crdb bank plc...2015/12/31 · steady balance sheet growth 13 financial position • customer...
TRANSCRIPT

CRDB BANK PLC
The Bank that Listens
2
About Us CRDB Bank Plc is a leading, wholly-owned private commercial bank in Tanzania
offering a comprehensive range of Corporate, Retail, Treasury, Premier and
Microfinance Services.
The Bank was established in 1996 and has grown and prospered over the years to
become the most innovative, first choice, and trusted bank in the country.
CRDB Bank was listed on the Dar es Salaam Stock Exchange on 17th June, 2009.
Vision and Mission
Vision:
To be the leading Bank, which is customer need driven with competitive returns to
shareholders.
Mission
To provide competitive and innovative financial products and services leveraging
technology to achieve distinctive customer experience. We strive to create value for
stakeholders and the society.

Economic outlook
3
Global Economy
• Global economic activity for 2015 is projected at 3.1 percent, 0.3 percentage point lower than
2014 and 0.2 percent point below the forecast in July 2015 WEO.
• Global economic activity is projected to gather some pace in 2016 with a growth of 3.4
percent.
• Growth in sub-Saharan Africa slowed in 2015 this year to 3.8 percent (from 5.0 percent in
2014)
Tanzania economy
• Real GDP expanded at 7.4 percent in 2015 and is projected at 7.2 percent in 2016.
• The Annual Headline Inflation rate for the month of December 2015 increased to 6.8% from
4.8% recorded in December 2014.
• The Shilling continued to stabilize at levels of 2100/2200 following inflows from export of
commodities.
– The overall lending rate in December remained at 16.00 % same as of December 2014.
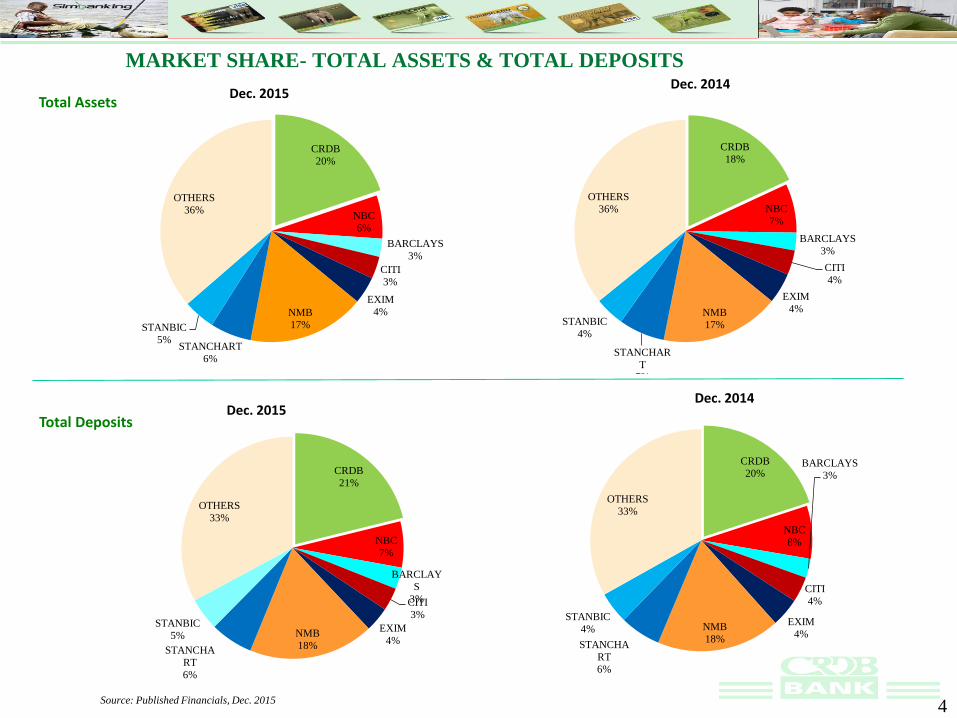
MARKET SHARE- TOTAL ASSETS & TOTAL DEPOSITS
Source: Published Financials, Dec. 2015
Total Assets
Total Deposits
Dec. 2015Dec. 2014
Dec. 2015Dec. 2014
4
CRDB
20%
NBC
6%
BARCLAYS
3%
CITI
3%
EXIM
4%NMB
17%
STANCHART
6%
STANBIC
5%
OTHERS
36%
CRDB
18%
NBC
7%
BARCLAYS
3%
CITI
4%
EXIM
4%NMB
17%
STANCHAR
T
7%
STANBIC
4%
OTHERS
36%
CRDB
21%
NBC
7%
BARCLAY
S
3%CITI
3%
EXIM
4%NMB
18%STANCHA
RT
6%
STANBIC
5%
OTHERS
33%
CRDB
20%
NBC
8%
BARCLAYS
3%
CITI
4%
EXIM
4%NMB
18%STANCHA
RT
6%
STANBIC
4%
OTHERS
33%

MARKET SHARE - SHAREHOLDERS’FUNDS AND LOANS & ADVANCES
Source: Published Financials, Dec. 2015
Capital
Loans & Advances
Dec. 2015 Dec. 2014
Dec. 2015 Dec. 2014
5
CRDB
18%
NBC
6%
BARCLAYS
2%
CITI
4%
EXIM
3%
NMB
17%
STANCHAR
T
6%
STANBIC
4%
OTHERS
40%
CRDB
15%
NBC
6%BARCLAYS
2%CITI
5%
EXIM
4%
NMB
19%
STANCHART
7%
STANBIC
5%
OTHERS
37%
CRDB
22%
NBC
6%
BARCLAYS
3%CITI
1%
EXIM
4%NMB
17%
STANCHART
5%
STANBIC
3%
OTHERS
39%
CRDB
21%
NBC
6%
BARCLAYS
3%CITI
1%
EXIM
4%NMB
17%
STANCHAR
T
6%
STANBIC
3%
OTHERS
39%

The Banking Industry continued to be competitive with 56 banks operating in the
market, but the market is controlled by 5 Banks led by CRDB.
Banks continue to introduce innovative products and services such as Internet
banking, Mobile banking and cards
– Expanding with additional physical and e-banking outlets – ATM’s, mobile
banking, internet banking.
– Competition for payment system – Debit Cards, prepaid cards, Money transfer
and payment system by telecoms i.e. M-Pesa
5 banks including CRDB Bank PLC licensed to started Agency banking
– Agent Banking is expected to enhance accessibility and convenience of banking
services to customers.
Increasing competition for qualified staff.
Potential for growth expected in – Mortgage finance, Islamic banking, Investment
Banking, Agent Banking and micro-finance and insurance.
Market
6

Bank Financial Performance
as at 31st December 2015
7

CRDB Bank PLC offers a
comprehensive range of
Corporate, Retail, Treasury,
Premier, Agent banking and
microfinance services
Network footprint of;
– 199 branches including
mobile branches and service
centers.
– 432 ATMs including 18
Depository ATMs,
– 778 Merchants Network
– 1,747 Agents (Fahari
Huduma)
– 441 Microfinance partner
institutions.
– 222 E-commerce merchants
CRDB Profile end of December, 2015
851997
1,153 1,239
1,311 1,437
1,658
1,898
2,158
2,387
2,651
34 38 44 56 6072 82
93 103120
199
30 50 71
100
132
164
190
245
311
374
432
0
50
100
150
200
250
300
350
400
450
500
0
500
1000
1500
2000
2500
3000
2005 2006 2007 2008 2009 2010 2011 2012 2013 2014 2015
Number of Staffs Number of Branches Number of ATMs
8

9
Shareholding Structure before and after Rights Issue 31.12.2015
(After rights issue)
30.06.2015
(Before rights
issue)
NAME SHARES % SHARES %
Above 10%
DANIDA Investment Fund 548,067,648 21.0 467,781,934 21.5
PPF Pension Fund 260,882,095 10.0 217,401,746 10.0
Sub Total 808,949,743 31.0 685,183,680 31.5
Above 1% and less than 10%
CDC Group Plc / International Finance Corporation / Africa Capitalization Fund Ltd 130,692,741 5.0 0 0
Mr. Aunali F Rajabali and Sajjad F Rajabali 105,506,395 4.0 60,100,945 2.8
Pinebridge 78,878,880 3.0 65,732,400 3.0
General Partners IV Ltd-TZ 64,704,702 2.5 55,082,392 2.5
LAPF Pension Fund 58,077,549 2.2 48,397,958 2.2
Blakeney General Partners III Ltd 52,953,203 2.0 47,805,578 2.2
PSPF Pension Fund 37,837,620 1.4 31,531,350 1.4
Hans Macha 32,764,200 1.3 27,303,500 1.3
National Health Insurance Fund 32,040,040 1.2 26,700,034 1.2
Western Zone Tobacco Growers Cooperative Union Ltd 30,000,000 1.1 25,000,000 1.1
CMG Investment Ltd 29,330,971 1.1 24,742,476 1.1
Kimberlite Frontier Master Africa Fund LP RCKM 28,720,830 1.1 - -
Blakeney Investors - - 21,120,714 1.0
Altree Custody Services Ltd – 008 -Tanzania - - 27,013,409 1.2
Lind Development Fund - - 21,660,000 1.0
Patrick Schegg - - 21,230,300 1.0
Sub Total 681,507,131 25.9 503,421,056 23.1
Less than 1%
More than 28,000 shareholders 1,121,381,710 43.1 987,927,424 45.4
Grand Total 2,611,838,584 100.0 2,176,532,160 100.0
The Bank successfully raised Tzs. 150 bn. as additional capital from the rights issue which closed in mid
July 2015.

Investment Ratio as at 31st December, 2015
10
Share Performance As at 31st Dec. 2015 As at 31st Dec. 2014
Market Price Closing TZS 405 TZS 430
Earning per share (EPS) 53.3 43.9
Price Earning Ratio (P/E) 7.6 9.8
Book Value (BV) 267.5 203.0
Price book value ratio (P/B) 1.5 2.0
Market Capitalisation (TZS billions) 1,057.8 935.9
Foreign Holding (%) 22.0 19.6

CRDB Bank Plc. – Performance Summary
(TZS Billion)
Interest Income 499.8 371.7 34% 16%
Interest Expenses 108.8 95.5 14% 18%
Net Interest Income 390.9 276.2 42% 15%
Net Fees and commissions 143.9 121.4 19% 13%
Net Foreign Exchange Income 35.7 29.3 22% 39%
Operating Expenses 315.6 258.1 22% 18%
Profit Before Tax 198.9 132.2 50% 15%
Loans & Advances to Customers 3,309.6 2,545.2 30% 24%
Customer Deposits 4,236.4 3,390.2 25% 17%
Shareholder Equity 701.5 441.1 59% 27%
Total Assets 5,436.7 4,210.1 29% 20%
Return on Avg. Assets 4.1% 3.6%
Return on Avg. Equity 24.4% 25.2%
NPL/Total Loans 6.6% 5.0%
Dec. 2015 Dec. 2014%
Change
Note: Total Assets for the Group closed at 5 trillion for the first time
Industry
11

Operating Profit Grew 50% YoY
12
Profitability
NII and other income coupled with operating efficiencies supported the overall profit growth
114,820
22,464 6,341 427 19,864 57,445
198,978
Operating
profit 2014NII Fee and
CommisionsFx Trading &
RevaluationOthers Impairment Operating
ExpensesOperating
profit 2015
50%
48,9
97
51,0
13
119,
282
130,
008
132,
244
198,
978
47,2
46
37,7
10
80,5
43
84,3
78
95,6
45
139,
285
21.4%
15.5%
28.2%24.4%
22.0%20.0%
0. 0%
5. 0%
10. 0%
15. 0%
20. 0%
25. 0%
30. 0%
-
50, 000
100, 000
150, 000
200, 000
250, 000
2010 2011 2012 2013 2014 Q4 2015 Q4
PBT PAT ROE
Profitability Trend
• YoY growth of 50%
• Mainly contributed by increase in NII
and fees and commissions.
• ROE recorded decrease due to
additional capital of about TZS
150bn.
• Cost to income ratio as at Dec. 2015
was 54%.
Tzs
Mil
lions
Tzs
Mil
lions
12
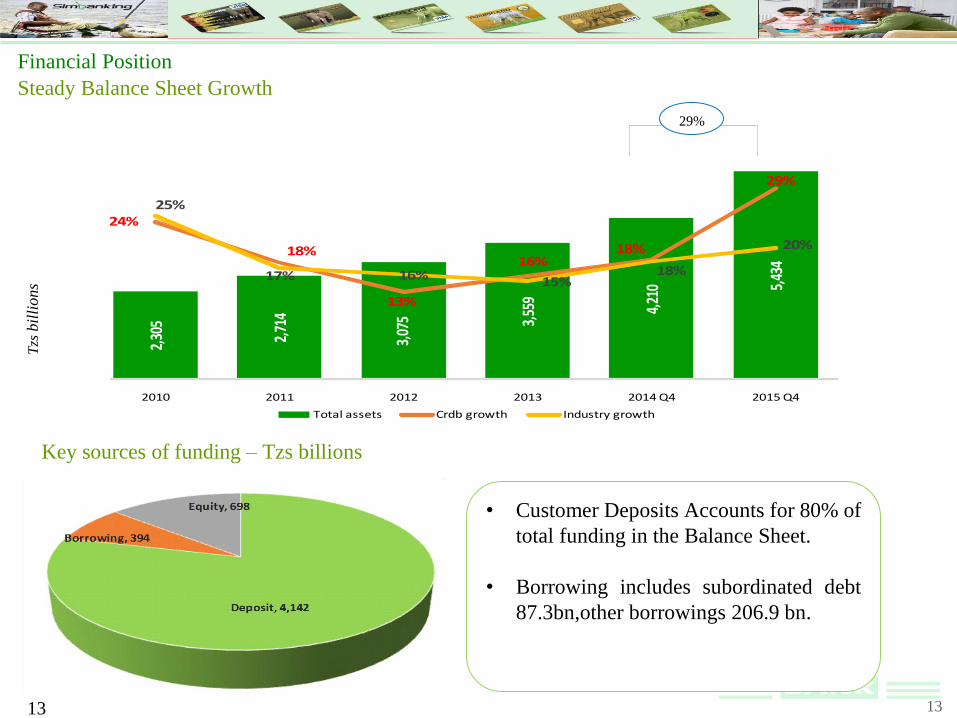
Steady Balance Sheet Growth
13
Financial Position
• Customer Deposits Accounts for 80% of
total funding in the Balance Sheet.
• Borrowing includes subordinated debt
87.3bn,other borrowings 206.9 bn.
29%
Key sources of funding – Tzs billions
Tzs
bil
lions
13
2,30
5
2,71
4
3,07
5 3,55
9
4,21
0 5,43
4
24%
18%
13%
16%18%
29%
25%
17% 16% 15%18%
20%
2010 2011 2012 2013 2014 Q4 2015 Q4
0%
5%
10%
15%
20%
25%
30%
35%
Total assets Crdb growth Industry growth

Loans and Advances
14
Steady Growth in Loan and Advances.
Loans and advances growth and contribution by key segments as at December 2015
Portfolio diversification among sectors and segments
• YoY Loan growth 30% above industry
24%.
• 29% of the total Loan is held in Foreign
Currency.
• FX Loans grew by 27% mainly due to
TZS depreciation against USD by 29%.
• Remarkable growth in retail segment
accounting for 41% of total loan portfolio
(2014 – Q3 was 36%)
821 979 1,177 1,393 1,795 2,357
302 450
630 600
750
953
17%
24%26%
10%
28%
30%
19%
30%
18%
17%
21%
24%
0%
5%
10%
15%
20%
25%
30%
35%
-
500
1,000
1,500
2,000
2,500
3,000
3,500
2010 2011 2012 2013 2014 Q4 2015 Q4
LCY FCY Bank Growth Industry GrowthTzs
bil
lions
62%
11%
17%
4%
6%
1%
55%
11%
23%
4%
7%
1%
0% 10% 20% 30% 40% 50% 60% 70%
Corporate
SME
Personal
Staff
MFSC
Mortgage
2015
2014
21%
18%
15%
8%
8%
5%
5%
19%
27%
19%
14%
4%
7%
3%
4%
21%
0% 5% 10% 15% 20% 25% 30%
Individual
Agriculture
Trading
Manufacturing
Transport and comm
Building & constru
Hospitality
Others
2015
2014

Customer Deposits
15
Funding Growth Through Deposit Mobilization
Deposit Growth
1,494 1,692 1,712 2,512 2,617
3,490 525 717 879
850 773
746
2010 2011 2012 2013 2014 Q4 2015 Q4
CASA Time Deposits
• Low cost CASA base grew
to 82% of total deposits with
YoY growth of 34%.
• YoY Deposit growth 25%
• Mainly from growth in
Bank network, Agency and
Government business and
customer convenience.
• 25% of the total deposits
are held in Foreign
Currency.
• Foreign Currency deposits
grow by 23% mainly
resulting from TZS
deprecation against USD.34%
25%
1,498 1,734
1,950
2,619 2,499
3,136 521
675 641
405 891
1,007 25%
19%
8%
17%
12%
22%
25%
16%
13%12%
13%
17%
0%
5%
10%
15%
20%
25%
30%
-
500
1, 000
1, 500
2, 000
2, 500
3, 000
3, 500
4, 000
4, 500
2010 2011 2012 2013 2014 Q4 2015 Q4
LCY FCY CRDB- Growth Industry Growth
Tzs
bil
lions
Tzs
bil
lions

16
18.0%
14.0%16.0%
14.5%13.1%
14.2%
18.0%
15.0%16.0%
15.1% 14.3%
18.3%
0.0%
2.0%
4.0%
6.0%
8.0%
10.0%
12.0%
14.0%
16.0%
18.0%
20.0%
2010 2011 2012 2013 2014 Q4 2015 Q4
Tier I Total
1,285 1,605 1,849 2,334 2,882
3,652 21
8 8
3 14
9 57% 59% 60%66% 69% 67%
0 %
1 0 %
2 0 %
3 0 %
4 0 %
5 0 %
6 0 %
7 0 %
8 0 %
-
500
1, 000
1, 500
2, 000
2, 500
3, 000
3, 500
4, 000
2010 2011 2012 2013 2014 Q4 2015 Q4
Market Risk
Credit Risk
Risk weighted Assets/Total Assets
Capital adequacy ratio
Risk weighted assets
Tzs
bil
lions

17
Non performing Loans and Provisions
Diversification of the loan book - Dec. 2015
11.5%
9.4%
6.8%6.2%
5.0%
6.6%
9.3%
6.8% 7.3%6.5%
6.7%
6.8%
2010 2011 2012 2013 2014 Dec-15CRDB NPL Ratio Industry Average
133 135 125 126 129 218
23%
34%
26% 28% 24%
49%
0 %
1 0 %
2 0 %
3 0 %
4 0 %
5 0 %
6 0 %
-
50
100
150
200
250
2010 2011 2012 2013 2014 Dec-15
Total NPL
27%
20%
14%6%
7%
3%4%
20%
Individual
Agriculture
Trading
Manufacturing
Transport and communication
Building & construction
Hospitality
Others 7%
14%
8%
2%
11%
3%
14%
2%
6%
10%
4%
2%
3%
3%
7%
2%
Others
Hospitality
Building & construction
Transport and …
Manufacturing
Trading
Agriculture
Individual
Provission NPL
Sector NPL and Provision as at Dec. 2015
TZ
S b
illi
ons

Sector NPL as a %age of Total NPL as at Dec. 2015
19.8%
4.5%
14.2%
6.7%
3.0%
27.4%
4.2%
20.2%
42.9%
7.4%
6.7%
1.9%
3.4%
7.5%
8.9%
21.2%
Agriculture
Manufacturing and processing
Trade and Commerce
Transport and Communication
Building and Construction
Individuals /Personal Loans
Hospitality
Others
NPL % Outstanding Loan %
18

1. CRDB Microfinance Services Company Limited
The Bank offers Microfinance products through its subsidiary by partnering with
Microfinance institutions (MFIs) mostly savings and credit cooperative societies (SACCOS).
The Bank provides financial products - microfinance loans, mobilise deposits from partner
MFIs on behalf of the parent company, insurance products and services, information and
communication technology solutions and support.
The number of partner MFIs were 441 in Dec. 2015.
Total loans extended by the Bank to these institutions at the end of December 2015 stood at
TZS 221 billion.
The subsidiary made a profit of TZS 5.8 billion compared to TZS 4.9 billion in 2014, which is
a growth of 16%.
CRDB Bank Plc Subsidiaries
2. CRDB Bank Burundi S.A.
The Bank has also a subsidiary in Bujumbura, capital city of Burundi and opened four branches.
The subsidiary recorded a profit of TZS 1,064 million compared to TZS 3,578 million loss
recorded in 2014 despite security instability in the country. The subsidiary was able to breakeven.
The subsidiary total assets as at 31st December 2015 grew to TZS 154 billion from TZS104 billion
in 2014.
Total deposits was TZS 60,363 million compared to TZS 28,894 million in 2014.
19

20
STRATEGIC FOCUS FOR 2016
For the past years, the Bank has been focusing on expanding its distribution channels
through opening of new outlets (mainly Government centres and Microfinance service
centres) and in alternative channels. Such investments needed to bring returns and
contribute to the profitability of the Bank. In addition to this, the Bank conducted business
process improvement with the aim of improving its customer service while also achieving
operational excellence.
Focus will therefore be on optimization of investments made and attain operation
excellence.

Thank You
21