crayon group holding asa q2 2021 report
TRANSCRIPT

Q2 2021 Crayon Group Interim Financial Report

Content
2
Highlights 3 Business review 4 Financial review 5 Financial statements and notes 7

3
Highlights • Gross profit growth across all business areas and market clusters in Q2 2021. Gross profit grew by 21.9% compared to the
same quarter last year (year-over-year, “YoY”), driven by strong growth in the segments Consulting (NOK 80.9m/ +46.4% YoY) and Software & Cloud Direct (NOK 50.3m/ +17.1% YoY). All market clusters delivered solid gross profit growth.
• Adjusted EBITDA has a positive development, and in Q2 2021 adjusted EBITDA¹ increased with NOK 84.7m YoY to NOK 255.8m. The improvement was primarily driven by Software & Cloud (NOK 62.1m), and Services EBITDA (NOK 36.6m)
Consolidated Operating Revenue In millions of NOK
Consolidated Gross Profit
In millions of NOK
Consolidated Adjusted EBITDA1
In millions of NOK
Key consolidated figures
6 095
3 668
5 632 5 522
8 071
Q2 2020 Q3 2020 Q4 2020 Q1 2021 Q2 2021
666
496
667635
812
Q2 2020 Q3 2020 Q4 2020 Q1 2021 Q2 2021
171
64
137
93
256
Q2 2020 Q3 2020 Q4 2020 Q1 2021 Q2 2021
¹Adjusted EBITDA is EBITDA excluding other income and expenses. Reference made to Alternative Performance Measures Section in note disclosure.
4
Business review
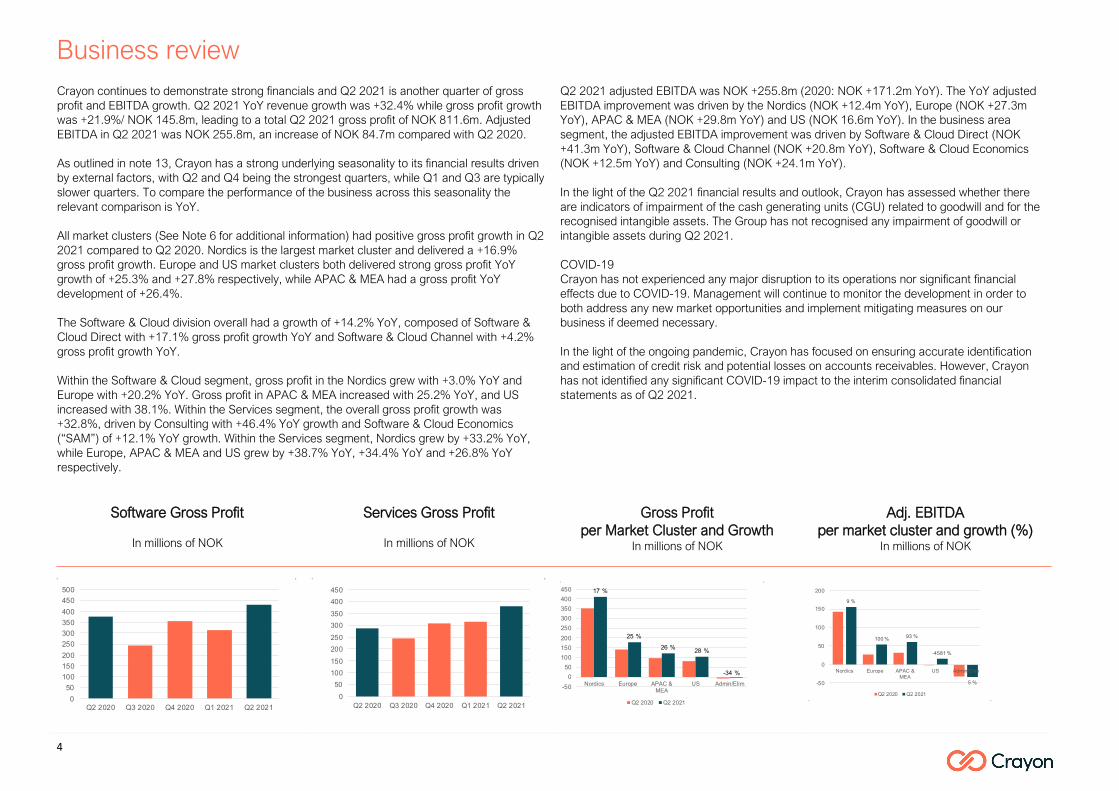
Crayon continues to demonstrate strong financials and Q2 2021 is another quarter of gross profit and EBITDA growth. Q2 2021 YoY revenue growth was +32.4% while gross profit growth was +21.9%/ NOK 145.8m, leading to a total Q2 2021 gross profit of NOK 811.6m. Adjusted EBITDA in Q2 2021 was NOK 255.8m, an increase of NOK 84.7m compared with Q2 2020. As outlined in note 13, Crayon has a strong underlying seasonality to its financial results driven by external factors, with Q2 and Q4 being the strongest quarters, while Q1 and Q3 are typically slower quarters. To compare the performance of the business across this seasonality the relevant comparison is YoY. All market clusters (See Note 6 for additional information) had positive gross profit growth in Q2 2021 compared to Q2 2020. Nordics is the largest market cluster and delivered a +16.9% gross profit growth. Europe and US market clusters both delivered strong gross profit YoY growth of +25.3% and +27.8% respectively, while APAC & MEA had a gross profit YoY development of +26.4%. The Software & Cloud division overall had a growth of +14.2% YoY, composed of Software & Cloud Direct with +17.1% gross profit growth YoY and Software & Cloud Channel with +4.2% gross profit growth YoY. Within the Software & Cloud segment, gross profit in the Nordics grew with +3.0% YoY and Europe with +20.2% YoY. Gross profit in APAC & MEA increased with 25.2% YoY, and US increased with 38.1%. Within the Services segment, the overall gross profit growth was +32.8%, driven by Consulting with +46.4% YoY growth and Software & Cloud Economics (“SAM”) of +12.1% YoY growth. Within the Services segment, Nordics grew by +33.2% YoY, while Europe, APAC & MEA and US grew by +38.7% YoY, +34.4% YoY and +26.8% YoY respectively.
Q2 2021 adjusted EBITDA was NOK +255.8m (2020: NOK +171.2m YoY). The YoY adjusted EBITDA improvement was driven by the Nordics (NOK +12.4m YoY), Europe (NOK +27.3m YoY), APAC & MEA (NOK +29.8m YoY) and US (NOK 16.6m YoY). In the business area segment, the adjusted EBITDA improvement was driven by Software & Cloud Direct (NOK +41.3m YoY), Software & Cloud Channel (NOK +20.8m YoY), Software & Cloud Economics (NOK +12.5m YoY) and Consulting (NOK +24.1m YoY). In the light of the Q2 2021 financial results and outlook, Crayon has assessed whether there are indicators of impairment of the cash generating units (CGU) related to goodwill and for the recognised intangible assets. The Group has not recognised any impairment of goodwill or intangible assets during Q2 2021. COVID-19 Crayon has not experienced any major disruption to its operations nor significant financial effects due to COVID-19. Management will continue to monitor the development in order to both address any new market opportunities and implement mitigating measures on our business if deemed necessary. In the light of the ongoing pandemic, Crayon has focused on ensuring accurate identification and estimation of credit risk and potential losses on accounts receivables. However, Crayon has not identified any significant COVID-19 impact to the interim consolidated financial statements as of Q2 2021.
Software Gross Profit
In millions of NOK
Services Gross Profit
In millions of NOK
Gross Profit per Market Cluster and Growth
In millions of NOK
Adj. EBITDA per market cluster and growth (%)
In millions of NOK
050
100150200250300350400450500
Q2 2020 Q3 2020 Q4 2020 Q1 2021 Q2 2021
050
100150200250300350400450
Q2 2020 Q3 2020 Q4 2020 Q1 2021 Q2 2021
17 %
25 %
26 % 28 %
-34 %
-500
50100150200250300350400450
Nordics Europe APAC &MEA
US Admin/Elim
Q2 2020 Q2 2021
9 %
100 % 93 %
-4581 %
5 %-50
0
50
100
150
200
Nordics Europe APAC &MEA
US Admin/Elim
Q2 2020 Q2 2021
5
Financial review Items below the EBITDA line Depreciation and amortisation increased NOK 5.2m YoY. The increase of depreciation is primarily driven by higher investments in recent periods into platforms and ERP systems, but also affected of impact from Sensa of NOK 2.3m. Interest expenses increased YoY with NOK 1.7m, primarily due to a lower interest on borrowings and settlement of swap in Q2 2020. Other financial expenses increased with NOK 36.2m due to currency movements. The net income before tax increases YoY by NOK 52.3m to NOK 184.1m, mainly due to increase EBITDA of NOK 95.3m and increase of other financial expense, net of NOK -36.2m. Income tax expense for Q2 2021 amounts to NOK 19.3m. Net profit in the period was NOK 164.8m, compared with the Q2 2020 result of NOK 102.6m. Basic earnings per share increased from NOK 1.22 per share in Q2 2020 to NOK 1.77 per share in Q2 2021.
Adjusted EBITDA Adjusted EBITDA is adjusted for share based compensation and other income and expenses, totaling NOK -3.9m in Q2 2021. Other income and expenses in Q2 are mainly driven by share-based compensation and forgivable loan (see note 14). Share-based compensation programs in Crayon relates to the option program from the IPO in 2017, the broad-based Employee Share Purchase Program in 2019 and 2020 and an option-based management performance program for strategic KPIs during 2020 and 2021. For more details, see the ‘Alternative Performance Measures’ section in this report.
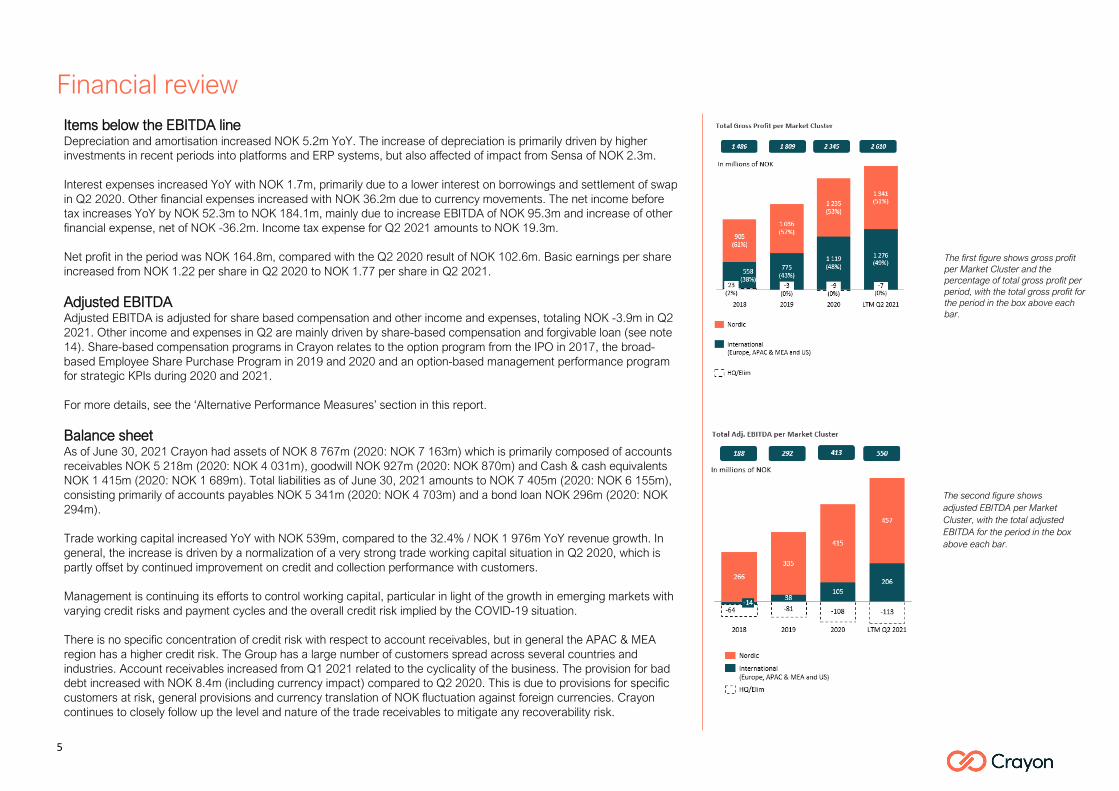
Balance sheet As of June 30, 2021 Crayon had assets of NOK 8 767m (2020: NOK 7 163m) which is primarily composed of accounts receivables NOK 5 218m (2020: NOK 4 031m), goodwill NOK 927m (2020: NOK 870m) and Cash & cash equivalents NOK 1 415m (2020: NOK 1 689m). Total liabilities as of June 30, 2021 amounts to NOK 7 405m (2020: NOK 6 155m), consisting primarily of accounts payables NOK 5 341m (2020: NOK 4 703m) and a bond loan NOK 296m (2020: NOK 294m). Trade working capital increased YoY with NOK 539m, compared to the 32.4% / NOK 1 976m YoY revenue growth. In general, the increase is driven by a normalization of a very strong trade working capital situation in Q2 2020, which is partly offset by continued improvement on credit and collection performance with customers. Management is continuing its efforts to control working capital, particular in light of the growth in emerging markets with varying credit risks and payment cycles and the overall credit risk implied by the COVID-19 situation. There is no specific concentration of credit risk with respect to account receivables, but in general the APAC & MEA region has a higher credit risk. The Group has a large number of customers spread across several countries and industries. Account receivables increased from Q1 2021 related to the cyclicality of the business. The provision for bad debt increased with NOK 8.4m (including currency impact) compared to Q2 2020. This is due to provisions for specific customers at risk, general provisions and currency translation of NOK fluctuation against foreign currencies. Crayon continues to closely follow up the level and nature of the trade receivables to mitigate any recoverability risk.
The second figure shows adjusted EBITDA per Market Cluster, with the total adjusted EBITDA for the period in the box above each bar.
The first figure shows gross profit per Market Cluster and the percentage of total gross profit per period, with the total gross profit for the period in the box above each bar.
6
1 On a LTM basis, excluding share based compensation and other income and expenses and non-controlling interest. Also, adjusted for restricted cash of NOK 61.0m, including not registered shares issued. 2 Includes impact of organic growth and acquisitions.
The need for additional provisions for expected credit losses has been assessed and the level has increased from last quarter. See note 11 for updated information on credit risk. Crayon has a non-recourse factoring agreement with BNP. This has been implemented for a set of customers in Norway and in Denmark. As of June 30, 2021, factoring is improving our accounts receivables of NOK 131m (2020: NOK 159). Equity increased by NOK 259.4m from year-end 2020 consisting primarily a total net income of NOK 180.0m and share issue of NOK 78.9m.
Leverage Net interest-bearing debt as end of June 30, 2021 was NOK -953m with a net cash position of NOK 1 415m (the Company reports its cash balance net of drawdown on its revolving credit facility (“RCF”)), corresponding to a leverage ratio of -1.7x EBITDA1. The Group had significant headroom with regards to its bank covenants as of quarter end.
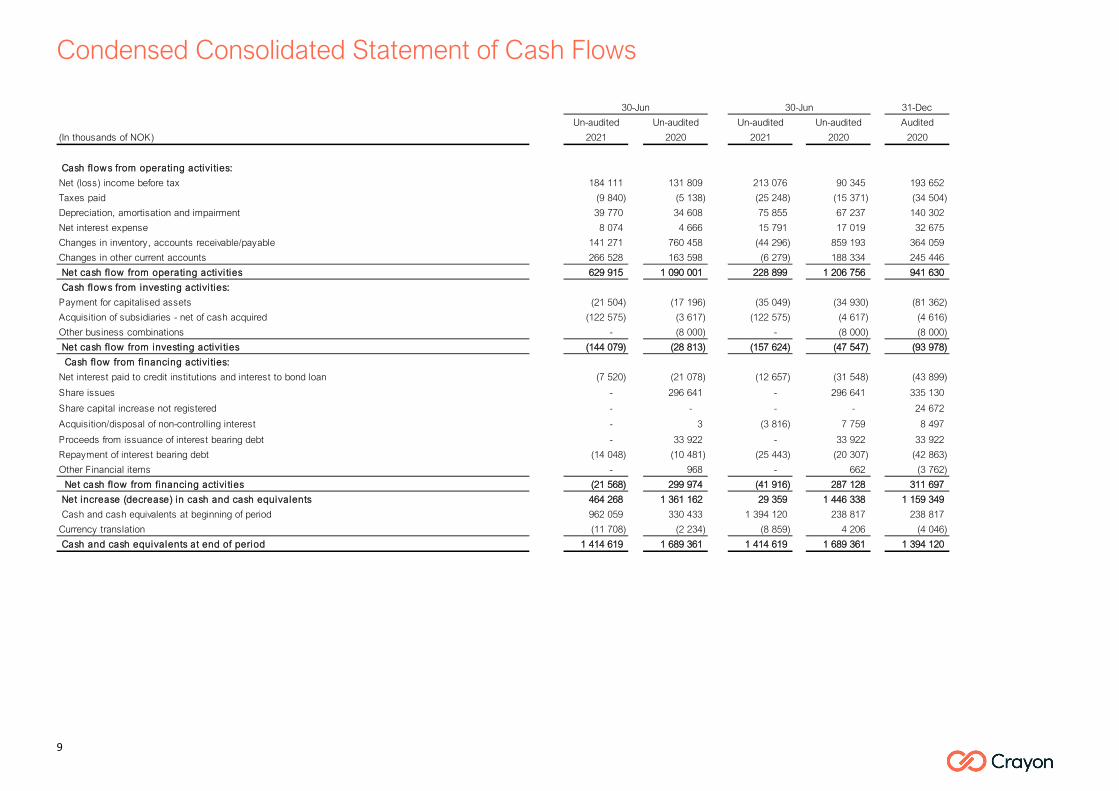
Cash flow Cash flow from operations in Q2 2021 was NOK -630m, compared with NOK 1 090m in Q2 2020 mainly due changes in net income and net working capital. The net cash position as of June 30, 2021 was NOK 1 415 (the Company reports its cash balance net of drawdown on its revolving credit facility (“RCF”)) compared to NOK 1 689m as of June 30, 2020. The liquidity position of the group remains strong, with a total liquidity reserve as of June 30, 2021 of NOK 1 621m, compared to NOK 1 947m as of June 30, 2020. For more information on the definition of liquidity reserve, please see the ‘Alternative Performance Measures’ section in this report. See note 11 for updated information of liquidity risk.
Employees Crayon is a people business with teammates being our greatest asset. We strive to continuously attract, develop, and retain top talent, but perhaps even more importantly, we empower our employees to do their best every single day at work. The average number of employees during Q2 2021 was 2 061, compared to an average during Q2 2020 of 1 653. This represents a YoY increase of 409 employees /+24.7%. The Software & Cloud business division had a total increase in average employees of 131 YoY, representing a 23.9% increase. The average number of employees in the Services business division increased YoY by 258 employees 2, whilst other employees increased YoY by 19 employees. At the date of this report, all Crayon employees are safe and remains productive. Crayon has taken measures to protect employees and support ongoing efforts to contain the COVID-19 pandemic in line with local and global health authorities. The transition to remote work has so far been seamless for our employees, customers and business partners.

7
Condensed Consolidated Statement of Income
Year ended
Note 31-Dec
Un-audited Audited Un-audited Un-Audited Audited
(In thousands of NOK) 2021 2020 2021 2020 2020
Operating revenue 6 8 071 296 6 095 044 13 593 753 10 298 997 19 599 455
Cost of sales 7 259 678 5 429 205 12 147 194 9 117 952 17 254 670
Gross profi t 811 617 665 839 1 446 558 1 181 045 2 344 785
Payroll and related cost 484 242 443 129 961 992 836 793 1 685 629
Other operating expenses 71 528 51 523 135 690 132 464 246 254
Share based compensation 10 225 6 751 19 107 8 574 48 684
Other income and expenses (14 115) 12 (11 177) 294 (17 196)
EBITDA 259 737 164 425 340 946 202 921 381 414
Depreciation and amortisation 4 39 770 34 608 75 855 67 237 140 302
Operating (loss)/profi t/EBIT 219 967 129 816 265 091 135 684 241 112
Interest expense 9 506 7 845 19 804 23 243 41 125
Other financial expense, net 5 26 349 (9 837) 32 211 22 096 6 336
Net (loss) income before tax 184 111 131 809 213 076 90 345 193 652
Income tax expense on ordinary result 19 303 29 256 33 095 39 380 66 821
Net (loss) income 164 809 102 552 179 981 50 965 126 831
16 % 44 %
Comprehensive income
Items that are or may be reclassi fied subsequently to profi t or loss
Currency translation 6 362 (56 784) (4 586) 60 112 4 995
Total comprehensive income -net of tax 171 171 45 768 175 395 111 077 131 826
Al location of net income
Non-controlling interests 16 001 3 607 15 607 (440) 6 336
Owners of Crayon Group Holding ASA 148 808 98 945 164 374 51 405 120 495
Total net income (loss) al located 164 809 102 552 179 981 50 965 126 831
Earnings (loss) per share (NOK per share) 1,77 1,22 1,96 0,63 1,48
Al location of Total comprehensive income
Non-controlling interests 15 916 5 589 15 972 (2 284) 5 680
Owners of Crayon Group Holding ASA 155 255 40 179 159 423 113 361 126 146
Total comprehensive income al located 171 171 45 768 175 395 111 077 131 826
For description of other income and expenses, see Alternative Performance Measures section
Quarter ended
30-Jun
Year to date ended
30-Jun

8
Condensed Consolidated Balance Sheet Statement
31-Dec
Un-audited Un-Audited Audited
(In thousands of NOK) Note 2021 2020 2020
ASSETS
Non-current assets:
Development Costs 8 94 492 87 611 88 756
Technology and software 8 14 709 24 273 18 515
Contracts 8 175 787 68 115 60 379
Software licenses (IP) 8 2 058 2 366 2 215
Goodwill 9 926 701 869 533 850 933
Deferred tax asset 39 261 29 623 35 458
Total intangible assets 1 253 007 1 081 520 1 056 255
Tangible assets
Equipment 43 087 39 057 38 624
Right of use assets 12 128 591 120 375 120 051
Total tangible assets 171 678 159 433 158 676
Other non-current receivables 61 159 21 693 39 962
Total financial assets 61 159 21 693 39 962
Total non-current assets 1 485 845 1 262 646 1 254 893
Current assets:
Inventory 9 591 19 016 8 846
Total inventory 9 591 19 016 8 846
Accounts receivable 11 5 218 175 4 030 650 3 393 421
Other current receivables 15 639 192 160 871 263 347
Total receivable 5 857 367 4 191 522 3 656 768
Cash & cash equivalents 10 1 414 619 1 689 361 1 394 120
Total current assets 7 281 578 5 899 899 5 059 733
Total assets 8 767 422 7 162 544 6 314 626
30-Jun 31-Dec
Un-audited Un-Audited Audited
(In thousands of NOK) Note 2021 2020 2020
LIABILITIES AND SHAREHOLDERS' EQUITY
Shareholders' equity:
Share capital 83 979 81 239 81 688
Own shares (10) (10) (10)
Share premium 1 053 515 914 175 976 887
Sum paid-in equi ty 1 137 484 995 404 1 058 565
Retained Earnings
Other Equity 206 645 19 315 41 276
Total retained earnings 206 645 19 315 41 276
Total equi ty attributable to parent company shareholders 1 344 128 1 014 719 1 099 840
Non-controlling interests 18 450 (6 961) 3 334
Total shareholders' equi ty 1 362 579 1 007 758 1 103 174
Long-term liabilities:
Bond loan 10 296 438 294 028 295 215
Deferred tax liabilities 16 832 28 365 21 505
Lease liabilities 104 846 95 780 95 340
Other non-current liabilities 71 160 76 173 47 503
Total long-term l iabi l i ties 489 276 494 346 459 562
Current liabilities:
Accounts payable 5 341 244 4 702 574 3 560 040
Income taxes payable 60 588 39 533 49 812
Public duties 15 561 915 286 380 250 918
Current lease liabilities 31 609 29 622 31 230
Other current interest bearing debt 10 100 201 57 127 75 884
Other current liabilities 820 010 545 205 784 004
Total current l iabi l i ties 6 915 567 5 660 441 4 751 889
Total l iabi l i ties 7 404 844 6 154 787 5 211 452
Total equi ty and l iabi l i ties 8 767 422 7 162 544 6 314 626
30-Jun
9
Condensed Consolidated Statement of Cash Flows
31-Dec
Un-audited Un-audited Un-audited Un-audited Audited
(In thousands of NOK) 2021 2020 2021 2020 2020
Cash flow s from operating activi ties:
Net (loss) income before tax 184 111 131 809 213 076 90 345 193 652
Taxes paid (9 840) (5 138) (25 248) (15 371) (34 504)
Depreciation, amortisation and impairment 39 770 34 608 75 855 67 237 140 302
Net interest expense 8 074 4 666 15 791 17 019 32 675
Changes in inventory, accounts receivable/payable 141 271 760 458 (44 296) 859 193 364 059
Changes in other current accounts 266 528 163 598 (6 279) 188 334 245 446
Net cash flow from operating activi ties 629 915 1 090 001 228 899 1 206 756 941 630
Cash flow s from investing activi ties:
Payment for capitalised assets (21 504) (17 196) (35 049) (34 930) (81 362)
Acquisition of subsidiaries - net of cash acquired (122 575) (3 617) (122 575) (4 617) (4 616)
Other business combinations - (8 000) - (8 000) (8 000)
Net cash flow from investing activi ties (144 079) (28 813) (157 624) (47 547) (93 978)
Cash flow from financing activi ties:
Net interest paid to credit institutions and interest to bond loan * (7 520) (21 078) (12 657) (31 548) (43 899)
Share issues - 296 641 - 296 641 335 130
Share capital increase not registered - - - - 24 672
Acquisition/disposal of non-controlling interest - 3 (3 816) 7 759 8 497
Proceeds from issuance of interest bearing debt - 33 922 - 33 922 33 922
Repayment of interest bearing debt (14 048) (10 481) (25 443) (20 307) (42 863)
Other Financial items - 968 - 662 (3 762)
Net cash flow from financing activi ties (21 568) 299 974 (41 916) 287 128 311 697
Net increase (decrease) in cash and cash equivalents 464 268 1 361 162 29 359 1 446 338 1 159 349
Cash and cash equivalents at beginning of period 962 059 330 433 1 394 120 238 817 238 817
Currency translation (11 708) (2 234) (8 859) 4 206 (4 046)
Cash and cash equivalents at end of period 1 414 619 1 689 361 1 414 619 1 689 361 1 394 120
30-Jun30-Jun

10
Condensed Consolidated Statement of Changes in Shareholder’s Equity
11
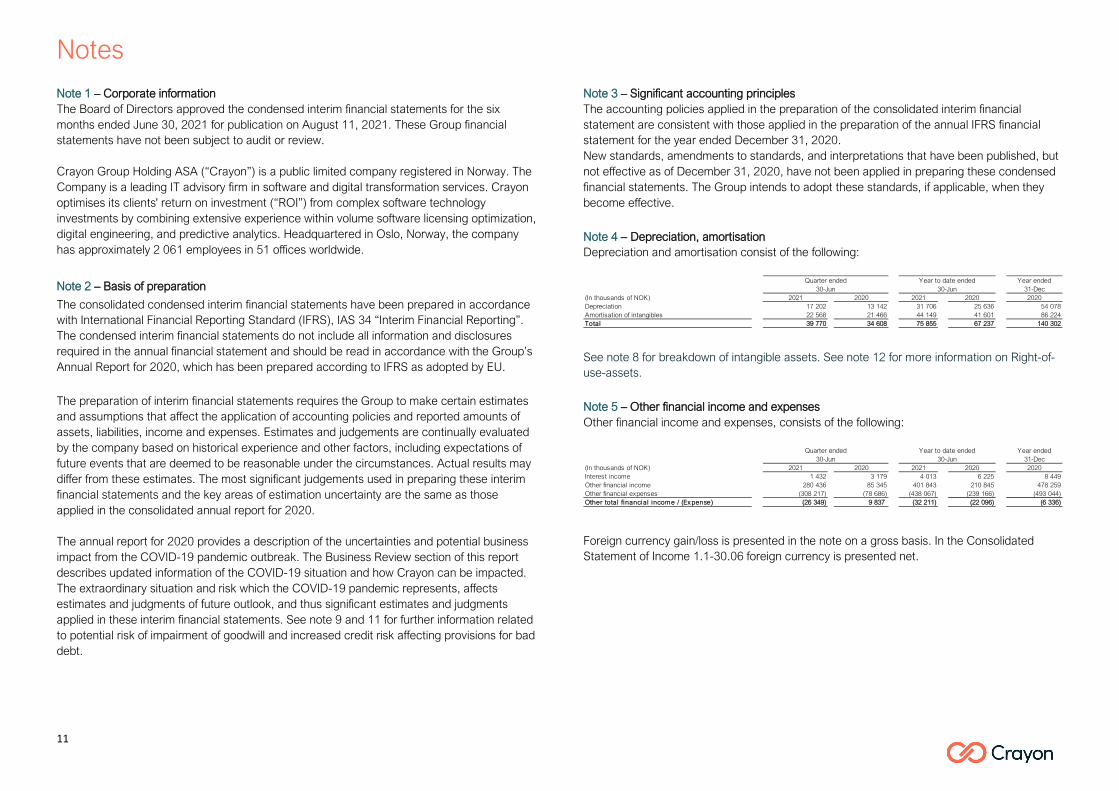
Notes Note 1 – Corporate information The Board of Directors approved the condensed interim financial statements for the six months ended June 30, 2021 for publication on August 11, 2021. These Group financial statements have not been subject to audit or review. Crayon Group Holding ASA (“Crayon”) is a public limited company registered in Norway. The Company is a leading IT advisory firm in software and digital transformation services. Crayon optimises its clients' return on investment (“ROI”) from complex software technology investments by combining extensive experience within volume software licensing optimization, digital engineering, and predictive analytics. Headquartered in Oslo, Norway, the company has approximately 2 061 employees in 51 offices worldwide.
Note 2 – Basis of preparation
The consolidated condensed interim financial statements have been prepared in accordance with International Financial Reporting Standard (IFRS), IAS 34 “Interim Financial Reporting”. The condensed interim financial statements do not include all information and disclosures required in the annual financial statement and should be read in accordance with the Group’s Annual Report for 2020, which has been prepared according to IFRS as adopted by EU.
The preparation of interim financial statements requires the Group to make certain estimates and assumptions that affect the application of accounting policies and reported amounts of assets, liabilities, income and expenses. Estimates and judgements are continually evaluated by the company based on historical experience and other factors, including expectations of future events that are deemed to be reasonable under the circumstances. Actual results may differ from these estimates. The most significant judgements used in preparing these interim financial statements and the key areas of estimation uncertainty are the same as those applied in the consolidated annual report for 2020. The annual report for 2020 provides a description of the uncertainties and potential business impact from the COVID-19 pandemic outbreak. The Business Review section of this report describes updated information of the COVID-19 situation and how Crayon can be impacted. The extraordinary situation and risk which the COVID-19 pandemic represents, affects estimates and judgments of future outlook, and thus significant estimates and judgments applied in these interim financial statements. See note 9 and 11 for further information related to potential risk of impairment of goodwill and increased credit risk affecting provisions for bad debt.
Note 3 – Significant accounting principles The accounting policies applied in the preparation of the consolidated interim financial statement are consistent with those applied in the preparation of the annual IFRS financial statement for the year ended December 31, 2020. New standards, amendments to standards, and interpretations that have been published, but not effective as of December 31, 2020, have not been applied in preparing these condensed financial statements. The Group intends to adopt these standards, if applicable, when they become effective.
Note 4 – Depreciation, amortisation Depreciation and amortisation consist of the following:
See note 8 for breakdown of intangible assets. See note 12 for more information on Right-of-use-assets.
Note 5 – Other financial income and expenses Other financial income and expenses, consists of the following:
Foreign currency gain/loss is presented in the note on a gross basis. In the Consolidated Statement of Income 1.1-30.06 foreign currency is presented net.
Year ended31-Dec
(In thousands of NOK) 2021 2020 2021 2020 2020Depreciation 17 202 13 142 31 706 25 636 54 078Amortisation of intangibles 22 568 21 466 44 149 41 601 86 224Total 39 770 34 608 75 855 67 237 140 302
Quarter ended30-Jun30-Jun
Year to date ended
Year ended 31-Dec
(In thousands of NOK) 2021 2020 2021 2020 2020Interest income 1 432 3 179 4 013 6 225 8 449Other financial income 280 436 85 345 401 843 210 845 478 259Other financial expenses (308 217) (78 686) (438 067) (239 166) (493 044) Other total financial income / (Ex pense) (26 349) 9 837 (32 211) (22 096) (6 336)
Quarter ended Year to date ended30-Jun 30-Jun
12
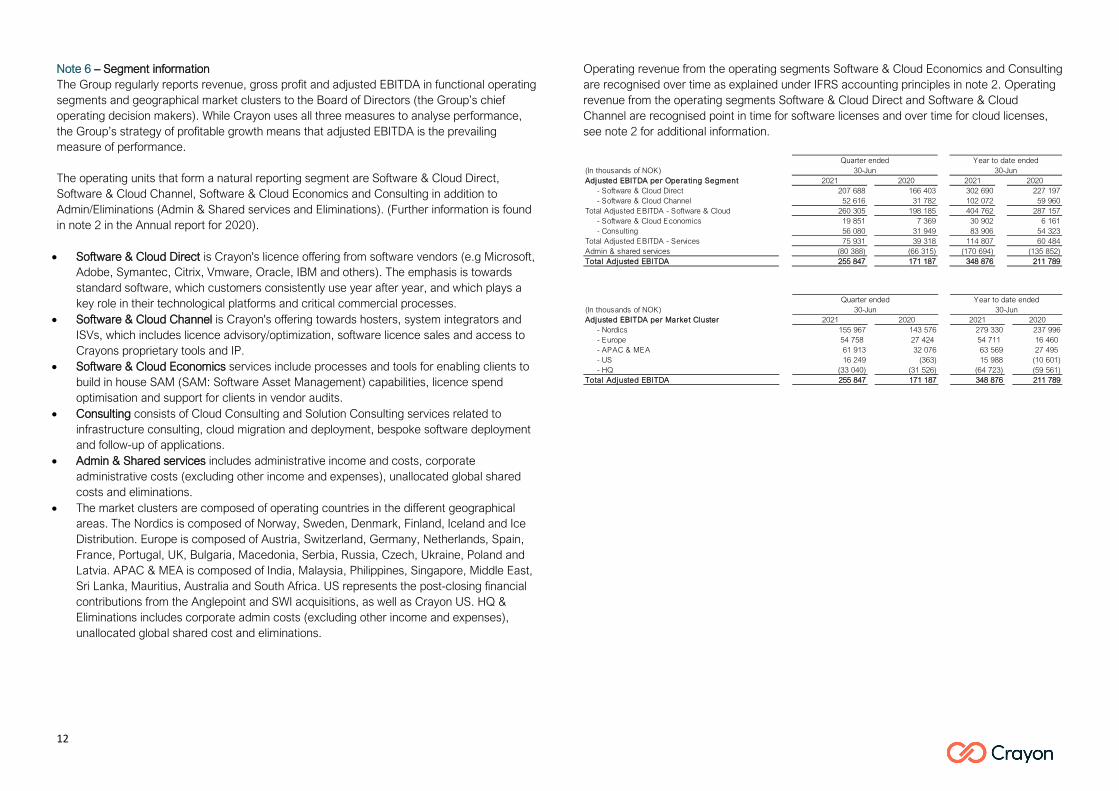
Note 6 – Segment information The Group regularly reports revenue, gross profit and adjusted EBITDA in functional operating segments and geographical market clusters to the Board of Directors (the Group’s chief operating decision makers). While Crayon uses all three measures to analyse performance, the Group’s strategy of profitable growth means that adjusted EBITDA is the prevailing measure of performance. The operating units that form a natural reporting segment are Software & Cloud Direct, Software & Cloud Channel, Software & Cloud Economics and Consulting in addition to Admin/Eliminations (Admin & Shared services and Eliminations). (Further information is found in note 2 in the Annual report for 2020). • Software & Cloud Direct is Crayon's licence offering from software vendors (e.g Microsoft,
Adobe, Symantec, Citrix, Vmware, Oracle, IBM and others). The emphasis is towards standard software, which customers consistently use year after year, and which plays a key role in their technological platforms and critical commercial processes.
• Software & Cloud Channel is Crayon's offering towards hosters, system integrators and ISVs, which includes licence advisory/optimization, software licence sales and access to Crayons proprietary tools and IP.
• Software & Cloud Economics services include processes and tools for enabling clients to build in house SAM (SAM: Software Asset Management) capabilities, licence spend optimisation and support for clients in vendor audits.
• Consulting consists of Cloud Consulting and Solution Consulting services related to infrastructure consulting, cloud migration and deployment, bespoke software deployment and follow-up of applications.
• Admin & Shared services includes administrative income and costs, corporate administrative costs (excluding other income and expenses), unallocated global shared costs and eliminations.
• The market clusters are composed of operating countries in the different geographical areas. The Nordics is composed of Norway, Sweden, Denmark, Finland, Iceland and Ice Distribution. Europe is composed of Austria, Switzerland, Germany, Netherlands, Spain, France, Portugal, UK, Bulgaria, Macedonia, Serbia, Russia, Czech, Ukraine, Poland and Latvia. APAC & MEA is composed of India, Malaysia, Philippines, Singapore, Middle East, Sri Lanka, Mauritius, Australia and South Africa. US represents the post-closing financial contributions from the Anglepoint and SWI acquisitions, as well as Crayon US. HQ & Eliminations includes corporate admin costs (excluding other income and expenses), unallocated global shared cost and eliminations.
Operating revenue from the operating segments Software & Cloud Economics and Consulting are recognised over time as explained under IFRS accounting principles in note 2. Operating revenue from the operating segments Software & Cloud Direct and Software & Cloud Channel are recognised point in time for software licenses and over time for cloud licenses, see note 2 for additional information.
(In thousands of NOK)Adjusted EBITDA per Operating Segment 2021 2020 2021 2020 - Software & Cloud Direct 207 688 166 403 302 690 227 197 - Software & Cloud Channel 52 616 31 782 102 072 59 960Total Adjusted EBITDA - Software & Cloud 260 305 198 185 404 762 287 157 - Software & Cloud Economics 19 851 7 369 30 902 6 161 - Consulting 56 080 31 949 83 906 54 323Total Adjusted EBITDA - Services 75 931 39 318 114 807 60 484Admin & shared services (80 388) (66 315) (170 694) (135 852) Total Adjusted EBITDA 255 847 171 187 348 876 211 789
Year to date ended30-Jun
Quarter ended30-Jun
(In thousands of NOK)Adjusted EBITDA per Market Cluster 2021 2020 2021 2020 - Nordics 155 967 143 576 279 330 237 996 - Europe 54 758 27 424 54 711 16 460 - APAC & MEA 61 913 32 076 63 569 27 495 - US 16 249 (363) 15 988 (10 601) - HQ (33 040) (31 526) (64 723) (59 561) Total Adjusted EBITDA 255 847 171 187 348 876 211 789
30-JunYear to date ended
30-JunQuarter ended

13
Segment information June 30, 2021, Quarter ended
(In thousands of NOK)
Software & Cloud Direct
Software & Cloud Channel
Software & Cloud Economics Consulting
Admin & Eliminations Total
Operating revenueNordics 1 980 912 447 795 35 288 311 281 -346 2 774 930 Europe 2 000 482 305 561 36 927 22 608 174 2 365 751 APAC & MEA 1 418 974 366 137 21 921 39 919 522 1 847 473 US 751 180 340 880 62 416 17 965 193 1 172 634 HQ - - - 434 15 101 15 535 Eliminations - - - - (105 027) (105 027) Operating revenue 6 151 548 1 460 373 156 551 392 207 (89 384) 8 071 296 Gross profitNordics 146 564 38 331 30 563 196 346 -500 411 303 Europe 100 639 22 303 31 328 23 571 617 178 459 APAC & MEA 68 272 19 237 11 032 22 077 1 088 121 705 US 29 485 7 222 54 481 13 168 193 104 549 HQ - - - (63) 15 453 15 390 Eliminations - - - - (19 789) (19 789) Gross profit 344 960 87 093 127 404 255 099 -2 939 811 617 Operating expenses 137 272 34 476 107 553 199 020 73 560 551 880 EBITDA 207 688 52 616 19 851 56 080 (76 499) 259 737 Depreciation and Amortisation 39 770 Net financial income and expenses 35 855 Net income before tax 184 112
Adjustments - - - - (3 890) (3 890) Adjusted EBITDA 207 688 52 616 19 851 56 080 (80 388) 255 847
Software & Cloud Services
Segment information June 30, 2020, Quarter ended
(In thousands of NOK)
Software & Cloud Direct
Software & Cloud Channel
Software & Cloud Economics Consulting
Admin & Eliminations Total
Operating revenueNordics 1 497 865 428 474 32 716 226 293 1 982 2 187 330 Europe 1 316 878 254 094 26 635 13 153 14 207 1 624 967 APAC & MEA 899 246 387 283 11 272 31 508 797 1 330 105 US 628 938 343 903 52 614 5 443 290 1 031 188 HQ - 62 - - 13 392 13 454 Eliminations - - - - (92 001) (92 001) Operating revenue 4 342 927 1 413 815 123 237 276 398 (61 332) 6 095 044 Gross profitNordics 141 465 38 024 28 015 142 361 2 095 351 959 Europe 82 533 19 762 25 972 13 614 578 142 459 APAC & MEA 50 931 18 943 9 297 15 331 1 800 96 302 US 19 774 6 814 50 409 2 938 1 859 81 794 HQ - 62 - - 15 048 15 110 Eliminations - - - - (21 784) (21 784) Gross profit 294 702 83 605 113 692 174 244 (404) 665 839 Operating expenses 128 299 51 823 106 323 142 296 72 673 501 414 EBITDA 166 403 31 782 7 369 31 949 (73 077) 164 425 Depreciation and Amortisation 34 608 Net financial income and expenses (1 992) Net income before tax 131 809
Adjustments - - - - 6 762 6 762 Adjusted EBITDA 166 403 31 782 7 369 31 949 (66 315) 171 187
Software & Cloud Services
Segment information June 30, 2021
(In thousands of NOK)
Software & Cloud Direct
Software & Cloud Channel
Software & Cloud Economics Consulting
Admin & Eliminations Total
Operating revenueNordics 3 688 468 848 390 70 362 558 428 805 5 166 453 Europe 2 784 136 596 455 67 325 45 225 770 3 493 911 APAC & MEA 2 213 635 704 322 31 849 58 603 1 160 3 009 570 US 1 275 769 650 945 123 574 31 938 397 2 082 623 HQ - - - 686 31 059 31 745 Eliminations - - - - (190 549) (190 549) Operating revenue 9 962 008 2 800 112 293 110 694 880 (156 358) 13 593 753 Gross profitNordics 262 999 74 163 60 679 359 067 606 757 515 Europe 156 643 45 477 54 823 40 294 1 193 298 429 APAC & MEA 108 905 40 958 18 074 32 216 1 990 202 141 US 46 718 13 043 109 385 25 311 397 194 854 HQ - - - (92) 31 616 31 524 Eliminations - - - - (37 904) (37 904) Gross profit 575 264 173 641 242 960 456 795 (2 102) 1 446 558 Operating expenses 272 574 71 568 212 059 372 890 176 522 1 105 613 EBITDA 302 690 102 072 30 902 83 906 (178 624) 340 945 Depreciation and Amortisation 75 855 Net financial income and expenses 52 015 Net income before tax 213 076
Adjustments - - - - 7 931 7 931 Adjusted EBITDA 302 690 102 072 30 902 83 906 (170 694) 348 876
Software & Cloud Services
Segment information June 30, 2020
(In thousands of NOK)
Software & Cloud Direct
Software & Cloud Channel
Software & Cloud
Economics ConsultingAdmin &
Eliminations TotalOperating revenueNordics 2 704 405 791 051 71 634 439 621 10 349 4 017 060 Europe 1 909 403 468 546 46 289 36 724 14 776 2 475 739 APAC & MEA 1 351 744 752 023 19 476 43 381 1 768 2 168 392 US 965 213 693 321 101 695 6 876 542 1 767 648 HQ - 62 (0) 2 27 258 27 322 Eliminations - - - - (157 163) (157 163) Operating revenue 6 930 765 2 705 003 239 093 526 604 (102 469) 10 298 997 Gross profitNordics 242 183 68 696 55 066 283 925 1 991 651 860 Europe 126 705 35 321 45 816 22 116 1 664 231 621 APAC & MEA 76 407 39 514 15 084 23 647 3 029 157 682 US 33 101 13 535 97 878 3 916 620 149 050 HQ - 136 353 2 29 282 29 773 Eliminations - - - - (38 940) (38 940) Gross profit 478 396 157 202 214 197 333 606 (2 355) 1 181 045 Operating expenses 251 199 97 242 208 036 279 283 142 364 978 124 EBITDA 227 197 59 960 6 161 54 323 (144 719) 202 921 Depreciation and Amortisation 67 237 Net financial income and expenses 45 339 Net income before tax 90 345
Adjustments - - - - 8 867 8 867 Adjusted EBITDA 227 197 59 960 6 161 54 323 (135 852) 211 788
Software & Cloud Services
14
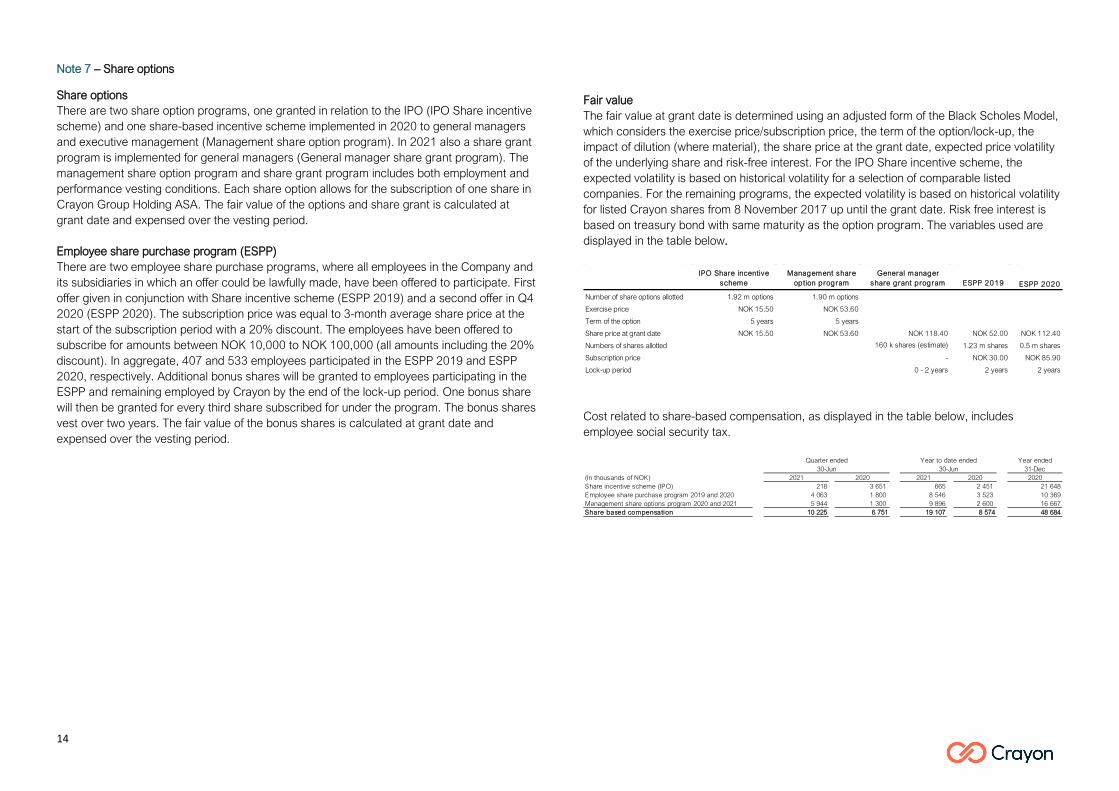
Note 7 – Share options
Share options There are two share option programs, one granted in relation to the IPO (IPO Share incentive scheme) and one share-based incentive scheme implemented in 2020 to general managers and executive management (Management share option program). In 2021 also a share grant program is implemented for general managers (General manager share grant program). The management share option program and share grant program includes both employment and performance vesting conditions. Each share option allows for the subscription of one share in Crayon Group Holding ASA. The fair value of the options and share grant is calculated at grant date and expensed over the vesting period. Employee share purchase program (ESPP) There are two employee share purchase programs, where all employees in the Company and its subsidiaries in which an offer could be lawfully made, have been offered to participate. First offer given in conjunction with Share incentive scheme (ESPP 2019) and a second offer in Q4 2020 (ESPP 2020). The subscription price was equal to 3-month average share price at the start of the subscription period with a 20% discount. The employees have been offered to subscribe for amounts between NOK 10,000 to NOK 100,000 (all amounts including the 20% discount). In aggregate, 407 and 533 employees participated in the ESPP 2019 and ESPP 2020, respectively. Additional bonus shares will be granted to employees participating in the ESPP and remaining employed by Crayon by the end of the lock-up period. One bonus share will then be granted for every third share subscribed for under the program. The bonus shares vest over two years. The fair value of the bonus shares is calculated at grant date and expensed over the vesting period.
Fair value The fair value at grant date is determined using an adjusted form of the Black Scholes Model, which considers the exercise price/subscription price, the term of the option/lock-up, the impact of dilution (where material), the share price at the grant date, expected price volatility of the underlying share and risk-free interest. For the IPO Share incentive scheme, the expected volatility is based on historical volatility for a selection of comparable listed companies. For the remaining programs, the expected volatility is based on historical volatility for listed Crayon shares from 8 November 2017 up until the grant date. Risk free interest is based on treasury bond with same maturity as the option program. The variables used are displayed in the table below.
Cost related to share-based compensation, as displayed in the table below, includes employee social security tax.
IPO Share incentive scheme
Management share option program
General manager share grant program ESPP 2019 ESPP 2020
Number of share options allotted 1.92 m options 1.90 m options
Exercise price NOK 15.50 NOK 53.60
Term of the option 5 years 5 years
Share price at grant date NOK 15.50 NOK 53.60 NOK 118.40 NOK 52.00 NOK 112.40
Numbers of shares allotted 160 k shares (estimate) 1.23 m shares 0.5 m shares
Subscription price - NOK 30.00 NOK 85.90
Lock-up period 0 - 2 years 2 years 2 years
Year ended 31-Dec
(In thousands of NOK) 2021 2020 2021 2020 2020Share incentive scheme (IPO) 218 3 651 665 2 451 21 648Employee share purchase program 2019 and 2020 4 063 1 800 8 546 3 523 10 369Management share options program 2020 and 2021 5 944 1 300 9 896 2 600 16 667Share based compensation 10 225 6 751 19 107 8 574 48 684
Quarter ended Year to date ended30-Jun 30-Jun

15
Note 8 – Intangible assets
The company recognises intangible assets in the balance sheet if it is likely that the expected future economic benefits attributable to the asset will accrue to the company and the assets acquisition cost can be measured reliably. Total amortisation of intangibles year to date June 30, 2021 amounts to NOK 44.1m. Of this, NOK 13.6m relates to impairments of intangible assets identified as part of purchase price allocation from acquisitions. Intangible assets with a limited useful life are measured at their acquisition cost, minus accumulated amortisation and impairments. Amortisation is recognised linearly over the estimated useful life. Amortisation period and method are reviewed annually. Intangible assets with an indefinite useful economic life are not amortised but are tested annually for impairment. See note 9 for additional information of impairment assessment at December 31, 2020. The company divides its Intangible assets into the following categories in the balance sheet:
Technology and software: According to IFRS 3, the Group has assessed if there are any identifiable intangible assets separable from Goodwill arising on business combinations. The Group has determined that intangible assets arising from the business combinations of Anglepoint and FAST meet the recognition requirements under IAS 38 as separately identifiable intangible assets. In the case of FAST, a set of technology and software primarily used in a subscription service to customers who need both Software & Cloud Economics (previous SAM) and IT compliance services was capitalised. This technology and software are expected to generate future economic benefits to the Group. In the case of the business combination with Anglepoint, the Group capitalised software and technology developed internally by Anglepoint. All qualifying intangible assets acquired during business combinations are recognised in the balance sheet at fair value at the time of acquisition. Technology, Software and R&D arising from business combinations are amortised linearly over the estimated useful life.
In addition to intangible assets recognised as part of business combinations, the Group also capitalises expenses related to development activities if the product or process is technically feasible, and the Group has adequate resources to complete the development. Expenses capitalised include material cost, direct wage costs and a share of directly attributable overhead costs. Capitalised development costs are depreciated linearly over the estimated useful life.
Software licences (IP): Software Licences (IP) relates to intangible assets recognised in relation to Genova and from the acquisition of Navicle. Genova is part of Esito's developed software (with an indefinite lifetime), The IP allocated for Navicle is also used as an internal tool to serve its customer base and is expected to generate future economic benefits for the Group. This IP tool is amortised on straight line basis over the estimated useful lifetime.
Contracts: Per IFRS 3, the Group has assessed if there are any identifiable intangible assets separable from Goodwill arising from business combinations. The Group has determined that the contractual customer relationships identified in the business combinations of Anglepoint, Inmeta, FAST, Again, Sequint, Techstep, Winc and Sensa meet the recognition requirements under IAS 38 as separately identifiable intangible assets. These contractual relationships are all expected to generate future economic benefits to the Group. Contractual customer relationships acquired in business combinations are recognized in the balance sheet at fair value at the time of acquisition. The contractual customer relationships have limited useful life and are stated at acquisition cost minus accumulated amortisation. Linear amortisation is carried over expected useful life.
2020Softw are l icenses
(IP)Development
costs ContractsTechnology
and softw are TotalAquisition cost 01.01 8 769 316 823 401 684 67 741 795 017Additions - 26 944 128 923 0 155 867FX translation (23) 6194 (843) 135 5 463 Aquisi ti tion cost at the end of the period 8 746 349 961 529 764 67 876 956 347
Amortisation and impairment 01.01 6 554 228 067 341 305 49 226 625 152Amortisation 134 27 402 12 672 3 941 44 149Impairment - - - 0Accumulated amortisation and impai rment 6 688 255 469 353 977 53 167 669 301
Net value at the end of the period 2 058 94 492 175 787 14 709 287 046
Amortisation period 0-5 years 3-10 years 5-20 years 3-10 years Amortisation method Linear Linear Linear Linear

16
Note 9 – Goodwill Goodwill arising on business combinations is initially measured at cost, being the excess of the cost of an acquisition over the net identifiable assets and liabilities assumed at the date of acquisition and relates to the future economic benefits arising from assets which are not capable of being identified and separately recognised. Following initial recognition, Goodwill is measured at cost less accumulated impairment losses. Reconciliation of the carrying amount of goodwill at the beginning and end of the reporting period is presented below:
The Group performs an impairment test for goodwill on an annual basis or when there are circumstances which would indicate that the carrying value of goodwill may be impaired. When assessing impairment, assets are grouped into cash generating units (CGU's), the lowest levels at which it is possible to distinguish between cash flows. Impairment of goodwill is tested by comparing the carrying value of goodwill for each CGU to the recoverable amount. The recoverable amount is the higher of fair value less cost to sell and value in use. The impairment assessment is built on a discounted cashflow model (DCF), with the model assumptions relating to WACC and CAGR. Future cash flows are discounted to present value using a discount rate based on a calculation of a weighted average cost of capital (WACC). As a general principle, the Group pre-tax WACC is used for most CGUs in the model applying the US interest rate. However, when there are material differences in the local market where the CGU operates (e.g., the interest risk, or the general market conditions), the WACC is adjusted accordingly. Crayon assess indication of impairment at each reporting period. At June 30, 2021 no impairment indication has been identified. Regarding Covid-19 outlook, although hope is on the horizon with the roll-out of several vaccines across most countries, as well as third-party intervention from governments and central banks to stabilize economic conditions, impacts of the COVID-19 outbreak continue to evolve. However, Crayon’s financial performance and operations has not negatively been affected during the pandemic, on the contrary, further business opportunities have raised and materialized. Crayon is not experiencing decreased
revenues, significant changes with adverse effect on the entity, or other factors described in IFRS 36 that indicate that their assets should be tested for impairment. For more information on sensitivity analysis see Note 9 in the 2020 consolidated financial statements.
(In thousands of NOK) Goodw i l l Aquisition cost at 01.01 960 450Additions 78 933Currency translation (3 166) Aquisi tion cost at the end of the period 1 036 218
Impairment at 01.01 109 517Impairment during the period - Accumulated Impai rment at the end of the period 109 517
Net book value at the end of the period 926 701
17
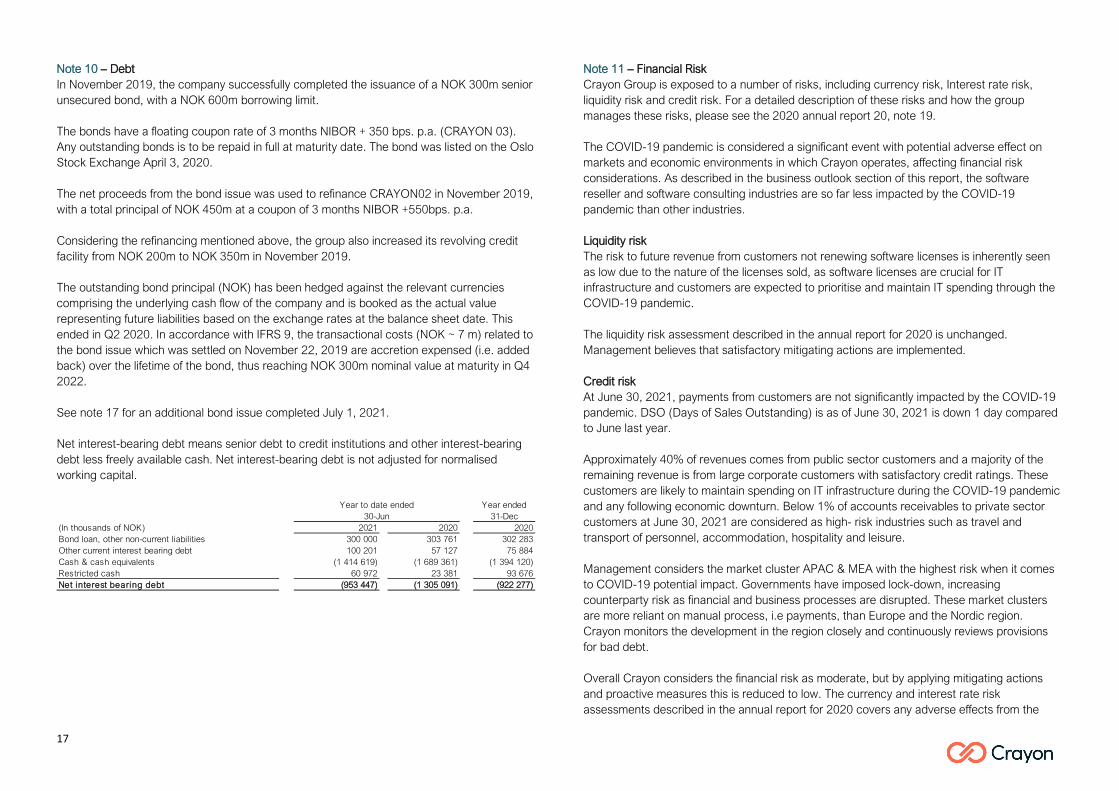
Note 10 – Debt In November 2019, the company successfully completed the issuance of a NOK 300m senior unsecured bond, with a NOK 600m borrowing limit. The bonds have a floating coupon rate of 3 months NIBOR + 350 bps. p.a. (CRAYON 03). Any outstanding bonds is to be repaid in full at maturity date. The bond was listed on the Oslo Stock Exchange April 3, 2020. The net proceeds from the bond issue was used to refinance CRAYON02 in November 2019, with a total principal of NOK 450m at a coupon of 3 months NIBOR +550bps. p.a. Considering the refinancing mentioned above, the group also increased its revolving credit facility from NOK 200m to NOK 350m in November 2019. The outstanding bond principal (NOK) has been hedged against the relevant currencies comprising the underlying cash flow of the company and is booked as the actual value representing future liabilities based on the exchange rates at the balance sheet date. This ended in Q2 2020. In accordance with IFRS 9, the transactional costs (NOK ~ 7 m) related to the bond issue which was settled on November 22, 2019 are accretion expensed (i.e. added back) over the lifetime of the bond, thus reaching NOK 300m nominal value at maturity in Q4 2022. See note 17 for an additional bond issue completed July 1, 2021. Net interest-bearing debt means senior debt to credit institutions and other interest-bearing debt less freely available cash. Net interest-bearing debt is not adjusted for normalised working capital.
Note 11 – Financial Risk Crayon Group is exposed to a number of risks, including currency risk, Interest rate risk, liquidity risk and credit risk. For a detailed description of these risks and how the group manages these risks, please see the 2020 annual report 20, note 19. The COVID-19 pandemic is considered a significant event with potential adverse effect on markets and economic environments in which Crayon operates, affecting financial risk considerations. As described in the business outlook section of this report, the software reseller and software consulting industries are so far less impacted by the COVID-19 pandemic than other industries. Liquidity risk The risk to future revenue from customers not renewing software licenses is inherently seen as low due to the nature of the licenses sold, as software licenses are crucial for IT infrastructure and customers are expected to prioritise and maintain IT spending through the COVID-19 pandemic. The liquidity risk assessment described in the annual report for 2020 is unchanged. Management believes that satisfactory mitigating actions are implemented. Credit risk At June 30, 2021, payments from customers are not significantly impacted by the COVID-19 pandemic. DSO (Days of Sales Outstanding) is as of June 30, 2021 is down 1 day compared to June last year. Approximately 40% of revenues comes from public sector customers and a majority of the remaining revenue is from large corporate customers with satisfactory credit ratings. These customers are likely to maintain spending on IT infrastructure during the COVID-19 pandemic and any following economic downturn. Below 1% of accounts receivables to private sector customers at June 30, 2021 are considered as high- risk industries such as travel and transport of personnel, accommodation, hospitality and leisure. Management considers the market cluster APAC & MEA with the highest risk when it comes to COVID-19 potential impact. Governments have imposed lock-down, increasing counterparty risk as financial and business processes are disrupted. These market clusters are more reliant on manual process, i.e payments, than Europe and the Nordic region. Crayon monitors the development in the region closely and continuously reviews provisions for bad debt. Overall Crayon considers the financial risk as moderate, but by applying mitigating actions and proactive measures this is reduced to low. The currency and interest rate risk assessments described in the annual report for 2020 covers any adverse effects from the
Year ended 31-Dec(In thousands of NOK) 2021 2020 2020Bond loan, other non-current liabilities 300 000 303 761 302 283Other current interest bearing debt 100 201 57 127 75 884Cash & cash equivalents (1 414 619) (1 689 361) (1 394 120) Restricted cash 60 972 23 381 93 676Net interest bearing debt (953 447) (1 305 091) (922 277)
Year to date ended30-Jun
18
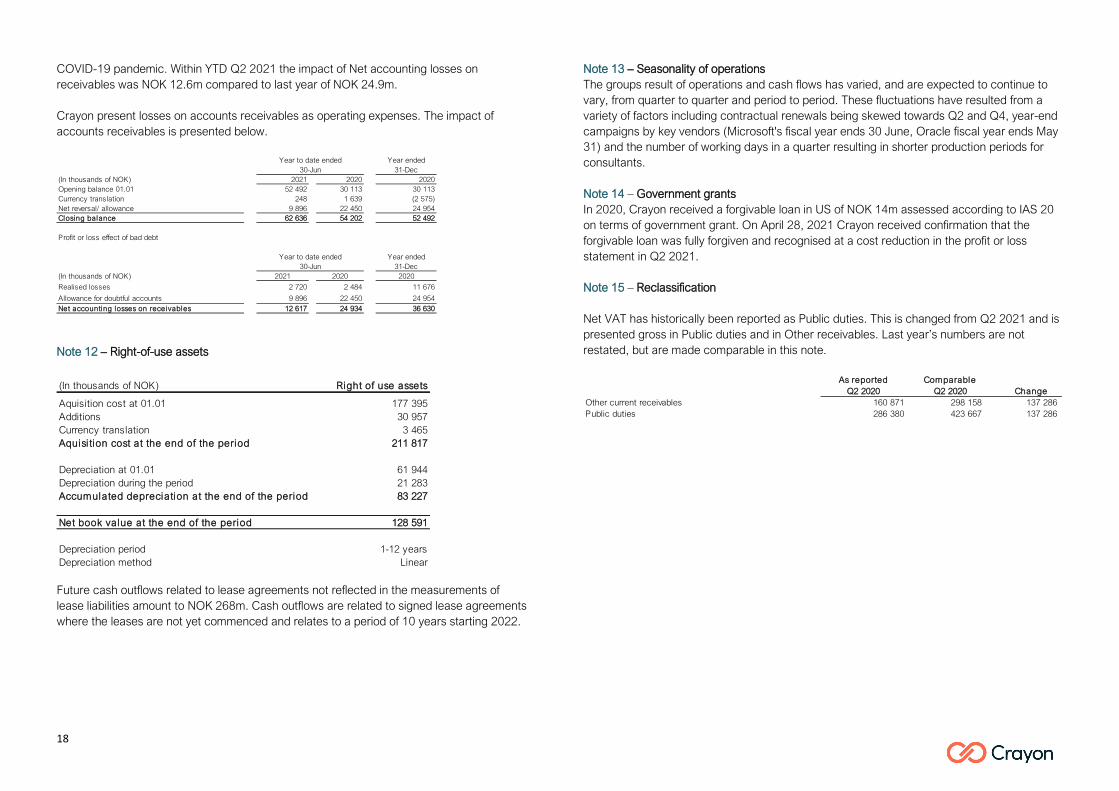
COVID-19 pandemic. Within YTD Q2 2021 the impact of Net accounting losses on receivables was NOK 12.6m compared to last year of NOK 24.9m. Crayon present losses on accounts receivables as operating expenses. The impact of accounts receivables is presented below.
Note 12 – Right-of-use assets
Future cash outflows related to lease agreements not reflected in the measurements of lease liabilities amount to NOK 268m. Cash outflows are related to signed lease agreements where the leases are not yet commenced and relates to a period of 10 years starting 2022.
Note 13 – Seasonality of operations The groups result of operations and cash flows has varied, and are expected to continue to vary, from quarter to quarter and period to period. These fluctuations have resulted from a variety of factors including contractual renewals being skewed towards Q2 and Q4, year-end campaigns by key vendors (Microsoft's fiscal year ends 30 June, Oracle fiscal year ends May 31) and the number of working days in a quarter resulting in shorter production periods for consultants. Note 14 – Government grants In 2020, Crayon received a forgivable loan in US of NOK 14m assessed according to IAS 20 on terms of government grant. On April 28, 2021 Crayon received confirmation that the forgivable loan was fully forgiven and recognised at a cost reduction in the profit or loss statement in Q2 2021. Note 15 – Reclassification Net VAT has historically been reported as Public duties. This is changed from Q2 2021 and is presented gross in Public duties and in Other receivables. Last year’s numbers are not restated, but are made comparable in this note.
Year ended 31-Dec(In thousands of NOK) 2021 2020 2020Opening balance 01.01 52 492 30 113 30 113Currency translation 248 1 639 (2 575) Net reversal/ allowance 9 896 22 450 24 954Closing balance 62 636 54 202 52 492
Profit or loss effect of bad debt
Year ended 31-Dec(In thousands of NOK) 2021 2020 2020
Realised losses 2 720 2 484 11 676
Allowance for doubtful accounts 9 896 22 450 24 954Net accounting losses on receivables 12 617 24 934 36 630
Year to date ended30-Jun
Year to date ended30-Jun
(In thousands of NOK) Right of use assets
Aquisition cost at 01.01 177 395Additions 30 957Currency translation 3 465Aquisi tion cost at the end of the period 211 817
Depreciation at 01.01 61 944Depreciation during the period 21 283Accumulated depreciation at the end of the period 83 227
Net book value at the end of the period 128 591
Depreciation period 1-12 yearsDepreciation method Linear
As reported Q2 2020
Comparable Q2 2020 Change
Other current receivables 160 871 298 158 137 286 Public duties 286 380 423 667 137 286
19
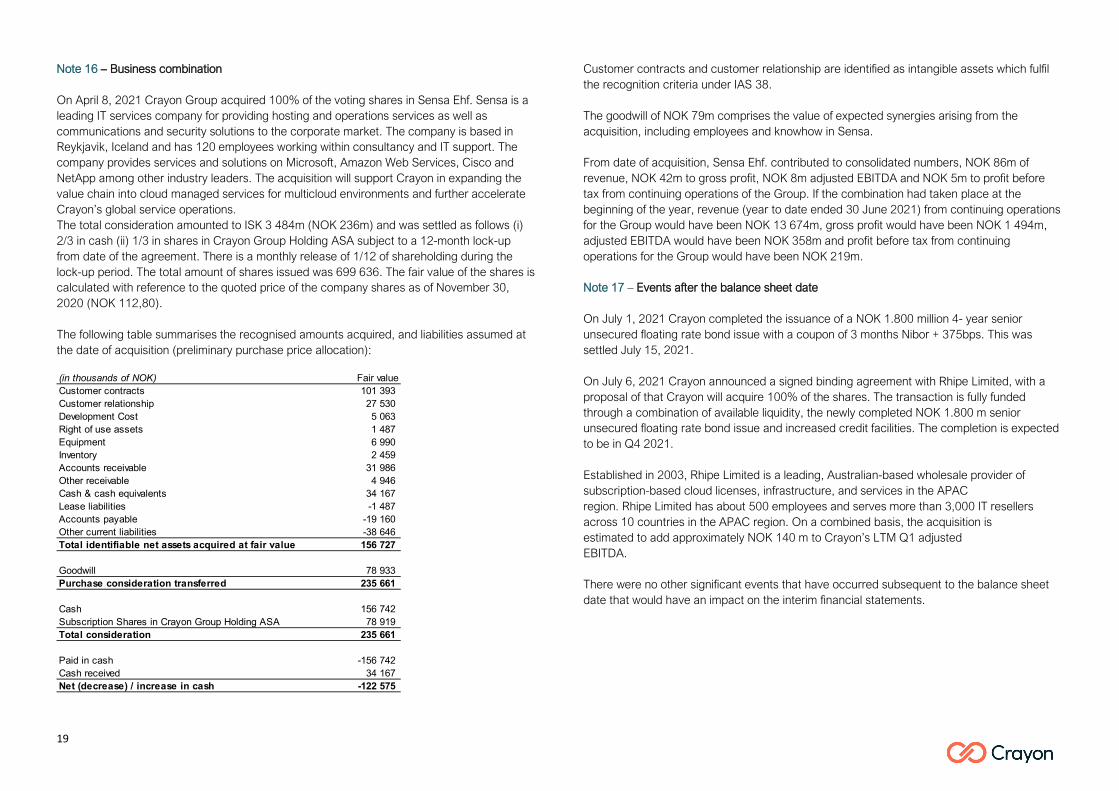
Note 16 – Business combination On April 8, 2021 Crayon Group acquired 100% of the voting shares in Sensa Ehf. Sensa is a leading IT services company for providing hosting and operations services as well as communications and security solutions to the corporate market. The company is based in Reykjavik, Iceland and has 120 employees working within consultancy and IT support. The company provides services and solutions on Microsoft, Amazon Web Services, Cisco and NetApp among other industry leaders. The acquisition will support Crayon in expanding the value chain into cloud managed services for multicloud environments and further accelerate Crayon’s global service operations. The total consideration amounted to ISK 3 484m (NOK 236m) and was settled as follows (i) 2/3 in cash (ii) 1/3 in shares in Crayon Group Holding ASA subject to a 12-month lock-up from date of the agreement. There is a monthly release of 1/12 of shareholding during the lock-up period. The total amount of shares issued was 699 636. The fair value of the shares is calculated with reference to the quoted price of the company shares as of November 30, 2020 (NOK 112,80). The following table summarises the recognised amounts acquired, and liabilities assumed at the date of acquisition (preliminary purchase price allocation):
Customer contracts and customer relationship are identified as intangible assets which fulfil the recognition criteria under IAS 38. The goodwill of NOK 79m comprises the value of expected synergies arising from the acquisition, including employees and knowhow in Sensa. From date of acquisition, Sensa Ehf. contributed to consolidated numbers, NOK 86m of revenue, NOK 42m to gross profit, NOK 8m adjusted EBITDA and NOK 5m to profit before tax from continuing operations of the Group. If the combination had taken place at the beginning of the year, revenue (year to date ended 30 June 2021) from continuing operations for the Group would have been NOK 13 674m, gross profit would have been NOK 1 494m, adjusted EBITDA would have been NOK 358m and profit before tax from continuing operations for the Group would have been NOK 219m. Note 17 – Events after the balance sheet date On July 1, 2021 Crayon completed the issuance of a NOK 1.800 million 4- year senior unsecured floating rate bond issue with a coupon of 3 months Nibor + 375bps. This was settled July 15, 2021. On July 6, 2021 Crayon announced a signed binding agreement with Rhipe Limited, with a proposal of that Crayon will acquire 100% of the shares. The transaction is fully funded through a combination of available liquidity, the newly completed NOK 1.800 m senior unsecured floating rate bond issue and increased credit facilities. The completion is expected to be in Q4 2021. Established in 2003, Rhipe Limited is a leading, Australian-based wholesale provider of subscription-based cloud licenses, infrastructure, and services in the APAC region. Rhipe Limited has about 500 employees and serves more than 3,000 IT resellers across 10 countries in the APAC region. On a combined basis, the acquisition is estimated to add approximately NOK 140 m to Crayon’s LTM Q1 adjusted EBITDA. There were no other significant events that have occurred subsequent to the balance sheet date that would have an impact on the interim financial statements.
(in thousands of NOK) Fair valueCustomer contracts 101 393 Customer relationship 27 530 Development Cost 5 063 Right of use assets 1 487 Equipment 6 990 Inventory 2 459 Accounts receivable 31 986 Other receivable 4 946 Cash & cash equivalents 34 167 Lease liabilities -1 487 Accounts payable -19 160 Other current liabilities -38 646 Total identifiable net assets acquired at fair value 156 727
Goodwill 78 933 Purchase consideration transferred 235 661
Cash 156 742 Subscription Shares in Crayon Group Holding ASA 78 919 Total consideration 235 661
Paid in cash -156 742 Cash received 34 167 Net (decrease) / increase in cash -122 575
20
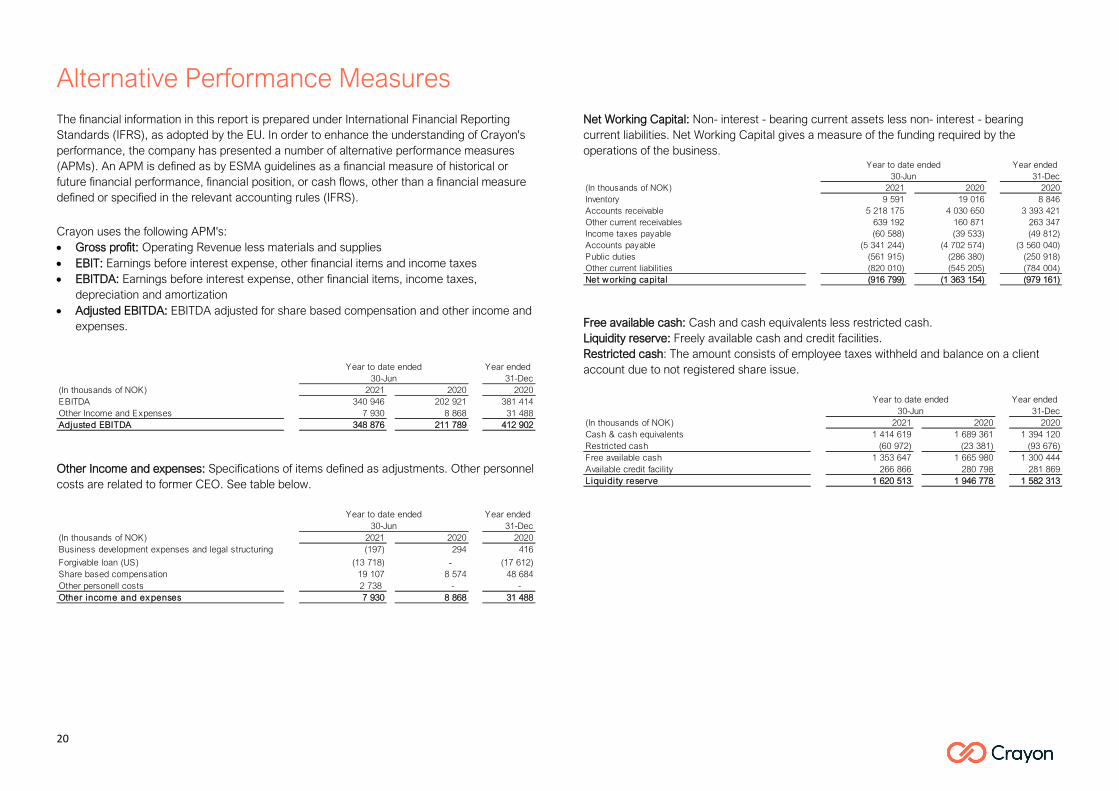
Alternative Performance Measures The financial information in this report is prepared under International Financial Reporting Standards (IFRS), as adopted by the EU. In order to enhance the understanding of Crayon's performance, the company has presented a number of alternative performance measures (APMs). An APM is defined as by ESMA guidelines as a financial measure of historical or future financial performance, financial position, or cash flows, other than a financial measure defined or specified in the relevant accounting rules (IFRS).
Crayon uses the following APM's: • Gross profit: Operating Revenue less materials and supplies • EBIT: Earnings before interest expense, other financial items and income taxes • EBITDA: Earnings before interest expense, other financial items, income taxes,
depreciation and amortization • Adjusted EBITDA: EBITDA adjusted for share based compensation and other income and
expenses.
Other Income and expenses: Specifications of items defined as adjustments. Other personnel costs are related to former CEO. See table below.
Net Working Capital: Non- interest - bearing current assets less non- interest - bearing current liabilities. Net Working Capital gives a measure of the funding required by the operations of the business.
Free available cash: Cash and cash equivalents less restricted cash. Liquidity reserve: Freely available cash and credit facilities. Restricted cash: The amount consists of employee taxes withheld and balance on a client account due to not registered share issue.
Year ended 31-Dec
(In thousands of NOK) 2021 2020 2020EBITDA 340 946 202 921 381 414Other Income and Expenses 7 930 8 868 31 488Adjusted EBITDA 348 876 211 789 412 902
30-JunYear to date ended
Year ended 31-Dec
(In thousands of NOK) 2021 2020 2020Business development expenses and legal structuring (197) 294 416
Forgivable loan (US) (13 718) - (17 612) Share based compensation 19 107 8 574 48 684Other personell costs 2 738 - - Other income and ex penses 7 930 8 868 31 488
Year to date ended30-Jun
Year ended 31-Dec
(In thousands of NOK) 2021 2020 2020Inventory 9 591 19 016 8 846Accounts receivable 5 218 175 4 030 650 3 393 421Other current receivables 639 192 160 871 263 347Income taxes payable (60 588) (39 533) (49 812) Accounts payable (5 341 244) (4 702 574) (3 560 040) Public duties (561 915) (286 380) (250 918) Other current liabilities (820 010) (545 205) (784 004) Net w orking capi tal (916 799) (1 363 154) (979 161)
Year to date ended30-Jun
Year ended 31-Dec
(In thousands of NOK) 2021 2020 2020Cash & cash equivalents 1 414 619 1 689 361 1 394 120Restricted cash (60 972) (23 381) (93 676) Free available cash 1 353 647 1 665 980 1 300 444Available credit facility 266 866 280 798 281 869Liquidi ty reserve 1 620 513 1 946 778 1 582 313
30-JunYear to date ended

21
Responsibility statement by the Board and CEO The Board and CEO have considered and approved the condensed set of financial statements for the period 1 January to 30 June 2021. We confirm to the best of our knowledge that the condensed set of financial statements for the above-mentioned period:
• Has been prepared in accordance with IAS 34 (Interim Financial Reporting) • Gives a true and fair view of the Group’s assets, liabilities, financial position, and overall result for the period viewed in in their entirety • That the interim management report includes a fair review of any significant events that arose during the above-mentioned period and their effect on the financial report • Gives a true picture of any significant related parties’ transactions, principal risks and uncertainties faced by the Group
Oslo, August 10, 2021
Grethe Viksaas Rune Syversen Chairman
Dagfinn Ringås Jennifer Koss
Eivind Roald Camilla Magnus Mette Wam Jens Rugseth
Christian Ødemark Melissa Mulholland CEO
Brit Smestad

22
Crayon Group Holding ASA Sandakerveiein 114A P.O. box 4384 Nydalen, 0402 Oslo, Norway Phone +47 23 00 67 00 Fax +47 22 89 10 01 Org.nr. 997 602 234 www.crayon.com Investor Relations www.crayon.com/en/about-us/investor-relations