cravens & co. 2014 review
DESCRIPTION
Economy & MarketsTRANSCRIPT
Despite a bumpy ride throughout 2014, the US economy gained pace while the US equity and fixed income markets outperformed most markets around the world. This performance came with higher market volatility in the US, a rallying dollar, slowing economies in Europe and Asia, and rising geopolitical tensions, including conflicts in Ukraine and the Middle East. The Dow Jones Industrial Average rose for the sixth straight year, posting a 7.52% gain (price-only return). The S&P 500 Index rose 13.69% (including reinvested dividends), marking the third straight year in which the benchmark has returned more than 10%. The Dow closed at a record high on 38 calendar days, while the S&P 500 had 53 record closes. The non-US markets followed a much different track: All major indices logged negative performance for the year (in USD). The MSCI EAFE Index had a -4.90% return and the MSCI Emerging Markets Index a -2.19% return (net dividends, in USD). The dollar’s strong performance relative to major regional currencies contributed significantly to the lower returns for US investors. Government bond yields fell across major markets, including the US, where many expected higher rates in response to improving economic growth and an eventual rate increase due to the end of quantitative easing by the Federal Reserve. The yield on the 10-year Treasury note declined to 2.17% by year-end, down from 3.03% in 2013, with lower prices boosting its return to over 4.0% for the year. The Barclays US Government Bond Index returned 4.92%. World government bonds had slightly positive returns: The Citigroup World Government Bond 1–5 Year Index (hedged) returned 1.90%.
2014 Review: Economy & Markets
2015 Cravens & Company Advisors |1080 Interstate Drive, Cookeville, TN 38501
931-528-6865 | F 931-646-3619 | [email protected]
2
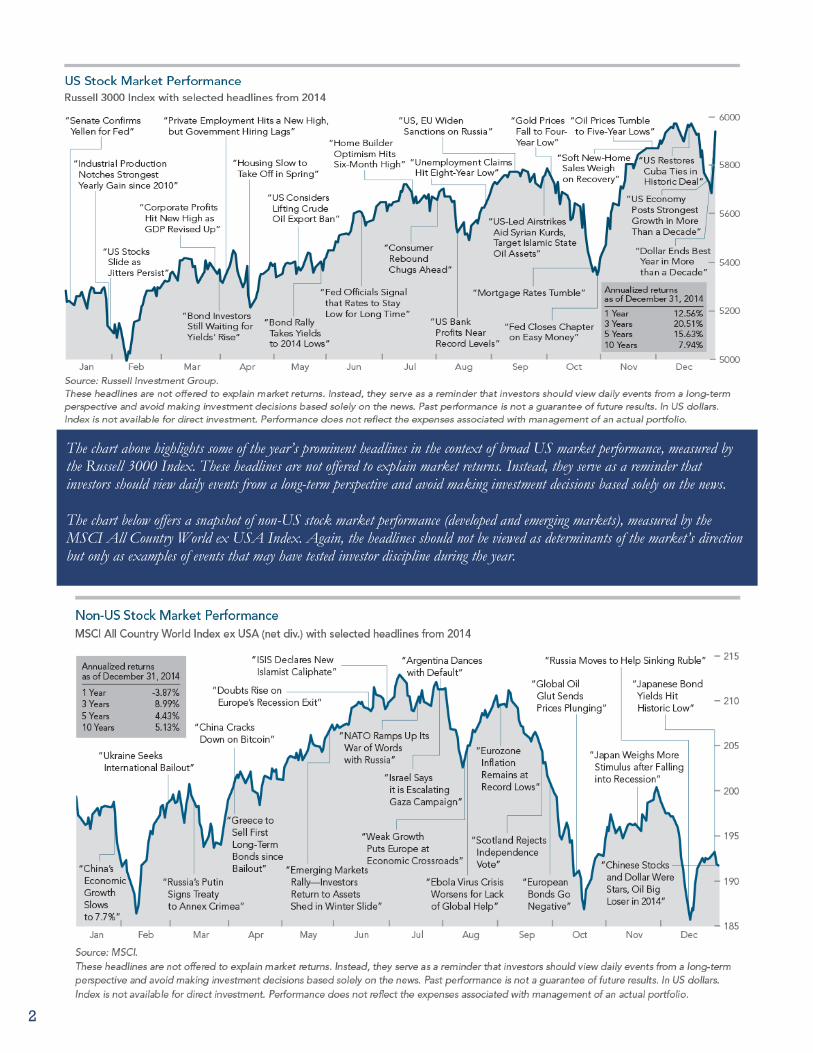
The chart above highlights some of the year’s prominent headlines in the context of broad US market performance, measured by the Russell 3000 Index. These headlines are not offered to explain market returns. Instead, they serve as a reminder that investors should view daily events from a long-term perspective and avoid making investment decisions based solely on the news. The chart below offers a snapshot of non-US stock market performance (developed and emerging markets), measured by the MSCI All Country World ex USA Index. Again, the headlines should not be viewed as determinants of the market’s direction but only as examples of events that may have tested investor discipline during the year.
3
Accelerating US Recovery The economy showed signs of weakening in early 2014, with Q1 GDP growth reported at an annualized -2.9%. In Q2, GDP rebounded strongly at a 4.6% annual growth rate (seasonally adjusted)—the highest since 2003. Growth in Q3 was even stronger at 5%, capping its best six-month stretch since 2003 and reaching the highest annualized growth rate in 11 years. If the Fed’s Q4 estimates hold, 2014 GDP growth will have been in the 2.4% range. A host of indicators pointed to improving conditions during the year, including:
• Employment—The US economy added 2.7 million jobs through November, the best employment growth in 15 years. Claims for jobless benefits ran lower than at any point since 2000. By year-end, the US had recovered all jobs lost to the past recession, and joblessness was at a six-year low. Despite the lowest labor force participation rate since the 1970s, the economy entered 2015 with record employment.
• Manufacturing—Economic activity in the manufacturing sector improved throughout most of 2014. The Institute for Supply Management (ISM) reported its purchasing managers index (PMI) at 59.0 in October, 58.7 in November, and 55.5 in December. (A reading above 50% indicates general expansion.) For the year, the PMI averaged 55.8, the best reading since the first full year after the recession in 2007–09.
• Consumer spending—An improving labor market and lower energy prices translated into higher income and purchases among American workers. Real personal consumption expenditures increased at a seasonally adjusted 3.2% rate in Q3, compared to 2.5% in Q2. US equity market gains over the past three years have added $7 trillion to household wealth, which many believe has helped fuel spending.
• Company earnings—The Department of Commerce reported a 2.8% rise in US corporate profits in Q2, followed by a 5.1% increase in Q3, marking 12 straight quarters of year-over-year growth. According to GDP data, Q2 after-tax profits hit a record high. However, after adjustments for depreciation and inventory changes, profit margins—particularly among smaller companies—appeared to be declining due to rising labor costs and capital expenditures.
Economic Backdrop

4
Declining Oil Prices Oil prices fell by almost half during 2014, a victim of excess supply due to rising production—particularly in the US, where production soared to its highest level since 1986—and to weakening demand from the economic slowdown in Europe and Asia. In the US, prices dropped from $107 per barrel in June to just over $53 at year-end. For the year, Brent crude was down 48% and West Texas Intermediate crude down 46%. The price decline most affected the economies and currencies of oil-exporting countries, especially Russia.
Soaring Dollar In 2014, the US dollar rose against every developed markets currency. Overall, it gained 12.5% against a basket of widely traded currencies, measured by the Wall Street Journal dollar index. This was the dollar’s best gain since 2005 and second-best on record. The rise was attributed to stronger US economic data, falling global oil prices, expectations of higher interest rates, and weakened currencies resulting from monetary easing by the Japanese and European central banks.
Weak Inflation Despite rising to an 18-month high in May and June (2.1% each), average US inflation remained low throughout 2014. In November, year-over-year inflation fell to 1.3%. Since rising inflation is normally viewed as a sign of an economic uptick, some believe that weak inflation influenced the Fed’s decision to not raise interest rates. Across the world’s largest economies, inflation eased for the sixth straight month in November, with the Organization for Economic Cooperation and Development (OECD) reporting average annual inflation for its 34 members at 1.5%.
5
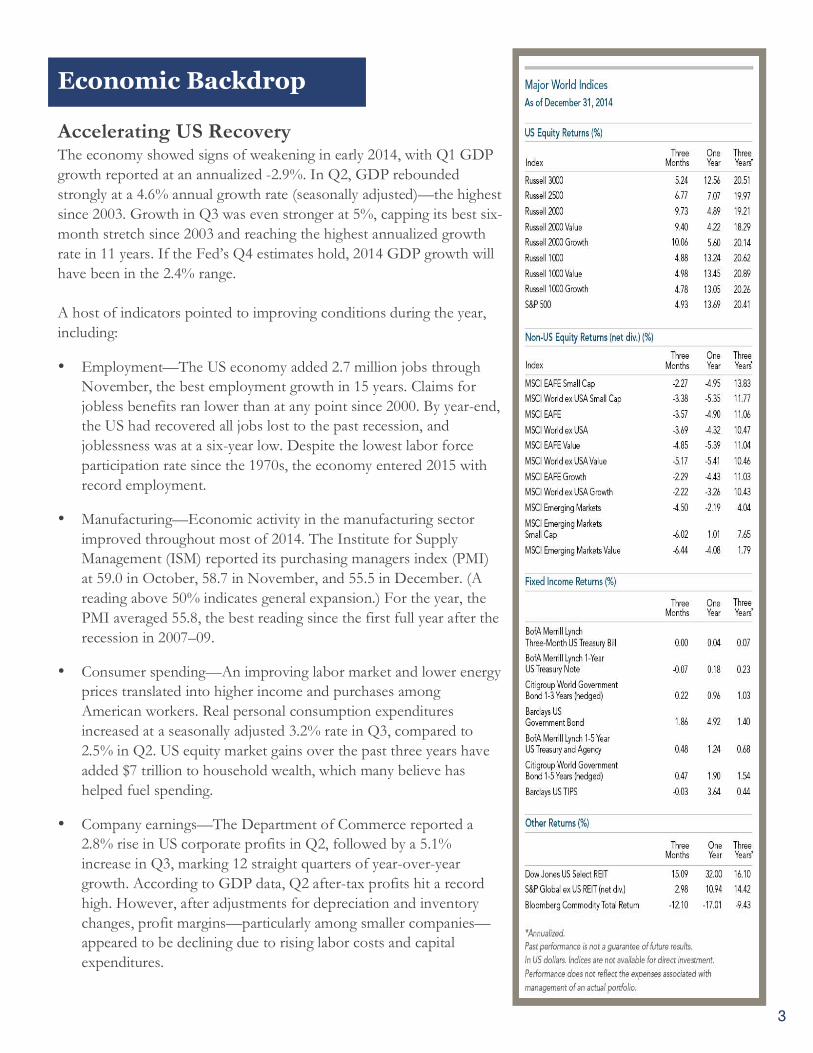
2014 Investment Overview Market Summary The US equity markets—and particularly the large cap segment of the market—logged a strong year. The S&P 500 Index returned 13.69%; the NASDAQ Composite Index gained 13.40%; and the Russell 2000, a popular benchmark for small company US stocks, returned 4.89%. US market volatility, measured by the Chicago Board Options Exchange Market Volatility Index (VIX), increased to its highest level in two years, with most activity occurring in Q3. Average volatility for the year, however, was the lowest since 2006. Non-US developed stock markets experienced negative performance across almost all major indices (references in USD). The MSCI World ex USA Index, a benchmark for large cap stocks in developed markets outside the US, returned -4.32%. The small cap and value versions of the MSCI EAFE index returned -4.95% and -5.39%, respectively. Emerging markets proved no exception, with the MSCI Emerging Markets Index returning -2.19% and the value sub-index returning -4.08%. The small cap sub-index returned 1.01%. Among the equity markets tracked by MSCI, more than half of the countries in the non-US developed markets index had negative total returns and the range of returns was broad. The top three return countries were Israel (22.77%), New Zealand (7.34%), and Denmark (6.18%). Countries with the lowest returns were Portugal (-38.24%), Austria (-29.77%), and Norway (-22.04%). In emerging markets, 13 of 23 countries tracked by MSCI logged negative total returns and the dispersion of returns was broader. Egypt (29.33%), Indonesia (26.59%), and the Philippines (25.59%) were the top-performing countries in the index. The lowest returns in the index came from Russia (-46.27%), Greece (-39.96%), & Hungary (-27.44%). Returns of major fixed income indices were positive due to falling yields and rising prices. One-year US Treasury notes returned 0.18%, US government bonds 4.92%, world government bonds (1–5 years USD hedged) 1.90%, and US TIPS 3.64%. Real estate securities had a banner year: The Dow Jones US Select REIT Index returned 32.00%, and the S&P Global ex US REIT Index returned 10.94%. Commodities were negative for the fourth year in a row, with the Bloomberg Commodity Total Return Index returning -17.01%. Brent crude oil and gasoline futures were the worst performers in the index, posting -48.3% and -48.5% returns, respectively. Natural gas fell 31.7%. Gold was down for the second year in a row, falling 1.5%; silver prices were down 19.5%. Coffee was the top-performing commodity in the index at 50.5%.
6
2014 Investment Overview, cont. Diverging Returns
While US equity returns were high relative to those of other regional markets, returns within various US market segments diverged. Based on the respective Russell 1000 and 2000 indices, US large cap stocks significantly outperformed small cap stocks, and within the relative price dimension, large value slightly outperformed large growth. Among small cap stocks, growth outperformed value.
In the non-US developed markets (based on the MSCI indices in USD), all segments had negative performance. Negative returns among large and small caps stocks were similar, while large growth slightly outperformed large value. In the emerging markets, small cap, which had a slightly positive return, outperformed large cap, and growth outperformed value, although both returns were negative.
The mixed results of the size and relative price dimensions in 2014 were not unusual from a historical standpoint. Although small cap and value stocks have offered higher expected returns relative to their large cap and growth counterparts, these return premiums do not appear each year. For example, since 1979, US small caps have outperformed large caps in 19 of the 36 calendar years—or 52% of the time. Results are similar for the relative price dimension: Since 1979, value has outperformed growth in 20 calendar years—or 55% of the time. Small cap value has outperformed large cap growth in 58% of the calendar years.
History also has produced multi-year periods in which small caps and value did not outperform large caps and growth. Noteworthy periods include 1984 - 1987 and 1994 - 1998, when small caps underperformed large caps, often by a wide margin each year. Since 1979, the value premium has also experienced extended periods of underperformance—and, in some cases, the differential exceeded 15% margin. The same is true of small value vs. large growth stocks. In the three-year period from 2009 - 2011, both value and small caps underperformed. Yet, despite even extended negative-premium periods, small caps and value have outperformed over time, and when the premiums reversed, they often did so strongly and in multiple years.
Currency Impact The strength of the US dollar had a negative impact on returns for US investors with holdings in unhedged non-US assets. (As a general principal, investors gain when their home currency falls relative to the local currency of the foreign asset they own, but lose when a rise in their home currency reduces the value of the foreign investment in the local currency.)
For example, in 2014, the dollar’s rise relative to the euro hurt the returns of US investors in European markets. The MSCI Europe Index (net dividends) returned 6.84% in euros but -6.18% in US dollars. This was the case in regions where the dollar outperformed local currencies. Other examples: The MSCI UK Index returned 0.50% in pounds but -5.39% in USD. The MSCI Japan Index returned 9.83% in yen and -3.72% in USD. The Year Ahead We’re entering the year with a sense of cautious and opportunistic optimism. From our perspective, the past year proved challenging and supported the argument of how wrong conventional wisdom can be. We’ve reviewed our notes and can’t find a single strategist who foresaw the broad decline in interest rates or the precipitous drop in oil at the beginning of the year. The difficulty of making accurate forecasts has been proven over and over and yet pundits must do what pundits do. I suppose if life were predictable, it wouldn't be life. Interestingly, not a single expert in Barons’ recent 2015 Roundtable was bearish.
Over the past few years, domestic large-cap stocks have been helped by an improving economy fueled by friendly monetary policy, and they continue to lead this rally. However, markets are subject to mean reversion - simply put, what goes up usually comes down. Arguably, U.S. stocks are not as cheap as they once were. With a price-to-earnings ratio of 15.7 (compared to their long term average of 15.3), bargains in the domestic markets are becoming harder to find. By comparison, foreign markets look inexpensive, and as markets revert to the mean, foreign stocks may prove to be an important diversifier.
For the moment however, the diverging investment returns we highlighted above have created challenges for our diversified portfolios. It is not uncommon for lagging investment returns to make us call into question the concept of diversification. However, history has shown that moving large chunks of money around in an effort to time individual markets or asset classes is highly unlikely to add any value over time. In fact, avoiding this losing game is one of the very reasons to diversify in the first place.
It is easy to get caught up in short-term underperformance and focus on the headlines: “Dow and S&P Hit New Highs!” However, while the media makes money selling short-term trends and headlines, it is our job as advisors to remain focused on our clients’ long-term financial plans. There are five core lessons we've learned over the course of time that heavily influence our investment philosophy:
1. How wrong conventional wisdom can consistently be.
2. Uncertainty is always present.
3. Risk and return are always connected.
4. Discount current headlines and think long-term.
5. We can't change the way the wind blows but we can adjust our sails.
We continue to rely upon these experiences along with the old tenets in the construction of your portfolio, and we believe time will prove this approach
to be best. Thank you for allowing our team at Cravens and Company to work for you.
We wish you the best and prosperous 2015.
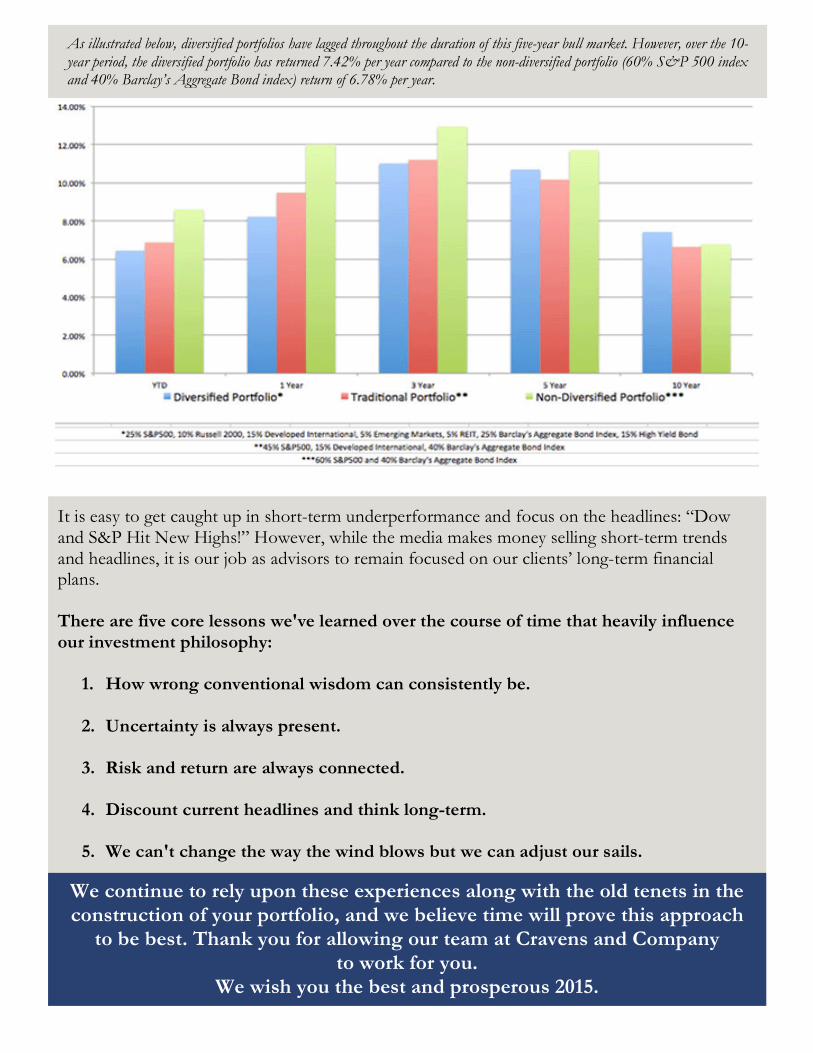
As illustrated below, diversified portfolios have lagged throughout the duration of this five-year bull market. However, over the 10-year period, the diversified portfolio has returned 7.42% per year compared to the non-diversified portfolio (60% S&P 500 index and 40% Barclay’s Aggregate Bond index) return of 6.78% per year.
8
Russell data © Russell Investment Group 1995–2015, all rights reserved. Dow Jones data provided by Dow Jones Indexes. MSCI data © MSCI 2015, all rights reserved. S&P data provided by Standard & Poor’s Index Services Group. The BofA Merrill Lynch Indices are used with permission; © 2015 Merrill Lynch, Pierce, Fenner & Smith Inc.; all rights reserved. Citigroup bond indices © 2015 by Citigroup. Barclays data provided by Barclays Bank PLC. Indices are not available for direct investment; their performance does not reflect the expenses associated with the management of an actual portfolio. Past performance is no guarantee of future results. This information is provided for educational purposes only and should not be considered investment advice or a solicitation to buy or sell securities. Investing risks include loss of principal and fluctuating value. Small cap securities are subject to greater volatility than those in other asset categories. International investing involves special risks such as currency fluctuation and political instability. Investing in emerging markets may accentuate these risks. Sector-specific investments can also increase these risks. Fixed income securities are subject to increased loss of principal during periods of rising interest rates. Fixed-income investments are subject to various other risks, including changes in credit quality, liquidity, prepayments, and other factors. REIT risks include changes in real estate values and property taxes, interest rates, cash flow of underlying real estate assets, supply and demand, and the management skill and creditworthiness of the issuer. Advisory services offered through Cravens & Company Advisors, LLC, a registered investment advisor. Securities and additional advisory services offered through FSC Securities Corporation, member FINRA/SIPC. Securities are not an obligation of nor guaranteed by Progressive Savings Bank or by any federal government agency, and are not FDIC insured, and involve risk including the loss of principal. Cravens & Company Advisors, LLC and Progressive Savings Bank are not affiliated with FSC Securities Corporation.
2015 Cravens & Company Advisors |1080 Interstate Drive, Cookeville, TN 38501
931-528-6865 | F 931-646-3619 | [email protected]