cracking the code - phoenixcg.com · • under performers decreased investment in sales and...
TRANSCRIPT
1
Copyright 2010 Phoenix Consulting Group All rights reserved.
Cracking the Code: 2010 Best Practices for Go-to-Market Alliances

2
Copyright 2010 Phoenix Consulting Group All rights reserved.
What were we seeking to learn?
We wanted to understand what drives performance in revenue producing or go-to-market alliances. What did successful alliances do differently than those who were less successful?
Given the severe economic conditions over the past 18 months, we wanted to know how did alliances react to the challenge. What course corrections were taken over the past year? What worked? What didn’t?
We also wanted to establish a base line of what were common practices and approaches to alliance management. How were joint offers created? How was value measured?
Methodology
The survey was conducted by CustomerImpact and Phoenix Consulting Group and launched in January of 2010.
The survey was sent to 1200 email contacts in the ASAP and PhoenixCG list base, targeting alliance managers in the IT and Communications industries.
104 alliance managers completed the survey.
Respondents were requested to answer based on a single go-to-market alliance, i.e., “a relationship where you partner in some manner to market and sell solutions to end-user customers (either in a sell-to, sell-through, or sell-with fashion). “
Results were initially presented to the Global IT Track of the 2010 ASAP Global Summit in Anaheim, CA.
Acknowledgement
The author would like to acknowledge Keith Gaylord, Partner Executive at IBM for his guidance and encouragement in supporting this research.
3
Copyright 2010 Phoenix Consulting Group All rights reserved.
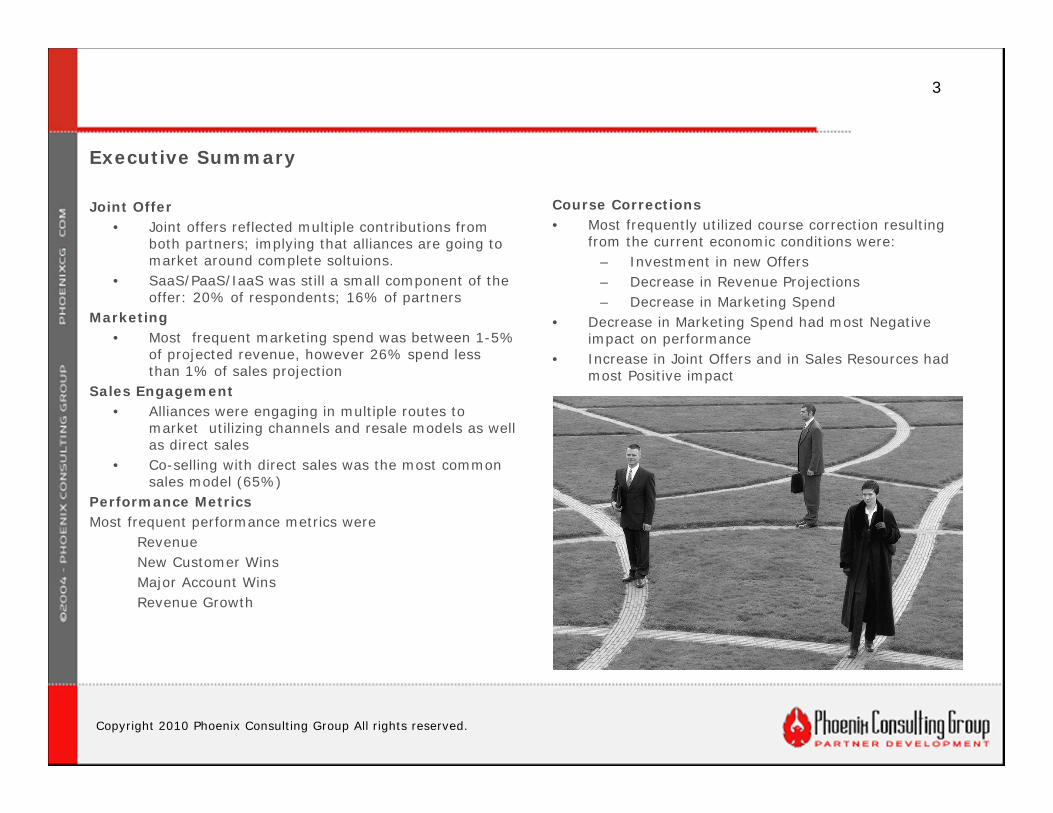
Executive Summary
Joint Offer• Joint offers reflected multiple contributions from
both partners; implying that alliances are going to market around complete soltuions.
• SaaS/PaaS/IaaS was still a small component of the offer: 20% of respondents; 16% of partners
Marketing• Most frequent marketing spend was between 1-5%
of projected revenue, however 26% spend less than 1% of sales projection
Sales Engagement• Alliances were engaging in multiple routes to
market utilizing channels and resale models as well as direct sales
• Co-selling with direct sales was the most common sales model (65%)
Performance MetricsMost frequent performance metrics were
RevenueNew Customer WinsMajor Account WinsRevenue Growth
Course Corrections• Most frequently utilized course correction resulting
from the current economic conditions were: – Investment in new Offers– Decrease in Revenue Projections– Decrease in Marketing Spend
• Decrease in Marketing Spend had most Negative impact on performance
• Increase in Joint Offers and in Sales Resources had most Positive impact
4
Copyright 2010 Phoenix Consulting Group All rights reserved.
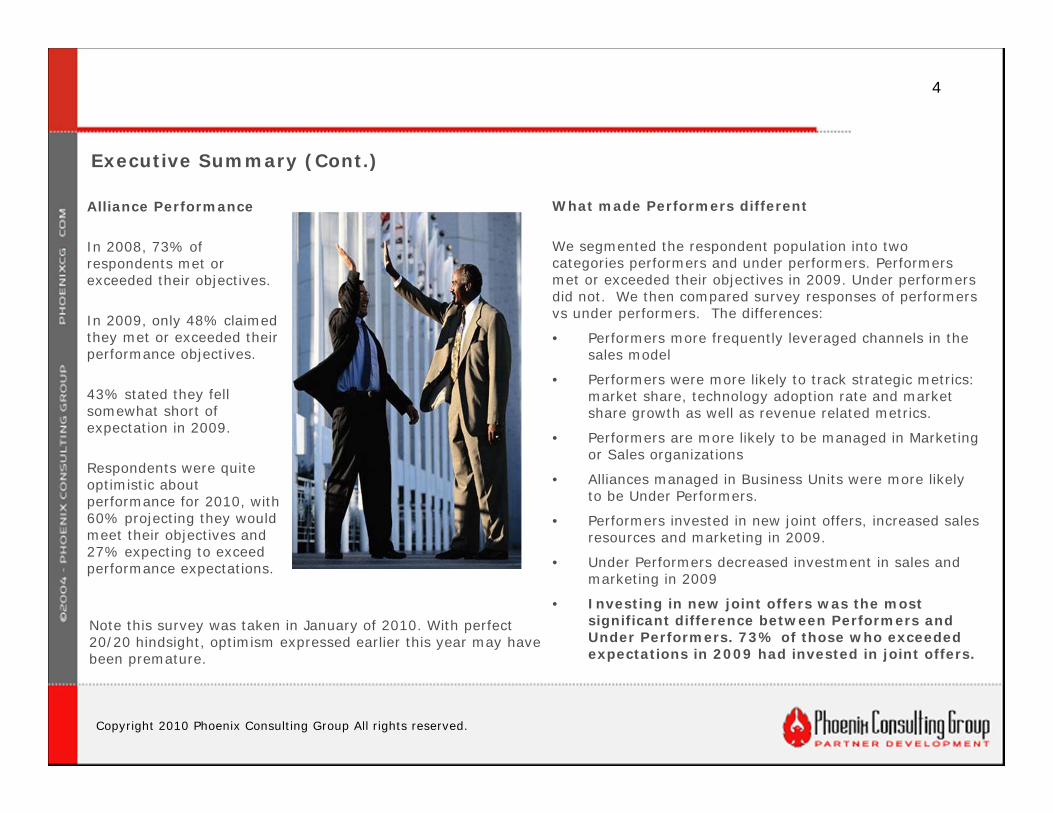
Alliance Performance
In 2008, 73% of respondents met or exceeded their objectives.
In 2009, only 48% claimed they met or exceeded their performance objectives.
43% stated they fell somewhat short of expectation in 2009.
Respondents were quite optimistic about performance for 2010, with 60% projecting they would meet their objectives and 27% expecting to exceed performance expectations.
What made Performers different
We segmented the respondent population into two categories performers and under performers. Performers met or exceeded their objectives in 2009. Under performers did not. We then compared survey responses of performers vs under performers. The differences:
• Performers more frequently leveraged channels in the sales model
• Performers were more likely to track strategic metrics: market share, technology adoption rate and market share growth as well as revenue related metrics.
• Performers are more likely to be managed in Marketing or Sales organizations
• Alliances managed in Business Units were more likely to be Under Performers.
• Performers invested in new joint offers, increased sales resources and marketing in 2009.
• Under Performers decreased investment in sales and marketing in 2009
• Investing in new joint offers was the most significant difference between Performers and Under Performers. 73% of those who exceeded expectations in 2009 had invested in joint offers.
Executive Summary (Cont.)
Note this survey was taken in January of 2010. With perfect 20/20 hindsight, optimism expressed earlier this year may have been premature.

5
Copyright 2010 Phoenix Consulting Group All rights reserved.
Cracking the Code: 2010 Best Practices for Go-to-Market Alliances
Copyright 2010 Phoenix Consulting Group All rights reserved.
PartnerDemographicsPartner Size by Revenue
Large and very large organizations dominate the survey populations. This is not unexpected given the consolidation occuring in the IT industry. IBM, Cisco, Xerox, and Symantec had the most alliance managers responding. These companies have large numbers of alliance managers, while the smaller entrepreneurial companies typically have only a few who are managing multiple partnerships.
While we did do some comparisons between the small partner responses and the large, we did not find any significant differences. Given the low numbers of entrepreneurial and small partners in the study, we did not feel this to be conclusive.
What is the size of your partner’s company?
Partners are somewhat more mixed in sizeSmall businesses those in the $5-$100 million range represent 11% of the partners in the survey.
Medium size businesses represent 16% of the partners.
What is the size of your company?
Very Large Companies Dominate the SurveyRespondents representing companies larger than $1B revenue account for 86% of the responses.
Respondents representing small entrepreneural companies under $5 million in revenue account only for 5% of the population.

6
Copyright 2010 Phoenix Consulting Group All rights reserved.
Cracking the Code: 2010 Best Practices for Go-to-Market Alliances
PartnerDemographicsWhere should Partners Report?
This has been a long standing debate in the technolgoy industry. There are tradeoffs for any reporting model. As we can see from the responses the largerst share (32%) do report into sales organizations.
The better approach to determining the reporting organization may be align the strategic intent of the alliance to skills sets required to achieve those results. This can be problematic when dealing with alliances span the entire value chain or multiple components of it. The skills of the alliance manager need to include managing across multiple functional organizations.
How old is this partner relationship?
Mature alliances are prevalent in the populationOnly 25% of the alliances are in the formative stages in the first 2 years.
Over half, 54% of the alliances represented are over 5 years old.
Where does partner management report organizationally?
Most frequently managed in Sales, Business Units, MarketingGTM Alliances are managed most frequently from a within a sales organization at 32%
Business units follow at 23% and Marketing at 18%

7
Copyright 2010 Phoenix Consulting Group All rights reserved.
Cracking the Code: 2010 Best Practices for Go-to-Market Alliances
Contributions to Joint Offer
Joint offers or complete solutions?
Companies are combining multiple products and services into their joint offers, implying that the trend among these large IT organizations is go to market aroung complete solutions.
Surprisingly the SAAS/XAAS solutions only comprise 20% of the respondents offer and even less in their partner’s contribution.
We would expect this to trend upward as cloud computing gains greater adoption.
What is the nature of your company/partner’s (gold bar) contribution to your partnering joint offer?Respondents were able to select all that apply reflecting the multiple lines of business of large technology organizations.Hardware and services were the most frequent contributions among the survey respondents.
Partners were more likely to be contributing services and software
Surprising SaaS/PaaS/etc is still a small component of the pratnering offer,

8
Copyright 2010 Phoenix Consulting Group All rights reserved.
Cracking the Code: 2010 Best Practices for Go-to-Market Alliances
Marketing ResourcesResource sharing prevailsMany of the alliances in this study have dedicated marketing resources, but clearly shared resources prevail.
Whether shared or dedicated, partner marketing needs to be aligned in the same way that partner managers seek alignment between the corporate objectives of both companies.
Messaging and branding of both companies need to be blended in the marketing materials and promotion sto strengthen the position of both partners with the joint customers.
This effort requires considerable collaboration and creativity from the marketing staff.
Which best describes your marketing resources assigned to the alliance?The majority of respondents rely on shared resources (52%) to execute on marketing intitiatives.
Only 33% have dedicated resources assigned to the partner marketing function.
Which best describes your partner’s marketing resources assigned to the alliance?Partners are even more stretched for partner marketing; 24% depending on ad hoc resources.
Since partners were somewhat smaller organizations than the respondents,this would be consident with having fewer resources to dedicate or share.

9
Copyright 2010 Phoenix Consulting Group All rights reserved.
Cracking the Code: 2010 Best Practices for Go-to-Market Alliances
Source of Marketing Funding
Diversity in source of marketing funding
Marketing funding came from diverse sources, with dedicated budget and MDF being the major sources.
We compared sources of funding with where alliances were managed organizationally and found that sales organizations were more likely to allocate funding based on ROI (35%).
Business Units were more likely to have dedicated budgets (48%) and least likely to allocate on ROI (13%).
We recommend that ROI analysis should be applied to all marketing funding whether dedicated budget, MDF or other.
Which best describes your source of marketing funding?
Largest source of funding is through a dedicated budgetFunding based on ROI analysis was reported by 23% of the respondents.
Which best describes your partner’s source of marketing funding?
More reliance on expense reimbursement vs respondentsPartners rely on expense reimbursement as source of marketing funding over twice as much as the respondents.

10
Copyright 2010 Phoenix Consulting Group All rights reserved.
Cracking the Code: 2010 Best Practices for Go-to-Market Alliances
Marketing SpendInvestment in Marketing Activities
The sweet spot for marketing spend was between 1-5% of projected revenue sales and a significant number spent less. We found very little difference between the marketing spend rates between performers vs underperformers. If anything there was a slight bias of ‘overspending’ in the 12%+ range among underperformers.
Curiously when we looked at how the spend was shared, 20% of respondents stated that their share of the marketing spend was only 10%, presumably leaving their partner to do most of the marketing.
What percentage of projected sales is spent on marketing activities?
Most Alliances spend between 1-5% of projected sales (42%)Significant number (26%)spend lessthan 1%
What is your company’s investment in the alliance’s total marketing spend?
50/50 is most common cost share, but significant number share less20% of respondents stated that theirshare of marketing spend was 10%

11
Copyright 2010 Phoenix Consulting Group All rights reserved.
Cracking the Code: 2010 Best Practices for Go-to-Market Alliances
Budget Allocation
Corresponds to Source of LeadsWe found in general very close correlation to where budget was allocated and where leads were generated.
Events in general seem to the top source of leads for most alliances with targeted events leading the pack.
Internal marketing is often an overlooked activity. Given the large company nature of the population, communicating the partner opportuntiy internal to these organizations and especially to the field force is an important activity and a significant source of leads.
What percentage of your partner marketing budget is allocated to the following activities?
What percentage of your total leads do you attribute to each activity?
Budget allocation and source of leads are closely correlated.46% of the respondents indicated that Targeted events were in their top three marketing budget allocations.
48% of the respondents mentioned Targeted events in the three source of leads.

12
Copyright 2010 Phoenix Consulting Group All rights reserved.
Cracking the Code: 2010 Best Practices for Go-to-Market Alliances
Collaboration ToolsTools with business focus prevail
Alliance managers are clearly using made for business collaboration tools and social media.
Curiously, in the write in text box over 26% of respondents entered email.
Clearly email is still the major means of communications within alliance teams.
A more in depth anaylsis of Social Media and Partnering is available on the PhoneixCG website: www.phoenixcg.com in the Resource Center.
What collaboration tools do you use to manage or to communicate with your partner(s)?
LinkedIn and Collaboration platforms are most frequently used to manage and communicate.The most popular social media (facebook, my space, and twitter have minimal presence in alliance management.
In the category of ‘Other’, the most frequent write in as email which represented 26% of total responses.

13
Copyright 2010 Phoenix Consulting Group All rights reserved.
Cracking the Code: 2010 Best Practices for Go-to-Market Alliances
Sales Engagement
Collaborating across the spectrum of sales activities
Alliance teams are engaging consistently through out the sales process.
Although an informal poll at a recent collaborative selling workshop revealed that very little of this activity is supported by automated tools.
Alliance organizations are typically relying on spreadsheets and email to coordinate these high-value and critical functions.
Which sales engagement activities do you engage in with your partner?
Alliance teams are highly engaged in sales activities
Joint account targeting (80%) leads in sales activities in which alliance teams engage, followed by joint training (78%) and joint sales calls (77%).

14
Copyright 2010 Phoenix Consulting Group All rights reserved.
Cracking the Code: 2010 Best Practices for Go-to-Market Alliances
Sales Profile
Multiple Routes to Market are common
What is the sales cycle of the joint value proposition?
Sales Cycles are most often in the 6-12 mos rangeSales cycles of partners and their joint offers are fairly consistent.
What is your sales model of your joint offer?
Alliances are utilizingmultiple routes to market.Co-selling with direct sales teams is the favored route to market for 65% of the respondents surveyed.
Channel and resale models are also part of the mix.While collaborative selling through
direct sales teams is the major sales model, it is clear that alliances are utilizing more than a single route to market.
Channels are an important element in reaching customers but introduce their own challenges in increased conflict and complexity.
Clear rules of engagement and open communications are more important than ever in managing these complex sales models.

15
Copyright 2010 Phoenix Consulting Group All rights reserved.
Cracking the Code: 2010 Best Practices for Go-to-Market Alliances
Scope of Engagement
Global Alliances for a Global Economy
Not surprisingly given the large number of respondents from companies of greater than $5 Billion revenue, the alliances represented are global in nature and scope.
Consistent with this population, sales engagement is also managed with shared responsibility at both global and regional levels.
This is especially important since many of the customers are also global and expect consistent relationships with among the collaborating vendors.
What is the scope of your marketing reach for this partnership?
Alliances in this survey are managed on a global scope (81%).Less than 20% of the population is managing alliances at a regional or domestic level.
At what level do you define and manage rules of engagement?
Sales Engagement is managed through global and regional policies Rules of engagement is a shared responsibility largely vested at the global and regional level.
19% of respondents are still managing rules of engagement on an ad hoc basis.

16
Copyright 2010 Phoenix Consulting Group All rights reserved.
Cracking the Code: 2010 Best Practices for Go-to-Market Alliances
IncentivesMotivating Behaviors
Revenue neutral incentives are the goal of most alliance programs, though experience shows this is very difficult to achieve, especially with joint offers which are composed of many elements: hardware, software, services, etc.
A revenue bias is sometimes introduced to incent sales organizations to work with each other. In our experience these can work short term in modifying behavior but over the longer term can actually have a negative result.
Alliance managers have diverse compensation plans. Sometimes with a revenue component, sometimes not, but most frequently a mix.
How are sales incentives structured for joint offering sales?
Revenue neutral incentive models predominate. 76% of respondents reporting that revenue neural sales incentives are in place for their joint sales offer.
How are you compensated for alliance performance?
Mixed incentives for both revenue and non-revenue metrics are part of alliance manager compensation.
A more comprehensive study of alliance manager compensation is available from the Association of Strategic Alliance Professionals. This study also delves into what metrics drive variable pay.

17
Copyright 2010 Phoenix Consulting Group All rights reserved.
Cracking the Code: 2010 Best Practices for Go-to-Market Alliances
Performance MetricsRevenue Metrics Predominate
The top four metrics used to measure performance are aspects of revenue.
Other more strategic measures do not appear with the same frequency.
Best practices prescribes a balance scorecard approach which would include measuring the accomplishment of the strategic intent of the alliances as well as financial performnce.
Effectiveness measures were also asked in this survey and represent tactical or operational performance.
With respect to your selected partner, what metrics are used to measure alliance performance? Revenue is almost ubiquitous in measuring alliance performance at 87%
Other revenue oriented metrics follow: new customer wins, major account wins, and revenue growth.
There is steep drop off after the top four most frequently measured revenue metrics.

18
Copyright 2010 Phoenix Consulting Group All rights reserved.
Cracking the Code: 2010 Best Practices for Go-to-Market Alliances
Revenue Tracking
Alliance offers are sold through multiple modesAlliance teams are measuring multiple revenue streams.
Influence revenue is a significant component of the alliance value and yet is difficult to track unambiguously.
Nearly half the respondents track influence through direct sales though this is notoriously unreliable as most direct sales do not benefit from acknowledging partner involvment.
Deal registries are often questioned because they are partner driven or the registered opportunities overlap with those in the direct pipeline.
Joint pipeline tracking is probably the most accurate but the most widely used tool to track these are still spreadsheets.
What revenue streams do you track with respect to your selected partner?
Multiple revenue streams are trackedDirect sales and Influence revenue are both tracked by 60% of respondents.
Channel and partner resale are also tracked as part of the go-to-market mix.
If you track influence revenue, what method do you use to track?
Influence Sales is reported most frequently through Direct SalesInfluence is tracked through direct sales reports by nearly 50% of respondents.
35% of respondents track influence revenue through deal registries.

19
Copyright 2010 Phoenix Consulting Group All rights reserved.
Cracking the Code: 2010 Best Practices for Go-to-Market Alliances
Effectiveness MetricsTracking leading indicatorsEffectiveness metrics are leadinging indicators that enable alliance managers to optimize performance proactively.
For revenue alliances, it is important to manage the entire revenue production process..
Yet, only 66% of respondents track joint pipeline and other activities in the sales process are tracked by less than 50% of the respondents.
We recognize that there is a dearth of appropriate tools and systems, despite the marketing claims of SFA and PRM vendors. Much of these efforts that are tracked are done manually by emailing spreadsheets back and forth.
Which metrics do you track to measure marketing effectiveness? Select all that apply.
Lead Gen is the most frequently tracked marketing metric81% of respondents tracked leads as a meaure of marketing effectiveness
Event registrations at 54% and Request for Sales follwup at 43%were the next most selected metrics.
Which metrics do you track to measure sales effectiveness? Select all that apply.
Pipeline is the most frequently tracked sales metricJoint pipeline was tracked by 66% of resondents.
Less than 50% of respondents tracked other effectiveness measures: sales calls, joint proposals, lead follow up, etc.

20
Copyright 2010 Phoenix Consulting Group All rights reserved.
Cracking the Code: 2010 Best Practices for Go-to-Market Alliances
Response to the EconomyInvestments had the most positive impactAlliance managers have been proactive in response to the current economy. 53% made investments in new joint offers 33% changed their underlying go-to-market model.
Some of these course corrections have had more impact than others. Decrease in marketing and sales have had the most negative impact on alliance performance.
Investment in new joint offers and increasing sales resources have had the highest positive impact.
When we compare course corrections implemented by performers vs underperformers we will see that these assessments bear out.
What course corrections have you made in your alliance during the past year?
New joint offers (53%) was the most common response.Decrease in revenue projections and in marketing follow as the next most common response.
21% of respondents realigned to government stimulus spending.
Please indicate the impact of course corrections on alliance performance.
Investments were indicated to have most positive impact.Increase in sales investments were indicated to have positive effects by 86% of those that made this course correction.
Other course corrections with high positive impact were New offers (85%) and New targets (82%).
Descreasing marketing (54%) and descreasing revenue projections (49%) had the most negative impact.

21
Copyright 2010 Phoenix Consulting Group All rights reserved.
ALLIANCE PERFORMANCE

22
Copyright 2010 Phoenix Consulting Group All rights reserved.
Cracking the Code: 2010 Best Practices for Go-to-Market Alliances
Alliance PerformanceAproximately 50% of alliances fell short of expectations in 2009
We segmented the respondents based on whether they met or fell short of their performance goals.
This survey was conducted in January and the predictions for future performance was optimistic but given the advantage of perfect hindsight, perhaps premature given the persistence of the current recession.
However, we believe the differences between the actions and practices between performers and underperformers as descibed going forward continues to be valid and gives sound direction for alliance managers.
How would you rate overall alliance performance during the past year (2009)? Prior year (2008)? Next year (2010)?
In 2009 half of the respondents met or exceeded their performance goals.Contrast that to 73% in 2008 who met or exceed performance goals.
In January when this survey was conducted, there was a pervasive optimism in that 87% of respondents predicted they would meet or exceed their goals in 2010.
<75% 76-90% 91-110% 110%-130 >131%
23
Copyright 2010 Phoenix Consulting Group All rights reserved.
Cracking the Code: 2010 Best Practices for Go-to-Market Alliances
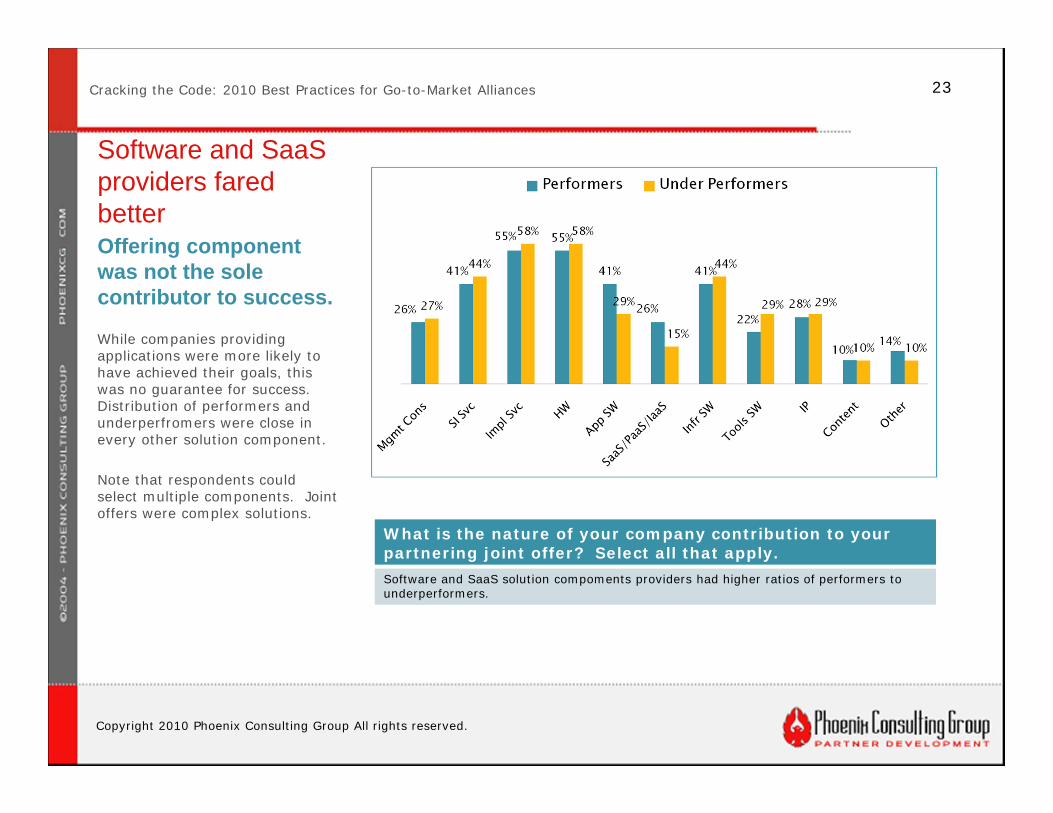
Software and SaaS providers fared betterOffering component was not the sole contributor to success.
While companies providing applications were more likely to have achieved their goals, this was no guarantee for success. Distribution of performers and underperfromers were close in every other solution component.
Note that respondents could select multiple components. Joint offers were complex solutions.
What is the nature of your company contribution to your partnering joint offer? Select all that apply.Software and SaaS solution compoments providers had higher ratios of performers to underperformers.

24
Copyright 2010 Phoenix Consulting Group All rights reserved.
Cracking the Code: 2010 Best Practices for Go-to-Market Alliances
Performers leveraged channels
Channels show more resillience
Channels being the broad net for product distribution have more capacity to reach markets and customers who are still buying, particularly in the SMB market.
Favorable channel economics are also a factor in more efficent go-to-market models.
What is your sales model of your joint offer? Select all that apply.
Performers leveraged channels somewhat more than the underperformers.
25
Copyright 2010 Phoenix Consulting Group All rights reserved.
Cracking the Code: 2010 Best Practices for Go-to-Market Alliances
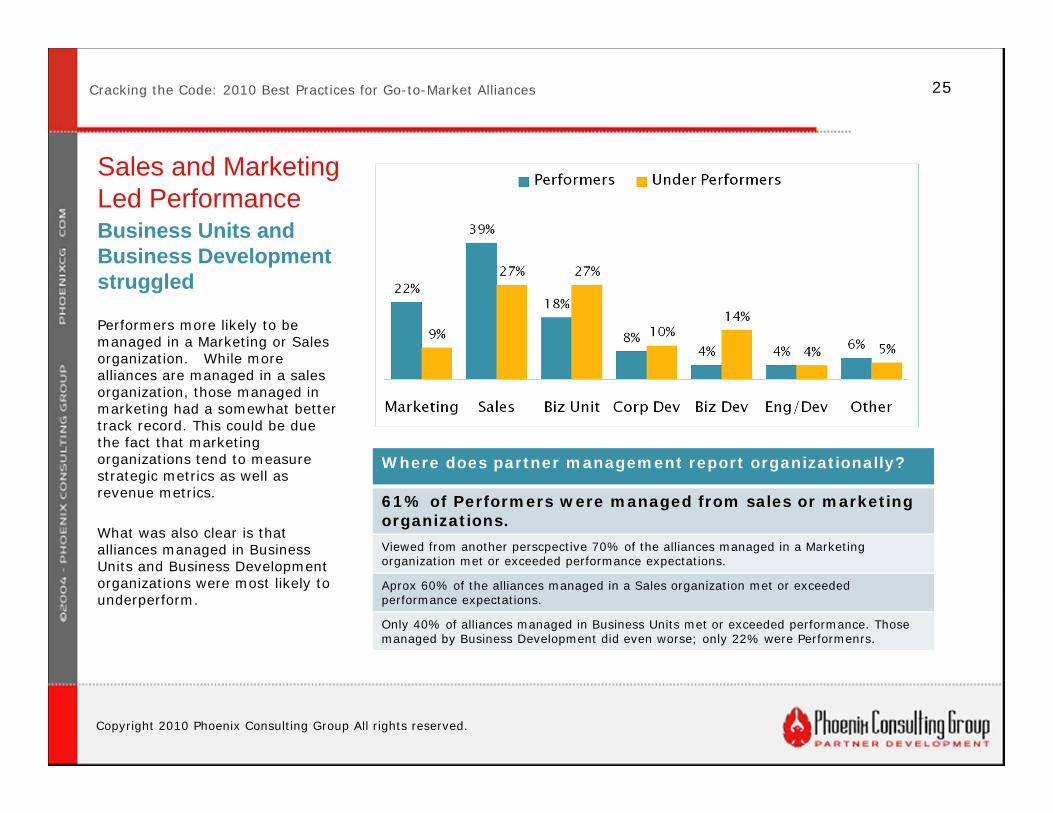
Sales and Marketing Led PerformanceBusiness Units and Business Development struggled
Performers more likely to be managed in a Marketing or Sales organization. While more alliances are managed in a sales organization, those managed in marketing had a somewhat better track record. This could be due the fact that marketing organizations tend to measure strategic metrics as well as revenue metrics.
What was also clear is that alliances managed in Business Units and Business Development organizations were most likely to underperform.
Where does partner management report organizationally?
61% of Performers were managed from sales or marketing organizations. Viewed from another perscpective 70% of the alliances managed in a Marketing organization met or exceeded performance expectations.
Aprox 60% of the alliances managed in a Sales organization met or exceeded performance expectations.
Only 40% of alliances managed in Business Units met or exceeded performance. Those managed by Business Development did even worse; only 22% were Performenrs.

26
Copyright 2010 Phoenix Consulting Group All rights reserved.
Cracking the Code: 2010 Best Practices for Go-to-Market Alliances
Performers measured strategic outcomesManaging for the Long Term
Managing revenue production was not a differentiator between performers and under performers. Both groups measured the top four revenue metrics and with the same frequency.
But, performers also measured strategic performance in Market Share and Market Share Growth and Technology Adoption.
It is a best practice to measure performance in multiple dimensions. The balanced score card is a common and effective model to measure both financial and strategic outcomes as well as operational and relationship factors as leading indicators.
With respect to your selected partner, what metrics are used to measure alliance performance ? Select all that apply.
Performers and Under Performers measured the same revenue metrics and to the same degree.Performers measured Market Share 26% more often than Under Performers and Market share growth 10% more frequently.
Performers were also more likely to mesure New technology adoption rate 18% more frequently than Under Performers
Performance Metric Under Performers Performers DifferenceMarket Share 14% 39% 26% !New Tech Adoption 19% 37% 18% !Market Share Growth Rate 12% 22% 10% !Revenue Growth Rate 52% 53% 1%
New Customer Wins 71% 73% 1%
Geographic Penetration 31% 31% 1%
Vertical Market Penetration 25% 26% 1%
Competitive Position 27% 28% 1%
Revenue 87% 86% 0%
Major Account Wins 65% 63% ‐3%

27
Copyright 2010 Phoenix Consulting Group All rights reserved.
Cracking the Code: 2010 Best Practices for Go-to-Market Alliances
Differentiating Performers vs Under PerformersPerformers made investments
What is clear by segmenting 2009 performers and underperformers by the couse corrections they chose, is that performers made investments.
Instead of decreasing marketing expenditures and decreasing revenue projections, they invested in new joint offers, increased marketing, invested in sales and increased their revenue projections.
If past recessions are any teachers, we know that market leaders of the old economy are not necessarily the leaders of the upswing. Performers seem to be proactive in making key bets to emerge stronger.
What course corrections have you made in your alliance during the past year? Select all that apply.
Clearly performers invested in new joint offers.
A closer look at the data revealed that 73% of the respondents who ‘exceeded’ their objectives invested in new joint offers.
18% more of the performers invested in marketing. 14% more aligned new offers to government stimulus.
25% of the performers increased their revenue projections.

28
Copyright 2010 Phoenix Consulting Group All rights reserved.
Partners in Best Practices
We specialize in best practice partner strategies, programs, and marketing. We help companies transform their partnering practices to drive corporate growth and build shareholder value.
Companies we have served:
Norma Watenpaugh, [email protected]

29
Copyright 2010 Phoenix Consulting Group All rights reserved.29
Partner & Customer Intelligence
Our Partner Success Program delivers:• Professionally created surveys that gather partner and customer
feedback • Interactive dashboards that monitor the performance of your
partnerships, pinpoint problem areas, and highlight best practices that help you achieve corporate goals
• Verbatim intelligence through sophisticated text analysis that categorizes comments by theme and sentiment
Monica David, VP North [email protected]