cr5000 measurement and control system · 2012-01-23 · cr5000 overview ov-2 ground lug cs i/o...
TRANSCRIPT

CR5000 Measurement and Control System
Revision: 11/06
C o p y r i g h t © 2 0 0 0 - 2 0 0 6C a m p b e l l S c i e n t i f i c , I n c .

Warranty and Assistance The CR5000 MEASUREMENT AND CONTROL SYSTEM is warranted by CAMPBELL SCIENTIFIC, INC. to be free from defects in materials and workmanship under normal use and service for thirty-six (36) months from date of shipment unless specified otherwise. Batteries have no warranty. CAMPBELL SCIENTIFIC, INC.'s obligation under this warranty is limited to repairing or replacing (at CAMPBELL SCIENTIFIC, INC.'s option) defective products. The customer shall assume all costs of removing, reinstalling, and shipping defective products to CAMPBELL SCIENTIFIC, INC. CAMPBELL SCIENTIFIC, INC. will return such products by surface carrier prepaid. This warranty shall not apply to any CAMPBELL SCIENTIFIC, INC. products which have been subjected to modification, misuse, neglect, accidents of nature, or shipping damage. This warranty is in lieu of all other warranties, expressed or implied, including warranties of merchantability or fitness for a particular purpose. CAMPBELL SCIENTIFIC, INC. is not liable for special, indirect, incidental, or consequential damages.
Products may not be returned without prior authorization. The following contact information is for US and International customers residing in countries served by Campbell Scientific, Inc. directly. Affiliate companies handle repairs for customers within their territories. Please visit www.campbellsci.com to determine which Campbell Scientific company serves your country. To obtain a Returned Materials Authorization (RMA), contact CAMPBELL SCIENTIFIC, INC., phone (435) 753-2342. After an applications engineer determines the nature of the problem, an RMA number will be issued. Please write this number clearly on the outside of the shipping container. CAMPBELL SCIENTIFIC's shipping address is:
CAMPBELL SCIENTIFIC, INC. RMA#_____ 815 West 1800 North Logan, Utah 84321-1784
CAMPBELL SCIENTIFIC, INC. does not accept collect calls.

i
CR5000 MEASUREMENT AND CONTROL SYSTEM TABLE OF CONTENTS
PDF viewers note: These page numbers refer to the printed version of this document. Use the Adobe Acrobat® bookmarks tab for links to specific sections.
PAGE OV1. PHYSICAL DESCRIPTION OV1.1 Measurement Inputs ........................................................................................................... OV-1 OV1.2 Communication and Data Storage...................................................................................... OV-4 OV1.3 Power Supply and AC Adapter ........................................................................................... OV-5
OV2. MEMORY AND PROGRAMMING CONCEPTS OV2.1 Memory ............................................................................................................................... OV-5 OV2.2 Measurements, Processing, Data Storage......................................................................... OV-5 OV2.3 Data Tables......................................................................................................................... OV-6
OV3. PC9000 APPLICATION SOFTWARE OV3.1 Hardware and Software Requirements .............................................................................. OV-6 OV3.2 PC9000 Installation............................................................................................................. OV-6 OV3.3 PC9000 Software Overview................................................................................................ OV-7
OV4. KEYBOARD DISPLAY OV4.1 Data Display...................................................................................................................... OV-12 OV4.2 Run/Stop Program ............................................................................................................ OV-16 OV4.3 File Display........................................................................................................................ OV-17 OV4.4 Configure Display.............................................................................................................. OV-19
OV5. SPECIFICATIONS.......................................................................................................... OV-20
1. INSTALLATION AND MAINTENANCE 1.1 Protection from the Environment ........................................................................................... 1-1 1.2 Power Requirements ............................................................................................................. 1-1 1.3 CR5000 Power Supplies........................................................................................................ 1-2 1.4 Solar Panels........................................................................................................................... 1-4 1.5 Direct Battery Connection to the CR5000 Wiring Panel ........................................................ 1-4 1.6 Vehicle Power Supply Connections....................................................................................... 1-4 1.7 CR5000 Grounding ................................................................................................................ 1-6 1.8 Powering Sensors and Peripherals ....................................................................................... 1-9 1.9 Controlling Power to Sensors and Peripherals.................................................................... 1-10 1.10 Maintenance ........................................................................................................................ 1-12
2. DATA STORAGE AND RETRIEVAL 2.1 Data Storage in CR5000........................................................................................................ 2-1 2.2 Internal Data Format .............................................................................................................. 2-2 2.3 Data Collection....................................................................................................................... 2-3 2.4 Data Format on Computer ................................................................................................... 2-10
CR5000 TABLE OF CONTENTS
ii
3. CR5000 MEASUREMENT DETAILS 3.1 Analog Voltage Measurement Sequence .............................................................................. 3-1 3.2 Single Ended and Differential Voltage Measurements .......................................................... 3-4 3.3 Signal Settling Time ............................................................................................................... 3-5 3.4 Thermocouple Measurements ............................................................................................... 3-7 3.5 Bridge Resistance Measurements....................................................................................... 3-17 3.6 Measurements Requiring AC Excitation .............................................................................. 3-19 3.7 Pulse Count Measurements................................................................................................. 3-20 3.8 Self Calibration..................................................................................................................... 3-21
4. CRBASIC - NATIVE LANGUAGE PROGRAMMING 4.1 Format Introduction................................................................................................................ 4-1 4.2 Programming Sequence ........................................................................................................ 4-2 4.3 Example Program .................................................................................................................. 4-4 4.4 Numerical Entries................................................................................................................... 4-7 4.5 Logical Expression Evaluation............................................................................................... 4-7 4.6 Flags ...................................................................................................................................... 4-8 4.7 Parameter Types ................................................................................................................... 4-9 4.8 Program Access to Data Tables .......................................................................................... 4-10
5. PROGRAM DECLARATIONS ........................................................................................... 5-1
6. DATA TABLE DECLARATIONS AND OUTPUT PROCESSING INSTRUCTIONS 6.1 Data Table Declaration .......................................................................................................... 6-1 6.2 Trigger Modifiers .................................................................................................................... 6-2 6.3 Export Data Instructions......................................................................................................... 6-8 6.4 Output Processing Instructions............................................................................................ 6-11
7. MEASUREMENT INSTRUCTIONS 7.1 Voltage Measurements .......................................................................................................... 7-3 7.2 Thermocouple Measurements ............................................................................................... 7-3 7.3 Half Bridges............................................................................................................................ 7-5 7.4 Full Bridges ............................................................................................................................ 7-8 7.5 Current Excitation ................................................................................................................ 7-11 7.6 Excitation/Continuous Analog Output .................................................................................. 7-13 7.7 Self Measurements .............................................................................................................. 7-15 7.8 Digital I/O ............................................................................................................................. 7-19 7.9 Peripheral Devices............................................................................................................... 7-29
8. PROCESSING AND MATH INSTRUCTIONS............................................................... 8-1
9. PROGRAM CONTROL INSTRUCTIONS....................................................................... 9-1
APPENDIX
A. CR5000 STATUS TABLE.................................................................................................... A-1
INDEX ......................................................................................................................................... INDEX-1

OV-1
CR5000 Overview The CR5000 provides precision measurement capabilities in a rugged, battery-operated package. The system makes measurements at a rate of up to 5,000 samples/second with 16-bit resolution. The CR5000 includes CPU, keyboard display, power supply, and analog and digital inputs and outputs. The on-board, BASIC-like programming language includes data processing and analysis routines. PC9000 Software provides program generation and editing, data retrieval, and realtime monitoring.
CAUTIONDC ONLY
SN:
Logan, Utah
MADE IN USA
CR5000 MICROLOGGER
H L1
DIFF
1 2
H L2
3 4
H L3
5 6
H L4
7 8
H L5
9 10
H L6
11 12
H L7
13 14
H L8
15 16
H L9
17 18
H L10
CS
I/O
(OP
TIC
ALL
Y IS
OLA
TE
D)
RS
-232
CO
MP
UT
ER
19 20
SE
H L11
DIFF
21 22
H L12
23 24
H L13
25 26
H L14
27 28
H L15
29 30
H L16
31 32
H L17
33 34
H L18
35 36
CONTROL I/O
CONTROL I/O POWERUP GROUND
LUGpc cardstatus
G
G 12V
12V
Hm
A B C D E F
J K LG H I
M N O
T U VP R S
W X Y
* / )- + (
< = >
Spc Cap
$ Q Z
, ' _
1 2PgUp
ENTER
BKSPC
SHIFT
ESC
PgDnEnd
Del Ins
Graph/char
3
4 5 6
7 8 9
0
CURSORALPHA
POWER IN11 - 16 VDC
H L19
37 38
H L20
39 40SE
VX
1
VX
2
VX
3
VX
4
CA
O1
CA
O2
IX1
IX2
IX3
IX4
IXR
P1
P1
C1
C2
C3
C4
G C6
C5
C7
C8
G G>2.
0V
<0.
8V
5V5V G SD
I-12
12V
G SD
M-C
2
SD
M-C
3
SD
M-C
1
G 12V
G SW
-12
SW
-12
G
POWER OUT
FIGURE OV1-1. CR5000 Measurement and Control System
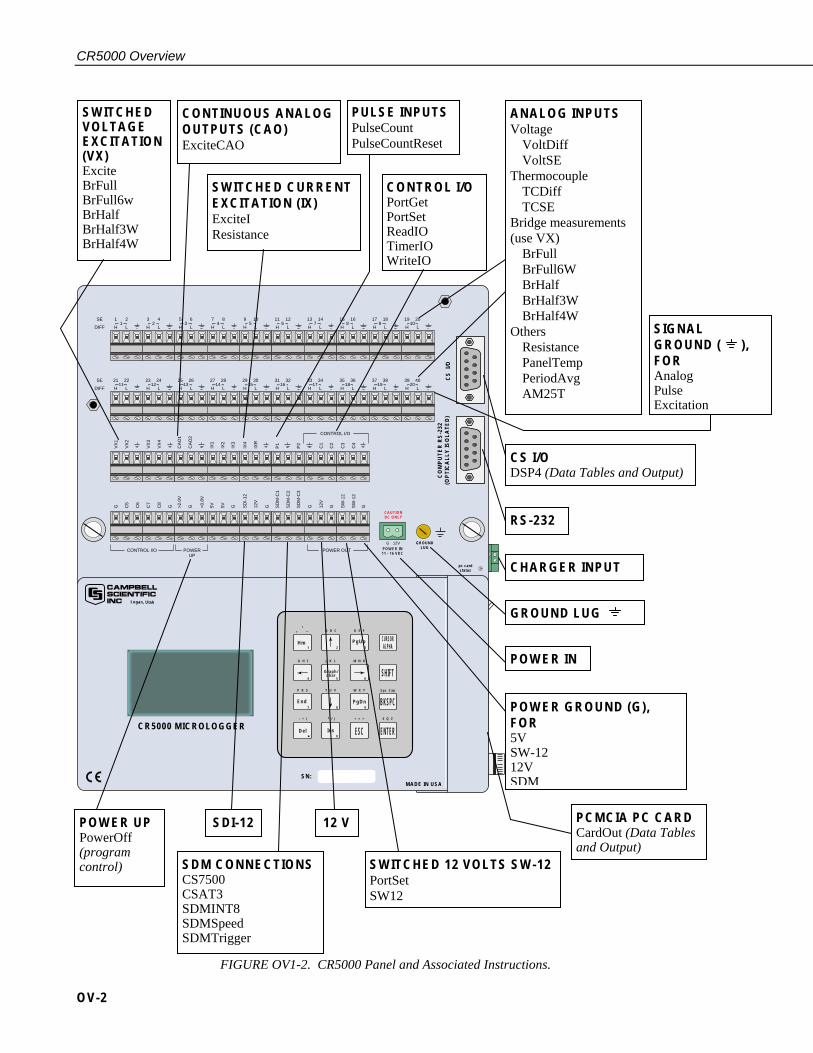
OV1. Physical Description Figure OV1-2 shows the CR5000 panel and the associated program instructions. Unless otherwise noted, they are measurement instructions (Section 7).
OV1.1 Measurement Inputs
OV1.1.1 Analog Inputs
There are 20 differential or 40 single-ended inputs for measuring voltages up to ±5 V. A thermistor installed in the wiring panel can be used to measure the reference temperature for thermocouple measurements, and a heavy copper grounding bar and connectors combine with the case design to reduce temperature gradients for accurate thermocouple measurements. Resolution on the most sensitive range is 0.67 µV
CR5000 Overview
OV-2
GROUNDLUG
CS
I/O
CO
MP
UT
ER
RS
-232
(OP
TIC
AL
LY
ISO
LA
TE
D)
G 12V
H L
1 21
H L
3 42
H L
5 63
H L
7 84
H L
9 105
H L
11 126
H L
13 147
H L
15 168
H L
17 189
H L
19 2010
DIFF
SE
H L
21
VX
1
VX
2
VX
3
VX
4
CA
O1
CA
O2
IX1
IX2
IX3
IX4
IXR
P1
P2
C1
C2
C3
C4
2211
G C5
C6
C7
C8
G >2.
0V
G >0.
8V
5V 5V G SD
I-12
12V
G SD
M-C
1
SD
M-C
2
SD
M-C
3
G 12V
G SW
-12
SW
-12
G
H L
23 2412
H L
25 2613
H L
27 2814
H L
29 3015
H L
31 3216
H L
33 34
CONTROL I/O
CONTROL I/O POWERUP
17H L
35 3618
H L
37 3819
H L
39 4020
DIFF
SE
POWER OUT
Hm
A B C D E F
J K LG H I M N O
T U VP R S W X Y
* / )- + ( < = >
Spc Cap
$ Q Z
, ' _
1 2
PgUp
ENTER
BKSPC
SHIFT
ESC
PgDnEnd
Del Ins
Graph/char
3
4 5 6
7 8 9
0
CURSORALPHA
SN:
Logan, Utah
MADE IN USA
CR5000 MICROLOGGER
CAUTIONDC ONLY
POWER IN11 - 16 VDC
pc cardstatus
ANALOG INPUTS Voltage VoltDiff VoltSE Thermocouple TCDiff TCSE Bridge measurements (use VX) BrFull BrFull6W BrHalf BrHalf3W BrHalf4W Others Resistance PanelTemp PeriodAvg AM25T
SWITCHED VOLTAGE EXCITATION (VX) Excite BrFull BrFull6w BrHalf BrHalf3W BrHalf4W
SWITCHED CURRENT EXCITATION (IX) ExciteI Resistance
CONTINUOUS ANALOG OUTPUTS (CAO) ExciteCAO
CONTROL I/O PortGet PortSet ReadIO TimerIO WriteIO
PULSE INPUTSPulseCount PulseCountReset
SWITCHED 12 VOLTS SW-12 PortSet SW12
POWER UP PowerOff (program control) SDM CONNECTIONS
CS7500 CSAT3 SDMINT8 SDMSpeed SDMTrigger
SDI-12 12 V
POWER IN
CHARGER INPUT
POWER GROUND (G), FOR 5V SW-12 12V SDM
CS I/O DSP4 (Data Tables and Output)
RS-232
GROUND LUG
PCMCIA PC CARD CardOut (Data Tablesand Output)
FIGURE OV1-2. CR5000 Panel and Associated Instructions.
SIGNAL GROUND ( ), FOR Analog Pulse Excitation
CR5000 Overview
OV-3
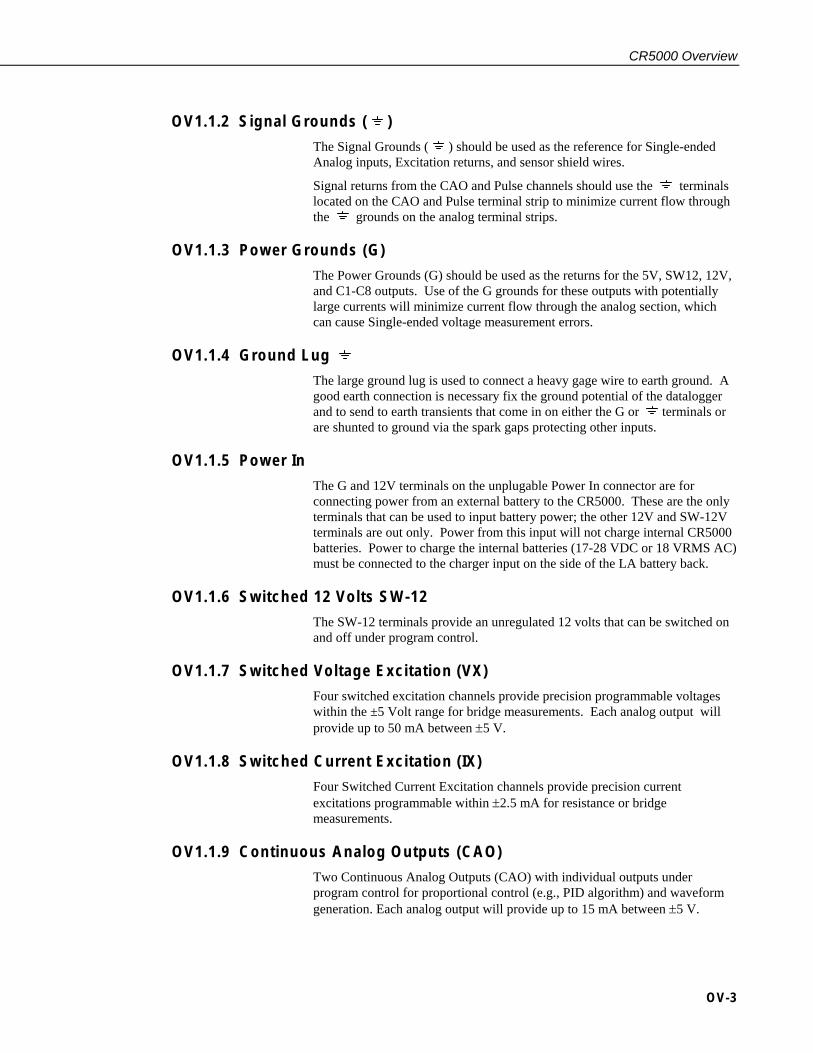
OV1.1.2 Signal Grounds ( )
The Signal Grounds ( ) should be used as the reference for Single-ended Analog inputs, Excitation returns, and sensor shield wires.
Signal returns from the CAO and Pulse channels should use the terminals located on the CAO and Pulse terminal strip to minimize current flow through the grounds on the analog terminal strips.
OV1.1.3 Power Grounds (G)
The Power Grounds (G) should be used as the returns for the 5V, SW12, 12V, and C1-C8 outputs. Use of the G grounds for these outputs with potentially large currents will minimize current flow through the analog section, which can cause Single-ended voltage measurement errors.
OV1.1.4 Ground Lug
The large ground lug is used to connect a heavy gage wire to earth ground. A good earth connection is necessary fix the ground potential of the datalogger and to send to earth transients that come in on either the G or terminals or are shunted to ground via the spark gaps protecting other inputs.
OV1.1.5 Power In
The G and 12V terminals on the unplugable Power In connector are for connecting power from an external battery to the CR5000. These are the only terminals that can be used to input battery power; the other 12V and SW-12V terminals are out only. Power from this input will not charge internal CR5000 batteries. Power to charge the internal batteries (17-28 VDC or 18 VRMS AC) must be connected to the charger input on the side of the LA battery back.
OV1.1.6 Switched 12 Volts SW-12
The SW-12 terminals provide an unregulated 12 volts that can be switched on and off under program control.
OV1.1.7 Switched Voltage Excitation (VX)
Four switched excitation channels provide precision programmable voltages within the ±5 Volt range for bridge measurements. Each analog output will provide up to 50 mA between ±5 V.
OV1.1.8 Switched Current Excitation (IX)
Four Switched Current Excitation channels provide precision current excitations programmable within ±2.5 mA for resistance or bridge measurements.
OV1.1.9 Continuous Analog Outputs (CAO)
Two Continuous Analog Outputs (CAO) with individual outputs under program control for proportional control (e.g., PID algorithm) and waveform generation. Each analog output will provide up to 15 mA between ±5 V.
CR5000 Overview
OV-4
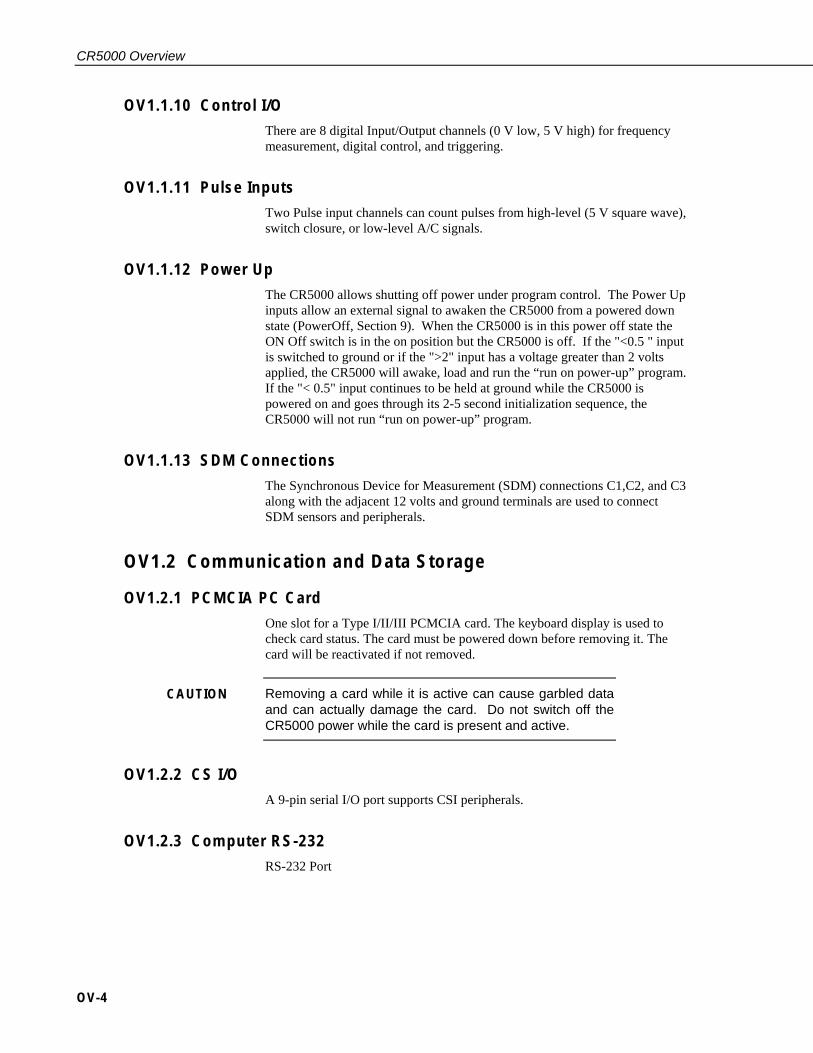
OV1.1.10 Control I/O
There are 8 digital Input/Output channels (0 V low, 5 V high) for frequency measurement, digital control, and triggering.
OV1.1.11 Pulse Inputs
Two Pulse input channels can count pulses from high-level (5 V square wave), switch closure, or low-level A/C signals.
OV1.1.12 Power Up
The CR5000 allows shutting off power under program control. The Power Up inputs allow an external signal to awaken the CR5000 from a powered down state (PowerOff, Section 9). When the CR5000 is in this power off state the ON Off switch is in the on position but the CR5000 is off. If the "<0.5 " input is switched to ground or if the ">2" input has a voltage greater than 2 volts applied, the CR5000 will awake, load and run the “run on power-up” program. If the "< 0.5" input continues to be held at ground while the CR5000 is powered on and goes through its 2-5 second initialization sequence, the CR5000 will not run “run on power-up” program.
OV1.1.13 SDM Connections
The Synchronous Device for Measurement (SDM) connections C1,C2, and C3 along with the adjacent 12 volts and ground terminals are used to connect SDM sensors and peripherals.
OV1.2 Communication and Data Storage
OV1.2.1 PCMCIA PC Card
One slot for a Type I/II/III PCMCIA card. The keyboard display is used to check card status. The card must be powered down before removing it. The card will be reactivated if not removed.
Removing a card while it is active can cause garbled data and can actually damage the card. Do not switch off the CR5000 power while the card is present and active.
OV1.2.2 CS I/O
A 9-pin serial I/O port supports CSI peripherals.
OV1.2.3 Computer RS-232
RS-232 Port
CAUTION

CR5000 Overview
OV-5
OV1.3 Power Supply and AC Adapter The CR5000 has two base options the low profile without any power supply and the lead acid battery power supply base. The low profile base requires an external DC power source connected to the Power In terminal on the panel.
The battery base has a 7 amp hour battery with built in charging regulator and includes an AC adapter for use where 120 VAC is available (18 VAC RMS output). Charging power can also come from a 17-28 VDC input such as a solar panel. The DCDC18R is available for stepping the voltage up from a nominal 12 volt source (e.g., vehicle power supply) to the DC voltage required for charging the internal battery.
OV2. Memory and Programming Concepts
OV2.1 Memory The CR5000 has 2MB SRAM and 1MB Flash EEPROM. The operating system and user programs are stored in the flash EEPROM. The memory that is not used by the operating system and program is available for data storage. The size of available memory may be seen in the status file. Additional data storage is available by using a PCMCIA card in the built in card slot.
OV2.2 Measurements, Processing, Data Storage The CR5000 divides a program into two tasks. The measurement task manipulates the measurement and control hardware on a rigidly timed sequence. The processing task processes and stores the resulting measurements and makes the decisions to actuate controls.
The measurement task stores raw Analog to Digital Converter (ADC) data directly into memory. As soon as the data from a scan is in memory, the processing task starts. There are at least two buffers allocated for this raw ADC data (more under program control), thus the buffer from one scan can be processed while the measurement task is filling another.
When a program is compiled, the measurement tasks are separated from the processing tasks. When the program runs, the measurement tasks are performed at a precise rate, ensuring that the measurement timing is exact and invariant.
Processing Task: Measurement Task:
Digital I/O task Read and writes to digital I/O ports (ReadI/O, WriteI/O)
Processes measurements Determines controls (port states) to set next scan Stores data
Analog measurement and excitation sequence and timing Reads Pulse Counters Reads Control Ports (GetPort) Sets control ports (SetPort)

CR5000 Overview
OV-6
OV2.3 Data Tables The CR5000 can store individual measurements or it may use its extensive processing capabilities to calculate averages, maxima, minima, histogams, FFTs, etc., on periodic or conditional intervals. Data are stored in tables such as listed in Table OV2-1. The values to output are selected when running the program generator or when writing a datalogger program directly.
Table OV2-1. Typical Data Table
TOA4 StnName Temp TIMESTAMP RECORD RefTemp_Avg TC_Avg(1) TC_Avg(2) TC_Avg(3) TC_Avg(4) TC_Avg(5) TC_Avg(6) TS RN degC degC degC degC degC degC degC Avg Avg Avg Avg Avg Avg Avg 1995-02-16 15:15:04.61 278822 31.08 24.23 25.12 26.8 24.14 24.47 23.76 1995-02-16 15:15:04.62 278823 31.07 24.23 25.13 26.82 24.15 24.45 23.8 1995-02-16 15:15:04.63 278824 31.07 24.2 25.09 26.8 24.11 24.45 23.75 1995-02-16 15:15:04.64 278825 31.07 24.21 25.1 26.77 24.13 24.39 23.76
OV3. PC9000 Application Software PC9000 is a Windows™ application for use with the CR5000. The software supports CR5000 program generation, real-time display of datalogger measurements, graphing, and retrieval of data files.
OV3.1 Hardware and Software Requirements The following computer resources are necessary:
• IBM PC, Portable or Desktop • 8 Meg of Ram • VGA Monitor • Windows 95 or newer • 30 Meg of Hard Drive Space for software • 40 Meg of Hard Drive Space for data • RS232 Serial Port
The following computer resources are recommended:
• 16 Meg of Ram • 33 MHz 486 or faster • Mouse
OV3.2 PC9000 Installation To install the PC9000 Software:
• Start Microsoft Windows • Insert diskette 1 (marked 1 of 2) in a disk drive. • From the Program Manager, select File menu and choose Run • Type (disk drive):\setup and press Enter e.g. a:\setup<Enter> • The setup routine will prompt for disk 2.
CR5000 Overview
OV-7
You may use the default directory of PC9000 or install the software in a different directory. The directory will be created for you.
To abort the installation, type Ctrl-C or Break at any time.
OV3.3 PC9000 Software Overview
This overview points out the main PC9000 functions and where to find them. PC9000 has extensive on-line help to guide the user in its operation, run PC9000 to get the details. A CR5000 is not necessary to try out the programming and real time display options; a demo uses canned data for viewing. Without a CR5000, there are no communications with the datalogger; operations such as downloading programs and retrieving data will not function.
Figures OV3-1 and OV3-2 show the main PC9000 menus. The primary functions of PC9000 are accessed from the File, Comm, Realtime, and Analysis selections on the main menu (Figure OV3-1).

CR5000 Overview
OV-8
OV3-1. PC9000 Primary Functions
File Edit Realtime Analysis Tools Collect Display Windows Help
CR9000 Program Generator CR5000 Program Generator CR9000 Program Editor . . . CR5000 Program Editor . . . Open Wiring Diagram . . . Open Data Table Info File . . . Open Data File . . . Convert Binary to ASCII File . . . Print . . . Printer Setup . . . DOS Shell . . . File Manager . . . Explorer . . . Exit PC9000
Menu-driven Program Generation.
Direct Editing of Program
View/Edit Wiring Diagram & DataTable Information (Created by Program Generator)
View Data Collected from CR5000
Display Data in Tables Collected From CR5000. Graphing requires no special processing of the data and provides rapid feedback to the operator.
Display Data Graph 1 . . . Display Data Graph 2 . . . ID2000 . . . Ctrl + I
CommLink Select Series Linked Station . . . Select Parallel Linked Station . . . Logger Clock . . . Logger Status . . . Download . . . Save and Download Logger Files . . . Diagnostics
PC to CR5000 communications.
Data Retrieval . . . Scheduled Data Retrieval . . . Collect data from CR5000
Realtime Display & Graphing
Alarms List . . . Field Monitor . . . Virtual Meter . . . Virtual O'Scope . . . X-Y Plotter . . . Histogram . . . Fast Fourier Transform . . . Level Crossing Histogram . . . Get/Set Variable . . .

CR5000 Overview
OV-9
OV3-2. PC9000 Editing, Help, and User Preferences
OV3.3.1 File
Program Generator Guides the user through a series of menus to configure the measurement types: thermocouple, voltage, bridge, pulse counting, frequency, and others. Creates a CR5000 program, wiring diagram, output table, description, and configuration file.
Program Editor Create programs directly or edit those created by the program generator or retrieved from the CR5000. Provides context-sensitive help for the CR5000's BASIC-like language.
OV3.3.2 Edit
REALTIME
Virtual Meter Updates up to five displays simultaneously. Choices include analog meter, horizontal and vertical bars, independent scaling/offset, multiple alarms, and rapid on-site calibration of sensors
Undo Ctrl + Z Date & Time Select All Strip Remarks and Spaces Ctrl + S Cut Ctrl + X Copy Ctrl + C Paste Ctrl + V Delete Delete Line Ctrl + Y Wrap Text Ctrl + WGo To Line . . . Find Ctrl + F Replace Ctrl + R
Colors . . . Fonts . . . Defaults . . .
Tile Horizontal . . . Tile Vertical . . . Cascade . . . Arrange Icons . . . Work Area Setup . . . List of Windows
PC9000 Help Contents . . . Search PC9000 Help . . . CRBasic Help Contents . . . Search CRBasic Help . . . Obtaining Technical Support . . . About PC9000 . . . Software Versions . . .
Editing Options for Active Windows
Change fonts and/or Colors for Active Windows.
File Edit Realtime Analysis Tools Collect Display Windows Help

CR5000 Overview
OV-10
Virtual Oscilloscope Displays up to six channels. Time base variable from milliseconds to hours.
X-Y Plotter Allows comparison of any two measurements in real time.
OV3.3.3 Analysis
Data Graphing Displays up to 16 fields simultaneously as strip charts or two multi-charts with up to 8 traces each. Includes 2D/3D bars, line, log/linear, area, and scatter. Line statistics available for max/min, best fit, mean, and standard deviation. Handles files of unlimited size. Historical graphing requires no special processing of the data and provides rapid feedback to the operator.
OV3.3.4 Tools
Control and Communications Supports PC to CR5000 communications: clock read/set, status read, program download, and program retrieval.
OV3.3.5 Collect
Collect data from CR5000 data tables
OV3.3.6 Display
Configure the font and color scheme in an active window.
OV3.3.7 Windows
Size and arrange windows.
OV3.3.8 Help
On-line help for PC9000 software.

CR5000 Overview
OV-11
OV4. Keyboard Display
CAMPBELL SCIENTIFIC
CR5000 Datalogger
06/18/2000, 18:24:35 CPU: TRIG.CR5
Running.
Real Time Tables Real Time Custom Final Storage Data Reset Data Tables Graph Setup
Data Run/Stop Program File Status Configure, Settings
ROM Version : xxxx OS Version : xxxx OS Date : xxxx OS Signature Serial Number Rev Board Station Name : xxxx Program Name : xxxxx StartTime : xxxxx Run Signature DLD Signature Battery : xxxx
New Edit Copy Delete Run Options Directory Format
Set Time/Date Settings Display
Power Up Screen
Press any key for Main Menu (except < >)
Adjust contrast with < > < lighter darker >

CR5000 Overview
OV-12
OV4.1 Data Display
Data Run/Stop Program File Status Configure, Settings
List of Data Tables created by active program
List of Data Tables created by active program
Real Time Tables Real Time Custom Final Storage Data Reset Data Table Graph Setup
Graph Type: Scope Scaler: Manual Upper: 0.000000 Lower: 0.000000 Display Val Off Display Max Off Display Min Off
List of Data Tables created by active program
Cursor to Data and Press Enter
All Tables List of Data Tables created by active program

CR5000 Overview
OV-13
OV4.1.1 Real Time Tables
Table1 Temps Public
Tref : 23.0234 TCTemp(1) : 19.6243 TCTemp(2) : 19.3429 TCTemp(3) : 21.2003 Flag(1) : -1.0000 Flag(2) : 0.00000 Flag(3) : 0.00000 Flag(4) : 0.00000
Scaler Manual Upper: 30.000000 Lower: 20.000000 Display Val On Display Max On Display Min On Graph Type Roll
30.0 22.35 _____ ___ ____ __ 20.00
List of Data Tables created by active program. For Example,
Cursor to desired Table and press Enter
TCTemp(3) :
Tref : 23.0234 TCTemp(1) : 19.6243 TCTemp(2) : 19.3429 TCTemp(3) : 21.2003 Flag(1) : -1.0000 Flag(2) : 0.00000 Flag(3) : 0.00000 Flag(4) : 0.00000 Fl (3)
TCTemp(3) 2
Public Table values can be changed. Cursor to value and press Enter to edit value.
Press Graph/ Char for Graph of selected field
Press Ins for Graph Setup
New values are displayed as they are stored.
CR5000 Overview
OV-14
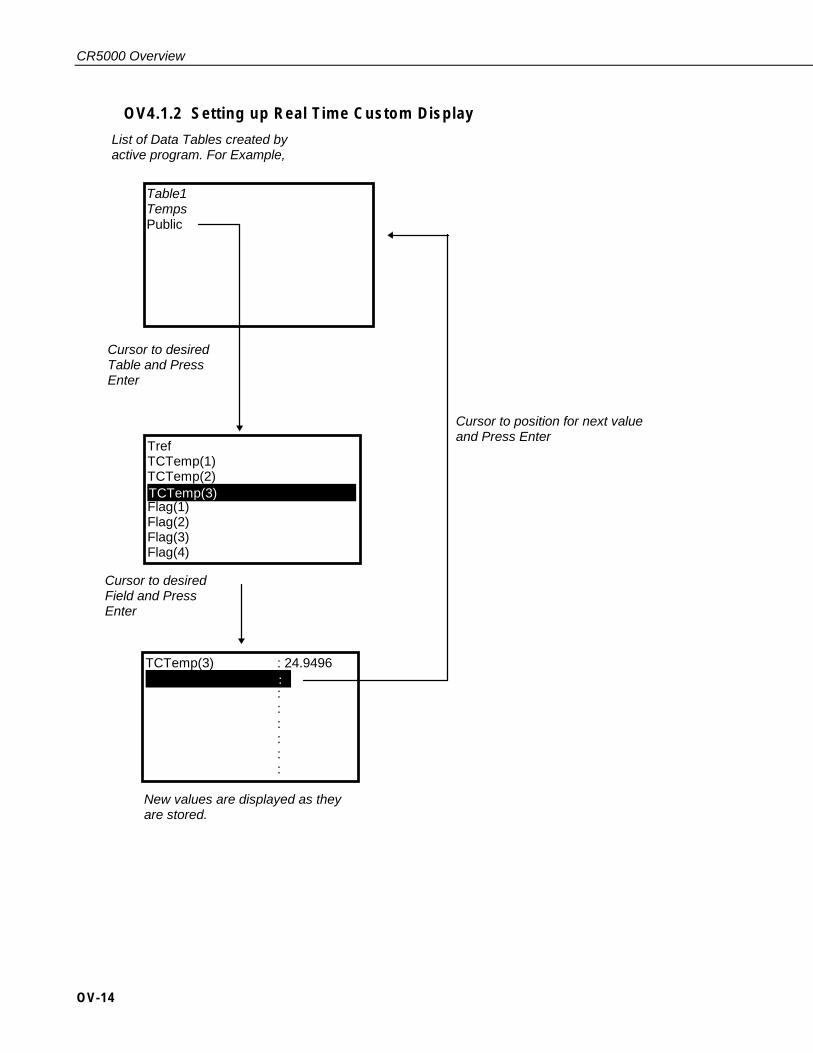
OV4.1.2 Setting up Real Time Custom Display
Table1TempsPublic
TrefTCTemp(1)TCTemp(2)TCTemp(3)Flag(1)Flag(2)Flag(3)Flag(4)
TCTemp(3) : 24.9496
::::::
List of Data Tables created byactive program. For Example,
Cursor to desiredTable and PressEnter
TCTemp(3)
New values are displayed as theyare stored.
Cursor to desiredField and PressEnter
:
Cursor to position for next valueand Press Enter

CR5000 Overview
OV-15
OV4.1.3 Final Storage Tables
Press Ins for Jump To screen.
TimeStamp Record Tref TC(1) TC(2) TC(3)"2000-01-03 00:12:38" 0 21.934 22.8419"2000-01-03 00:12:39" 1 24.1242 21.8619 21.9173 22.8364"2000-01-03 00:12:40" 2 24.1242 21.8786 21.9229 22.8364"2000-01-03 00:12:41" 3 24.1242 : 21.8786 21.9173 22.8419"2000-01-03 00:12:42" 4 24.1242 : 21.8786 21.9173 22.8253"2000-01-03 00:12:43" 5 24.1242 : 21.8675 21.9118 22.8364"2000-01-03 00:12:44" 6 24.1242 : 21.8675 21.9173 22.8087"2000-01-03 00:12:45" 7 24.1242 : 21.8675 21.9173 22.8142"2000-01-03 00:12:46" 8 24.1242 : 21.8398 21.9395 22.8253"2000-01-03 00:12:47" 9 24.1242 21.8176 21.9118 22.8308"2000-01-03 00:12:48" 10 24.1242 21.8342 21.945 22.8364"2000-01-03 00:12:49" 11 24.1242 21.8453 21.9506 22.8364
Press Graph/ Char forGraph of selected field.Use ←, →, PgUp, PgDnto move cursor andwindow of data graphed.
5 :2000-01-03 00:12:43Tref TC(1)
21.8675
List of Data Tables created byactive program. For Example:
Table1Temps
Cursor to desiredTable and PressEnter
Use Hm (oldest), End (newest),PgUp (older), PgDn (newer),←, →, ↑, and ↓ to move aroundin data table.
Scaler ManualUpper: 30.000000Lower: 20.000000Display Val OnDisplay Max OnDisplay Min OnGraph Type Roll
30.0 21.87
_______ ______ _______ ____ ___ ____ __20.00
Press Ins forGraph Setup
Go to Record:
press Ins to edit
Table Size: 1000 Current Record: 759
5
CR5000 Overview
OV-16
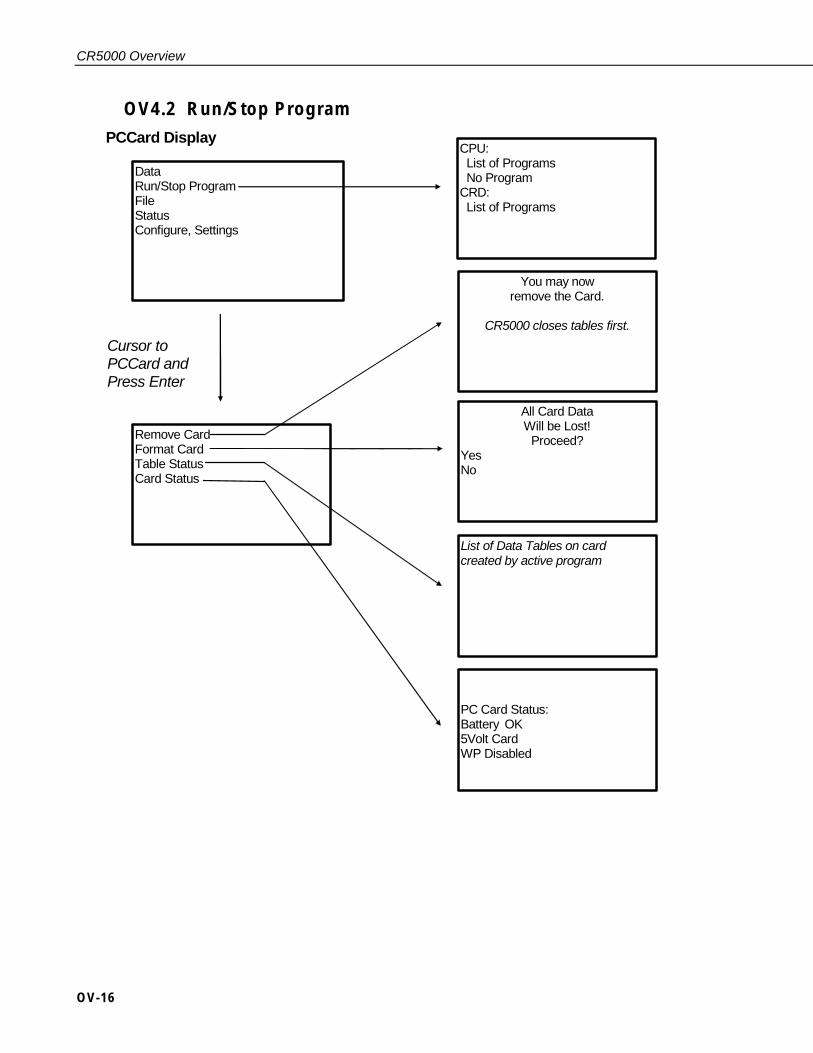
OV4.2 Run/Stop Program PCCard Display
Data Run/Stop Program File Status Configure, Settings
You may now remove the Card.
CR5000 closes tables first.
All Card Data Will be Lost!
Proceed? Yes No
Remove Card Format Card Table Status Card Status
PC Card Status: Battery OK 5Volt Card WP Disabled
List of Data Tables on card created by active program
Cursor to PCCard and Press Enter
CPU: List of Programs No Program CRD: List of Programs
CR5000 Overview
OV-17
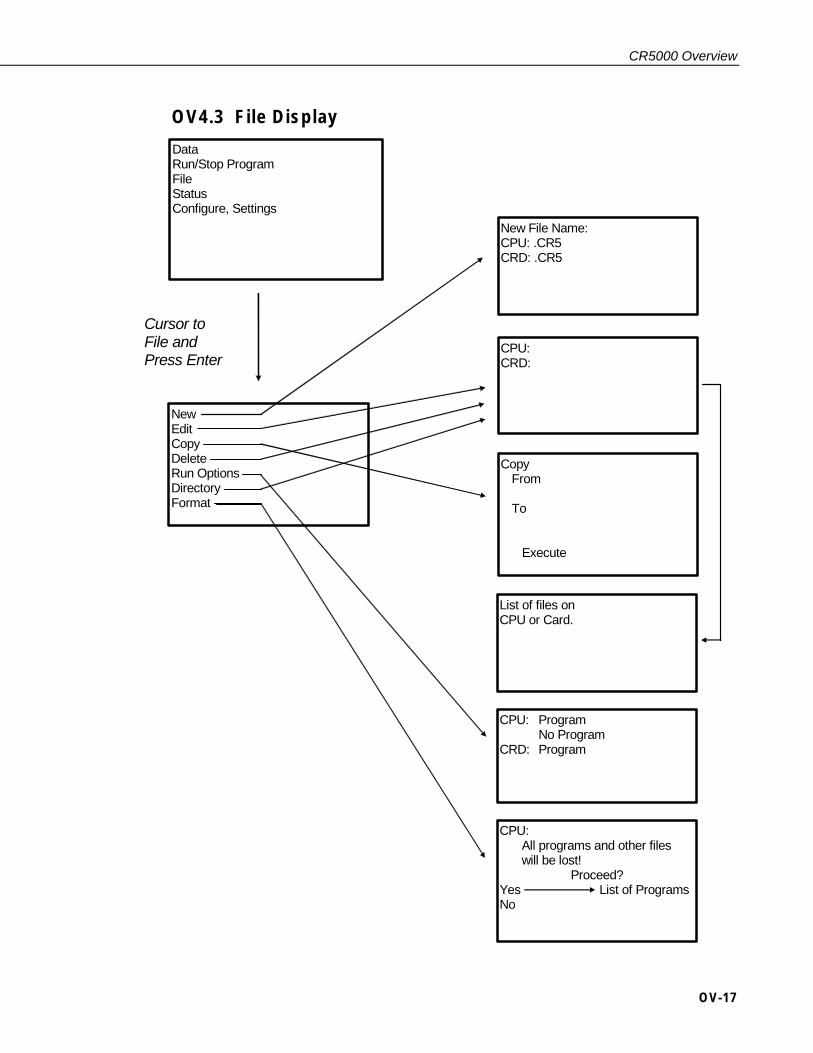
OV4.3 File Display
New Edit Copy Delete Run Options Directory Format
CPU: All programs and other files will be lost!
Proceed? Yes List of Programs No
Data Run/Stop Program File Status Configure, Settings
New File Name: CPU: .CR5 CRD: .CR5
CPU: CRD:
Copy From To Execute
Cursor to File and Press Enter
List of files on CPU or Card.
CPU: Program No Program CRD: Program
CR5000 Overview
OV-18
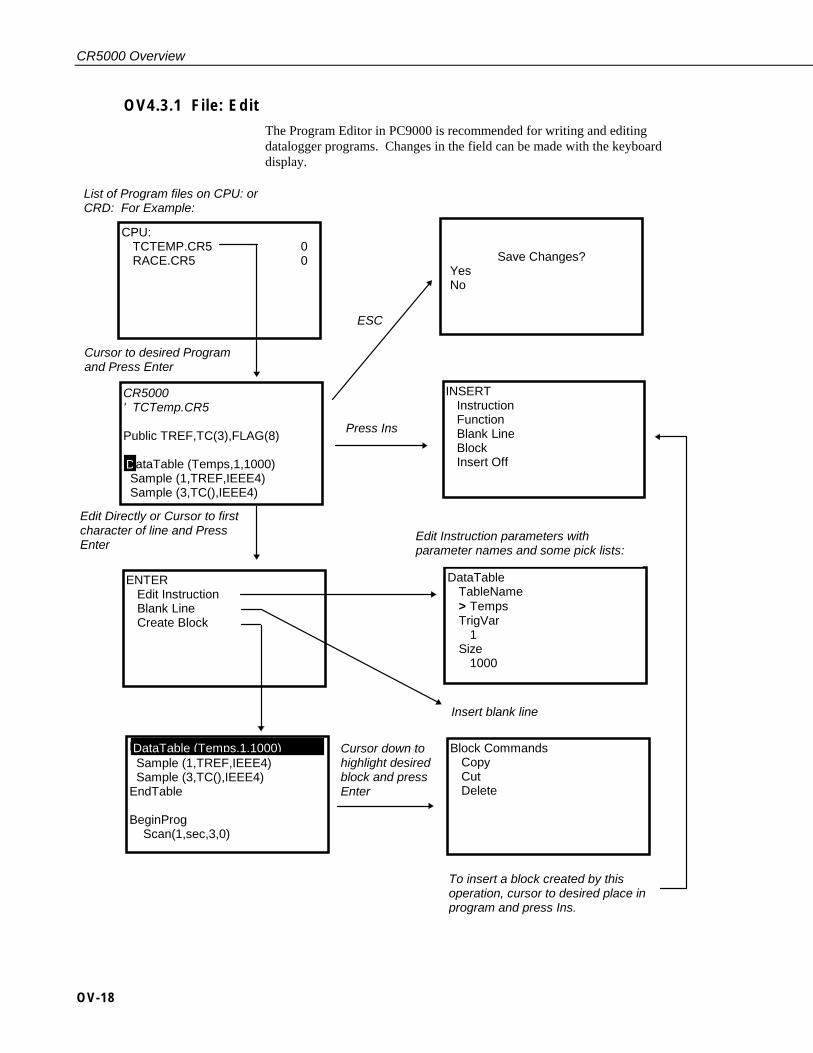
OV4.3.1 File: Edit
The Program Editor in PC9000 is recommended for writing and editing datalogger programs. Changes in the field can be made with the keyboard display.
Press Ins
ESC
CPU:TCTEMP.CR5 0RACE.CR5 0
CR5000' TCTemp.CR5
Public TREF,TC(3),FLAG(8)
D ataTable (Temps,1,1000) Sample (1,TREF,IEEE4) Sample (3,TC(),IEEE4)E dT bl
ENTEREdit InstructionBlank LineCreate Block
List of Program files on CPU: orCRD: For Example:
Cursor to desired Programand Press Enter
Edit Directly or Cursor to firstcharacter of line and PressEnter
D
INSERTInstructionFunctionBlank LineBlockInsert Off
DataTableTableName> TempsTrigVar
1Size
1000
Block CommandsCopyCutDelete
Insert blank line
DataTable (Temps,1,1000) Sample (1,TREF,IEEE4) Sample (3,TC(),IEEE4)EndTable
BeginProg Scan(1,sec,3,0)
Edit Instruction parameters withparameter names and some pick lists:
DataTable (Temps,1,1000) Cursor down tohighlight desiredblock and pressEnter
To insert a block created by thisoperation, cursor to desired place inprogram and press Ins.
Save Changes? Yes No

CR5000 Overview
OV-19
OV4.4 Configure Display
Data Run/Stop Program File Status Configure, Settings
Light Dark <- * ->
05/24/2000, 15:10:40 Year 2000 Month 5 Day 24 Hour 15 Minute 10 Set Cancel
Cursor to Configure, Settings and Press Enter
Set Time/Date Settings Display
Security Enable RS-232 Time Out: No CR5000 Off
Turn off display Back Light Contrast Adjust Display Time Out: No, Yes (if yes)
Time out (min) 1
Enter Passwords: Level 1: Level 2: Level 3:
Enter Num
Password
click

CR5000 Overview
OV-20
OV5. Specifications
PROGRAM EXECUTION RATEThe CR5000 can measure one channel and store theresult in 500 µs; all 40 SE* channels can be measuredin 8 ms (5 kHz aggregate rate).
ANALOG INPUTSDESCRIPTION: 20 DF* or 40 SE, individually
configured. Channel expansion provided through AM16/32, AM416, and AM25T Multiplexers.
RANGES, RESOLUTION, AND TYPICAL INPUTNOISE: Basic Resolution (Basic Res) is the A/D
resolution of a single conversion. Resolution of DFM* with input reversal is half the Basic Res.Noise values are for DFM with input reversal; noiseis greater with SEM.*
Input Basic 0 Int. 250 µs Int. 20/16.7 ms Int.Rng (mV) Res (µV) (µV RMS) (µV RMS) (µV RMS)
±5000 167 70 60 30±1000 33.3 30 12 6±200 6.67 8 2.4 1.2±50 1.67 3.0 0.8 0.3±20 0.67 1.8 0.5 0.2
ACCURACY†:±(0.05% of Reading + Offset) 0° to 40°C
±(0.075% of Reading + Offset) -25° to 50°C
±(0.10% of Reading + Offset) -40° to 85°C
Offset for DFM w/input reversal = Basic Res +1 µV
Offset for DFM w/o input reversal = 2Basic Res + 2 µV
Offset for SEM = 2Basic Res + 10 µV
MINIMUM TIME BETWEEN MEASUREMENTS:
Zero Integration: 125 µs250 µs Integration: 475 µs16.7 ms Integration: 19.9 ms20 ms Integration: 23.2 ms
COMMON MODE RANGE: ±5 V
DC COMMON MODE REJECTION: >100 dB with input reversal (>80 dB without input reversal)
NORMAL MODE REJECTION: 70 dB @ 60 Hz when using 60 Hz rejection
SUSTAINED INPUT VOLTAGE WITHOUT DAMAGE:±16 Vdc
INPUT CURRENT: ±2 nA typ., ±10 nA max. @ 50°C
INPUT RESISTANCE: 20 GΩ typical
ACCURACY OF INTERNAL THERMOCOUPLE REFERENCE JUNCTION:
±0.25°C, 0° to 40°C±0.5°C, -25° to 50°C±0.7°C, -40° to 85°C
ANALOG OUTPUTSDESCRIPTION: 4 switched voltage; 4 switched cur-
rent; 2 continuous voltage; switched outputs active only during measurements, one at a time.
RANGE: Voltage (current) outputs programmable between ±5 V (±2.5 mA)
RESOLUTION: 1.2 mV (0.6 µA) for voltage (current) outputs
ACCURACY: ±10 mV (±10 µA) for voltage (current) outputs
CURRENT SOURCING: 50 mA for switched voltage;15 mA for continuous
CURRENT SINKING: 50 mA for switched voltage;5 mA for continuous (15 mA w/selectable option)
COMPLIANCE VOLTAGE: ±5 V for switched current excitation
RESISTANCE MEASUREMENTSProvides voltage ratio measurements of 4- and 6-wirefull bridges, and 2-, 3-, 4-wire half bridges. Directresistance measurements available with current excita-tion. Dual-polarity excitation is recommended.
VOLTAGE RATIO ACCURACY†: Assumes input and excitation reversal and an excitation voltage of at least 2000 mV.
±(0.04% Reading + Basic Res/4) 0° to 40°C
±(0.05% Reading + Basic Res/4) -25° to 50°C±(0.06% Reading + Basic Res/4) -40° to 85°C
ACCURACY† WITH CURRENT EXCITATION:Assumes input and excitation reversal, and an excitation current, Ix, of at least 1 mA.
±(0.075% Reading + Basic Res/2Ix) 0° to 40°C
±(0.10% Reading + Basic Res/2Ix) -25° to 50°C
±(0.12% Reading + Basic Res/2Ix) -40° to 85°C
PERIOD AVERAGING MEASUREMENTSDESCRIPTION: The average period for a single
cycle is determined by measuring the duration of aspecified number of cycles. Any of the 40 SE analog inputs can be used; signal attenuation and ac coupling may be required.
INPUT FREQUENCY RANGE:Input Signal (peak to peak) Min. Max.
Rng (mV) Min. Max.1 Pulse W. Freq
±5000 600 mV 10 V 2.5 µs 200 kHz±1000 100 mV 2.0 V 5.0 µs 100 kHz
±200 4 mV 2.0 V 25 µs 20 kHz1Maximum signals must be centered around datalogger ground.
RESOLUTION: 70 ns/number of cycles measured
ACCURACY: ±(0.03% of Reading + Resolution)
PULSE COUNTERSDESCRIPTION: Two 16-bit inputs selectable for switch
closure, high frequency pulse, or low-level ac.
MAXIMUM COUNT: 4 x 10⁹ counts per scan
SWITCH CLOSURE MODE:Minimum Switch Closed Time: 5 msMinimum Switch Open Time: 6 msMaximum Bounce Time: 1 ms open without being counted.
HIGH FREQUENCY PULSE MODE:Maximum Input Frequency: 400 kHzMaximum Input Voltage: ±20 VVoltage Thresholds: Count upon transitionfrom below 1.5 V to above 3.5 V at low frequen-cies. Larger input transitions are required at high frequencies because of 1.2 µs time constant filter.
LOW LEVEL AC MODE:Internal ac coupling removes dc offsets up to ±0.5 V.
Input Hysteresis: 15 mVMaximum ac Input Voltage: ±20 VMinimum ac Input Voltage (sine wave):
(mV RMS) Range (Hz)20 1.0 to 1000
200 0.5 to 10,0001000 0.3 to 16,000
DIGITAL I/O PORTSDESCRIPTION: 8 ports selectable as binary inputs or
control outputs.
OUTPUT VOLTAGES (no load): high 5.0 V ±0.1 V;low < 0.1 V
OUTPUT RESISTANCE: 330 Ω
INPUT STATE: high 3.0 to 5.3 V; low -0.3 to 0.8 V
INPUT RESISTANCE: 100 kΩ
EMI and ESD PROTECTIONThe CR5000 is encased in metal and incorporatesEMI filtering on all inputs and outputs. Gas dischargetubes provide robust ESD protection on all terminalblock inputs and outputs. The following Europeanstandards apply.
EMC tested and conforms to BS EN61326:1998.
Details of performance criteria applied are availableupon request.
Warning: This is a Class A product. In a domesticenvironment this product may cause radio interferencein which case the user may be required to correct theinterference at the user’s own expense.
CPU AND INTERFACEPROCESSOR: Hitachi SH7034
MEMORY: Battery-backed SRAM provides 2 Mbytes for data and operating system use with 128 kbytes reserved for program storage.Expanded data storage with PCMCIA type I, type II, or type III card.
DISPLAY: 8-line-by-21 character alphanumeric or 128 x 64 pixel graphic LCD display w/backlight.
SERIAL INTERFACES: Optically isolated RS-232 9-pin interface for computer or modem. CSI/O9-pin interface for peripherals such as CSI modems.
BAUD RATES: Selectable from 1,200 to 115,200 bps.ASCII protocol is eight data bits, one start bit, one stop bit, no parity.
CLOCK ACCURACY: ±1 minute per month
SYSTEM POWER REQUIREMENTSVOLTAGE: 11 to 16 Vdc
TYPICAL CURRENT DRAIN: 400 µA software power off; 1.5 mA sleep mode; 4.5 mA at 1 Hz (200 mAat 5 kHz) sample rate.
INTERNAL BATTERIES: 7 Ahr rechargeable base (optional); 1650 mAhr lithium battery for clock andSRAM backup, 10 years of service typical, less at high temperatures.
EXTERNAL BATTERIES: 11 to 16 Vdc; reverse polarity protected.
PHYSICAL SPECIFICATIONSSIZE: 9.8” x 8.3” x 4.5” (24.7 cm x 21.0 cm x 11.4 cm)
Terminal strips extend 0.4” (1.0 cm).
WEIGHT: 4.5 lbs (2.0 kg) with low-profile base;12.2 lbs (5.5 kg) with rechargeable base
WARRANTY Three years against defects in materials and workmanship.
Electrical specifications are valid over a -25° to +50°C range unless otherwise specified; testing over -40° to +85°C available asan option, excludes batteries. Non-condensing environment required. Yearly calibrations are recommended to maintain electri-cal specifications.
We recommend that you confirm system configuration and critical specifications with
Campbell Scientific before purchase.
*SE(M): Single-Ended (Measurement)
*DF(M): Differential (Measurement)† Sensor and measurement noise not included.

1-1
Section 1. Installation and Maintenance
1.1 Protection from the EnvironmentThe normal environmental variables of concern are temperature and moisture.The standard CR5000 is designed to operate reliably from -25 to +50°C (-40°Cto +85°C, optional) in noncondensing humidity. When humidity tolerances areexceeded, damage to IC chips, microprocessor failure, and/or measurementinaccuracies due to condensation on the various PC board runners may result.Effective humidity control is the responsibility of the user.
The CR5000 is not hermetically sealed. Two half unit packets of DESI PAKdesiccant are located by the batteries. A dry package weighs approximately 19grams and will absorb a maximum of six grams of water at 40% humidity and11 grams at 80%. Desiccant packets can be dried out by placing the packets inan oven at 120°C for 16 hours (desiccant only, not the CR5000).
Campbell Scientific offers two enclosures for housing a CR5000 andperipherals. The fiberglass enclosures are classified as NEMA 4X (water-tight,dust-tight, corrosion-resistant, indoor and outdoor use). A 1.25" diameterentry/exit port is located at the bottom of the enclosure for routing cables andwires. The enclosure door can be fastened with the hasp for easy access, orwith the two supplied screws for more permanent applications. The whiteplastic inserts at the corners of the enclosure must be removed to insert thescrews. Both enclosures are white for reflecting solar radiation, thus reducingthe internal enclosure temperature.
The Model ENC 12/14 fiberglass enclosure houses the CR5000 and one ormore peripherals. Inside dimensions of the ENC 12/14 are 14"x12"x5.5",outside dimensions are 18"x13.5"x8.13" (with brackets); weight is 11.16 lbs.
The Model ENC 16/18 fiberglass enclosure houses the CR5000 and severalperipherals. Inside dimensions of the ENC 16/18 are 18"x16"x8¾", outsidedimensions are 18½"x18¾"x10½" (with brackets); weight is 18 lbs.
1.2 Power RequirementsThe CR5000 operates at a nominal 12 VDC. Below 11.0 V or above 16 voltsthe CR5000 does not operate properly.
The CR5000 is diode protected against accidental reversal of the positive andground leads from the battery. Input voltages in excess of 18 V may damagethe CR5000 and/or power supply. A transzorb provides transient protection bylimiting voltage at approximately 20 V.
System operating time for the batteries can be determined by dividing the batterycapacity (amp-hours) by the average system current drain. The CR5000typically draws 1.5 mA in the sleep state (with display off), 4.5 mA with a 1 Hzsample rate, and 200 mA with a 5 kHz sample rate.

Section 1. Installation and Maintenance
1-2
1.3 CR5000 Power SuppliesThe CR5000 may be purchased with either a rechargeable lead acid battery orwith a low profile case without a battery.
While the CR5000 has a wide operating temperature range (-40 to +85°Coptional), the lead acid battery base is limited to -40 to +60°C. Exceeding thisrange will degrade battery capacity and lifetime and could also causepermanent damage.
1.3.1 CR5000 Lead Acid Battery BASETemperature range: -40° to +60°CCharging voltage: 17 to 24 VDC or 18 V RMS AC
In normal operation a charging source should be connected tothe base at all times. The CR5000 stops measuring at ~11 V.Battery life is shortened when discharged below 10.5 V.
The CR5000 includes a 12 V, 7.0 amp-hour lead acid battery, an ACtransformer (18 V RMS AC), and a temperature compensated charging circuitwith a charge indicating LED (Light Emitting Diode). An AC transformer orsolar panel should be connected to the base at all times. The charging sourcepowers the CR5000 while float charging the lead acid batteries. The internallead acid battery powers the datalogger if the charging source is interrupted.The lead acid battery specifications are given in Table 1.3-1.
The leads from the charging source connect to a wiring terminal plug on theside of the base. Polarity of the leads to the connector does not matter. Atranszorb provides transient protection to the charging circuit. A sustainedinput voltage in excess of 40V will cause the transzorb to limit voltage.
The red light (LED) on the base is on during charging with 17 to 24 VDC or18 V RMS AC. The switch turns power to the CR5000 on or off. Batterycharging still occurs when the switch is off.
Should the lead acid batteries require replacement, consult Figure 1.3-1 forwiring.
NOTE

Section 1. Installation and Maintenance
1-3
BLACK
RED
WHITE
6V 7AHLEAD ACIDBATTERY
6V 7AHLEAD ACIDBATTERY
LEAD ACID BATTERY REPLACEMENT
- -
+ +
FIGURE 1.3-1. Lead Acid Battery Wiring
Monitor the power supply using datalogger Instruction “ Battery” . Incorporatethis instruction into data acquisition programs to keep track of the state of thepower supply. If the system voltage level consistently decreases through time,some element(s) of the charging system has failed. Battery measures thevoltage at the CR5000 electronics, not the voltage of the lead acid battery. Themeasured voltage will normally be about 0.3 V less than the voltage at theinternal or external 12 V input. This voltage drop is on account of a Schottkeydiode. External power sources must be disconnected from the CR5000 tomeasure the actual lead acid battery voltage.
TABLE 1.3-1. CR5000 Rechargeable Battery and AC TransformerSpecifications
Lead Acid BatteryBattery Type Yuasa NP7-6Float Life @ 25oC 3 years minimumCapacity 7.0 amp-hourShelf Life, full charge 6 monthsCharge Time (AC Source) 40 hr full charge, 20 hr 95% chargeOperating temperature -40°C to 60°CAC Transformer
Input: 120 VAC, 60 HzIsolated Output: 18 VAC 1.2 Amp
There are inherent hazards associated with the use of sealed lead acid batteries.Under normal operation, lead acid batteries generate a small amount ofhydrogen gas. This gaseous by-product is generally insignificant because thehydrogen dissipates naturally before build-up to an explosive level (4%)occurs. However, if the batteries are shorted or overcharging takes place,hydrogen gas may be generated at a rate sufficient to create a hazard.Campbell Scientific recommends:
1. A CR5000 equipped with standard lead acid batteries should NEVER beused in applications requiring INTRINSICALLY SAFE equipment.
2. A lead acid battery should not be housed in a gas-tight enclosure.

Section 1. Installation and Maintenance
1-4
1.3.2 Low Profile CR5000The low profile CR5000 option is not supplied with a battery base. SeeSection 1.5 and 1.6 for external power connection considerations.
1.4 Solar PanelsAuxiliary photovoltaic power sources may be used to maintain charge on leadacid batteries.
When selecting a solar panel, a rule-of-thumb is that on a stormy overcast daythe panel should provide enough charge to meet the system current drain(assume 10% of average annual global radiation, kW/m2). Specific siteinformation, if available, could strongly influence the solar panel selection.For example, local effects such as mountain shadows, fog from valleyinversion, snow, ice, leaves, birds, etc. shading the panel should be considered.
Guidelines are available from the Solarex Corporation for solar panel selectioncalled "DESIGN AIDS FOR SMALL PV POWER SYSTEMS". It provides amethod for calculating solar panel size based on general site location andsystem power requirements. If you need help in determining your systempower requirements contact Campbell Scientific's Marketing Department.
1.5 Direct Battery Connection to the CR5000 WiringPanel
Any clean, battery backed 11 to 16 VDC supply may be connected to the 12 Vand G connector terminals on the front panel. When connecting externalpower to the CR5000, first, remove the green power connector from theCR5000 front panel. Insert the positive 12 V lead into the right-most terminalof the green connector. Insert the ground lead in the left terminal. Doublecheck polarity before plugging the green connector into the panel.
Diode protection exists so that an external battery can be connected to the greenG and 12 V power input connector, without loading or charging the internalbatteries. The CR5000 will draw current from the source with the largestvoltage. When power is connected through the front panel, switch control onthe standard CR5000 power supplies is by-passed (Figure 1.7-1).
1.6 Vehicle Power Supply Connections
1.6.1 CR5000 with Battery BaseThe best way to power a CR5000 with battery base from a vehicle’s 12 Vpower system is to use the DCDC18R to input the power to the CR5000’scharger input (Figure 1.6-1). With this configuration the CR5000’s batteriesare charged when the vehicle power is available. When the vehicle’s voltage istoo low or off, the CR5000 is powered from its internal batteries.

Section 1. Installation and Maintenance
1-5
CATONDC ONL
SN
Logan tah
ADE N SA
CR5000easurement and Control System
H L1
DIFF
1 2
H L2
3 4
H L3
5 6
H L4
7 8
H L5
9 10
H L6
11 12
H L7
13 14
H L8
15 16
H L9
17 18
H L10
CS
I/O
(OP
TIC
ALL
Y IS
OLA
TE
D)
RS
-232
CO
PT
ER
19 20
SE
H L11
DIFF
21 22
H L12
23 24
H L13
25 26
H L14
27 28
H L15
29 30
H L16
31 32
H L17
33 34
H L18
35 36
CONTROL I/O
CONTROL I/O POWERUP ROND
Lpc cardstatus
12V
12V
m
A B C D E
L
N O
T VP R S
W
-
Spc Cap
1 2Pgp
ENTER
BSPC
ST
ESC
PgDnEnd
Del ns
raphchar
3
4 5 6
0
CRSORALPA
POWER N11 - 16 VDC
H L19
37 38
H L20
39 40SE
VX
1
VX
2
VX
3
VX
4
CA
O1
CA
O2
IX1
IX2
IX3
IX4
IXR
P1
P1
C1
C2
C3
C4
G C6
C5
C7
C8
G G>2.
0V
<0.
8V
5V5V G SD
I-12
12V
G SD
M-C
2
SD
M-C
3
SD
M-C
1
G 12V
G SW
-12
SW
-12
G
POWER OUT
MADE INUSA
(11-16)V G 18V G
V in
DCDC1RBOOST REGULATOR
V out
FIGURE 1.6-1. CR5000 with DCDC18R
It is also possible to use the vehicle's 12 V power system as the primary supplyfor a CR5000 with a battery base (Figure 1.6-2). When a vehicle’s startingmotor is engaged, the system voltage drops considerably below the 11 voltsneeded for uninterrupted datalogger function. Diodes in the CR5000 in serieswith the 12 V Power In connector allow the battery base to supply the neededvoltage during motor start. The diodes also prevent the separate powersystems of the CR5000 and vehicle from attempting to charge each other.Because this configuration does not charge the CR5000 batteries, it is notrecommended.
CR5000Panel
+12V
G
FIGURE 1.6-2. Alternate Connect on to Vehicle Power Supply
Section 1. Installation and Maintenance
1-6
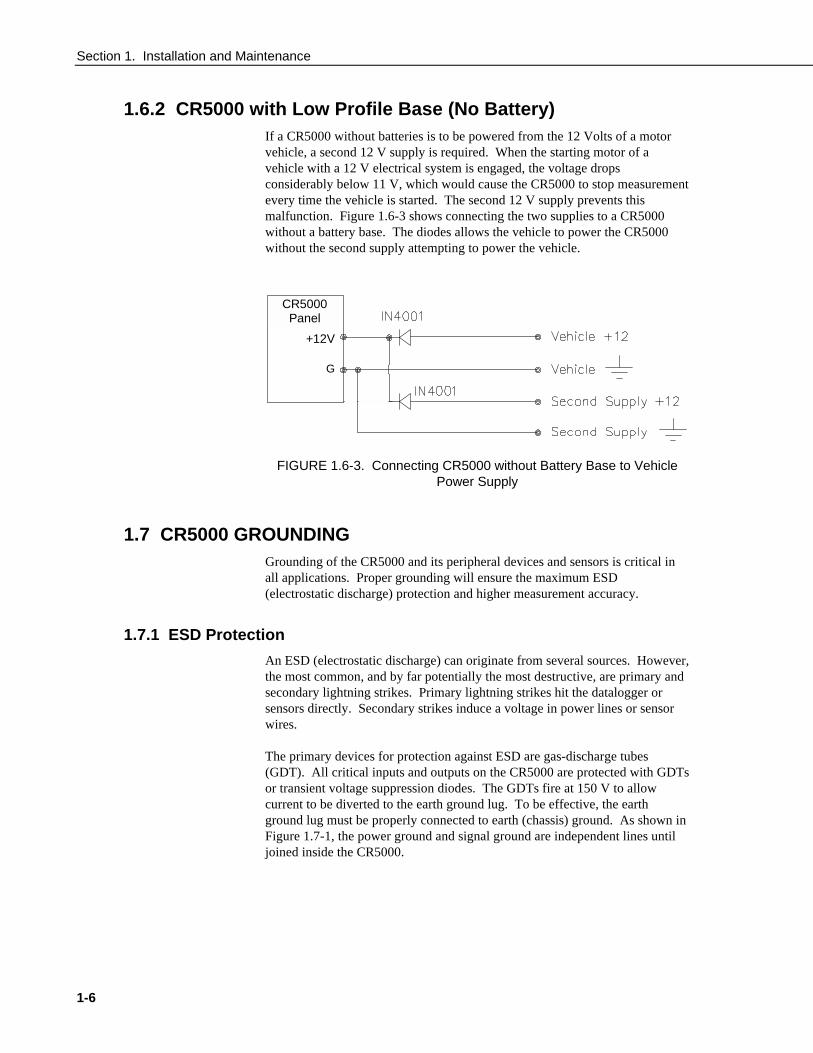
1.6.2 CR5000 with Low Profile Base (No Battery)If a CR5000 without batteries is to be powered from the 12 Volts of a motorvehicle, a second 12 V supply is required. When the starting motor of avehicle with a 12 V electrical system is engaged, the voltage dropsconsiderably below 11 V, which would cause the CR5000 to stop measurementevery time the vehicle is started. The second 12 V supply prevents thismalfunction. Figure 1.6-3 shows connecting the two supplies to a CR5000without a battery base. The diodes allows the vehicle to power the CR5000without the second supply attempting to power the vehicle.
CR5000Panel
+12V
G
FIGURE 1.6-3. Connecting CR5000 without Battery Base to VehiclePower Supply
1.7 CR5000 GROUNDINGGrounding of the CR5000 and its peripheral devices and sensors is critical inall applications. Proper grounding will ensure the maximum ESD(electrostatic discharge) protection and higher measurement accuracy.
1.7.1 ESD Protection
An ESD (electrostatic discharge) can originate from several sources. However,the most common, and by far potentially the most destructive, are primary andsecondary lightning strikes. Primary lightning strikes hit the datalogger orsensors directly. Secondary strikes induce a voltage in power lines or sensorwires.
The primary devices for protection against ESD are gas-discharge tubes(GDT). All critical inputs and outputs on the CR5000 are protected with GDTsor transient voltage suppression diodes. The GDTs fire at 150 V to allowcurrent to be diverted to the earth ground lug. To be effective, the earthground lug must be properly connected to earth (chassis) ground. As shown inFigure 1.7-1, the power ground and signal ground are independent lines untiljoined inside the CR5000.

Section 1. Installation and Maintenance
1-7
H L
1 21
H L
3 42
H L
5 63
H L
7 84
H L
9 105
H L
11 126
H L
13 147
H L
15 168
H L
17 189
H L
19 2010
DIFF
SE
H L
21
VX
1
VX
2
VX
3
VX
4
CA
O1
CA
O2
IX1
IX2
IX3
IX4
IXR
P1
P2
C1
C2
C3
C4
2211
G C5
C6
C7
C8
G >2.
0V
G >0.
8V
5V 5V G SD
I-12
12V
G SD
M-C
1
SD
M-C
2
SD
M-C
3
G 12V
G SW
-12
SW
-12
G
H L
23 2412
H L
25 2613
H L
27 2814
H L
29 3015
H L
31 3216
H L
33 34
CONTROL I/O
CONTROL I/O POWERUP
POWER UP
17H L
35 3618
H L
37 3819
H L
39 4020
DIFF
SE
m
A B C D E
LG I N O
T U VP R S W
)- (
Spc Cap
1 2
PgUp
ENTER
BSPC
SIT
ESC
PgDnEnd
Del Ins
Graphchar
3
4 5 6
7
0
CURSORALPA
SN
Logan Utah
ADE IN USA
CR5000 ICROLOGGER
CAUTIONDC ONL
POWER IN11 - 16 VDC
pc cardstatus
CS
IO
CO
PU
TE
R R
S-2
32(O
PT
ICA
LL
ISO
LA
TE
D)
GROUNDLUG
G 12V
Ground PlaneAnalog Grounds
1.85AThermal fuse
1.5k E20A
To CR5000Electronics
On/Off
5A Thermal fuse
0.9AThermal fuse
1.85A Thermal fuse
Batteries
SW12Control
10µf
Excitation, CAO,Pulse Counter Grounds ( )
Power Grounds (G)
FIGURE 1.7-1. Schematic of CR5000 Grounds
The 9-pin serial I/O ports on the CR5000 are another path for transients toenter and damage the CR5000. Communications devices such a telephone orshort-haul modem lines should have spark gap protection. Spark gapprotection is often an option with these products, so it should always berequested when ordering. The spark gaps for these devices must be connectedto either the CR5000 earth ground lug, the enclosure ground, or to the earth(chassis) ground.
Tie analog signalshields and returns togrounds ( ) located inanalog input terminalstrips.
Tie CAO and pulse-counter returns into grounds ( ) in CAO and pulse-counterterminal strip. Large excitation return currents may also be tied into this groundin order to minimize induced single-ended offset voltages in half bridgemeasurements.
ExternalPower Input
Tie 5 V, SW-12, 12 V and C1-C8returns into power grounds (G).
Star Ground atGround Lug

Section 1. Installation and Maintenance
1-8
A good earth (chassis) ground will minimize damage to the datalogger andsensors by providing a low resistance path around the system to a point of lowpotential. Campbell Scientific recommends that all dataloggers be earth(chassis) grounded. All components of the system (dataloggers, sensors,external power supplies, mounts, housings, etc.) should be referenced to onecommon earth (chassis) ground.
In the field, at a minimum, a proper earth ground will consist of a 6 to 8 footcopper sheathed grounding rod driven into the earth and connected to theCR5000 Ground Lug with a 12 AWG wire. In low conductive substrates, suchas sand, very dry soil, ice, or rock, a single ground rod will probably notprovide an adequate earth ground. For these situations, consult the literatureon lightning protection or contact a qualified lightning protection consultant.An excellent source of information on lightning protection can be located viathe web at http://www.polyphaser.com.
In vehicle applications, the earth ground lug should be firmly attached to thevehicle chassis with 12 AWG wire or larger.
In laboratory applications, locating a stable earth ground is not always obvious.In older buildings, new cover plates on old AC sockets may indicate that asafety ground exists when in fact the socket is not grounded. If a safety grounddoes exist, it is good practice to verify that it carries no current. If the integrityof the AC power ground is in doubt, also ground the system through thebuildings, plumbing or another connection to earth ground.
1.7.2 Effect of Grounding on Measurements: Common ModeRange
The common mode range is the voltage range, relative to the CR5000 ground,within which both inputs of a differential measurement must lie in order for thedifferential measurement to be made correctly. Common mode range for theCR5000 is ±5.0 V. For example, if the high side of a differential input is at 2 Vand the low side is at 0.5 V relative to CR5000 ground, a measurement made onthe ±5.0 V range would indicate a signal of 1.5 V. However, if the high inputchanged to 6 V, the common mode range is exceeded and the measurement maybe in error.
Common mode range may be exceeded when the CR5000 is measuring theoutput from a sensor which has its own grounded power supply and the lowside of the signal is referenced to the sensors power supply ground. If theCR5000 ground and the sensor ground are at sufficiently different potentials,the signal will exceed the common mode range. To solve this problem, thesensor power ground and the CR5000 ground should be connected, creatingone ground for the system.
In a laboratory application, where more than one AC socket may be used topower various sensors, it is not safe to assume that the power grounds are at thesame potential. To be safe, the ground of all the AC sockets in use should betied together with a 12 AWG wire.

Section 1. Installation and Maintenance
1-9
1.7.3 Effect of Grounding on Single-Ended MeasurementsLow-level single-ended voltage measurements can be problematic because ofground potential fluctuations. The grounding scheme in the CR5000 has beendesigned to eliminate ground potential fluctuations due to changing returncurrents from 12 V, SW-12, 5 V, and the control ports. This is accomplishedby utilizing separate signal grounds ( ) and power grounds (G). To takeadvantage of this design, observe the following grounding rule:
Always connect a device’s ground next to the active terminalassociated with that ground.
Examples:
1. Connect 5 Volt, 12 Volt, and control grounds to G terminals.
2. Connect excitation grounds to the closest terminal on the excitationterminal block.
3. Connect the low side of single-ended sensors to the nearest terminal onthe analog input terminal blocks.
4. Connect shield wires to the nearest terminal on the analog inputterminal blocks.
If offset problems occur because of shield or ground leads with large current
flow, tying the problem leads into the terminals next to the excitation, CAO,and pulse-counter channels should help. Problem leads can also be tieddirectly to the ground lug to minimize induced single-ended offset voltages.
1.8 Powering Sensors and PeripheralsThe CR5000 is a convenient source of power for sensors and peripheralsrequiring a continuous or semi-continuous 5 VDC or 12 VDC source. TheCR5000 has 2 continuous 12 Volt (12V) supply terminals, 2 switched 12 Volt(SW-12) supply terminals, and 2 continuous 5 Volt (5V) supply terminals.Voltage on the 12V and SW-12 terminals will change with the CR5000 supplyvoltage. The 5V terminal is regulated and will always remain near 5 Volts(±4%)so long as the CR5000 supply voltage remains above 11 Volts. The 5Vterminal is not suitable for resistive bridge sensor excitation. Table 1.8-1shows the current limits of the 12 Volt and 5 Volt ports. Table 1.8-2 showscurrent requirements for several CSI peripherals. Other devices normally havecurrent requirements listed in their specifications. Current drain of allperipherals and sensors combined should not exceed current sourcing limits ofthe CR5000.
NOTE

Section 1. Installation and Maintenance
1-10
Table 1.8-1 Current Sourcing Limits
Terminals Current Source Limit
SW12 < 900 mA @ 20°C< 729 mA @ 40°C< 630 mA @ 50°C< 567 mA @ 60°C< 400 mA @ 80°C
12V + SW12 < 1.85 A @ 20°C< 1.50 A @ 40°C< 1.30 A @ 50°C< 1.17 A @ 60°C< 0.85 A @ 80°C
5V + CSI/O < 200 mA
Make certain that the primary source of power for the CR5000 can sustain thecurrent drain for the period of time required. Contact a CSI applicationsengineer for help in determining a power budget for applications that approachthe limits of a given power supply’s capabilities. Be particularly cautiousabout any application using solar panels and cellular telephone or radio,applications requiring long periods of time between site visits, or applicationsat extreme temperatures.
TABLE 1.8-2. Typical Current Drain for Some CR5000 Peripherals
Typical Current Drain (mA)Peripheral Quiescent Active
AM25T .5 1COM100 .5 1.8COM200 Phone Modem 0.0012 140SDM-INT8 0.4 6.5
1.9 Controlling Power to Sensors and PeripheralsControlling power to an external device is a common function of the CR5000.
Many devices can conveniently be controlled with the SW-12 (Switched 12Volt) terminals on the CR5000. Table 1.8-1 shows the current available fromSW-12 port.
Applications requiring more control channels or greater power sourcingcapacity can usually be satisfied with the use of Campbell Scientific’sA21REL-12 Four Channel Relay Driver, A6REL-12 Six Channel RelayDriver, SDM-CD16AC 16 Channel AC/DC Relay Module, or by using thecontrol (C1-C8) ports as described in Section 1.9.1

Section 1. Installation and Maintenance
1-11
1.9.1 Use of Digital I/O Ports for Switching RelaysEach of the eight digital I/O ports can be configured as an output port and setlow or high (0 V low, 5 V high) using the PortSet or WriteIO instructions. Adigital output port is normally used to operate an external relay driver circuitbecause the port itself has a limited drive capability (2.0 mA minimum at 3.5V).
Figure 1.9-1 shows a typical relay driver circuit in conjunction with a coildriven relay which may be used to switch external power to some device. Inthis example, when the control port is set high, 12 V from the datalogger passesthrough the relay coil, closing the relay which completes the power circuit to afan, turning the fan on.
In other applications it may be desirable to simply switch power to a devicewithout going through a relay. Figure 1.9-2 illustrates a circuit for switchingexternal power to a device without going through a relay. If the peripheral to bepowered draws in excess of 75 mA at room temperature (limit of the 2N2907Amedium power transistor), the use of a relay (Figure 1.9-1) would be required.
Other control port activated circuits are possible for applications with greatercurrent/voltage demands than shown in Figures 1.9-1 and 2. For moreinformation contact a Campbell Scientific applications engineer.
FIGURE 1.9-1. Relay Driver Circuit with Relay

Section 1. Installation and Maintenance
1-12
FIGURE 1.9-2. Power Switching without Relay
1.10 MaintenanceThe CR5000 power supplies require a minimum of routine maintenance.
When not in use, the rechargeable supply should be stored in a cool, dryenvironment with the AC charger active.
1.10.1 DesiccantThe CR5000 is shipped with desiccant to reduce humidity. Desiccant shouldbe changed periodically. To prevent corrosion in uncontrolled or condensingatmospheres, the CR5000 must be placed inside a weather tight instrumentenclosure with desiccant. Do not completely seal the enclosure if lead acidbatteries are present. Hydrogen gas generated by the batteries may build up toan explosive concentration.
1.10.2 Replacing the Internal Battery
Misuse of the lithium battery or installing it improperly cancause severe injury. Fire, explosion, and severe burnhazard! Do not recharge, disassemble, heat above 100°C(212°F), solder directly to the cell, incinerate, nor exposecontents to water.
The CR5000 contains a lithium battery that operates the clock and SRAMwhen the CR5000 is not powered. The CR5000 does not draw any power fromthe lithium battery while it is powered by a 12 VDC supply. In a CR5000stored at room temperature, the lithium battery should last approximately 10years (less at temperature extremes). Where the CR5000 is powered most orall of the time the lithium cell should last much longer.
CAUTION
Section 1. Installation and Maintenance
1-13
While powered from an external source, the CR5000 measures the voltage ofthe lithium battery daily. This voltage is displayed in the status table (Section1.6) A new battery will have approximately 3.6 volts. The CR5000 StatusTable has a “ Lithium Battery” field. This field is either “ True” (battery isgood) or “ False” (replace battery). If the lithium cell is removed or allowed todischarge below the safe level, the CR5000 will still operate correctly whilepowered. Without the lithium battery, the clock will reset and data will be lostwhen power is removed.
A replacement lithium battery can be purchased from Campbell (part number13497). Table 1.10-1 lists the specifications of the battery.
Table 1.10-1 CR5000 Lithium Battery Specifications
Model Tadiran TL-5955 (3.6 V)
Capacity 1650 mAhself discharge rate 1%/year @ 20°CDiameter 14.5 mmLength 33.5 mmOperating temperature range -55°C to 85°C
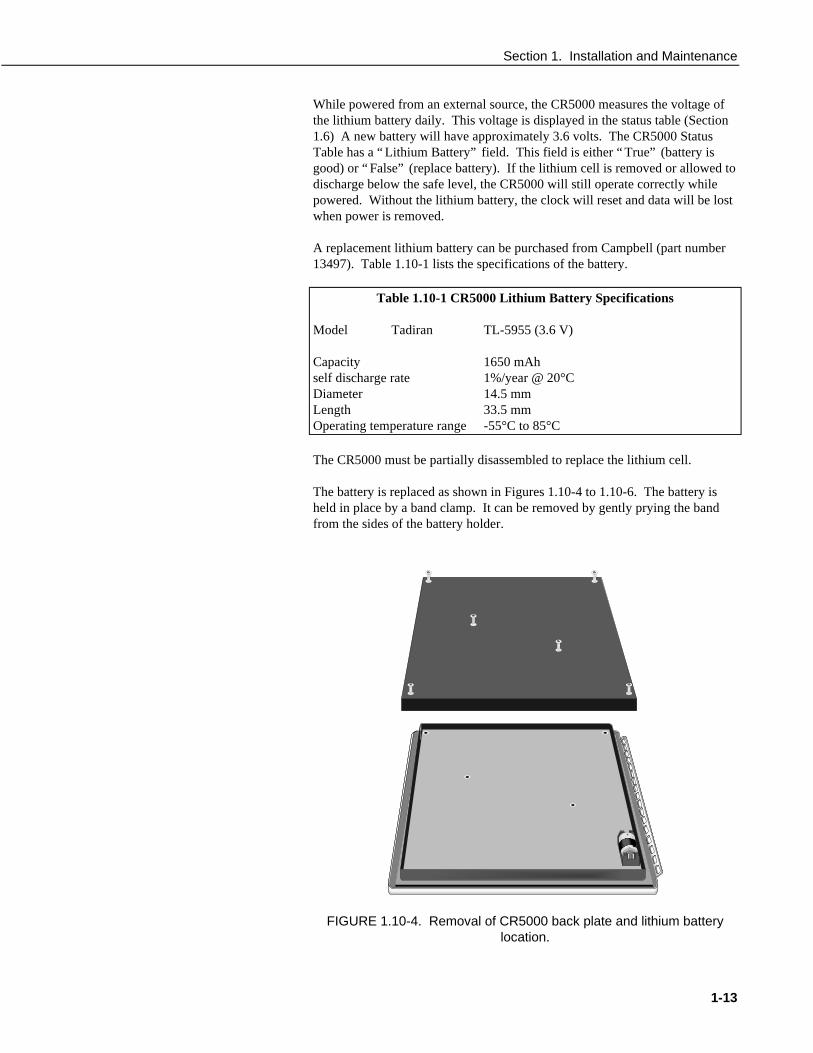
The CR5000 must be partially disassembled to replace the lithium cell.
The battery is replaced as shown in Figures 1.10-4 to 1.10-6. The battery isheld in place by a band clamp. It can be removed by gently prying the bandfrom the sides of the battery holder.
SANYO
FIGURE 1.10-4. Removal of CR5000 back plate and lithium batterylocation.

Section 1. Installation and Maintenance
1-14
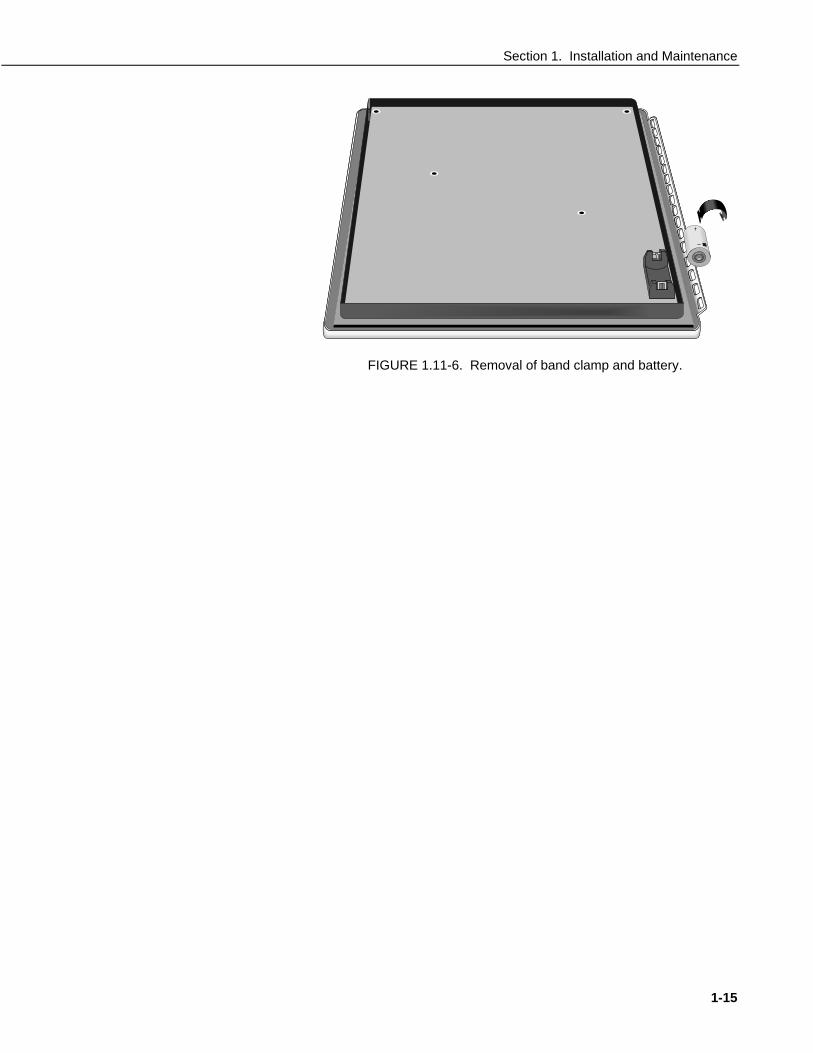
The new cell is placed into the battery holder, observing the polarity markingson the holder. Replace the band clamp, ensuring that both ends snap securelyinto the battery holder.
BATTERY2(datalogger/cr5000)
SANYO
FIGURE 1.10-5. Loosening of band clamp.
Section 1. Installation and Maintenance
1-15
SANYO
FIGURE 1.11-6. Removal of band clamp and battery.

Section 1. Installation and Maintenance
1-16
This is a blank page.
2-1
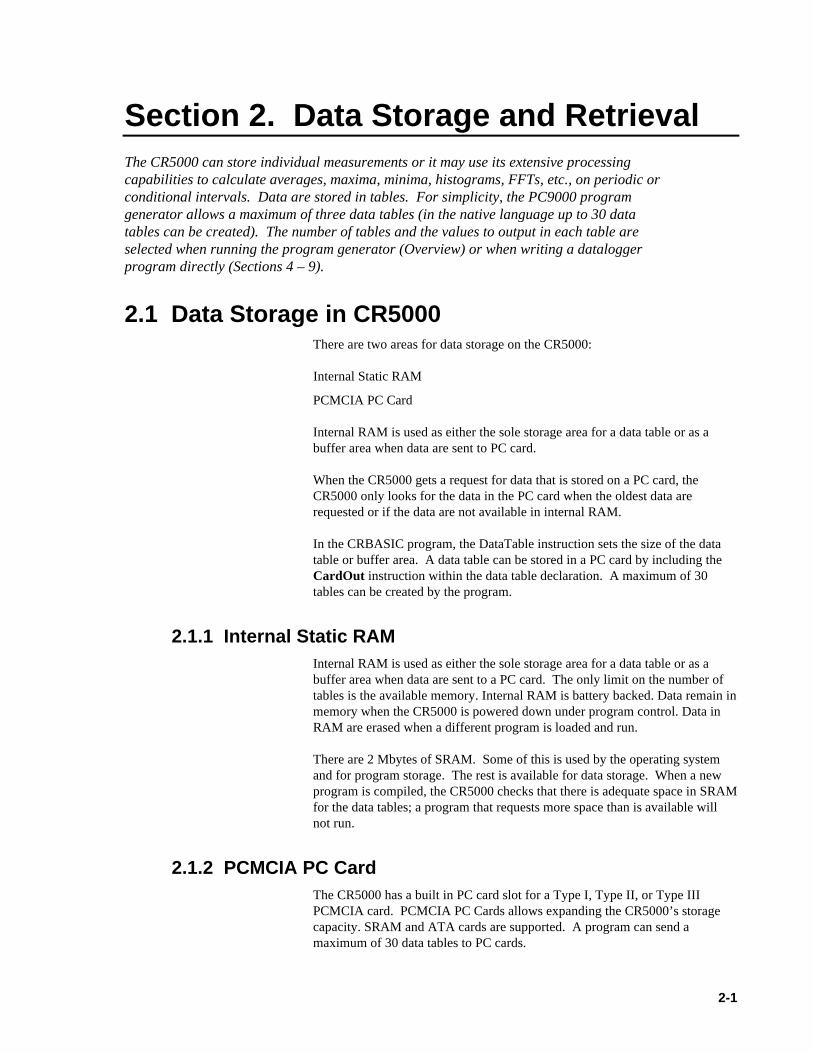
Section 2. Data Storage and RetrievalThe CR5000 can store individual measurements or it may use its extensive processingcapabilities to calculate averages, maxima, minima, histograms, FFTs, etc., on periodic orconditional intervals. Data are stored in tables. For simplicity, the PC9000 programgenerator allows a maximum of three data tables (in the native language up to 30 datatables can be created). The number of tables and the values to output in each table areselected when running the program generator (Overview) or when writing a dataloggerprogram directly (Sections 4 – 9).
2.1 Data Storage in CR5000There are two areas for data storage on the CR5000:
Internal Static RAM
PCMCIA PC Card
Internal RAM is used as either the sole storage area for a data table or as abuffer area when data are sent to PC card.
When the CR5000 gets a request for data that is stored on a PC card, theCR5000 only looks for the data in the PC card when the oldest data arerequested or if the data are not available in internal RAM.
In the CRBASIC program, the DataTable instruction sets the size of the datatable or buffer area. A data table can be stored in a PC card by including theCardOut instruction within the data table declaration. A maximum of 30tables can be created by the program.
2.1.1 Internal Static RAMInternal RAM is used as either the sole storage area for a data table or as abuffer area when data are sent to a PC card. The only limit on the number oftables is the available memory. Internal RAM is battery backed. Data remain inmemory when the CR5000 is powered down under program control. Data inRAM are erased when a different program is loaded and run.
There are 2 Mbytes of SRAM. Some of this is used by the operating systemand for program storage. The rest is available for data storage. When a newprogram is compiled, the CR5000 checks that there is adequate space in SRAMfor the data tables; a program that requests more space than is available willnot run.
2.1.2 PCMCIA PC CardThe CR5000 has a built in PC card slot for a Type I, Type II, or Type IIIPCMCIA card. PCMCIA PC Cards allows expanding the CR5000’s storagecapacity. SRAM and ATA cards are supported. A program can send amaximum of 30 data tables to PC cards.
Section 2. Data Storage and Retrieval
2-2
When a new program is compiled that sends data to the PC card, the CR5000checks if a card is present and if the card has adequate space for the datatables. If the card has adequate space, the tables will be allocated and theCR5000 will start storing data to them. If there is no card or if there is notenough space, the CR5000 will warn that the card is not being used and willrun the program, storing the data in SRAM only. When a card with enoughavailable memory is inserted the CR5000 will create the data tables on the cardand store the data that is accumulated in SRAM (Section 2.3.4).
Data stored on cards can be retrieved through the communication link to theCR5000 or by removing the card and inserting it in a PC card slot in acomputer. The PCMCIA interface is much faster than the communication link.With large files transferring the PC card is faster than collecting the data overthe link.
The CR5000 uses an MS DOS format for the PC cards. Cards can beformatted in a PC or in the CR5000.
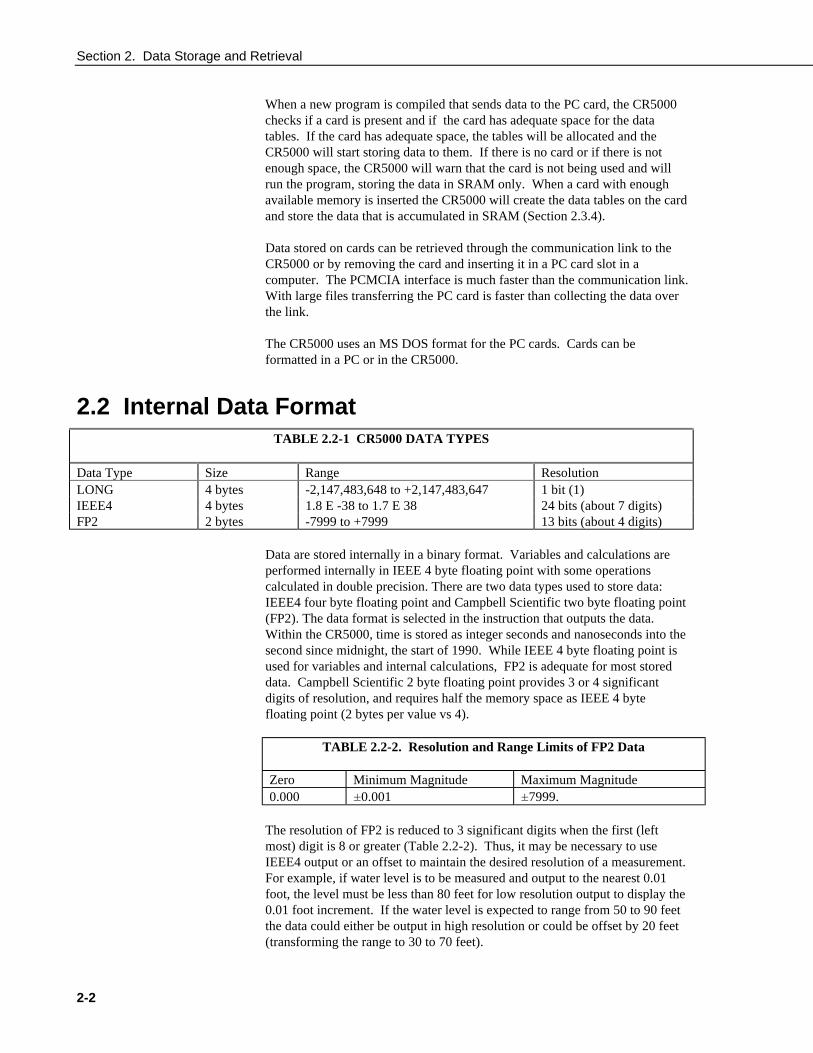
2.2 Internal Data FormatTABLE 2.2-1 CR5000 DATA TYPES
Data Type Size Range ResolutionLONG 4 bytes -2,147,483,648 to +2,147,483,647 1 bit (1)IEEE4 4 bytes 1.8 E -38 to 1.7 E 38 24 bits (about 7 digits)FP2 2 bytes -7999 to +7999 13 bits (about 4 digits)
Data are stored internally in a binary format. Variables and calculations areperformed internally in IEEE 4 byte floating point with some operationscalculated in double precision. There are two data types used to store data:IEEE4 four byte floating point and Campbell Scientific two byte floating point(FP2). The data format is selected in the instruction that outputs the data.Within the CR5000, time is stored as integer seconds and nanoseconds into thesecond since midnight, the start of 1990. While IEEE 4 byte floating point isused for variables and internal calculations, FP2 is adequate for most storeddata. Campbell Scientific 2 byte floating point provides 3 or 4 significantdigits of resolution, and requires half the memory space as IEEE 4 bytefloating point (2 bytes per value vs 4).
TABLE 2.2-2. Resolution and Range Limits of FP2 Data
Zero Minimum Magnitude Maximum Magnitude0.000 ±0.001 ±7999.
The resolution of FP2 is reduced to 3 significant digits when the first (leftmost) digit is 8 or greater (Table 2.2-2). Thus, it may be necessary to useIEEE4 output or an offset to maintain the desired resolution of a measurement.For example, if water level is to be measured and output to the nearest 0.01foot, the level must be less than 80 feet for low resolution output to display the0.01 foot increment. If the water level is expected to range from 50 to 90 feetthe data could either be output in high resolution or could be offset by 20 feet(transforming the range to 30 to 70 feet).
Section 2. Data Storage and Retrieval
2-3
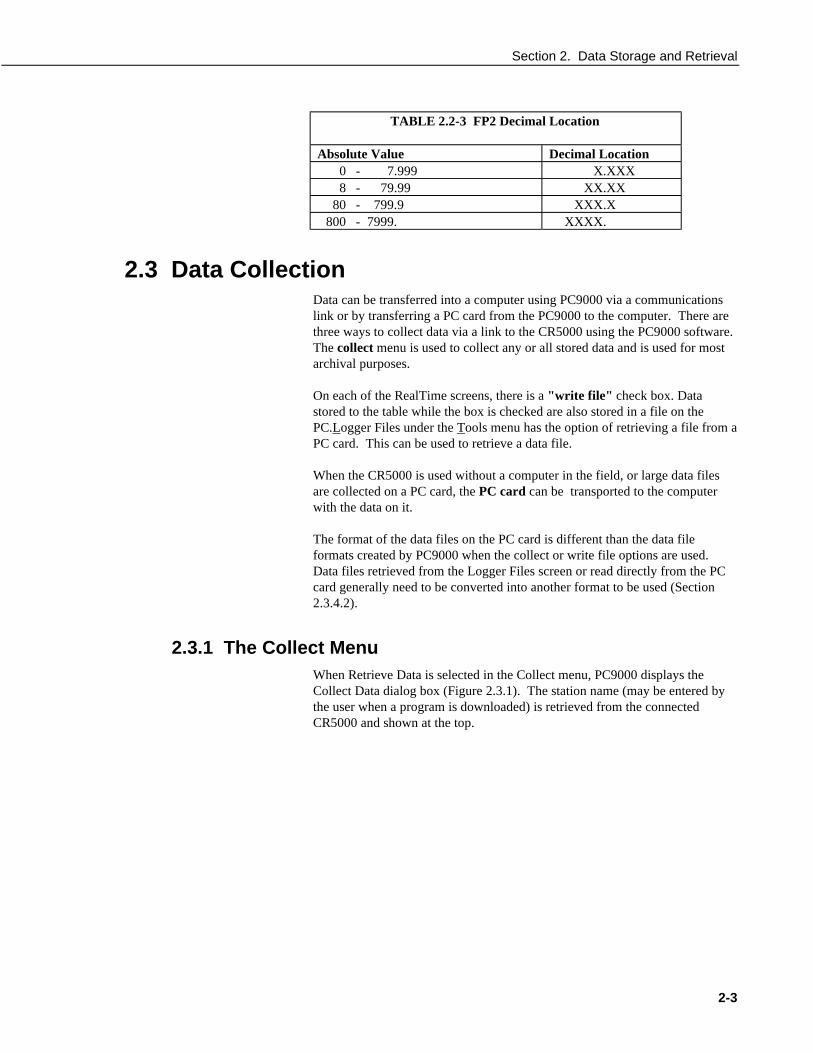
TABLE 2.2-3 FP2 Decimal Location
Absolute Value Decimal Location0 - 7.999 X.XXX8 - 79.99 XX.XX
80 - 799.9 XXX.X800 - 7999. XXXX.
2.3 Data CollectionData can be transferred into a computer using PC9000 via a communicationslink or by transferring a PC card from the PC9000 to the computer. There arethree ways to collect data via a link to the CR5000 using the PC9000 software.The collect menu is used to collect any or all stored data and is used for mostarchival purposes.
On each of the RealTime screens, there is a "write file" check box. Datastored to the table while the box is checked are also stored in a file on thePC.Logger Files under the Tools menu has the option of retrieving a file from aPC card. This can be used to retrieve a data file.
When the CR5000 is used without a computer in the field, or large data filesare collected on a PC card, the PC card can be transported to the computerwith the data on it.
The format of the data files on the PC card is different than the data fileformats created by PC9000 when the collect or write file options are used.Data files retrieved from the Logger Files screen or read directly from the PCcard generally need to be converted into another format to be used (Section2.3.4.2).
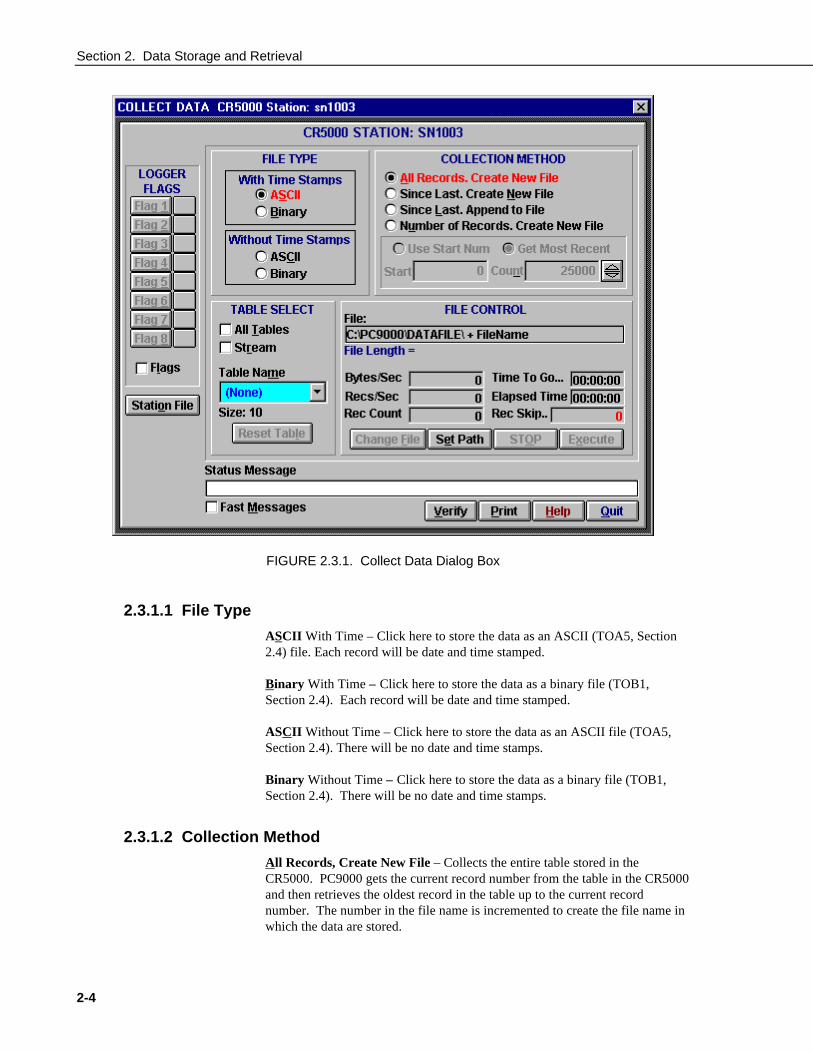
2.3.1 The Collect MenuWhen Retrieve Data is selected in the Collect menu, PC9000 displays theCollect Data dialog box (Figure 2.3.1). The station name (may be entered bythe user when a program is downloaded) is retrieved from the connectedCR5000 and shown at the top.
Section 2. Data Storage and Retrieval
2-4
FIGURE 2.3.1. Collect Data Dialog Box
2.3.1.1 File Type
ASCII With Time – Click here to store the data as an ASCII (TOA5, Section2.4) file. Each record will be date and time stamped.
Binary With Time – Click here to store the data as a binary file (TOB1,Section 2.4). Each record will be date and time stamped.
ASCII Without Time – Click here to store the data as an ASCII file (TOA5,Section 2.4). There will be no date and time stamps.
Binary Without Time – Click here to store the data as a binary file (TOB1,Section 2.4). There will be no date and time stamps.
2.3.1.2 Collection Method
All Records, Create New File – Collects the entire table stored in theCR5000. PC9000 gets the current record number from the table in the CR5000and then retrieves the oldest record in the table up to the current recordnumber. The number in the file name is incremented to create the file name inwhich the data are stored.

Section 2. Data Storage and Retrieval
2-5
Since Last, Create New File – Click here to save new data in a new file.PC9000 searches for the last file with the Root name, gets the last recordnumber from that file, then the current record from the table in the CR5000,and requests all records in between those numbers from the CR5000. Thenumber in the file name is incremented to create the file name in which thedata are stored.
Since Last, Append To File – Click here to append retrieved data to the endof the named file. PC9000 searches for the last file with the Root name, getsthe last record number from that file, then the current record from the table inthe CR5000, and requests all records in between those numbers from theCR5000. The data are appended to the existing file.
Number of Records, Create New File Collects the number of records enteredin Num of Recs box. Retrieves that many records back from the current recordnumber. The number in the file name is incremented to create the file name inwhich the data are stored.
Num of Recs – Enabled when Number of Records, Create New File ischecked. Enter the number of records back from the current record number toretrieve.
2.3.1.3 Table Selection
All Tables – When the All Tables box is checked, all data tables except thePublic and Status tables are collected when collection is executed. The datafrom each table are stored in a file with the table name and increment number(see Table naming). This is a convenient method of collecting all data fromthe CR5000. The first time data are collected, all data is checked and the filetype and collection method are selected. PC9000 remembers the settings, andon subsequent collections the operator only needs to click on execute.
Stream – acts the same as Write file for the selected Table Name (Section2.3.2).
Table Name – When "All tables" is not checked, a single data table can beselected for collection. The Table Name box is used to select the table to beretrieved.
Reset Table – Resetting a data table erases all data in the table and sets therecord number back to 0. Unless the table is configured as fill and stop by theCR5000 program, it is not necessary to reset the table because the "Since Last"collection option can be used to get only the new data. If the table isconfigured as fill and stop, it stops collecting data once full and must be resetbefore more data can be collected. Use with caution.
2.3.1.4 File Control
The default naming for a file stored to disk is to use the data table nameappended with a 2 digit number and the extension .DAT. If the table name islonger than 6 characters, it is truncated. For example, the table name EVENTSis stored as EVENTS00.DAT. A table named CYLTEMP is stored asCYLTEM00.DAT.
Section 2. Data Storage and Retrieval
2-6
When the file collection options that create a new file are used, each time atable is collected, the 2 digit number is incremented (e.g., EVENTS00.DAT,EVENTS01.DAT, EVENTS03.DAT ...). PC9000 searches the selecteddirectory and adds 1 to the number of the highest numbered file of thematching name to create the new name.
When the new data are to be appended to the existing file, PC9000 searches theselected directory for the highest numbered file of the matching name, andappends the data to that file.
Change File – Press the Change File button to change the name of the file tobe stored on disk. This is not possible when "All Tables" is selected.
Set Path – Press here to select a different disk or directory to write the files to.
EXECUTE – Press here to begin collecting data.
2.3.1.5 Status Messages
TABLE SIZE – Shows the size (in records) of the table highlighted in theTable Name box above.
COLLECTION RANGE – Displays the range of records to be collected.More records than the last number in this range may actually be retrieved.
LOGGER MESSAGE – Displays messages from the CR5000.
2.3.2 RealTime Write FileThis feature is provided to allow the user to start and stop collecting data forsome event without leaving the real-time window. Check this box to write thecurrent table to a file in the computer. Writing begins with the current recordand continues until the Write File box is unchecked or until the window isclosed.
This collection method requires that the PC is connected to the CR5000 whilethe data are collected. Because the beginning and end points of the data fileare roughly determined by when the box is checked, this is best suited tocollecting data when the user rather than the measurements determine whendata should be collected.
The bottom line of the screen will periodically display the current record beingwritten. The name of the file written will be the first six characters of the tablename plus 2 digits and an extension of .DAT. If the table name is MAIN thenthe first file created will be named MAIN00.DAT. The next file will be namedMAIN01.DAT and so on. It takes a little time to open the file so be sure it isopened in advance of the event you want to store.
The file is written to every 1 second so it is important the table size be largeenough to store sufficient data between writes. During each write operation,the data may not be updated on the screen but this will not effect the storeddata.
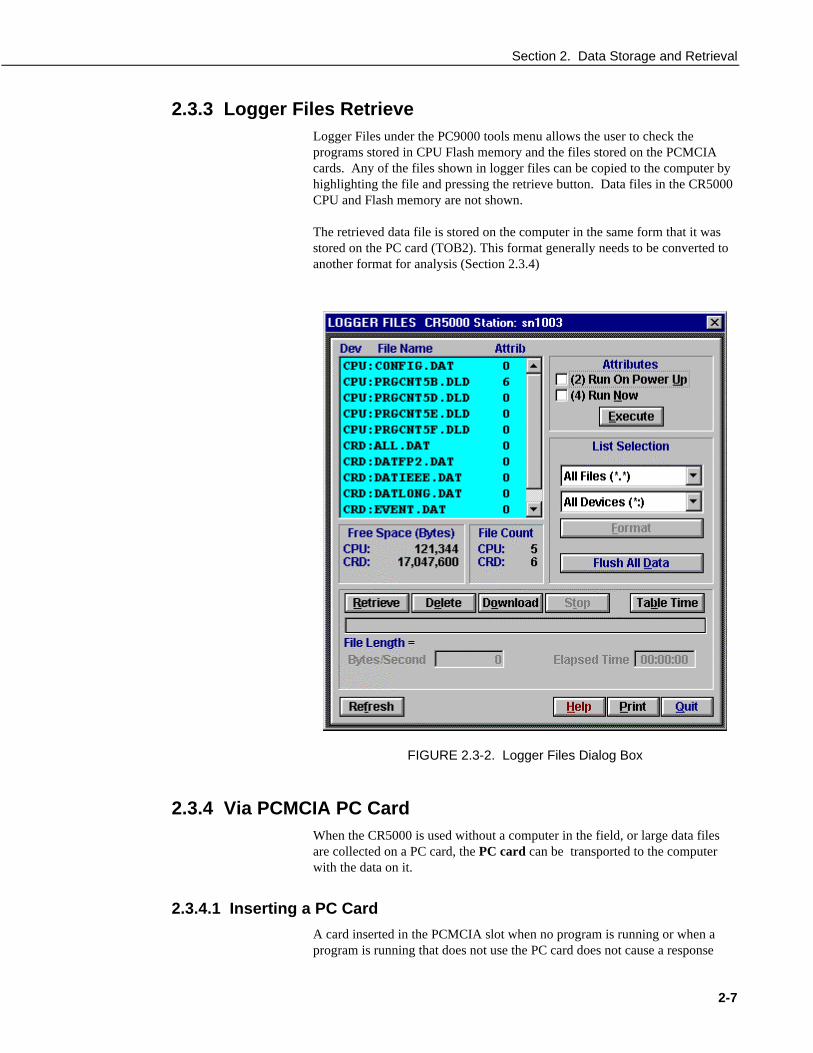
Section 2. Data Storage and Retrieval
2-7
2.3.3 Logger Files RetrieveLogger Files under the PC9000 tools menu allows the user to check theprograms stored in CPU Flash memory and the files stored on the PCMCIAcards. Any of the files shown in logger files can be copied to the computer byhighlighting the file and pressing the retrieve button. Data files in the CR5000CPU and Flash memory are not shown.
The retrieved data file is stored on the computer in the same form that it wasstored on the PC card (TOB2). This format generally needs to be converted toanother format for analysis (Section 2.3.4)
FIGURE 2.3-2. Logger Files Dialog Box
2.3.4 Via PCMCIA PC CardWhen the CR5000 is used without a computer in the field, or large data filesare collected on a PC card, the PC card can be transported to the computerwith the data on it.
2.3.4.1 Inserting a PC Card
A card inserted in the PCMCIA slot when no program is running or when aprogram is running that does not use the PC card does not cause a response

Section 2. Data Storage and Retrieval
2-8
from the CR5000. When a new program is compiled that sends data to the PCcard, the CR5000 checks if a card is present and if the card has adequate spacefor the data tables. If the card has adequate space, the tables will be allocatedand the CR5000 will start storing data to them.
When the running program sends data to the card, and a card is inserted, theCR5000 will detect the card and display a message.
A card that has no data tables files with the same names as those created by theprogram causes the message:
New Card. Start Storing?NoYes
If the card has existing data table files that match those created by the programthere is the message:
Tables on Card Must be Reset. Proceed?NoYesSame Card
The “ No” option [do not start storing data to the card] allows using theCR5000 to check the card and to erase files or to format the card if necessary.
The “ Yes” option is to start storing data right away, resetting any tables withthe same name that exist on the card. This is the option that is generally usedwhen a blank (but formatted) card is inserted or when a card is reinserted aftertransferring data to a computer.
The “ Same Card” option is only available if the data table header matches theprogram exactly and the program has already run with a card. This optionallows removing the card to read it and then returning it to the CR5000 andhaving the new data appended to the data already on the card. If you choose touse this option be aware that if the CR5000 overwrites its buffer while the cardis out, there will be a gap in the data on the card.
2.3.4.2 Removing Card from CR5000
The PC Card Status LED just above the PC card door is lit when the card isbeing written to.
Removing a card while it is active can cause garbled dataand can actually damage the card. Do not switch off thepower while the cards are present and active.
To remove a card, use the keyboard display to go to the PcCard menu; movethe cursor to “ Remove Card: and press Enter. The Status will show “ You maynow remove the card” . Remove the card. The card will be reactivated if notremoved.
CAUTION

Section 2. Data Storage and Retrieval
2-9
When the PC card is inserted in a computer, the data files can be copied toanother drive or used directly from the PC card just as one would from anyother disk. In most cases, however, it will be necessary to convert the fileformat before using the data.
2.3.4.3 Converting File Format
The CR5000 stores data on the PC card in TOB2 Format. TOB2 is a binaryformat that incorporates features to improve reliability of the PC Cards. TOB2allows the accurate determination of each record’s time without the spacerequired for individual time stamps.
When TOB2 files are converted to another format, the number of records maybe greater or less than the number requested in the data table declaration.There are always at least two additional frames of data allocated. When thefile is converted these will result in additional records if no lapses occurred. Ifmore lapses occur than were anticipated, there may be fewer records in the filethan were allocated.
PC9000’s file converter will convert TOB1 or TOB2 files to other formats.The Convert Data Files option is in the File Menu. The options for TOB2appear after the name of the file to convert has been selected (Figure 2.3-3.)
FIGURE 2.3-3 File Conversion Dialog Box
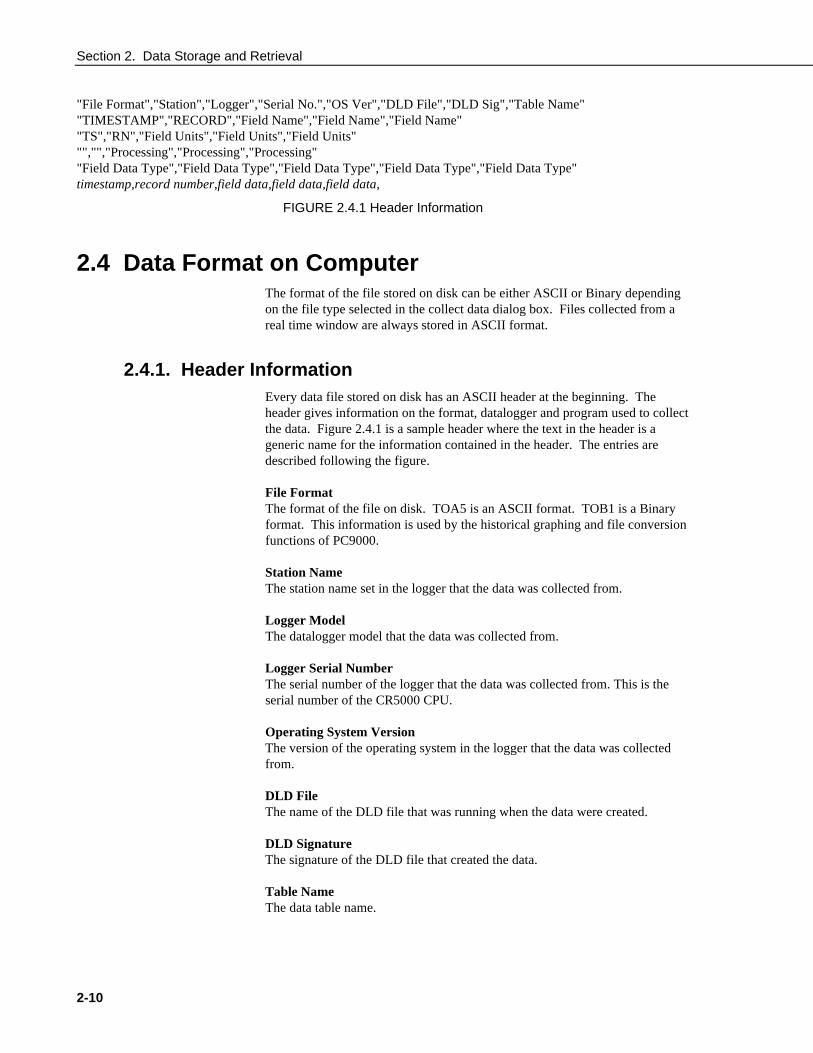
Section 2. Data Storage and Retrieval
2-10
"File Format","Station","Logger","Serial No.","OS Ver","DLD File","DLD Sig","Table Name""TIMESTAMP","RECORD","Field Name","Field Name","Field Name""TS","RN","Field Units","Field Units","Field Units""","","Processing","Processing","Processing""Field Data Type","Field Data Type","Field Data Type","Field Data Type","Field Data Type"timestamp,record number,field data,field data,field data,
FIGURE 2.4.1 Header Information
2.4 Data Format on ComputerThe format of the file stored on disk can be either ASCII or Binary dependingon the file type selected in the collect data dialog box. Files collected from areal time window are always stored in ASCII format.
2.4.1. Header InformationEvery data file stored on disk has an ASCII header at the beginning. Theheader gives information on the format, datalogger and program used to collectthe data. Figure 2.4.1 is a sample header where the text in the header is ageneric name for the information contained in the header. The entries aredescribed following the figure.
File FormatThe format of the file on disk. TOA5 is an ASCII format. TOB1 is a Binaryformat. This information is used by the historical graphing and file conversionfunctions of PC9000.
Station NameThe station name set in the logger that the data was collected from.
Logger ModelThe datalogger model that the data was collected from.
Logger Serial NumberThe serial number of the logger that the data was collected from. This is theserial number of the CR5000 CPU.
Operating System VersionThe version of the operating system in the logger that the data was collectedfrom.
DLD FileThe name of the DLD file that was running when the data were created.
DLD SignatureThe signature of the DLD file that created the data.
Table NameThe data table name.

Section 2. Data Storage and Retrieval
2-11
Field NameThe name of the field in the data table. This name is created by the CR5000 byappending underscore ( _ ) and a three character mnemonic for the outputprocessing.
Field UnitsThe units for the field in the data table. Units are assigned in the program withthe units declaration.
Field ProcessingThe output processing that was used when the field was stored.
Smp = Sample
Max = Maximum
Min = Minimum
Avg = Average
Field Data TypeThis header line is only in TOB1 binary format and identifies the data type foreach of the fields in the data table.
UINT4 = Unsigned 4 byte integer
IEEE4 = 4 byte floating point
Time StampThis field is the date and time stamp for this record. It indicates the time,according to the logger clock, that each record was stored.
Record NumberThis field is the record number of this record. The number will increase up to2E32 and then start over with zero. The record number will also start over atzero if the table is reset.
Field DataThis is the data for each of the fields in the record.
2.4.2 TOA5 ASCII File FormatThe following is a sample of a file collected as ASCII with time stamps.
"TOA5","Bob's9K","CR5000","1048575","1.00","EXPLDAT.DLD","4339","Temp""TIMESTAMP","RECORD","RefTemp_Avg","TC_Avg(1)","TC_Avg(2)","TC_Avg(3)","TC_Avg(4)""TS","RN","degC","degC","degC","degC","degC""","","Avg","Avg","Avg","Avg","Avg""1995-09-19 14:31:43.84",458,29.94,25.6,25.36,25.48,25.4"1995-09-19 14:31:43.85",459,29.93,25.6,25.36,25.41,25.35
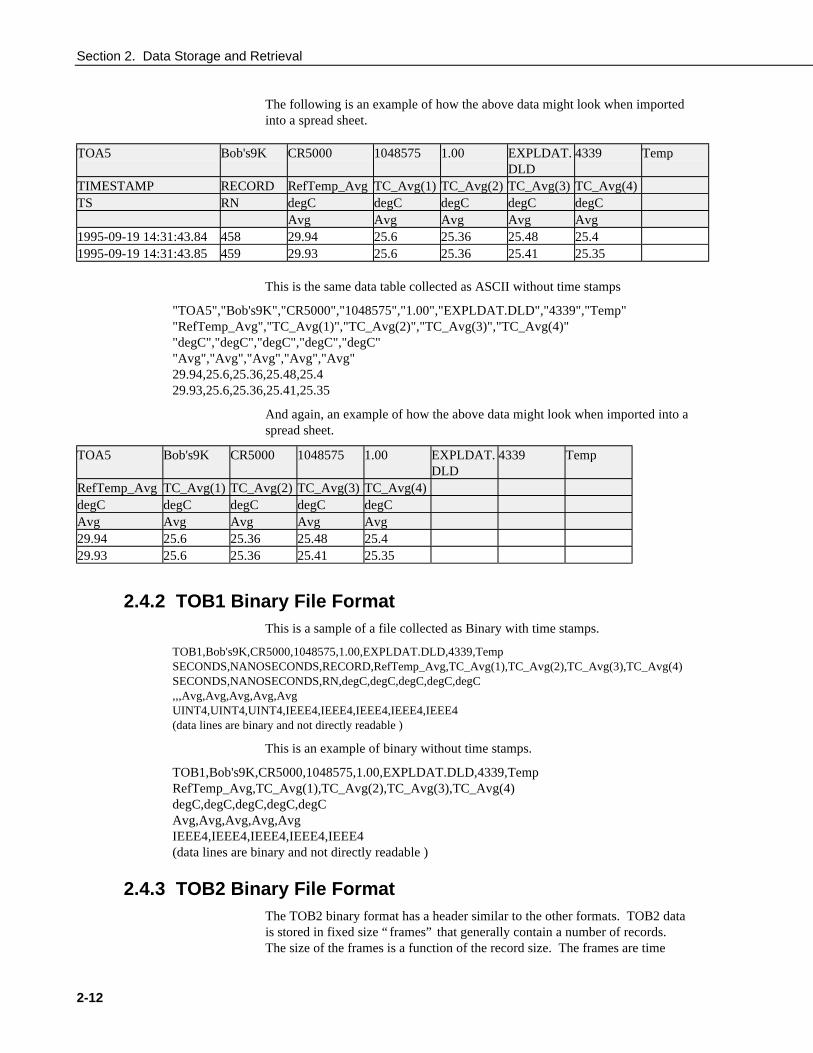
Section 2. Data Storage and Retrieval
2-12
The following is an example of how the above data might look when importedinto a spread sheet.
TOA5 Bob's9K CR5000 1048575 1.00 EXPLDAT.DLD
4339 Temp
TIMESTAMP RECORD RefTemp_Avg TC_Avg(1) TC_Avg(2) TC_Avg(3) TC_Avg(4)TS RN degC degC degC degC degC
Avg Avg Avg Avg Avg1995-09-19 14:31:43.84 458 29.94 25.6 25.36 25.48 25.41995-09-19 14:31:43.85 459 29.93 25.6 25.36 25.41 25.35
This is the same data table collected as ASCII without time stamps
"TOA5","Bob's9K","CR5000","1048575","1.00","EXPLDAT.DLD","4339","Temp""RefTemp_Avg","TC_Avg(1)","TC_Avg(2)","TC_Avg(3)","TC_Avg(4)""degC","degC","degC","degC","degC""Avg","Avg","Avg","Avg","Avg"29.94,25.6,25.36,25.48,25.429.93,25.6,25.36,25.41,25.35
And again, an example of how the above data might look when imported into aspread sheet.
TOA5 Bob's9K CR5000 1048575 1.00 EXPLDAT.DLD
4339 Temp
RefTemp_Avg TC_Avg(1) TC_Avg(2) TC_Avg(3) TC_Avg(4)degC degC degC degC degCAvg Avg Avg Avg Avg29.94 25.6 25.36 25.48 25.429.93 25.6 25.36 25.41 25.35
2.4.2 TOB1 Binary File FormatThis is a sample of a file collected as Binary with time stamps.
TOB1,Bob's9K,CR5000,1048575,1.00,EXPLDAT.DLD,4339,TempSECONDS,NANOSECONDS,RECORD,RefTemp_Avg,TC_Avg(1),TC_Avg(2),TC_Avg(3),TC_Avg(4)SECONDS,NANOSECONDS,RN,degC,degC,degC,degC,degC,,,Avg,Avg,Avg,Avg,AvgUINT4,UINT4,UINT4,IEEE4,IEEE4,IEEE4,IEEE4,IEEE4(data lines are binary and not directly readable )
This is an example of binary without time stamps.
TOB1,Bob's9K,CR5000,1048575,1.00,EXPLDAT.DLD,4339,TempRefTemp_Avg,TC_Avg(1),TC_Avg(2),TC_Avg(3),TC_Avg(4)degC,degC,degC,degC,degCAvg,Avg,Avg,Avg,AvgIEEE4,IEEE4,IEEE4,IEEE4,IEEE4(data lines are binary and not directly readable )
2.4.3 TOB2 Binary File FormatThe TOB2 binary format has a header similar to the other formats. TOB2 datais stored in fixed size “ frames” that generally contain a number of records.The size of the frames is a function of the record size. The frames are time
Section 2. Data Storage and Retrieval
2-13
stamped, allowing the calculation of time stamps for their records. If there is alapse in periodic interval records that does not occur on a frame boundary, anadditional time stamp is written within the frame and its occurrence noted inthe frame boundary. This additional time stamp takes up space that wouldotherwise hold data.
When TOB2 files are converted to another format, the number of records maybe greater or less than the number requested in the data table declaration.There are always at least two additional frames of data allocated. When thefile is converted these will result in additional records if no lapses occurred. Ifmore lapses occur than were anticipated, there may be fewer records in the filethan were allocated.

Section 2. Data Storage and Retrieval
2-14
This is a blank page.
3-1
Section 3. CR5000 Measurement Details
3.1 Analog Voltage Measurement SequenceThe CR5000 measures analog voltages with either an integrate and hold or asample and hold analog to digital (A/D) conversion. The A/D conversion ismade with a 16 bit successive approximation technique which resolves thesignal voltage to approximately one part in 60,000 of the full scale range. Themaximum conversion rate is 5000 per second or one measurement every 200µs (10,000 measurements per second on a single channel).
The timing of CR5000 measurements is precisely controlled. The measurementschedule is determined at compile time and loaded into memory. This schedulesets interrupts that drive the measurement task.
Using two different voltage measurement instructions with the samevoltage range takes the same measurement time as using one instructionwith two repetitions. (This is not the case in the CR10X, 21X, CR23X andCR7 dataloggers where there is always a setup time for each instruction.)
There are four parameters in the measurement instructions that may vary thesequence and timing of the measurement. These are options to measure andcorrect the ground offset on single-ended measurements each timemeasurements are made (MeasOfs), reverse the high and low differentialinputs (RevDiff), to set the time to allow the signal to settle between switchingto a channel and making a measurement (SettlingTime), and the length of timeto integrate a measurement (Integ), and to reverse the polarity of excitationvoltage (RevEx).
3.1.1 Voltage RangeThe CR5000 has 5 fixed voltage ranges and autorange. The 16 bit A/D has aresolution of 1 part in 216 (65,536). To allow for some overrange capabilitiesthe A/D is applied to a range approximately 9% greater than the Full ScaleRange resulting in the 1 part in 60,000 resolution over the FSR. For example,on the ±20 mV range the full scale range is 40 mV [20 - (-20)] and theresolution is two thirds of a microvolt; 0.04 / 0.000000667 = 60,000. Thesmaller the voltage range, the better the absolute resolution. In general, ameasurement should use the smallest fixed voltage range that willaccommodate the full scale output of the sensor being measured. If the voltageexceeds the range, the CR5000 indicates the overrange by returning Not-A-Number (NAN) for the measurement.
For signals that do not fluctuate too rapidly, AutoRange allows the CR5000 toautomatically choose the voltage range to use. AutoRange causes the CR5000to make two measurements. The first measurement determines the range touse. It is made with no integration on the ±5000 mV range. The secondmeasurement is made on the appropriate range using the integration specifiedin the instruction. Both measurements use the settling time programmed in theinstruction. AutoRange optimizes resolution but takes longer than ameasurement on a fixed range, because of the two measurements required.

Section 3. CR5000 Measurement Details
3-2
An AutoRange measurement will return Not-A-Number if the voltage exceedsthe range picked by the first measurement. To avoid problems with a signal onthe edge of a range, AutoRange selects the next larger range when the signalexceeds 90% of a range.
AutoRange is very good for a signal that occasionally exceeds a particularrange, for example, a Type J thermocouple that most of the time will be lessthan 360 °C (±20 mV range) but will occasionally see temperatures as high as400 °C (±50 mV range, Table 3.4-2). AutoRange should not be used forrapidly fluctuating signals, particularly those whose signal traverses severalvoltage ranges rapidly because of the possibility that the signal could changeranges between the range check and the actual measurement.
3.1.2 Reversing Excitation or the Differential InputReversing the excitation polarity or the differential input are techniques tocancel voltage offsets that are not part of the signal. For example, if there is a+5 µV offset in the measurement circuitry, a 5 mV signal will be measured as5.005 mV. When the input is reversed, the measurement will be-4.995 mV. Subtracting the second measurement from the first and dividingby 2 gives the correct answer: 5.005-(-4.995)=10, 10/2=5. Most offsets arethermocouple effects caused by temperature gradients in the measurementcircuitry or wiring.
Reversing the excitation polarity cancels voltage offsets in the sensor, wiring,and measurement circuitry. One measurement is made with the excitationvoltage with the polarity programmed and a second measurement is made withthe polarity reversed. The excitation "on time" for each polarity is exactly thesame to ensure that ionic sensors do not polarize with repetitive measurements.
Reversing the inputs of a differential measurement cancels offsets in theCR5000 measurement circuitry and improves common-mode rejection. Onemeasurement is made with the high input referenced to the low input and asecond with the low referenced to the high.
3.1.3 Measuring Single-Ended OffsetThe single-ended offset is a voltage offset on a single-ended input. It ismeasured by internally switching the input to ground and measuring thevoltage. When a single-ended measurement is made this offset is corrected forin the calibration. The offset can either be measured automatically as part ofthe background calibration or as part of the measurement sequence each timethe measurement is made (adding to the time to make the measurement).When the offset is measured in the measurement sequence, the offset ismeasured once prior to completing all of the instruction reps.
The MeasOfs parameter in instructions that make single-ended voltagemeasurements is used to force the offset measurement. In most cases thebackground calibration is adequate. Additional accuracy can be gained bymaking the offset measurement with each measurement instruction when theoffset is changing rapidly as it would during when the CR5000 is undergoingrapid temperature swings.
Section 3. CR5000 Measurement Details
3-3
3.1.4 SettlingTimeWhen the CR5000 switches to a new channel or switches on the excitation fora bridge measurement, there is a finite amount of time required for the signal toreach its true value. Delaying between setting up a measurement (switching tothe channel, setting the excitation) and making the measurement allows thesignal to settle to the correct value. The default settling times are theminimum required for the CR5000 to settle to within its accuracyspecifications. Additional time is necessary when working with high sensorresistances or long lead lengths (higher capacitance). Using a longer settlingtime increases the time required for each measurement. Section 3.3 goes intomore detail on determining an adequate settling time.
When the CR5000 Reverses the differential input or the excitation polarity itdelays the same settling time after the reversal as it does before the firstmeasurement. Thus there are two delays per channel when either RevDiff orRevEx is used. If both RevDiff and RevEx are selected, there are fourmeasurement segments, positive and negative excitations with the inputs oneway and positive and negative excitations with the inputs reversed. TheCR5000 switches to the channel:
sets the excitation, delays, measures,reverses the excitation, delays, measures,reverses the excitation, reverses the inputs, delays, measures,reverses the excitation, delays, measures.
Thus there are four delays per channel measured. The CR5000 processes themeasurement segments into the single value it returns for the measurement.
3.1.5 IntegrationIntegration is used to reduce the noise included in a measurement. The CR5000may use a combination of analog and digital integration.
For the fastest measurements, there is a zero integration measurement. Thismeasurement does not integrate. The signal at a precise instant is sampled andthis voltage is held for A/D conversion.
With analog integration, the input signal is integrated for a precise period oftime. The integrated value is held for the A/D conversion. There are threepossible analog integration times 20 ms, 16.67 ms and 250 µs. The 20 ms(1/50 second) and 16.667 ms (1/60 second) are available to integrate out theeffects of noise from 50 or 60 Hz AC power sources.
An integration time in microseconds is specified as part of the measurementinstruction. An integration time of 0 selects the sample-and-hold, 250 selectsthe 250 µs integration, 16667 or “ _60 Hz” selects the 60 Hz rejection(16667 µs), and 20000 or “ _50 Hz” selects 50 Hz rejection (20000 µs).
In addition to the analog integrations, it is possible to average a number of thesample-and-hold or 250 µs integration measurements. The A/D conversionsare made as rapidly as possible: every 100 µs for the samples and every 500 µsfor the 250 µs integrations. If the integration time specified is 250 µs or a

Section 3. CR5000 Measurement Details
3-4
multiple of 500 µs, the CR5000 will repeat 250 µs integration measurementsevery 500 µs throughout the integration interval. If the integration timespecified is 100 µs or 200 µs, the CR5000 makes one or two samples in theintegration interval. The average of these measurements is stored as the resultof the measurement.
The random noise level is decreased by the square root of the number ofmeasurements made. For example, the input noise on the ±5000 mV rangewith one 250 µs integration is 120 µV RMS; entering 2000 µs for theintegration (four measurements) will cut this noise in half (120/(√4)=60).
The integration time specified in the measurement instruction is used for eachsegment of the measurement. Thus, if reversing the differential input orreversing the excitation is specified, there will be two integrations per channel;if both reversals are specified, there will be four integrations.
3.2 Single Ended and Differential VoltageMeasurements
A single-ended voltage measurement is made on a single input which ismeasured relative to ground. A differential measurement measures thedifference in voltage between two inputs.
There are two sets of channel numbers on the analog channels.Differential channels (1-20) have two inputs: high (H) and low(L). Either the high or low side of a differential channel can beused for a single ended measurement. The single-endedchannels are numbered 1-40.
Because a single ended measurement is referenced to CR5000 ground, anydifference in ground potential between the sensor and the CR5000 will result inan error in the measurement. For example, if the measuring junction of acopper-constantan thermocouple, being used to measure soil temperature, isnot insulated and the potential of earth ground is 1 mV greater at the sensorthan at the point where the CR5000 is grounded, the measured voltage wouldbe 1 mV greater than the thermocouple output, or approximately 25 oC high.Another instance where a ground potential difference creates a problem iswhere external signal conditioning circuitry is powered from the same sourceas the CR5000. Despite being tied to the same ground, differences in currentdrain and lead resistance result in different ground potential at the twoinstruments. For this reason, a differential measurement should be made on ananalog output from the external signal conditioner. Differential measurementsMUST be used when the inputs are known to be different from ground, such asthe output from a full bridge.
Common mode range
In order to make a differential measurement, the inputs must be within theCR5000 common mode range of ±5 V. The common mode range is thevoltage range, relative to CR5000 ground, within which both inputs of adifferential measurement must lie, in order for the differential measurement to
NOTE
Section 3. CR5000 Measurement Details
3-5
be made. For example, if the high side of a differential input is at 4 V and thelow side is at 3 V relative to CR5000 ground, there is no problem. Ameasurement made on the ±5000 mV range will return 1000 mV. However, ifthe high input is at 5.8 V and the low input is at 4.8 V, the measurement cannot be made because the high input is outside of the ±5 V common moderange (the CR5000 will indicate the overrange by returning not-a-number(NAN)).
Sensors that have a floating output or are not referenced to ground through aseparate connection may need to have one side of the differential inputconnected to ground to ensure the signal remains within the common moderange.
Problems with exceeding common mode range may be encountered when theCR5000 is used to read the output of external signal conditioning circuitry if agood ground connection does not exist between the external circuitry and theCR5000. When operating where AC power is available, it is not always safe toassume that a good ground connection exists through the AC wiring. If aCR5000 is used to measure the output from a laboratory instrument (bothplugged into AC power and referencing ground to outlet ground), it is best torun a ground wire between the CR5000 and the external circuitry. Even withthis ground connection, the ground potential of the two instruments may not beat exactly the same level, which is why a differential measurement is desired.
A differential measurement has the option of reversing the inputs to canceloffsets as described above.
Sustained voltages in excess of ±16 V will damage the CR5000circuitry.
3.3 Signal Settling TimeWhenever an analog input is switched into the CR5000 measurement circuitryprior to making a measurement, a finite amount of time is required for thesignal to stabilize at it's correct value. The rate at which the signal settles isdetermined by the input settling time constant which is a function of both thesource resistance and input capacitance.
The CR5000 delays after switching to a channel to allow the input to settlebefore initiating the measurement. The default delays used by the CR5000depend on the integration used and the voltage range. For the sample-and-hold, the default delay is 100 µs on the ±5000, ±1000, ±200, and ±50 mVranges and 200 µs on the ±20 mV range. The default delay is 200 µs for 250µs integrations and 3 ms for 50 Hz or 60 Hz rejection integrations. Thissettling time is the minimum required to allow the input to settle to theresolution specification.
Additional wire capacitance associated with long sensor leads can increase thesettling time constant to the point that measurement errors may occur. Thereare three potential sources of error which must settle before the measurement ismade:
NOTE

Section 3. CR5000 Measurement Details
3-6
1. The signal must rise to its correct value.
2. A small transient caused by switching the analog input into themeasurement circuitry must settle.
3. When a resistive bridge measurement is made using a switched excitationchannel, a larger transient caused when the excitation is switched mustsettle.
3.3.1 Minimizing Settling ErrorsWhen long lead lengths are mandatory, the following general practices can beused to minimize or measure settling errors:
1. DO NOT USE WIRE WITH PVC INSULATED CONDUCTORS. PVChas a high dielectric which extends input settling time.
2. Where possible run excitation leads and signal leads in separate shields tominimize transients.
3. When measurement speed is not a prime consideration, additional timecan be used to ensure ample settling time. The settling time required canbe measured with the CR5000.
3.3.2 Measuring the Necessary Settling TimeThe CR5000 can measure the time required for a particular sensor/cableconfiguration to settle. This is done by allowing the signal to settle theminimum amount of time and then making zero integration measurementsevery 100 µs. Looking at the series of measurements it is possible to see thesettling of the sensor signal. By counting the number of measurements beforethe signal settles the correct settling time can be determined (100 µs permeasurement plus an extra 100 µs if the measurement is made on the 20 mVrange where the default settling time is 200 µs).
This technique for measuring settling time can only be used withinstructions that measure only one voltage per repetition. Thesettling time to use with instructions that make more than onemeasurement can be determined with an instruction that usesonly one measurement. For example, for the BrFull6Wdetermine the settling time with BrFull; for BrHalf3W useBrHalf.
The following example demonstrates measuring the settling time for adifferential voltage measurement. If you are not yet familiar with CR5000programming, you may want to read Section 4 before trying to follow theexample.
The series of measurements on the sensor is made with one instruction.Measurement instructions have a repetitions parameter that allow oneinstruction to repeat the measurement on a number of channels. There is alsothe capability to repeat measurements on the same channel. When
NOTE
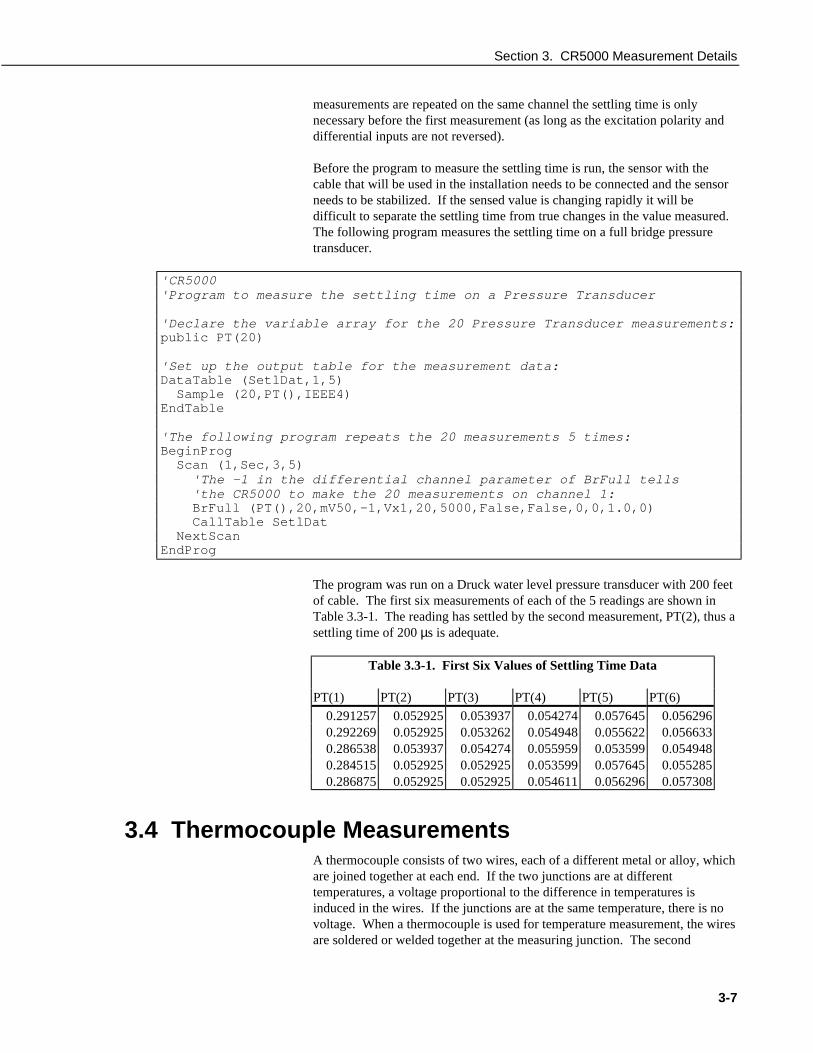
Section 3. CR5000 Measurement Details
3-7
measurements are repeated on the same channel the settling time is onlynecessary before the first measurement (as long as the excitation polarity anddifferential inputs are not reversed).
Before the program to measure the settling time is run, the sensor with thecable that will be used in the installation needs to be connected and the sensorneeds to be stabilized. If the sensed value is changing rapidly it will bedifficult to separate the settling time from true changes in the value measured.The following program measures the settling time on a full bridge pressuretransducer.
'CR5000'Program to measure the settling time on a Pressure Transducer
'Declare the variable array for the 20 Pressure Transducer measurements:public PT(20)
'Set up the output table for the measurement data:DataTable (SetlDat,1,5) Sample (20,PT(),IEEE4)EndTable
'The following program repeats the 20 measurements 5 times:BeginProg Scan (1,Sec,3,5) 'The -1 in the differential channel parameter of BrFull tells 'the CR5000 to make the 20 measurements on channel 1: BrFull (PT(),20,mV50,-1,Vx1,20,5000,False,False,0,0,1.0,0) CallTable SetlDat NextScanEndProg
The program was run on a Druck water level pressure transducer with 200 feetof cable. The first six measurements of each of the 5 readings are shown inTable 3.3-1. The reading has settled by the second measurement, PT(2), thus asettling time of 200 µs is adequate.
Table 3.3-1. First Six Values of Settling Time Data
PT(1) PT(2) PT(3) PT(4) PT(5) PT(6)
0.291257 0.052925 0.053937 0.054274 0.057645 0.0562960.292269 0.052925 0.053262 0.054948 0.055622 0.0566330.286538 0.053937 0.054274 0.055959 0.053599 0.0549480.284515 0.052925 0.052925 0.053599 0.057645 0.0552850.286875 0.052925 0.052925 0.054611 0.056296 0.057308
3.4 Thermocouple MeasurementsA thermocouple consists of two wires, each of a different metal or alloy, whichare joined together at each end. If the two junctions are at differenttemperatures, a voltage proportional to the difference in temperatures isinduced in the wires. If the junctions are at the same temperature, there is novoltage. When a thermocouple is used for temperature measurement, the wiresare soldered or welded together at the measuring junction. The second

Section 3. CR5000 Measurement Details
3-8
junction, which becomes the reference junction, is formed where the other endsof the wires are connected to the measuring device. (With the connectors atthe same temperature, the chemical dissimilarity between the thermocouplewire and the connector does not induce any voltage.) When the temperature ofthe reference junction is known, the temperature of the measuring junction canbe determined by measuring the thermocouple voltage and adding thecorresponding temperature difference to the reference temperature.
The CR5000 determines thermocouple temperatures using the followingsequence. First the temperature of the reference junction is measured andstored in °C. If the reference junction is the CR5000 analog input terminals,the temperature is measured with the built in thermistor (PanelTempinstruction). The thermocouple measurement instruction measures thethermocouple voltage (TCDiff or TCSE). The thermocouple instructioncalculates the voltage that a thermocouple of the type specified would output atthe reference junction temperature if its reference junction were at 0 oC, andadds this voltage to the thermocouple voltage. The temperature of themeasuring junction is then calculated from a polynomial approximation of theNIST TC calibrations
3.4.1 Error AnalysisThe error in the measurement of a thermocouple temperature is the sum of theerrors in the reference junction temperature, the thermocouple output(deviation from standards published in NIST Monograph 175), thethermocouple voltage measurement, and the linearization error (differencebetween NIST standard and CR5000 polynomial approximations). Thediscussion of errors which follows is limited to these errors in calibration andmeasurement and does not include errors in installation or matching the sensorto the environment being measured.
Panel Temperature
A brass bar is just under the CR5000 panel between the two rows of analoginput terminals. This bar helps to reduce temperature gradients between theterminals. The panel temperature thermistor is in a depression in the center ofthis bar.
The thermistor (Betatherm 10K3A1A) has an interchangability specification of0.1 °C for temperatures between 0 and 70 °C. Below freezing and at highertemperatures this specification is degraded (Figure 3.4.1). Combined withpossible errors in completion resistors and the measurement, the accuracy ofpanel temperature is ±0.25 °C 0 to 40 °C, ±0.5 °C -25 to 50 °C, and ±0.7 °C-40 to 85 °C.

Section 3. CR5000 Measurement Details
3-9
0
0.05
0.1
0.15
0.2
0.25
0.3
-60 -50 -40 -30 -20 -10 0 10 20 30 40 50 60 70 80 90 100
Temperature ºC
Ther
mis
tor T
oler
ance
ºC
FIGURE 3.4-1. Thermistor Tolerance
The error in the reference temperature measurement is a combination of theerror in the thermistor temperature and the difference in temperature betweenthe panel thermistor and the terminals the thermocouple is connected to. Theterminal strip cover should always be used when making thermocouplemeasurements. It insulates the terminals from drafts and rapid fluctuations intemperature as well as conducting heat to reduce temperature gradients. In atypical installation where the CR5000 is in a weather proof enclosure notsubject to violent swings in temperature or lopsided solar radiation loading, thetemperature difference between the terminals and the thermistor is likely to beless than 0.2 °C.
With an external driving gradient, the temperature gradients on the input panelcan be much worse. For example, the CR5000 with the rechargeable batteryback was placed in a controlled temperature chamber. Thermocouples inchannels at the ends and middle of each analog terminal strip measured thetemperature of an insulated aluminum bar outside the chamber. Thetemperature of this bar was also measured by another datalogger. Differencesbetween the temperature measured by one of the thermocouples and the actualtemperature of the bar are due to the temperature difference between theterminals the thermocouple is connected to and the thermistor reference (thefigures have been corrected for thermistor errors). Figure 3.4-2 shows theerrors when the chamber was changed from -55 to 80 °C in approximately 15minutes. Figure 3.4-3 shows the results when going from 80 to 25 °C inapproximately 45 minutes, a less dramatic change but still greater than wouldbe seen in most natural circumstances. During these rapid changes intemperature, the temperature of panel thermistor will tend to lag behind theterminals because it is buried a bit deeper in the CR5000 and is closer to the

Section 3. CR5000 Measurement Details
3-10
thermal mass of the batteries. Note that the smallest errors are on channels 5and 16 in the middle of the terminal strips closest to the thermistor.
Reference Temperature Errors Due to Panel GradientChamber changed from -55 to 80 °C at maximum rate
-7
-6
-5
-4
-3
-2
-1
0
1
2
-5 0 5 10 15 20 25 30 35 40 45 50 55 60 65 70 75 80 85 90 95
Time (minutes)
Mea
sure
d - A
ctua
l (°C
)
-60
-40
-20
0
20
40
60
80
Cha
mbe
r and
CR
5000
Pan
el T
empe
ratu
re (°
C)
Chanel 1Chanel 5Chanel 10Chanel 11Chanel 16Chanel 20PanelChamber
FIGURE 4.3-2. Panel Temperature Gradients During -55 to 80 °C change

Section 3. CR5000 Measurement Details
3-11
Reference Temperature Errors Due to Panel GradientChamber Changed From 80 to 25 °C at 1.3 °C/Minute
-0.4
-0.2
0
0.2
0.4
0.6
0.8
1
1.2
1.4
-5 0 5 10 15 20 25 30 35 40 45 50 55 60 65 70 75 80 85 90 95
Time (minutes)
Mea
sure
d - A
ctua
l (°C
)
20
30
40
50
60
70
80
Cha
mbe
r and
CR
5000
Pan
el T
empe
ratu
re (°
C)
Channel 1Channel 5Channel 10Channel 11Channel 16Channel 20PanelChamber
FIGURE 4.3-3. Panel Temperature Gradients During 80 to 25 °C change
Thermocouple Limits of Error
The standard reference which lists thermocouple output voltage as a functionof temperature (reference junction at 0oC) is the National Institute of Standardsand Technology Monograph 175 (1993). The American National StandardsInstitute has established limits of error on thermocouple wire which is acceptedas an industry standard (ANSI MC 96.1, 1975). Table 3.4-1 gives the ANSIlimits of error for standard and special grade thermocouple wire of the typesaccommodated by the CR5000.
TABLE 3.4-1. Limits of Error for Thermocouple Wire (Reference Junction at 0oC)
Limits of ErrorThermocouple Temperature (Whichever is greater)
Type Range oC Standard Special
T -200 to 0 ± 1.0oC or 1.5%0 to 350 ± 1.0oC or 0.75% ± 0.5oC or 0.4%
J 0 to 750 ± 2.2oC or 0.75% ± 1.1oC or 0.4%
E -200 to 0 ± 1.7oC or 1.0%0 to 900 ± 1.7oC or 0.5% ± 1.0oC or 0.4%
K -200 to 0 ± 2.2oC or 2.0%0 to 1250 ± 2.2oC or 0.75% ± 1.1oC or 0.4%
R or S 0 to 1450 ± 1.5oC or 0.25% ± 0.6oC or 0.1%
B 800 to 1700 ± 0.5% Not Estab.

Section 3. CR5000 Measurement Details
3-12
When both junctions of a thermocouple are at the same temperature there is novoltage produced (law of intermediate metals). A consequence of this is that athermocouple can not have an offset error; any deviation from a standard(assuming the wires are each homogeneous and no secondary junctions exist) isdue to a deviation in slope. In light of this, the fixed temperature limits of error(e.g., ±1.0 °C for type T as opposed to the slope error of 0.75% of the temperature)in the table above are probably greater than one would experience whenconsidering temperatures in the environmental range (i.e., the reference junction, at0 °C, is relatively close to the temperature being measured, so the absolute error -the product of the temperature difference and the slope error - should be closer tothe percentage error than the fixed error). Likewise, because thermocouplecalibration error is a slope error, accuracy can be increased when the referencejunction temperature is close to the measurement temperature. For the same reasondifferential temperature measurements, over a small temperature gradient, can beextremely accurate.
In order to quantitatively evaluate thermocouple error when the referencejunction is not fixed at 0 oC, one needs limits of error for the Seebeckcoefficient (slope of thermocouple voltage vs. temperature curve) for thevarious thermocouples. Lacking this information, a reasonable approach is toapply the percentage errors, with perhaps 0.25% added on, to the difference intemperature being measured by the thermocouple.
Accuracy of the Thermocouple Voltage Measurement
The -25 to 50 °C accuracy of a CR5000 differential voltage measurement isspecified as ± (0.075% of the measured voltage plus the input offset error of 2times the basic resolution of the range being used to make the measurementplus 2 µV). The input offset error reduces to the basic resolution if thedifferential measurement is made utilizing the option to reverse the differentialinput.
For optimum resolution, the ±20 mV range is used for all but high temperaturemeasurements (Table 3.4-2). The input offset error dominates the voltagemeasurement error for environmental measurements. A temperature differenceof 45 to 65 °C between the measurement and reference junctions is required fora thermocouple to output 2.67 mV, the voltage at which 0.075% of the readingis equal to 2 µV. For example, assume that a type T thermocouple is used tomeasure a temperature of 45 °C and that the reference temperature is 25 °C.The voltage output by the thermocouple is 830.7 µV. At 45 degrees a type Tthermocouple outputs 42.4 µV per oC. The possible slope error in the voltagemeasurement is 0.00075x830.7 µV = 0.62 µV or 0.014 oC (0.62/42.4). Thebasic resolution on the ±20 mV range is 0.67 µV or 0.01 oC. The 2 µV offsetis an error of 0.047 oC. Thus, the possible error due to the voltagemeasurement is 0.081 oC on a non-reversing differential, or 0.024 oC with areversing differential measurement. The value of using a differentialmeasurement with reversing input to improve accuracy is readily apparent.
The error in the temperature due to inaccuracy in the measurement of thethermocouple voltage is worst at temperature extremes, particularly when thetemperature and thermocouple type require using the 200 mV range. Forexample, assume type K (chromel-alumel) thermocouples are used to measuretemperatures around 1300 oC. The TC output is on the order of 52 mV,
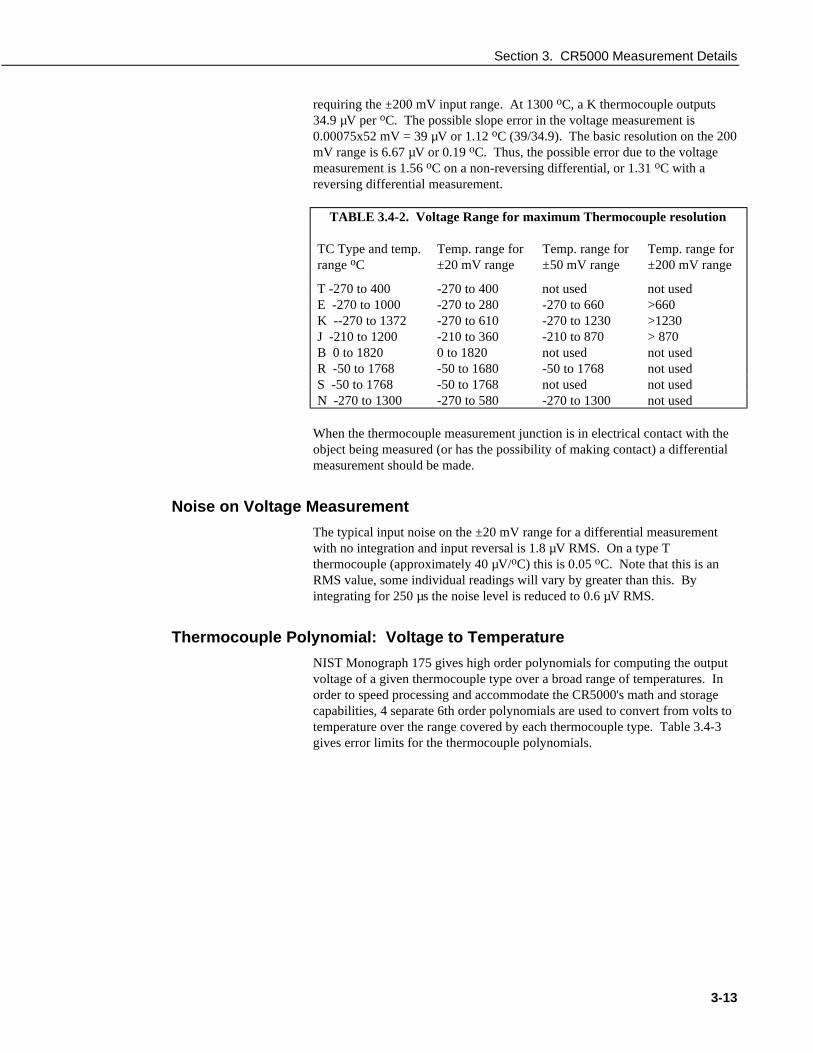
Section 3. CR5000 Measurement Details
3-13
requiring the ±200 mV input range. At 1300 oC, a K thermocouple outputs34.9 µV per oC. The possible slope error in the voltage measurement is0.00075x52 mV = 39 µV or 1.12 oC (39/34.9). The basic resolution on the 200mV range is 6.67 µV or 0.19 oC. Thus, the possible error due to the voltagemeasurement is 1.56 oC on a non-reversing differential, or 1.31 oC with areversing differential measurement.
TABLE 3.4-2. Voltage Range for maximum Thermocouple resolution
TC Type and temp.range oC
Temp. range for±20 mV range
Temp. range for±50 mV range
Temp. range for±200 mV range
T -270 to 400 -270 to 400 not used not usedE -270 to 1000 -270 to 280 -270 to 660 >660K --270 to 1372 -270 to 610 -270 to 1230 >1230J -210 to 1200 -210 to 360 -210 to 870 > 870B 0 to 1820 0 to 1820 not used not usedR -50 to 1768 -50 to 1680 -50 to 1768 not usedS -50 to 1768 -50 to 1768 not used not usedN -270 to 1300 -270 to 580 -270 to 1300 not used
When the thermocouple measurement junction is in electrical contact with theobject being measured (or has the possibility of making contact) a differentialmeasurement should be made.
Noise on Voltage Measurement
The typical input noise on the ±20 mV range for a differential measurementwith no integration and input reversal is 1.8 µV RMS. On a type Tthermocouple (approximately 40 µV/oC) this is 0.05 oC. Note that this is anRMS value, some individual readings will vary by greater than this. Byintegrating for 250 µs the noise level is reduced to 0.6 µV RMS.
Thermocouple Polynomial: Voltage to Temperature
NIST Monograph 175 gives high order polynomials for computing the outputvoltage of a given thermocouple type over a broad range of temperatures. Inorder to speed processing and accommodate the CR5000's math and storagecapabilities, 4 separate 6th order polynomials are used to convert from volts totemperature over the range covered by each thermocouple type. Table 3.4-3gives error limits for the thermocouple polynomials.

Section 3. CR5000 Measurement Details
3-14
TABLE 3.4-3. Limits of Error on CR5000 Thermocouple Polynomials(Relative to NIST Standards)
TCType Range oC Limits of Error oC
T -270 to 400-270 to -200 + 18 @ -270-200 to -100 ± 0.08-100 to 100 ± 0.001100 to 400 ± 0.015
J -150 to 760 ± 0.008-100 to 300 ± 0.002
E -240 to 1000-240 to -130 ± 0.4-130 to 200 ± 0.005200 to 1000 ± 0.02
K -50 to 1372-50 to 950 ± 0.01950 to 1372 ± 0.04
Reference Junction Compensation: Temperature to Voltage
The polynomials used for reference junction compensation (convertingreference temperature to equivalent TC output voltage) do not cover the entirethermocouple range. Substantial errors will result if the reference junctiontemperature is outside of the linearization range. The ranges covered by theselinearizations include the CR5000 environmental operating range, so there isno problem when the CR5000 is used as the reference junction. Externalreference junction boxes however, must also be within these temperatureranges. Temperature difference measurements made outside of the referencetemperature range should be made by obtaining the actual temperaturesreferenced to a junction within the reference temperature range and subtractingone temperature from the other. Table 3.4-3 gives the reference temperatureranges covered and the limits of error in the linearizations within these ranges.
Two sources of error arise when the reference temperature is out of range. Themost significant error is in the calculated compensation voltage, however erroris also created in the temperature difference calculated from the thermocoupleoutput. For example, suppose the reference temperature for a measurement ona type T thermocouple is 300 oC. The compensation voltage calculated by theCR5000 corresponds to a temperature of 272.6 oC, a -27.4 oC error. The typeT thermocouple with the measuring junction at 290 oC and reference at 300 oCwould output -578.7 µV; using the reference temperature of 272.6 oC, theCR5000 calculates a temperature difference of -10.2 oC, a -0.2 oC error. Thetemperature calculated by the CR5000 would be 262.4 oC, 27.6 oC low.
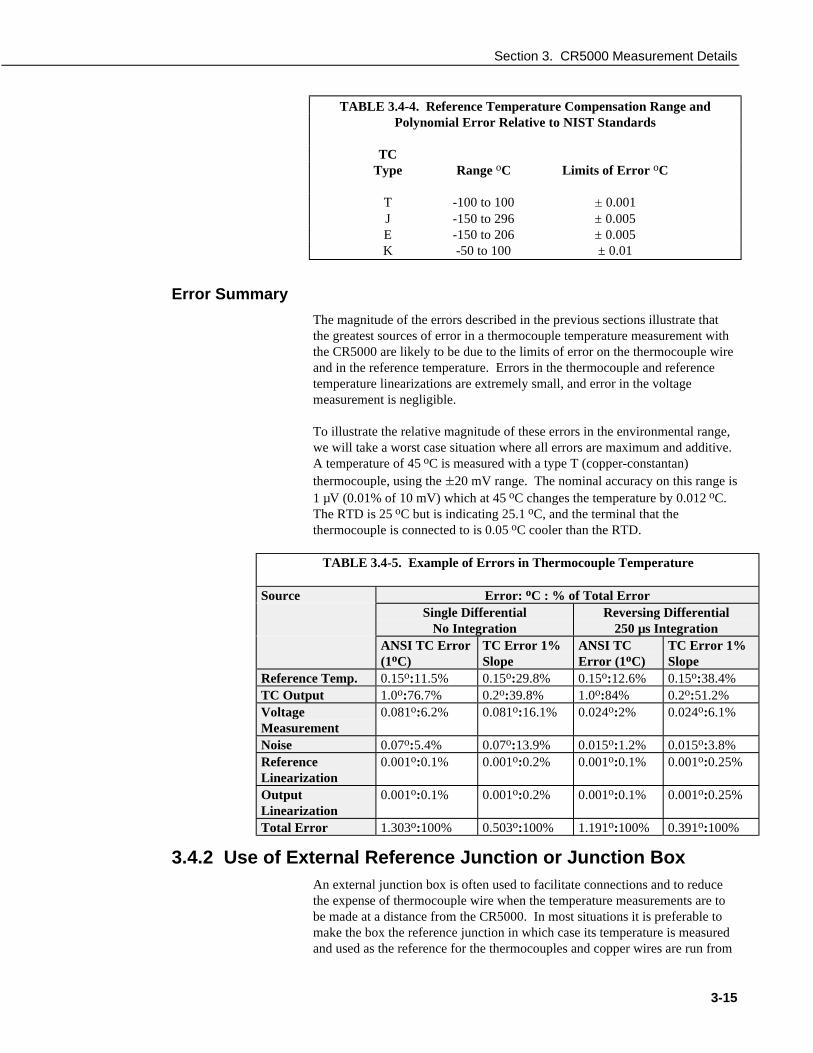
Section 3. CR5000 Measurement Details
3-15
TABLE 3.4-4. Reference Temperature Compensation Range andPolynomial Error Relative to NIST Standards
TCType Range oC Limits of Error oC
T -100 to 100 ± 0.001J -150 to 296 ± 0.005E -150 to 206 ± 0.005K -50 to 100 ± 0.01
Error Summary
The magnitude of the errors described in the previous sections illustrate thatthe greatest sources of error in a thermocouple temperature measurement withthe CR5000 are likely to be due to the limits of error on the thermocouple wireand in the reference temperature. Errors in the thermocouple and referencetemperature linearizations are extremely small, and error in the voltagemeasurement is negligible.
To illustrate the relative magnitude of these errors in the environmental range,we will take a worst case situation where all errors are maximum and additive.A temperature of 45 oC is measured with a type T (copper-constantan)thermocouple, using the ±20 mV range. The nominal accuracy on this range is1 µV (0.01% of 10 mV) which at 45 oC changes the temperature by 0.012 oC.The RTD is 25 oC but is indicating 25.1 oC, and the terminal that thethermocouple is connected to is 0.05 oC cooler than the RTD.
TABLE 3.4-5. Example of Errors in Thermocouple Temperature
Source Error: oC : % of Total ErrorSingle Differential
No IntegrationReversing Differential
250 µs IntegrationANSI TC Error(1oC)
TC Error 1%Slope
ANSI TCError (1oC)
TC Error 1%Slope
Reference Temp. 0.15o:11.5% 0.15o:29.8% 0.15o:12.6% 0.15o:38.4%TC Output 1.0o:76.7% 0.2o:39.8% 1.0o:84% 0.2o:51.2%VoltageMeasurement
0.081o:6.2% 0.081o:16.1% 0.024o:2% 0.024o:6.1%
Noise 0.07o:5.4% 0.07o:13.9% 0.015o:1.2% 0.015o:3.8%ReferenceLinearization
0.001o:0.1% 0.001o:0.2% 0.001o:0.1% 0.001o:0.25%
OutputLinearization
0.001o:0.1% 0.001o:0.2% 0.001o:0.1% 0.001o:0.25%
Total Error 1.303o:100% 0.503o:100% 1.191o:100% 0.391o:100%
3.4.2 Use of External Reference Junction or Junction BoxAn external junction box is often used to facilitate connections and to reducethe expense of thermocouple wire when the temperature measurements are tobe made at a distance from the CR5000. In most situations it is preferable tomake the box the reference junction in which case its temperature is measuredand used as the reference for the thermocouples and copper wires are run from

Section 3. CR5000 Measurement Details
3-16
the box to the CR5000. Alternatively, the junction box can be used to coupleextension grade thermocouple wire to the thermocouples, and the CR5000panel temperature used as the reference. Extension grade thermocouple wirehas a smaller temperature range than standard thermocouple wire, but meetsthe same limits of error within that range. The only situation where it would benecessary to use extension grade wire instead of a external measuring junctionis where the junction box temperature is outside the range of reference junctioncompensation provided by the CR5000. This is only a factor when using typeK thermocouples, where the upper limit of the reference compensationlinearization is 100 oC and the upper limit of the extension grade wire is 200oC. With the other types of thermocouples the reference compensation rangeequals or is greater than the extension wire range. In any case, errors can ariseif temperature gradients exist within the junction box.
Figure 3.4-1 illustrates a typical junction box. Terminal strips will be adifferent metal than the thermocouple wire. Thus, if a temperature gradientexists between A and A' or B and B', the junction box will act as anotherthermocouple in series, creating an error in the voltage measured by theCR5000. This thermoelectric offset voltage is a factor whether or not thejunction box is used for the reference. This offset can be minimized by makingthe thermal conduction between the two points large and the distance small.The best solution in the case where extension grade wire is being connected tothermocouple wire would be to use connectors which clamped the two wires incontact with each other.
CR9000
H
L
A' A
B' B
Junction Box
TCCR5000 Junction Box
FIGURE 3.4-1. Diagram of Junction Box
An external reference junction box must be constructed so that the entireterminal area is very close to the same temperature. This is necessary so that avalid reference temperature can be measured and to avoid a thermoelectricoffset voltage which will be induced if the terminals at which the thermocoupleleads are connected (points A and B in Figure 3.4-1) are at differenttemperatures. The box should contain elements of high thermal conductivity,which will act to rapidly equilibrate any thermal gradients to which the box issubjected. It is not necessary to design a constant temperature box, it isdesirable that the box respond slowly to external temperature fluctuations.
Radiation shielding must be provided when a junction box is installed in thefield. Care must also be taken that a thermal gradient is not induced byconduction through the incoming wires. The CR5000 can be used to measurethe temperature gradients within the junction box.

Section 3. CR5000 Measurement Details
3-17
3.5 Bridge Resistance MeasurementsThere are six bridge measurement instructions included in the standardCR5000 software. Figure 3.5-1 shows the circuits that would typically bemeasured with these instructions. In the diagrams, the resistors labeled Rswould normally be the sensors and those labeled Rf would normally be fixedresistors. Circuits other than those diagrammed could be measured, providedthe excitation and type of measurements were appropriate.
All of the bridge measurements have the option (RevEx) to make one set ofmeasurements with the excitation as programmed and another set ofmeasurements with the excitation polarity reversed. The offset error in the twomeasurements due to thermal emfs can then be accounted for in the processingof the measurement instruction. The excitation channel maintains the excitationvoltage or current until the hold for the analog to digital conversion iscompleted. When more than one measurement per sensor is necessary (fourwire half bridge, three wire half bridge, six wire full bridge), excitation isapplied separately for each measurement. For example, in the four wire halfbridge when the excitation is reversed, the differential measurement of thevoltage drop across the sensor is made with the excitation at both polarities andthen excitation is again applied and reversed for the measurement of thevoltage drop across the fixed resistor.
Calculating the actual resistance of a sensor which is one of the legs of aresistive bridge usually requires additional processing following the bridgemeasurement instruction. In addition to the schematics of the typical bridgeconfigurations, Figure 3.5-1 lists the calculations necessary to compute theresistance of any single resistor, provided the values of the other resistors in thebridge circuit are known.
BrHalf X = result w/mult = 1, offset = 0
XV
V
R
R Rx
s
s f= =
+1 ( )
R R XX
RR X
X
s f
fs
=−
=−
11
BrHalf3W X = result w/mult = 1, offset = 0
XV V
V V
R
RX
s
f=
−
−=
2 2 1
1
R R X
R R Xs f
f s
=
= /

Section 3. CR5000 Measurement Details
3-18
BrHalf4W
H
LH
L
X = result w/mult = 1, offset = 0
XV
V
R
Rs
f= =2
1
R R X
R R Xs f
f s
=
= /
BrFull
HL
X = result w/mult = 1, offset = 0
X 1000V1Vx
1000R3
R3 R4
R2R1 R2
= =+
−+
( )( )
X X R R R
RR X
X
RR X
X
1 3 3 4
12 1
1
21 1
1
1000
1
1
= − + +
=−
=−
/ /
BrFull6W
HL
HL
X = result w/mult = 1, offset = 0
XV
V
R
R R
R
R R= =
+−
+
1000 10002
1
3
3 4
2
1 2
( )
( )
X X R R R
RR X
X
RR X
X
2 2 1 2
34 2
2
43 2
2
1000
11
= + +
=−
=−
/ /
Resistance
H
LH
I
IXR
X = result w/mult = 1, offset = 0
XVI
Rx
s= =
Resistance
used to measure full bridge
HL
IXR
X = result w/mult = 1, offset = 0
XVI
RR
R RR
R R
R R R R R RR R R R
xbridge= =
+−
+
=+ − ++ + +
1 3
3 4
2
1 2
3 1 2 2 3 4
1 2 3 4
( ) ( )
( )R
R R X R R RX R
RR R X R R R
X R
RR R X R R R
X R
RR R X R R R
X R
12 4 2 3 4
3
21 3 1 3 4
4
32 4 1 2 4
1
41 3 1 2 3
2
=− − + +
−
=− + +
+
=− − + +
−
=− + +
+
( )
( )
( )
FIGURE 3.5-1. Circuits Used with Bridge Measurement Instructions
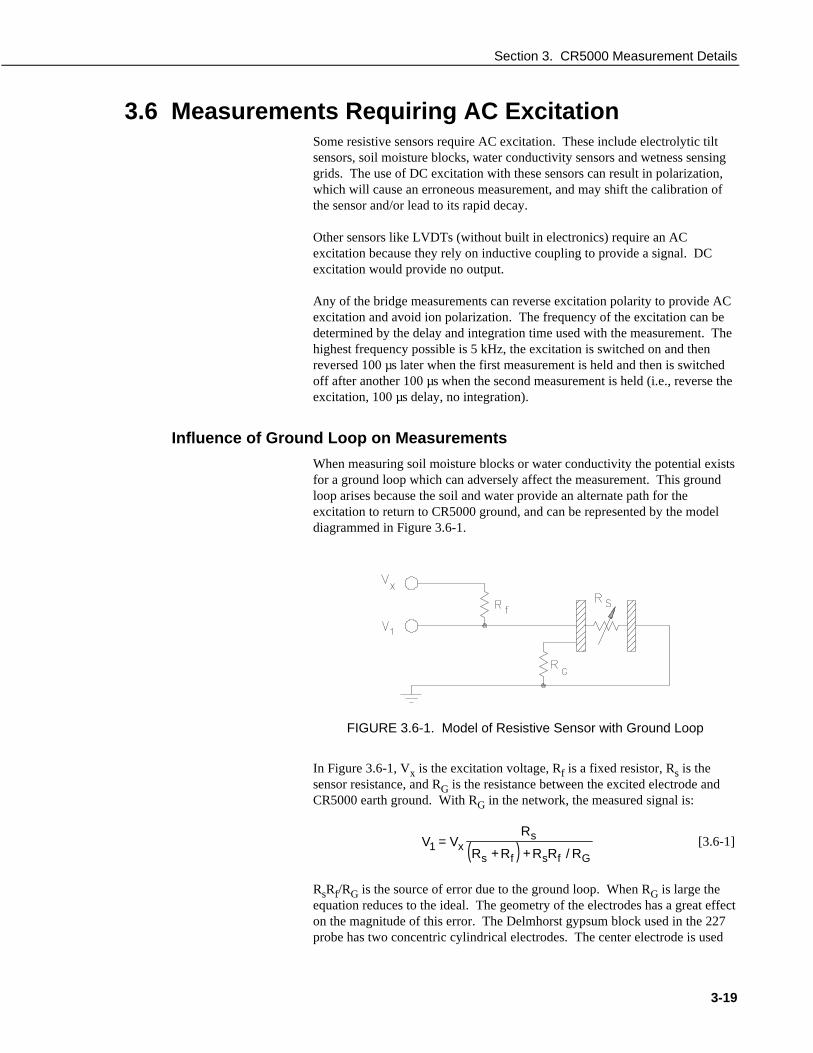
Section 3. CR5000 Measurement Details
3-19
3.6 Measurements Requiring AC ExcitationSome resistive sensors require AC excitation. These include electrolytic tiltsensors, soil moisture blocks, water conductivity sensors and wetness sensinggrids. The use of DC excitation with these sensors can result in polarization,which will cause an erroneous measurement, and may shift the calibration ofthe sensor and/or lead to its rapid decay.
Other sensors like LVDTs (without built in electronics) require an ACexcitation because they rely on inductive coupling to provide a signal. DCexcitation would provide no output.
Any of the bridge measurements can reverse excitation polarity to provide ACexcitation and avoid ion polarization. The frequency of the excitation can bedetermined by the delay and integration time used with the measurement. Thehighest frequency possible is 5 kHz, the excitation is switched on and thenreversed 100 µs later when the first measurement is held and then is switchedoff after another 100 µs when the second measurement is held (i.e., reverse theexcitation, 100 µs delay, no integration).
Influence of Ground Loop on Measurements
When measuring soil moisture blocks or water conductivity the potential existsfor a ground loop which can adversely affect the measurement. This groundloop arises because the soil and water provide an alternate path for theexcitation to return to CR5000 ground, and can be represented by the modeldiagrammed in Figure 3.6-1.
FIGURE 3.6-1. Model of Resistive Sensor with Ground Loop
In Figure 3.6-1, Vx is the excitation voltage, Rf is a fixed resistor, Rs is thesensor resistance, and RG is the resistance between the excited electrode andCR5000 earth ground. With RG in the network, the measured signal is:
( )V VR
R R R R Rxs
s f s f G1 =
+ + /[3.6-1]
RsRf/RG is the source of error due to the ground loop. When RG is large theequation reduces to the ideal. The geometry of the electrodes has a great effecton the magnitude of this error. The Delmhorst gypsum block used in the 227probe has two concentric cylindrical electrodes. The center electrode is used

Section 3. CR5000 Measurement Details
3-20
for excitation; because it is encircled by the ground electrode, the path for aground loop through the soil is greatly reduced. Moisture blocks which consistof two parallel plate electrodes are particularly susceptible to ground loopproblems. Similar considerations apply to the geometry of the electrodes inwater conductivity sensors.
The ground electrode of the conductivity or soil moisture probe and theCR5000 earth ground form a galvanic cell, with the water/soil solution actingas the electrolyte. If current was allowed to flow, the resulting oxidation orreduction would soon damage the electrode, just as if DC excitation was usedto make the measurement. Campbell Scientific probes are built with seriescapacitors in the leads to block this DC current. In addition to preventingsensor deterioration, the capacitors block any DC component from affectingthe measurement.
3.7 Pulse Count MeasurementsMany pulse output type sensors (e.g., anemometers and flow-meters) arecalibrated in terms of frequency (counts/second). For these measurements theaccuracy is related directly to the accuracy of the time interval over which thepulses are accumulated. Frequency dependent measurements should have thePulseCount instruction programmed to return frequency. If the number ofcounts is primary interest, PulseCount should be programmed to return counts(i.e., the number of times a door opens, the number of tips of a tipping bucketrain gage).
The interval of the scan loop that PulseCount is in is not the sole determiningfactor in the calculation of frequency. While normally the counters will beread on the scan interval, if execution is delayed, for example by lengthyoutput processing, the pulse counters are not read until the scan issynchronized with real time and restarted. The CR5000 actually measures theelapsed time since the last time the counters were read when determiningfrequency so in the case of an overrun, the correct frequency will still beoutput.
The resolution of the pulse counters is one count. The resolution of thecalculated frequency depends on the scan interval: frequency resolution =1/scan interval (e.g., a pulse count in a 1 second scan has a frequencyresolution of 1 Hz, a 0.5 second scan gives a resolution of 2 Hz, and a 1 msscan gives a resolution of 1000 Hz). The resultant measurement will bouncearound by the resolution. For example, if you are scanning a 2.5 Hz input oncea second, in some intervals there will be 2 counts and in some 3 as shown infigure 3.7-1. If the pulse measurement is averaged, the correct value will bethe result.
3 2 3 2
FIGURE 3.7-1. Varying counts within Pulse interval.

Section 3. CR5000 Measurement Details
3-21
The resolution gets much worse with the shorter intervals used with higherspeed measurements. As an example, assume that engine RPM is beingmeasured from a signal that outputs 30 pulses per revolution. At 2000 RPM,the signal has a frequency of 100 Hz (2000 RPMx(1 min/60 s)x30=1000). Themultiplier to convert from frequency to RPM is 2 RPM/Hz (1 RPM/(30pulses/60s) = 2). At a 1 second scan interval, the resolution is 2 RPM.However, if the scan interval were 1 ms, the resolution would be 2000 RPM.At the 1 ms scan, if every thing was perfect, each interval there would be 1count. However, a slight variation in the frequency might cause 2 countswithin one interval and none in the next, causing the result to vary between 0and 4000 RPM!
3.8 Self CalibrationThe CR5000 performs a self-calibration of the analog voltage measurementsand excitation voltages. The range gains and offsets and the excitation voltageoutput will vary with temperature. The self calibration allows the CR5000 tomaintain its specifications over the temperature range.
Rather than make all of the measurements required to calibrate allrange/integration type combinations possible in the CR5000, the calibrationonly measures the range/integration type combinations that occur in therunning CR5000 program. The calibration may occur in three different modes.
1. Compile time calibration. This occurs prior to running the program andcalibrates all integration/range combinations needed. For the 250 usc andzero integrations multiple measurements are made and averaged to comeup with gain values to use in the measurements. Ten measurements aremade on the zero integration ranges and five measurements for the 250usec integrations. When this calibration is performed the values in thecalibration table are completely replaced (i.e., no filtering is used).
2. System background calibration. This automatically takes place in thebackground while the user program is running. Multiple measurementsare not averaged, but a filter is applied to the new gain/offset valuesobtained. The filter is used so that the calibration values change slowly.The filter combines the newly measured value multiplied by 0.1 with theprevious calibration value by 0.9 to arrive at the new calibration value. Apiece of the background calibration is added to each fast scan in the userprogram. The background calibration measurements will be repeatedevery 4 seconds or the time it takes to complete them, whichever islonger. If there is not enough time to do the background calibration, theCR5000 will display: “ Warning when Fast Scan X is runningbackground calibration will be disabled.” (X is the number of the fastscan where the first scan entered in the program is 1, the next scan is 2,etc.)
3. Calibration under program control. When the calibrate instruction isincluded in a program, the calibration is identical to the compile timecalibration. The calibration table values are replaced with thosecalculated. The fast integrations have averaging as in the compilecalibrate. When a calibrate instruction is found in any scan the

Section 3. CR5000 Measurement Details
3-22
background calibration will be disabled (even if the scan is not executed).The calibrate instruction is described in Section 7.
The self calibration does not take place if there is not enough time to run it or ifthe calibrate instruction is in the CR5000 program and never executed.Without the self calibration the drift in accuracy with temperature is about afactor of 10 worse. For example, over the extended temperature range (-40 to85°C) the accuracy specification is approximately 0.1% of reading. If the selfcalibration is disabled, the accuracy over the range is approximately 1% ofreading. Temperature is the main factor causing a calibration shift and theneed for the self calibration. If the temperature of the CR5000 remains thesame there will be little calibration drift with the self calibration disabled.
The time constant for the background calibration (at the 4 second rate) isapproximately 36 seconds. This allows the CR5000 to remain calibratedduring fairly rapid temperature changes. In cases of extreme temperaturechange, such as bringing a vehicle from equilibrium in a chamber at -30°C outinto a hot Arizona day, it may be worthwhile to override the backgroundcalibration by running the calibration instruction in the scan with themeasurements.
Another case where using the calibration instruction makes sense is wherethere is not time for the background calibration in the normal scan but theprogram can periodically stop making measurements and run the calibrationinstruction in a separate scan.

4-1
Section 4. CRBasic - Native LanguageProgrammingThe CR5000 is programmed in a language that has some similarities to a structured basic.There are special instructions for making measurements and for creating tables of outputdata. The results of all measurements are assigned variables (given names).Mathematical operations are written out much as they would be algebraically. Thissection describes a program, its syntax, structure, and sequence.
4.1 Format Introduction
4.1.1 Mathematical OperationsMathematical operations are written out much as they would be algebraically.For example, to convert a temperature in Celsius to Fahrenheit one mightwrite:
TempF = TempC * 1.8 + 32
With the CR5000 there may be 2 or 20 temperature (or other) measurements.Rather than have 20 different names, a variable array with one name and 20elements may be used. A thermocouple temperature might be called TCTemp.With an array of 20 elements the names of the individual temperatures areTCTemp(1), TCTemp(2), TCTemp(3), ... TCTemp(20). The array notationallows compact code to perform operations on all the variables. For example,to convert ten temperatures in a variable array from C to F:
For I=1 to 10TCTemp(I)=TCTemp(I)*1.8+32
Next I
4.1.2 Measurement and Output Processing InstructionsMeasurement instructions are procedures that set up the measurementhardware to make a measurement and place the results in a variable or avariable array. Output processing instructions are procedures that store theresults of measurements or calculated values. Output processing includesaveraging, saving maximum or minimum, standard deviation, FFT, etc.
The instructions for making measurements and outputting data are not found ina standard basic language. The instructions Campbell Scientific has created forthese operations are in the form of procedures. The procedure has a keywordname and a series of parameters that contain the information needed tocomplete the procedure. For example, the instruction for measuring thetemperature of the CR5000 input panel is:
PanelTemp (Dest, Integ)

Section 4. CRBasic - Native Language Programming
4-2
PanelTemp is the keyword name of the instruction. The two parametersassociated with PanelTemp are: Destination, the name of the variable in whichto put the temperature; and Integration, the length of time to integrate themeasurement. To place the panel temperature in the variable RefTemp (usinga 250 microsecond measurement integration time) the code is:
PanelTemp(RefTemp, 250)
The use of these instructions should become clearer as we go through anintroductory example.
4.1.3 Inserting Comments Into ProgramComments can be inserted into a program by preceding the comment with asingle quote ('). Comments can be entered either as independent lines orfollowing CR5000 code. When the CR5000 compiler sees the ' it ignores therest of the line.
' The declaration of variables starts here.Public Start(6) 'Declare the start time array
4.2 Programming SequenceThe following table describes the structure of a typical CR5000 program:
Declarations Make a list of what to measure and calculate.
Declare constants Within this list, include the fixed constants used,
Declare Public variables indicate the values that the user is able to viewwhile the program is running,
Dimension variables the number of each measurement that will bemade,
Define Aliases and specific names for any of the measurements.
Define data tables. Describe, in detail, tables of data that will besaved from the experiment.
Process/store trigger Set when the data should be stored. Are theystored when some condition is met? Are datastored on a fixed interval? Are they stored ona fixed interval only while some condition ismet?
Table size Set the size of the table in CR5000 RAM
Other on-line storagedevices
Should the data also be sent to the PC card?
Processing of Data What data are to be output (current value,average, maximum, minimum, etc.)

Section 4. CRBasic - Native Language Programming
4-3
Define Subroutines If there is a process or series of calculationsthat need to be repeated several times in theprogram, it can be packaged in a subroutineand called when needed rather than repeatingall the code each time.
Program The program section defines the action ofdatalogging
Set scan interval The scan sets the interval for a series ofmeasurements
Measurements Enter the measurements to make
Processing Enter any additional processing with themeasurements
Call Data Table(s) The Data Table must be called to process outputdata
Initiate controls Check measurements and Initiate controls ifnecessary
NextScan Loop back (and wait if necessary) for the nextscan
End Program

Section 4. CRBasic - Native Language Programming
4-4
4.3 Example Program
Const RevDiff=1Const Del=0 'defaultConst Integ=250Const Mult=1Const Offset=0
Public RefTempPublic TC(6)Units RefTemp=degCUnits TC=DegC
DataTable (Temp,1,2000) DataInterval (0,100,mSec,10) Average (1,RefTemp,FP2,0) Average (6,TC(),FP2,0)EndTable
BeginProg Scan (10,mSec,3,0) PanelTemp (RefTemp, 250) TCDiff (TC(),6,mV20C ,1,TypeT,RefTemp,RevDiff,Del,Integ,Mult,Offset) CallTable Temp NextScanEndProg
4.3.1 Data TablesData storage follows a fixed structure in the CR5000 in order to optimize thetime and space required. Data are stored in tables such as:
TOA4 StnName TempTIMESTAMP RECORD RefTemp_Avg TC_Avg(1) TC_Avg(2) TC_Avg(3) TC_Avg(4) TC_Avg(5) TC_Avg(6)TS RN degC degC degC degC degC degC degC
Avg Avg Avg Avg Avg Avg Avg1995-02-16 15:15:04.61 278822 31.08 24.23 25.12 26.8 24.14 24.47 23.761995-02-16 15:15:04.62 278823 31.07 24.23 25.13 26.82 24.15 24.45 23.81995-02-16 15:15:04.63 278824 31.07 24.2 25.09 26.8 24.11 24.45 23.751995-02-16 15:15:04.64 278825 31.07 24.21 25.1 26.77 24.13 24.39 23.76
The user's program determines the values that are output and their sequence.The CR5000 automatically assigns names to each field in the data table. In theabove table, TIMESTAMP, RECORD, RefTemp_Avg, and TC_Avg(1) arefieldnames. The fieldnames are a combination of the variable name (or alias ifone exists) and a three letter mnemonic for the processing instruction thatoutputs the data. Alternatively, the FieldNames instruction can be used tooverride the default names.
The data table header also has a row that lists units for the output values. Theunits must be declared for the CR5000 to fill this row out (e.g., Units RefTemp
Declare public variables ,dimension array, anddeclare units.
Declare constants
Define Data Table
Declarations
Scan loopMeasure
Call Data Table
Section 4. CRBasic - Native Language Programming
4-5
= degC). The units are strictly for the user's documentation; the CR5000makes no checks on their accuracy.
The above table is the result of the data table description in the exampleprogram:
DataTable (Temp,1,2000)DataInterval(0,10,msec,10)Average(1,RefTemp,fp2,0)Average(6,TC(1),fp2,0)
EndTable
All data table descriptions begin with DataTable and end with EndTable.Within the description are instructions that tell what to output and that canmodify the conditions under which output occurs.
DataTable(Name, Trigger, Size)DataTable (Temp,1,2000)
The DataTable instruction has three parameters: a user specified name for thetable, a trigger condition, and the size to make the table in CR5000 RAM. Thetrigger condition may be a variable, expression, or constant. The trigger is trueif it is not equal to 0. Data are output if the trigger is true and there are noother conditions to be met. No output occurs if the trigger is false (=0). Theexample creates a table name Temp, outputs any time other conditions are met,and retains 2000 records in RAM.
DataInterval(TintoInt, Interval, Units, Lapses)DataInterval(0,10,msec,10)
DataInterval is an instruction that modifies the conditions under which data arestored. The four parameters are the time into the interval, the interval onwhich data are stored, the units for time, and the number of lapses or gaps inthe interval to keep track of. The example outputs at 0 time into (on) theinterval relative to real time, the interval is 10 milliseconds, and the table willkeep track of 10 lapses. The DataInterval instruction reduces the memoryrequired for the data table because the time of each record can be calculatedfrom the interval and the time of the most recent record stored. Other outputcondition modifiers are: Worst Case and FillandStop.
The output processing instructions included in a data table declarationdetermine the values output in the table. The table must be called by theprogram in order for the output processing to take place. That is, each time anew measurement is made, the data table is called. When the table is called,the output processing instructions within the table process the current inputs.If the trigger conditions for the are true, the processed values are output to thedata table. In the example, several averages are output.
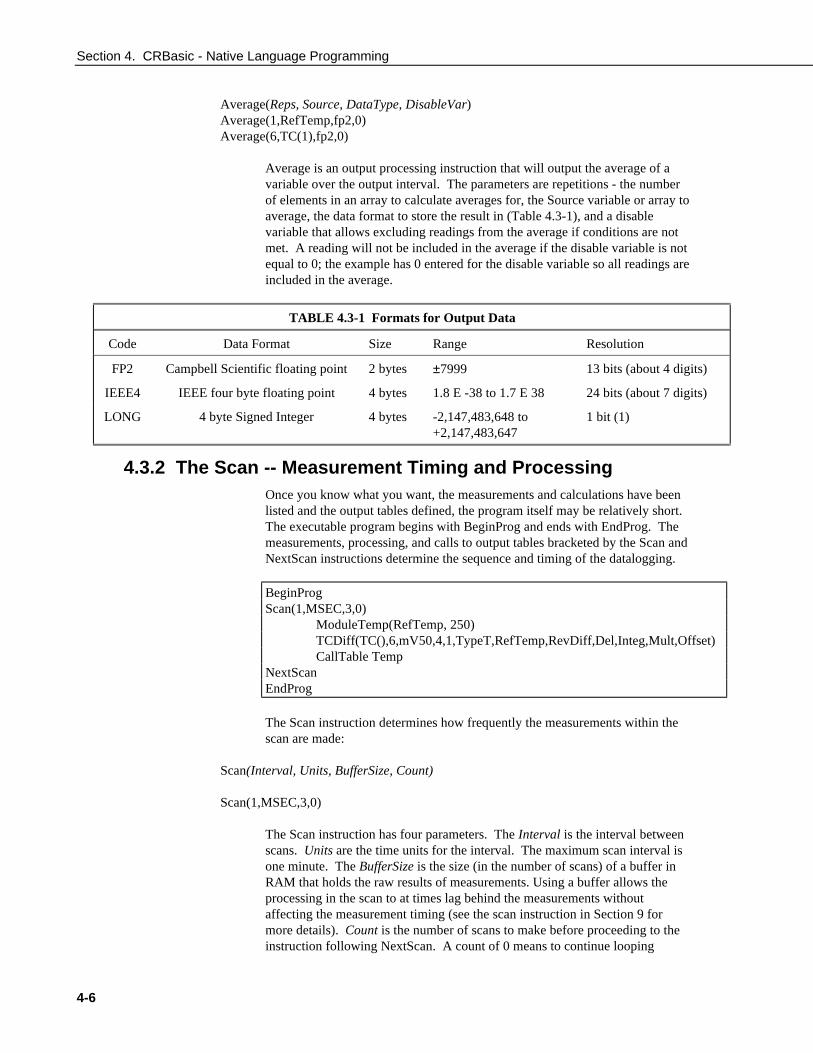
Section 4. CRBasic - Native Language Programming
4-6
Average(Reps, Source, DataType, DisableVar)Average(1,RefTemp,fp2,0)Average(6,TC(1),fp2,0)
Average is an output processing instruction that will output the average of avariable over the output interval. The parameters are repetitions - the numberof elements in an array to calculate averages for, the Source variable or array toaverage, the data format to store the result in (Table 4.3-1), and a disablevariable that allows excluding readings from the average if conditions are notmet. A reading will not be included in the average if the disable variable is notequal to 0; the example has 0 entered for the disable variable so all readings areincluded in the average.
TABLE 4.3-1 Formats for Output Data
Code Data Format Size Range Resolution
FP2 Campbell Scientific floating point 2 bytes ±7999 13 bits (about 4 digits)
IEEE4 IEEE four byte floating point 4 bytes 1.8 E -38 to 1.7 E 38 24 bits (about 7 digits)
LONG 4 byte Signed Integer 4 bytes -2,147,483,648 to+2,147,483,647
1 bit (1)
4.3.2 The Scan -- Measurement Timing and ProcessingOnce you know what you want, the measurements and calculations have beenlisted and the output tables defined, the program itself may be relatively short.The executable program begins with BeginProg and ends with EndProg. Themeasurements, processing, and calls to output tables bracketed by the Scan andNextScan instructions determine the sequence and timing of the datalogging.
BeginProgScan(1,MSEC,3,0)
ModuleTemp(RefTemp, 250)TCDiff(TC(),6,mV50,4,1,TypeT,RefTemp,RevDiff,Del,Integ,Mult,Offset)CallTable Temp
NextScanEndProg
The Scan instruction determines how frequently the measurements within thescan are made:
Scan(Interval, Units, BufferSize, Count)
Scan(1,MSEC,3,0)
The Scan instruction has four parameters. The Interval is the interval betweenscans. Units are the time units for the interval. The maximum scan interval isone minute. The BufferSize is the size (in the number of scans) of a buffer inRAM that holds the raw results of measurements. Using a buffer allows theprocessing in the scan to at times lag behind the measurements withoutaffecting the measurement timing (see the scan instruction in Section 9 formore details). Count is the number of scans to make before proceeding to theinstruction following NextScan. A count of 0 means to continue looping

Section 4. CRBasic - Native Language Programming
4-7
forever (or until ExitScan). In the example the scan is 1 millisecond, threescans are buffered, and the measurements and output continue indefinitely.
4.4 Numerical EntriesIn addition to entering regular base 10 numbers there are 3 additional ways torepresent numbers in a program: scientific notation, binary, and hexadecimal(Table 4.4-1).
TABLE 4.4-1 Formats for Entering Numbers in CRBasic
Format Example Value
Standard 6.832 6.832
Scientific notation 5.67E-8 5.67X10⁻⁸
Binary: &B1101 13
Hexadecimal &HFF 255
The binary format makes it easy to visualize operations where the ones andzeros translate into specific commands. For example, a block of ports can beset with a number, the binary form of which represents the status of the ports(1= high, 0=low). To set ports 1, 3, 4, and 6 high and 2, 5, 7, and 8 low; thenumber is &B00101101. The least significant bit is on the right and representsport 1. This is much easier to visualize than entering 72, the decimalequivalent.
4.5 Logical Expression Evaluation
4.5.1 What is True?Several different words get used to describe a condition or the result of a test.The expression, X>5, is either true or false. However, when describing thestate of a port or flag, on or off or high or low sounds better. In CRBasic thereare a number of conditional tests or instruction parameters the result of whichmay be described with one of the words in Table 4.5-1. The CR5000 evaluatesthe test or parameter as a number; 0 is false, not equal to 0 is true.
TABLE 4.5-1. Synonyms for True and False
Predefined Constant True (-1) False (0)
Synonym High Low
Synonym On Off
Synonym Yes No
Synonym Trigger Do Not Trigger
Number ≠0 0
Digital port 5 Volts 0 Volts

Section 4. CRBasic - Native Language Programming
4-8
4.5.2 Expression EvaluationConditional tests require the CR5000 to evaluate an expression and take onepath if the expression is true and another if the expression is false. Forexample:If X>=5 then Y=0will set the variable Y to 0 if X is greater than or equal to 5.
The CR5000 will also evaluate multiple expressions linked with and or or.For example:If X>=5 and Z=2 then Y=0will only set Y=0 if both X>=5 and Z=2 are true.If X>=5 or Z=2 then Y=0will set Y=0 if either X>=5 or Z=2 is true (see And and Or in Section 9). Acondition can include multiple and and or links.
4.5.3 Numeric Results of Expression EvaluationThe CR5000 expression evaluator evaluates an expression and returns anumber. A conditional statement uses the number to decide which way tobranch. The conditional statement is false if the number is 0 and true if thenumber is not 0. For example:If 6 then Y=0,is always true, Y will be set to 0 any time the conditional statement is executed.If 0 then Y=0is always false, Y will never be set to 0 by this conditional statement.
The CR5000 expression evaluator evaluates the expression, X>=5, and returns-1, if the expression is true, and 0, if the expression is false.W=(X>Y)will set W equal to -1 if X>Y or will set W equal to 0 if X<=Y.
The CR5000 uses -1 rather than some other non-zero number because the andand or operators are the same for logical statements and binary bitwisecomparisons (see and and or in Section 8). The number -1 is expressed inbinary with all bits equal to 1, the number 0 has all bits equal to 0. When -1 isanded with any other number the result is the other number, ensuring that if theother number is non-zero (true), the result will be non-zero
4.6 FlagsAny variable can be used as a flag as far as logical tests in CRBasic areconcerned. If the value of the variable is non-zero the flag is high. If the valueof the variable is 0 the flag is low (Section 4.5). PC9000 looks for the variablearray with the name Flag when the option to display flag status is used in oneof the real time screens.
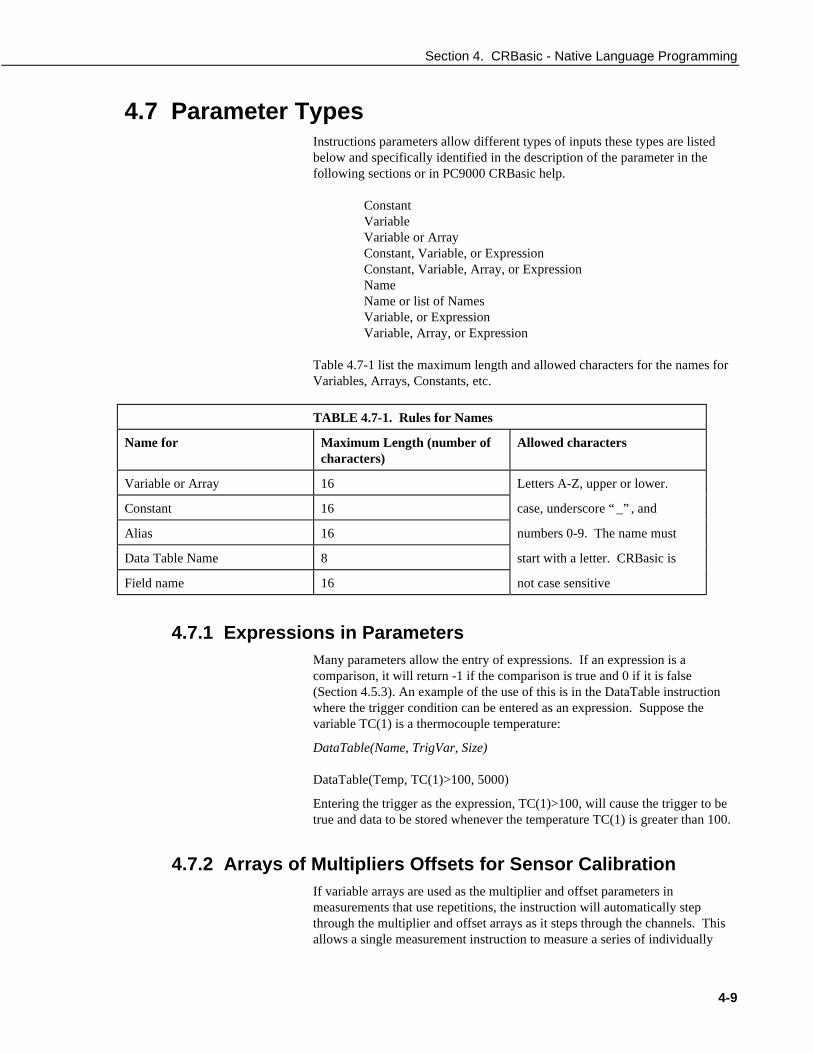
Section 4. CRBasic - Native Language Programming
4-9
4.7 Parameter TypesInstructions parameters allow different types of inputs these types are listedbelow and specifically identified in the description of the parameter in thefollowing sections or in PC9000 CRBasic help.
ConstantVariableVariable or ArrayConstant, Variable, or ExpressionConstant, Variable, Array, or ExpressionNameName or list of NamesVariable, or ExpressionVariable, Array, or Expression
Table 4.7-1 list the maximum length and allowed characters for the names forVariables, Arrays, Constants, etc.
TABLE 4.7-1. Rules for Names
Name for Maximum Length (number ofcharacters)
Allowed characters
Variable or Array 16 Letters A-Z, upper or lower.
Constant 16 case, underscore “ _” , and
Alias 16 numbers 0-9. The name must
Data Table Name 8 start with a letter. CRBasic is
Field name 16 not case sensitive
4.7.1 Expressions in ParametersMany parameters allow the entry of expressions. If an expression is acomparison, it will return -1 if the comparison is true and 0 if it is false(Section 4.5.3). An example of the use of this is in the DataTable instructionwhere the trigger condition can be entered as an expression. Suppose thevariable TC(1) is a thermocouple temperature:
DataTable(Name, TrigVar, Size)
DataTable(Temp, TC(1)>100, 5000)
Entering the trigger as the expression, TC(1)>100, will cause the trigger to betrue and data to be stored whenever the temperature TC(1) is greater than 100.
4.7.2 Arrays of Multipliers Offsets for Sensor CalibrationIf variable arrays are used as the multiplier and offset parameters inmeasurements that use repetitions, the instruction will automatically stepthrough the multiplier and offset arrays as it steps through the channels. Thisallows a single measurement instruction to measure a series of individually
Section 4. CRBasic - Native Language Programming
4-10
calibrated sensors, applying the correct calibration to each sensor. If themultiplier and offset are not arrays, the same multiplier and offset are used foreach repetition.
VoltSE(Dest,Reps,Range,ASlot,SEChan,Delay,Integ,Mult,Offset)
'Calibration factors:Mult(1)=0.123 : Offset(1)= 0.23Mult(2)=0.115 : Offset(2)= 0.234Mult(3)=0.114 : Offset(3)= 0.224VoltSE(Pressure(),3,mV1000,6,1,1,100,Mult(),Offset()
4.8 Program Access to Data TablesData stored in a table can be accessed from within the program. The formatused is:
Tablename.Fieldname(fieldname index,records back)
Where Tablename is the name of the table in which the desired value is stored.Fieldname is the name of the field in the table. The fieldname is always anarray even if it consists of only one variable; the fieldname index must alwaysbe specified. Records back is the number of records back in the data tablefrom the current time (1 is the most recent record stored, 2 is the record storedprior to the most recent). For example, the expression:
Tdiff=Temp.TC_Avg(1,1)–Temp.TC_Avg(1,101)
could be used in the example program (Section 4.3) to calculate the change inthe 10 ms average temperature of the first thermocouple between the mostrecent average and the one that occurred a second (100 x 10 ms) earlier.
In addition to accessing the data actually output in a table, there are somepseudo fields related to the data table that can be retrieved:
Tablename.record(1,n) = the record number of the record output n records ago.
Tablename.output(1,1) = 1 if data were output to the table the last time thetable was called, = 0 if data were not output.
Tablename.timestamp(m,n) = element m of the timestamp output n records agowhere:
timestamp(1,n) = microseconds since 1990timestamp(2,n) = microseconds into the current yeartimestamp(3,n) = microseconds into the current monthtimestamp(4,n) = microseconds into the current daytimestamp(5,n) = microseconds into the current hourtimestamp(6,n) = microseconds into the current minutetimestamp(7,n) = microseconds into the current second

Section 4. CRBasic - Native Language Programming
4-11
Tablename.eventend(1,1) is only valid for a data table using the DataEventinstruction, Tablename.eventend(1,1) = 1 if the last record of an event occurredthe last time the table was called, = 0 if the data table did not store a record orif it is in the middle of an event.
The values of Tablename.output(1,1) and Tablename.eventend(1,1) are only updated when the tables are called.
The WorstCase example in Section 6.2 illustrates the use of this syntax.
NOTE

Section 4. CRBasic - Native Language Programming
4-12
This is a blank page.
5-1
Section 5. Program Declarations
AliasUsed to assign a second name to a variable.
SyntaxAlias VariableA = VariableB
RemarksAlias allows assigning a second name to a variable. Within the dataloggerprogram, either name can be used. Only the alias is available for Public variables.The alias is also used as the root name for data table fieldnames.
With aliases the program can have the efficiency of arrays for measurement andprocessing yet still have individually named measurements.
Alias Declaration Example
The example shows how to use the Alias declaration.
Dim TCTemp(4)Alias TCTemp(1) = CoolantTAlias TCTemp(2) = ManifoldTAlias TCTemp(3) = ExhaustTAlias TCTemp(4) = CatConvT
ConstDeclares symbolic constants for use in place of numeric entries.
SyntaxConst constantname = expression
RemarksThe Const statement has these parts:
Part Descriptionconstantname Name of the constant.expression Expression assigned to the constant. It can consist of literals
(such as 1.0), other constants, or any of the arithmetic orlogical operators.
Tip Constants can make your programs self-documenting and easier tomodify. Unlike variables, constants can't be changed while yourprogram is running.
Caution Constants must be defined before referring to them.
Tip Use all uppercase letters for constant names to make them easy torecognize in your program listings.

Section 5. Program Declarations
5-2
Const Declaration Example
The example uses Const to define the symbolic constant PI.
Const PI = 3.141592654 'Define constant.Dim Area, Circum, Radius 'Declare variables.Radius = Volt( 1 ) 'Get measurement.Circum = 2 * PI * Radius 'Calculate circumference.Area = PI * ( Radius ^ 2 ) 'Calculate area.
DimDeclares variables and allocates storage space. In CRBasic, ALL variables MUSTbe declared.
SyntaxDim varname[([subscripts]) [, varname[([subscripts])]]
RemarksThe Dim statement has these parts:
Part Descriptionvarname Name of a variable.subscripts Dimensions of an array variable. You can declare multiple
dimensions.
The argument subscripts has the following syntax:size [size, size]
In CRBasic the Option Base is always 1. This means the lowest number in adimension is 1 and not 0.
Dim A( 8, 3 )
The maximum number of array dimensions allowed in a Dim statement is 3. If aprogram uses a subscript that is greater than the dimensioned value, a subscript outof bounds error is recorded.
When variables are initialized, they are initialized to 0
Tip Put Dim statements at the beginning of the program.
PublicDimensions a variable as public and available in the Public table of the CR5000.
SyntaxPublic(list of [dimensioned] variables that make up the Public Table)
RemarksMore than one Public statement can be made.
Section 5. Program Declarations
5-3
Public Declaration Example
The example shows the use of the Public declaration.
Dim x( 3 ), y, z( 2, 3, 4 )Public x, y, zPublic Dim x( 3 ), y, z( 2, 3, 4 ) 'Dim is optionalPublic x( 3 ),y, z( 2, 3, 4 )Public w
Station NameSets the station name.
SyntaxStationName StaName
RemarksStationName is used to set the datalogger station name with the program. Thestation name is displayed by PC9000 and stored in the data table headers(Section 2.4).
UnitsUsed to assign a unit name to a field associated with a variable.
SyntaxUnits Variable = UnitName
RemarksUnits allows assigning a unit name to a field. Units are displayed on demandin the real-time windows of PC9000. The unit name also appears in the headerof the output files and in the Data Table Info file of PC9000. The unit name isa text field that allows the user to label data. When the user modifies the units,the text entered is not checked by PC9000 or the CR5000.
ExampleDim TCTemp( 1 )
Units TCTemp( 1 ) = Deg_C
Sub, Exit Sub, End SubDeclares the name, variables, and code that form a Subroutine.
SyntaxSub SubName [(VariableList )]
[ statementblock ][ Exit Sub ][ statementblock ]
End Sub

Section 5. Program Declarations
5-4
The Sub statement has these parts:
Part Description
Sub Marks the beginning of a Subroutine.
SubName Name of the Subroutine. Because Subroutine names arerecognized by all procedures in all modules, subname cannotbe the same as any other globally recognized name in theprogram.
VariableList List of variables that are passed to the Subroutine when it iscalled. The variable names used in this list should not be thesame names as variables, aliases, or constants declaredelsewhere. The variable names in this list can only be usedwithin the Subroutine. Multiple variables are separated bycommas. When the Subroutine is called, the call statementmust list the program variables or values to pass into thesubroutine variable. The number and sequence of theprogram variables/values in the call statement must match thenumber and sequence of the variable list in the subdeclaration. Changing the value of one of the variables in thislist inside the Subroutine changes the value of the variablepassed into it in the calling procedure.
The call may pass constants or expressions that evaluate toconstants (i.e., do not contain a variable) into some of thevariables. If a constant is passed, the “ variable” it is passedto becomes a constant and cannot be changed by thesubroutine. If constants will be passed, the subroutine shouldbe written to not try to change the value of the “ variables”they will be passed into.
statementblock Any group of statements that are executed within the body ofthe Subroutine.
Exit Sub Causes an immediate exit from a Subroutine. Programexecution continues with the statement following thestatement that called the Subroutine. Any number of ExitSub statements can appear anywhere in a Subroutine.
End Sub Marks the end of a Subroutine.
A Subroutine is a procedure that can take variables, perform a series of statements,and change the value of the variables. However, a Subroutine can't be used in anexpression. You can call a Subroutine using the name followed by the variable list.See the Call statement for specific information on how to call Subroutines.
The list of Subroutine variables to pass is optional. Subroutines can operate on theglobal program variables declared by the Public or Dim statements. The advantageof passing variables is that the subroutine can be used to operate on whateverprogram variable is passed (see example).
Caution Subroutines can be recursive; that is, they can call themselves toperform a given task. However, recursion can lead to strange results.

Section 5. Program Declarations
5-5
Subroutine Example
'CR5000'Declare Variables used in Program:Public RefT, TC(4),PRTresist,PRTtemp,I
'Data output in deg C:DataTable (TempsC,1,-1)
DataInterval (0,5,Min,10)Average (1,RefT,FP2,0)Average (4,TC(),FP2,0)Average (1,PRTtemp,FP2,0)
EndTable
'Same Data output in F:DataTable (TempsF,1,-1)
DataInterval (0,5,Min,10)Average (1,RefT,FP2,0)Average (4,TC(),FP2,0)Average (1,PRTtemp,FP2,0)
EndTable
'Subroutine to convert temperature in degrees C to degrees FSub ConvertCtoF (Tmp)
Tmp = Tmp*1.8 +32EndSub
BeginProgScan (1,Sec,3,0)
'Measure Temperatures (panel, 4 thermocouples, and 100 ohm PRT) in deg CPanelTemp (RefT,250)TCDiff (TC(),4,mV20C ,1,TypeT,RefT,True ,0,250,1.0,0)Resistance (PRTresist,1,mV50,7,Ix1,1,500,True ,True ,0,250,0.01,0)PRT (PRTtemp,1,PRTresist,1.0,0)'Call Output Table for CCallTable TempsC'Convert Temperatures to F using Subroutine:Call ConvertCtoF(RefT) 'Subroutine call using Call statementFor I = 1 to 4
ConvertCtoF(TC(I)) 'Subroutine call without Call statementNext IConvertCtoF(PRTtemp) 'Subroutine call without Call statement'Call Output Table for F:CallTable TempsF
NextScanEndProg

Section 5. Program Declarations
5-6
This is a blank page.

6-1
Section 6. Data Table Declarations andOutput Processing Instructions
6.1 Data Table Declaration
DataTable (Name, TrigVar, Size)
output trigger modifier
export data destinations
output processing instructions
EndTable
DataTable is used to declare/define a data table. The name of the table, outputtrigger and size of the table in RAM are set with DataTable. The Tabledeclaration must be at the beginning of the code prior to BeginProg. The tabledeclaration starts with DataTable and ends with EndTable. Within thedeclaration are output trigger modifiers (optional, e.g., DataInterval, DataEventor WorstCase), the on-line storage devices to send the data to (optional, e.g.,CardOut, DSP4), and the output processing instructions describing the data setin the table.
Parameter& Data Type
Enter
NameName
The name for the data table. The table name is limited to eight characters.
TrigVar The name of the variable to test for the trigger. Trigger modifiers add additionalconditions.
Constant Value Result
Variable, or 0 Do not trigger
Expression ≠ 0 Trigger
SizeConstant
The size to make the data table. The number of data sets (records) to allocate memory forin static RAM. Each time a variable or interval trigger occurs, a line (or row) of data isoutput with the number of values determined by the output Instructions within the table.This data is called a record. The total number of records stored equals the size..Note Enter a negative number and all remaining memory
(after creating fixed size data tables) will beallocated to the table or partitioned between alltables with a negative value for size. Thepartitioning algorithm attempts to have the tables fillat the same time.
DataTable Example - see native language Section 4.
EndTable
Used to mark the end of a data table.
See DataTable
Section 6. Data Table Declarations and Output Processing Instructions
6-2
6.2 Trigger Modifiers
DataInterval (TintoInt, Interval, Units, Lapses)
Used to set the time interval for an output table. DataInterval is inserted into adata table declaration following the DataTable instruction to establish a fixedinterval table. The fixed interval table requires less memory than a conditionaltable because time is not stored with each record. The time of each record iscalculated by knowing the time of the most recent output and the interval ofthe data. DataInterval does not override the Trigger in the DataTableinstruction. If the trigger is not set always true by entering a constant, it is acondition that must be met in addition to the time interval before data will bestored.
The Interval determines how frequently data are stored to the table. Theinterval is synchronized with the real time clock. Time is kept internally as theelapsed time since the start of 1990 (01-01-1990 00:00:00). When the intervaldivides evenly into this elapsed time it is time to output (elapsed time MODinterval = 0). Entering 0 for the Interval sets it equal to the scan Interval.
TintoInt allows the user to set the time into the Interval, or offset relative toreal time, at which the output occurs([elapsed time + TintoInt] MOD interval =0). For example, 360 (TintoInt) minutes into a 720 (Interval) minute (Units)interval specifies that output should occur at 6:00 (6 AM, 360 minutes frommidnight) and 18:00 (6 PM, 360 minutes from noon) where the 720 minute (12hour) interval is set relative to midnight 00:00. Enter 0 to keep output on theeven interval.
Interval driven data allows a more efficient use of memory because it is notnecessary to store time with each record. The CR5000 still stores time but on afixed spacing, only about once per 1 K of memory used for the table. As eachnew record is stored, time is checked to ensure that the interval is correct. Thedatalogger keeps track of lapses or discontinuities in the data. If a lapse hasoccurred, the CR5000 inserts a time stamp into the data. When the data areretrieved a time stamp can be calculated and stored with each record.
This lapse time stamp takes up some memory that would otherwise be used fordata. While the CR5000 allocates some extra memory for the table, if there area lot of lapses, it is not possible to store as many records as requested in theDataTable declaration. The Lapses parameter allows the programmer toallocate additional space for the number of lapses entered. This is used inparticular when the program is written in a way that will create lapses. Forexample, if the data output is controlled by a trigger (e.g., a user flag) in theDataTable instruction in addition to the DataInterval, lapses would occur eachtime the trigger was false for a period of time longer than the interval.
To take advantage of the more efficient memory use, always enter 1 or greaterfor the lapses parameter even if no lapses are expected. Entering 0 causesevery record to be time stamped.
Entering a negative number tells the CR5000 not to keep track of lapses. Onlythe periodic time stamps (approximately once per K of data) are inserted.
Section 6. Data Table Declarations and Output Processing Instructions
6-3
Parameter& Data Type
Enter
TintoIntConstant
The time into the interval (offset to the interval) at which the table is to be output. Theunits for time are the same as for the interval.
IntervalConstant
Enter the time interval on which the data in the table is to be recorded. The interval maybe in µs, ms, s, or minutes, whichever is selected with the Units parameter. Enter 0 tomake the data interval the same as the scan interval.
Units The units for the time parameters, PowerOff is the only instruction that uses hours ordays.
Constant AlphaCode
NumericCode Units
USEC 0 microsecondsMSEC 1 millisecondsSEC 2 secondsMIN 3 minutes
LapsesConstant
As each new record is stored, time is checked to ensure that the interval is correct. Thedatalogger keeps track of lapses or discontinuities in the data.
OpenInterval
When the DataInterval instruction is included in a data table, the CR5000 usesonly values from within an interval for time series processing (e.g., average,maximum, minimum, etc.). When data are output every interval, the outputprocessing instructions reset each time output occurs. To ensure that data fromprevious intervals is not included in a processed output, processing is reset anytime an output interval is skipped. (An interval could be skipped because thetable was not called or another trigger condition was not met.) The CR5000resets the processing the next time that the table is called after an outputinterval is skipped. If this next call to the table is on a scheduled interval, itwill not output. Output will resume on the next interval. (If Sample is the onlyoutput processing instruction in the table, data will be output any time the tableis called on the interval because sampling uses only the current value andinvolves no processing.)
OpenInterval is used to modify an interval driven table so that time seriesprocessing in the table will include all values input since the last time the tableoutput data. Data will be output whenever the table is called on the outputinterval (provided the other trigger conditions are met), regardless of whetheror not output occurred on the previous interval.
OpenInterval Example:
In the following example, 5 thermocouples are measured every 500milliseconds. Every 10 seconds, while Flag(1) is true, the averages of thereference and thermocouple temperatures are output. The user can toggleFlag(1) to enable or disable the output. Without the OpenInterval Instruction,the first averages output after Flag(1) is set high would include only themeasurements within the previous 10 second interval. This is the default and iswhat most users desire. With the Open interval in the program (remove theinitial single quote (‘) to uncomment the instruction) all the measurementsmade while the flag was low will be included in the first averages output afterthe flag is set high.

Section 6. Data Table Declarations and Output Processing Instructions
6-4
Const RevDiff 1 'Reverse input to cancel offsetsConst Del 0 'Use default delayConst Integ 0 'Use no integrationPublic RefTemp 'Declare the variable used for reference temperaturePublic TC(5) 'Declare the variable used for thermocouple measurementsPublic Flag(8)Units RefTemp=degC 'Units TC=degC
DataTable (AvgTemp,Flag(1),1000) 'Output when Flag(1)=trueDataInterval(0,10,sec,10) 'Output every 10 seconds(while Flag(1)=true)'OpenInterval 'When Not Commented, include data while Flag(1)=false in next averageAverage(1,RefTemp,IEEE4,0)Average(5,TC,IEEE4,0)
EndTable
BeginProgScan(500,mSec,0,0)
PanelTemp (RefTemp,250)TCDiff (TC(),5,mV50C,9,TypeT,RefTemp,RevDiff,Del,Integ,1,0)CallTable AvgTemp
NextScanEndProg
DataEvent (RecsBefore, StartTrig, StopTrig, RecsAfter)
Used to set a trigger to start storing records and another trigger to stop storingrecords within a table. The number of records before the start trigger and thenumber of records after the stop trigger can also be set. A filemark (Section 8) isautomatically stored in the table between each event.
Parameter& Data Type
Enter
RecsBeforeConstant
The number of records to store before the Start Trigger.
StartTrig The variable or expression test to Trigger copying the pre trigger records into thedata table and start storing each new record..
Variable, or Value ResultExpression 0 Do not trigger
≠ 0 TriggerStopTrigVariable,Expression orConstant
The variable, expression or constant to test to stop storing to the data table. TheCR5000 does not start checking for the stop trigger until after the Start Triggeroccurs. A non-zero (true) constant may be used to store a fixed number ofrecords when the start trigger occurs (total number of records = PreTrigRecs+ 1record for the trigger +PostTrigRecs.). Zero (false) could be entered if it wasdesired to continuously store data once the start trigger occurred.Value Result
0 Do not trigger≠ 0 Trigger
RecsAfterConstant
The number of records to store after the Stop Trigger occurs.

Section 6. Data Table Declarations and Output Processing Instructions
6-5
DataEvent Example:
In this example, 5 type T thermocouples are measured. The trigger for the startof an event is when TCTemp(1) exceeds 30 degrees C. The stop trigger iswhen TCTemp(1) less than 29 degrees C. The event consists of 20 recordsprior to the start trigger and continues to store data until 10 records followingthe stop trigger.
Const RevDiff 1 'Reverse input to cancel offsetsConst Del 0 'Use default delayConst Integ 0 'Use no integrationPublic RefTemp ‘Declare the variable used for reference temperaturePublic TC(5) 'Declare the variable used for thermocouple measurementsPublic Flag(8)Units RefTemp=degC 'Units TC=degC
DataTable (Event,1,1000)DataInterval(0,00,msec,10) 'Set the sample interval equal to the scanDataEvent(20,TC(1)>30,TC(1)<29,10) '20 records before TC(1)>30,
'after TC(1)<29 store 10 more recordsSample(1,RefTemp,IEEE4) 'Sample the reference temperatureSample(5,TC,IEEE4) 'Sample the 5 thermocouple temperatures
EndTable
BeginProgScan(500,mSec,0,0)
PanelTemp (RefTemp,250)TCDiff (TC(),5,mV50C,1,TypeT,RefTemp,RevDiff,Del,Integ,1,0)CallTable Event
NextScanEndProg
FillStop
Data Tables are by default ring memory where, once full, the newest data arewritten over the oldest. Entering FillStop into a data table declaration makesthe table fill and stop. Once the table is filled, no more data are stored until thetable has been reset. The table can be reset from within the program byexecuting the ResetTable instruction. Tables can also be reset from PC9000real time windows or the collect data window.
Example:
DataTable (Temp,1,2000)DataInterval(0,10,msec,10)FillStop ' the table will stop collecting data after 2000 records.Average(1,RefTemp,fp2,0)Average(6,TC(1),fp2,0)
EndTable

Section 6. Data Table Declarations and Output Processing Instructions
6-6
WorstCase (TableName, NumCases, MaxMin, Change, RankVar)Allows saving the most significant or “ worst-case” events in separate datatables.
A data table is created that is sized to hold one event. This table acts as theevent buffer. Each event that occurs is stored to this table. This table may usethe DataEvent instruction or some other condition to determine when an eventis stored. The significance of an event is determined by an algorithm in theprogram and a numerical ranking of the event is stored in a variable.
WorstCase creates as many clones of the specified table as the number of casesfor which to keep data. When WorstCase is executed, it checks the rankingvariable; if the value of the variable is a new worst case, the data in the eventtable replace the data in the cloned table that holds the least significant eventcurrently stored.
An additional data table, nameWC (e.g., EvntWC) is created that holds thevalues of the rank variables for each of the worst case tables and the time thatthat table was stored.
WorstCase must be used with data tables sent to the CPU. It will not work ifthe event table is sent to the PC card.
While WorstCase acts as Trigger Modifier and a data table declaration(creating the cloned data tables), it is entered within the program to call theworst case tables (see example).
Parameter& Data Type
Enter
TableNamename
The name of the data table to clone. The length of this name should be 4 characters orless so the complete names of the worst case tables are retained when collected (seeNumCases).
NumCases The number of “ worst” cases to store. This is the number of clones of the data table tocreate. The cloned tables use the name of the table being cloned (up to the first 6characters) plus a 2 digit number (e.g., Evnt01, Evnt02, Evnt03, …). The numbers givethe tables unique names, they have no relationship to the ranking of the events. PC9000uses this same name modification when creating a new data file for a table. To avoidconfusion and ambiguous names when collecting data with PC9000, keep the base namefour characters or less (4character base name + 2 digit case identifier + 2 digit collectionidentifier = 8 character maximum length).
MaxMin A code specifying whether the maximum or minimum events should be saved.Constant Value Result
0 Min, save the events associated with the minimum ranking; i.e.,Keep track of the RankVar associated with each event stored.If a new RankVar is less than previous maximum, copy theevent over the event with previous maximum)
1 Max, save the events associated with the maximum ranking;i.e., copy if RankVar is greater than previous lowest (over eventwith previous minimum)
ChangeConstant
The minimum change that must occur in the RankVariable before a new worst case isstored.
RankVarVariable
The Variable to rank the events by.

Section 6. Data Table Declarations and Output Processing Instructions
6-7
WorstCase Example
This program demonstrates the Worst Case Instruction. Five type Tthermocouples are measured. The event is similar to that in the example forthe DataEvent instruction; the trigger for the start of a data event is whenTC(1) exceeds 30 degrees C. However in this example, the stop trigger is setimmediately true. This is done to set a fixed size for the event which can beduplicated in the worst case tables. To use the worst case instruction withevents of varying duration, the event table size must be selected toaccommodate the maximum duration expected (or needed). The event consistsof 20 records prior to the start trigger and continues until 100 recordsfollowing the start trigger.
The ranking criteria is the number of readings following the trigger that TC(1)stays above 30 degrees C. The greater the number the “ worse” the event.
Const RevDiff 1 'Reverse input to cancel offsetsConst Del 0 'Use default delayConst Integ 0 'Use default IntegrationConst NumCases 5 'Number of Worst Cases to saveConst Max 1Public RefTemp 'Declare the variable used for reference temperaturePublic TC(5) 'Declare the variable used for thermocouple measurementsPublic I, NumAbove30 ‘Declare index and the ranking variableUnits RefTemp=degC 'Units TC=degC
DataTable (Evnt,1,125)DataInterval(0,00,msec,10) 'Set the sample interval equal to the scanDataEvent(20,TC(1)>30,-1,100) '20 records before TC(1)>30,
‘100 records after TC(1)>30Sample(1,RefTemp,IEEE4) 'Sample the reference temperatureSample(5,TC,IEEE4) 'Sample the 5 thermocouple temperatures
EndTable
BeginProgScan(500,mSec,3,0)
ModuleTemp(RefTemp,1,5,30) TCDiff(TC(),5,mV50C,5,9,TypeT,RefTemp,RevDiff,Del,Integ,1,0) CallTable Evnt
If Evnt.EventEnd(1,1) Check if an Event just EndedI=100 ‘Initialize IndexNumAbove30=0 ‘Zero Ranking VariableDo ‘Loop through the Event table
NumAbove30=NumAbove30+1 ‘Counting the # of times TC(1)>30I=I-1
Loop While I>0 and Evnt.TC(1,I)>=30 ‘Quit looping when at end or TC(1)<30WorstCase(Evnt,NumCases,Max,0,NumAbove30) ‘Check for worst case
End IfNextScan
EndProg
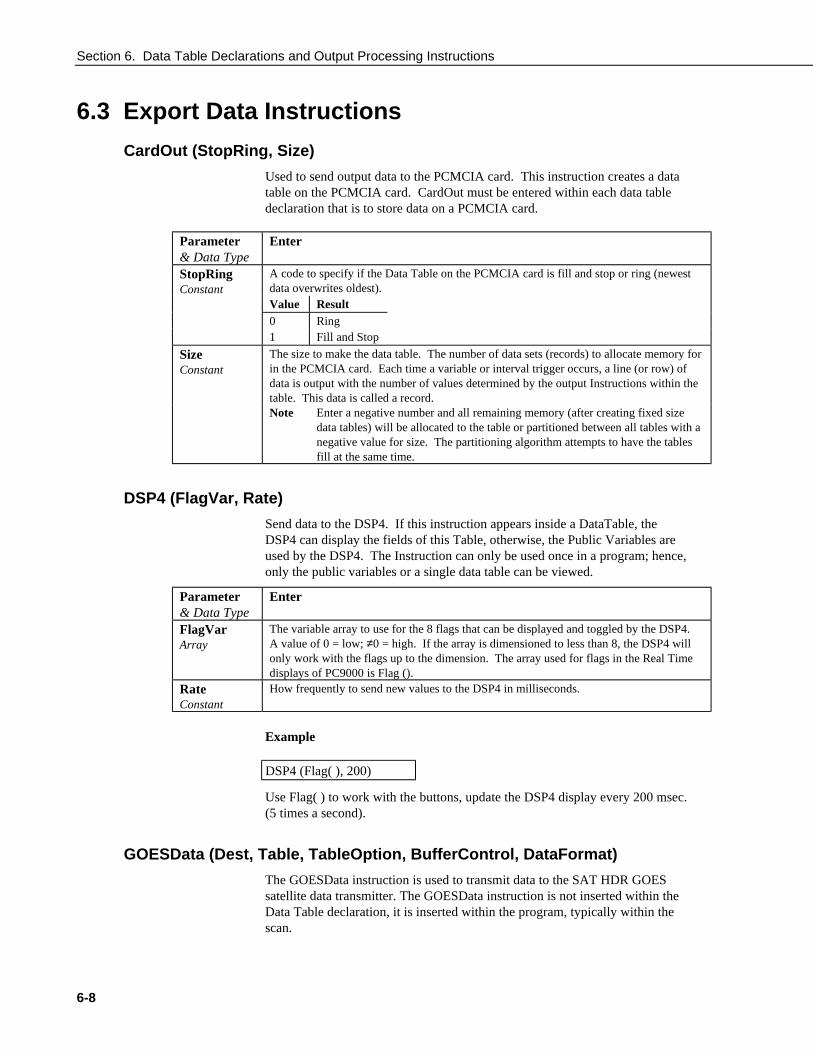
Section 6. Data Table Declarations and Output Processing Instructions
6-8
6.3 Export Data Instructions
CardOut (StopRing, Size)
Used to send output data to the PCMCIA card. This instruction creates a datatable on the PCMCIA card. CardOut must be entered within each data tabledeclaration that is to store data on a PCMCIA card.
Parameter& Data Type
Enter
StopRingConstant
A code to specify if the Data Table on the PCMCIA card is fill and stop or ring (newestdata overwrites oldest).Value Result0 Ring1 Fill and Stop
SizeConstant
The size to make the data table. The number of data sets (records) to allocate memory forin the PCMCIA card. Each time a variable or interval trigger occurs, a line (or row) ofdata is output with the number of values determined by the output Instructions within thetable. This data is called a record.Note Enter a negative number and all remaining memory (after creating fixed size
data tables) will be allocated to the table or partitioned between all tables with anegative value for size. The partitioning algorithm attempts to have the tablesfill at the same time.
DSP4 (FlagVar, Rate)
Send data to the DSP4. If this instruction appears inside a DataTable, theDSP4 can display the fields of this Table, otherwise, the Public Variables areused by the DSP4. The Instruction can only be used once in a program; hence,only the public variables or a single data table can be viewed.
Parameter& Data Type
Enter
FlagVarArray
The variable array to use for the 8 flags that can be displayed and toggled by the DSP4.A value of 0 = low; ≠0 = high. If the array is dimensioned to less than 8, the DSP4 willonly work with the flags up to the dimension. The array used for flags in the Real Timedisplays of PC9000 is Flag ().
RateConstant
How frequently to send new values to the DSP4 in milliseconds.
Example
DSP4 (Flag( ), 200)
Use Flag( ) to work with the buttons, update the DSP4 display every 200 msec.(5 times a second).
GOESData (Dest, Table, TableOption, BufferControl, DataFormat)
The GOESData instruction is used to transmit data to the SAT HDR GOESsatellite data transmitter. The GOESData instruction is not inserted within theData Table declaration, it is inserted within the program, typically within thescan.

Section 6. Data Table Declarations and Output Processing Instructions
6-9
Data transfer to the transmitter can occur via the datalogger's CS I/O port only.The GOESData instruction has the following parameters:
When the datalogger sends a command, further processing taskswill be performed only after a response has been received fromthe HDR GOES Transmitter.
Parameter& Data Type
Enter
Dest The variable that holds a result code for the transmission. The result codes are:Variable or Code DescriptionArray 0 Command executed successfully
2 Timed out waiting for STX character from transmitter after SDCaddressing
3 Wrong character received after SDC addressing.4 Something other than ACK returned when select data buffer command
was executed5 Timed out waiting for ACK6 CS I/O port not available7 Random message transmit failure (could be no data in buffer)
TableTable Name
The data table from which record(s) should be transmitted.
TableOption The TableOption indicates which records should be sent from the data table.Constant Code Description
0 send all records since last execution1 send only the most recent record stored in the table
BufferControlConstant
The BufferControl parameter specifies which buffer should be used (random orself-timed) and whether data should be overwritten or appended to the existingdata. Data stored in the self-timed buffer is transmitted only during apredetermined time frame. Data is erased from the transmitter's buffer after eachtransmission. Data in the random buffer is transmitted immediately after athreshold has been exceeded. The transmission is randomly repeated to insure itis received.Code Description0 Append to self-timed buffer1 Overwrite self-timed buffer2 Append to random buffer3 Overwrite random buffer9 Clear random buffer
NOTE

Section 6. Data Table Declarations and Output Processing Instructions
6-10
Parameter& Data Type
Enter
DataFormat The DataFormat parameter specifies the format of the data sent to the transmitterConstant Code Description
0 CSI FP2 data; 3 bytes per data point1 Floating point ASCII; 7 bytes per data point2 18-bit binary integer; 3 bytes per data point, numbers to the right of
the decimal are truncated3 RAWS7; 7 data points:
Data Point Description1 total rainfall in inches, format = xx.xxx2 wind speed MPH, format = xxx3 vector average wind direction in degrees, format = xxx4 air temperature in degrees F, format = xxx5 RH percentage, format = xxx6 fuel stick temperature in degrees F, format = xxx7 battery voltage in VDC, format = xx.x
4 Fixed decimal ASCII xxx.x5 Fixed decimal ASCII xx.xx6 Fixed decimal ASCII x.xxx7 Fixed decimal ASCII xxx8 Fixed decimal ASCII xxxxx
GOESStatus (Dest, StatusCommand)
The GOESStatus instruction is used to request status and diagnosticinformation from the SAT HDR GOES satellite transmitter.
When the datalogger sends a command, further processing taskswill be performed only after a response has been received fromthe HDR GOES Transmitter.
Parameter& Data Type
Enter
DestArray
An array that will hold the result codes returned from the transmitter. The size ofthe array is determined by the option chosen in the StatusCommand.Code Description0 Command executed successfully1 Checksum failure in response2 Timeout waiting for STX character after SDC addressing3 Wrong character (not STX) received after SDC addressing4 Received a NAK5 Timed out waiting for ACK6 CS I/O port not available7 Transmit random message failure, could be no data9 Invalid command
NOTE
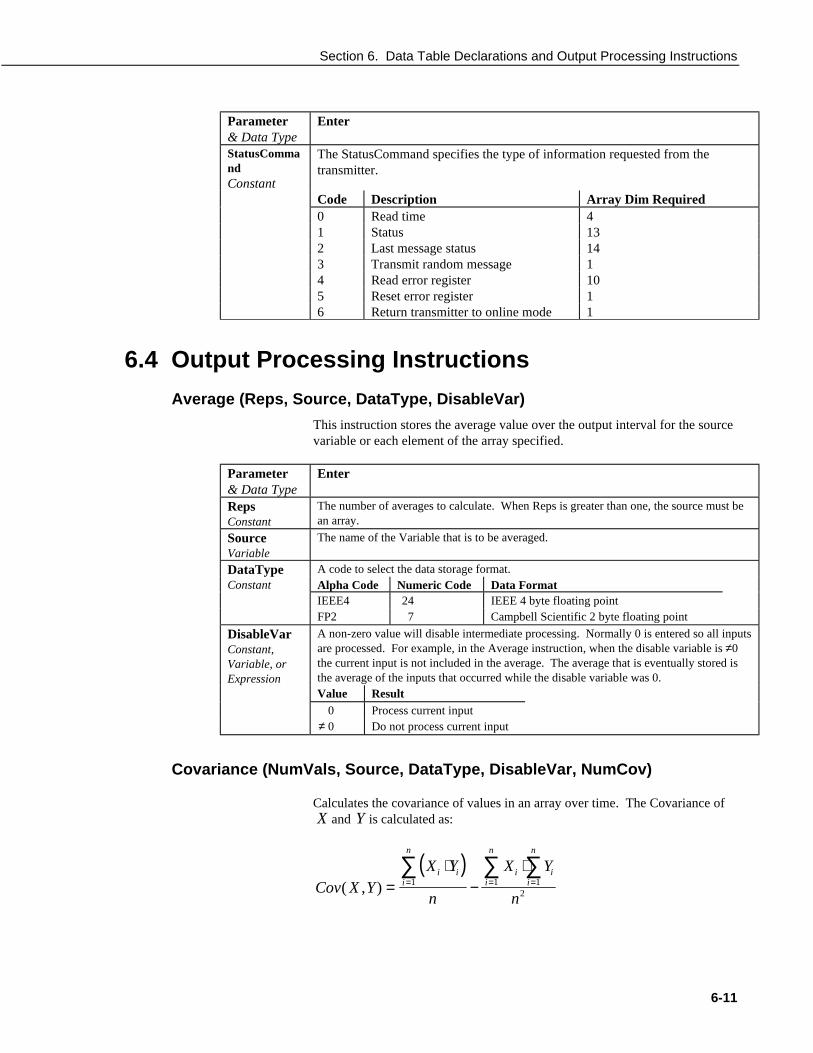
Section 6. Data Table Declarations and Output Processing Instructions
6-11
Parameter& Data Type
Enter
StatusCommandConstant
The StatusCommand specifies the type of information requested from thetransmitter.
Code Description Array Dim Required0 Read time 41 Status 132 Last message status 143 Transmit random message 14 Read error register 105 Reset error register 16 Return transmitter to online mode 1
6.4 Output Processing Instructions
Average (Reps, Source, DataType, DisableVar)
This instruction stores the average value over the output interval for the sourcevariable or each element of the array specified.
Parameter& Data Type
Enter
RepsConstant
The number of averages to calculate. When Reps is greater than one, the source must bean array.
SourceVariable
The name of the Variable that is to be averaged.
DataType A code to select the data storage format.Constant Alpha Code Numeric Code Data Format
IEEE4 24 IEEE 4 byte floating pointFP2 7 Campbell Scientific 2 byte floating point
DisableVarConstant,Variable, orExpression
A non-zero value will disable intermediate processing. Normally 0 is entered so all inputsare processed. For example, in the Average instruction, when the disable variable is ≠0the current input is not included in the average. The average that is eventually stored isthe average of the inputs that occurred while the disable variable was 0.Value Result
0 Process current input≠ 0 Do not process current input
Covariance (NumVals, Source, DataType, DisableVar, NumCov)
Calculates the covariance of values in an array over time. The Covariance ofX and Y is calculated as:
( )Cov X Y
X Y
n
X Y
n
i ii
n
ii
n
ii
n
( , ) =⋅
−⋅
= = =∑ ∑ ∑
1 1 12
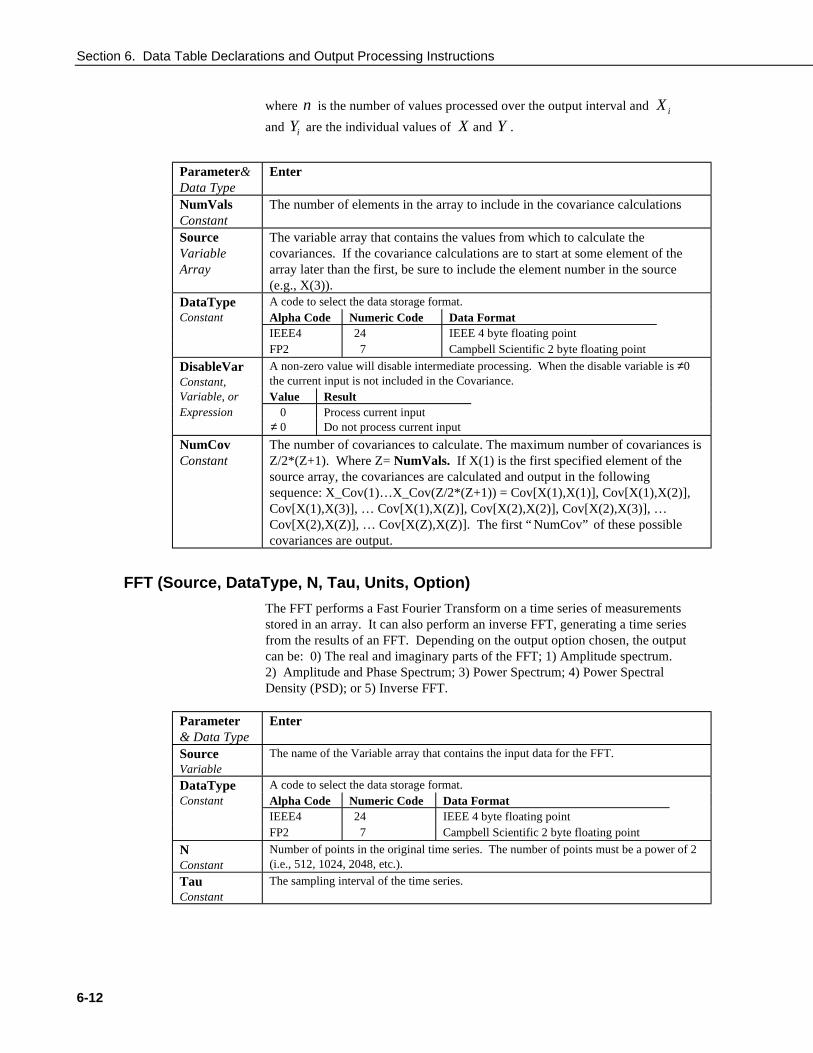
Section 6. Data Table Declarations and Output Processing Instructions
6-12
where n is the number of values processed over the output interval and X i
and Yi are the individual values of X and Y .
Parameter&Data Type
Enter
NumValsConstant
The number of elements in the array to include in the covariance calculations
SourceVariableArray
The variable array that contains the values from which to calculate thecovariances. If the covariance calculations are to start at some element of thearray later than the first, be sure to include the element number in the source(e.g., X(3)).
DataType A code to select the data storage format.Constant Alpha Code Numeric Code Data Format
IEEE4 24 IEEE 4 byte floating pointFP2 7 Campbell Scientific 2 byte floating point
DisableVarConstant,
A non-zero value will disable intermediate processing. When the disable variable is ≠0the current input is not included in the Covariance.
Variable, or Value ResultExpression 0 Process current input
≠ 0 Do not process current input
NumCovConstant
The number of covariances to calculate. The maximum number of covariances isZ/2*(Z+1). Where Z= NumVals. If X(1) is the first specified element of thesource array, the covariances are calculated and output in the followingsequence: X_Cov(1)…X_Cov(Z/2*(Z+1)) = Cov[X(1),X(1)], Cov[X(1),X(2)],Cov[X(1),X(3)], … Cov[X(1),X(Z)], Cov[X(2),X(2)], Cov[X(2),X(3)], …Cov[X(2),X(Z)], … Cov[X(Z),X(Z)]. The first “ NumCov” of these possiblecovariances are output.
FFT (Source, DataType, N, Tau, Units, Option)
The FFT performs a Fast Fourier Transform on a time series of measurementsstored in an array. It can also perform an inverse FFT, generating a time seriesfrom the results of an FFT. Depending on the output option chosen, the outputcan be: 0) The real and imaginary parts of the FFT; 1) Amplitude spectrum.2) Amplitude and Phase Spectrum; 3) Power Spectrum; 4) Power SpectralDensity (PSD); or 5) Inverse FFT.
Parameter& Data Type
Enter
SourceVariable
The name of the Variable array that contains the input data for the FFT.
DataType A code to select the data storage format.Constant Alpha Code Numeric Code Data Format
IEEE4 24 IEEE 4 byte floating pointFP2 7 Campbell Scientific 2 byte floating point
NConstant
Number of points in the original time series. The number of points must be a power of 2(i.e., 512, 1024, 2048, etc.).
TauConstant
The sampling interval of the time series.
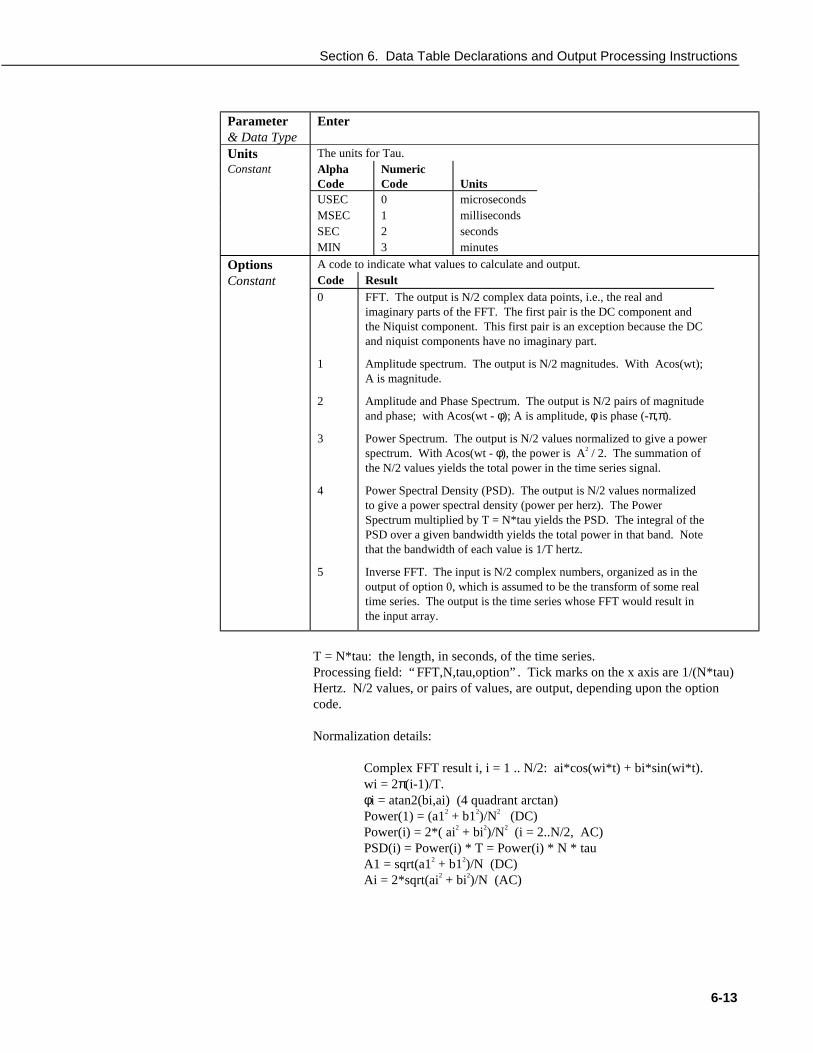
Section 6. Data Table Declarations and Output Processing Instructions
6-13
Parameter& Data Type
Enter
Units The units for Tau.Constant Alpha
CodeNumericCode Units
USEC 0 microsecondsMSEC 1 millisecondsSEC 2 secondsMIN 3 minutes
Options A code to indicate what values to calculate and output.
Constant Code Result0
1
2
3
4
5
FFT. The output is N/2 complex data points, i.e., the real andimaginary parts of the FFT. The first pair is the DC component andthe Niquist component. This first pair is an exception because the DCand niquist components have no imaginary part.
Amplitude spectrum. The output is N/2 magnitudes. With Acos(wt);A is magnitude.
Amplitude and Phase Spectrum. The output is N/2 pairs of magnitudeand phase; with Acos(wt - φ); A is amplitude, φ is phase (-π,π).
Power Spectrum. The output is N/2 values normalized to give a powerspectrum. With Acos(wt - φ), the power is A2 / 2. The summation ofthe N/2 values yields the total power in the time series signal.
Power Spectral Density (PSD). The output is N/2 values normalizedto give a power spectral density (power per herz). The PowerSpectrum multiplied by T = N*tau yields the PSD. The integral of thePSD over a given bandwidth yields the total power in that band. Notethat the bandwidth of each value is 1/T hertz.
Inverse FFT. The input is N/2 complex numbers, organized as in theoutput of option 0, which is assumed to be the transform of some realtime series. The output is the time series whose FFT would result inthe input array.
T = N*tau: the length, in seconds, of the time series.Processing field: “ FFT,N,tau,option” . Tick marks on the x axis are 1/(N*tau)Hertz. N/2 values, or pairs of values, are output, depending upon the optioncode.
Normalization details:
Complex FFT result i, i = 1 .. N/2: ai*cos(wi*t) + bi*sin(wi*t).wi = 2π(i-1)/T.φi = atan2(bi,ai) (4 quadrant arctan)Power(1) = (a12 + b12)/N2 (DC)Power(i) = 2*( ai2 + bi2)/N2 (i = 2..N/2, AC)PSD(i) = Power(i) * T = Power(i) * N * tauA1 = sqrt(a12 + b12)/N (DC)Ai = 2*sqrt(ai2 + bi2)/N (AC)

Section 6. Data Table Declarations and Output Processing Instructions
6-14
Notes:
• Power is independent of the sampling rate (1/tau) and of the number ofsamples (N).
• The PSD is proportional to the length of the sampling period (T=N*tau),since the “ width” of each bin is 1/T.
• The sum of the AC bins (excluding DC) of the Power Spectrum is theVariance (AC Power) of the time series.
• The factor of 2 in the Power(i) calculation is due to the power series beingmirrored about the Niquist frequency N/(2*T); only half the power isrepresented in the FFT bins below N/2, with the exception of DC. Hence,DC does not have the factor of 2.
• The Inverse FFT option assumes that the data array input is the transformof a real time series. Filtering is performed by taking an FFT on a data set,zeroing certain frequency bins, and then taking the Inverse FFT.Interpolation is performed by taking an FFT, zero padding the result, andthen taking the Inverse FFT of the larger array. The resolution in the timedomain is increased by the ratio of the size of the padded FFT to the sizeof the unpadded FFT. This can be used to increase the resolution of amaximum or minimum, as long as aliasing is avoided.
FFT Example
Const SIZE_FFT 16CONST PI 3.141592654Const CYCLESperT 2Const AMPLITUDE 3Const DC 7Const OPT_FFT 0CONST PI 3.141592654
dim ipublic x(SIZE_FFT),y(SIZE_FFT)
DataTable(Amp,1,1) fft(x,fp2,SIZE_FFT,10 msec,1)EndTableDataTable(AmpPhase,1,1) fft(x,fp2,SIZE_FFT,10 msec,2)EndTableDataTable(power,1,1) fft(x,fp2,SIZE_FFT,10 msec,3)EndTableDataTable(PSD,1,1) fft(x,fp2,SIZE_FFT,10 msec,4)EndTableDataTable(FFT,1,1) fft(x,IEEE4,SIZE_FFT,10 msec,0)EndTable

Section 6. Data Table Declarations and Output Processing Instructions
6-15
DataTable(IFFT,1,1) 'inverse FFT fft(y,IEEE4,SIZE_FFT,10 msec,5)EndTable
BeginProg
Scan(10, msec,0,SIZE_FFT) i=i+1 X(i) = DC + Sin(PI/8+2*PI*CYCLESperT*i/SIZE_FFT) * AMPLITUDE + Sin(PI/2+PI*i)Next Scan
CallTable(Amp)CallTable(AmpPhase)CallTable(Power)CallTable(PSD)CallTable(FFT)for i = 1 to SIZE_FFT ' get result back into y() y(i) = FFT.x_fft(i,1)nextCallTable(IFFT) ' inverse, result is the same as x()
EndProg
FieldNames “list of fieldnames”
The FieldNames instructions may be used to override the fieldnames that theCR5000 generates for results sent to the data table. Fieldnames mustimmediately follow the output instruction creating the data fields. Field namesare limited to 19 characters. Individual names may be entered for each resultgenerated by the previous output instruction or an array may be used to namemultiple fields. When the program is compiled, the CR5000 will determinehow many fields are created. If the list of names is greater than the number offields the extra names are ignored. If the number of fields is greater than thenumber names in the list of fieldnames, the default names are used for theremaining fields.
Example
Sample(4, Temp(1), IEEE4)FieldNames “ IntakeT, CoolerT, PlenumT, ExhaustT”
The 4 values from the variable array temp are stored in the output table withthe names IntakeT, CoolerT, PlenumT, and ExhaustT.
Sample(4, Temp(1), IEEE4)FieldNames “ IntakeT, CoolerT”
The 4 values from the variable array Temp are stored in the output table with 2individual names and the remainder of the default array Temp:IntakeT, CoolerT, Temp(3), and Temp(4),
Section 6. Data Table Declarations and Output Processing Instructions
6-16
Sample(4, Temp(1), IEEE4)FieldNames “ IntakeT(2)”
The 4 values from the variable array Temp are stored in the output table withIntakeT,an array of 2, and the remainder of the default array Temp:IntakeT(1), IntakeT(2), Temp(3), and Temp(4),
Histogram (BinSelect, DataType, DisableVar, Bins, Form, WtVal, LoLim,UpLim)
Processes input data as either a standard histogram (frequency distribution) ora weighted value histogram.
The standard histogram counts the time that the bin select variable is within aparticular sub-range of its specified range. The count in a bin is incrementedwhenever the bin select input falls within the sub-range associated with the bin.The value that is output to the data table for each bin can either be theaccumulated total count for each bin or a relative fraction of time computed bydividing the accumulated total in each bin by the total number of scans. Thisform of output is also referred to as a frequency distribution.
The weighted value histogram does not add a constant to the bin but insteadadds the current value of a variable. That variable name is entered as theweighted value. Each time the instruction is executed, the weighted value isadded to a bin. The sub-range that the bin select value is in determines the binto which the weighted value is added. When the histogram is output, the valueaccumulated in each bin can be output or the totals can be divided by theTOTAL number of input scans and then output. These values are thecontributions of the sub-ranges to the overall weighted value. A common useof a closed form weighted value histogram is the wind speed rose. Wind speedvalues (the weighted value input) are accumulated into corresponding directionsectors (bin select input).
To obtain the average of the weighted values that occurred while the bin selectvalue was within a particular sub-range, the weighted value output must bedivided by the fraction of time that the bin select value was within thatparticular sub-range (i.e., a standard histogram of the bin select value must alsobe output; for each bin the weighted value output must be divided by thefrequency distribution output).
The frequency distribution histogram is specified by entering a constant in theweighted value parameter. Enter 1 to have frequency output as the fraction ofthe total time that the bin select value was within the bin range. Enter 100 tohave the frequency output as the percent of time. Enter a variable name for theweighted value histogram.
At the user's option, the histogram may be either closed or open. The openform includes all values below the lower range limit in the first bin and allvalues above the upper range limit in the last bin. The closed form excludesany values falling outside the histogram range.
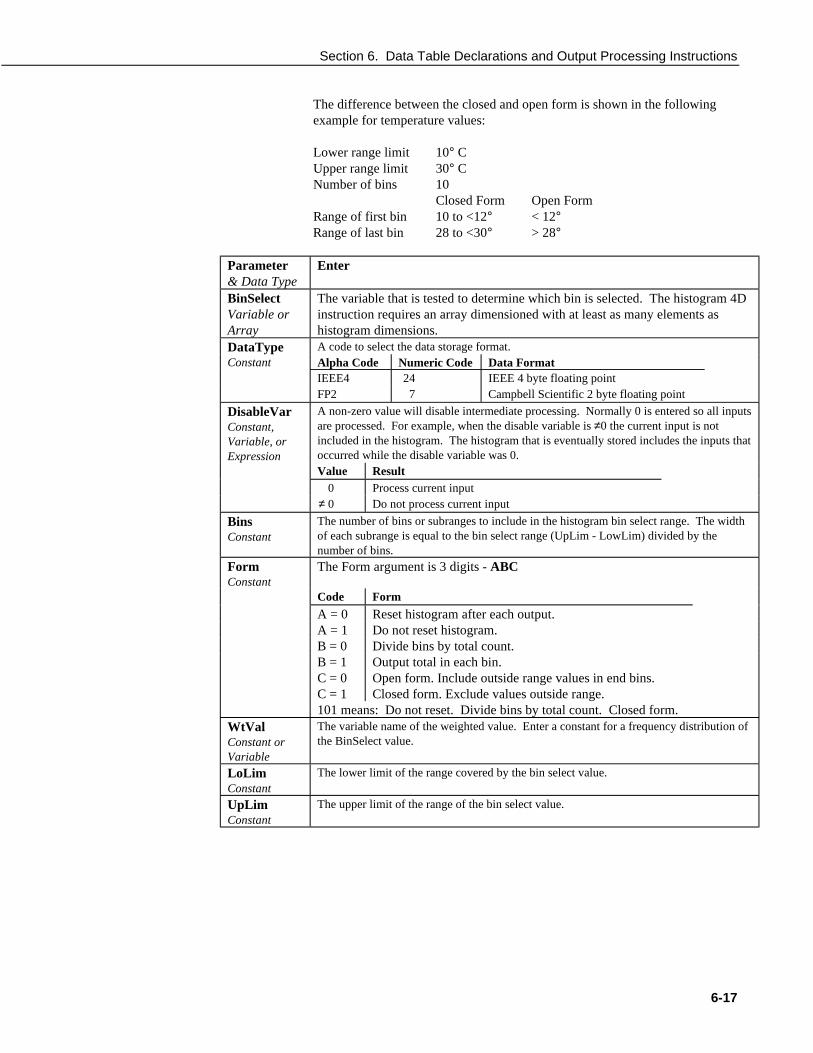
Section 6. Data Table Declarations and Output Processing Instructions
6-17
The difference between the closed and open form is shown in the followingexample for temperature values:
Lower range limit 10° CUpper range limit 30° CNumber of bins 10
Closed Form Open FormRange of first bin 10 to <12° < 12°Range of last bin 28 to <30° > 28°
Parameter& Data Type
Enter
BinSelectVariable orArray
The variable that is tested to determine which bin is selected. The histogram 4Dinstruction requires an array dimensioned with at least as many elements ashistogram dimensions.
DataType A code to select the data storage format.Constant Alpha Code Numeric Code Data Format
IEEE4 24 IEEE 4 byte floating pointFP2 7 Campbell Scientific 2 byte floating point
DisableVarConstant,Variable, orExpression
A non-zero value will disable intermediate processing. Normally 0 is entered so all inputsare processed. For example, when the disable variable is ≠0 the current input is notincluded in the histogram. The histogram that is eventually stored includes the inputs thatoccurred while the disable variable was 0.Value Result
0 Process current input≠ 0 Do not process current input
BinsConstant
The number of bins or subranges to include in the histogram bin select range. The widthof each subrange is equal to the bin select range (UpLim - LowLim) divided by thenumber of bins.
FormConstant
The Form argument is 3 digits - ABC
Code Form
A = 0 Reset histogram after each output.A = 1 Do not reset histogram.B = 0 Divide bins by total count.B = 1 Output total in each bin.C = 0 Open form. Include outside range values in end bins.C = 1 Closed form. Exclude values outside range.101 means: Do not reset. Divide bins by total count. Closed form.
WtValConstant orVariable
The variable name of the weighted value. Enter a constant for a frequency distribution ofthe BinSelect value.
LoLimConstant
The lower limit of the range covered by the bin select value.
UpLimConstant
The upper limit of the range of the bin select value.

Section 6. Data Table Declarations and Output Processing Instructions
6-18
Histogram4D (BinSelect, Source, DataType, DisableVar, Bins1, Bins2,Bins3, Bins4, Form, WtVal, LoLim1, UpLim1, LoLim2, UpLim2,LoLim3, UpLim3, LoLim4, UpLim4)
Processes input data as either a standard histogram (frequency distribution) ora weighted value histogram of up to 4 dimensions.
The description of the Histogram instruction also applies to the Histogram4Dinstruction. The difference is that the Histogram4D instruction allows up tofour bin select inputs (dimensions). The bin select values are specified asvariable array. Each of the bin select values has its own range and number ofbins. The total number of bins is the product of the number of bins in eachdimension (Bins1 x Bins2 x Bins3 x Bins4).
Histogram4D Output Example'The example program below is an example of using the Histogram4D'instruction to calculate a 2 dimensional histogram of RPM distribution vs Gear
'\\\\\\\\\\\\\\\\\\\\ VARIABLES and CONSTANTS ////////////////////
Public RPM, Gear, Port(4)Dim Bin(2)
'\\\\\\\\\\\\\\\\\\\\\\\\ OUTPUT SECTION ////////////////////////
DataTable (RPMvsG,1,100)DataInterval(0,60,Min,100)Histogram4D(Bin(), FP2, 0,4,8, 0, 0,000,1,0.5, 4.5, 0,8000, 0, 0, 0, 0)'4 bins for gear, range 0.5 to 4.5; 8 bins for RPM range 0 to 8000'Open form so that RPM >8000 is included in 7000 to 8000 bin
EndTable
'\\\\\\\\\\\\\\\\\\\\\\\\\\\ PROGRAM ///////////////////////////
BeginProgScan (100,mSec,3,0)PulseCount (RPM,1,1 ,1,1,0.4225,0)'RPM from pick up on 142 tooth fly wheel
'60 rpm/142 Hz = 0.42253 ...Portget (Port(1),1) 'There are digital inputs to ports 1 to 4Portget (Port(2),2) 'If C1 is high then the care is in first gearPortget (Port(3),3) 'C2 indicates 2nd gear etc.Portget (Port(4),4)
IF Port(1) then Gear = 1If Port(2) Then Gear = 2If Port(3) Then Gear = 3If Port(4) Then Gear = 4
Bin(1) = GearBin(2) = RPMCallTable RPMvsGNext Scan
EndProg

Section 6. Data Table Declarations and Output Processing Instructions
6-19
LevelCrossing (Source, DataType, DisableVar, NumLevels, 2ndDim,CrossingArray, 2ndArray, Hysteresis, Option)
Parameter& Data Type
Enter
SourceVariable orArray
The variable that is tested to determine if it crosses the specified levels. If a twodimensional level crossing is selected, the source must be an array. The secondelement of the array (or the next element beyond the one specified for thesource) is the variable that is tested to determine the second dimension of thehistogram.
DataType A code to select the data storage format.Constant Alpha Code Numeric Code Data Format
IEEE4 24 IEEE 4 byte floating pointFP2 7 Campbell Scientific 2 byte floating point
DisableVarConstant,Variable, orExpression
A non-zero value will disable intermediate processing. Normally 0 is entered so all inputsare processed. For example, when the disable variable is ≠0 the current input is notincluded in the histogram. The histogram that is eventually stored includes the inputs thatoccurred while the disable variable was 0.Value Result
0 Process current input≠ 0 Do not process current input
NumLevelsConstant
The number levels on which to count crossings. This is the number of bins in which tostore the number of crossings for the associated level. The actual levels are input in theCrossing Array. A count is added to a bin when the Source goes from less than theassociated level to greater than the associated level (Rising edge or positive polarity). Orif Falling edge or negative polarity is selected, a count occurs if the source goes fromgreater than the level to less than the level.
2ndDimConstant
The second dimension of the histogram. The total number of bins output =NumLevels*2ndDim. Enter 1 for a one dimensional histogram consisting only of thenumber of level crossings. If 2ndDim is greater than 1, the element of the source arrayfollowing the one tested for level crossing is used to determine the second dimension.
CrossingArrayArray
The name of the Array that contains the Crossing levels to check. Because it does notmake sense to change the levels while the program is running, the program should bewritten to load the values into the array once before entering the scan.
2ndArrayArray
The name of the Array that contains the levels that determine the second dimension.Because it does not make sense to change the levels while the program is running, theprogram should be written to load the values into the array once before entering the scan.
HysteresisConstant
The minimum change in the source that must occur for a crossing to be counted.
OptionConstant
The Option code is 3 digits - ABC
Code Form
A = 0 Count on falling edge (source goes form > level to <level)
A = 1 Count on rising edge (source goes from < level to >level)
B = 0 Reset histogram counts to 0 after each output.B = 1 Do not reset histogram; continue to accumulate counts.C = 0 Divide count in each bin by total number of counts in all bins.C = 1 Output total counts in each bin.101 means: Count on rising edge, reset count to 0 after each output, outputcounts.
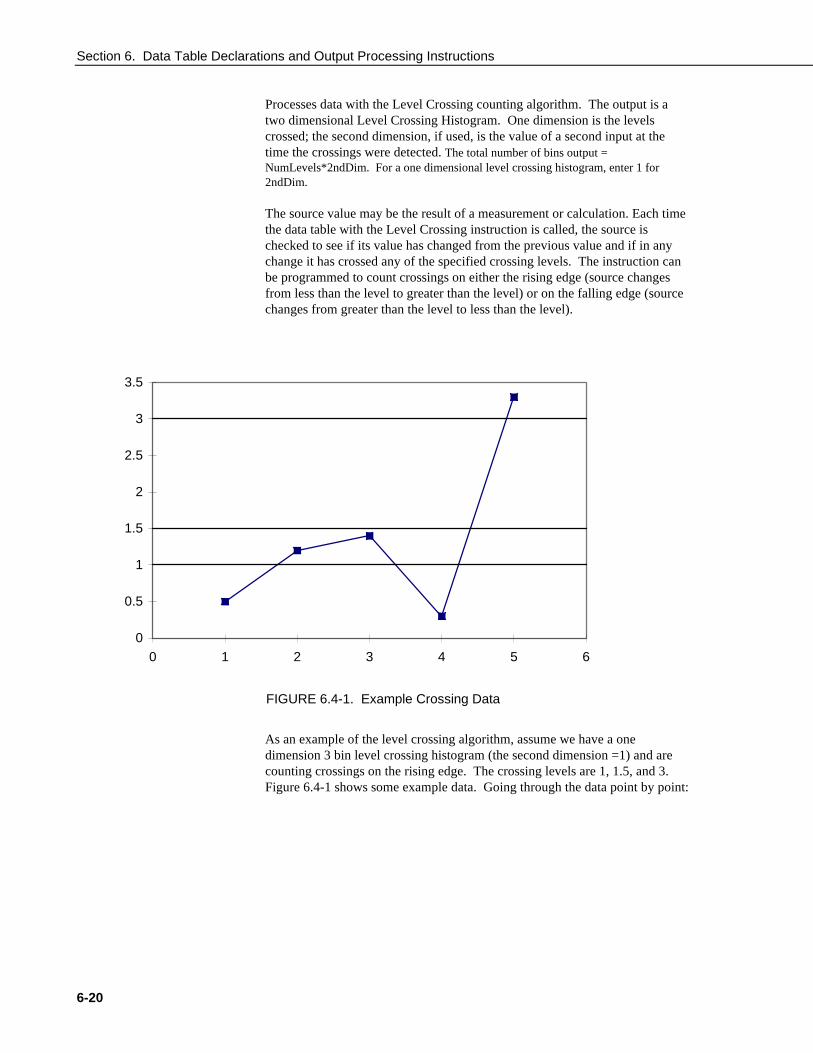
Section 6. Data Table Declarations and Output Processing Instructions
6-20
Processes data with the Level Crossing counting algorithm. The output is atwo dimensional Level Crossing Histogram. One dimension is the levelscrossed; the second dimension, if used, is the value of a second input at thetime the crossings were detected. The total number of bins output =NumLevels*2ndDim. For a one dimensional level crossing histogram, enter 1 for2ndDim.
The source value may be the result of a measurement or calculation. Each timethe data table with the Level Crossing instruction is called, the source ischecked to see if its value has changed from the previous value and if in anychange it has crossed any of the specified crossing levels. The instruction canbe programmed to count crossings on either the rising edge (source changesfrom less than the level to greater than the level) or on the falling edge (sourcechanges from greater than the level to less than the level).
0
0.5
1
1.5
2
2.5
3
3.5
0 1 2 3 4 5 6
FIGURE 6.4-1. Example Crossing Data
As an example of the level crossing algorithm, assume we have a onedimension 3 bin level crossing histogram (the second dimension =1) and arecounting crossings on the rising edge. The crossing levels are 1, 1.5, and 3.Figure 6.4-1 shows some example data. Going through the data point by point:
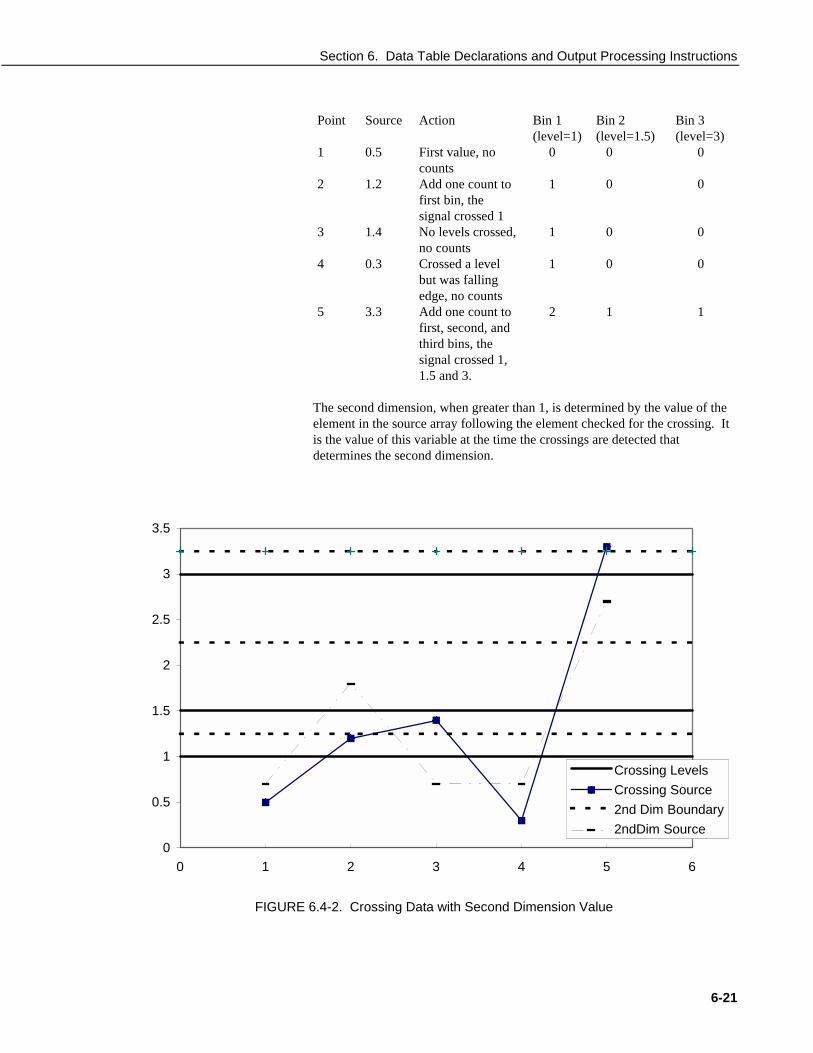
Section 6. Data Table Declarations and Output Processing Instructions
6-21
Point Source Action Bin 1(level=1)
Bin 2(level=1.5)
Bin 3(level=3)
1 0.5 First value, nocounts
0 0 0
2 1.2 Add one count tofirst bin, thesignal crossed 1
1 0 0
3 1.4 No levels crossed,no counts
1 0 0
4 0.3 Crossed a levelbut was fallingedge, no counts
1 0 0
5 3.3 Add one count tofirst, second, andthird bins, thesignal crossed 1,1.5 and 3.
2 1 1
The second dimension, when greater than 1, is determined by the value of theelement in the source array following the element checked for the crossing. Itis the value of this variable at the time the crossings are detected thatdetermines the second dimension.
0
0.5
1
1.5
2
2.5
3
3.5
0 1 2 3 4 5 6
Crossing LevelsCrossing Source2nd Dim Boundary2ndDim Source
FIGURE 6.4-2. Crossing Data with Second Dimension Value

Section 6. Data Table Declarations and Output Processing Instructions
6-22
Point CrossingSource
2nd DimSource
Action
1 0.5 .7 First value, no counts2 1.2 1.8 Add one count to first crossing,
second 2D bin, the signal crossed1
Histogram:2D < 1.25 1.25<2D<2.25 2.25<2D<3.25
Cross 1 0 1 0Cross 1.5 0 0 0Cross 3 0 0 0
3 1.4 .7 No levels crossed, no counts4 0.3 .7 Crossed a level but was falling
edge, no counts5 3.3 2.7 Add one count to first, second, and
third crossing bins in the third 2Dbin, the signal crossed 1, 1.5 and 3.
Histogram:2D < 1.25 1.25<2D<2.25 2.25<2D<3.25
Cross 1 0 1 1Cross 1.5 0 0 1Cross 3 0 0 1
Note that the first bin of the second dimension is always “ open” . Any valueless than the specified boundary is included in this bin. The last bin of thesecond dimension is always “ closed” . It only includes values that are less thanits upper boundary and greater than or equal to the upper boundary of theprevious bin. If you want the histogram to be “ open” on both ends of thesecond dimension, enter an upper boundary for the last bin that is greater thanany possible second dimension source value.
The crossing levels and the boundaries for the second dimension are notspecified in the LevelCrossing instruction but are contained in variable arrays.This allows the levels to be spaced in any manner the programmer desires.The arrays need to be dimensioned to at least the same size as the dimensionsof the histogram. If a one dimension level crossing histogram is selected (1entered for the second dimension) the name of the Crossing Array can also beentered for the 2nd Array to avoid declaring an unused array. The programmust load the values into these arrays.
The array specifying the boundaries of the second dimension is loaded with theupper limits for each bin. For example, assume the second dimension is 3, andthe upper limits loaded into the array containing the second dimensionboundaries are 1, 3, and 6.
The value of each element (bin) of the histogram can be either the actualnumber of times the signal crossed the level associated with that bin or it canbe the fraction of the total number of crossings counted that were associatedwith that bin (i.e., number of counts in the bin divided by total number ofcounts in all bins).

Section 6. Data Table Declarations and Output Processing Instructions
6-23
The hysteresis determines the minimum change in the input that must occurbefore a crossing is counted. If the value is too small, “ crossings” could becounted which are in reality just noise. For example, suppose 5 is a crossinglevel. If the input is not really changing but is varying from 4.999 to 5.001, ahysteresis of 0 would allow all these crossings to be counted. Setting thehysteresis to 0.1 would prevent this noise from causing counts.
Maximum (Reps, Source, DataType, DisableVar, Time)
This instruction stores the MAXIMUM value that occurs in the specifiedSource variable over the output interval. Time of maximum value(s) isOPTIONAL output information, which is selected by entering the appropriatecode in the time parameter.
Parameter& Data Type
Enter
RepsConstant
The number of maximum values to determine. When repetitions are greater than 1, thesource must be an array..
SourceVariable
The name of the Variable that is the input for the instruction.
DataType A code to select the data storage format.Constant Alpha Code Numeric Code Data Format
IEEE4 24 IEEE 4 byte floating pointFP2 7 Campbell Scientific 2 byte floating point
DisableVarConstant,Variable, orExpression
A non-zero value will disable intermediate processing. Normally 0 is entered so all inputsare processed. For example, when the disable variable is ≠0 the current input is notchecked for a new maximum. The maximum that is eventually stored is the maximumthat occurred while the disable variable was 0.Value Result
0 Process current input≠ 0 Do not process current input
Time Option to store time of Maximum. When time is output, the maximums for all reps areoutput first followed by the respective times at which they occurred.
Constant Value Result0 Do not store time1 Store time
Minimum (Reps, Source, DataType, DisableVar, Time)
This instruction stores the MINIMUM value that occurs in the specified Sourcevariable over the output interval. Time of minimum value(s) is OPTIONALoutput information, which is selected by entering the appropriate code for
Parameter& Data Type
Enter
RepsConstant
The number of minimum values to determine. When repetitions are greater than 1, thesource must be an array..
SourceVariable
The name of the Variable that is the input for the instruction.

Section 6. Data Table Declarations and Output Processing Instructions
6-24
Parameter& Data Type
Enter
DataType A code to select the data storage format.Constant Alpha Code Numeric Code Data Format
IEEE4 24 IEEE 4 byte floating pointFP2 7 Campbell Scientific 2 byte floating point
DisableVarConstant,Variable, orExpression
A non-zero value will disable intermediate processing. Normally 0 is entered so all inputsare processed. For example, when the disable variable is ≠0 the current input is notchecked for a new minimum. The minimum that is eventually stored is the minimum thatoccurred while the disable variable was 0.Value Result
0 Process current input≠ 0 Do not process current input
Time Option to store time of Minimum. When time is output, the minimum values for allrepetitions are output first followed by the times at which they occurred.
Constant Value Result0 Do not store time1 Store time
RainFlow (Source, DataType, DisableVar, MeanBins, AmpBins, Lowlimit,Highlimit, MinAmp, Form)
Parameter& Data Type
Enter
SourceVariable
The variable that is tested to determine which bin is selected
DataType A code to select the data storage format.Constant Alpha Code Numeric Code Data Format
IEEE4 24 IEEE 4 byte floating pointFP2 7 Campbell Scientific 2 byte floating point
DisableVarConstant,Variable, orExpression
A non-zero value will disable intermediate processing. Normally 0 is entered so all inputsare processed. For example, when the disable variable is ≠0 the current input is notincluded in the histogram. The histogram that is eventually stored includes the inputs thatoccurred while the disable variable was 0.Value Result
0 Process current input≠ 0 Do not process current input
MeanBinsConstant
This parameter allows sorting by the mean value of the signal during a stress strain cycle.The number entered is the number of bins or subranges to sort the mean values into.Enter 1 to disregard the signal value and only sort by the amplitude of the signal. Thewidth of each subrange is equal to the HiLimit - LowLimit divided by the number of bins.The lowest bin’s minimum value is the low limit and the highest bin’s maximum value isthe High limit
AmpBinsConstant
The number of bins or subranges to sort the amplitude of a stress strain cycle into. Thewidth of each subrange is equal to the HiLimit - LowLimit divided by the number of bins.
LowLimConstant
The lower limit of the input signal and the Mean Bins.
UpLimConstant
The upper limit of the input signal and the Mean Bins.
MinAmpConstant
The minimum amplitude that a stress strain cycle must have to be counted.
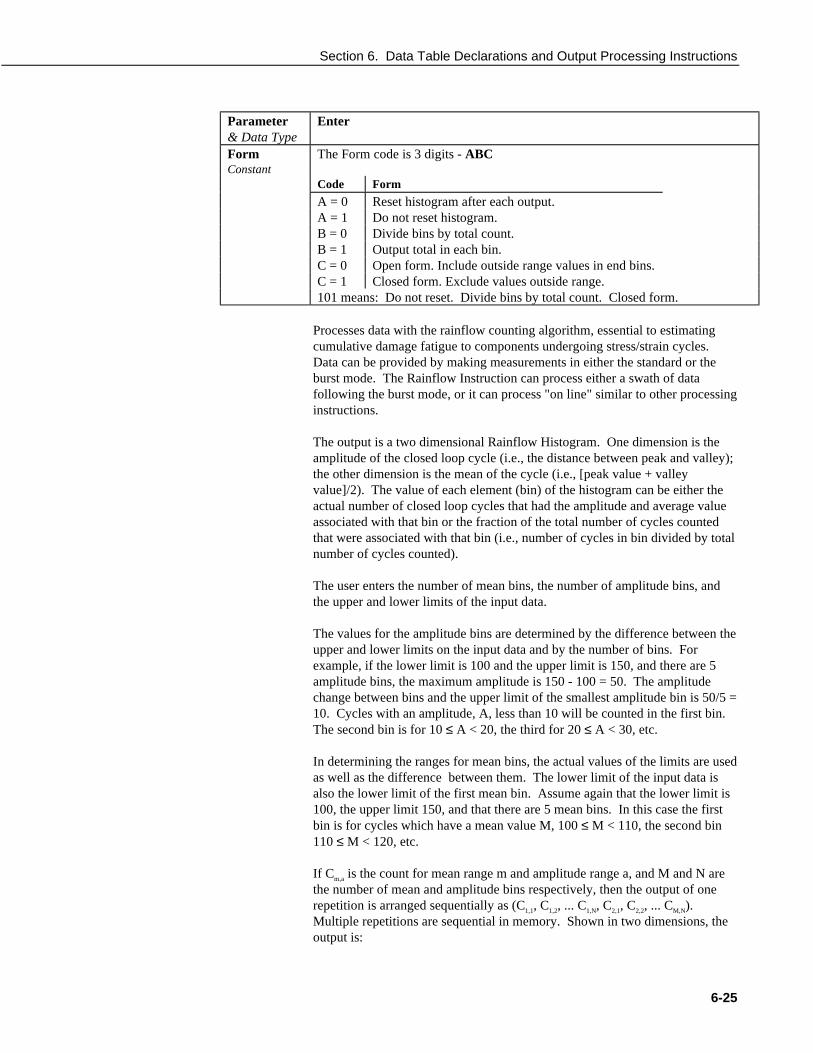
Section 6. Data Table Declarations and Output Processing Instructions
6-25
Parameter& Data Type
Enter
FormConstant
The Form code is 3 digits - ABC
Code Form
A = 0 Reset histogram after each output.A = 1 Do not reset histogram.B = 0 Divide bins by total count.B = 1 Output total in each bin.C = 0 Open form. Include outside range values in end bins.C = 1 Closed form. Exclude values outside range.101 means: Do not reset. Divide bins by total count. Closed form.
Processes data with the rainflow counting algorithm, essential to estimatingcumulative damage fatigue to components undergoing stress/strain cycles.Data can be provided by making measurements in either the standard or theburst mode. The Rainflow Instruction can process either a swath of datafollowing the burst mode, or it can process "on line" similar to other processinginstructions.
The output is a two dimensional Rainflow Histogram. One dimension is theamplitude of the closed loop cycle (i.e., the distance between peak and valley);the other dimension is the mean of the cycle (i.e., [peak value + valleyvalue]/2). The value of each element (bin) of the histogram can be either theactual number of closed loop cycles that had the amplitude and average valueassociated with that bin or the fraction of the total number of cycles countedthat were associated with that bin (i.e., number of cycles in bin divided by totalnumber of cycles counted).
The user enters the number of mean bins, the number of amplitude bins, andthe upper and lower limits of the input data.
The values for the amplitude bins are determined by the difference between theupper and lower limits on the input data and by the number of bins. Forexample, if the lower limit is 100 and the upper limit is 150, and there are 5amplitude bins, the maximum amplitude is 150 - 100 = 50. The amplitudechange between bins and the upper limit of the smallest amplitude bin is 50/5 =10. Cycles with an amplitude, A, less than 10 will be counted in the first bin.The second bin is for 10 ≤ A < 20, the third for 20 ≤ A < 30, etc.
In determining the ranges for mean bins, the actual values of the limits are usedas well as the difference between them. The lower limit of the input data isalso the lower limit of the first mean bin. Assume again that the lower limit is100, the upper limit 150, and that there are 5 mean bins. In this case the firstbin is for cycles which have a mean value M, 100 ≤ M < 110, the second bin110 ≤ M < 120, etc.
If Cm,a is the count for mean range m and amplitude range a, and M and N arethe number of mean and amplitude bins respectively, then the output of onerepetition is arranged sequentially as (C1,1, C1,2, ... C1,N, C2,1, C2,2, ... CM,N).Multiple repetitions are sequential in memory. Shown in two dimensions, theoutput is:

Section 6. Data Table Declarations and Output Processing Instructions
6-26
C1,1 C1,2 . . . C1,N
C2,1 C2,2 . . . C2,N
. . . .
. . . .
. . . .
CM,1 CM,2 . . . CM,N
The histogram can have either open or closed form. In the open form, a cyclethat has an amplitude larger than the maximum bin is counted in the maximumbin; a cycle that has a mean value less than the lower limit or greater than theupper limit is counted in the minimum or maximum mean bin. In the closedform, a cycle that is beyond the amplitude or mean limits is not counted.
The minimum distance between peak and valley, MinAmp, determines thesmallest amplitude cycle that will be counted. The distance should be less thanthe amplitude bin width ([high limit - low limit]/no. amplitude bins) or cycleswith the amplitude of the first bin will not be counted. However, if the value istoo small, processing time will be consumed counting "cycles" which are inreality just noise.
Outputs Generated: No. Mean Bins x No. Amplitude Bins x Reps
Sample (Reps, Source, DataType)
This instruction stores the current value(s) at the time of output from thespecified variable or array.
Parameter& Data Type
Enter
RepsConstant
The number of values to sample. When repetitions are greater than 1, the source must bean array.
SourceVariable
The name of the Variable to sample.
DataType A code to select the data storage format.Constant Alpha Code Numeric Code Data Format
IEEE4 24 IEEE 4 byte floating pointFP2 7 Campbell Scientific 2 byte floating point
StdDev (Reps, Source, DataType, DisableVar)
StdDev calculates the standard deviation of the Source(s) over the outputinterval.
δ( ) / /x x x N Ni ii
i N
i
i N= −
=
=
=
=
∑∑ 2
1
2
1
1
2
where ( )δ x is the standard deviation of x, and N is the number of samples

Section 6. Data Table Declarations and Output Processing Instructions
6-27
Parameter& Data Type
Enter
RepsConstant
The number of standard deviations to calculate. When repetitions are greater than 1, thesource must be an array.
SourceVariable
The name of the Variable that is the input for the instruction.
DataType A code to select the data storage format.Constant Alpha Code Numeric Code Data Format
IEEE4 24 IEEE 4 byte floating pointFP2 7 Campbell Scientific 2 byte floating point
DisableVarConstant,Variable, orExpression
A non-zero value will disable intermediate processing. Normally 0 is entered so all inputsare processed. For example, when the disable variable is ≠0 the current input is notincluded in the standard deviation. The standard deviation that is eventually stored is thestandard deviation of the inputs that occurred while the disable variable was 0.Value Result
0 Process current input≠ 0 Do not process current input
Totalize (Reps, Source, DataType, DisableVar)
This instruction stores the total(s) of the values of the source(s) over the givenoutput interval.
Parameter& Data Type
Enter
RepsConstant
The number of totals to calculate. When repetitions are greater than 1, the source must bean array.
SourceVariable
The name of the Variable that is the input for the instruction.
DataType A code to select the data storage format.Constant Alpha Code Numeric Code Data Format
IEEE4 24 IEEE 4 byte floating pointFP2 7 Campbell Scientific 2 byte floating point
DisableVarConstant,Variable, orExpression
A non-zero value will disable intermediate processing. Normally 0 is entered so all inputsare processed. For example, when the disable variable is ≠0 the current input is notincluded in the total. The total that is eventually stored is the total of the inputs thatoccurred while the disable variable was 0.Value Result
0 Process current input≠ 0 Do not process current input
WindVector (Repetitions, Speed/East, Direction/North, DataType,DisableVar, Subinterval, SensorType, OutputOpt)
WindVector processes wind speed and direction from either polar (wind speedand direction) or orthogonal (fixed East and North propellers) sensors. It usesthe raw data to generate the mean wind speed, the mean wind vectormagnitude, and the mean wind vector direction over an output interval. Twodifferent calculations of wind vector direction (and standard deviation of windvector direction) are available, one of which is weighted for wind speed.
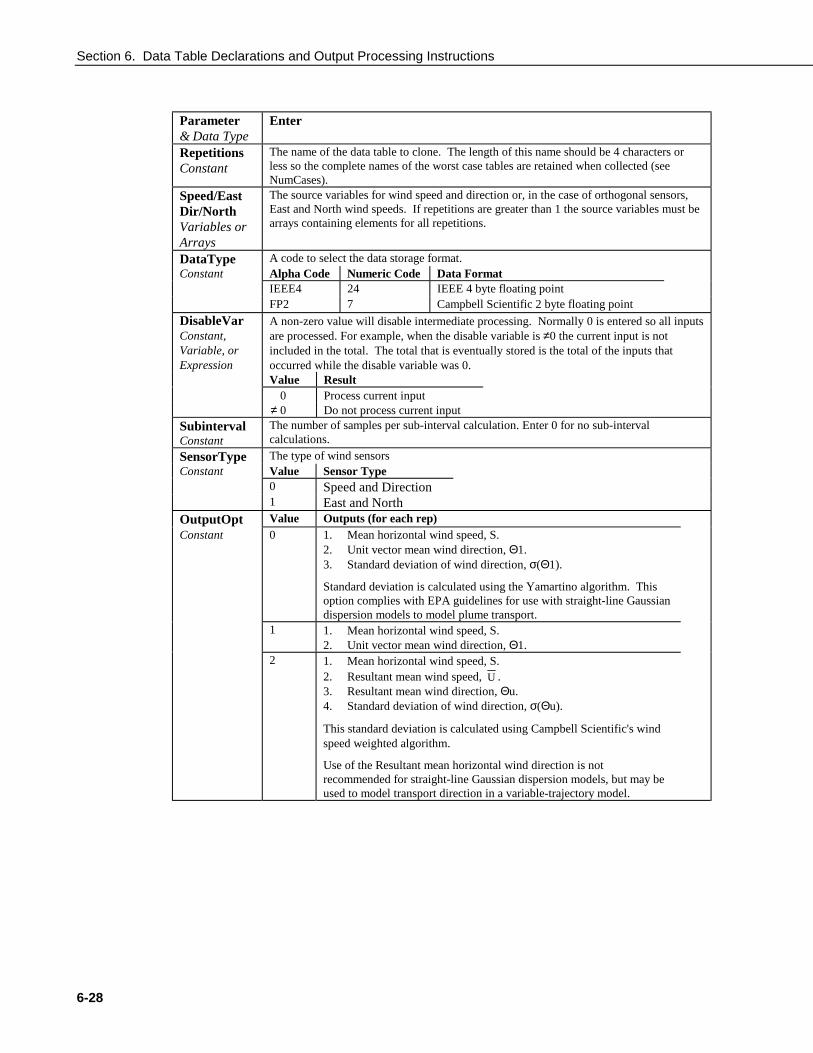
Section 6. Data Table Declarations and Output Processing Instructions
6-28
Parameter& Data Type
Enter
RepetitionsConstant
The name of the data table to clone. The length of this name should be 4 characters orless so the complete names of the worst case tables are retained when collected (seeNumCases).
Speed/EastDir/NorthVariables orArrays
The source variables for wind speed and direction or, in the case of orthogonal sensors,East and North wind speeds. If repetitions are greater than 1 the source variables must bearrays containing elements for all repetitions.
DataType A code to select the data storage format.Constant Alpha Code Numeric Code Data Format
IEEE4 24 IEEE 4 byte floating pointFP2 7 Campbell Scientific 2 byte floating point
DisableVarConstant,Variable, orExpression
A non-zero value will disable intermediate processing. Normally 0 is entered so all inputsare processed. For example, when the disable variable is ≠0 the current input is notincluded in the total. The total that is eventually stored is the total of the inputs thatoccurred while the disable variable was 0.Value Result
0 Process current input≠ 0 Do not process current input
SubintervalConstant
The number of samples per sub-interval calculation. Enter 0 for no sub-intervalcalculations.
SensorType The type of wind sensorsConstant Value Sensor Type
0 Speed and Direction1 East and North
OutputOpt Value Outputs (for each rep)Constant 0 1. Mean horizontal wind speed, S.
2. Unit vector mean wind direction, Θ1.3. Standard deviation of wind direction, σ(Θ1).
Standard deviation is calculated using the Yamartino algorithm. Thisoption complies with EPA guidelines for use with straight-line Gaussiandispersion models to model plume transport.
1 1. Mean horizontal wind speed, S.2. Unit vector mean wind direction, Θ1.
2 1. Mean horizontal wind speed, S.2. Resultant mean wind speed, U .3. Resultant mean wind direction, Θu.4. Standard deviation of wind direction, σ(Θu).
This standard deviation is calculated using Campbell Scientific's windspeed weighted algorithm.
Use of the Resultant mean horizontal wind direction is notrecommended for straight-line Gaussian dispersion models, but may beused to model transport direction in a variable-trajectory model.

Section 6. Data Table Declarations and Output Processing Instructions
6-29
When used with polar sensors, the instruction does a modulo divide by 360 onwind direction, which allows the wind direction (in degrees) to be 0 to 360, 0to 540, less than 0, or greater than 540. The ability to handle a negativereading is useful where a difficult to reach wind vane is improperly oriented.For example, a vane outputs 0 degrees at a true reading of 340 degrees. Thesimplest solution is to enter an offset of -20 in the instruction measuring thewind vane, which results in 0 to 360 degrees following the modulo divide.
When a wind speed sample is 0, the instruction uses 0 to process scalar orresultant vector wind speed and standard deviation, but the sample is not usedin the computation of wind direction. The user may not want a sample lessthan the sensor threshold used in the standard deviation. If this is the case,Write the datalogger program to check wind speed, and if it is less than thethreshold set the wind speed variable equal to 0 prior to calling the data table.
Standard deviation can be processed one of two ways: 1) using every sampletaken during the output period (enter 0 for the Subinterval parameter), or 2)by averaging standard deviations processed from shorter sub-intervals of theoutput period. Averaging sub-interval standard deviations minimizes theeffects of meander under light wind conditions, and it provides more completeinformation for periods of transition1.
Standard deviation of horizontal wind fluctuations from sub-intervals iscalculated as follows:
σ(Θ)=[((σΘ1)2+(σΘ2)2 ...+( σΘM)2)/M]1/2
where σ(Θ) is the standard deviation over the output interval, and σΘ1 ... σΘMare sub-interval standard deviations.
A sub-interval is specified as a number of scans. The number of scans for asub-interval is given by:
Desired sub-interval (secs) / scan rate (secs)
For example if the scan rate is 1 second and the Data Interval is 60 minutes, thestandard deviation is calculated from all 3600 scans when the sub-interval is 0.With a sub-interval of 900 scans (15 minutes) the standard deviation is theaverage of the four sub-interval standard deviations. The last sub-interval isweighted if it does not contain the specified number of scans.
Measured raw data:
Si = horizontal wind speedΘi = horizontal wind directionUei = east-west component of windUni = north-south component of windN = number of samples
1 EPA On-site Meteorological Program Guidance for Regulatory ModelingApplications.

Section 6. Data Table Declarations and Output Processing Instructions
6-30
Calculations:
FIGURE 6.4-2. Input Sample Vectors
In Figure 6.4-2, the short, head-to-tail vectors are the input sample vectorsdescribed by si and Θi , the sample speed and direction, or by Uei and Uni, the
east and north components of the sample vector. At the end of output intervalT, the sum of the sample vectors is described by a vector of magnitude U anddirection Θu. If the input sample interval is t, the number of samples in outputinterval T is N T t= / . The mean vector magnitude is U U N= / .
Scalar mean horizontal wind speed, S:
S=(Σsi)/Nwhere in the case of orthogonal sensors:
Si=(Uei2+Uni
2)1/2
Unit vector mean wind direction, Θ1:
Θ1=Arctan (Ux/Uy)where
Ux=(Σsin Θi)/NUy=(Σcos Θi)/N
or, in the case of orthogonal sensors
Ux=(Σ(Uei/Ui))/NUy=(Σ(Uni/Ui))/N
where Ui=(Uei2+Uni
2)1/2
Standard deviation of wind direction, σσσσ(ΘΘΘΘ1), using Yamartino algorithm:
σ(Θ1)=arc sin(ε)[1+0.1547 ε3]where,
ε=[1-((Ux)2+(Uy)2)]1/2
and Ux and Uy are as defined above.
sn
Θu
s 2
North
East
U
s1 s3
s 4

Section 6. Data Table Declarations and Output Processing Instructions
6-31
Resultant mean horizontal wind speed, U :
U =(Ue2+Un2)1/2
FIGURE 6.4-3. Mean Wind Vector
where for polar sensors:Ue=(ΣSi Sin Θi)/NUn=(ΣSi Cos Θi)/N
or, in the case of orthogonal sensors:Ue=(ΣUei)/NUn=(ΣUni)/N
Resultant mean wind direction, ΘΘΘΘu:
Θu=Arctan (Ue/Un)
Standard deviation of wind direction, σσσσ(ΘΘΘΘu), using Campbell Scientificalgorithm:
σ(Θu)=81(1- U /S)1/2
The algorithm for σ(θu) is developed by noting (Figure 6.4-4) that
Cos U / s ; where i i( ' ) 'Θ Θ Θ Θi i i u= = −
FIGURE 6.2-3. Standard Deviation of Direction
The Taylor Series for the Cosine function, truncated after 2 terms is:
Cos ( ' ) ( ' ) /Θ Θi i≅ −1 22
UUn
Ue
si
Θ'iΘu
UiU
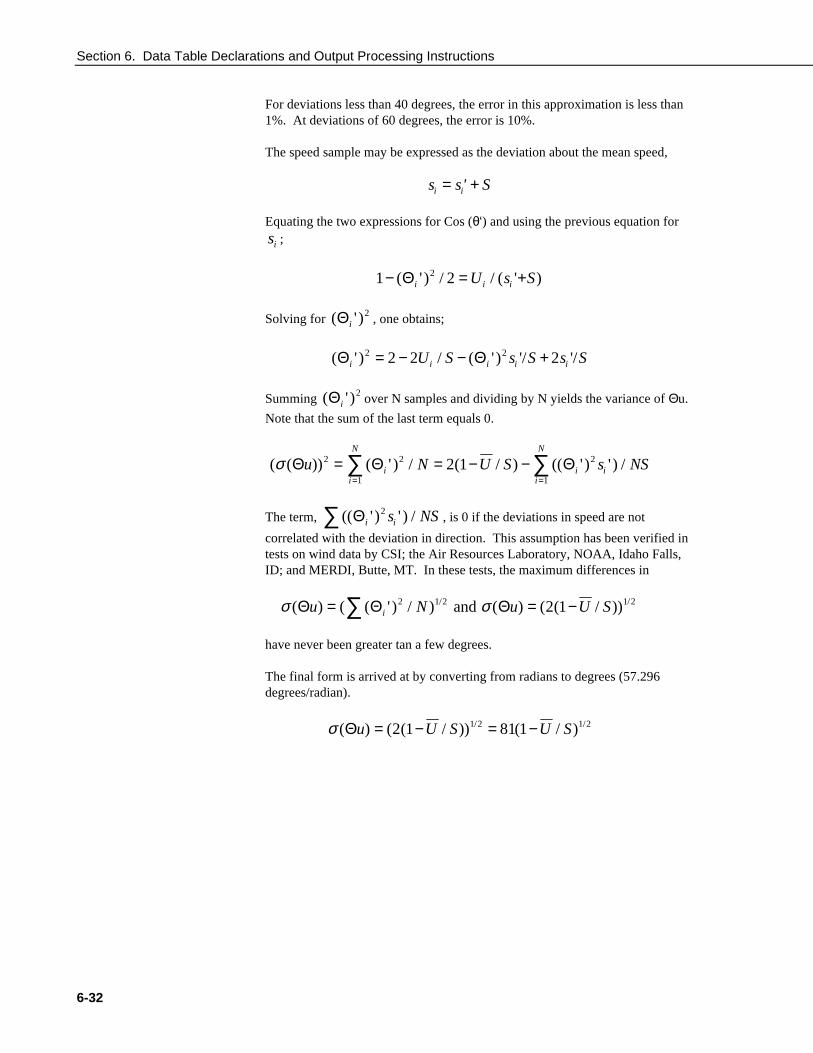
Section 6. Data Table Declarations and Output Processing Instructions
6-32
For deviations less than 40 degrees, the error in this approximation is less than1%. At deviations of 60 degrees, the error is 10%.
The speed sample may be expressed as the deviation about the mean speed,
s s' Si i= +
Equating the two expressions for Cos (θ‘) and using the previous equation forsi ;
1 22− = +( ' ) / / ( ' )Θi i iU s S
Solving for ( ' )Θi2 , one obtains;
( ' ) / ( ' ) '/ '/Θ Θi i i i iU S s S s S2 22 2 2= − − +
Summing ( ' )Θi2 over N samples and dividing by N yields the variance of Θu.
Note that the sum of the last term equals 0.
( ( )) ( ' ) / ( / ) (( ' ) ' ) /σ Θ Θ Θu N U S s NSi i ii
N
i
N2 2 2
112 1= = − −
==∑∑
The term, (( ' ) ' ) /Θi is NS2∑ , is 0 if the deviations in speed are not
correlated with the deviation in direction. This assumption has been verified intests on wind data by CSI; the Air Resources Laboratory, NOAA, Idaho Falls,ID; and MERDI, Butte, MT. In these tests, the maximum differences in
σ σ( ) ( ( ' ) / ) ( ) ( ( / ))/ /Θ Θ Θu N u U Si= = −∑ 2 1 2 1 22 1 and
have never been greater tan a few degrees.
The final form is arrived at by converting from radians to degrees (57.296degrees/radian).
σ ( ) ( ( / )) ( / )/ /Θu U S U S= − = −2 1 81 11 2 1 2

7-1
Section 7. Measurement Instructions
7.1 Voltage Measurements VoltDiff – Differential Voltage Measurement............................................. 7-3 VoltSE – Single-ended Voltage Measurement ............................................ 7-3
7.2 Thermocouple Measurements Measure the Output of Thermocouples and Convert to Temperature. TCDiff – Differential Voltage Measurement of Thermocouple .................. 7-3 TCSE – Single-ended Voltage Measurement of Thermocouple.................. 7-4
Resistance Bridge Measurements Bridge measurements combine an excitation with voltage measurements and are used to measure sensors that change resistance in response to the phenomenon being measured. These sensors include RTDS, thermistors, potentiometers, strain gages, and pressure and force transducers.
7.3 Half Bridges BrHalf – Half Bridge ................................................................................... 7-5 BrHalf3W – Three Wire Half Bridge .......................................................... 7-6 BrHalf4W – Four Wire Half Bridge............................................................ 7-6
7.4 Full Bridges BrFull – Four Wire Full Bridge ................................................................... 7-8 BrFull6W – Six Wire Full Bridge ............................................................... 7-9
7.5 Current Excitation Resistance - Measures Resistance or Full Bridge with Current
Excitation........................................................................................... 7-11
7.6 Excitation / Continuous Analog Output ExciteCAO - Sets the voltage of a Continuous Analog Output channel ... 7-13 ExciteI - Sets the specified current excitation channel to the current
specified............................................................................................. 7-14 ExciteV - Sets the specified switched voltage excitation channel to the
voltage specified ................................................................................ 7-14
7.7 Self Measurements Battery – Measures Battery Voltage or Current ........................................ 7-15 PanelTemp – (Used as a Reference for Thermocouple Measurements) .... 7-15 Calibrate – Adjusts the Calibration for Analog Measurements ................. 7-16

Section 7. Measurement Instructions
7-2
7.8 Digital I/O PeriodAvg - Measures the period or the frequency of a signal on a
single-ended channel.......................................................................... 7-19 PortGet - Reads the status of one of the eight control ports....................... 7-21 PortSet – Sets Digital Ports........................................................................ 7-22 PulseCount – Pulse/Frequency Measurement ............................................ 7-23 PulseCountReset - Resets Pulse Counters and Running Averages
Used in Pulse Count Instruction ........................................................ 7-25 ReadIO – Reads State of Digital I/O Ports................................................. 7-25 SW12 – Sets a switched 12 Volt supply high or low................................. 7-26 TimerIO – Measures the time between edges or frequency on the
digital I/O ports of the datalogger ...................................................... 7-27 WriteIO – Sets Digital Outputs.................................................................. 7-28
7.9 Peripheral Devices AM25T - Controls the AM25T multiplexer............................................... 7-29 AO4 – Sets the voltage to an SDM-AO4 output device ............................ 7-30 CANBUS – Measures and controls the SDM-CAN interface ................... 7-31 CD16AC – Controls an SDM-CD16AC, SDMCD16, or SDM-CD16D
16 channel relay/control port device.................................................. 7-36 CS7500 - Communicates with the CS7500 open path CO2 sensor ............ 7-37 CSAT3 - Communicates with the CSAT3 sonic anemometer ................... 7-38 INT8 – Allows the use of the SDM-INT8, 8 channel interval timer,
with the CR5000 ................................................................................ 7-39 SDMSpeed - Changes the rate that the CR5000 uses to clock the SDM
data..................................................................................................... 7-42 SDMTrigger - Allows the CR5000 to synchronize when measurements
are made............................................................................................. 7-42 SIO4 – Controls and transmits/retrieves data from a CSI SIO4 interface.. 7-42 SW8A – Controls the SDM-SW8A 8-channel switch closure module...... 7-44
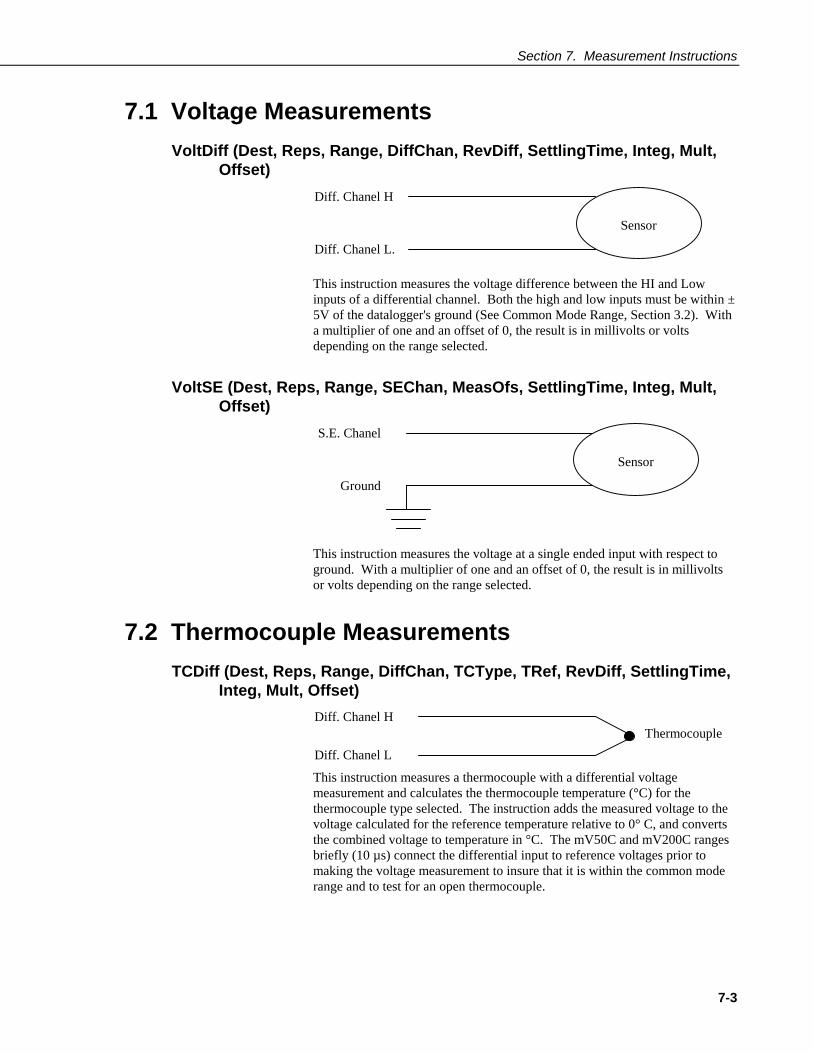
Section 7. Measurement Instructions
7-3
7.1 Voltage Measurements
VoltDiff (Dest, Reps, Range, DiffChan, RevDiff, SettlingTime, Integ, Mult, Offset)
Sensor
Diff. Chanel H
Diff. Chanel L.
This instruction measures the voltage difference between the HI and Low inputs of a differential channel. Both the high and low inputs must be within ± 5V of the datalogger's ground (See Common Mode Range, Section 3.2). With a multiplier of one and an offset of 0, the result is in millivolts or volts depending on the range selected.
VoltSE (Dest, Reps, Range, SEChan, MeasOfs, SettlingTime, Integ, Mult, Offset)
Sensor
S.E. Chanel
Ground
This instruction measures the voltage at a single ended input with respect to ground. With a multiplier of one and an offset of 0, the result is in millivolts or volts depending on the range selected.
7.2 Thermocouple Measurements
TCDiff (Dest, Reps, Range, DiffChan, TCType, TRef, RevDiff, SettlingTime, Integ, Mult, Offset)
Diff. Chanel H
Diff. Chanel LThermocouple
This instruction measures a thermocouple with a differential voltage measurement and calculates the thermocouple temperature (°C) for the thermocouple type selected. The instruction adds the measured voltage to the voltage calculated for the reference temperature relative to 0° C, and converts the combined voltage to temperature in °C. The mV50C and mV200C ranges briefly (10 µs) connect the differential input to reference voltages prior to making the voltage measurement to insure that it is within the common mode range and to test for an open thermocouple.

Section 7. Measurement Instructions
7-4
TCSE (Dest, Reps, Range, SEChan, TCType, TRef, MeasOfs, SettlingTime, Integ, Mult, Offset)
S.E. Chanel
GroundThermocouple
This instruction measures a thermocouple with a single-ended voltage measurement and calculates the thermocouple temperature (°C) for the thermocouple type selected. The instruction adds the measured voltage to the voltage calculated for the reference temperature relative to 0° C, and converts the combined voltage to temperature in °C.
Voltage and Thermocouple Parameters
Parameter & Data Type
Enter
Dest Variable or Array
The Variable in which to store the results of the instruction. When Reps are used the results are stored in an array with the variable name. An array must be dimensioned to have elements for all the Reps.
Reps Constant
The number of repetitions for the measurement or instruction.
Range Constant
Alpha Code
Numeric Code
Voltage Range
mV5000 0 ± 5000 mV mV1000 1 ± 1000 mV mV200 2 ± 200 mV mV50 3 ± 50 mV mV20 4 ± 20 mV AutoRange 5 mV20 - mV5000 Selects range (Sect. 3.1) mV200C
mV50C mV20C
20 30 40
± 200 mV ± 50 mV ± 20 mV
The mV200C, mV50C, and mV20C ranges pull the channel into common mode range and check for open input
DiffChan Constant
The differential channel number on which to make the first measurement. When Reps are used, subsequent measurements will be automatically made on the following channels. If the channel is entered as a negative number, all reps occur on that channel.
SEChan Constant
The single-ended channel number on which to make the first measurement. When Reps are used, subsequent measurements will be automatically made on the following channels. If the channel is entered as a negative number, all reps occur on that channel.
TCType Alpha Code
Numeric Code
Thermocouple Type
Constant TypeT 0 Copper Constantan TypeE 1 Chromel Constantan TypeK 2 Chromel Alumel TypeJ 3 Iron Constantan TypeB 4 Platinum Rhodium TypeR 5 Platinum Rhodium TypeS 6 Platinum Rhodium TRef Variable
The name of the variable that is the reference temperature for the thermocouple measurements.

Section 7. Measurement Instructions
7-5
Parameter & Data Type
Enter
RevDiff Code Value Result (Reversing requires twice as much time to complete) Constant False 0 Signal is measured with the high side referenced to the low True ≠0 A second measurement is made after reversing the inputs to cancel
offsets MeasOfs Constant
Code Value Result the Ground offset voltage is subtracted from single ended measurements.
False 0 Offset voltage is corrected from background calibration True ≠0 Offset voltage is measured each scan SettlingTime Constant
The time in microseconds to delay between setting up a measurement (switching to the channel, setting the excitation) and making the measurement. (1 microsecond resolution)
Entry Voltage Range Integration Settling Time 0 ± 20 mV Flash 200 µS (default) 0 All but ± 20 mV, Flash 100 µS (default) 0 All 250 µS 200 µS (default) 0 All _50Hz, _60 Hz 3 mS (default) >=100 All All µS entered Integ The time spent on integration in microseconds for each of the channels measured. Constant Entry Integration 0, 200 Flash Conversion; 200 = 2 flash conversions 100 µS apart
and averaged
250; 500-16000 250 µS; multiples of 500: 250 µS integrations starting each 500 µS and averaged
_60Hz or 16667 16,667 µS (reject 60 Hz noise) _50 Hz or 20000 20,000 µS (reject 50 Hz noise) Mult, Offset Constant, Variable, Array, or Expression
A multiplier and offset by which to scale the raw results of the measurement. See the measurement description for the units of the raw result; a multiplier of one and an offset of 0 are necessary to output in the raw units. For example, the TCDiff instruction measures a thermocouple and outputs temperature in degrees C. A multiplier of 1.8 and an offset of 32 will convert the temperature to degrees F.
7.3 Half Bridges
BrHalf (Dest, Reps, Range, SEChan, ExChan, MeasPEx, ExmV, RevEx, SettlingTime, Integ, Mult, Offset)
X = result w/mult = 1, offset = 0
X VV
RR Rx
s
s f= =
+1
This Instruction applies an excitation voltage, delays a specified time and then makes a single ended voltage measurement. The result with a multiplier of 1 and an offset of 0 is the ratio of the measured voltage divided by the excitation voltage.

Section 7. Measurement Instructions
7-6
BrHalf3W (Dest, Reps, Range, SEChan, ExChan, MeasPEx, ExmV, RevEx, SettlingTime, Integ, Mult, Offset)
X = result w/mult = 1, offset = 0
X V VV V
RRx
s
f=
−−
=2 2 1
1
This Instruction is used to determine the ratio of the sensor resistance to a known resistance using a separate voltage sensing wire from the sensor to compensate for lead wire resistance.
The measurement sequence is to apply an excitation voltage and make two voltage measurements on two adjacent single-ended channels: the first on the reference resistor and the second on the voltage sensing wire from the sensor. The two measurements are used to calculate the resulting value (multiplier = 1, offset = 0) that is the ratio of the voltage across the sensor to the voltage across the reference resistor.
BrHalf4W (Dest, Reps, Range1, Range2, DiffChan, ExChan, MeasPEx, ExmV, RevEx, RevDiff, SettlingTime, Integ, Mult, Offset)
X = result w/mult = 1, offset = 0
X VV
RR
s
f= =2
1
This Instruction applies an excitation voltage and makes two differential voltage measurements, then reverses the polarity of the excitation and repeats the measurements. The measurements are made on sequential channels. The result is the voltage measured on the second channel (V2) divided by the voltage measured on the first (V1). The connections are made so that V1 is the voltage drop across the fixed resistor (Rf), and V2 is the drop across the sensor (Rs). The result with a multiplier of 1 and an offset of 0 is V2 / V1 which equals Rs / Rf.

Section 7. Measurement Instructions
7-7
Half Bridge Parameters
Parameter & Data Type
Enter
Dest Variable or Array
The Variable in which to store the results of the instruction. When Reps are used the results are stored in an array with the variable name. An array must be dimensioned to have elements for all the Reps.
Reps Constant
The number of repetitions for the measurement or instruction.
Range Constant
Alpha Code Numeric Code
Voltage Range
mV5000 0 ± 5000 mV mV1000 1 ± 1000 mV mV200 2 ± 200 mV mV50 3 ± 50 mV mV20 4 ± 20 mV AutoRange 5 mV20 - mV5000 Selects range (Sect. 3.1) mV200C
mV50C mV20C
20 30 40
± 200 mV ± 50 mV ± 20 mV
The mV200C, mV50C, and mV20C ranges pull the channel into common mode range and check for open input
SEChan Constant
The single-ended channel number on which to make the first measurement. When Reps are used, subsequent measurements will be automatically made on the following single-ended channels. If the channel is entered as a negative number, all reps occur on that channel.
ExChan Enter the excitation channel number to excite the first measurement. Constan Alpha
Code Code/ Channel
Result
VX1 1 Switched excitation channels, are switched to the excitation voltage.
VX2 2 for the measurement and switched off between measurements. VX3 3 VX4 4 MeasPEx Constant
The number of sensors to excite with the same excitation channel before automatically advancing to the next excitation channel. To excite all the sensors with the same excitation channel, the number should equal the number of Reps.
ExmV Constant
The excitation voltage in millivolts. Allowable range ± 5000 mV. RevEx may be used to excite with both a positive and negative polarity to cancel offset voltages.
RevEx Code Value Result (Reversing requires twice as much time to complete) Constant False 0 Excite only with the excitation voltage entered True ≠0 A second measurement is made with the voltage polarity
reversed to cancel offsets
RevDiff Code Value Result (Reversing requires twice as much time to complete) Constant False 0 Signal is measured with the high side referenced to the low True ≠0 A second measurement is made after reversing the inputs to cancel
offsets

Section 7. Measurement Instructions
7-8
Parameter & Data Type
Enter
SettlingTime Constant
The time in microseconds to delay between setting up a measurement (switching to the channel, setting the excitation) and making the measurement. (1 microsecond resolution)
Entry Voltage Range Integration Settling Time 0 ± 20 mV Flash 200 µS (default) 0 All but ± 20 mV, Flash 100 µS (default) 0 All 250 µS 200 µS (default) 0 All _50Hz, _60 Hz 3 mS (default) >=100 All All µS entered Integ The time spent on integration in microseconds for each of the channels measured. Constant Entry Integration 0, 200 Flash Conversion; 200 = 2 flash conversions 100 µS apart
and averaged
250; 500-16000 250 µS; multiples of 500: 250 µS integrations starting each 500 µS and averaged
_60Hz or 16667 16,667 µS (reject 60 Hz noise) _50 Hz or 20000 20,000 µS (reject 50 Hz noise) Mult, Offset Constant, Variable, Array, or Expression
A multiplier and offset by which to scale the raw results of the measurement.
7.4 Full Bridges
BrFull (Dest, Reps, Range, DiffChan, ExChan, MeasPEx, ExmV, RevEx, RevDiff, SettlingTime, Integ, Mult, Offset)
X = result w/mult = 1, offset = 0
X VV
RR R
RR Rx
= =+
−+
⎛
⎝⎜
⎞
⎠⎟1000 10001 3
3 4
2
1 2
This Instruction applies an excitation voltage to a full bridge and makes a differential voltage measurement of the bridge output. The resulting value (multiplier = 1, offset = 0) is the measured voltage in millivolts divided by the excitation voltage in volts (i.e., millivolts per volt).

Section 7. Measurement Instructions
7-9
BrFull6W (Dest, Reps, Range1, Range2, DiffChan, ExChan, MeasPEx, ExmV, RevEx, RevDiff, SettlingTime, Integ, Mult, Offset)
X = result w/mult = 1, offset = 0
X VV
RR R
RR R
= =+
−+
⎛
⎝⎜
⎞
⎠⎟1000 10002
1
3
3 4
2
1 2
This Instruction applies an excitation voltage and makes two differential voltage measurements. The measurements are made on sequential channels. The result is the voltage measured on the second channel (V2) divided by the voltage measured on the first (V1). The result is 1000 times V2 / V1 or millivolts output per volt of excitation. The connections are made so that V1 is the measurement of the voltage drop across the full bridge, and V2 is the measurement of the bridge output.
Full Bridge Parameters
Parameter & Data Type
Enter
Dest Variable or Array
The Variable in which to store the results of the instruction. When Reps are used the results are stored in an array with the variable name. An array must be dimensioned to have elements for all the Reps.
Reps Constant
The number of repetitions for the measurement or instruction.
Range Constant
Alpha Code Numeric Code
Voltage Range
mV5000 0 ± 5000 mV mV1000 1 ± 1000 mV mV200 2 ± 200 mV mV50 3 ± 50 mV mV20 4 ± 20 mV AutoRange 5 mV20 - mV5000 Selects range (Sect. 3.1) mV200C
mV50C mV20C
20 30 40
± 200 mV ± 50 mV ± 20 mV
The mV200C, mV50C, and mV20C ranges pull the channel into common mode range and check for open input
DiffChan Constant
The differential channel number on which to make the first measurement. When Reps are used, subsequent measurements will be automatically made on the following differential channels. If the channel is entered as a negative number, all reps occur on that channel.
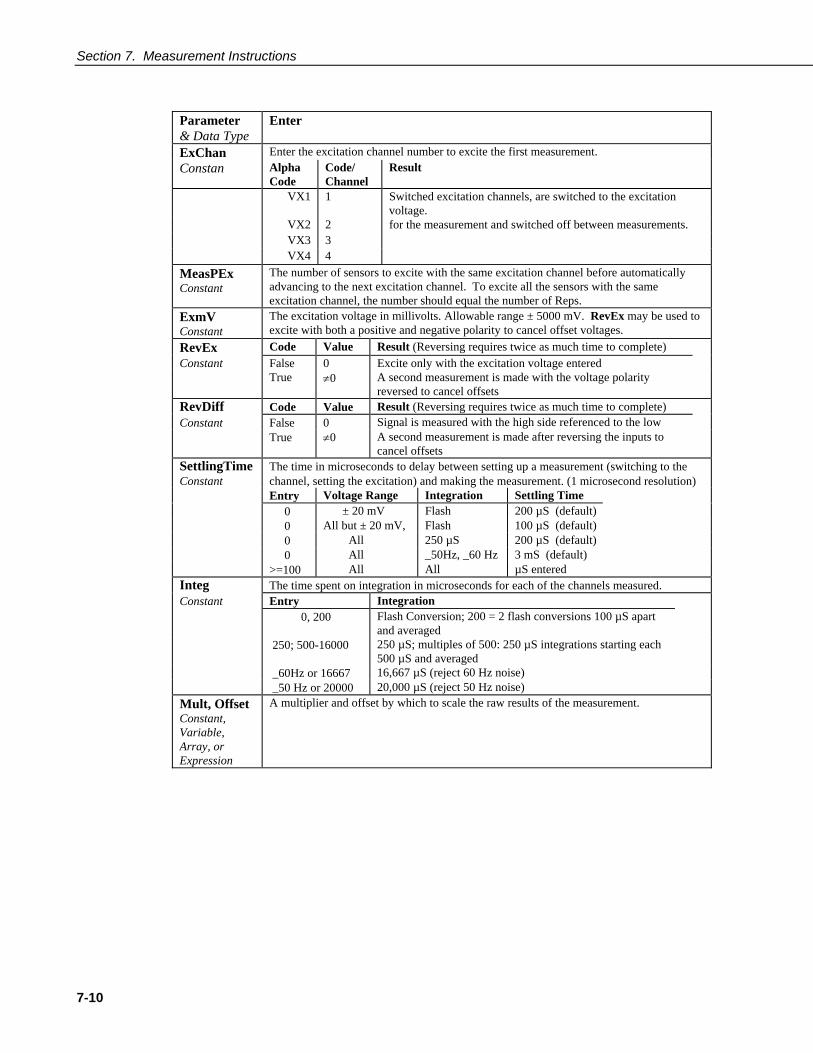
Section 7. Measurement Instructions
7-10
Parameter & Data Type
Enter
ExChan Enter the excitation channel number to excite the first measurement. Constan Alpha
Code Code/ Channel
Result
VX1 1 Switched excitation channels, are switched to the excitation voltage.
VX2 2 for the measurement and switched off between measurements. VX3 3 VX4 4 MeasPEx Constant
The number of sensors to excite with the same excitation channel before automatically advancing to the next excitation channel. To excite all the sensors with the same excitation channel, the number should equal the number of Reps.
ExmV Constant
The excitation voltage in millivolts. Allowable range ± 5000 mV. RevEx may be used to excite with both a positive and negative polarity to cancel offset voltages.
RevEx Code Value Result (Reversing requires twice as much time to complete) Constant False 0 Excite only with the excitation voltage entered True ≠0 A second measurement is made with the voltage polarity
reversed to cancel offsets
RevDiff Code Value Result (Reversing requires twice as much time to complete) Constant False 0 Signal is measured with the high side referenced to the low True ≠0 A second measurement is made after reversing the inputs to
cancel offsets
SettlingTime Constant
The time in microseconds to delay between setting up a measurement (switching to the channel, setting the excitation) and making the measurement. (1 microsecond resolution)
Entry Voltage Range Integration Settling Time 0 ± 20 mV Flash 200 µS (default) 0 All but ± 20 mV, Flash 100 µS (default) 0 All 250 µS 200 µS (default) 0 All _50Hz, _60 Hz 3 mS (default) >=100 All All µS entered Integ The time spent on integration in microseconds for each of the channels measured. Constant Entry Integration 0, 200 Flash Conversion; 200 = 2 flash conversions 100 µS apart
and averaged
250; 500-16000 250 µS; multiples of 500: 250 µS integrations starting each 500 µS and averaged
_60Hz or 16667 16,667 µS (reject 60 Hz noise) _50 Hz or 20000 20,000 µS (reject 50 Hz noise) Mult, Offset Constant, Variable, Array, or Expression
A multiplier and offset by which to scale the raw results of the measurement.

Section 7. Measurement Instructions
7-11
7.5 Current Excitation
Resistance (Dest, Reps, Range, DiffChan, IxChan, MeasPEx, ExuA, RevEx, RevDiff, SettlingTime, Integ, Mult,Offset)
The Resistance instruction applies a precision current excitation and measures a differential voltage. The result is the measured voltage divided by the excitation current. The measurement can be used to measure resistance or, with some sensors, to provide a current excitation for measuring a full bridge.
The excitation current is set in the instruction with a maximum current of 2500 microamps. The compliance voltage is ± 5 volts. The compliance voltage is the maximum or minimum voltage to which the excitation can go in order to drive the current specified. Some of the consequences of this are:
The maximum resistance that can be excited with 2500 µA= 5V/0.0025A = 2000 Ohms.
The maximum resistance that can be excited with 1000 µA = 5V/0.001A = 5000 Ohms.
The minimum resistance required to fill the 20 mV range = 0.02V/0.0025A = 8 Ohms.
The resistance instruction can be used for full bridge measurements were the sensor is calibrated for current excitation or the resistance across the bridge is constant (or assumed to be). The 2.5 mA maximum current excitation provides for reasonable output from the full bridge when the bridge resistance is in the range of 2000 to 5000 ohms. For lower resistance bridges such as 120 ohm or 350 ohm, measuring with the voltage excitation full bridge BrFull will allow a higher output from the bridge.
Resistance used to measure resistance
H
LH
L
I
IXR
X = result w/mult = 1, offset = 0
XVI
Rx
s= =

Section 7. Measurement Instructions
7-12
Resistance used to measure full bridge
HL
IXR
IX
X = result w/mult = 1, offset = 0
XVI
RR
R RR
R R
R R R R R RR R R R
xbridge= =
+−
+⎛⎝⎜
⎞⎠⎟
=+ − ++ + +
1 3
3 4
2
1 2
3 1 2 2 3 4
1 2 3 4
( ) ( )
( )R
R R X R R RX R
RR R X R R R
X R
RR R X R R R
X R
RR R X R R R
X R
12 4 2 3 4
3
21 3 1 3 4
4
32 4 1 2 4
1
41 3 1 2 3
2
=− − + +
−
=− + +
+
=− − + +
−
=− + +
+
( )
( )
( )
Resistance Parameters
Parameter & Data Type
Enter
Dest Variable or Array
The Variable in which to store the results of the instruction. When Reps are used the results are stored in an array with the variable name. An array must be dimensioned to have elements for all the Reps.
Reps Constant
The number of repetitions for the measurement or instruction.
Range Constant
Alpha Code Numeric Code
Voltage Range
mV5000 0 ± 5000 mV mV1000 1 ± 1000 mV mV200 2 ± 200 mV mV50 3 ± 50 mV mV20 4 ± 20 mV AutoRange 5 mV20 - mV5000 Selects range (Sect. 3.1) DiffChan Constant
The differential channel number on which to make the first measurement. When Reps are used, subsequent measurements will be automatically made on the following differential channels. If the channel is entered as a negative number, all reps occur on that channel.
IxChan Enter the current excitation channel number to use to excite the first measurement. Constant Alpha
Code Code/ Channel
Result
IX1 1 Current Excitation Channels IX2 2 IX3 3 IX4 4 MeasPEx Constant
The number of sensors to excite with the same excitation channel before automatically advancing to the next excitation channel. To excite all the sensors with the same excitation channel, the number should equal the number of Reps. With current excitation, the sensors must be wired in series when more than one measurement per excitation is made.
ExuA Constant
The excitation current in microamps. The allowable range is ±2500 µA. RevEx may be used to excite with both a positive and negative polarity to cancel offset voltages.
RevEx Code Value Result (Reversing requires twice as much time to complete) Constant False 0 Excite only with the current polarity entered True ≠0 A second measurement is made with the voltage polarity
reversed to cancel offsets
RevDiff Code Value Result (Reversing requires twice as much time to complete) Constant False 0 Signal is measured with the high side referenced to the low True ≠0 A second measurement is made after reversing the inputs to
cancel offsets

Section 7. Measurement Instructions
7-13
Parameter & Data Type
Enter
SettlingTime Constant
The time in microseconds to delay between setting up a measurement (switching to the channel, setting the excitation) and making the measurement. (1 microsecond resolution)
Entry Voltage Range Integration Settling Time 0 ± 20 mV Flash 200 µS (default) 0 All but ± 20 mV, Flash 100 µS (default) 0 All 250 µS 200 µS (default) 0 All _50Hz, _60 Hz 3 mS (default) >=100 All All µS entered Integ The time spent on integration in microseconds for each of the channels measured. Constant Entry Integration 0, 200 Flash Conversion; 200 = 2 flash conversions 100 µS apart
and averaged
250; 500-16000 250 µS; multiples of 500: 250 µS integrations starting each 500 µS and averaged
_60Hz or 16667 16,667 µS (reject 60 Hz noise) _50 Hz or 20000 20,000 µS (reject 50 Hz noise) Mult, Offset Constant, Variable, Array, or Expression
A multiplier and offset by which to scale the raw results of the measurement.
7.6 Excitation/Continuous Analog Output
ExciteCAO (CAOChan, CAOmV, Boost, FastUpdate)
ExciteCAO sets the voltage of a Continuous Analog Output channel.
The datalogger has two continuous analog out (CAO) channels. These channels are used to provide a continuous analog output. The output may be used for proportional control. The CAO channels can source 15 mA and sink 5 mA. If Boost is enabled, sink is increased to 15 mA.
To ensure the CAO voltage settles to with in the ±10 mV accuracy specification of the CAOmV value, a settling time of ten time constants (~2.6 ms) is required. This time is required for the worst case voltage changes (e.g., -5000 to +5000 mV). In instances where the change in CAO voltage from one scan to the next is small and the time required for measurements is approaching the scan time, the FastScan parameter can be used to shorten the execution time. When FastScan is true the settling time is shortened to approximately one time constant and the time required to execute the instruction to approximately 300 µs. In one time constant the signal settles to 63% of the step change which will not be within ±10 mV for large steps.

Section 7. Measurement Instructions
7-14
Parameter & Data Type
Enter
CAOChan The CAO channel to set. Constant Alpha Numeric Description CAO1 1 CAO channel 1 CAO2 2 CAO channel 2 CAOmV Constant or Variable
The voltage, in millivolts, to apply to the CAO Channel. The allowable range is ±5000 mV. The voltage can be constant or a variable can be used to vary the analog output in response to time or measurements.
Boost Sets the current that the CAO can sink (The CAO can always source up to 15 mA.) Constant Alpha Code Value Result False 0 Boost off: Maximum current sink 5 mA True ≠0 Boost Enabled: Maximum current sink 15 mA FastUpdate Shortens the execution time of the instruction and the settling time for the excitation. Alpha Code Value Result False 0 Settle 10 time constants (~2.6 ms) True ≠0 Settle 1 time constant (~300 µs)
ExciteI (IxChan, IxuA, XDelay)
This instruction sets the specified current excitation channel to the current specified.
Parameter & Data Type
Enter
IxChan Enter the current excitation channel number to use to excite the first measurement. Constant Alpha
Code Code/ Channel
Result
IX1 1 Current Excitation Channels (IxChan) IX2 2 IX3 3 IX4 4 ExuA Constant
The excitation current in microamps. The allowable range is ±2500 µA.
XDelay
Specifies the length of time the current channel is enabled, after which, the channel is set low and the datalogger moves on to the next instruction. If XDelay is set to 0, the excitation will be on until the end of the program scan or until another instruction sets an excitation voltage, CAO, or current channel.
ExciteV (ExChan, ExmV, XDelay)
This instruction sets the specified switched voltage excitation channel to the voltage specified. The XDelay parameter is used to specify the length of time the excitation channel is enabled, after which, the channel is set low and the datalogger moves on to the next instruction. If the SettlingTime is set to 0, the excitation channel will be enabled and the voltage will be held until the end of the program scan or until another instruction sets an excitation voltage, CAO, or current channel.
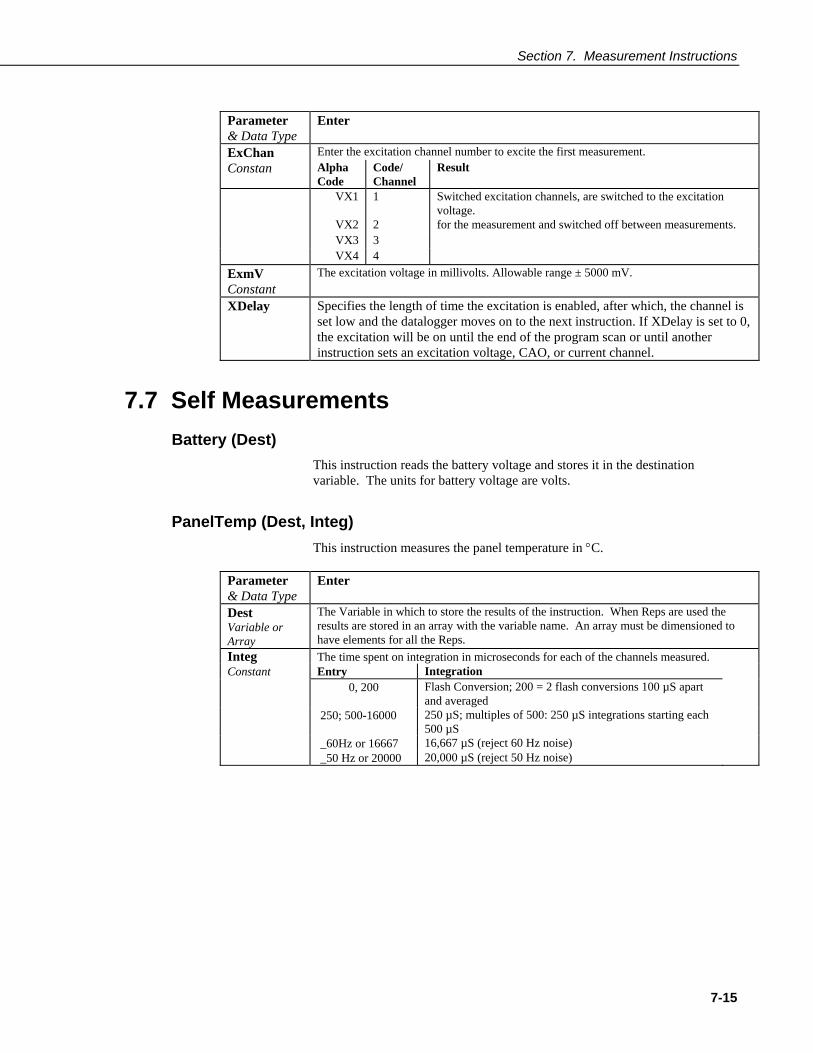
Section 7. Measurement Instructions
7-15
Parameter & Data Type
Enter
ExChan Enter the excitation channel number to excite the first measurement. Constan Alpha
Code Code/ Channel
Result
VX1 1 Switched excitation channels, are switched to the excitation voltage.
VX2 2 for the measurement and switched off between measurements. VX3 3 VX4 4 ExmV Constant
The excitation voltage in millivolts. Allowable range ± 5000 mV.
XDelay
Specifies the length of time the excitation is enabled, after which, the channel is set low and the datalogger moves on to the next instruction. If XDelay is set to 0, the excitation will be on until the end of the program scan or until another instruction sets an excitation voltage, CAO, or current channel.
7.7 Self Measurements
Battery (Dest)
This instruction reads the battery voltage and stores it in the destination variable. The units for battery voltage are volts.
PanelTemp (Dest, Integ)
This instruction measures the panel temperature in °C.
Parameter & Data Type
Enter
Dest Variable or Array
The Variable in which to store the results of the instruction. When Reps are used the results are stored in an array with the variable name. An array must be dimensioned to have elements for all the Reps.
Integ The time spent on integration in microseconds for each of the channels measured. Constant Entry Integration 0, 200 Flash Conversion; 200 = 2 flash conversions 100 µS apart
and averaged
250; 500-16000 250 µS; multiples of 500: 250 µS integrations starting each 500 µS
_60Hz or 16667 16,667 µS (reject 60 Hz noise) _50 Hz or 20000 20,000 µS (reject 50 Hz noise)

Section 7. Measurement Instructions
7-16
Calibrate (Dest, AllRanges)
The Calibrate instruction places the CR5000 self calibration under program control. Placing the Calibrate instruction in the program disables the automatic self calibration that is normally run in the background (Section 3.8).
The Calibrate parameters are optional and are only used to place the results of the calibration in a variable array. With no parameters the Calibrate instruction does not return data.
Parameter & Data Type
Enter
Dest Array
If present the array must contain at least 60 elements (more if excitation is used in the program. With no parameters no data are returned.
AllRanges Constant
Option to calibrate ranges not being used. Dest must be entered before AllRanges parameter
Alpha Code Value Result False =0 Calibrate only Voltage ranges used in program True ≠0 Calibrate all Voltage ranges
In most cases the background calibration is adequate and the calibrate instruction should not be used in the program.
There are three valid situations for using the Calibrate instruction:
1) With the normal set of measurements there is not time for the Calibration to run in the background but the program can periodically stop making measurements and run the calibration in a separate scan.
2) The CR5000 will experience extremely rapid temperature change and the Calibration instruction is run to update the calibration before each set of measurements.
3) The program is run by a repair technician specifically to get the results of the calibration. (Calibration values are also available in the status table without running a special program.)
If there is not enough time leftover in a fast scan for the background calibration to run, the message: “Warning when Fast Scan x is running background calibration will be disabled.” will be returned when the program is compiled (x is the number of the fast scan where the first fast scan entered in the program is 1, the next scan is 2, etc.) If you see this message you have the options of letting the scan run without any calibration (if the temperature remains constant there will be little shift, Section 3.8), reducing the number of measurements or the time it takes to make them (e.g., shorten the integration), or periodically changing to a different scan to run the calibration.
In cases of rapid temperature change, such as bringing a vehicle from equilibrium at -30°C to a hot Arizona day, running the Calibration instruction in the program can improve the accuracy of the measurements. It has to be a rapid change to require this; the background calibration filters new readings and has a time constant (63% response to a step change) of approximately 36 seconds. When the calibration instruction is run in the program the calibration is completely updated each time the instruction is run.
NOTE

Section 7. Measurement Instructions
7-17
Unless the AllRanges option is selected, the calibrate instruction only measures the range and integration combinations that occur in the measurements in the program. For the 250 µs and zero integration calibrations multiple measurements are averaged for the calibration values. The 250 µs integration calibration averages five measurements and the zero integration calibration averages ten measurements.
The Calibration instruction can occur in a fast scan or in a slow sequence scan. In a fast scan the entire calibration is completed at once. In a slow sequence scan the calibration measurements are separated into sections that can be spliced on to the end of fast sequence scans.
If it is necessary to update the calibration more rapidly than is done by the background calibration, try running the Calibrate instruction in the fast scan with the measurements. If there isn’t time for it to run there it can be placed in a slow sequence scan, but remember, unless the slow scan is faster than about 40 seconds the calibration isn’t being updated any faster than with the background calibration.
Running Calibrate in a slow sequence scan is not an option when there is not time for the automatic background calibration. The instruction requires more time because of the multiple measurements for the 250 µs and zero integrations.
When the results of the calibration are placed in an array, the array must have at least 60 elements, more if the program contains instructions which use excitations. The calibration values will be in the following order, followed by the calibrations of the excitations if any. If a range is not calibrated, 0 will be returned for the gain and offset.
Table 7.7-1. Calibrate Return Value Decode
Array Element Description 1 zero integrate 5000 mV single ended offset 2 zero integrate 5000 mV differential offset 3 zero integrate 5000 mV gain 4 zero integrate 1000 mV single ended offset 5 zero integrate 1000 mV differential offset 6 zero integrate 1000 mV gain 7 zero integrate 200 mV single ended offset 8 zero integrate 200 mV differential offset 9 zero integrate 200 mV gain
10 zero integrate 50 mV single ended offset 11 zero integrate 50 mV differential offset 12 zero integrate 50 mV gain 13 zero integrate 20 mV single ended offset 14 zero integrate 20 mV differential offset 15 zero integrate 20 mV gain 16 250 µSec integrate 5000 mV single ended offset 17 250 µSec integrate 5000 mV differential offset 18 250 µSec integrate 5000 mV gain 19 250 µSec integrate 1000 mV single ended offset

Section 7. Measurement Instructions
7-18
20 250 µSec integrate 1000 mV differential offset 21 250 µSec integrate 1000 mV gain 22 250 µSec integrate 200 mV single ended offset 23 250 µSec integrate 200 mV differential offset 24 250 µSec integrate 200 mV gain 25 250 µSec integrate 50 mV single ended offset 26 250 µSec integrate 50 mV differential offset 27 250 µSec integrate 50 mV gain 28 250 µSec integrate 20 mV single ended offset 29 250 µSec integrate 20 mV differential offset 30 250 µSec scriptsizeintegrate 20 mV gain 31 60 Hz rejection 5000 mV single ended offset 32 60 Hz rejection 5000 mV differential offset 33 60 Hz rejection 5000 mV gain 34 60 Hz rejection 1000 mV single ended offset 35 60 Hz rejection 1000 mV differential offset 36 60 Hz rejection 1000 mV gain 37 60 Hz rejection 200 mV single ended offset 38 60 Hz rejection 200 mV differential offset 39 60 Hz rejection 200 mV gain 40 60 Hz rejection 50 mV single ended offset 41 60 Hz rejection 50 mV differential offset 42 60 Hz rejection 50 mV gain 43 60 Hz rejection 20 mV single ended offset 44 60 Hz rejection 20 mV differential offset 45 60 Hz rejection 20 mV gain 46 50 Hz rejection 5000 mV single ended offset 47 50 Hz rejection 5000 mV differential offset 48 50 Hz rejection 5000 mV gain 49 50 Hz rejection 1000 mV single ended offset 50 50 Hz rejection 1000 mV differential offset 51 50 Hz rejection 1000 mV gain 52 50 Hz rejection 200 mV single ended offset 53 50 Hz rejection 200 mV differential offset 54 50 Hz rejection 200 mV gain 55 50 Hz rejection 50 mV single ended offset 56 50 Hz rejection 50 mV differential offset 57 50 Hz rejection 50 mV gain 58 50 Hz rejection 20 mV single ended offset 59 50 Hz rejection 20 mV differential offset 60 50 Hz rejection 20 mV gain

Section 7. Measurement Instructions
7-19
7.8 Digital I/O
PeriodAvg (Dest, Reps, Range, SEChan, Threshold, PAOption, Cycles, Timeout, Mult, Offset)
This instruction measures the period of a signal on any single-ended input channel. The specified number of Cycles are timed with a resolution of 70 ns, making the resolution of the period measurement 70 ns divided by the number of Cycles chosen.
Parameter & Data Type
Enter
Dest Variable or Array
The Variable in which to store the results of the instruction. When Reps are used the results are stored in an array with the variable name. An array must be dimensioned to have elements for all the Reps.
Reps Constant
The number of repetitions for the instruction on adjacent channels.
Range Constant
The voltage range for the measurement, which determines the gain applied to the signal prior to a zero-crossing detector. Maximum frequency decreases with increasing gain.
Range Gain Signal (pk-pk)1 Minimum Maximum Code Min Max Pulse
Width Frequency2
mV5000 0.8 600 mV 10.0 V 2.5 µs 200 kHz mV1000 4.0 100 mV 2.0 V 5.0 µs 100 kHz mV200 20 4 mV 2.0 V 25 µs 20 kHz 1 Signals must cross threshold to trigger the voltage comparator.
2 Maximum frequency equals 1/(Twice Minimum Pulse Width) for 50% duty cycle signals.
SEChan Constant
The single-ended channel number on which to make the first measurement. If the channel is entered as a negative number, all reps occur on that channel.
Threshold Constant
The voltage in millivolts that the input must cross for a count to occur. For a signal centered around CR5000 ground (Figure 7.8-1) the threshold should be 0. If the input signal is a 0 to 5 V CMOS signal then a threshold of 2500 mV would result in the voltage comparator switching at 2.5 V.
PAoption Specifies whether to output the period in µs or the frequency in Hz. Numeric Code Voltage Range 0 Period of the signal is returned 1 Frequency of the signal is returned Cycles Constant
The number of cycles to be measured for the average calculation.
Timeout Constant
The maximum time duration (in msec) that the logger will wait for the number of Cycles to be measured for the average calculation.
Mult, Offset Constant, Variable, Array, or Expression
A multiplier and offset by which to scale the raw results of the measurement.
Low-level signals are amplified prior to a voltage comparator for the period averaging measurement. The internal voltage comparator is referenced to the user entered threshold. The threshold parameter allows a user to reference the internal voltage comparator to voltages other than 0 V. For example, a threshold of 2500 mV allows a 0 to 5 V digital signal to be sensed by the internal comparator without the need of any additional input conditioning circuitry. The threshold allows direct connection of standard digital signals, but

Section 7. Measurement Instructions
7-20
is not recommended for small amplitude sensor signals. For sensor amplitudes less than 20 mV pk-pk a dc blocking capacitor, see Figure 7.8-1, is recommended to center the signal at CR5000 ground (threshold = 0) because of offset voltage drift along with limited accuracy (± 10 mV) and resolution (1.2 mV) of a threshold other than 0.
The minimum pulse width requirements increase (maximum frequency decreases) with increasing gain as shown in range parameter. Signals larger than the specified maximum for a range will saturate the gain stages and prevent operation up to the maximum specified frequency. Back-to-back diodes, Figure 7.8-1, are recommended to limit large amplitude signals to within the input signal ranges.
Noisy signals with slow transitions through the voltage threshold have the potential for extra counts around the comparator switch point. A voltage comparator with 20 mV of hysteresis follows the voltage gain stages. The effective input referred hysteresis equals 20 mV divided by the selected voltage gain. The effective input referred hysteresis on the ± 200 mV range is 1 mV. Consequently, 1 mV of noise on the input signal could cause extraneous counts on the ± 200 mV range. For best results, select the largest input range (smallest gain) that will meet the minimum input signal requirements.
c
Vo s
SensorwithDCoffset
Silicon diodessuch as 1N4001
To single - endedinput
1µF
D1
D2R
10k
FIGURE 7.8-1. Input conditioning circuit for low-level and high level period averaging.
Figure 7.8-1 shows a circuit that capacitively couples an input signal to center it around ground and also limits the amplitude of the input to allowable levels. The capacitor C is a dc blocking capacitor for offset voltage removal. Resistor R1 is used to bias the datalogger side of the input circuit to ground. The reactance of the dc blocking capacitor (Xc = (2⋅π⋅f⋅C)-1) and resistor R1 form a voltage divider at low frequencies (R1/(R1 + Xc)) that attenuates the applied input signal. This attenuation sets a lower limit on low-frequency operation and the minimum size of R1. The circuit attenuates the input signal by a factor of 2 at 16 Hz.
CAUTION
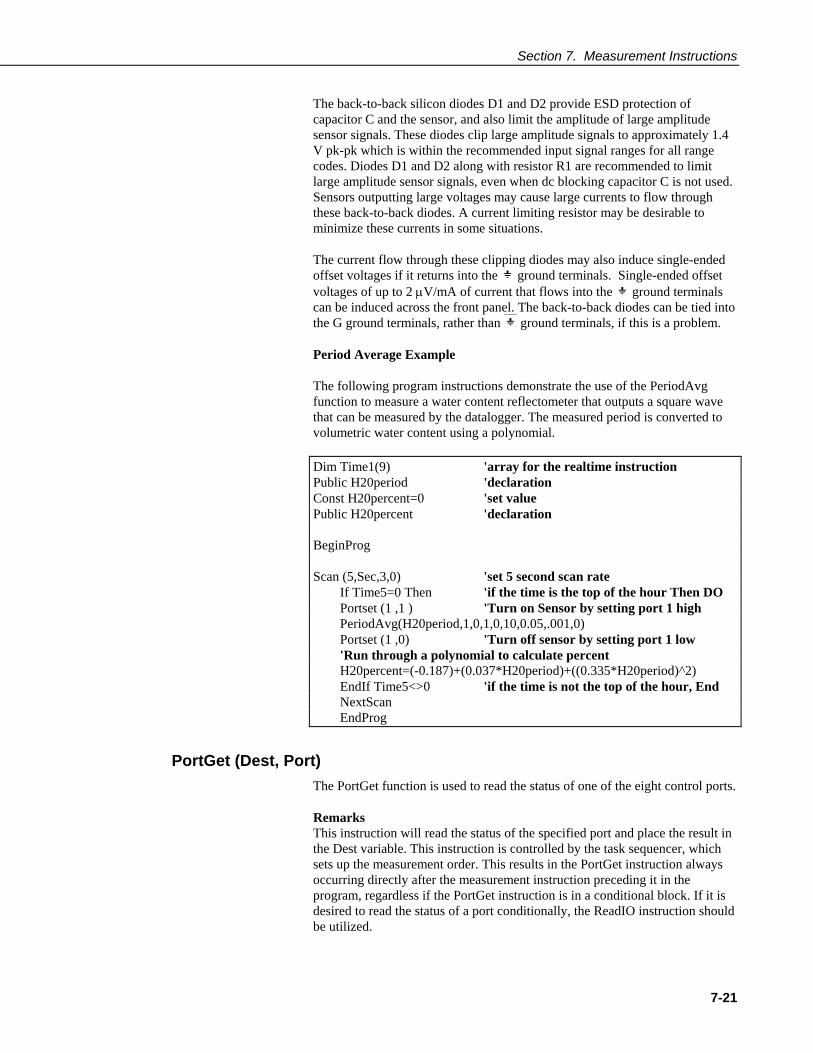
Section 7. Measurement Instructions
7-21
The back-to-back silicon diodes D1 and D2 provide ESD protection of capacitor C and the sensor, and also limit the amplitude of large amplitude sensor signals. These diodes clip large amplitude signals to approximately 1.4 V pk-pk which is within the recommended input signal ranges for all range codes. Diodes D1 and D2 along with resistor R1 are recommended to limit large amplitude sensor signals, even when dc blocking capacitor C is not used. Sensors outputting large voltages may cause large currents to flow through these back-to-back diodes. A current limiting resistor may be desirable to minimize these currents in some situations.
The current flow through these clipping diodes may also induce single-ended offset voltages if it returns into the ground terminals. Single-ended offset voltages of up to 2 µV/mA of current that flows into the ground terminals can be induced across the front panel. The back-to-back diodes can be tied into the G ground terminals, rather than ground terminals, if this is a problem.
Period Average Example
The following program instructions demonstrate the use of the PeriodAvg function to measure a water content reflectometer that outputs a square wave that can be measured by the datalogger. The measured period is converted to volumetric water content using a polynomial.
Dim Time1(9) 'array for the realtime instruction Public H20period 'declaration Const H20percent=0 'set value Public H20percent 'declaration BeginProg Scan (5,Sec,3,0) 'set 5 second scan rate If Time5=0 Then 'if the time is the top of the hour Then DO Portset (1 ,1 ) 'Turn on Sensor by setting port 1 high PeriodAvg(H20period,1,0,1,0,10,0.05,.001,0) Portset (1 ,0) 'Turn off sensor by setting port 1 low 'Run through a polynomial to calculate percent H20percent=(-0.187)+(0.037*H20period)+((0.335*H20period)^2) EndIf Time5<>0 'if the time is not the top of the hour, End NextScan EndProg
PortGet (Dest, Port)
The PortGet function is used to read the status of one of the eight control ports.
Remarks This instruction will read the status of the specified port and place the result in the Dest variable. This instruction is controlled by the task sequencer, which sets up the measurement order. This results in the PortGet instruction always occurring directly after the measurement instruction preceding it in the program, regardless if the PortGet instruction is in a conditional block. If it is desired to read the status of a port conditionally, the ReadIO instruction should be utilized.
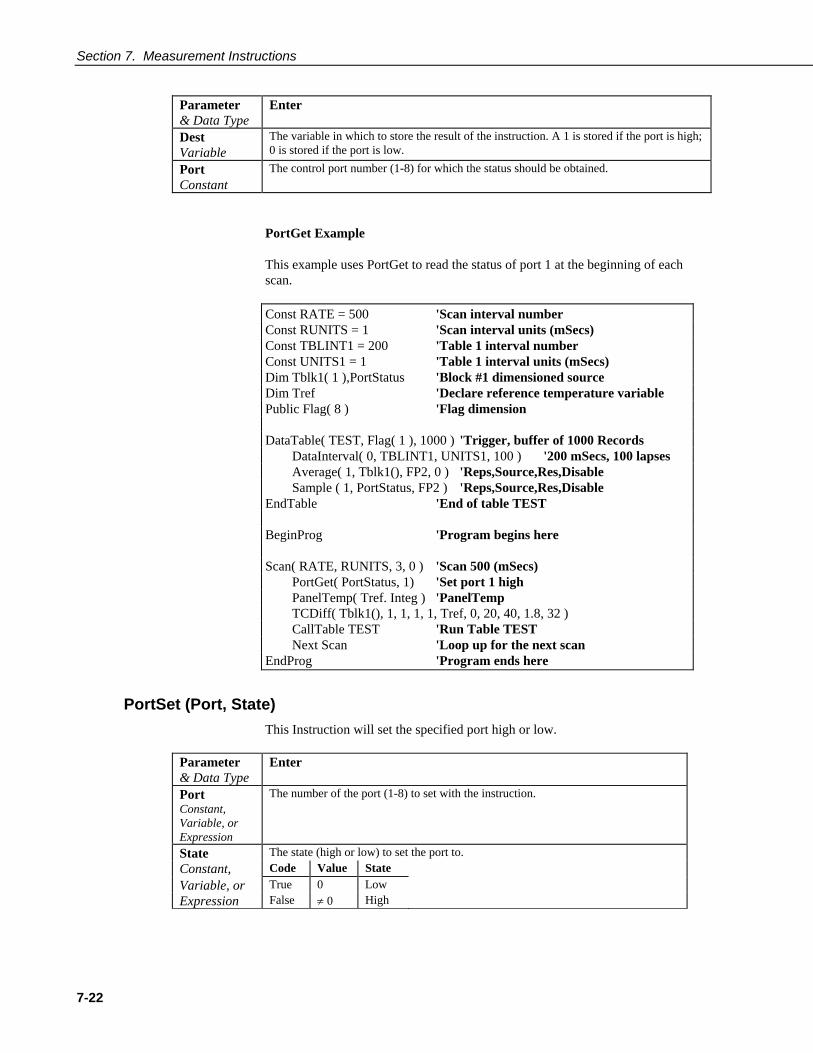
Section 7. Measurement Instructions
7-22
Parameter & Data Type
Enter
Dest Variable
The variable in which to store the result of the instruction. A 1 is stored if the port is high; 0 is stored if the port is low.
Port Constant
The control port number (1-8) for which the status should be obtained.
PortGet Example
This example uses PortGet to read the status of port 1 at the beginning of each scan.
Const RATE = 500 'Scan interval number Const RUNITS = 1 'Scan interval units (mSecs) Const TBLINT1 = 200 'Table 1 interval number Const UNITS1 = 1 'Table 1 interval units (mSecs) Dim Tblk1( 1 ),PortStatus 'Block #1 dimensioned source Dim Tref 'Declare reference temperature variable Public Flag( 8 ) 'Flag dimension DataTable( TEST, Flag( 1 ), 1000 ) 'Trigger, buffer of 1000 Records DataInterval( 0, TBLINT1, UNITS1, 100 ) '200 mSecs, 100 lapses Average( 1, Tblk1(), FP2, 0 ) 'Reps,Source,Res,Disable Sample ( 1, PortStatus, FP2 ) 'Reps,Source,Res,Disable EndTable 'End of table TEST BeginProg 'Program begins here Scan( RATE, RUNITS, 3, 0 ) 'Scan 500 (mSecs) PortGet( PortStatus, 1) 'Set port 1 high PanelTemp( Tref. Integ ) 'PanelTemp TCDiff( Tblk1(), 1, 1, 1, 1, Tref, 0, 20, 40, 1.8, 32 ) CallTable TEST 'Run Table TEST Next Scan 'Loop up for the next scan EndProg 'Program ends here
PortSet (Port, State)
This Instruction will set the specified port high or low.
Parameter & Data Type
Enter
Port Constant, Variable, or Expression
The number of the port (1-8) to set with the instruction.
State The state (high or low) to set the port to. Constant, Code Value State Variable, or True 0 Low Expression False ≠ 0 High

Section 7. Measurement Instructions
7-23
PulseCount (Dest, Reps, PChan, PConfig, POption, Mult, Offset)
Sensor
Pulse Channel
Ground
Parameter & Data Type
Enter
Dest Variable or Array
The Variable in which to store the results of the instruction. When Reps are used the results are stored in an array with the variable name. An array must be dimensioned to have elements for all the Reps.
Reps Constant
The number of repetitions for the measurement or instruction.
PChan Constant
The number of the pulse channel (1 or 2) for the measurement.
PConfig A code specifying the type of pulse input to measure. Constant Code Input Configuration 0 High Frequency 1 Low Level AC 2 Switch Closure POption Constant
A code that determines if the raw result (multiplier = 1, offset = 0) is returned as counts or frequency. The running average can be used to smooth out readings when a low frequency relative to the scan rate causes large fluctuations in the measured frequency from scan to another.
Code Result 0 Counts 1 Frequency (Hz) counts/scan interval in seconds >1 Running average of frequency. The number entered is the time
period over which the frequency is averaged in milliseconds.
Mult, Offset Constant, Variable, Array, or Expression
A multiplier and offset by which to scale the raw results of the measurement. See the measurement description for the units of the raw result; a multiplier of one and an offset of 0 are necessary to output in the raw units. For example, the TCDiff instruction measures a thermocouple and outputs temperature in degrees C. A multiplier of 1.8 and an offset of 32 will convert the temperature to degrees F.
The PulseCount instruction is used to measure counts or frequency on one of the pulse channels.
The PulseCount instruction can not be used in a Slow Sequence scan.
NOTE

Section 7. Measurement Instructions
7-24
CR23X
Pi
20k
FIGURE 7.8-1. Conditioning Large Voltage Pulses
The maximum input voltage on a pulse channel is ±20 V. Refer to Figure 7.8-1 if reducing input voltage is required.
• Pulse Channels Maximum Input Voltage: ±20 V
High Frequency Input
• Pulse Channels Minimum Pulse Width: 1.2 microsecond Maximum Frequency: 400 kHz
(50% Duty Cycle) Lower Threshold: 1.5 V* Upper Threshold: 3.5 V*
When a pulse channel is configured for high-frequency pulse, there is an internal 100 kohm pull-up resistor to 5 V on the pulse channel. This pull-up resistor accommodates open-collector output devices for high-frequency input.
*Larger input transitions are required at high frequencies because of the input RC filter with 1.2 microsecond time constant. Signals up to 400 kHz will be counted if centered around +2.5 V with deviations ≥ ± 2.5 V for ≥ 1.2 microseconds.
Low Level AC (Pulse Channels Only)
Input Hysteresis: 15 mV Maximum Input Voltage: 20 V peak-to-peak Input Voltage and Frequency Range
(16 bit counter required above 2.56 kHz) 20 mV 1.0 Hz to 1 kHz 200 mV 0.5 Hz to 10 kHz 1000 mV 0.3 Hz to 16 kHz
CR5000

Section 7. Measurement Instructions
7-25
Switch Closure
• Pulse Channels A switch closure is connected between P1..P4 and analog ground. When the switch is open, the CR23X pulls the pulse channel to 5 V through a 100 kOhm impedance. When the switch is closed, the pulse channel is pulled to ground. The count is incremented when the switch opens.
Minimum Switch Closed Time: 5 ms Minimum Switch Open Time: 6 ms Maximum Bounce Time: 1 ms open without being counted
PulseCountReset
PulseCountReset is used to reset the pulse counters and the running averages used in the pulse count instruction. The 16 bit counters can count up to decimal 65535. More counts than 65535 result in an over-range condition. With each scan, the CR5000 reads the counts accumulated since the last scan and then resets the counter. If the scans stop, as in a program with more that one Scan loop, the counter continues to accumulate counts until another scan is initiated or it over-ranges. If the running averaging is in use, the over-range value will be included in the average until for the duration of the averaging period (e.g., with a 1000 millisecond running average, the over-range will be the value from the PulseCount(...) instruction until 1 second has passed. Resetting the average prior to (re)starting the scan avoids this.
ReadIO (Dest, Mask)
ReadIO is used to read the status of selected control I/O channels (ports) on the CR5000. There are 8 ports. The status of these ports is considered to be a binary number with a high port (+5 V) signifying 1 and a low port (0 V) signifying 0. For example, if ports 1 and 3 are high and the rest low, the binary representation is 00000101, or 5 decimal. The mask parameter is used to select which of the ports to read, it too is a binary representation of the ports, a 1 means pay attention to the status of the port, a 0 means ignore the status of the port (the mask is "anded" with the port status; the "and" operation returns a 1 for a digit if the mask digit and the port status are both 1 and a 0 if either or both is 0). CRBasic allows the entry of numbers in binary format by preceding the number with "&B". For example if the mask is entered as &B100 (leading zeros can be omitted in binary format just as in decimal) and ports 3 and 1 are high as in the previous example, the result of the instruction will be 4 (decimal, binary = 100); if port 3 is low, the result would be 0.
Examples
ReadIO(Port3, &B100) ' read port 3 if port 3 is high then Port3 = 4, if port 3 is low then Port3 = 0

Section 7. Measurement Instructions
7-26
SW12
The SW12 instruction is used to set a Switched 12 volt supply high or low.
Syntax SW12( State )
Remarks The datalogger has a switched 12 volt output with two terminals. This switched 12 volts is used to provide a continuous 12 volt supply to external peripherals. At room temperature the switched 12 volt supply can source 900 mA between the SW-12 terminal and Ground. The State parameter indicates whether the switched 12 volts is High (non-zero) or low (0).
The SW-12 supply is unregulated and can supply up to 900 mA at 20C and up to 630 mA at 50C. A resettable polymeric fuse protects against over-current. Reset is accomplished by removing the load or turning off the SW-12 for several seconds.
SW12 Example This example sets the switched 12 volt supply high at the beginning of each scan, and low at the end of the program.
Const RATE = 500 'Scan interval number Const RUNITS = 1 'Scan interval units (mSecs) Const TBLINT1 = 200 'Table 1 interval number Const UNITS1 = 1 'Table 1 interval units (mSecs) Dim Tblk1( 1 ) 'Block #1 dimensioned source Dim Tref 'Declare reference temperature variable Public Flag( 8 ) 'Flag dimension DataTable( TEST, Flag( 1 ), 1000 ) 'Trigger, buffer of 1000 Records DataInterval( 0, TBLINT1, UNITS1, 100 ) '200 mSecs, 100 lapses Average( 1, Tblk1(), FP2, 0 ) 'Reps,Source,Res,Disable EndTable 'End of table TEST BeginProg 'Program begins here Scan( RATE, RUNITS, 1, 0 ) 'Scan 500 (mSecs), no fast buffer SW12( 1 ) 'Set SW12 high PanelTemp( Tref., Integ ) 'PanelTemp TCDiff( Tblk1(), 1, 1, 1, 1, Tref, 0, 20, 40, 1.8, 32 ) CallTable TEST 'Run Table TEST SW12 ( 0 ) 'Set SW12 log Next Scan 'Loop up for the next scan EndProg 'Program ends here
NOTE

Section 7. Measurement Instructions
7-27
TimerIO
The TimerIO instruction is used to measure the time between edges (state transitions) or frequency on the digital I/O ports of the datalogger. The timing resolution is 50 nanoseconds. The longest interval that can be timed is 214.7 seconds (232 x 50 nanoseconds).
Syntax TimerIO( Dest, Edges, Function, Timeout, Units)
Remarks There are eight control ports on the datalogger. Six of the ports (1 through 6) can be used for edge timing and low frequency period/frequency measurements (<1 kHz). The other two ports (7 and 8) can be used to measure high frequency signals (up to about 5 MHz) with edge counting only (no edge timing). When port 7 is enabled, ports 3 and 4 are not available for edge timing. When port 8 is enabled, ports 5 and 6 cannot be used for edge timing.
The TimerIO instruction has the following parameters:
Parameter & Data Type
Enter
Dest The Dest parameter is a variable array in which to store the results of the measurement. The array must be dimensioned equal to the number of ports for which results are requested.
Edges The Edge parameter consists of 8 digits used to configure each of the 8 ports. The digits represent the ports in descending order from left to right. If a 1 is entered for a port, the transition will be counted on the rising edge (from <1.5V to >3.5V). If a 0 is entered, the transition will be counted on the falling edge (from >3.5V to <1.5V).
Function The Function parameter has 8 digits. Each digit is used to program the results for each port. Only one function may be programmed per port. The number of values returned is determined by the number of ports for which a result is requested.
Digit Results 0 The associated port is not used. 1 Calculate the period of the signal on the specified port (in
microseconds).
2 Calculate the frequency (Hz) for the specified port. 3 Calculate the time from an edge on the previous port (1 number
lower) to an edge on the specified port (in microseconds).
4 Calculate the time from an edge on port 1 to an edge on the specified port (in microseconds).
5 Not used. 6 Not used. 7 Pulse counting period on port 7 or 8 (in microseconds). 8 Pulse counting frequency on port 7 or 8 (in Hz). Timeout A constant is entered for the Timeout parameter to determine the results to be
returned when no changes have occurred in the specified ports since the last execution of the instruction. If the timeout period has expired and no change has occurred, a null value will be returned (0 for frequency and NaN for period or time since last edge). If the timeout period has not expired the last valid result will be returned. This is useful for measuring signals with periods greater than the scan interval. The maximum time out is 232 x the scan.

Section 7. Measurement Instructions
7-28
Parameter & Data Type
Enter
Units The Units parameter is used to specify the unit of measure for the timeout period. An alphabetical or numeric code can be entered.
Numeric Alpha Description 0 usec microseconds 1 msec milliseconds 2 sec seconds 3 min minutes
WriteIO (Mask, Source)
WriteIO is used to set the status of selected control I/O channels (ports) on the CR5000. (See Also PortSet.) There are 8 ports. The status of these ports is considered to be a binary number with a high port (+5 V) signifying 1 and a low port (0 V) signifying 0. For example, if ports 1 and 3 are high and the rest low, the binary representation is 00000101, or 5 decimal. The source value is interpreted as a binary number and the ports set accordingly. The mask parameter is used to select which of the ports to set, it too is a binary representation of the ports, a 1 means set the port according to the source, a 0 means do not change the status of the port. CRBasic allows the entry of numbers in binary format by preceding the number with "&B". For example if the mask is entered as &B110 (leading zeros can be omitted in binary format just as in decimal) and the source is 5 decimal (binary 101) port 3 will be set high and port 2 will be set low. The mask indicates that only 3 and 2 should be set. While the value of the source also has a 1 for port 1, it is ignored because the mask indicates 1 should not be changed.
Example
WriteIO (&B100, &B100) ' Set port 3 high.
Parameter & Data Type
Enter
Mask Constant
The Mask allows the read or write to only act on certain ports. The Mask is ANDed with the value obtained when reading and ANDed with the source before writing.
Source Constant Variable
The Variable or number that is to be written to the I/O ports.

Section 7. Measurement Instructions
7-29
7.9 Peripheral Devices
AM25T (Dest, Reps, Range, AM25TChan, DiffChan, TCType, Tref, ClkPort, ResPort, VxChan, RevDiff, SettlingTime, Integ, Mult, Offset)
This Instruction controls the AM25T Multiplexer.
Parameter & Data Type
Enter
Dest Variable or Array
The Variable in which to store the results of the instruction. When Reps are used the results are stored in an array with the variable name. An array must be dimensioned to have elements for all the Reps.
Reps The number of channels to measure on the AM25T. Enter 0 to just measure Temperature.
Range Constant
Alpha Code
Numeric Code
Voltage Range
mV5000 0 ± 5000 mV mV1000 1 ± 1000 mV mV200 2 ± 200 mV mV50 3 ± 50 mV mV20 4 ± 20 mV AutoRange 5 mV20 - mV5000 Selects range (Sect. 3.1) mV200C
mV50C mV20C
20 30 40
± 200 mV ± 50 mV ± 20 mV
The mV200C, mV50C, and mV20C ranges pull the channel into common mode range and check for open input
Am25tChan Constant
The starting input channel on the multiplexer.
DiffChan Constant
The Differential channel that will be used to make the actual measurements from the AM25T. If the channel is entered as a negative number, all reps occur on that channel.
TCType Constant
The Thermocouple Type Code. Enter -1 to return voltage measurements.
Tref Variable
The variable in which to store/read the AM25T reference temperature.
ClkPort Constant
The Digital Output port number that will be used to clock the AM25T. One clock port may be used with several AM25Ts.
ResPort Constant
The Digital Output port number that will be used to enable and reset the AM25T. Each AM25T must have it's own unique Reset line
VxChan Constant
The Excitation Channel number that will be used to provide excitation for the PRT reference temperature measurement. If 0 is entered for the excitation channel, the temperature is not measured.
RevDiff Code Value Result (Reversing requires twice as much time to complete) Constant False 0 Signal is measured with the high side referenced to the low True ≠0 A second measurement is made after reversing the inputs to
cancel offsets

Section 7. Measurement Instructions
7-30
Parameter & Data Type
Enter
SettlingTime Constant
The time in microseconds to delay between setting up a measurement (switching to the channel, setting the excitation) and making the measurement. (1 microsecond resolution)
Entry Voltage Range Integration Settling Time 0 ± 20 mV Flash 200 µS (default) 0 All but ± 20 mV, Flash 100 µS (default) 0 All 250 µS 200 µS (default) 0 All _50Hz, _60 Hz 3 mS (default) >=100 All All µS entered Integ The time spent on integration in microseconds for each of the channels measured. Constant Entry Integration 0, 200 Flash Conversion; 200 = 2 flash conversions 100 µS apart
and averaged
250; 500-16000 250 µS; multiples of 500: 250 µS integrations starting each 500 µS and averaged
_60Hz or 16667 16,667 µS (reject 60 Hz noise) _50 Hz or 20000 20,000 µS (reject 50 Hz noise) Mult, Offset Constant, Variable, Array, or Expression
A multiplier and offset by which to scale the raw results of the measurement. See the measurement description for the units of the raw result; a multiplier of one and an offset of 0 are necessary to output in the raw units. For example, the TCDiff instruction measures a thermocouple and outputs temperature in degrees C. A multiplier of 1.8 and an offset of 32 will convert the temperature to degrees F.
AO4 (Source, Reps, SDMAdress)
This instruction is used to set the voltage to an SDM-AO4 four channel analog output device.
The AO4 instruction has the following parameters:
Parameter & Data Type
Enter
Source
The Source parameter is the variable that hold the voltage, in millivolts, that should be sent to the SDM-AO4. If multiple SDM-AO4s are to be triggered with one instruction, this parameter must be an array dimensioned to the size of the Reps.
Reps
The Reps parameter determines the number of SDM-AO4 devices to supply a voltage using this instruction. The SDM-A04s must have sequential SDM addresses if the Reps parameter is greater than 1.
SDMAddress
The SDMAddress parameter defines the address of the SDM-AO4 to which a voltage should be applied. Valid SDM addresses are 0 through 14. Address 15 is reserved for the SDMTrigger instruction. The SDM address is entered as a base 10 number, unlike older, jumper-settable SDM instruments that used base 4.
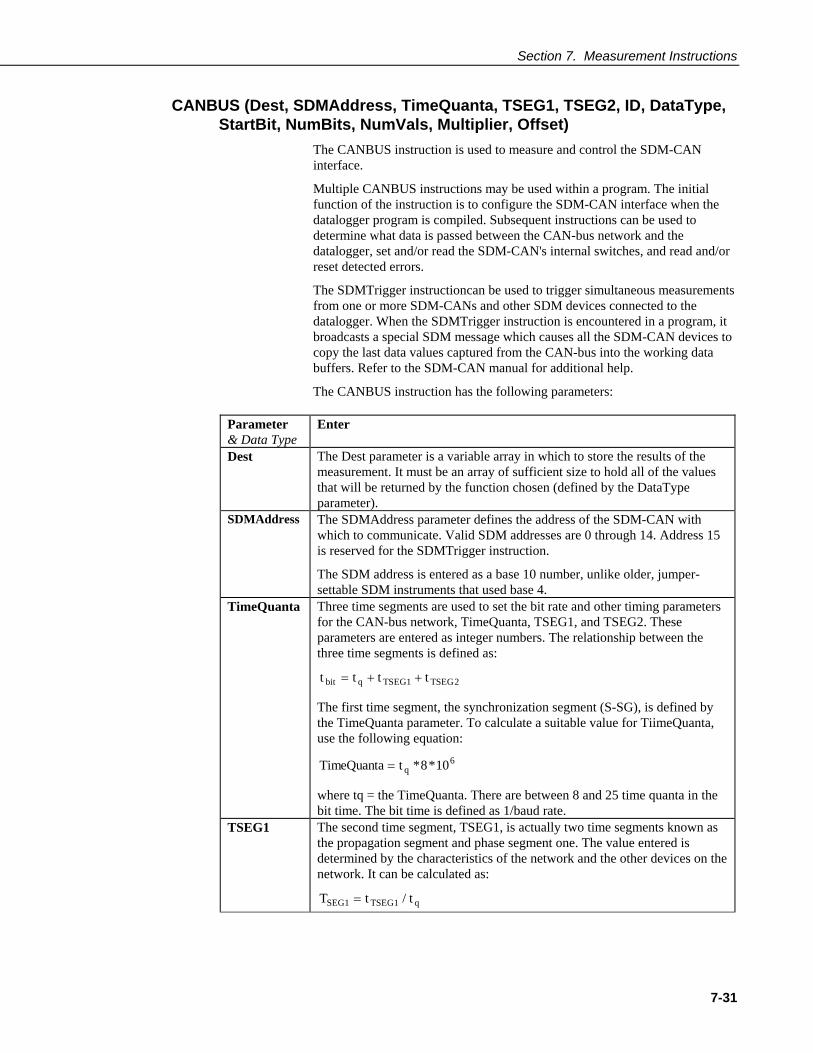
Section 7. Measurement Instructions
7-31
CANBUS (Dest, SDMAddress, TimeQuanta, TSEG1, TSEG2, ID, DataType, StartBit, NumBits, NumVals, Multiplier, Offset)
The CANBUS instruction is used to measure and control the SDM-CAN interface.
Multiple CANBUS instructions may be used within a program. The initial function of the instruction is to configure the SDM-CAN interface when the datalogger program is compiled. Subsequent instructions can be used to determine what data is passed between the CAN-bus network and the datalogger, set and/or read the SDM-CAN's internal switches, and read and/or reset detected errors.
The SDMTrigger instructioncan be used to trigger simultaneous measurements from one or more SDM-CANs and other SDM devices connected to the datalogger. When the SDMTrigger instruction is encountered in a program, it broadcasts a special SDM message which causes all the SDM-CAN devices to copy the last data values captured from the CAN-bus into the working data buffers. Refer to the SDM-CAN manual for additional help.
The CANBUS instruction has the following parameters:
Parameter & Data Type
Enter
Dest
The Dest parameter is a variable array in which to store the results of the measurement. It must be an array of sufficient size to hold all of the values that will be returned by the function chosen (defined by the DataType parameter).
SDMAddress
The SDMAddress parameter defines the address of the SDM-CAN with which to communicate. Valid SDM addresses are 0 through 14. Address 15 is reserved for the SDMTrigger instruction.
The SDM address is entered as a base 10 number, unlike older, jumper-settable SDM instruments that used base 4.
TimeQuanta
Three time segments are used to set the bit rate and other timing parameters for the CAN-bus network, TimeQuanta, TSEG1, and TSEG2. These parameters are entered as integer numbers. The relationship between the three time segments is defined as:
t t t tbit q TSEG TSEG= + +1 2
The first time segment, the synchronization segment (S-SG), is defined by the TimeQuanta parameter. To calculate a suitable value for TiimeQuanta, use the following equation:
TimeQuanta t q= * *8 106
where tq = the TimeQuanta. There are between 8 and 25 time quanta in the bit time. The bit time is defined as 1/baud rate.
TSEG1
The second time segment, TSEG1, is actually two time segments known as the propagation segment and phase segment one. The value entered is determined by the characteristics of the network and the other devices on the network. It can be calculated as:
T t tSEG TSEG q1 1= /

Section 7. Measurement Instructions
7-32
Parameter & Data Type
Enter
TSEG2
The third time segment, TSEG2 (the phase segment two), is defined by the TSEG2 parameter. The value of TSEG2 can be calculated using the equation:
T t tSEG TSEG q2 2= /
The relative values of TSEG1 and TSEG2 determine when the SDM-CAN samples the data bit.
ID
Each device on a CAN-bus network prefaces its data frames with an 11 or 29 bit identifier. The ID parameter is used to set this address. The ID is entered as a single decimal equivalent. Enter a positive value to signify a 29 bit ID or a negative value to signify an 11 bit ID.
DataType
The DataType parameter defines what function the CANBUS instruction will perform. This instruction can be used to collect data, buffer data for transmission to the CAN-bus, transmit data to the CAN-bus, read or reset error counters, read the status of the SDM-CAN, read the SDM-CAN's OS signature and version, send a remote frame, or read or set the SDM-CAN's internal switches. Enter the numeric value for the desired option:
Value Description 1 Retrieve data; unsigned integer, most significant byte first 2 Retrieve data; unsigned integer, least significant byte first 3 Retrieve data; signed integer, most significant byte first 4 Retrieve data; signed integer, least significant byte first 5 Retrieve data; 4-byte IEEE floating point number; most
significant byte first 6 Retrieve data; 4-byte IEEE floating point number; least
significant byte first 7 Build data frame in SDM-CAN memory; unsigned integer, most
significant byte first. Overwrite existing data. 8 Build data frame in SDM-CAN memory; unsigned integer, least
significant byte first. Overwrite existing data. 9 Build data frame in SDM-CAN memory; signed integer, most
significant byte first. Overwrite existing data. 10 Build data frame in SDM-CAN memory; signed integer, least
significant byte first. Overwrite existing data. 11 Build data frame in SDM-CAN memory; 4-byte IEEE floating
point number; most significant byte first. Overwrite existing data. 12 Build data frame in SDM-CAN memory; 4-byte IEEE floating
point number; least significant byte first. Overwrite existing data. 13 Build data frame in SDM-CAN memory; unsigned integer, most
significant byte first. Logical "OR" with existing data. 14 Build data frame in SDM-CAN memory; unsigned integer, least
significant byte first. Logical "OR" with existing data. 15 Build data frame in SDM-CAN memory; signed integer, most
significant byte first. Logical "OR" with existing data. 16 Build data frame in SDM-CAN memory; signed integer, least
significant byte first. Logical "OR" with existing data. 17 Build data frame in SDM-CAN memory; 4-byte IEEE floating
point number; most significant byte first. Logical "OR" with existing data.

Section 7. Measurement Instructions
7-33
Parameter & Data Type
Enter
18 Build data frame in SDM-CAN memory; 4-byte IEEE floating point number; least significant byte first. Logical "OR" with existing data.
19 Transmit data value to the CAN-bus; unsigned integer, most significant byte first.
20 Transmit data value to the CAN-bus; unsigned integer, least significant byte first.
21 Transmit data value to the CAN-bus; signed integer, most significant byte first.
22 Transmit data value to the CAN-bus; signed integer, least significant byte first.
23 Transmit data value to the CAN-bus; 4-byte IEEE floating point number; most significant byte first.
24 Transmit data value to the CAN-bus; 4-byte IEEE floating point number; least significant byte first.
25 Transmit previously built data frame to the CAN-bus. 26 Set up previously built data frame as a Remote Frame Response. 27 Read Transmit, Receive, Overrun, and Watchdog errors. The
errors are placed consecutively in the array specified by the Dest parameter.
28 Read Transmit, Receive, Overrun, and Watchdog errors. The errors are placed consecutively in the array specified by the Dest parameter. Reset error counters to 0 after reading.
29 Read SDM-CAN status; result is placed into the array specified in the Dest parameter. The result codes are as follows:
Status Description 0000 The SDM-CAN is involved in bus activities; error
counters are less than 96. 0001 The SDM-CAN is involved in bus activities; one or
more error counters is greater than or equal to 96. 0002 The SDM-CAN is not involved in bus activities;
error counters are less than 96. 0003 The SDM-CAN is not involved in bus activities; one
or more error counters is greater than or equal to 96. 30 Read SDM-CAN operating system and version number; results
are placed in two consecutive array variables beginning with the variable specified in the Dest parameter.
31 Send Remote Frame Request. 32 Set SDM-CAN's internal switches. The code is stored in the
array specified in the Dest parameter and is entered in the form of ABCD.
Switch Code Description A 0 Currently not used; set to 0. B 0 SDM-CAN returns the last value captured
from the network, even if that value has been read before (default).

Section 7. Measurement Instructions
7-34
Parameter & Data Type
Enter
1 SDM-CAN returns -99999 if a data value is requested by the datalogger and a new value has not been captured from the network since the last request.
2-9 Currently not used. C 0 Disable I/O interrupts (default). 1 Enable I/O interrupts, pulsed mode. 2 Enable I/O interrupts, fast mode. 3-7 Currently not used. 8 Place the SDM-CAN into low power
stand-by mode 9 Leave switch setting unchanged. D 0 Listen only (error passive) mode. CAN
transmissions are not confirmed. 1 Transmit once. Data will not be
retransmitted in case of error or loss of arbitration. Frames received without error are acknowledged.
2 Self-reception. A frame transmitted from the SDM-CAN that was acknowledged by an external node will also be received by the SDM-CAN but no retransmission will occur in the event of loss of arbitration or error. Frames received correctly from an external node are acknowledged.
3 Normal, retransmission will occur in the event of loss of arbitration or error. Frames received correctly from an external node are acknowledged. This is the typical setting to use if the SDM-CAN is to be used to transmit data.
4 Transmit once; self-test. The SDM-CAN will perform a successful transmission even if there is no acknowledgment from an external CAN node. Frames received correctly from an external node are acknowledged.
5 Self-reception; self -test. The SDM-CAN will perform a successful transmission even if there is no acknowledgment from an external CAN node. Frames received correctly from an external node are acknowledged. SDM-CAN will receive its own transmission.
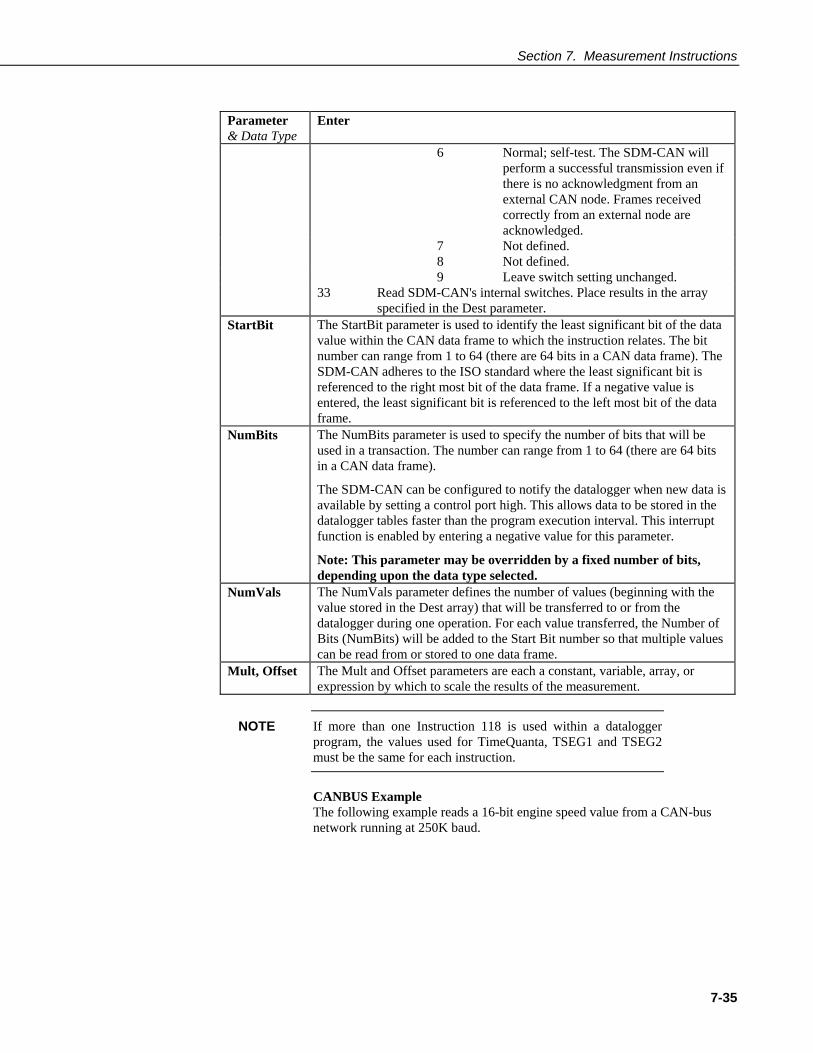
Section 7. Measurement Instructions
7-35
Parameter & Data Type
Enter
6 Normal; self-test. The SDM-CAN will perform a successful transmission even if there is no acknowledgment from an external CAN node. Frames received correctly from an external node are acknowledged.
7 Not defined. 8 Not defined. 9 Leave switch setting unchanged. 33 Read SDM-CAN's internal switches. Place results in the array
specified in the Dest parameter. StartBit
The StartBit parameter is used to identify the least significant bit of the data value within the CAN data frame to which the instruction relates. The bit number can range from 1 to 64 (there are 64 bits in a CAN data frame). The SDM-CAN adheres to the ISO standard where the least significant bit is referenced to the right most bit of the data frame. If a negative value is entered, the least significant bit is referenced to the left most bit of the data frame.
NumBits
The NumBits parameter is used to specify the number of bits that will be used in a transaction. The number can range from 1 to 64 (there are 64 bits in a CAN data frame).
The SDM-CAN can be configured to notify the datalogger when new data is available by setting a control port high. This allows data to be stored in the datalogger tables faster than the program execution interval. This interrupt function is enabled by entering a negative value for this parameter.
Note: This parameter may be overridden by a fixed number of bits, depending upon the data type selected.
NumVals
The NumVals parameter defines the number of values (beginning with the value stored in the Dest array) that will be transferred to or from the datalogger during one operation. For each value transferred, the Number of Bits (NumBits) will be added to the Start Bit number so that multiple values can be read from or stored to one data frame.
Mult, Offset
The Mult and Offset parameters are each a constant, variable, array, or expression by which to scale the results of the measurement.
If more than one Instruction 118 is used within a datalogger program, the values used for TimeQuanta, TSEG1 and TSEG2 must be the same for each instruction.
CANBUS Example The following example reads a 16-bit engine speed value from a CAN-bus network running at 250K baud.
NOTE

Section 7. Measurement Instructions
7-36
'Set Scan Rate Const Period=1 Const P_Units=2 ' \ \ \ \ \ \ \ \ \ \ \ \ CANBUS Constants / / / / / / / / / / / / '------------------------- Physical Network Parameters ------------ 'Set SDM-CAN to 250K Const TQUANT=4 Const TSEG1=5 Const TSEB2=2 '------------------------ Data Frame Parameters ------------------- '___________________ Canbus Block1_____________________ 'Collect and retrieve 16-bit data value 'Data Type 1, unsigned integer, most significant byte first Const CANREP1=1 'Repetitions Const ADDR1=0 'Address of SDM-CAN module Const DTYPE1=1 'Data values to collect Const STBIT1=33 'Start position in data frame Const NBITS1=16 'Number of bits per value Const NVALS1=1 'Number of values Const CMULT1=0.4 'Multiplier Const COSET1=0 'Offset Dim CANBlk1(CANREP1) 'Dimensioned Dest ' \ \ \ \ \ \ \ \ \ \ \ \ Aliases and other Variables / / / / / / / / Alias Canblk1(1)=Engine_Speed ' \ \ \ \ \ \ \ \ \ \ \ \ \ PROGRAM / / / / / / / / / / / / / / / / / BeginProg Scan(PERIOD,P_UNITS,0,0) '____________________ CAN Blocks_______________________ 'Retrieve Data from CAN-bus network Canbus (CANBLK1(), ADDR1, TQUANT, TSEG1, TSEG2, 217056256, DTYPE1, STBIT1, NBITS1, NVALS2, CMJLT1, COSET1) Next Scan EndProg
CD16AC (Source, Reps, SDMAddress)
The CD16AC instruction is used to control an SDM-CD16AC, SDM-CD16, or SDM-CD16D 16 channel relay/control port device.
A port on an SDM-CD16xx is enabled/disabled (turned on or off) by sending a value to it using the CD16AC instruction. A non-zero value will turn the port on; a zero value will turn it off. The values to be sent to the CD16AC are held in the Source array.
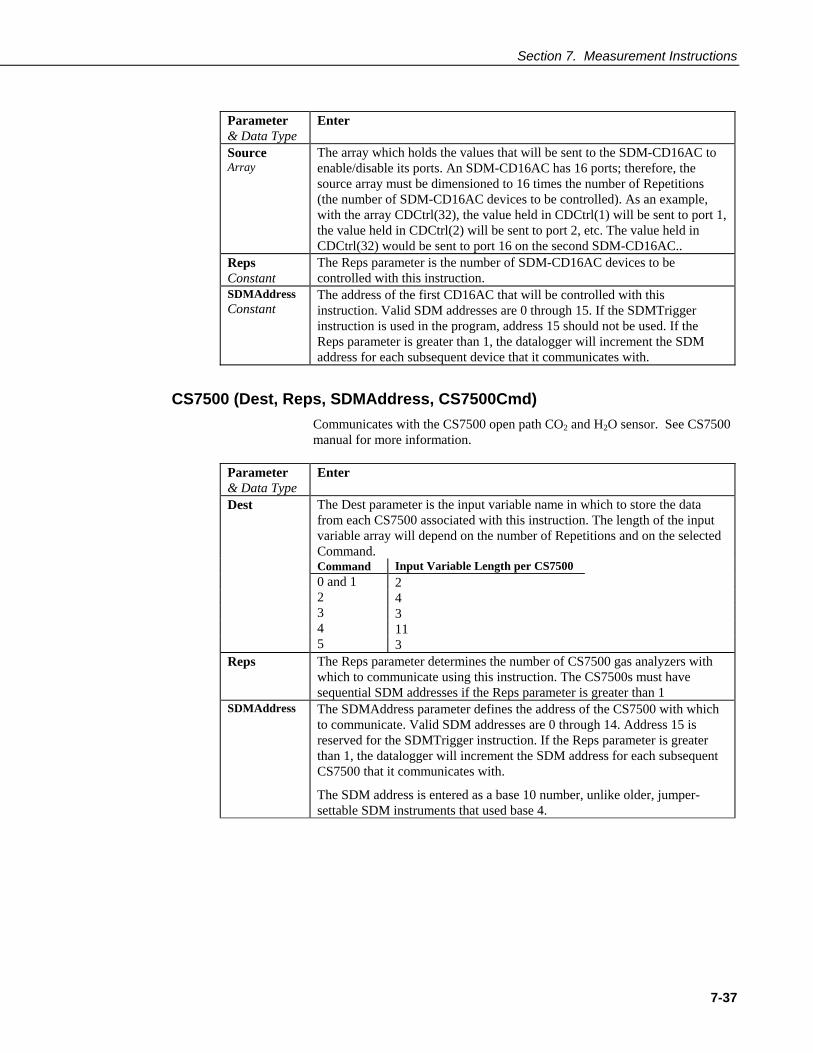
Section 7. Measurement Instructions
7-37
Parameter & Data Type
Enter
Source Array
The array which holds the values that will be sent to the SDM-CD16AC to enable/disable its ports. An SDM-CD16AC has 16 ports; therefore, the source array must be dimensioned to 16 times the number of Repetitions (the number of SDM-CD16AC devices to be controlled). As an example, with the array CDCtrl(32), the value held in CDCtrl(1) will be sent to port 1, the value held in CDCtrl(2) will be sent to port 2, etc. The value held in CDCtrl(32) would be sent to port 16 on the second SDM-CD16AC..
Reps Constant
The Reps parameter is the number of SDM-CD16AC devices to be controlled with this instruction.
SDMAddress Constant
The address of the first CD16AC that will be controlled with this instruction. Valid SDM addresses are 0 through 15. If the SDMTrigger instruction is used in the program, address 15 should not be used. If the Reps parameter is greater than 1, the datalogger will increment the SDM address for each subsequent device that it communicates with.
CS7500 (Dest, Reps, SDMAddress, CS7500Cmd)
Communicates with the CS7500 open path CO2 and H2O sensor. See CS7500 manual for more information.
Parameter & Data Type
Enter
Dest The Dest parameter is the input variable name in which to store the data from each CS7500 associated with this instruction. The length of the input variable array will depend on the number of Repetitions and on the selected Command.
Command Input Variable Length per CS7500 0 and 1 2 2 4 3 3 4 11 5 3 Reps The Reps parameter determines the number of CS7500 gas analyzers with
which to communicate using this instruction. The CS7500s must have sequential SDM addresses if the Reps parameter is greater than 1
SDMAddress The SDMAddress parameter defines the address of the CS7500 with which to communicate. Valid SDM addresses are 0 through 14. Address 15 is reserved for the SDMTrigger instruction. If the Reps parameter is greater than 1, the datalogger will increment the SDM address for each subsequent CS7500 that it communicates with.
The SDM address is entered as a base 10 number, unlike older, jumper-settable SDM instruments that used base 4.

Section 7. Measurement Instructions
7-38
Parameter & Data Type
Enter
CS7500Cmd The CS7500Cmd parameter requests the data to be retrieved from the sensor. The command is sent first to the device specified by the SDMAddress parameter. If the Reps parameter is greater than 1, subsequent CS7500s will be issued the command with each rep. The results for the command will be returned in the array specified by the Dest parameter. A numeric code is entered to request the data:
Code Description 0 Get CO2 & H2O molar density (mmol/m3) 1 Get CO2 & H2O absorptance 2 Get internal pressure estimate (kPa), auxiliary measurement A,
auxiliary measurement B, and cooler voltage (V)
3 Get cell diagnostic value, output bandwidth (Hz), and programmed delay [230 + (delay * 6.579)] (msec)
4 Get all data (CO2 molar density (mmol/m3), H2O molar density (mmol/m3), CO2 absorptance, H2O absorptance, internal pressure estimate (kPa), auxiliary measurement A, auxiliary measurement B, cooler voltage (V), cell diagnostic value, output bandwidth (Hz), and programmed delay [230 + (delay * 6.579)] (msec))
5 Get CO2 & H2O molar density (mmol/m3) and internal pressure estimate (kPa)
CSAT3 (Dest, Reps, SDMAddress, CSAT3Cmd, CSAT3Opt)
Communicates with the CSAT3 three dimensional sonic anemometer. See CSAT3 manual for more information.
Parameter & Data Type
Enter
Dest The Dest parameter is a variable in which to store the results of the measurement. This variable must be dimensioned to a length of five to hold the CSAT3 Ux, Uy, Uz, speed of sound, and diagnostic data.
Reps The Reps parameter is the number of times the measurement should be made. Measurements are made on consecutive channels. If the Reps parameter is greater than 1, the Dest parameter must be a variable array.
SDMAddress The SDMAddress parameter defines the address of the CSAT3 with which to communicate. Valid SDM addresses are 0 through 14. Address 15 is reserved for the SDMTrigger instruction. If the Reps parameter is greater than 1, the datalogger will increment the SDM address for each subsequent CSAT3 that it communicates with.
The SDM address is entered as a base 10 number, unlike older, jumper-settable SDM instruments that used base 4.

Section 7. Measurement Instructions
7-39
Parameter & Data Type
Enter
Command Commands 90 - 92 send a measurement trigger to the CSAT3 with the SDM address specified by the SDMAddress argument. The CSAT3 also sends data to the datalogger. Options 97 - 99 get data after a group trigger, SDMTrigger(), from the CSAT3 specified by the SDMAddress parameter without triggering a new CSAT3 measurements. The CSAT() instruction must be preceded by the SDMTrigger() instruction in order to used Options 97 - 99.
Code Description 90 Trigger and Get wind & speed of sound data 91 Trigger and Get wind & sonic temperature data 92 Trigger and Get wind & speed of sound data minus 340 m/s 97 Get wind & speed of sound data minus 340 m/s after a Group
Trigger
98 Get wind & sonic temperature data after a Group Trigger 99 Get wind & speed of sound data after a Group Trigger Rate The Rate argument sets the CSAT3’s execution parameter. This parameter
tells the CSAT3 which measurement parameters to use and what frequency to expect the measurement trigger from the datalogger. See the table below for a brief description of each of the parameter and the CSAT3 manual for a detailed description.
Code Description 1 Set Execution Parameter to 1 Hz 2 Set Execution Parameter to 2 Hz 3 Set Execution Parameter to 3 Hz 5 Set Execution Parameter to 5 Hz 6 Set Execution Parameter to 6 Hz 10 Set Execution Parameter to 10 Hz 12 Set Execution Parameter to 12 Hz 20 Set Execution Parameter to 20 Hz 30 Set Execution Parameter to 30 Hz 60 Set Execution Parameter to 60 Hz 61 Set Execution Parameter to 60 Hz to 10 Hz Oversample Mode 62 Set Execution Parameter to 60 Hz to 20 Hz Oversample Mode
INT8 (Dest, Address, Config8_5, Config4_1, Funct8_5, Funct4_1, OutputOpt, CaptureTrig, Mult, Offset )
This Instruction allows the use of the SDM-INT8, 8 Channel Interval Timer, with the CR5000. The INT8 is a (S)ynchronous (D)evice for the (M)easurement of intervals, counts between events, frequencies, periods, and/or time since an event. See the INT8 manual for more information about its capabilities.

Section 7. Measurement Instructions
7-40
Parameter & Data Type
Enter
Dest Variable or Array
The array where the results of the instruction are stored. For all output options except Capture All Events, the Dest argument should be a one dimensional array with as many elements as there are programmed INT8 channels. If the "Capture All Events" OutputOption is selected, then the Dest array must be two dimensional. The magnitude of first dimension should be set to the number of functions (up to 8), and the magnitude of the second dimension should be set to at least the number of events to be captured. The values will be loaded into the array in the sequence of all of the time ordered events captured from the lowest programmed channel to the time ordered events of the highest programmed channel.
Address Constant
The address is entered as a base 10 number. Valid addresses are 0 to 15. The INT8 is addressable using internal jumpers. The jumpers are set at the factory for address 00. See Appendix A of the INT8 manual for details on changing the INT8 address.
Config8_5 Config4_1 Constants
Each of the 8 input channels can be configured for either high or low level voltage inputs, and for rising or falling edges. Config8_5 is a four digit code to configure the INT8's channels 5 through 8. Config4_1 is a four digit code to configure the INT8's channels 1 through 4. The digits represent the channels in descending order left to right. For example, the code entered for Config8_5 to program channels 8 and 6 to capture the rising edge of a high level voltage, and channels 5 and 7 to capture the falling edge of a low level voltage would be "0303". See section 2 of the INT8 manual for information about the specification requirements of high and low level voltage signals.
Digit Edge 0 High level, rising edge 1 High level, falling edge 2 Low level, rising edge 3 Low level falling edge Funct8_5 Funct4_1 Constants
Each of the 8 input channels can be independently programmed for one of eight different timing functions. Funct8_5 is a four digit code to program the timing functions of INT8 channels 5 through 8. Funct4_1 is a four digit code to program the timing functions of INT8 channels 1 through 4. See section 5.3 of the INT8 manual for further details about these functions.
Digit Results 0 None 1 Period (msec) between edges on this channel 2 Frequency (kHz) of edges on the channel 3 Time between an edge on the previous channel and the edge on
this channel (msec)
4 time between an edge on channel 1 and the edge on this channel (msec)
5 Number of edges on channel 2 between the last edge on channel 1 and the edge on this channel using linear interpolation
6 Low resolution frequency (kHz) of edges on this channel 7 Total number of edges on this channel since last interrogation 8 Integer number of edges on channel 2 between the last edge on
channel 1 and the edge on this channel.
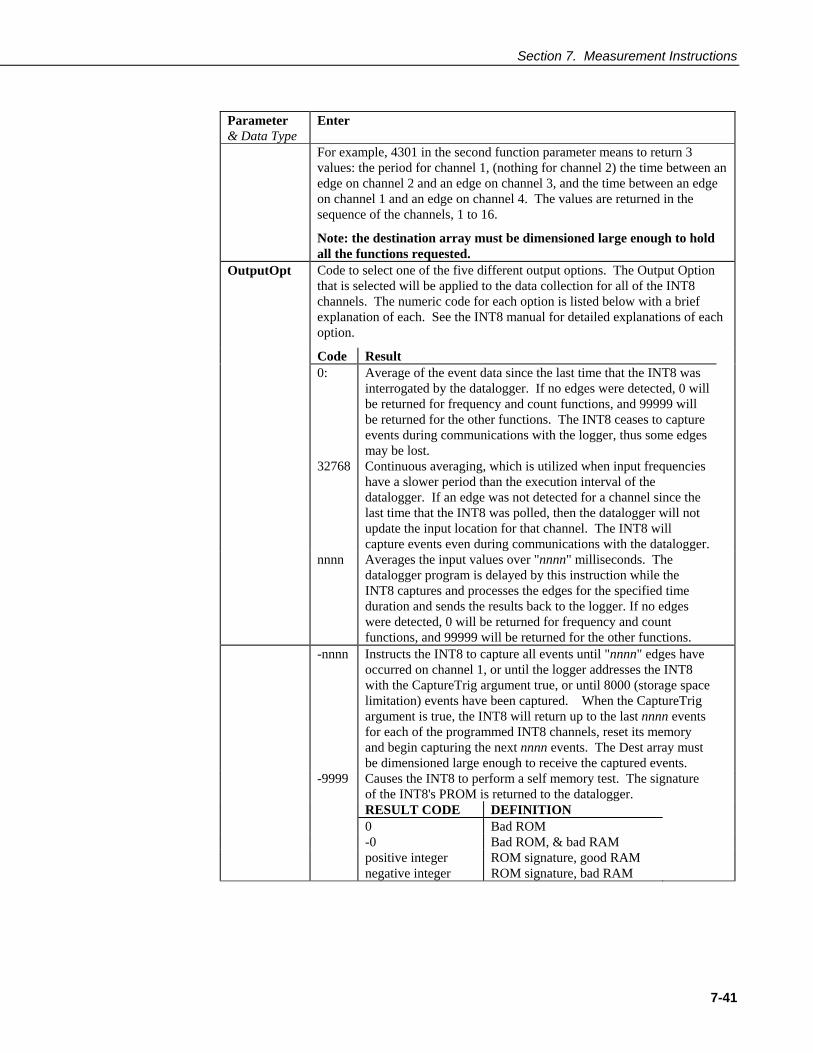
Section 7. Measurement Instructions
7-41
Parameter & Data Type
Enter
For example, 4301 in the second function parameter means to return 3 values: the period for channel 1, (nothing for channel 2) the time between an edge on channel 2 and an edge on channel 3, and the time between an edge on channel 1 and an edge on channel 4. The values are returned in the sequence of the channels, 1 to 16.
Note: the destination array must be dimensioned large enough to hold all the functions requested.
OutputOpt Code to select one of the five different output options. The Output Option that is selected will be applied to the data collection for all of the INT8 channels. The numeric code for each option is listed below with a brief explanation of each. See the INT8 manual for detailed explanations of each option.
Code Result 0: Average of the event data since the last time that the INT8 was
interrogated by the datalogger. If no edges were detected, 0 will be returned for frequency and count functions, and 99999 will be returned for the other functions. The INT8 ceases to capture events during communications with the logger, thus some edges may be lost.
32768 Continuous averaging, which is utilized when input frequencies have a slower period than the execution interval of the datalogger. If an edge was not detected for a channel since the last time that the INT8 was polled, then the datalogger will not update the input location for that channel. The INT8 will capture events even during communications with the datalogger.
nnnn Averages the input values over "nnnn" milliseconds. The datalogger program is delayed by this instruction while the INT8 captures and processes the edges for the specified time duration and sends the results back to the logger. If no edges were detected, 0 will be returned for frequency and count functions, and 99999 will be returned for the other functions.
-nnnn Instructs the INT8 to capture all events until "nnnn" edges have occurred on channel 1, or until the logger addresses the INT8 with the CaptureTrig argument true, or until 8000 (storage space limitation) events have been captured. When the CaptureTrig argument is true, the INT8 will return up to the last nnnn events for each of the programmed INT8 channels, reset its memory and begin capturing the next nnnn events. The Dest array must be dimensioned large enough to receive the captured events.
-9999 Causes the INT8 to perform a self memory test. The signature of the INT8's PROM is returned to the datalogger.
RESULT CODE DEFINITION 0 Bad ROM -0 Bad ROM, & bad RAM positive integer ROM signature, good RAM negative integer ROM signature, bad RAM
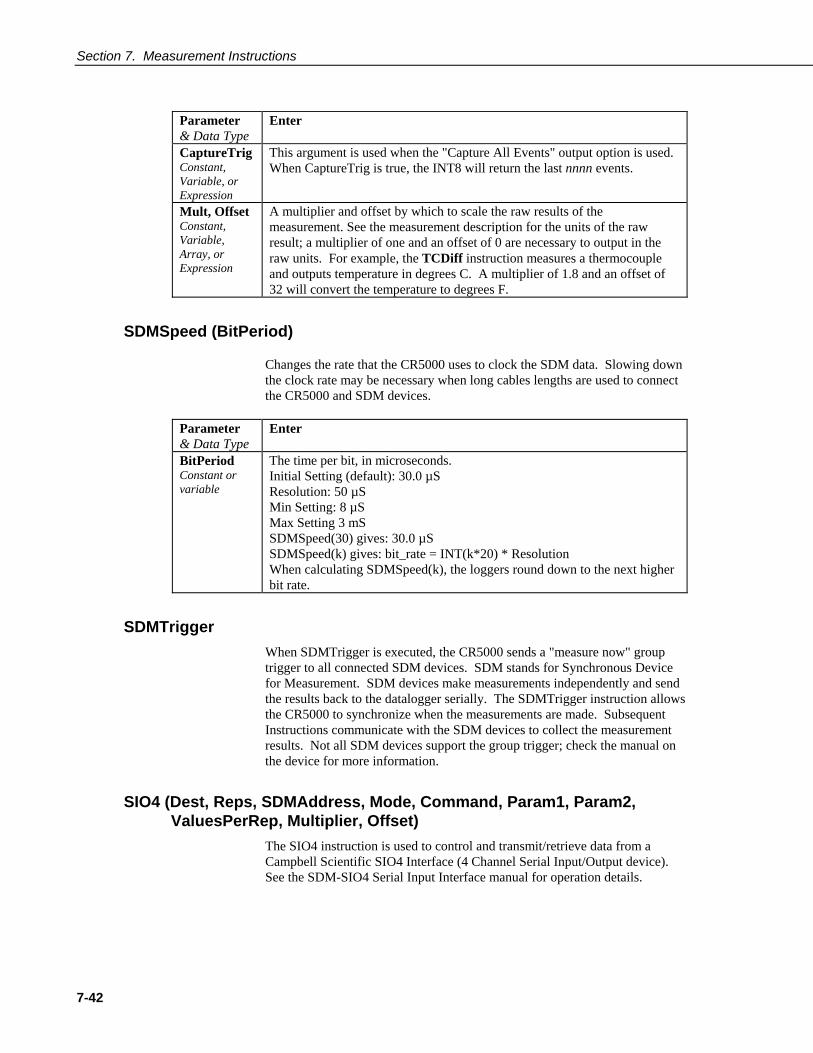
Section 7. Measurement Instructions
7-42
Parameter & Data Type
Enter
CaptureTrig Constant, Variable, or Expression
This argument is used when the "Capture All Events" output option is used. When CaptureTrig is true, the INT8 will return the last nnnn events.
Mult, Offset Constant, Variable, Array, or Expression
A multiplier and offset by which to scale the raw results of the measurement. See the measurement description for the units of the raw result; a multiplier of one and an offset of 0 are necessary to output in the raw units. For example, the TCDiff instruction measures a thermocouple and outputs temperature in degrees C. A multiplier of 1.8 and an offset of 32 will convert the temperature to degrees F.
SDMSpeed (BitPeriod)
Changes the rate that the CR5000 uses to clock the SDM data. Slowing down the clock rate may be necessary when long cables lengths are used to connect the CR5000 and SDM devices.
Parameter & Data Type
Enter
BitPeriod Constant or variable
The time per bit, in microseconds. Initial Setting (default): 30.0 µS Resolution: 50 µS Min Setting: 8 µS Max Setting 3 mS SDMSpeed(30) gives: 30.0 µS SDMSpeed(k) gives: bit_rate = INT(k*20) * Resolution When calculating SDMSpeed(k), the loggers round down to the next higher bit rate.
SDMTrigger
When SDMTrigger is executed, the CR5000 sends a "measure now" group trigger to all connected SDM devices. SDM stands for Synchronous Device for Measurement. SDM devices make measurements independently and send the results back to the datalogger serially. The SDMTrigger instruction allows the CR5000 to synchronize when the measurements are made. Subsequent Instructions communicate with the SDM devices to collect the measurement results. Not all SDM devices support the group trigger; check the manual on the device for more information.
SIO4 (Dest, Reps, SDMAddress, Mode, Command, Param1, Param2, ValuesPerRep, Multiplier, Offset)
The SIO4 instruction is used to control and transmit/retrieve data from a Campbell Scientific SIO4 Interface (4 Channel Serial Input/Output device). See the SDM-SIO4 Serial Input Interface manual for operation details.
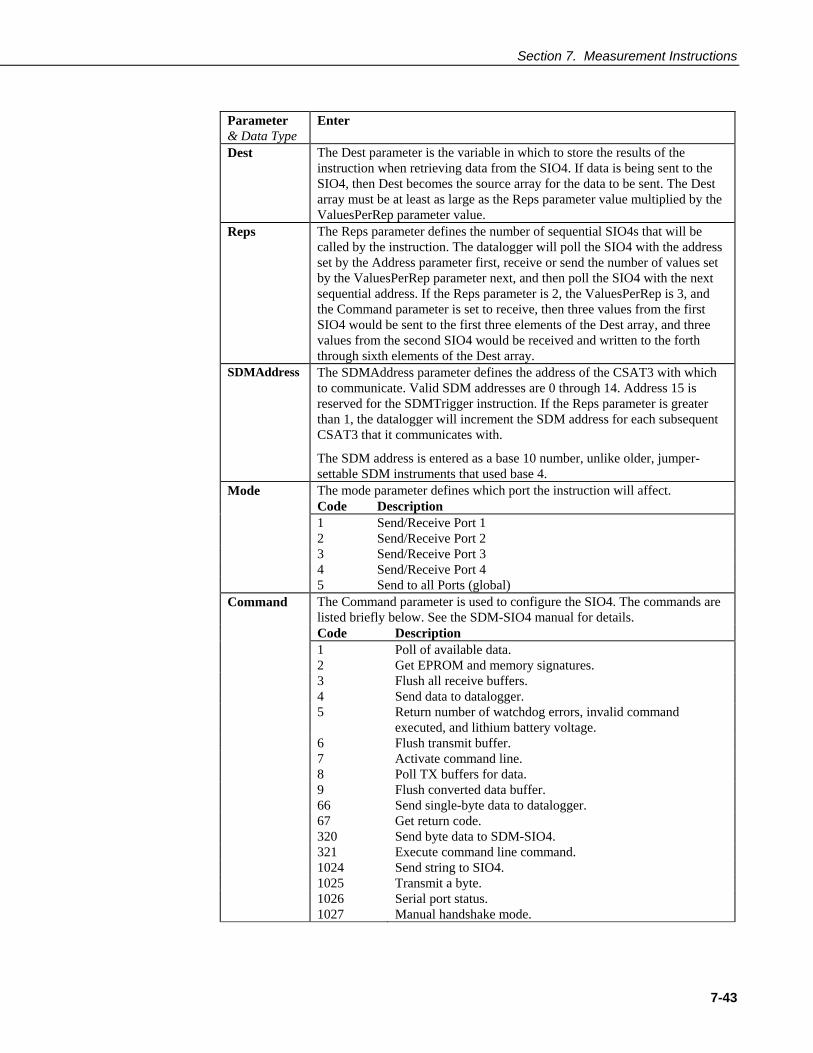
Section 7. Measurement Instructions
7-43
Parameter & Data Type
Enter
Dest
The Dest parameter is the variable in which to store the results of the instruction when retrieving data from the SIO4. If data is being sent to the SIO4, then Dest becomes the source array for the data to be sent. The Dest array must be at least as large as the Reps parameter value multiplied by the ValuesPerRep parameter value.
Reps
The Reps parameter defines the number of sequential SIO4s that will be called by the instruction. The datalogger will poll the SIO4 with the address set by the Address parameter first, receive or send the number of values set by the ValuesPerRep parameter next, and then poll the SIO4 with the next sequential address. If the Reps parameter is 2, the ValuesPerRep is 3, and the Command parameter is set to receive, then three values from the first SIO4 would be sent to the first three elements of the Dest array, and three values from the second SIO4 would be received and written to the forth through sixth elements of the Dest array.
SDMAddress
The SDMAddress parameter defines the address of the CSAT3 with which to communicate. Valid SDM addresses are 0 through 14. Address 15 is reserved for the SDMTrigger instruction. If the Reps parameter is greater than 1, the datalogger will increment the SDM address for each subsequent CSAT3 that it communicates with.
The SDM address is entered as a base 10 number, unlike older, jumper-settable SDM instruments that used base 4.
Mode The mode parameter defines which port the instruction will affect. Code Description 1 Send/Receive Port 1 2 Send/Receive Port 2 3 Send/Receive Port 3 4 Send/Receive Port 4 5 Send to all Ports (global) Command
The Command parameter is used to configure the SIO4. The commands are listed briefly below. See the SDM-SIO4 manual for details.
Code Description 1 Poll of available data. 2 Get EPROM and memory signatures. 3 Flush all receive buffers. 4 Send data to datalogger. 5 Return number of watchdog errors, invalid command
executed, and lithium battery voltage. 6 Flush transmit buffer. 7 Activate command line. 8 Poll TX buffers for data. 9 Flush converted data buffer. 66 Send single-byte data to datalogger. 67 Get return code. 320 Send byte data to SDM-SIO4. 321 Execute command line command. 1024 Send string to SIO4. 1025 Transmit a byte. 1026 Serial port status. 1027 Manual handshake mode.

Section 7. Measurement Instructions
7-44
Parameter & Data Type
Enter
2049 Communication parameters. 2054 Set up receive filter. 2304 Transmit string and/or data to device (formatter/filter). 2305 Transmit bytes. Param1
Param1 is the first parameter that should be passed on to the SIO4 for the selected Command. Refer to the SDM-SIO4 manual for details.
Param2
Param2 is the second parameter that should be passed on to the SIO4 for the selected Command. Refer to the SDM-SIO4 manual for details.
ValuesPerRep
The ValuesPerRep parameter is the number of values to be sent or received from each SIO4 each time this instruction is performed.
Mult, Offset
These parameters are the multiplier and offset with which to scale the values received by the datalogger from the SIO4.
SW8A (Dest, Reps, SDMAddress, FunctOp, SW8AStartChan, Mult, Offset)
The SW8A instruction is used to control the SDM-SW8A Eight-Channel Switch Closure module, and store the results of its measurements to a variable array.
Parameter & Data Type
Enter
Dest Variable or Array
The variable in which to store the results of the SW8A measurement. The variable array for this parameter must be dimensioned to the number of Reps.
Reps Constant
The number of channels that will be read on the SW8A. If (StartChan +Reps –1) is greater than 8, measurement will continue on the next sequential SW8A. In this instance, the addresses of the SDM devices must be consecutive.
SDMAddress Constant
The address of the first SW8A with which to communicate. Valid SDM addresses are 0 through 15. If the SDMTrigger instruction is used in the program, address 15 should not be used. If the Reps parameter used more channels than are available on the first SW8A, the datalogger will increment the SDM address for each subsequent device that it communicates with.
FunctOp The FunctOp is used to determine the result that will be returned by the SW8A.
Constant Numeric Code
Function
0 Returns the state of the signal at the time the instruction is executed. A 0 is stored for low and a 1 is stored for high.
1 Returns the duty cycle of the signal. The result is the percentage of time the signal is high during the scan interval.
2 Returns a count of the number of positive transitions of the signal.
3 Returns a value indicating the condition of the module: positive integer: ROM and RAM are good negative value: RAM is bad Zero: ROM is bad

Section 7. Measurement Instructions
7-45
Parameter & Data Type
Enter
StartChan Constant
The first channel that should be read on the SW8A. If the Reps parameter is greater than 1, measurements will be made on sequential channels.
Mult, Offset Constant, Variable, Array, or Expression
A multiplier and offset by which to scale the raw results of the measurement. See the measurement description for the units of the raw result; a multiplier of one and an offset of 0 are necessary to output in the raw units. For example, the TCDiff instruction measures a thermocouple and outputs temperature in degrees C. A multiplier of 1.8 and an offset of 32 will convert the temperature to degrees F.

Section 7. Measurement Instructions
7-46
This is a blank page.
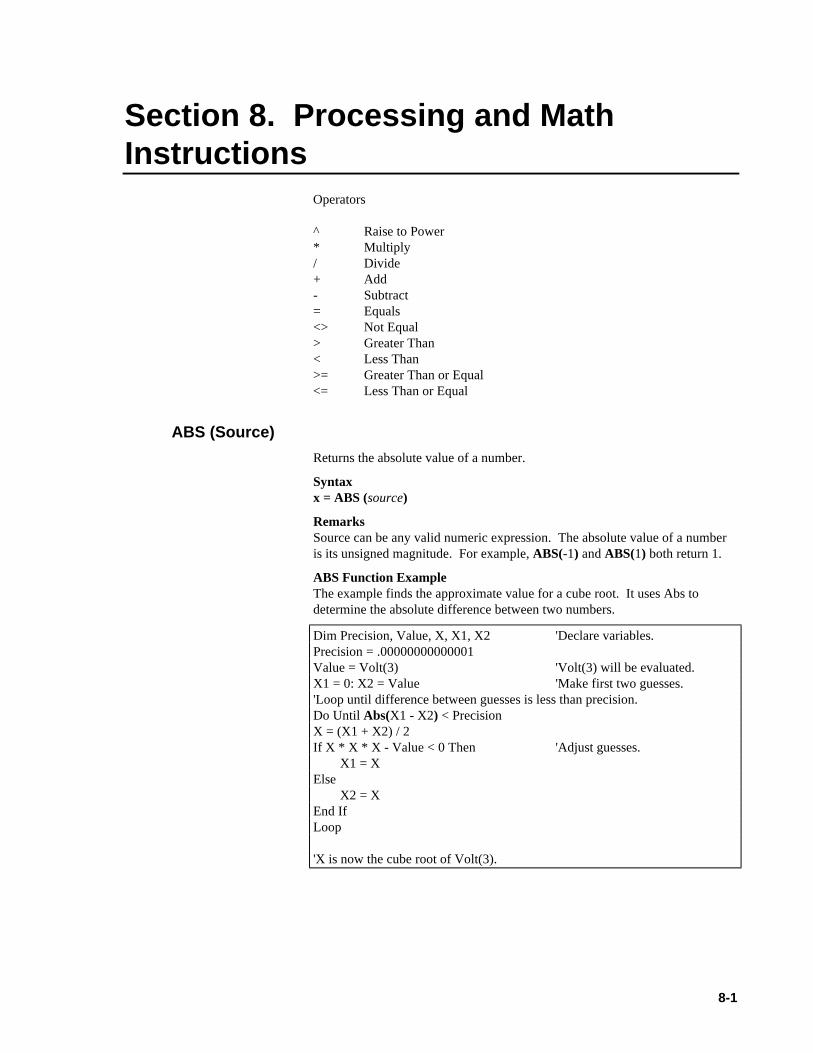
8-1
Section 8. Processing and MathInstructions
Operators
^ Raise to Power* Multiply/ Divide+ Add- Subtract= Equals<> Not Equal> Greater Than< Less Than>= Greater Than or Equal<= Less Than or Equal
ABS (Source)
Returns the absolute value of a number.
Syntaxx = ABS (source)
RemarksSource can be any valid numeric expression. The absolute value of a numberis its unsigned magnitude. For example, ABS(-1) and ABS(1) both return 1.
ABS Function ExampleThe example finds the approximate value for a cube root. It uses Abs todetermine the absolute difference between two numbers.
Dim Precision, Value, X, X1, X2 'Declare variables.Precision = .00000000000001Value = Volt(3) 'Volt(3) will be evaluated.X1 = 0: X2 = Value 'Make first two guesses.'Loop until difference between guesses is less than precision.Do Until Abs(X1 - X2) < PrecisionX = (X1 + X2) / 2If X * X * X - Value < 0 Then 'Adjust guesses.
X1 = XElse
X2 = XEnd IfLoop
'X is now the cube root of Volt(3).

Section 8. Processing and Math Instructions
8-2
ACOS (Source)
The ACOS function returns the arc cosine of a number.
Syntaxx = ACOS (source)
RemarksThe source can be any valid numeric expression that has a value between -1and 1 inclusive.
The ACOS function takes the ratio of two sides of a right triangle and returnsthe corresponding angle. The ratio is the length of the side adjacent to the angledivided by the length of the hypotenuse. The result is expressed in radians andis in the range -π/2 to π/2 radians.
To convert degrees to radians, multiply degrees by π/180. To convert radiansto degrees, multiply radians by 180/π.
ACOS is the inverse trigonometric function of COSINE, which takes an angleas its argument and returns the length ratio of the side adjacent to the angle tothe hypotenuse.
ACOS Function ExampleThe example uses ACOS to calculate π. By definition, a full circle is 2πradians. ACOS(0) is π/2 radians (90 degrees).
Public Pi 'Declare variables.Pi = 2 * ACOS( 0 ) 'Calculate Pi.
AND
Used to perform a logical conjunction on two expressions.
Syntaxresult = expr1 And expr2
RemarksIf, and only if, both expressions evaluate True, result is True. If eitherexpression evaluates False, result is False. The following table illustrates howresult is determined:
If expr1 And expr2 The resultis is isTrue True TrueTrue False FalseFalse True FalseFalse False FalseThe And operator also performs a bit-wise comparison of identicallypositioned bits in two numeric expressions and sets the corresponding bit inresult according to the following truth table:
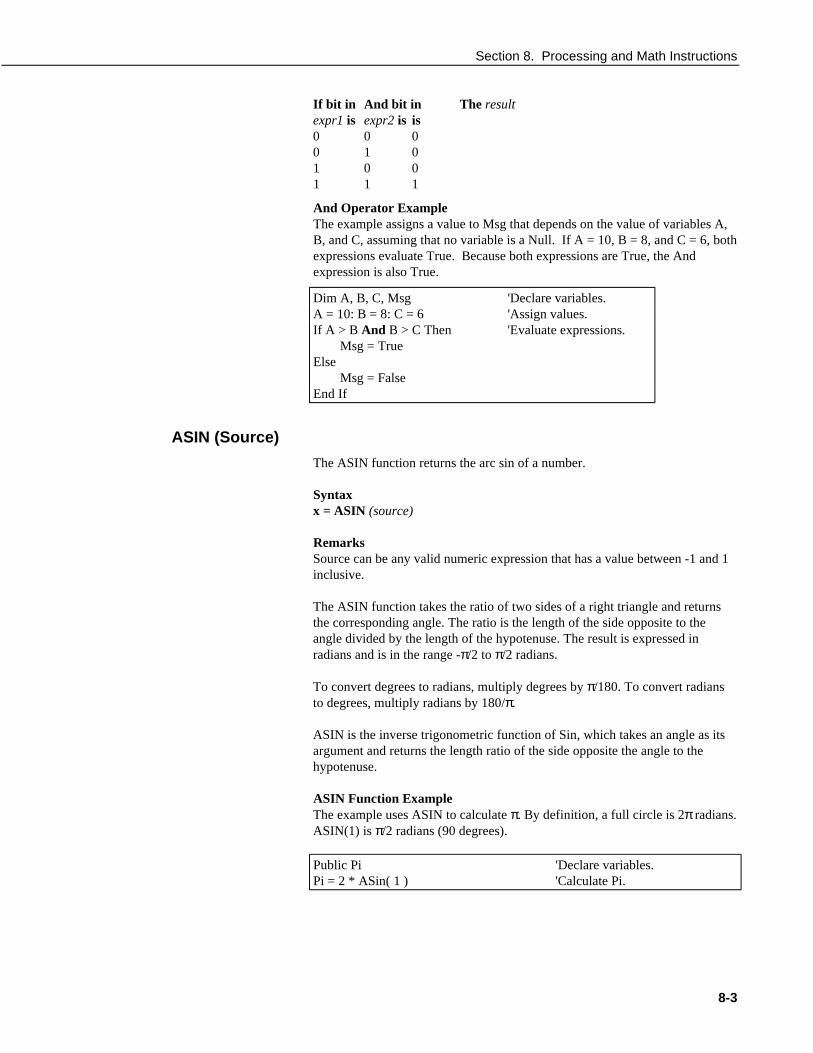
Section 8. Processing and Math Instructions
8-3
If bit in And bit in The resultexpr1 is expr2 is is0 0 00 1 01 0 01 1 1
And Operator ExampleThe example assigns a value to Msg that depends on the value of variables A,B, and C, assuming that no variable is a Null. If A = 10, B = 8, and C = 6, bothexpressions evaluate True. Because both expressions are True, the Andexpression is also True.
Dim A, B, C, Msg 'Declare variables.A = 10: B = 8: C = 6 'Assign values.If A > B And B > C Then 'Evaluate expressions.
Msg = TrueElse
Msg = FalseEnd If
ASIN (Source)
The ASIN function returns the arc sin of a number.
Syntaxx = ASIN (source)
RemarksSource can be any valid numeric expression that has a value between -1 and 1inclusive.
The ASIN function takes the ratio of two sides of a right triangle and returnsthe corresponding angle. The ratio is the length of the side opposite to theangle divided by the length of the hypotenuse. The result is expressed inradians and is in the range -π/2 to π/2 radians.
To convert degrees to radians, multiply degrees by π/180. To convert radiansto degrees, multiply radians by 180/π.
ASIN is the inverse trigonometric function of Sin, which takes an angle as itsargument and returns the length ratio of the side opposite the angle to thehypotenuse.
ASIN Function ExampleThe example uses ASIN to calculate π. By definition, a full circle is 2π radians.ASIN(1) is π/2 radians (90 degrees).
Public Pi 'Declare variables.Pi = 2 * ASin( 1 ) 'Calculate Pi.

Section 8. Processing and Math Instructions
8-4
ATN (Source)
Returns the arctangent of a number.
Syntaxx = ATN (source)
RemarksSource can be any valid numeric expression.
The Atn function takes the ratio of two sides of a right triangle and returns thecorresponding angle. The ratio is the length of the side opposite the angledivided by the length of the side adjacent to the angle. The result is expressedin radians and is in the range -π/2 to π/2 radians.
To convert degrees to radians, multiply degrees by π/180. To convert radiansto degrees, multiply radians by 180/π.
Atn is the inverse trigonometric function of Tan, which takes an angle as itsargument and returns the ratio of two sides of a right triangle. Do not confuseAtn with the cotangent, which is the simple inverse of a tangent (1/tangent).
Atn FunctionExample
The example uses Atn to calculate π. By definition, a full circle is 2π radians.Atn(1) is π/4 radians (45 degrees).
Dim Pi 'Declare variables.Pi = 4 * Atn(1) 'Calculate Pi.
ATN2()
The ATN2 function returns the arctangent of y/x.
Syntaxx = ATN2 ( Y, X )
RemarksATN2 function calculates the arctangent of Y/X returning a value in the rangefrom Pi to -Pi radians, using the signs of both parameters to determine thequadrant of the return value. ATN2 is defined for every point other than theorigin (X = 0 and Y = 0). Y and X can be variables, constants, or expressions.
To convert degrees to radians, multiply degrees by π/180. To convert radiansto degrees, multiply radians by 180/π.
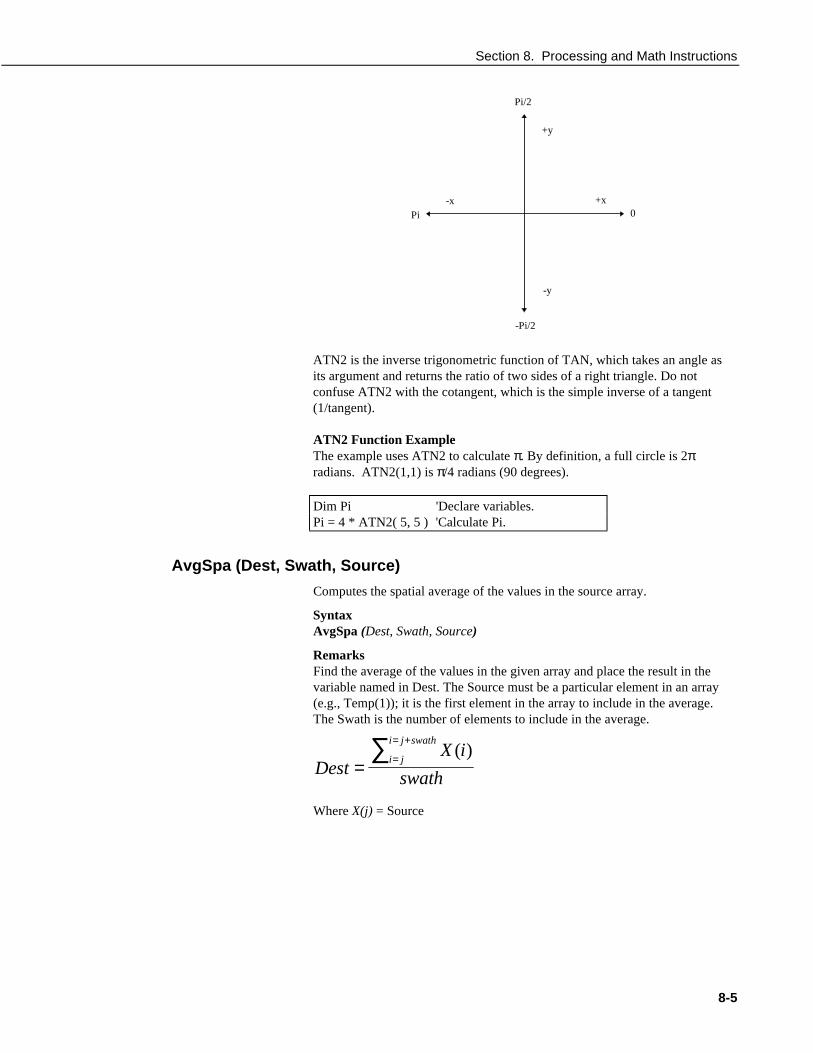
Section 8. Processing and Math Instructions
8-5
Pi/2
-Pi/2
Pi 0
+y
+x-x
-y
ATN2 is the inverse trigonometric function of TAN, which takes an angle asits argument and returns the ratio of two sides of a right triangle. Do notconfuse ATN2 with the cotangent, which is the simple inverse of a tangent(1/tangent).
ATN2 Function ExampleThe example uses ATN2 to calculate π. By definition, a full circle is 2πradians. ATN2(1,1) is π/4 radians (90 degrees).
Dim Pi 'Declare variables.Pi = 4 * ATN2( 5, 5 ) 'Calculate Pi.
AvgSpa (Dest, Swath, Source)
Computes the spatial average of the values in the source array.
SyntaxAvgSpa (Dest, Swath, Source)
RemarksFind the average of the values in the given array and place the result in thevariable named in Dest. The Source must be a particular element in an array(e.g., Temp(1)); it is the first element in the array to include in the average.The Swath is the number of elements to include in the average.
DestX i
swathi j
i j swath
= =
= +∑ ( )
Where X(j) = Source

Section 8. Processing and Math Instructions
8-6
Parameter& Data Type
Enter
DestVariable
The variable in which to store the results of the instruction.
SwathConstant
The number of values of the source array to average.
SourceArray
The name of the variable array that is the input for the instruction.
Average Spatial Output Example
This example uses AvgSpa to find the average value of the five elementsTemp(6) through Temp(10) and store the result in the variable AvgTemp.
AvgSpa(AvgTemp, 5, Temp(6))
AvgRun (Dest, Reps, Source, Number)
Calculates a running average of a measurement or calculated value.
SyntaxAvgRun (Dest, Reps, Source, Number)
RemarksAvgRun is used to create a running average. A running average is the averageof the last N values where N is the number of values.
DestX
Nii
i N
= =
=∑ 1
Where X N is the most recent value of the source variable and X N −1 is the
previous value ( X1 is the oldest value included in the average, i.e., N-1 values
back from the most recent).
Parameter& Data Type
Enter
DestVariable orArray
The variable or array in which to store the average(s).
RepsConstant
When the source is an array, this is the number of variables in the array tocalculate averages for. When the source is not an array or only a singlevariable of the array is to be averaged, reps should be 1.
NumberConstant
The number of values to include in the running average..
SourceArray
The name of the variable or array that is to be averaged.

Section 8. Processing and Math Instructions
8-7
Example
BeginProg 'Program begins hereScan( RATE, RUNITS, 0, 0 ) 'Scan 1(mSecs),'______________________ Volt Blocks ______________________VoltDiff(HiVolts, VREP1, VRNG1, 5, 1, 0, VDLY1, VINT1, VMULT1,
VOSET1)AvgRun(AvgOut,1,HiVolts,100 ) 'Put the average of 100 HiVolts in
AvgOutCallTable MAIN 'Go up and run Table MAINNext Scan 'Loop up for the next scan
EndProg 'Program ends here
Cos (Source)
Returns the cosine of an angle specified in radians.
Syntaxx = Cos (source)
RemarksSource can be any valid numeric expression measured in radians.
The Cos function takes an angle and returns the ratio of two sides of a righttriangle. The ratio is the length of the side adjacent to the angle divided by thelength of the hypotenuse. The result lies in the range -1 to 1.
To convert degrees to radians, multiply degrees by π/180. To convert radiansto degrees, multiply radians by 180/π.
Cos FunctionExampleThe example uses Cos to calculate the cosine of an angle with a user-specifiednumber of degrees.
Dim Degrees, Pi, Radians, Ans 'Declare variables.BeginProgPi = 4 * Atn(1) 'Calculate Pi.Degrees = Volts(1) 'Get value to convert.Radians = Degrees * (Pi / 180) 'Convert to radians.Ans = Cos(Radians) ‘The Cosine of Degrees.EndProg
CosH (Source)
The COSH function returns the hyperbolic cosine of an expression or value.
Syntaxx = COSH (source)
RemarksThe COSH function takes a value and returns the hyperbolic cosine [COSH(x)= 0.5(ex + e-x)] for that value.
COSH Function ExampleThe example uses COSH to calculate the hyperbolic cosine of a voltage inputand store the result in the Ans variable.
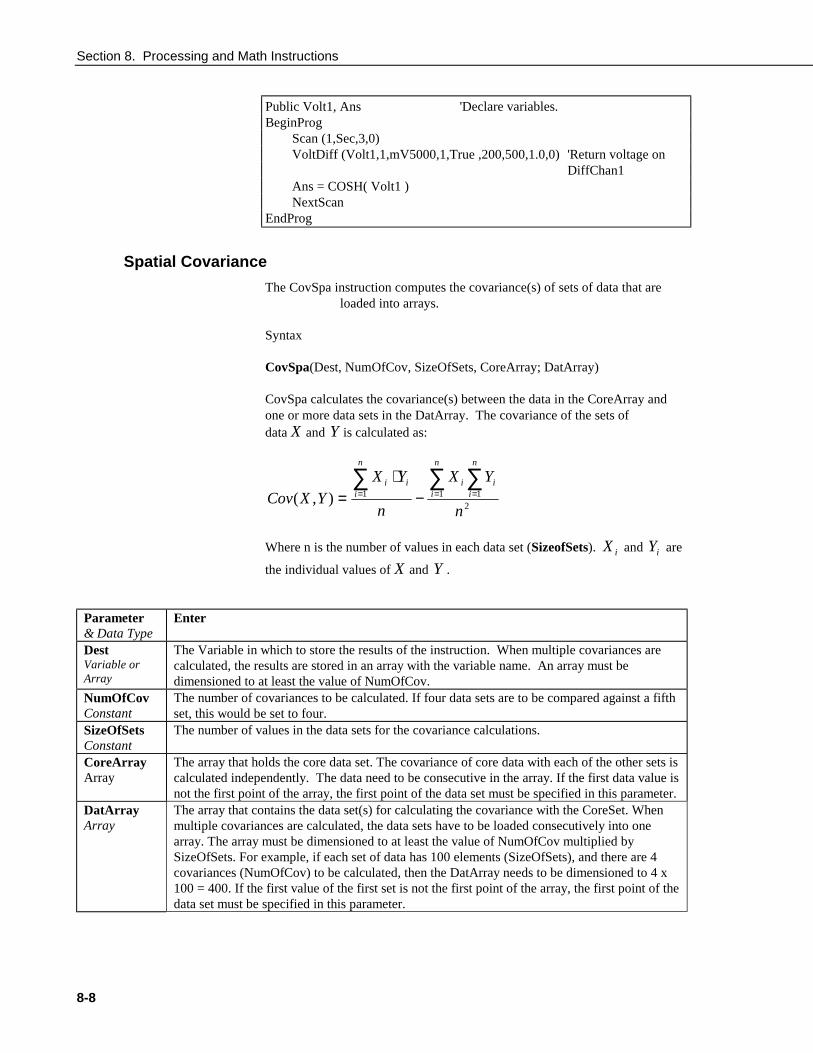
Section 8. Processing and Math Instructions
8-8
Public Volt1, Ans 'Declare variables.BeginProg
Scan (1,Sec,3,0)VoltDiff (Volt1,1,mV5000,1,True ,200,500,1.0,0) 'Return voltage on
DiffChan1Ans = COSH( Volt1 )NextScan
EndProg
Spatial Covariance
The CovSpa instruction computes the covariance(s) of sets of data that areloaded into arrays.
Syntax
CovSpa(Dest, NumOfCov, SizeOfSets, CoreArray; DatArray)
CovSpa calculates the covariance(s) between the data in the CoreArray andone or more data sets in the DatArray. The covariance of the sets ofdata X and Y is calculated as:
2111),(
n
YX
n
YXYXCov
n
ii
n
ii
n
iii ∑∑∑
=== −⋅
=
Where n is the number of values in each data set (SizeofSets). iX and iY are
the individual values of X and Y .
Parameter& Data Type
Enter
DestVariable orArray
The Variable in which to store the results of the instruction. When multiple covariances arecalculated, the results are stored in an array with the variable name. An array must bedimensioned to at least the value of NumOfCov.
NumOfCovConstant
The number of covariances to be calculated. If four data sets are to be compared against a fifthset, this would be set to four.
SizeOfSetsConstant
The number of values in the data sets for the covariance calculations.
CoreArrayArray
The array that holds the core data set. The covariance of core data with each of the other sets iscalculated independently. The data need to be consecutive in the array. If the first data value isnot the first point of the array, the first point of the data set must be specified in this parameter.
DatArrayArray
The array that contains the data set(s) for calculating the covariance with the CoreSet. Whenmultiple covariances are calculated, the data sets have to be loaded consecutively into onearray. The array must be dimensioned to at least the value of NumOfCov multiplied bySizeOfSets. For example, if each set of data has 100 elements (SizeOfSets), and there are 4covariances (NumOfCov) to be calculated, then the DatArray needs to be dimensioned to 4 x100 = 400. If the first value of the first set is not the first point of the array, the first point of thedata set must be specified in this parameter.

Section 8. Processing and Math Instructions
8-9
Exp
Returns e (the base of natural logarithms) raised to a power.
Syntaxx = Exp (source)
RemarksIf the value of the source exceeds 709.782712893, an Overflow error occurs.The constant e is approximately 2.718282.
The Exp function complements the action of the Log functionand is sometimes referred to as the antilogarithm.
Exp FunctionExampleThe example uses Exp to calculate the value of e. Exp(1) is e raised to thepower of 1.
'Exp(x) is e ^x so Exp(1) is e ^1 or e.
Dim ValueOfE 'Declare variables.BeginProgValueOfE = Exp(1) 'Calculate value of e.EndProg
FFTSpa (Dest, N, Source, Tau, Units, Option)
The FFTSpa performs a Fast Fourier Transform on a time series ofmeasurements stored in an array and places the results in an array. It can alsoperform an inverse FFT, generating a time series from the results of an FFT.Depending on the output option chosen, the output can be: 0) The real andimaginary parts of the FFT; 1) Amplitude spectrum. 2) Amplitude and PhaseSpectrum; 3) Power Spectrum; 4) Power Spectral Density (PSD); or 5) InverseFFT.
The difference between the FFT instruction (Section 6) and FFTSpa is thatFFT is an output instruction that stores the results in a data table and FFTSpastores its results in an array.
Parameter& Data Type
Enter
DestArray
The array in which to store the results of FFT.
SourceVariable
The name of the Variable array that contains the input data for the FFT.
NConstant
Number of points in the original time series. The number of points must be a powerof 2 (i.e., 512, 1024, 2048, etc.).
TauConstant
The sampling interval of the time series.
NOTE
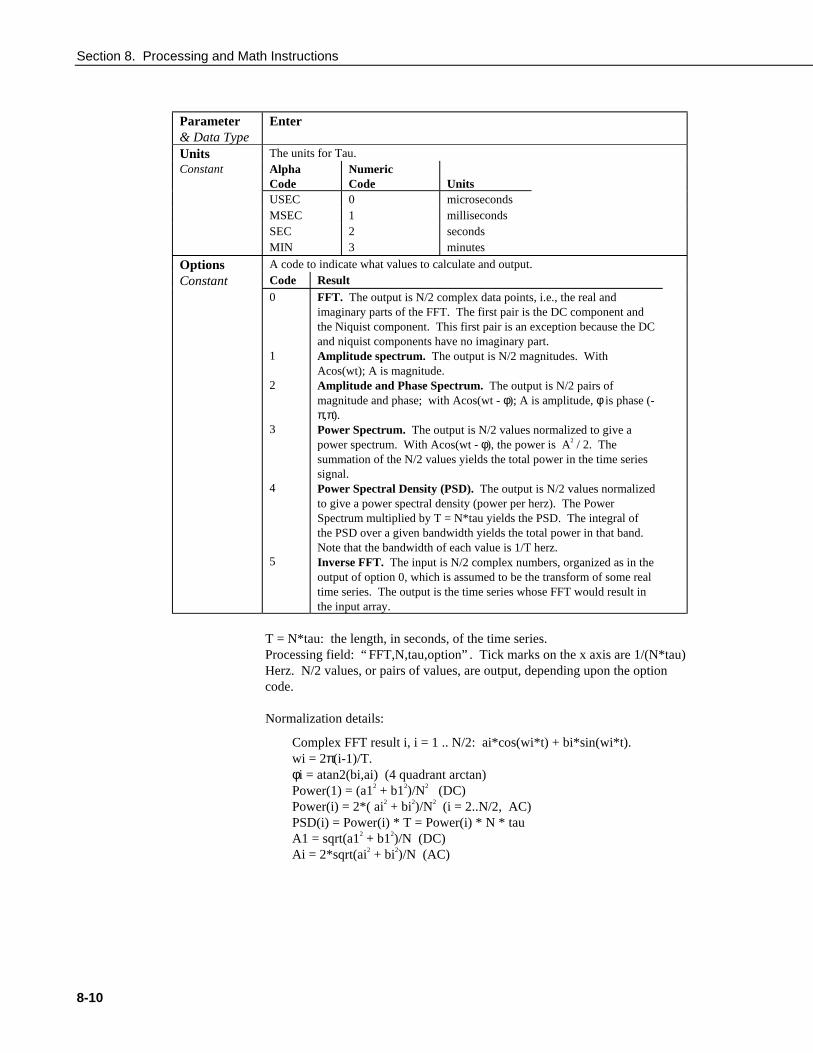
Section 8. Processing and Math Instructions
8-10
Parameter& Data Type
Enter
Units The units for Tau.Constant Alpha
CodeNumericCode Units
USEC 0 microsecondsMSEC 1 millisecondsSEC 2 secondsMIN 3 minutes
Options A code to indicate what values to calculate and output.
Constant Code Result0
1
2
3
4
5
FFT. The output is N/2 complex data points, i.e., the real andimaginary parts of the FFT. The first pair is the DC component andthe Niquist component. This first pair is an exception because the DCand niquist components have no imaginary part.Amplitude spectrum. The output is N/2 magnitudes. WithAcos(wt); A is magnitude.Amplitude and Phase Spectrum. The output is N/2 pairs ofmagnitude and phase; with Acos(wt - φ); A is amplitude, φ is phase (-π,π).Power Spectrum. The output is N/2 values normalized to give apower spectrum. With Acos(wt - φ), the power is A2 / 2. Thesummation of the N/2 values yields the total power in the time seriessignal.Power Spectral Density (PSD). The output is N/2 values normalizedto give a power spectral density (power per herz). The PowerSpectrum multiplied by T = N*tau yields the PSD. The integral ofthe PSD over a given bandwidth yields the total power in that band.Note that the bandwidth of each value is 1/T herz.Inverse FFT. The input is N/2 complex numbers, organized as in theoutput of option 0, which is assumed to be the transform of some realtime series. The output is the time series whose FFT would result inthe input array.
T = N*tau: the length, in seconds, of the time series.Processing field: “ FFT,N,tau,option” . Tick marks on the x axis are 1/(N*tau)Herz. N/2 values, or pairs of values, are output, depending upon the optioncode.
Normalization details:
Complex FFT result i, i = 1 .. N/2: ai*cos(wi*t) + bi*sin(wi*t).wi = 2π(i-1)/T.φi = atan2(bi,ai) (4 quadrant arctan)Power(1) = (a12 + b12)/N2 (DC)Power(i) = 2*( ai2 + bi2)/N2 (i = 2..N/2, AC)PSD(i) = Power(i) * T = Power(i) * N * tauA1 = sqrt(a12 + b12)/N (DC)Ai = 2*sqrt(ai2 + bi2)/N (AC)

Section 8. Processing and Math Instructions
8-11
Notes:
• Power is independent of the sampling rate (1/tau) and of the number ofsamples (N).
• The PSD is proportional to the length of the sampling period (T=N*tau),since the “ width” of each bin is 1/T.
• The sum of the AC bins (excluding DC) of the Power Spectrum is theVariance (AC Power) of the time series.
• The factor of 2 in the Power(i) calculation is due to the power series beingmirrored about the Niquist frequency N/(2*T); only half the power isrepresented in the FFT bins below N/2, with the exception of DC. Hence,DC does not have the factor of 2.
• The Inverse FFT option assumes that the data array input is the transformof a real time series. Filtering is performed by taking an FFT on a data set,zeroing certain frequency bins, and then taking the Inverse FFT.Interpolation is performed by taking an FFT, zero padding the result, andthen taking the Inverse FFT of the larger array. The resolution in the timedomain is increased by the ratio of the size of the padded FFT to the sizeof the unpadded FFT. This can be used to increase the resolution of amaximum or minimum, as long as aliasing is avoided.
Frac (Source)
Returns the fractional part of a number.
Syntaxx = Frac (source)
RemarksReturns the fractional portion of the number within the parentheses.
Frac FunctionExampleThe example uses Frac function.
GetRecord (Dest, TableName, RecsBack)
Retrieves one record from a data table.
SyntaxGetRecord (Dest, TableName, RecsBack)
RemarksThe GetRecord instruction retrieves one entire record from a data table. Thedestination array must be dimensioned large enough to hold all the fields in therecord.

Section 8. Processing and Math Instructions
8-12
Parameter& Data Type
Enter
DestArray
The destination variable array in which to store the fields of the record. Thearray must be dimensioned large enough to hold all the fields in the record.
TableNamename
The name of the data table to retrieve the record from.
RecsBackConst. Orvariable
The number of records back from the most recent record stored to go toretrieve the record (1 record back is the most recent).
IfTime
The IfTime instruction is used to return a number indicating True (-1) or False(0) based on the datalogger's real-time clock.
Syntax
IfTime (TintoInt, Interval, Units)
The IfTime function returns True (-1) or False (0) based on the scan clock.Time is kept internally by the datalogger as the elapsed time since January 1,1990, at 00:00:00 hours. The interval is synchronized with this elapsed time(i.e., the interval is true when the Interval divides evenly into this elapsedtime). The time into interval allows an offset to the interval. The IfTimeinstruction can be used to set the value of a variable or it can be used as anexpression for a condition.
The scan clock that the IfTime function checks has the time resolution of thescan interval (i.e., it remains fixed for an entire scan and increments for thenext scan). IfTime must be within a scan to function.
The window of time in which the IfTime instruction is true is 1 of its specifiedUnits. For example, if IfTime specifies 0 into a 10 minute interval, it could betrue when the scan clock specified any time within the first minute of the tenminute interval. With 0 into a 600 second interval, the interval is still 10minutes but it could only be true during the first 1 second of that interval.
IfTime will only return true once per interval. For example, a program with a1 second scan that tests IfTime(0,10, min) -- 0 minutes into a 10 minuteinterval – each scan will execute the instruction 60 times during the minute thatit could be true. It will only return true the first time that it is executed, it willnot return true again until another interval has elapsed.
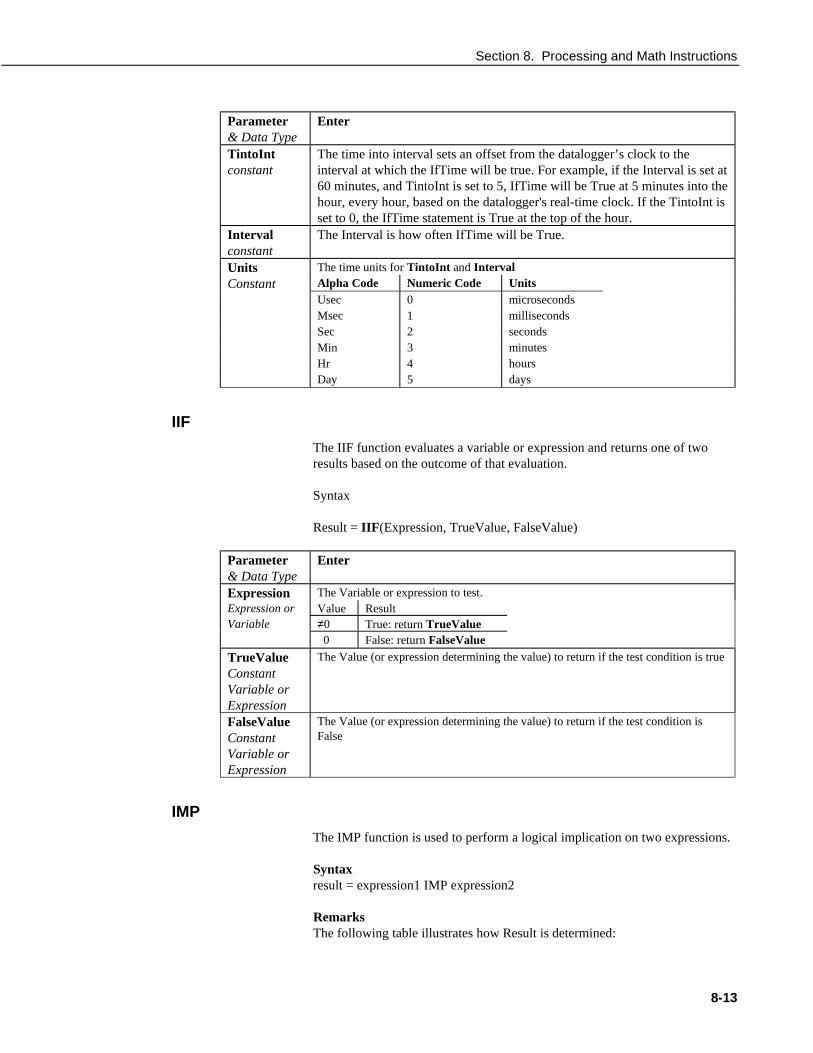
Section 8. Processing and Math Instructions
8-13
Parameter& Data Type
Enter
TintoIntconstant
The time into interval sets an offset from the datalogger’s clock to theinterval at which the IfTime will be true. For example, if the Interval is set at60 minutes, and TintoInt is set to 5, IfTime will be True at 5 minutes into thehour, every hour, based on the datalogger's real-time clock. If the TintoInt isset to 0, the IfTime statement is True at the top of the hour.
Intervalconstant
The Interval is how often IfTime will be True.
Units The time units for TintoInt and IntervalConstant Alpha Code Numeric Code Units
Usec 0 microsecondsMsec 1 millisecondsSec 2 secondsMin 3 minutesHr 4 hoursDay 5 days
IIF
The IIF function evaluates a variable or expression and returns one of tworesults based on the outcome of that evaluation.
Syntax
Result = IIF(Expression, TrueValue, FalseValue)
Parameter& Data Type
Enter
Expression The Variable or expression to test.Expression or Value ResultVariable ≠0 True: return TrueValue
0 False: return FalseValue
TrueValueConstantVariable orExpression
The Value (or expression determining the value) to return if the test condition is true
FalseValueConstantVariable orExpression
The Value (or expression determining the value) to return if the test condition isFalse
IMP
The IMP function is used to perform a logical implication on two expressions.
Syntaxresult = expression1 IMP expression2
RemarksThe following table illustrates how Result is determined:

Section 8. Processing and Math Instructions
8-14
If expression1 is And expression2 is The result is
True True True
True False False
True Null Null
False True True
False False True
False Null True
Null True True
Null False Null
Null Null Null
The IMP operator performs a bitwise comparison of identically positioned bitsin two numeric expressions and sets the corresponding bit in result accordingto the following table:
If bit in expression1 is And bit in expression2 is The result is
0 0 1
0 1 1
1 0 0
1 1 1
Int, FixReturn the integer portion of a number.
SyntaxInt (source)
Fix (source)
RemarksThe source can be any valid numeric expression. Both Int and Fix remove thefractional part of source and return the resulting integer value.
If the numeric expression results in a Not-a-Number, Int and Fix return a Not-a-Number.
The difference between Int and Fix is that if number is negative, Int returnsthe first negative integer less than or equal to number, whereas Fix returns thefirst negative integer greater than or equal to number. For example, Intconverts -8.4 to -9, and Fix converts -8.4 to -8.
Fix(number) is equivalent to:Int and Fix Function Example
This example illustrates the use of Int and Fix.
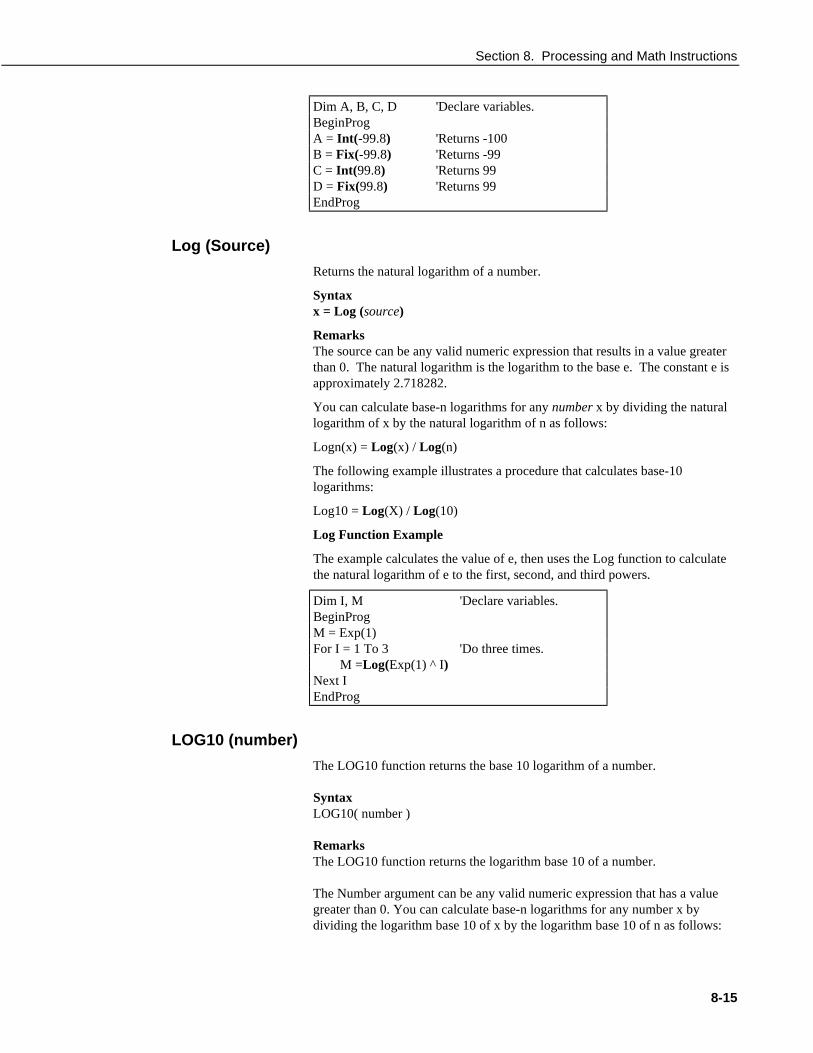
Section 8. Processing and Math Instructions
8-15
Dim A, B, C, D 'Declare variables.BeginProgA = Int(-99.8) 'Returns -100B = Fix(-99.8) 'Returns -99C = Int(99.8) 'Returns 99D = Fix(99.8) 'Returns 99EndProg
Log (Source)
Returns the natural logarithm of a number.
Syntaxx = Log (source)
RemarksThe source can be any valid numeric expression that results in a value greaterthan 0. The natural logarithm is the logarithm to the base e. The constant e isapproximately 2.718282.
You can calculate base-n logarithms for any number x by dividing the naturallogarithm of x by the natural logarithm of n as follows:
Logn(x) = Log(x) / Log(n)
The following example illustrates a procedure that calculates base-10logarithms:
Log10 = Log(X) / Log(10)
Log Function Example
The example calculates the value of e, then uses the Log function to calculatethe natural logarithm of e to the first, second, and third powers.
Dim I, M 'Declare variables.BeginProgM = Exp(1)For I = 1 To 3 'Do three times.
M =Log(Exp(1) ^ I)Next IEndProg
LOG10 (number)
The LOG10 function returns the base 10 logarithm of a number.
SyntaxLOG10( number )
RemarksThe LOG10 function returns the logarithm base 10 of a number.
The Number argument can be any valid numeric expression that has a valuegreater than 0. You can calculate base-n logarithms for any number x bydividing the logarithm base 10 of x by the logarithm base 10 of n as follows:

Section 8. Processing and Math Instructions
8-16
LOGN( x ) = LOG10( x ) / LOG10( n )
LOG10 Function Example
This example uses the LOG10 instruction to calculate the log base 2 of 1000.
Dim LOG2_1000 'Declare variables.LOG2_1000 = LOG10(1000)/ LOG10(2)
MemoryTest (Dest)
Stores the results of the most recent memory test in a variable.
SyntaxMemoryTest (Dest)
RemarksThe CR5000 tests CPU RAM and Task Sequencer memory when it compilesand runs a program. MemoryTest stores the results of this compile test in avariable
Parameter& Data Type
Enter
Dest The variable in which to store the results of the memory testVariable Result Meaning
0 No problems found1 Error in CPU RAM2 Error in Task Memory3 Error in both CPU RAM and Task Memory
MaxSpa (Dest, Swath, Source)
Finds the maximum value in an array.
SyntaxMaxSpa(Dest, Swath, Source)
RemarksFind the maximum value in the given array and place the result in the variablenamed in Dest. The Source must be a particular element in an array (e.g.,Temp(1)); it is the first element in the array
Parameter& Data Type
Enter
DestVariable
The variable in which to store the maximum.
SwathConstant
The number of values of the source array in which to search for themaximum.
SourceArray
The name of the variable array that is the input for the instruction.
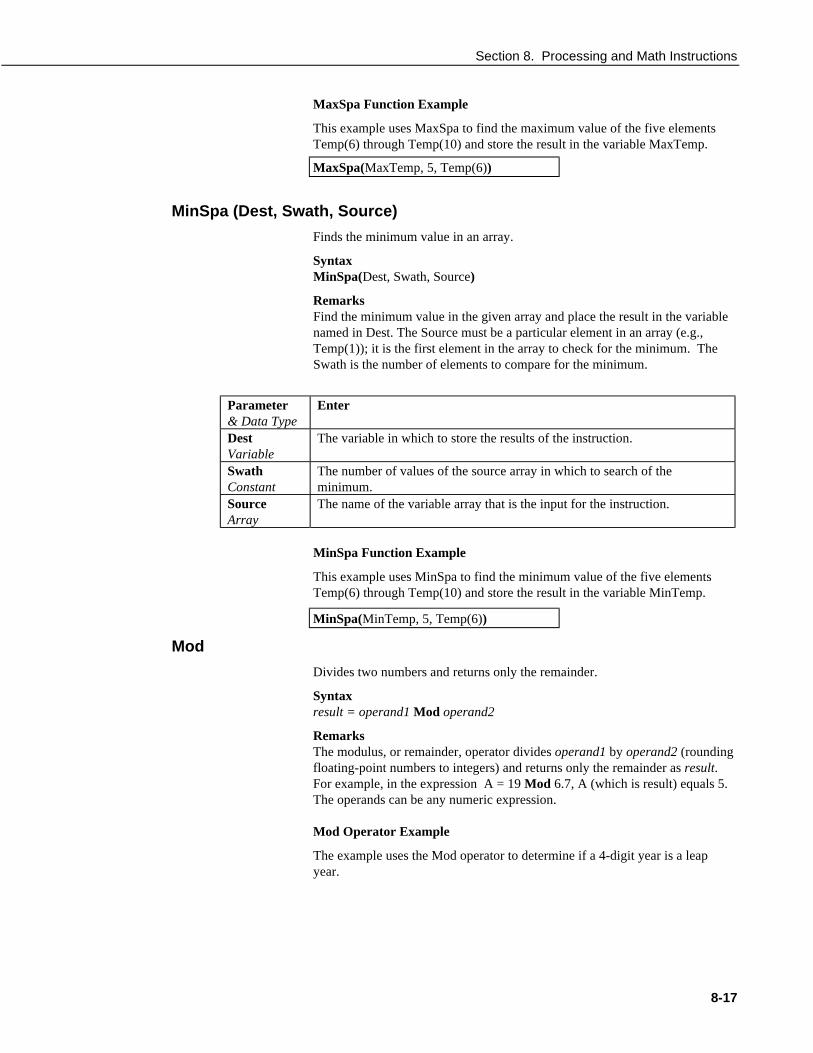
Section 8. Processing and Math Instructions
8-17
MaxSpa Function Example
This example uses MaxSpa to find the maximum value of the five elementsTemp(6) through Temp(10) and store the result in the variable MaxTemp.
MaxSpa(MaxTemp, 5, Temp(6))
MinSpa (Dest, Swath, Source)
Finds the minimum value in an array.
SyntaxMinSpa(Dest, Swath, Source)
RemarksFind the minimum value in the given array and place the result in the variablenamed in Dest. The Source must be a particular element in an array (e.g.,Temp(1)); it is the first element in the array to check for the minimum. TheSwath is the number of elements to compare for the minimum.
Parameter& Data Type
Enter
DestVariable
The variable in which to store the results of the instruction.
SwathConstant
The number of values of the source array in which to search of theminimum.
SourceArray
The name of the variable array that is the input for the instruction.
MinSpa Function Example
This example uses MinSpa to find the minimum value of the five elementsTemp(6) through Temp(10) and store the result in the variable MinTemp.
MinSpa(MinTemp, 5, Temp(6))
Mod
Divides two numbers and returns only the remainder.
Syntaxresult = operand1 Mod operand2
RemarksThe modulus, or remainder, operator divides operand1 by operand2 (roundingfloating-point numbers to integers) and returns only the remainder as result.For example, in the expression A = 19 Mod 6.7, A (which is result) equals 5.The operands can be any numeric expression.
Mod Operator Example
The example uses the Mod operator to determine if a 4-digit year is a leapyear.
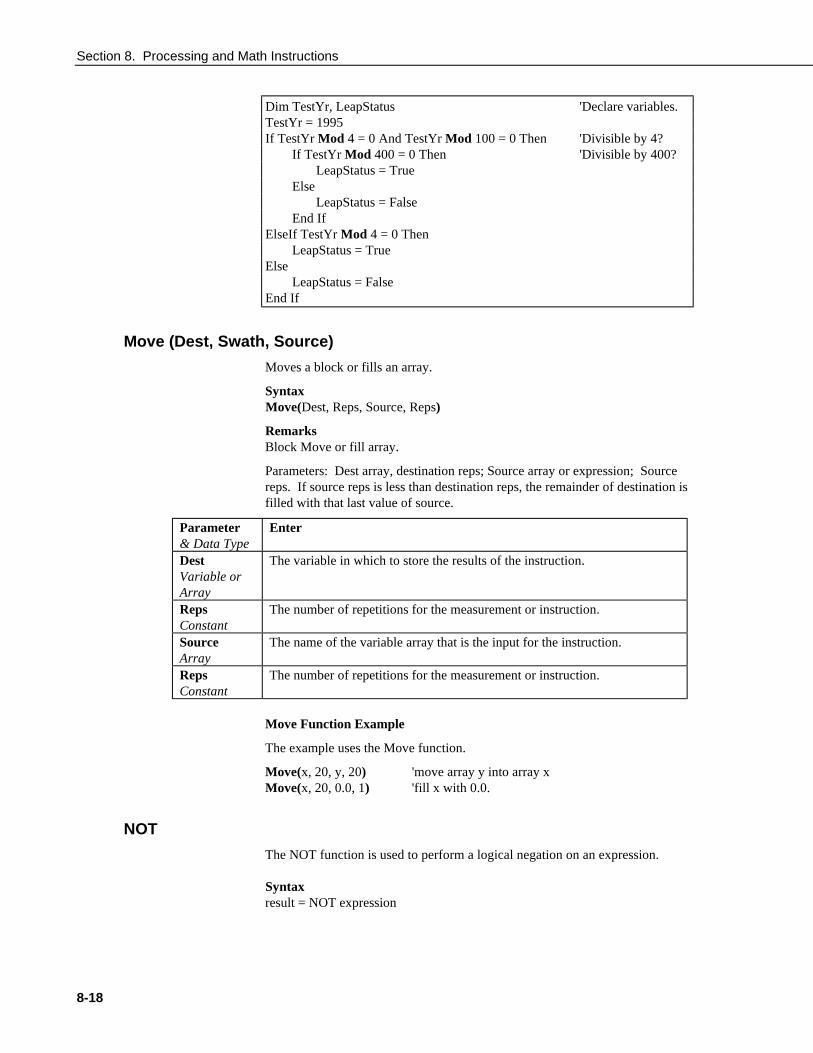
Section 8. Processing and Math Instructions
8-18
Dim TestYr, LeapStatus 'Declare variables.TestYr = 1995If TestYr Mod 4 = 0 And TestYr Mod 100 = 0 Then 'Divisible by 4?
If TestYr Mod 400 = 0 Then 'Divisible by 400?LeapStatus = True
ElseLeapStatus = False
End IfElseIf TestYr Mod 4 = 0 Then
LeapStatus = TrueElse
LeapStatus = FalseEnd If
Move (Dest, Swath, Source)
Moves a block or fills an array.
SyntaxMove(Dest, Reps, Source, Reps)
RemarksBlock Move or fill array.
Parameters: Dest array, destination reps; Source array or expression; Sourcereps. If source reps is less than destination reps, the remainder of destination isfilled with that last value of source.
Parameter& Data Type
Enter
DestVariable orArray
The variable in which to store the results of the instruction.
RepsConstant
The number of repetitions for the measurement or instruction.
SourceArray
The name of the variable array that is the input for the instruction.
RepsConstant
The number of repetitions for the measurement or instruction.
Move Function Example
The example uses the Move function.
Move(x, 20, y, 20) 'move array y into array xMove(x, 20, 0.0, 1) 'fill x with 0.0.
NOT
The NOT function is used to perform a logical negation on an expression.
Syntaxresult = NOT expression
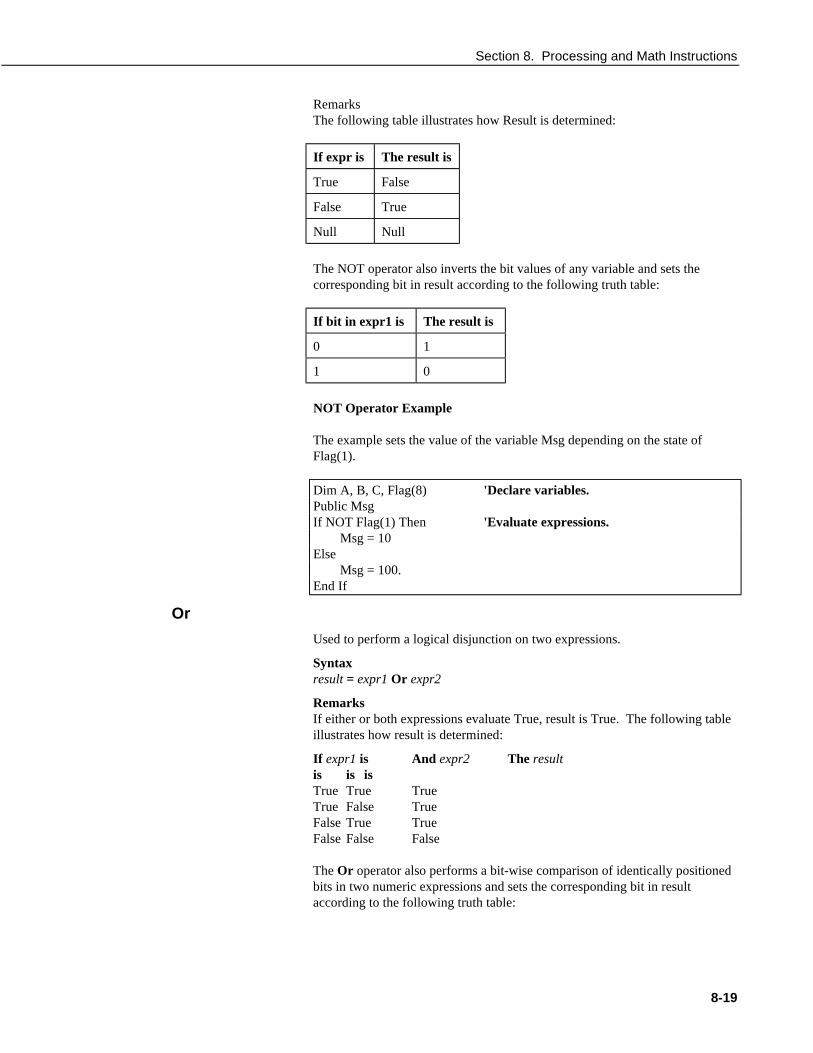
Section 8. Processing and Math Instructions
8-19
RemarksThe following table illustrates how Result is determined:
If expr is The result is
True False
False True
Null Null
The NOT operator also inverts the bit values of any variable and sets thecorresponding bit in result according to the following truth table:
If bit in expr1 is The result is
0 1
1 0
NOT Operator Example
The example sets the value of the variable Msg depending on the state ofFlag(1).
Dim A, B, C, Flag(8) 'Declare variables.Public MsgIf NOT Flag(1) Then 'Evaluate expressions.
Msg = 10Else
Msg = 100.End If
Or
Used to perform a logical disjunction on two expressions.
Syntaxresult = expr1 Or expr2
RemarksIf either or both expressions evaluate True, result is True. The following tableillustrates how result is determined:
If expr1 is And expr2 The resultis is isTrue True TrueTrue False TrueFalse True TrueFalse False False
The Or operator also performs a bit-wise comparison of identically positionedbits in two numeric expressions and sets the corresponding bit in resultaccording to the following truth table:
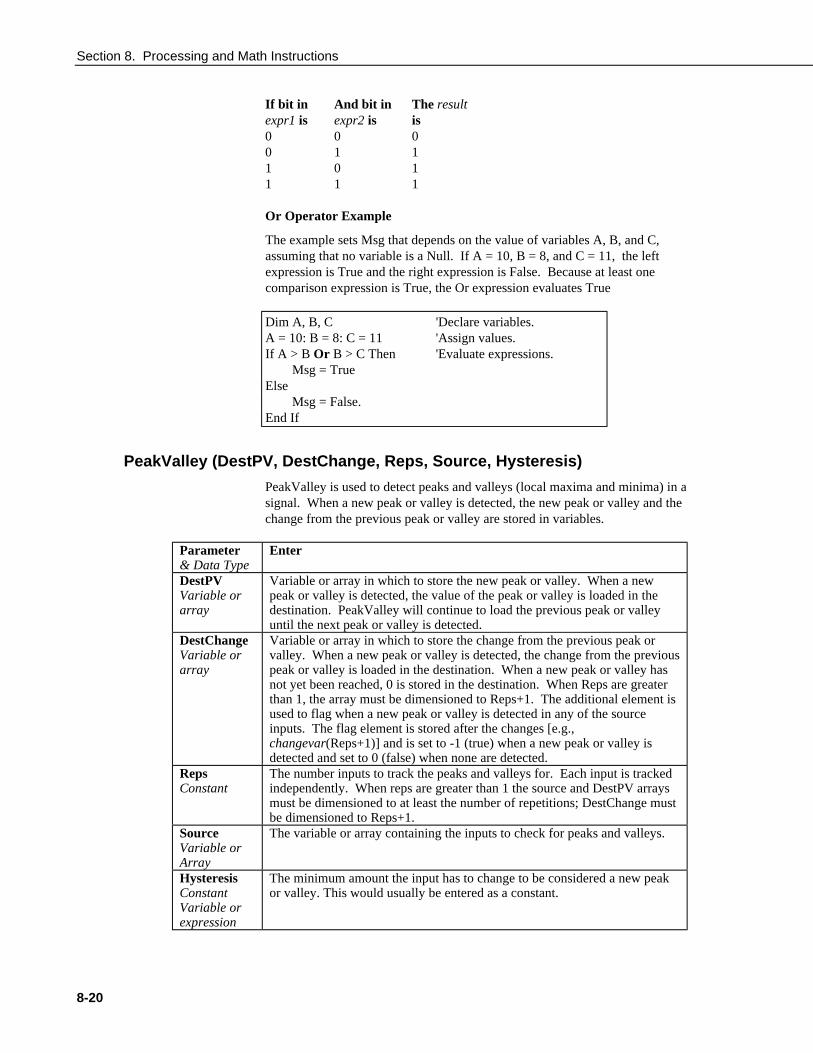
Section 8. Processing and Math Instructions
8-20
If bit in And bit in The resultexpr1 is expr2 is is0 0 00 1 11 0 11 1 1
Or Operator Example
The example sets Msg that depends on the value of variables A, B, and C,assuming that no variable is a Null. If A = 10, B = 8, and C = 11, the leftexpression is True and the right expression is False. Because at least onecomparison expression is True, the Or expression evaluates True
Dim A, B, C 'Declare variables.A = 10: B = 8: C = 11 'Assign values.If A > B Or B > C Then 'Evaluate expressions.
Msg = TrueElse
Msg = False.End If
PeakValley (DestPV, DestChange, Reps, Source, Hysteresis)
PeakValley is used to detect peaks and valleys (local maxima and minima) in asignal. When a new peak or valley is detected, the new peak or valley and thechange from the previous peak or valley are stored in variables.
Parameter& Data Type
Enter
DestPVVariable orarray
Variable or array in which to store the new peak or valley. When a newpeak or valley is detected, the value of the peak or valley is loaded in thedestination. PeakValley will continue to load the previous peak or valleyuntil the next peak or valley is detected.
DestChangeVariable orarray
Variable or array in which to store the change from the previous peak orvalley. When a new peak or valley is detected, the change from the previouspeak or valley is loaded in the destination. When a new peak or valley hasnot yet been reached, 0 is stored in the destination. When Reps are greaterthan 1, the array must be dimensioned to Reps+1. The additional element isused to flag when a new peak or valley is detected in any of the sourceinputs. The flag element is stored after the changes [e.g.,changevar(Reps+1)] and is set to -1 (true) when a new peak or valley isdetected and set to 0 (false) when none are detected.
RepsConstant
The number inputs to track the peaks and valleys for. Each input is trackedindependently. When reps are greater than 1 the source and DestPV arraysmust be dimensioned to at least the number of repetitions; DestChange mustbe dimensioned to Reps+1.
SourceVariable orArray
The variable or array containing the inputs to check for peaks and valleys.
HysteresisConstantVariable orexpression
The minimum amount the input has to change to be considered a new peakor valley. This would usually be entered as a constant.
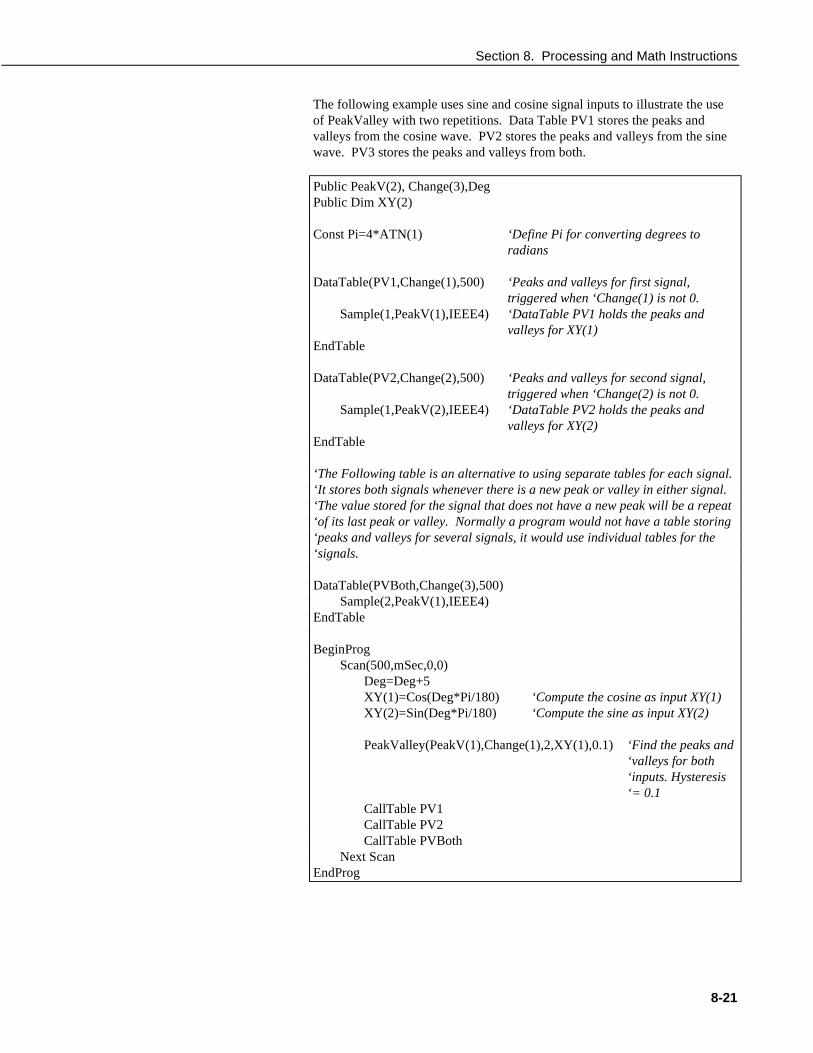
Section 8. Processing and Math Instructions
8-21
The following example uses sine and cosine signal inputs to illustrate the useof PeakValley with two repetitions. Data Table PV1 stores the peaks andvalleys from the cosine wave. PV2 stores the peaks and valleys from the sinewave. PV3 stores the peaks and valleys from both.
Public PeakV(2), Change(3),DegPublic Dim XY(2)
Const Pi=4*ATN(1) ‘Define Pi for converting degrees toradians
DataTable(PV1,Change(1),500) ‘Peaks and valleys for first signal,triggered when ‘Change(1) is not 0.
Sample(1,PeakV(1),IEEE4) ‘DataTable PV1 holds the peaks andvalleys for XY(1)
EndTable
DataTable(PV2,Change(2),500) ‘Peaks and valleys for second signal,triggered when ‘Change(2) is not 0.
Sample(1,PeakV(2),IEEE4) ‘DataTable PV2 holds the peaks andvalleys for XY(2)
EndTable
‘The Following table is an alternative to using separate tables for each signal.‘It stores both signals whenever there is a new peak or valley in either signal.‘The value stored for the signal that does not have a new peak will be a repeat‘of its last peak or valley. Normally a program would not have a table storing‘peaks and valleys for several signals, it would use individual tables for the‘signals.
DataTable(PVBoth,Change(3),500)Sample(2,PeakV(1),IEEE4)
EndTable
BeginProgScan(500,mSec,0,0)
Deg=Deg+5XY(1)=Cos(Deg*Pi/180) ‘Compute the cosine as input XY(1)XY(2)=Sin(Deg*Pi/180) ‘Compute the sine as input XY(2)
PeakValley(PeakV(1),Change(1),2,XY(1),0.1) ‘Find the peaks and‘valleys for both‘inputs. Hysteresis‘= 0.1
CallTable PV1CallTable PV2CallTable PVBoth
Next ScanEndProg

Section 8. Processing and Math Instructions
8-22
PRT (Dest, Reps, Source, Mult, Offset)
Used to calculate temperature from the resistance of an RTD.
SyntaxPRT (Dest, Reps, Source, Mult, Offset)
RemarksThis instruction uses the result of a previous RTD bridge measurement tocalculate the temperature. The input (Source) must be the ratio Rs/R0, whereRs is the RTD resistance and R0 the resistance of the RTD at 0° C.
The temperature is calculated according to the DIN 43760 specificationadjusted (1980) to the International Electrotechnical Commission standard.The range of linearization is -200° C to 850° C. The error in the linearization isless than 0.001° C between -200 and +300° C, and is less than 0.003° Cbetween -180 and +830° C. The error (T calculated - T standard) is +0.006° at-200° C and -0.006° at +850° C.
Parameter& Data Type
Enter
DestVariable orArray
The variable in which to store the temperature in degrees C.
RepsConstant
The number of repetitions for the measurement or instruction.
SourceVariable orArray
The name of the variable or array that contains the Rs/RO value(s).
Mult, OffsetConstant,Variable,Array, orExpression
A multiplier and offset by which to scale the raw results of themeasurement. See the measurement description for the units of the rawresult; a multiplier of one and an offset of 0 are necessary to output in theraw units. For example, the TCDiff instruction measures a thermocoupleand outputs temperature in degrees C. A multiplier of 1.8 and an offset of32 will convert the temperature to degrees F.
Randomize (Source)
Initializes the random-number generator.
SyntaxRandomize (source)
RemarksThe argument number can be any valid numeric expression. Number is used toinitialize the random-number generator by giving it a new seed value. If youomit number, the value returned by the Timer function is used as the new seedvalue.
If Randomize is not used, the Rnd function returns the same sequence ofrandom numbers every time the program is run. To have the sequence ofrandom numbers change each time the program is run, place a Randomizestatement with no argument at the beginning of the program.

Section 8. Processing and Math Instructions
8-23
RealTime
Used to pick out year, month, day, hour, minute, second, usecond, day ofweek, and/or day of year from the CR5000 clock.
SyntaxRealTime(Dest)
RemarksRealTime Example
This example uses RealTime to place all time segments in the Destination array. Ifthe remark (‘) is removed from the first 8 Sample statements and the last Samplestatement is remarked, the results will be exactly the same.
Public rTime(9) 'declare as public and dimension rTime to 9Alias rTime(1) = Year 'assign the alias Year to rTime(1)Alias rTime(2) = Month 'assign the alias Month to rTime(2)Alias rTime(3) = Day 'assign the alias Day to rTime(3)Alias rTime(4) = Hour 'assign the alias Hour to rTime(4)Alias rTime(5) = Minute 'assign the alias Minute to rTime(5)Alias rTime(6) = Second 'assign the alias Second to rTime(6)Alias rTime(7) = uSecond 'assign the alias uSecond to rTime(7)Alias rTime(8) = WeekDay 'assign the alias WeekDay to rTime(8)Alias rTime(9) = Day_of_Year 'assign the alias Day_of_Year to rTime(9)
DataTable (VALUES, 1, 100) 'set up data tableDataInterval(0, 1, mSec, 0) 'set up data table' Sample(1, Year, IEEE4) 'place Year in VALUES table' Sample(1, Month, IEEE4) 'place Month in VALUES table' Sample(1, Day, IEEE4) 'place Day in VALUES table' Sample(1, Hour, IEEE4) 'place Hour in VALUES table' Sample(1, Minute, IEEE4) 'place Minute in VALUES table' Sample(1, Second, IEEE4) 'place Second in VALUES table' Sample(1, uSecond, IEEE4) 'place uSecond in VALUES table' Sample(1, WeekDay, IEEE4) 'place WeekDay in VALUES table' Sample(1, Day_of_Year, IEEE4) 'place Day_of_Year in VALUES table Sample(9, rTime(), IEEE4) 'place all 9 segments in VALUES tableEndTable
BeginProg Scan (1, mSec, 0, 0) RealTime(rTime()) CallTable VALUES Next ScanEndProg

Section 8. Processing and Math Instructions
8-24
RectPolar (Dest, Source)
Converts from rectangular to polar coordinates.
Parameter& Data Type
Enter
DestVariablearray
Variable array in which to store the 2 resultant values. The length of thevector is stored in the specified destination element and the angle, inradians(± π), in the next element of the array
SourceVariableArray
The variable array containing the X and Y coordinates to convert to Polarcoordinates. The X value must be in the specified array element and the Yvalue in the next element of the array.
Example: In the following example, a counter (Deg) is incremented from 0 to360 degrees. The cosine and sine of the angle are taken to get X and Y inrectangular coordinates. RectPolar is then used to convert to polar coordinates.
Dim XY(2),Polar(2),Deg,AnglDegConst Pi=4*ATN(1)
Alias XY(1)=XAlias XY(2)=YAlias Polar(1)=LengthAlias Polar(2)=AnglRad
DataTable(RtoP,1,500)Sample(1,Deg,IEEE4)Sample(2,XY,IEEE4)Sample(2,Polar,IEEE4)Sample(1,AnglDeg,IEEE4)EndTable
BeginProgFor Deg=0 to 360
XY(1)=Cos(Deg*Pi/180) ‘Cos and Sin operate on radiansXY(2)=Sin(Deg*Pi/180)RectPolar(Polar,XY)AnglDeg=Polar(2)*180/Pi ‘Convert angle to degrees for
comparison w/DegCallTable RtoP
Next DegEndProg
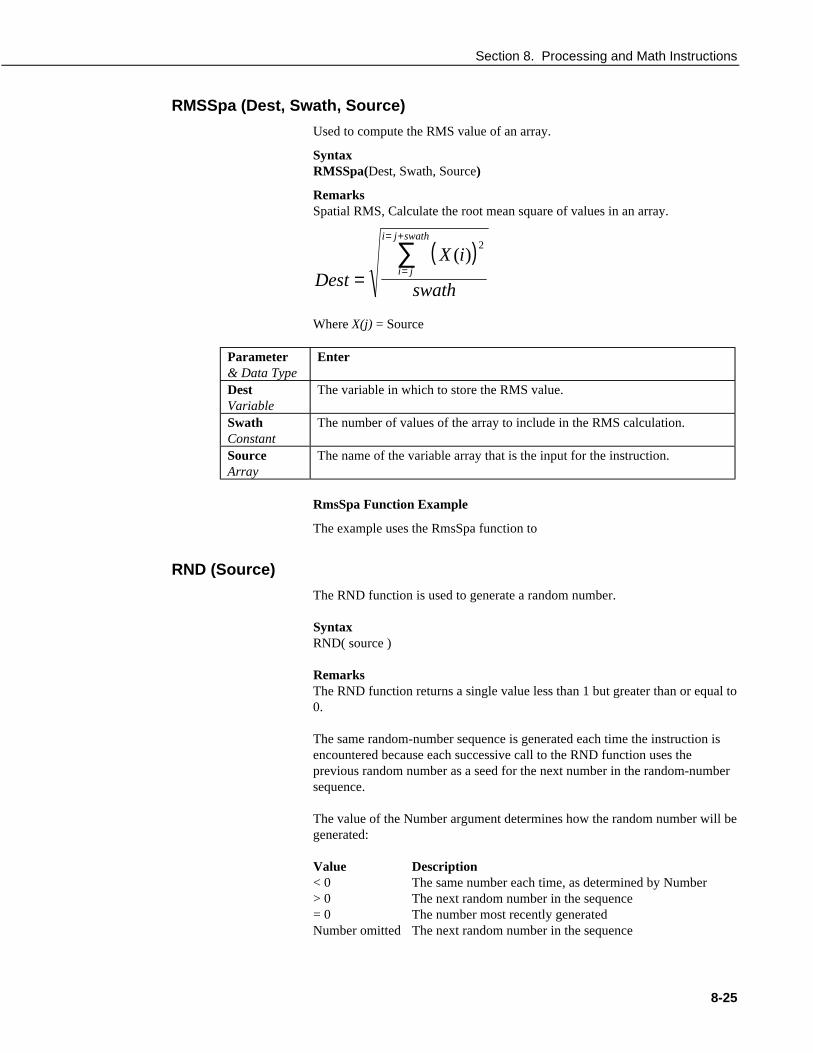
Section 8. Processing and Math Instructions
8-25
RMSSpa (Dest, Swath, Source)
Used to compute the RMS value of an array.
SyntaxRMSSpa(Dest, Swath, Source)
RemarksSpatial RMS, Calculate the root mean square of values in an array.
( )Dest
X i
swathi j
i j swath
= =
= +
∑ ( ) 2
Where X(j) = Source
Parameter& Data Type
Enter
DestVariable
The variable in which to store the RMS value.
SwathConstant
The number of values of the array to include in the RMS calculation.
SourceArray
The name of the variable array that is the input for the instruction.
RmsSpa Function Example
The example uses the RmsSpa function to
RND (Source)
The RND function is used to generate a random number.
SyntaxRND( source )
RemarksThe RND function returns a single value less than 1 but greater than or equal to0.
The same random-number sequence is generated each time the instruction isencountered because each successive call to the RND function uses theprevious random number as a seed for the next number in the random-numbersequence.
The value of the Number argument determines how the random number will begenerated:
Value Description< 0 The same number each time, as determined by Number> 0 The next random number in the sequence= 0 The number most recently generatedNumber omitted The next random number in the sequence

Section 8. Processing and Math Instructions
8-26
To have the program generate a different random-number sequence each timeit is run, use the Randomize statement with no Number argument to initializethe random-number generator before RND is called.
To produce random integers in a given range, use this formula:
INT( ( upperbound - lowerbound + 1 ) * RND + lowerbound )
Here, upperbound is the highest number in the range, and lowerbound is thelowest number in the range.
StrainCalc (Dest, Reps, Source, BrZero, BrConfig, GF, v)
Converts the output of a bridge measurement instruction to microstrain.
SyntaxStrainCalc (Dest, Reps, Source, BrZero, BrConfig, GF, v)
RemarksCalculates microstrain, µ∈ , from the appropriate formula for the bridgeconfiguration. All are electrically full bridges , the quarter bridge, half bridgeand full bridge strain gages refer to the number of active elements (i.e., straingages), 1,2, or 4 respectively.
Parameter& Data Type
Enter
Dest Variable to store strain in.Reps Number of strains to calculate, Destination, source, and zero variables must
be dimensioned accordingly.BrConfig Bridge configuration code for strain gages The bridge configuration code
can be entered as a positive or negative number:+ code: Vr = −0 001. ( )Source Zero ; bridge configured so its outputdecreases with increasing strain.- code: Vr = − −0 001. ( )Source Zero ; bridge configured so outputincreases with strain. This is the configuration for a quarter bridge usingCSI’s 4WFB350 Terminal Input Module (i.e., enter the bridge configurationcode as -1 for 1/4 bridge with TIM.)Code Configuration1
Quarter bridge strain gaugeµε =− ⋅
+
4 10
1 2
6 V
GF Vr
r( )2 Half bridge strain gauge, one gage parallel to strain, the other at 90°
to strain:
µεν ν
=− ⋅
+ − −
4 10
1 2 1
6 V
GF Vr
r[( ) ( )]3 Half bridge strain gauge, one gage parallel to +ε, the other parallel
to −ε:
µε =− ⋅2 106 V
GFr
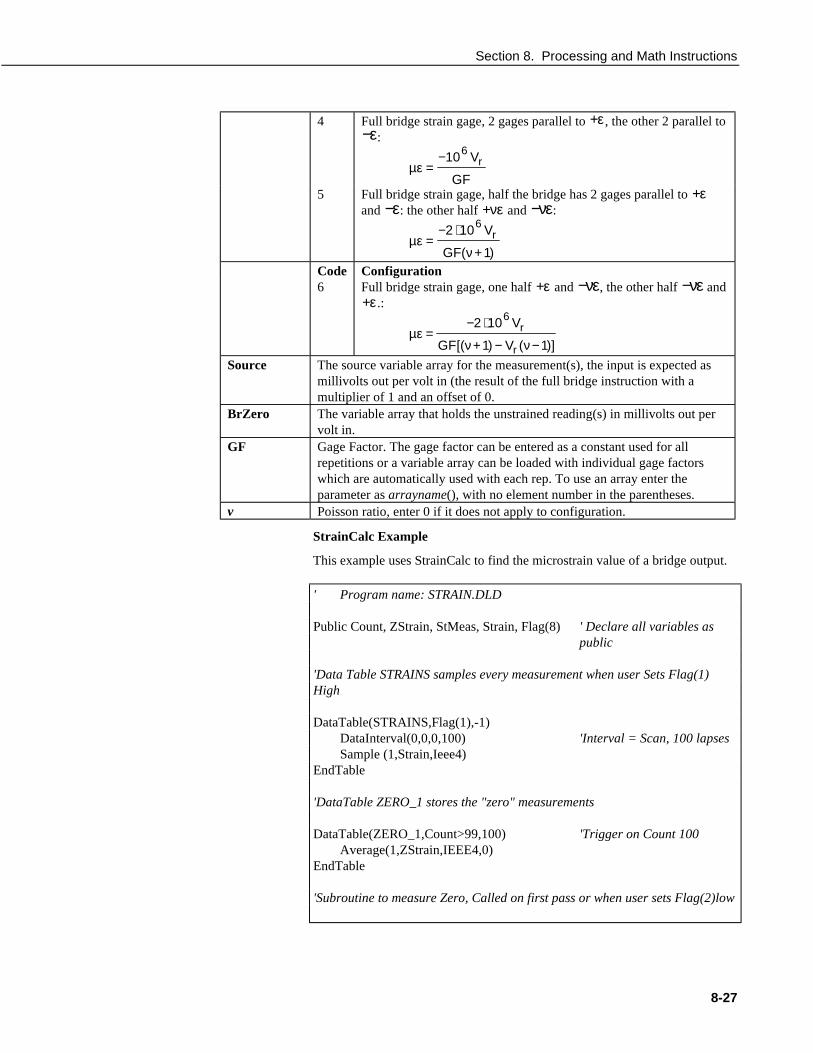
Section 8. Processing and Math Instructions
8-27
4 Full bridge strain gage, 2 gages parallel to +ε, the other 2 parallel to−ε:
µε =−106 V
GFr
5 Full bridge strain gage, half the bridge has 2 gages parallel to +εand −ε: the other half +νε and −νε:
µεν
=− ⋅
+
2 10
1
6 V
GFr
( )Code Configuration6 Full bridge strain gage, one half +ε and −νε, the other half −νε and
+ε.:
µεν ν
=− ⋅
+ − −
2 10
1 1
6 V
GF Vr
r[( ) ( )]Source The source variable array for the measurement(s), the input is expected as
millivolts out per volt in (the result of the full bridge instruction with amultiplier of 1 and an offset of 0.
BrZero The variable array that holds the unstrained reading(s) in millivolts out pervolt in.
GF Gage Factor. The gage factor can be entered as a constant used for allrepetitions or a variable array can be loaded with individual gage factorswhich are automatically used with each rep. To use an array enter theparameter as arrayname(), with no element number in the parentheses.
v Poisson ratio, enter 0 if it does not apply to configuration.
StrainCalc Example
This example uses StrainCalc to find the microstrain value of a bridge output.
' Program name: STRAIN.DLD
Public Count, ZStrain, StMeas, Strain, Flag(8) ' Declare all variables aspublic
'Data Table STRAINS samples every measurement when user Sets Flag(1)High
DataTable(STRAINS,Flag(1),-1)DataInterval(0,0,0,100) 'Interval = Scan, 100 lapsesSample (1,Strain,Ieee4)
EndTable
'DataTable ZERO_1 stores the "zero" measurements
DataTable(ZERO_1,Count>99,100) 'Trigger on Count 100Average(1,ZStrain,IEEE4,0)
EndTable
'Subroutine to measure Zero, Called on first pass or when user sets Flag(2)low
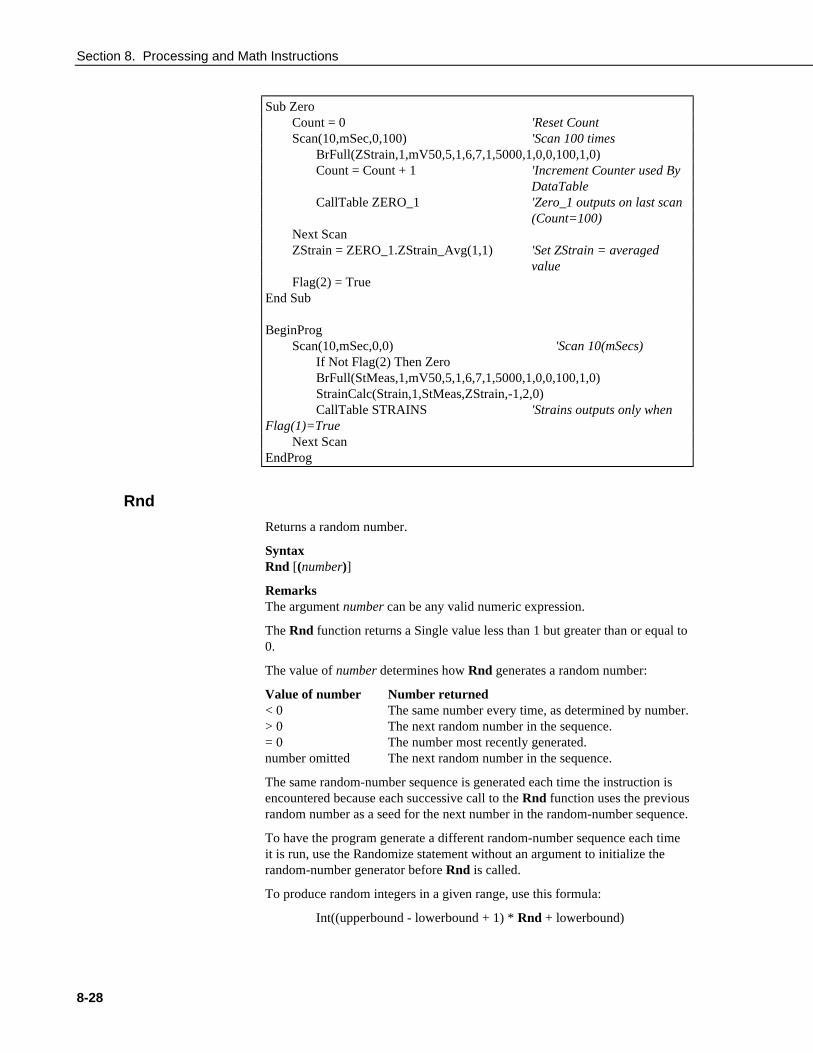
Section 8. Processing and Math Instructions
8-28
Sub ZeroCount = 0 'Reset CountScan(10,mSec,0,100) 'Scan 100 times
BrFull(ZStrain,1,mV50,5,1,6,7,1,5000,1,0,0,100,1,0)Count = Count + 1 'Increment Counter used By
DataTableCallTable ZERO_1 'Zero_1 outputs on last scan
(Count=100)Next ScanZStrain = ZERO_1.ZStrain_Avg(1,1) 'Set ZStrain = averaged
valueFlag(2) = True
End Sub
BeginProgScan(10,mSec,0,0) 'Scan 10(mSecs)
If Not Flag(2) Then ZeroBrFull(StMeas,1,mV50,5,1,6,7,1,5000,1,0,0,100,1,0)StrainCalc(Strain,1,StMeas,ZStrain,-1,2,0)CallTable STRAINS 'Strains outputs only when
Flag(1)=TrueNext Scan
EndProg
Rnd
Returns a random number.
SyntaxRnd [(number)]
RemarksThe argument number can be any valid numeric expression.
The Rnd function returns a Single value less than 1 but greater than or equal to0.
The value of number determines how Rnd generates a random number:
Value of number Number returned< 0 The same number every time, as determined by number.> 0 The next random number in the sequence.= 0 The number most recently generated.number omitted The next random number in the sequence.
The same random-number sequence is generated each time the instruction isencountered because each successive call to the Rnd function uses the previousrandom number as a seed for the next number in the random-number sequence.
To have the program generate a different random-number sequence each timeit is run, use the Randomize statement without an argument to initialize therandom-number generator before Rnd is called.
To produce random integers in a given range, use this formula:
Int((upperbound - lowerbound + 1) * Rnd + lowerbound)

Section 8. Processing and Math Instructions
8-29
Here, upperbound is the highest number in the range, and lowerbound is thelowest number in the range.
Rnd Function ExampleThe example uses the Rnd function to generate random integer values from 1to 9. Each time this program is run, Randomize generates a new random-number sequence.
Dim Wild1, Wild2 'Declare variables.Randomize 'Seed random number generator.Wild1 = Int(9 * Rnd + 1) 'Generate first random value.Wild2 = Int(9 * Rnd + 1) 'Generate second random value.
Sgn (Source)
Used to find the sign value of a number.
Syntaxx = Sgn (source)
RemarksReturns an integer indicating the sign of a number.
The argument number can be any valid numeric expression. Its signdetermines the value returned by the Sgn function:
If X > 0, then Sgn(X) = 1.
If X = 0, then Sgn(X) = 0.
If X < 0, then Sgn(X) = -1.
Sgn Function Example
The example uses Sgn to determine the sign of a number.
Dim Msg, Number 'Declare variables.Number = Volt(1) 'Get user input.Select Case Sgn(Number) 'Evaluate Number.
Case 0 'Zero.Msg = 0
Case 1 'Positive.Msg = 1
Case -1 'Negative.Msg = -1
End Select
Sin (Source)
Returns the sine of an angle.
Syntaxx = Sin (source)
RemarksSource can be any valid numeric expression measured in radians.
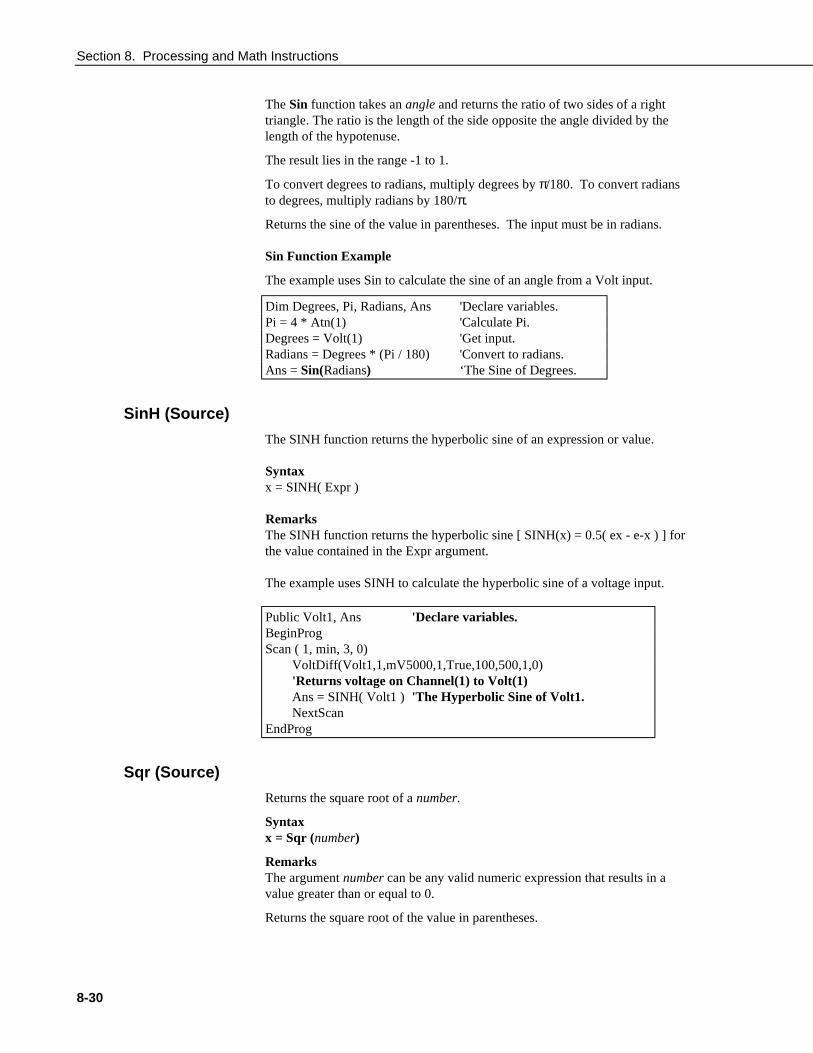
Section 8. Processing and Math Instructions
8-30
The Sin function takes an angle and returns the ratio of two sides of a righttriangle. The ratio is the length of the side opposite the angle divided by thelength of the hypotenuse.
The result lies in the range -1 to 1.
To convert degrees to radians, multiply degrees by π/180. To convert radiansto degrees, multiply radians by 180/π.
Returns the sine of the value in parentheses. The input must be in radians.
Sin Function Example
The example uses Sin to calculate the sine of an angle from a Volt input.
Dim Degrees, Pi, Radians, Ans 'Declare variables.Pi = 4 * Atn(1) 'Calculate Pi.Degrees = Volt(1) 'Get input.Radians = Degrees * (Pi / 180) 'Convert to radians.Ans = Sin(Radians) ‘The Sine of Degrees.
SinH (Source)
The SINH function returns the hyperbolic sine of an expression or value.
Syntaxx = SINH( Expr )
RemarksThe SINH function returns the hyperbolic sine [ SINH(x) = 0.5( ex - e-x ) ] forthe value contained in the Expr argument.
The example uses SINH to calculate the hyperbolic sine of a voltage input.
Public Volt1, Ans 'Declare variables.BeginProgScan ( 1, min, 3, 0)
VoltDiff(Volt1,1,mV5000,1,True,100,500,1,0)'Returns voltage on Channel(1) to Volt(1)Ans = SINH( Volt1 ) 'The Hyperbolic Sine of Volt1.NextScan
EndProg
Sqr (Source)
Returns the square root of a number.
Syntaxx = Sqr (number)
RemarksThe argument number can be any valid numeric expression that results in avalue greater than or equal to 0.
Returns the square root of the value in parentheses.

Section 8. Processing and Math Instructions
8-31
Sqr Function Example
The example uses Sqr to calculate the square root of Volt(1) value.
Dim Msg, Number 'Declare variables.Number = Volt(1) 'Get input.If Number < 0 ThenMsg = 0 ‘Cannot determine the square root of a
negative number.ElseMsg = Sqr(Number)End If
StdDevSpa
Used to find the standard deviation of an array.
SyntaxStdDevSpa(Dest, Swath, Source)
RemarksSpatial standard deviation.
Dest X i X i swath swathi j
i j swath
i j
i j swath
= −
=
= +
=
= +
∑∑ ( ) ( ) / /2
212
Where X(j) = Source
Parameter& Data Type
Enter
DestVariable orArray
The variable in which to store the results of the instruction.
SwathConstant
The number of values of the array over which to perform the specifiedoperation.
SourceArray
The name of the variable array that is the input for the instruction.
Tan (Source)
Returns the tangent of an angle.
Syntaxx = Tan (source)
RemarksSource can be any valid numeric expression measured in radians.
Tan takes an angle and returns the ratio of two sides of a right triangle. Theratio is the length of the side opposite an angle divided by the length of the sideadjacent to the angle.
To convert degrees to radians, multiply degrees by π/180. To convert radiansto degrees, multiply radians by 180/π.

Section 8. Processing and Math Instructions
8-32
Tan Function Example
The example uses Tan to calculate the tangent of an angle from a Volt(1) input.
Dim Degrees, Pi, Radians, Ans 'Declare variables.Pi = 4 * Atn(1) 'Calculate Pi.Degrees = Volt(1) 'Get user input.Radians = Degrees * (Pi / 180) 'Convert to radians.Ans = Tan(Radians) ‘The Tangent of Degrees.
TANH (Source)
The TANH function returns the hyperbolic tangent of an expression or value.
Syntaxx = TANH (Source)
RemarksThe TANH function returns the hyperbolic tangent [ tanh(x) = sinh(x)/cosh(h) ]for the value defined in Source.
TANH Function Example
The example uses TANH to calculate the hyperbolic tangent of a voltage input.
Public Volt1, Ans 'Declare variables.VoltDiff(Volt1,1,mV5000,1,True,100,500,1,0)'Returns voltage on Channel(1) to Volt(1)Ans = TANH( Volt1 ) 'The Hyperbolic Tangent of Volt1.
XOR
The XOR function is used to perform a logical exclusion on two expressions.
Syntaxresult = expr1 XOR expr2
RemarksIf only one of the expressions evaluates True, result is True. If eitherexpression is a Null, result is also a Null. When neither expression is a Null,result is determined according to the following table:
If expr1 is And expr2 is The result is
True True False
True False True
False True True
False False False

Section 8. Processing and Math Instructions
8-33
The XOR operator also performs a bit-wise comparison of identicallypositioned bits in two numeric expressions and sets the corresponding bit inresult according to the following truth table:
If bit in expr1 is And bit in expr2 is The result is
0 0 0
0 1 1
1 0 1
1 1 0
XOR Operator Example
The example sets the variable Msg based on the value of variables A, B, and C,assuming that no variable is a Null. If A = 10, B = 8, and C = 11, the leftexpression is True and the right expression is False. Because only onecomparison expression is True, the XOR expression evaluates True.
Dim A, B, C 'Declare variables.A = 10: B = 8: C = 11 'Assign values.If A > B XOR B > C Then 'Evaluate expressions.
Msg = TrueElse
Msg = False.End If
Derived Math Functions
The following is a list of nonintrinsic mathematical functions that can bederived from the intrinsic math functions provided with CRBasic:
Function CRBasic equivalentSecant Sec = 1 / Cos(X)Cosecant Cosec = 1 / Sin(X)Cotangent Cotan = 1 / Tan(X)Inverse Secant Arcsec = Atn(X / Sqr(X * X - 1)) + Sgn(Sgn(X) -1) *1.5708Inverse Cosecant Arccosec = Atn(X/Sqr(X * X - 1)) + (Sgn(X) - 1) * 1.5708Inverse Cotangent Arccotan = Atn(X) + 1.5708
Hyperbolic Secant HSec = 2 / (Exp(X) + Exp(-X))Hyperbolic Cosecant HCosec = 2 / (Exp(X) - Exp(-X))Hyperbolic Cotangent HCotan = (Exp(X) + Exp(-X)) / (Exp(X) - Exp(-X))Inverse Hyperbolic Sine HArcsin = Log(X + Sqr(X * X + 1))Inverse Hyperbolic Cosine HArccos = Log(X + Sqr(X * X - 1))Inverse Hyperbolic Tangent HArctan = Log((1 + X) / (1 - X)) / 2Inverse Hyperbolic Secant HArcsec = Log((Sqr(-X * X + 1) + 1) / X)Inverse Hyperbolic Cosecant HArccosec = Log((Sgn(X) * Sqr(X * X + 1) +1) / X)Inverse Hyperbolic Cotangent HArccotan = Log((X + 1) / (X - 1)) / 2Logarithm LogN = Log(X) / Log(N)


9-1
Section 9. Program ControlInstructions
BeginProg, EndProg
The BeginProg instruction is used to mark the beginning of a program.EndProg marks the end of a program.
SyntaxBeginProg ... ...EndProg
RemarksAll of the instructions for the main program fall between the BeginProg andEndProg statements. Program Variables, DataTables, and Subroutines must bedefined before the main program. The BeginProg/EndProg statements are notnecessary if there are no subroutines or DataTables.
BeginProg ExampleThe following code shows the layout of a typical datalogger program and theuse of the BeginProg/EndProg statements. Program variables and theDataTable are defined, followed by the code for the main program.
'Define Variables for WindSpeed and Rain'Dimension the RealTime arrayPUBLIC WINDSPPUBLIC RAINDIM TIME(9)ALIAS TIME(1)=YEARALIAS TIME(2)=MONTHALIAS TIME(3)=DAYALIAS TIME(4)=HOURALIAS TIME(5)=MINUTESALIAS TIME(6)=SECONDSALIAS TIME(7)=mSECONDSALIAS TIME(8)=DAY_OF_WEEKALIAS TIME(9)=DAY_OF_YEAR
'Define the DataTable, METDATADataTable (METDATA,1,1000)
DataInterval (0,1,Min,10)Sample (1,WINDSP,FP2)Totalize (1,RAIN,FP2,False )
EndTable
'Main program - Read datalogger real-time clock'Measure 2 pulse count channels and Call DataTableBeginProg
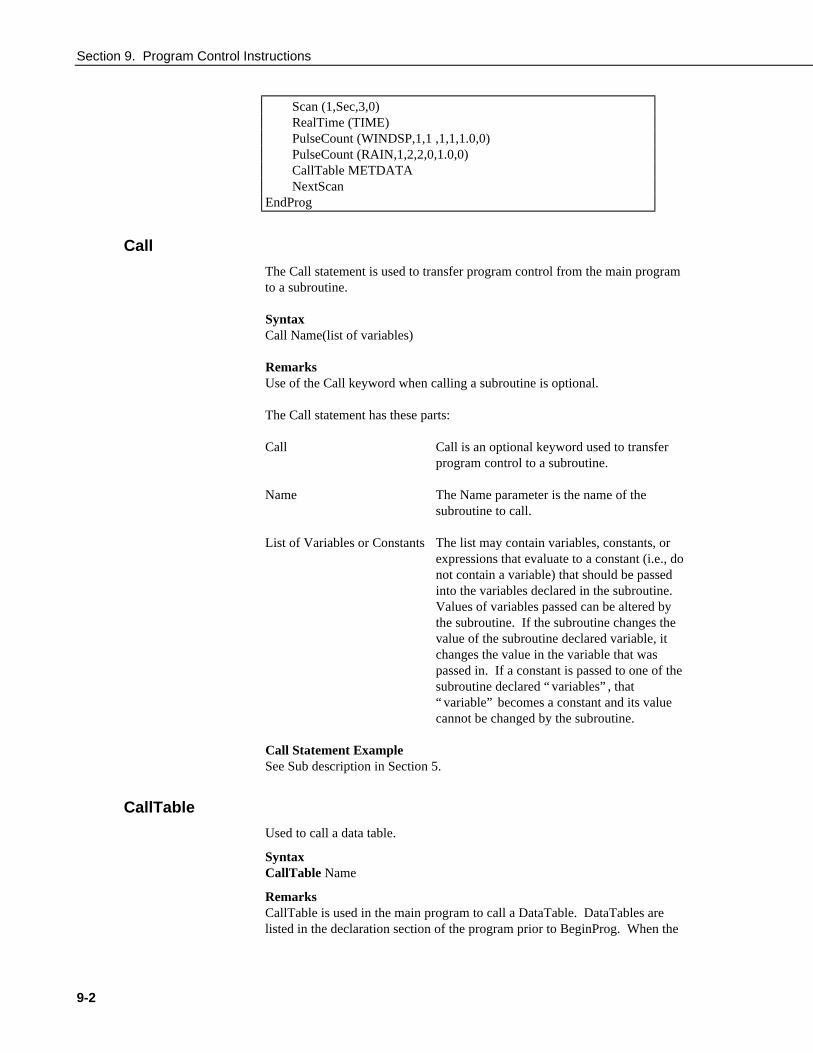
Section 9. Program Control Instructions
9-2
Scan (1,Sec,3,0)RealTime (TIME)PulseCount (WINDSP,1,1 ,1,1,1.0,0)PulseCount (RAIN,1,2,2,0,1.0,0)CallTable METDATANextScan
EndProg
Call
The Call statement is used to transfer program control from the main programto a subroutine.
SyntaxCall Name(list of variables)
RemarksUse of the Call keyword when calling a subroutine is optional.
The Call statement has these parts:
Call Call is an optional keyword used to transferprogram control to a subroutine.
Name The Name parameter is the name of thesubroutine to call.
List of Variables or Constants The list may contain variables, constants, orexpressions that evaluate to a constant (i.e., donot contain a variable) that should be passedinto the variables declared in the subroutine.Values of variables passed can be altered bythe subroutine. If the subroutine changes thevalue of the subroutine declared variable, itchanges the value in the variable that waspassed in. If a constant is passed to one of thesubroutine declared “ variables” , that“ variable” becomes a constant and its valuecannot be changed by the subroutine.
Call Statement ExampleSee Sub description in Section 5.
CallTable
Used to call a data table.
SyntaxCallTable Name
RemarksCallTable is used in the main program to call a DataTable. DataTables arelisted in the declaration section of the program prior to BeginProg. When the
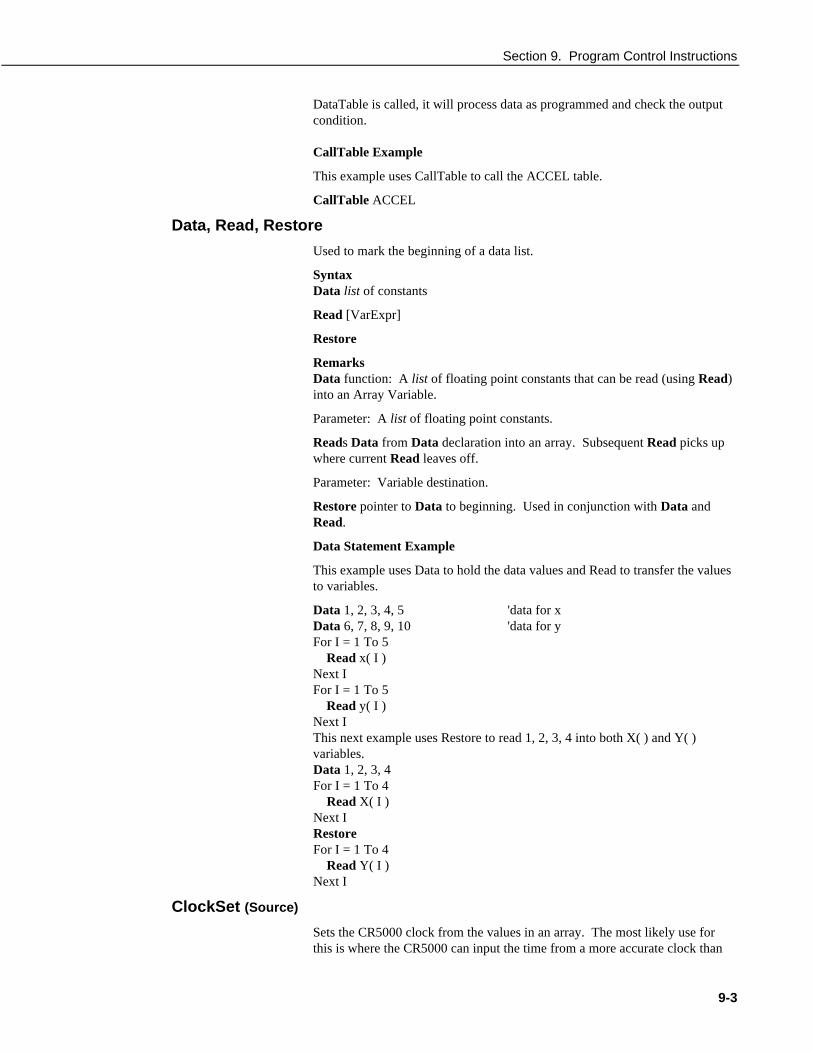
Section 9. Program Control Instructions
9-3
DataTable is called, it will process data as programmed and check the outputcondition.
CallTable Example
This example uses CallTable to call the ACCEL table.
CallTable ACCEL
Data, Read, Restore
Used to mark the beginning of a data list.
SyntaxData list of constants
Read [VarExpr]
Restore
RemarksData function: A list of floating point constants that can be read (using Read)into an Array Variable.
Parameter: A list of floating point constants.
Reads Data from Data declaration into an array. Subsequent Read picks upwhere current Read leaves off.
Parameter: Variable destination.
Restore pointer to Data to beginning. Used in conjunction with Data andRead.
Data Statement Example
This example uses Data to hold the data values and Read to transfer the valuesto variables.
Data 1, 2, 3, 4, 5 'data for xData 6, 7, 8, 9, 10 'data for yFor I = 1 To 5 Read x( I )Next IFor I = 1 To 5 Read y( I )Next IThis next example uses Restore to read 1, 2, 3, 4 into both X( ) and Y( )variables.Data 1, 2, 3, 4For I = 1 To 4 Read X( I )Next IRestoreFor I = 1 To 4 Read Y( I )Next I
ClockSet (Source)
Sets the CR5000 clock from the values in an array. The most likely use forthis is where the CR5000 can input the time from a more accurate clock than

Section 9. Program Control Instructions
9-4
its own (e.g., a GPS receiver). The input time would periodically orconditionally be converted into the required variable array and ClockSet wouldbe used to set the CR5000 clock.
SourceArray
The source must be a seven element array . array(1)..array(7) should holdrespectively year, month, day, hours, minutes, seconds, and microseconds..
Delay (Option, Delay, Units)
Used to delay the program.
SyntaxDelay OptionDelay(Delay, Units)
RemarksThe Delay instruction is used to delay the measurement task sequence or theprocessing instructions for the time period specified by the Delay and Unitsarguments, before progressing to the next measurement or processinginstruction.
The Scan Interval should be sufficiently long to process all measurements plusthe delay period. If the delay is applied to the measurement task sequence andthe scan interval is not long enough to process all measurements plus the delay,the program will not compile when downloaded to the datalogger. If the delayis applied to the processing task sequence, the program will compile but scanswill be skipped.
Parameter& Data Type
Enter
DelayOptionConstant
Code0
1
ResultDelay will affect the measurement task sequence. Processingwill continue to take place as needed in the background.When this option is chosen, the Delay instruction must notbe placed in a conditional statement.Delay will affect processing. Measurements will continue ascalled for by the task sequencer.
DelayConstant
The numeric value for the time delay.
Units The units for the delay.Constant Alpha
CodeNumericCode Units
USEC 0 microsecondsMSEC 1 millisecondsSEC 2 secondsMIN 3 minutes

Section 9. Program Control Instructions
9-5
Do
Repeats a block of statements while a condition is true or until a conditionbecomes true.
Syntax 1Do [While | Until condition]
[statementblock][Exit Do][statementblock]
Loop
Syntax 2Do
[statementblock][Exit Do][statementblock]
Loop [While | Until condition]
The Do...Loop statement has these parts:
Part Description
Do Must be the first statement in a Do...Loop control structure.
While Indicates that the loop is executed while condition is true.
Until Indicates that the loop is executed until condition is true.
condition Numeric expression that evaluates true (nonzero) or false (0or Null).
statementblock Program lines between the Do and Loop statements that arerepeated while or until condition is true.
Exit Do Only used within a Do...Loop control structure to provide analternate way to exit a Do...Loop. Any number of Exit Dostatements may be placed anywhere in the Do...Loop. Oftenused with the evaluation of some condition (for example,If...Then), Exit Do transfers control to the statementimmediately following the Loop. When Do...Loopstatements are nested, control is transferred to the Do...Loopthat is one nested level above the loop in which the Exit Dooccurs.
Loop Ends a Do...Loop.
Do...Loop Statement Example
The example creates an infinite Do...Loop that can be exited only if Volt(1) iswithin a range.
Dim Reply 'Declare variable.Do
Reply = Volt(1)If Reply > 1 And Reply < 9 Then 'Check range.
Exit Do 'Exit Do Loop.End If
Loop
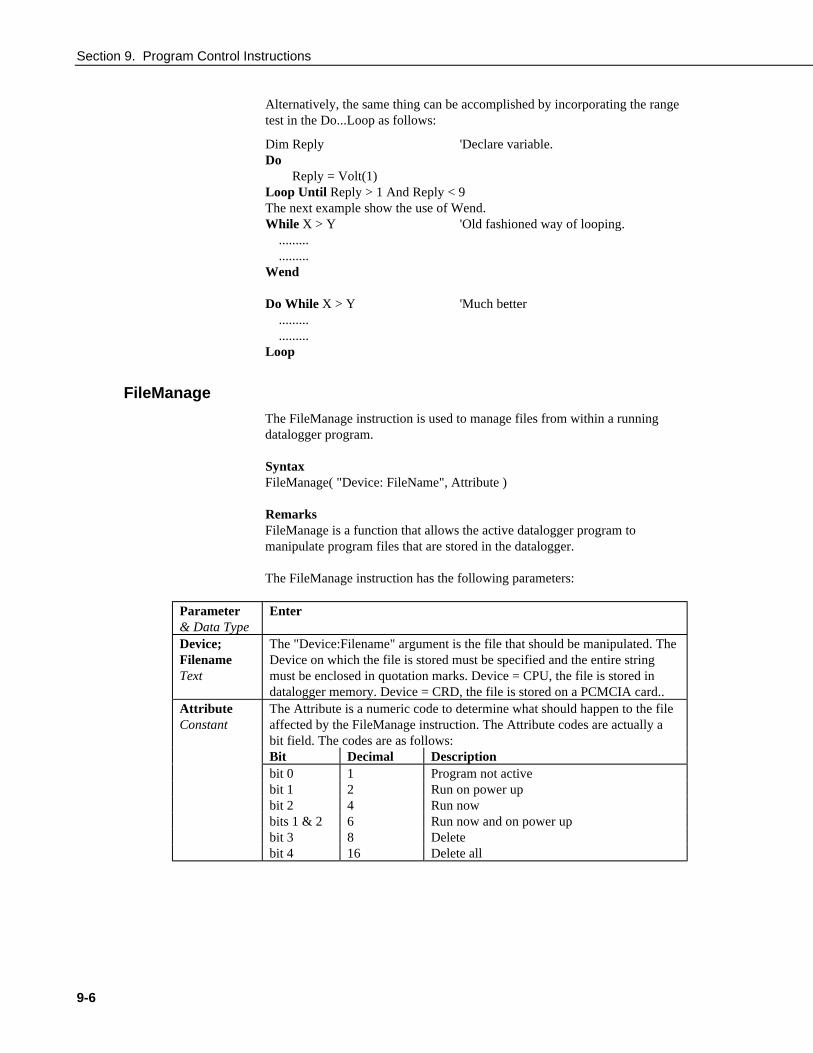
Section 9. Program Control Instructions
9-6
Alternatively, the same thing can be accomplished by incorporating the rangetest in the Do...Loop as follows:
Dim Reply 'Declare variable.Do
Reply = Volt(1)Loop Until Reply > 1 And Reply < 9The next example show the use of Wend.While X > Y 'Old fashioned way of looping. ......... .........Wend
Do While X > Y 'Much better ......... .........Loop
FileManage
The FileManage instruction is used to manage files from within a runningdatalogger program.
SyntaxFileManage( "Device: FileName", Attribute )
RemarksFileManage is a function that allows the active datalogger program tomanipulate program files that are stored in the datalogger.
The FileManage instruction has the following parameters:
Parameter& Data Type
Enter
Device;FilenameText
The "Device:Filename" argument is the file that should be manipulated. TheDevice on which the file is stored must be specified and the entire stringmust be enclosed in quotation marks. Device = CPU, the file is stored indatalogger memory. Device = CRD, the file is stored on a PCMCIA card..
AttributeConstant
The Attribute is a numeric code to determine what should happen to the fileaffected by the FileManage instruction. The Attribute codes are actually abit field. The codes are as follows:Bit Decimal Descriptionbit 0 1 Program not activebit 1 2 Run on power upbit 2 4 Run nowbits 1 & 2 6 Run now and on power upbit 3 8 Deletebit 4 16 Delete all
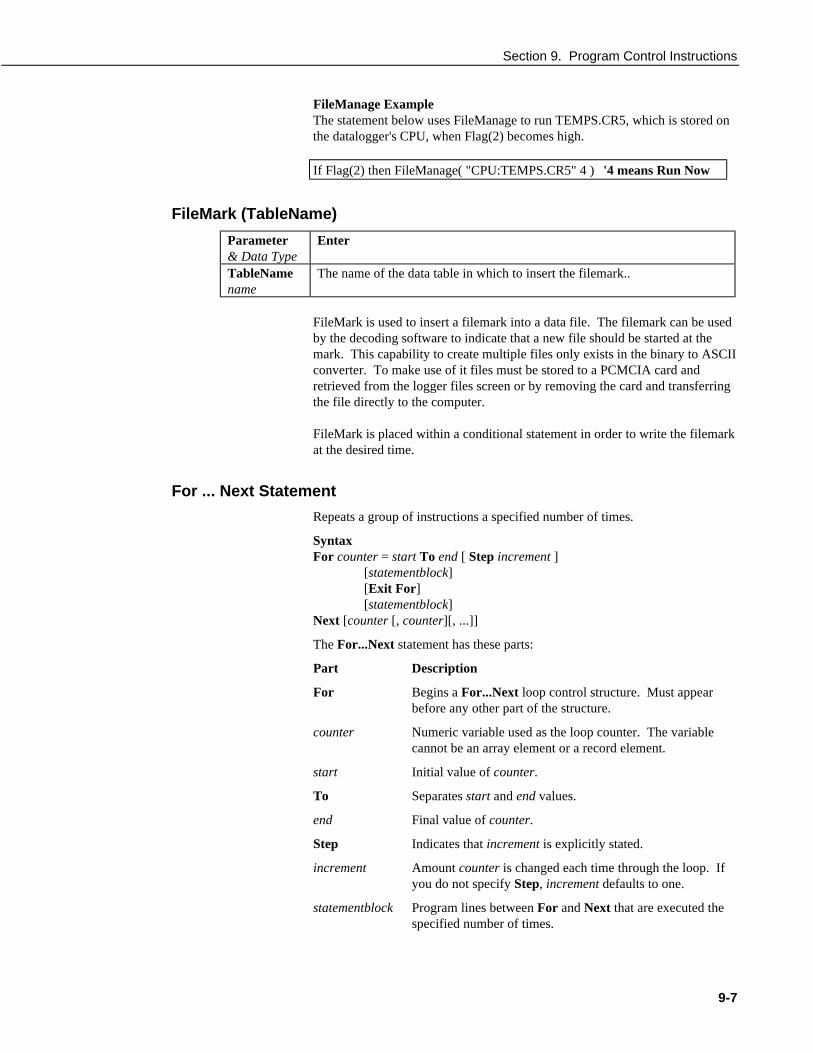
Section 9. Program Control Instructions
9-7
FileManage ExampleThe statement below uses FileManage to run TEMPS.CR5, which is stored onthe datalogger's CPU, when Flag(2) becomes high.
If Flag(2) then FileManage( "CPU:TEMPS.CR5" 4 ) '4 means Run Now
FileMark (TableName)
Parameter& Data Type
Enter
TableNamename
The name of the data table in which to insert the filemark..
FileMark is used to insert a filemark into a data file. The filemark can be usedby the decoding software to indicate that a new file should be started at themark. This capability to create multiple files only exists in the binary to ASCIIconverter. To make use of it files must be stored to a PCMCIA card andretrieved from the logger files screen or by removing the card and transferringthe file directly to the computer.
FileMark is placed within a conditional statement in order to write the filemarkat the desired time.
For ... Next Statement
Repeats a group of instructions a specified number of times.
SyntaxFor counter = start To end [ Step increment ]
[statementblock][Exit For][statementblock]
Next [counter [, counter][, ...]]
The For...Next statement has these parts:
Part Description
For Begins a For...Next loop control structure. Must appearbefore any other part of the structure.
counter Numeric variable used as the loop counter. The variablecannot be an array element or a record element.
start Initial value of counter.
To Separates start and end values.
end Final value of counter.
Step Indicates that increment is explicitly stated.
increment Amount counter is changed each time through the loop. Ifyou do not specify Step, increment defaults to one.
statementblock Program lines between For and Next that are executed thespecified number of times.

Section 9. Program Control Instructions
9-8
Exit For Only used within a For...Next control structure to providean alternate way to exit. Any number of Exit Forstatements may be placed anywhere in the For...Next loop.Often used with the evaluation of some condition (forexample, If...Then), Exit For transfers control to thestatement immediately following the Next.
Next Ends a For...Next loop. Causes increment to be added tocounter.
The Step value controls loop execution as follows:
When Step is Loop executes ifPositive or 0 counter <= endNegative counter >= endOnce the loop has been entered and all the statements in the loop haveexecuted, Step is added to counter. At this point, either the statements in theloop execute again (based on the same test that caused the loop to execute inthe first place), or the loop is exited and execution continues with the statementfollowing the Next statement.
Tip Changing the value of counter while inside a loop can make theprogram more difficult to read and debug.
You can nest For...Next loops by placing one For...Next loop within another.Give each loop a unique variable name as its counter. The followingconstruction is correct:
For I = 1 To 10For J = 1 To 10
For K = 1 To 10...
Next KNext J
Next I
Note If you omit the variable in a Next statement, the value of Stepincrement is added to the variable associated with the most recentFor statement. If a Next statement is encountered before itscorresponding For statement, an error occurs.
For...Next Statement Example
The example runs one For..Next loop inside another.
Dim I, J 'Declare variables.For J = 5 To 1 Step -1 'Loop 5 times backwards.
For I = 1 To 12 'Loop 12 times.. . . . 'Run some code.
Next I. . . . 'Run some code.
Next J. . . . 'Run some code.
This next example fills odd elements of X up to 40 * Y with odd numbers.
For I = 1 To 40 * Y Step 2 X( I ) = INext I

Section 9. Program Control Instructions
9-9
If ... Then ... Else Statement
Allows conditional execution, based on the evaluation of an expression.
Syntax 1If condition Then thenpart [Else elsepart]
Syntax 2If condition1 Then
[statementblock-1][ElseIf condition2 Then
[statementblock-2] ][Else
[statementblock-n] ]End If
Syntax 1 DescriptionThe single-line form is often useful for short, simple conditional tests. Syntax1 has these parts:
Part Description
If Begins the simple If...Then control structure.
condition An expression that evaluates true (nonzero) or false (0 andNull).
Then Identifies actions to be taken if condition is satisfied.
thenpart Statements or branches performed when condition is true.
Else Identifies actions taken if condition is not satisfied. If theElse clause is not present, control passes to the nextstatement in the program.
elsepart Statements or branches performed when condition is false.
The thenpart and the elsepart fields both have this syntax:
statements | [GoTo] linenumber | GoTo linelabel
The thenpart and elsepart syntax has these parts:
Part Description
statements One or more CRBasic statements, separated by colons.
Note You can have multiple statements with a condition, but theymust be on the same line and separated by colons, as in thefollowing statement:
If A > 10 Then A = A + 1 : B = B + A : C = C + B
Syntax 2 Description
The block form of If...Then...Else provides more structure and flexibility thanthe single-line form and is usually easier to read, maintain, and debug. Syntax2 has these parts:

Section 9. Program Control Instructions
9-10
Part Description
If Keyword that begins the block If...Then decision controlstructure.
condition1 Same as condition used in the single-line form shown above.
Then Keyword used to identify the actions to be taken if acondition is satisfied.
statementblock-1 One or more CRBasic statements executed if condition1 istrue.
ElseIf Keyword indicating that alternative conditions must beevaluated if condition1 is not satisfied.
condition2 Same as condition used in the single-line form shown above.
statementblock-2 One or more CRBasic statements executed if condition2 istrue.
Else Keyword used to identify the actions taken if none of theprevious conditions are satisfied.
statementblock-n One or more CRBasic statements executed if condition1 andcondition2 are both false.
End If Keyword that ends the block form of the If...Then.
In executing a block If, CRBasic tests condition1, the first numeric expression.If the expression is true, the statements following Then are executed.
If the first expression is false, CRBasic begins evaluating each ElseIf conditionin turn. When CRBasic finds a true condition, the statements immediatelyfollowing the associated Then are executed. If none of the ElseIf conditions istrue, the statements following the Else are executed. After executing thestatements following Then or Else, the program continues with the statementfollowing End If.
The Else and ElseIf clauses are both optional. You can have as many ElseIfclauses as you like in a block If, but none can appear after an Else clause. Anyof the statement blocks can contain nested block If statements.
CRBasic looks at what appears after the Then keyword to determine whetheror not an If statement is a block If. If anything other than a comment appearsafter Then, the statement is treated as a single-line If statement.
A block If statement must be the first statement on a line. The Else, ElseIf,and End If parts of the statement can have nothing but spaces in front of them.The block If must end with an End If statement.
For Example
If a > 1 And a <= 100 Then
...
ElseIf a = 200 Then
...
End If
Tip Select Case may be more useful when evaluating a single expressionthat has several possible actions.
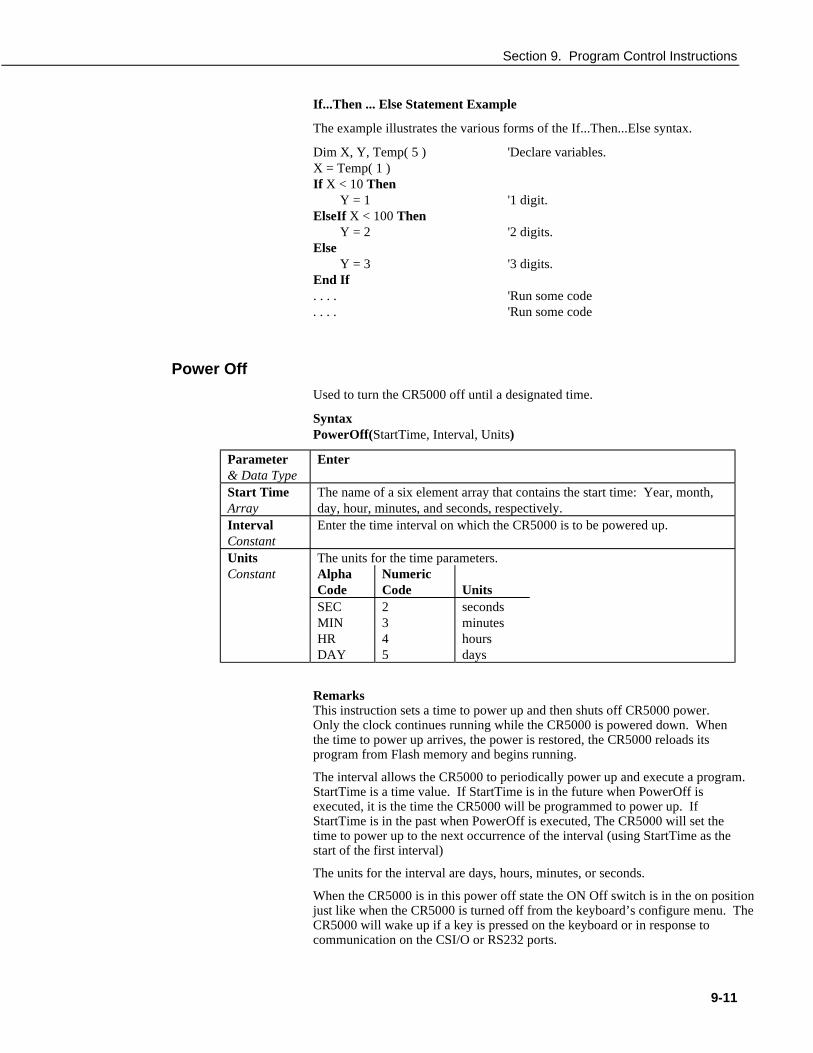
Section 9. Program Control Instructions
9-11
If...Then ... Else Statement Example
The example illustrates the various forms of the If...Then...Else syntax.
Dim X, Y, Temp( 5 ) 'Declare variables.X = Temp( 1 )If X < 10 Then
Y = 1 '1 digit.ElseIf X < 100 Then
Y = 2 '2 digits.Else
Y = 3 '3 digits.End If. . . . 'Run some code. . . . 'Run some code
Power Off
Used to turn the CR5000 off until a designated time.
SyntaxPowerOff(StartTime, Interval, Units)
Parameter& Data Type
Enter
Start TimeArray
The name of a six element array that contains the start time: Year, month,day, hour, minutes, and seconds, respectively.
IntervalConstant
Enter the time interval on which the CR5000 is to be powered up.
Units The units for the time parameters.Constant Alpha
CodeNumericCode Units
SEC 2 secondsMIN 3 minutesHR 4 hoursDAY 5 days
RemarksThis instruction sets a time to power up and then shuts off CR5000 power.Only the clock continues running while the CR5000 is powered down. Whenthe time to power up arrives, the power is restored, the CR5000 reloads itsprogram from Flash memory and begins running.
The interval allows the CR5000 to periodically power up and execute a program.StartTime is a time value. If StartTime is in the future when PowerOff isexecuted, it is the time the CR5000 will be programmed to power up. IfStartTime is in the past when PowerOff is executed, The CR5000 will set thetime to power up to the next occurrence of the interval (using StartTime as thestart of the first interval)
The units for the interval are days, hours, minutes, or seconds.
When the CR5000 is in this power off state the ON Off switch is in the on positionjust like when the CR5000 is turned off from the keyboard’s configure menu. TheCR5000 will wake up if a key is pressed on the keyboard or in response tocommunication on the CSI/O or RS232 ports.

Section 9. Program Control Instructions
9-12
Power off can also be used in conjunction with the power-up digital inputs to set upthe CR5000 to power up in response to external trigger, make a series ofmeasurements, and then power off.
If the "<0.5 " input is switched to ground or if the ">2" input has a voltagegreater than 2 volts applied, the CR5000 will awake, load the program inmemory and run. If the "< 0.5" input is held at ground and off/on switchturned off then on, the CR5000 will not run the program in memory. This isextremely useful if the program executes the PowerOff instruction immediatelyor after a short measurement period.
The following example is a good one to play with to become familiar with thePowerOff instruction. The CR5000 "scans" once a second for two minutes.At the end of that time it powers down. It is programmed to wake up on a 4minute interval. After the first PowerOff, it will wake up every four minutes,count for 2 minutes and turn itself off. You can load this program and use thePower On inputs to wake the CR5000 before the interval is up. A program foran actual application would have measurements within the scan.
Public Start(6), count 'Declare the start time array and count'Start() is initialized to 0 at compile time. 0 time is Midnight the start of 1990'count is initialized to 0 at compile time
BeginProgScan(1,SEC,0,120) 'Scan once per second for 2 minutes
Count=count+1 'Increment counterNextScanPowerOff(Start,4,min) 'Power off, wake up on 4 minute interval
EndProg
Print list of variables or quoted text
Print is used as a tool in debugging a program to print text or the value ofvariables at different points in the program. “ Printing” occurs over the activelink and can be observed from Tools | Diagnostics | Terminal Mode in PC9000.
RunDLDFile
The RunDLDFile instruction is used to run a datalogger program file from theactive program file.
SyntaxRunDLDFile( "Device:FileName", Attrib )
RemarksThe RunDLDFile has the following parameters:
"Device:FileName" The "Device:Filename" argument is the file that shouldbe executed. The Device on which the file is storedmust be specified and the entire string must be enclosedin quotation marks. Device = CPU, the file is stored indatalogger memory. Device = CRD, the file is stored ona PCMCIA card.
Attribute The Attribute is a numeric code to determine whatshould happen to the file called by the RunDLDFile

Section 9. Program Control Instructions
9-13
instruction. The Attribute codes are actually a bit field.The codes are as follows:
Bit Decimal Description
bit 1 2 Run on power up
bit 2 4 Run now
RunDLDFile Example
The statement below uses RunDLDFile to run TEMPS.DLD, which is storedon the datalogger's CPU, when Flag(2) becomes high.
If Flag(2) then RunDLDFile( "CPU:TEMPS.DLD" 4 ) '4 means Run Now
Reset Table
Used to reset a data table under program control.
Syntax
ResetTable( TableName )
Remarks
ResetTable is a function that allows a running program to erase and restart adata table. TableName is the name of the table to reset.
ResetTable Example
The example program line uses ResetTable to reset table MAIN when Flag(2)is high.
If Flag(2) then ResetTable( MAIN ) 'resets table MAIN
Scan
Used to establish the program scan rate.
SyntaxScan(Interval, Units, Option, Count)
...
...[Exit Scan]
...Next Scan
The measurements, processing, and calls to output tables bracketed by theScan…NextScan instructions determine the sequence and timing of thedatalogger program.
The Scan instruction determines how frequently the measurements within theScan…NextScan structure are made, controls the buffering capabilities, andsets the number of times to loop through the scan.

Section 9. Program Control Instructions
9-14
Parameter& Data Type
Enter
IntervalConstant
Enter the time interval at which the scan is to be executed. The interval maybe in µs, ms, s, or minutes, whichever is selected with the Units parameter.The maximum scan interval is one minute.
Units The units for the time parameters.Constant Alpha
CodeNumericCode Units
USEC 0 microsecondsMSEC 1 millisecondsSEC 2 secondsMIN 3 minutes
OptionConstant
The Option parameter determines how data will be buffered during theScan…NextScan process. The options are:
Option Result0, 1, or 2 The datalogger uses two buffers when processing
measurements. When a measurement begins on a scan,the values of the previous scan are loaded into a buffer.This allows processing to finish on the previous scanduring measurement of the current scan.
>3 The datalogger uses three or more buffers whenprocessing measurements, based on the number of scansdefined by this Constant.
Larger buffers can be used for a Scan that has occasional large processingrequirements such as FFTs or Histograms, and/or when processing may beinterrupted by communications. If a value of 1000 is inserted into theBufferSize argument of a scan having 10 thermocouple measurements,40,000 bytes of SRAM will be allocated for the buffer [(4 bytes) /(measurement) x (10 measurements)/(buffered scan) x 1000 bufferedscans)]. The buffer size plus the size of any Output Tables stored in SRAMshould not exceed 2 megabytes.
If the processing ever lags behind by more than the buffer allocated, thedatalogger will discard the buffered values and synchronize back up to thecurrent measurement
The SlowSequence instruction does not allow for this buffering scheme eventhough Scan is used to signify the start of a scan in a slow sequence. InSlowSequence, the measurements are stored in a single buffer. Processing ofthis buffer is completed before the NextScan measurements are made.
CountInteger
The number of times to execute the Scan/NextScan loop. Enter 0 for infinitelooping.

Section 9. Program Control Instructions
9-15
Select Case Statement
Executes one of several statement blocks depending on the value of anexpression.
SyntaxSelect Case testexpression[Case expressionlist1
[statementblock-1] ][Case expressionlist2
[statementblock-2] ][Case Else
[statementblock-n] ]End Select
The Select Case syntax has these parts:
Part Description
Select Case Begins the Select Case decision control structure. Mustappear before any other part of the Select Case structure.
testexpression Any numeric or string expression. If testexpression matchesthe expressionlist associated with a Case clause, thestatementblock following that Case clause is executed up tothe next Case clause, or for the final one, up to the EndSelect. Control then passes to the statement following EndSelect. If testexpression matches more than one Caseclause, only the statements following the first match areexecuted.
Case Sets apart a group of CRBasic statements to be executed ifan expression in expressionlist matches testexpression.
expressionlist The expressionlist consists of a comma-delimited list of oneor more of the following forms.
expression
expression To expression
Is compare-operator expression
statementblock
Elements statementblock-1 to statementblock-n consist ofany number of CRBasic statements on one or more lines.
Case Else Keyword indicating the statementblock to be executed if nomatch is found between the testexpression and anexpressionlist in any of the other Case selections. Whenthere is no Case Else statement and no expression listed inthe Case clauses matches testexpression, program executioncontinues at the statement following End Select.
End Select Ends the Select Case. Must appear after all other statementsin the Select Case control structure.

Section 9. Program Control Instructions
9-16
The argument expressionlist has these parts:
Part Description
expression Any numeric expression.
To Keyword used to specify a range of values. If you use the Tokeyword to indicate a range of values, the smaller valuemust precede To.
Although not required, it is a good idea to have a Case Else statement in yourSelect Case block to handle unforeseen testexpression values.
You can use multiple expressions or ranges in each Case clause. For example,the following line is valid:
Case 1 To 4, 7 To 9, 11, 13
Select Case statements can be nested. Each Select Case statement must have amatching End Select statement.
Select Case Statement Example
The example uses Select Case to decide what action to take based on userinput.
Dim X, Y 'Declare variables.If Not X = Y Then 'Are they equal
If X > Y ThenSelect Case X 'What is X.Case 0 To 9 'Must be less than 10.
. . . . 'Run some code.
. . . . 'Run some code.Case 10 To 99 'Must be less than 100.
. . . . 'Run some code.
. . . . 'Run some code.Case Else 'Must be something else.
. . . . 'Run some code.End Select
End IfElse
Select Case Y 'What is Y.Case 1, 3, 5, 7, 9 'It's odd.
. . . . 'Run some code.Case 0, 2, 4, 6, 8 'It's even.
. . . . 'Run some code.Case Else 'Out of range.
. . . . 'Run some code.
. . . . 'Run some code.End Select
End If. . . . 'Run some code.. . . . 'Run some code.
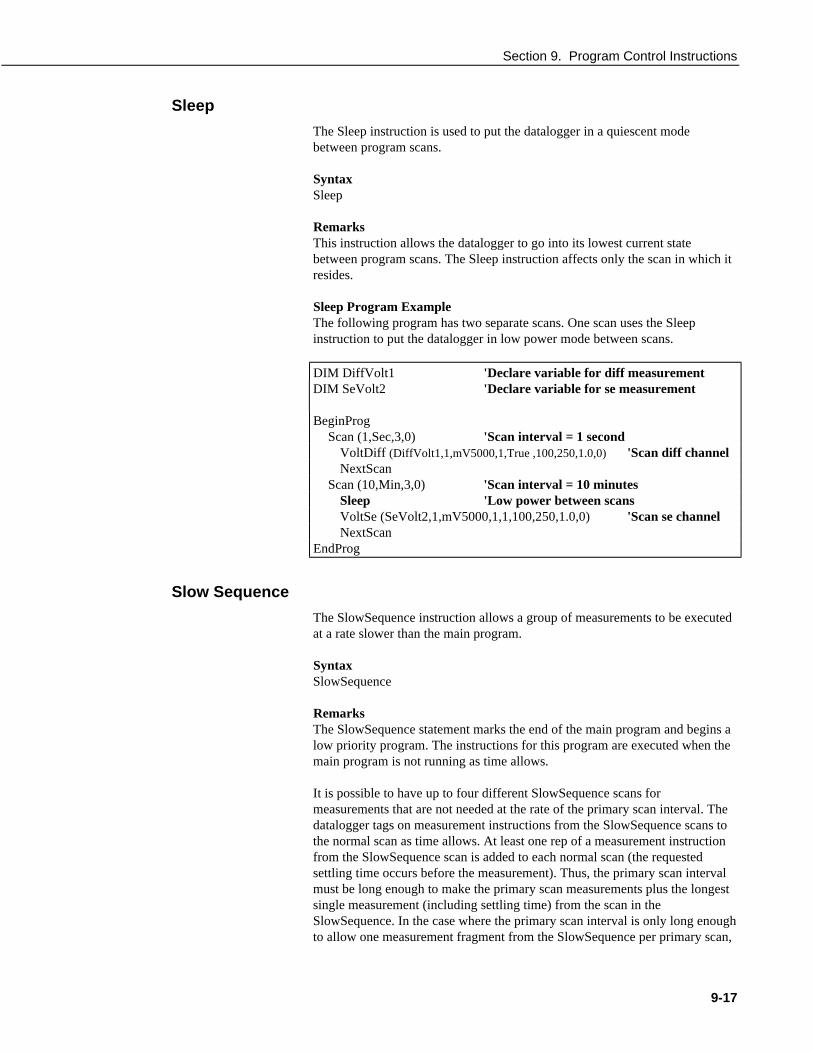
Section 9. Program Control Instructions
9-17
Sleep
The Sleep instruction is used to put the datalogger in a quiescent modebetween program scans.
SyntaxSleep
RemarksThis instruction allows the datalogger to go into its lowest current statebetween program scans. The Sleep instruction affects only the scan in which itresides.
Sleep Program ExampleThe following program has two separate scans. One scan uses the Sleepinstruction to put the datalogger in low power mode between scans.
DIM DiffVolt1 'Declare variable for diff measurementDIM SeVolt2 'Declare variable for se measurement
BeginProgScan (1,Sec,3,0) 'Scan interval = 1 second
VoltDiff (DiffVolt1,1,mV5000,1,True ,100,250,1.0,0) 'Scan diff channelNextScan
Scan (10,Min,3,0) 'Scan interval = 10 minutesSleep 'Low power between scansVoltSe (SeVolt2,1,mV5000,1,1,100,250,1.0,0) 'Scan se channelNextScan
EndProg
Slow Sequence
The SlowSequence instruction allows a group of measurements to be executedat a rate slower than the main program.
SyntaxSlowSequence
RemarksThe SlowSequence statement marks the end of the main program and begins alow priority program. The instructions for this program are executed when themain program is not running as time allows.
It is possible to have up to four different SlowSequence scans formeasurements that are not needed at the rate of the primary scan interval. Thedatalogger tags on measurement instructions from the SlowSequence scans tothe normal scan as time allows. At least one rep of a measurement instructionfrom the SlowSequence scan is added to each normal scan (the requestedsettling time occurs before the measurement). Thus, the primary scan intervalmust be long enough to make the primary scan measurements plus the longestsingle measurement (including settling time) from the scan in theSlowSequence. In the case where the primary scan interval is only long enoughto allow one measurement fragment from the SlowSequence per primary scan,

Section 9. Program Control Instructions
9-18
the minimum time for the SlowSequence scan interval is the product of thenumber of SlowSequence measurement segments and the primary scaninterval. One function of a SlowSequence is to update the calibration table.
The measurements in a single "scan" of the SlowSequence may be spread outover a longer time period because the measurements can be parceled intomultiple primary scans.
When more than one SlowSequence is used in a program, certain combinationsof the main program scan rate and the SlowSequence scan rates may result in alower priority SlowSequence never being executed. If the interval for a higherpriority SlowSequence arrives before the lower priority SlowSequence can besliced in, the lower priority SlowSequence will never be performed. Eachcombination of main program and SlowSequence program segments must beevaluated to determine if there is sufficient time to allow lower priority scansto be executed.
Low priority DataTables can be included in the SlowSequence scan by listingthem after the SlowSequence instruction. It should be noted that time stampeddata written to SlowSequence DataTables will be stamped with the start time ofthe last SlowSequence scan.
SlowSequence ExampleThe example uses SlowSequence to calibrate the datalogger every sixtyseconds.
'Calibrate
Public Temp1Public Calib1(60)
DataTable(Table1,1,600)DataInterval(0,1,sec,1)Sample(1,Temp1,FP2)EndTable
BeginProgScan(20,mSec,0,0)
PanelTemp (Temp1,250)CallTable Table1
Next scan
SlowSequenceScan (60,Sec,0,0)
Calibrate(Calib1)Next scan
EndProg
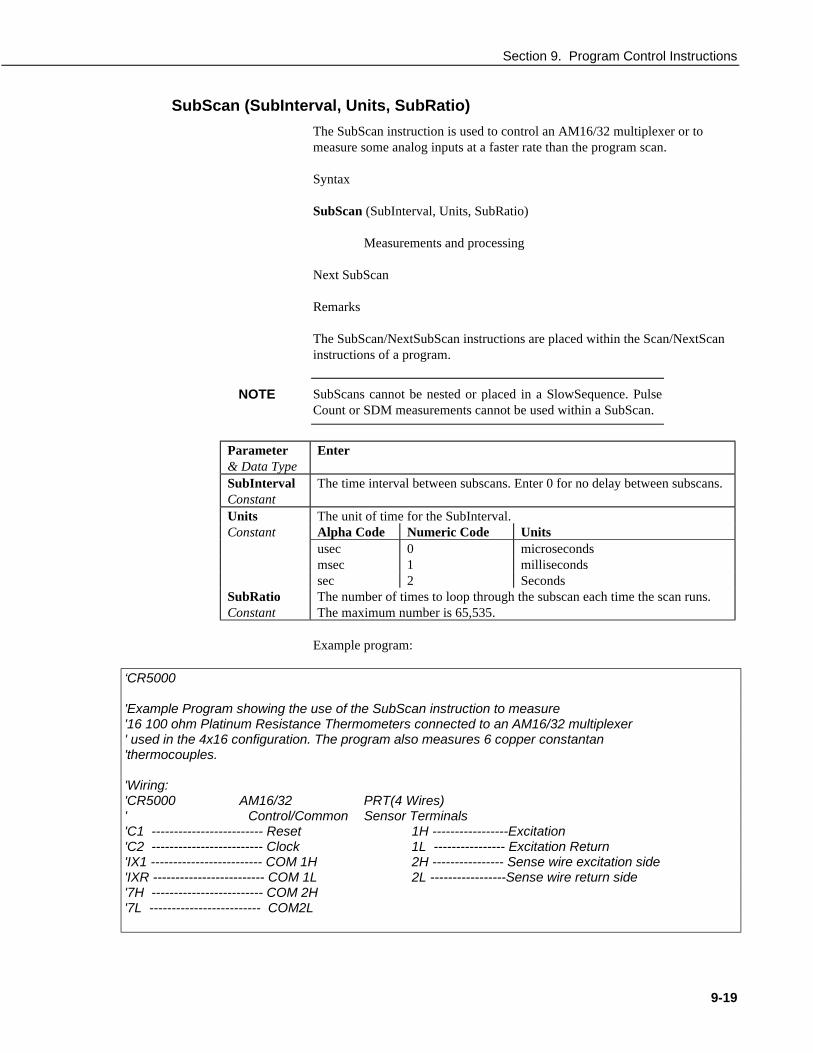
Section 9. Program Control Instructions
9-19
SubScan (SubInterval, Units, SubRatio)
The SubScan instruction is used to control an AM16/32 multiplexer or tomeasure some analog inputs at a faster rate than the program scan.
Syntax
SubScan (SubInterval, Units, SubRatio)
Measurements and processing
Next SubScan
Remarks
The SubScan/NextSubScan instructions are placed within the Scan/NextScaninstructions of a program.
SubScans cannot be nested or placed in a SlowSequence. PulseCount or SDM measurements cannot be used within a SubScan.
Parameter& Data Type
Enter
SubIntervalConstant
The time interval between subscans. Enter 0 for no delay between subscans.
Units The unit of time for the SubInterval.Constant Alpha Code Numeric Code Units
usec 0 microsecondsmsec 1 millisecondssec 2 Seconds
SubRatioConstant
The number of times to loop through the subscan each time the scan runs.The maximum number is 65,535.
Example program:
‘CR5000
'Example Program showing the use of the SubScan instruction to measure'16 100 ohm Platinum Resistance Thermometers connected to an AM16/32 multiplexer' used in the 4x16 configuration. The program also measures 6 copper constantan'thermocouples.
'Wiring:'CR5000 AM16/32 PRT(4 Wires)' Control/Common Sensor Terminals'C1 ------------------------- Reset 1H -----------------Excitation'C2 ------------------------- Clock 1L ---------------- Excitation Return'IX1 ------------------------- COM 1H 2H ---------------- Sense wire excitation side'IXR ------------------------- COM 1L 2L -----------------Sense wire return side'7H ------------------------- COM 2H'7L ------------------------- COM2L
NOTE
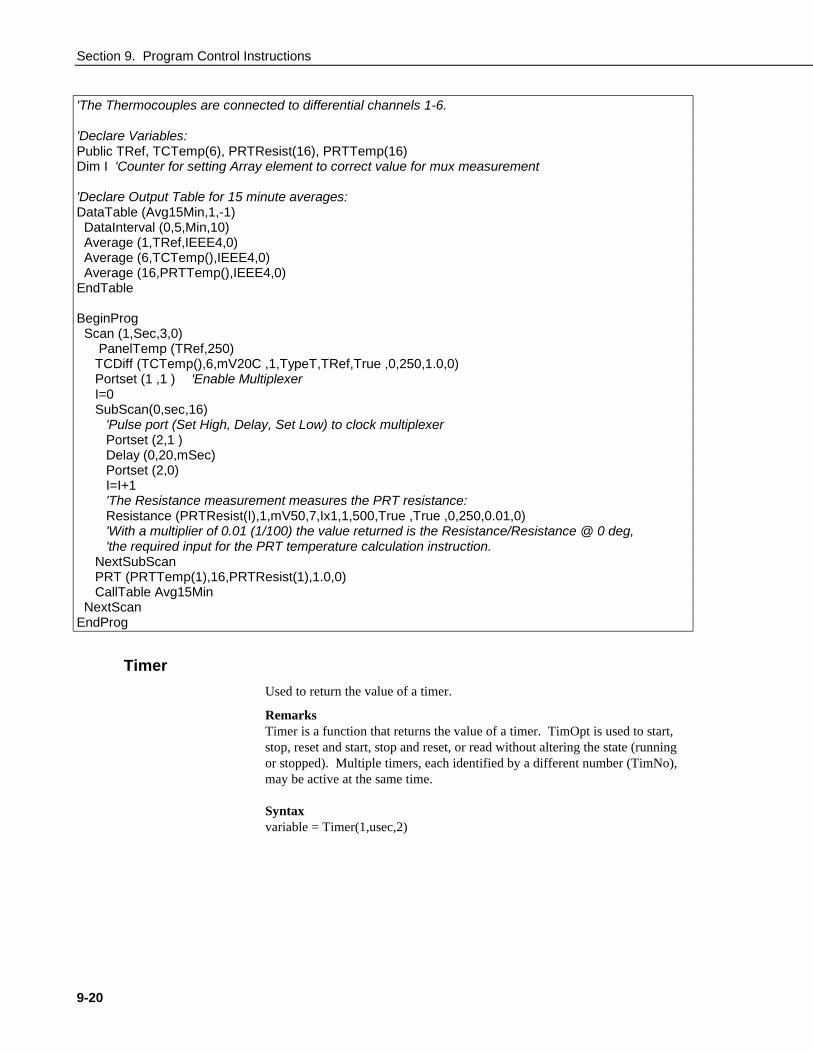
Section 9. Program Control Instructions
9-20
'The Thermocouples are connected to differential channels 1-6.
'Declare Variables:Public TRef, TCTemp(6), PRTResist(16), PRTTemp(16)Dim I 'Counter for setting Array element to correct value for mux measurement
'Declare Output Table for 15 minute averages:DataTable (Avg15Min,1,-1) DataInterval (0,5,Min,10) Average (1,TRef,IEEE4,0) Average (6,TCTemp(),IEEE4,0) Average (16,PRTTemp(),IEEE4,0)EndTable
BeginProg Scan (1,Sec,3,0) PanelTemp (TRef,250) TCDiff (TCTemp(),6,mV20C ,1,TypeT,TRef,True ,0,250,1.0,0) Portset (1 ,1 ) 'Enable Multiplexer I=0 SubScan(0,sec,16) 'Pulse port (Set High, Delay, Set Low) to clock multiplexer Portset (2,1 ) Delay (0,20,mSec) Portset (2,0) I=I+1 'The Resistance measurement measures the PRT resistance: Resistance (PRTResist(I),1,mV50,7,Ix1,1,500,True ,True ,0,250,0.01,0) 'With a multiplier of 0.01 (1/100) the value returned is the Resistance/Resistance @ 0 deg, 'the required input for the PRT temperature calculation instruction. NextSubScan PRT (PRTTemp(1),16,PRTResist(1),1.0,0) CallTable Avg15Min NextScanEndProg
Timer
Used to return the value of a timer.
RemarksTimer is a function that returns the value of a timer. TimOpt is used to start,stop, reset and start, stop and reset, or read without altering the state (runningor stopped). Multiple timers, each identified by a different number (TimNo),may be active at the same time.
Syntaxvariable = Timer(1,usec,2)

Section 9. Program Control Instructions
9-21
Parameter& Data Type
Enter
TimNoConstant,Variable, orExpression
An integer number for the timer (e.g., 0, 1, 2, . . .) Use low numbers toconserve memory; using TimNo 100 will allocate space for 100 timers evenif it is the only timer in the program.
Units The units in which to return the timer value.Constant Alpha
CodeNumericCode Units
USEC 0 microsecondsMSEC 1 millisecondsSEC 2 secondsMIN 3 minutes
TimOptConstant
The action on the timer. The timer function returns the value of the timerafter the action is performedCode Result0 start1 stop2 reset and start3 stop and reset4 read only
Timer ExampleThe example uses Timer.
While…Wend
The While…Wend instructions are used to executes a series of statements in aloop as long as a given condition is true.
SyntaxWhile Condition [StatementBlock]Wend
RemarksWhile…Wend loops can be nested.
The While...Wend statement has the following parameters:
While The While statement begins the While...Wend loop controlstructure.
Condition The Condition is any expression that can be evaluated True(nonzero) or False (0 and Null). If Condition is true, allstatements in StatementBlock are executed until the Wendstatement is encountered. Control then returns to the Whilestatement and Condition is again checked. If Condition isstill true, the process is repeated. If Condition it is not True,execution resumes with the statement following the Wendstatement.
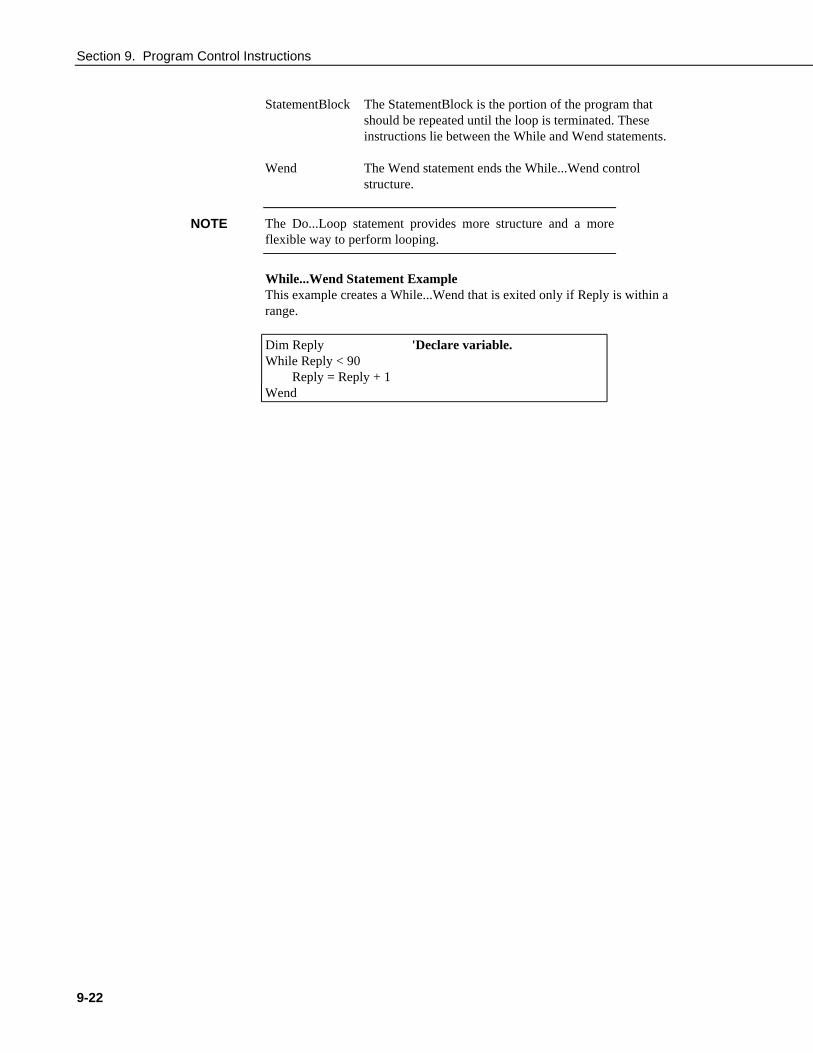
Section 9. Program Control Instructions
9-22
StatementBlock The StatementBlock is the portion of the program thatshould be repeated until the loop is terminated. Theseinstructions lie between the While and Wend statements.
Wend The Wend statement ends the While...Wend controlstructure.
The Do...Loop statement provides more structure and a moreflexible way to perform looping.
While...Wend Statement ExampleThis example creates a While...Wend that is exited only if Reply is within arange.
Dim Reply 'Declare variable.While Reply < 90
Reply = Reply + 1Wend
NOTE
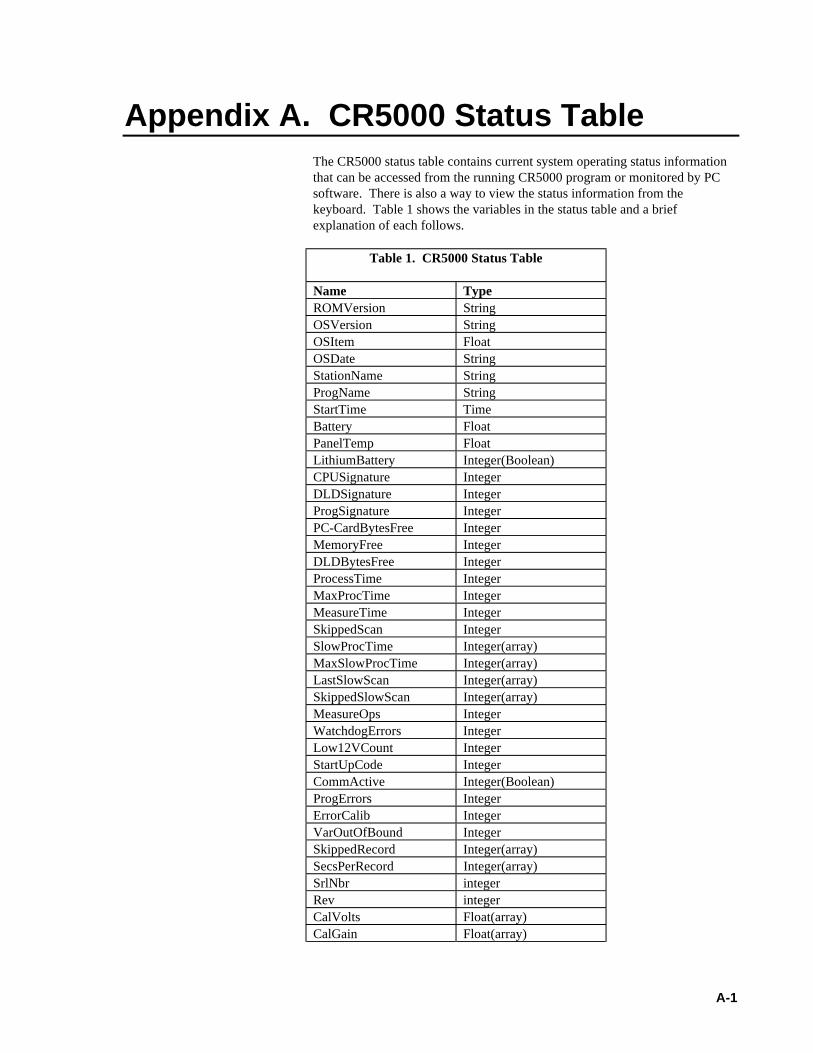
A-1
Appendix A. CR5000 Status TableThe CR5000 status table contains current system operating status informationthat can be accessed from the running CR5000 program or monitored by PCsoftware. There is also a way to view the status information from thekeyboard. Table 1 shows the variables in the status table and a briefexplanation of each follows.
Table 1. CR5000 Status Table
Name TypeROMVersion StringOSVersion StringOSItem FloatOSDate StringStationName StringProgName StringStartTime TimeBattery FloatPanelTemp FloatLithiumBattery Integer(Boolean)CPUSignature IntegerDLDSignature IntegerProgSignature IntegerPC-CardBytesFree IntegerMemoryFree IntegerDLDBytesFree IntegerProcessTime IntegerMaxProcTime IntegerMeasureTime IntegerSkippedScan IntegerSlowProcTime Integer(array)MaxSlowProcTime Integer(array)LastSlowScan Integer(array)SkippedSlowScan Integer(array)MeasureOps IntegerWatchdogErrors IntegerLow12VCount IntegerStartUpCode IntegerCommActive Integer(Boolean)ProgErrors IntegerErrorCalib IntegerVarOutOfBound IntegerSkippedRecord Integer(array)SecsPerRecord Integer(array)SrlNbr integerRev integerCalVolts Float(array)CalGain Float(array)
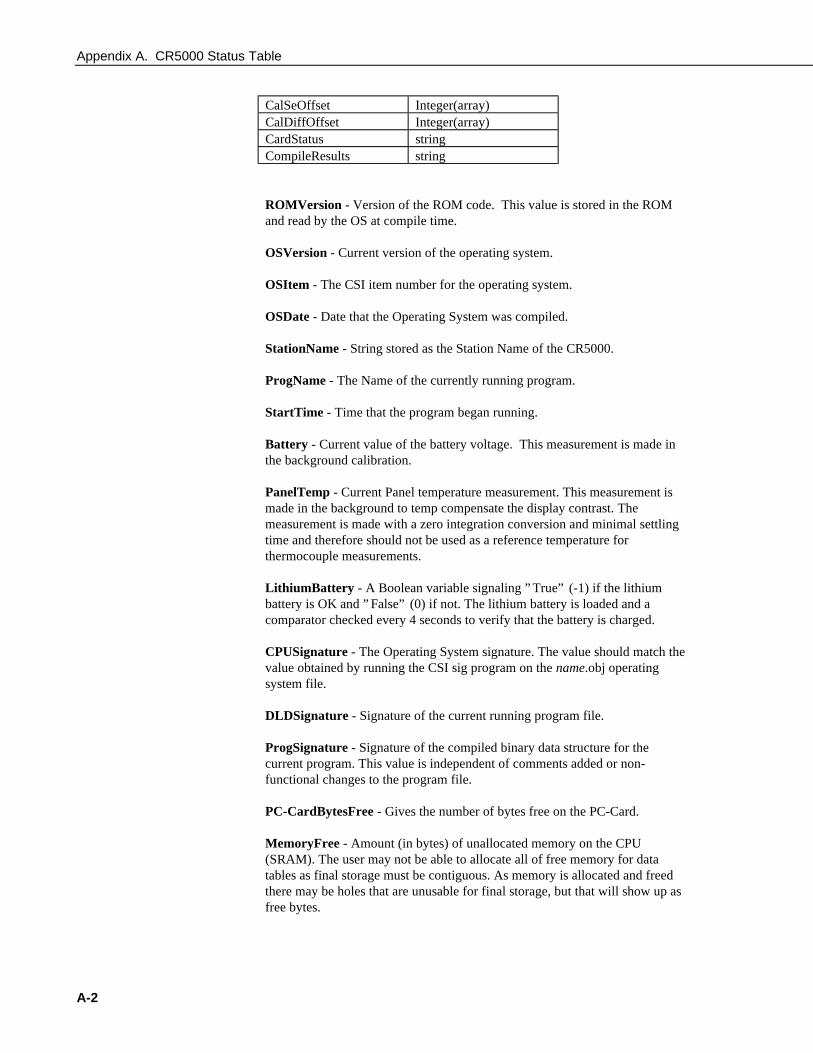
Appendix A. CR5000 Status Table
A-2
CalSeOffset Integer(array)CalDiffOffset Integer(array)CardStatus stringCompileResults string
ROMVersion - Version of the ROM code. This value is stored in the ROMand read by the OS at compile time.
OSVersion - Current version of the operating system.
OSItem - The CSI item number for the operating system.
OSDate - Date that the Operating System was compiled.
StationName - String stored as the Station Name of the CR5000.
ProgName - The Name of the currently running program.
StartTime - Time that the program began running.
Battery - Current value of the battery voltage. This measurement is made inthe background calibration.
PanelTemp - Current Panel temperature measurement. This measurement ismade in the background to temp compensate the display contrast. Themeasurement is made with a zero integration conversion and minimal settlingtime and therefore should not be used as a reference temperature forthermocouple measurements.
LithiumBattery - A Boolean variable signaling ” True” (-1) if the lithiumbattery is OK and ” False” (0) if not. The lithium battery is loaded and acomparator checked every 4 seconds to verify that the battery is charged.
CPUSignature - The Operating System signature. The value should match thevalue obtained by running the CSI sig program on the name.obj operatingsystem file.
DLDSignature - Signature of the current running program file.
ProgSignature - Signature of the compiled binary data structure for thecurrent program. This value is independent of comments added or non-functional changes to the program file.
PC-CardBytesFree - Gives the number of bytes free on the PC-Card.
MemoryFree - Amount (in bytes) of unallocated memory on the CPU(SRAM). The user may not be able to allocate all of free memory for datatables as final storage must be contiguous. As memory is allocated and freedthere may be holes that are unusable for final storage, but that will show up asfree bytes.
Appendix A. CR5000 Status Table
A-3
DLDBytesFree - Amount of free space in the CPU RAM disk that is used tostore program files.
ProcessTime - Time in microseconds that it took to run through processing onthe last scan. Time is measured from the end of the EndScan instruction (afterthe measurement event is set) to the beginning of the EndScan (before the waitfor the measurement event begins) for the subsequent scan.
MaxProcTime - The maximum time required to run through processing forthe current scan. This value is reset when the scan exits.
MeasureTime - The time required by the hardware to make the measurementsin this scan. The sum of all integration times and settling times. Processing willoccur concurrent with this time so the sum of measure time and process time isnot the time required in the scan instruction.
SkippedScan - Number of scans that have occurred while running the currentprogram.
SlowProcTime - Time required to process the current slow scan. If the userhas slow scans then this variable becomes an array with a value for the systemslow scan and each of the users scans.
MaxSlowProcTime - The maximum Time required to process the current slowscan. If the user has slow scans then this variable becomes an array with avalue for the system slow scan and each of the users scans.
LastSlowScan - The last time that this slow scan executed. If the user has slowscans then this variable becomes an array with a value for the system slow scanand each of the users scans.
SkippedSlowScan - The number of scans that have been skipped in this slowsequence. If the user has slow scans then this variable becomes an array with avalue for the system slow scan and each of the users scans.
MeasureOps - This is the number of task sequencer opcodes required to do allmeasurements in the system. This value includes the Calibration opcodes(compile time) and the system slow sequence opcodes.
WatchdogErrors - The number of Watchdog errors that have occurred whilerunning this program. This value can be reset from the keyboard by going tostatus and scrolling down to the variable and pressing the DEL key. It is alsoreset upon compiling a new program.
Low12VCount - Keeps a running count of the number of occurrences of the12VLow signal being asserted. When this condition is detected the loggerceases making measurements and goes into a low power mode until the systemvoltage is up to a safe level. This value can be reset from the keyboard bygoing to status and scrolling down to the variable and pressing the DEL key. Itis also reset upon compiling a new program.
StartUpCode - A code variable that allows the user to know how the systemwoke up from poweroff.
Appendix A. CR5000 Status Table
A-4
CommActive - A variable signaling whether or not communications iscurrently active (increments each time the autobaud detect code is executed).
ProgErrors - The number of compile (or runtime) errors for the current pro-gram.
ErrorCalib - A counter that is incremented each time a bad calibration value ismeasured. The value is discarded (not included in the filter update) and this varis incremented.
VarOutOfBound - Flags whether an array was accessed out of bounds.
SkippedRecord - Variable that tells how many records have been shipped fora given table. Each table has its own entry in this array.
SecsPerRecord - Output interval for a given table. Each table has its ownentry in this array.
SrlNbr - Machine specific serial number. Stored in FLASH memory.
Rev - Hardware revision number. Stored in FLASH memory.
CalVolts - Factory calibration numbers. This array contains twenty valuescorresponding to the 20 integration / range combinations. These numbers areloaded by the Factory Calibration and are stored in FLASH.
CalGain - Calibration table Gain values. Each integration / range combinationhas a gain associated with it. These numbers are updated by the backgroundslow sequence if the running program uses the integration / range.
CalSeOffset - Calibration table single ended offset values. Each integration /range combination has a single ended offset associated with it. These numbersare updated by the background slow sequence if the running program uses theintegration / range.
CalDiffOffset - Calibration table differential offset values. Each integration /range combination has a differential offset associated with it. These numbersare updated by the background slow sequence if the running program uses theintegration / range.
CardStatus - Contains a string with the most recent card status information.
CompileResults - Contains any error messages that were generated bycompilation or during run time.

Index-1
Index
AABS 8-1ACOS 6-13, 8-2Alias 4-2, 4-4, 4-9, 5-1, 6-14, 8-23, 8-24, 9-1AM25T OV2, 1-10, 7-29AND 7-28, 8-2ASIN 8-3ATN 8-4, 8-7, 8-21, 8-24, 8-30, 8-32, 8-33ATN2 8-4, 8-5Average 4-6, 6-11AvgRun 8-6, 8-7AvgSpa 8-5, 8-6
BBattery OV-1, OV-3, OV-9, 1-1, 1-2, 1-3, 1-4, 1-5,
1-6, 1-12, 1-13, 1-14, 1-15, 2-1, 3-9, 7-15, A-1,A-2
BeginProg, EndProg 3-7, 4-4, 4-6, 6-1, 6-4, 6-5,6-7, 6-15, 6-18, 7-21, 7-22, 7-26, 8-7, 8-9, 8-15,8-21, 8-23, 8-24, 8-28, 8-30, 9-1, 9-2, 9-12,9-17, 9-18
BrFull OV-2, 3-6, 3-7, 3-18, 7-8, 7-11, 8-28BrFull6W OV-2, 3-6, 3-18, 7-9BrHalf OV-2, 3-6, 3-17, 7-5BrHalf3W OV-2, 3-6, 3-17, 7-6BrHalf4W OV-2, 3-18, 7-6
CCalibrate 3-20, 3-21, 3-22, 4-10, 7-11, 7-16, 7-17,
9-18Call 9-2CallTable 3-7, 4-4, 4-6, 6-4, 6-5, 6-7, 6-15, 6-18,
7-22, 7-26, 8-7, 8-21, 8-23, 8-24, 8-28, 9-2, 9-3,9-18
CardOut OV-2, 2-1, 6-1, 6-8ClockSet 9-4Const 4-4, 5-1, 5-2, 6-4, 6-5, 6-7, 6-13, 7-21, 7-22,
7-26, 8-21, 8-24Cos 6-1, 8-7, 8-10, 8-21, 8-24, 8-33CosH 8-7, 8-8, 8-32Covariance 6-11, 6-12CS7500 OV-2, 7-37CSAT3 OV-2, 7-38
DData, Read, Restore 9-3DataEvent 4-11, 6-1, 6-4, 6-5, 6-6, 6-7DataInterval 4-4, 4-5, 6-1, 6-2, 6-3, 6-4, 6-5, 6-7,
6-18, 7-22, 7-26, 8-23, 8-27, 9-1, 9-18DataTable EndTable OV-8, 2-1, 3-7, 4-4, 4-5, 4-9,
6-1, 6-2, 6-4, 6-5, 6-7, 6-8, 6-14, 6-15, 6-18,7-22, 7-26, 8-21, 8-23, 8-24, 8-27, 8-28, 9-1,9-2, 9-3, 9-18
Delay 3-3, 3-5, 3-19, 3-20, 4-10, 6-4, 6-5, 6-7, 7-5,7-8, 7-10, 7-13, 7-30, 7-38, 9-4
Dim 5-1, 5-2, 5-3, 6-14, 6-17, 7-21, 7-22, 7-26, 8-1,8-3, 8-4, 8-5, 8-7, 8-9, 8-15, 8-16, 8-18, 8-19,8-20, 8-21, 8-24, 8-29, 8-30, 8-31, 8-32, 8-33,9-1, 9-2, 9-5, 9-6, 9-8, 9-10, 9-16, 9-17, 9-20
Do 9-5, 9-6DSP4 OV-2, 6-1, 6-8
EExciteCAO OV-2, 7-13ExciteI OV-2, 7-14ExciteV 7-14Exp 8-9, 8-15, 8-33
FFFT OV-6, 2-1, 4-1, 6-12, 6-13, 6-14, 6-15, 9-14FieldNames 4-4, 4-10, 5-1, 6-14FileManage 9-6, 9-7FileMark 6-4, 9-7FillStop 6-5For ... Next Statement 9-7, 9-8, 9-9Frac 8-8
GGetRecord 8-11
HHistogram 2-1, 6-16, 6-17, 6-18, 6-19, 6-20, 6-22,
6-24, 6-25, 6-26, 9-14Histogram4D 6-18

Index
Index-2
IIf ... Then ... Else Statement 9-9, 9-10, 9-11IMP 8-13Int, Fix 8-14INT8 Interval Timer 7-39, 7-40, 7-41
LLevelCrossing 6-19, 6-22Log 8-9, 8-15, 8-16, 8-33
MMaximum 2-11, 4-1, 4-2, 6-3, 6-12, 6-23MaxSpa 8-16, 8-17MemoryTest 8-11Minimum 2-11, 4-1, 4-2, 6-3, 6-14, 6-19, 6-23,
6-24MinSpa 8-17Mod 6-2, 8-17, 8-18Move 8-18
NNOT 8-18
OOpenInterval 6-3, 6-4Or 4-8, 8-19, 8-20
PPanelTemp 3-8, 4-1, 4-2, 4-4, 6-4, 6-5, 7-15, 7-22,
7-26, 9-18, A-1, A-2PeakValley 8-20, 8-21PeriodAvg 7-19, 7-21PortGet 6-18, 7-21, 7-22PortSet 1-11, 7-21, 7-22, 7-28Power Off OV-4, 6-3, 9-11, 9-12, A-3Print 9-12PRT 7-29, 8-22Public 2-5, 3-7, 4-2, 4-4, 5-1, 5-2, 5-3, 6-4, 6-5,
6-7, 6-8, 6-14, 6-18, 7-21, 7-22, 7-26, 8-2, 8-3,8-8, 8-19, 8-21, 8-23, 8-27, 8-30, 8-32, 9-1,9-12, 9-18
PulseCount 3-20, 6-18, 7-23, 9-2PulseCountReset 7-25
RRainFlow 6-24, 6-25Randomize 8-22, 8-29ReadIO OV-2, 7-21, 7-25RealTime OV-1, OV-7, OV-8, OV-9, 2-3, 2-6,
7-21, 8-23, 9-1, 9-2RectPolar 8-24Reset Table 2-5, 6-5, 7-26, 9-13Resistance OV-2, OV-3, 3-17, 3-18, 3-19, 7-6,
7-11, 7-12, 8-22RMSSpa 8-25Rnd 8-22, 8-25, 8-26, 8-28, 8-29RunDLDFile 9-12, 9-13
SSample 2-11, 3-7, 6-3, 6-5, 6-7, 6-14, 6-26, 7-22,
8-21, 8-23, 8-24, 8-27, 9-1, 9-18Scan OV-5, 3-7, 3-20, 3-21, 3-22, 4-3, 4-4, 4-6,
4-7, 6-2, 6-4, 6-5, 6-7, 6-15, 6-16, 6-18, 7-13,7-14, 7-16, 7-17, 7-21, 7-22, 7-23, 7-25, 7-26,8-7, 8-8, 8-12, 8-21, 8-23, 8-27, 8-28, 8-30, 9-2,9-4, 9-12, 9-13, 9-14, 9-17, 9-18, 9-19, A-1,A-3
SDMSpeed OV-2, 7-34SDMTrigger OV-2, 7-30, 7-31, 7-37Select Case Statement 9-15, 9-16Sgn 8-29, 8-33Sin 6-13, 6-15, 8-3, 8-10, 8-21, 8-24, 8-29,
8-30, 8-33SinH 8-30, 8-32Sleep 1-1, 9-16, 9-17Slow Sequence 7-17, 7-23, 9-14, 9-17, A-3, A-4Sqr 8-30, 8-31, 8-33Station Name 2-4, 2-10, 5-3, A-1, 1-2StdDev 6-26StdDevSpa 8-31StrainCalc 8-26, 8-27, 8-28Sub, Exit Sub, End Sub 5-3, 5-4, 8-23SW12 OV-2, OV-3, 1-9, 1-10, 7-26
TTan 8-4, 8-5, 8-31, 8-32, 8-33TANH 8-27TCDiff OV-2, 3-8, 4-4, 4-6, 6-4, 6-5, 6-7, 7-3, 7-5,
7-22, 7-23, 7-26, 7-30, 7-42, 7-45, 8-22TCSE OV-2, 3-8, 7-4Timer 8-22, 9-20, 9-21
Index
Index-3
TimerIO OV-2, 7-27Totalize 6-27, 9-1
UUnits 2-10, 2-11, 4-4, 4-5, 4-6, 5-3, 6-2, 6-3, 6-4,
6-5, 6-7, 6-12, 6-13, 7-5, 7-15, 7-22, 7-26, 7-27,7-28, 7-30, 7-36, 7-42, 9-4, 9-11, 9-13,9-14, 9-19
VVoltDiff OV-2, 7-3, 8-7, 8-8, 8-30, 8-32, 9-17VoltSE OV-2, 4-10, 7-3, 9-17
WWhile…Wend 9-6, 9-21, 9-22WorstCase 4-11, 6-1, 6-6, 6-7WriteIO OV-2, 1-11, 7-28

Index
Index-4
This is a blankpage.

This is a blank page.
Campbell Scientific Companies
Campbell Scientific, Inc. (CSI) 815 West 1800 North Logan, Utah 84321 UNITED STATES
www.campbellsci.com [email protected]
Campbell Scientific Africa Pty. Ltd. (CSAf)
PO Box 2450 Somerset West 7129
SOUTH AFRICA www.csafrica.co.za
Campbell Scientific Australia Pty. Ltd. (CSA) PO Box 444
Thuringowa Central QLD 4812 AUSTRALIA www.campbellsci.com.au [email protected]
Campbell Scientific do Brazil Ltda. (CSB)
Rua Luisa Crapsi Orsi, 15 Butantã CEP: 005543-000 São Paulo SP BRAZIL
www.campbellsci.com.br [email protected]
Campbell Scientific Canada Corp. (CSC)
11564 - 149th Street NW Edmonton, Alberta T5M 1W7
CANADA www.campbellsci.ca
Campbell Scientific Ltd. (CSL) Campbell Park
80 Hathern Road Shepshed, Loughborough LE12 9GX
UNITED KINGDOM www.campbellsci.co.uk [email protected]
Campbell Scientific Ltd. (France)
Miniparc du Verger - Bat. H 1, rue de Terre Neuve - Les Ulis
91967 COURTABOEUF CEDEX FRANCE
www.campbellsci.fr [email protected]
Campbell Scientific Spain, S. L.
Psg. Font 14, local 8 08013 Barcelona
SPAIN www.campbellsci.es [email protected]
Please visit www.campbellsci.com to obtain contact information for your local US or International representative.