cpwf working paper - food and agriculture organization of the
TRANSCRIPT

cpwf working paper 1
cpwf working paper
01Paul J. Block, Ph.D.
International Research Institute for Climate and Society, Columbia University, New York
2008
Mitigating the Effects of Hydrologic Variability in Ethiopia An Assessment of Investments in Agricultural
and Transportation Infrastructure, Energy and Hydroclimatic Forecasting

cpwf working paper 2
AcknowlEdgEMEnTs
This paper is a contribution to the synthesis work of the cgIAR challenge Program on water and Food’s Theme 5, ‘The global Food and water system’. It was also supported by the UsAId-cgIAR linkage grant.
Block, Paul, J. 2008. Mitigating the Effects of Hydrologic Variability in Ethiopia: An As-sessment of Investments in Agricultural and Transportation Infrastructure, Energy, and Hydroclimatic Forecasting. CPWF Working Paper 01 The cgIAR challenge Program on water and Food, colombo, sri lanka. 53pp.
keywords: agro-economic model, Ethiopia, irrigation, road infrastructure, investment, management, climate change
copyright © 2008, by cPwF. All rights reserved.
You can find the CPWF Working Paper series online at www.waterandfood.org.
The Challenge Program on Water and Food (CPWF), an initiative of the Consultative Group on International Agricultural Research (CGIAR), contributes to efforts of the inter-national community to ensure global diversions of water to agriculture are maintained at the level of the year 2000. It is a multi-institutional research initiative that aims to increase water productivity for agriculture—that is, to change the way water is managed and used to meet international food security and poverty eradication goals—in order to leave more water for other users and the environment. The CGIAR Challenge Program for Water and Food’s Working Paper series captures the Program’s work in progress that is worthy of documentation before a project’s comple-tion. Working papers may contain preliminary material and research results - data sets, methodologies, observations, and findings that have been compiled in the course of research, which have not been subject to formal external reviews, but which have been reviewed by at least two experts in the topic. They are published to stimulate discussion and critical comment.

cpwf working paper 3
ABsTRAcT
Ethiopia is at a critical crossroads with a burgeoning population, a severely depressed national economy, insufficient agricultural production, and a minimal number of devel-oped energy sources. This study assesses how investment in and management of water resources, together with related policy reforms, may mitigate the negative effects of hydrologic variability on the performance and structure of the Ethiopian economy. This is accomplished by identifying interventions both aimed at managing hydrologic variabil-ity, and at decreasing the vulnerability of the economy to potential shocks. The areas of focus include increased infrastructure for agricultural irrigation and roads, large-scale hydropower generation, and a precipitation forecast model.
A dynamic climate agro-economic model of Ethiopia is utilized to assess irrigation and road construction investment strategies in comparison to a baseline scenario over a 12-year time horizon. Although both investments create positive economic boosts, the irrigation investment, on average, slightly outperforms the road investment, producing an average gdP growth rate of 0.95% versus 0.75% over the baseline scenario, along with lower associated poverty and malnutrition rates. The benefit-cost (b-c) ratios for the projects also favor the irrigation investment.
The upper Blue nile basin harbors considerable untapped potential for irrigation and large-scale hydropower development and expansion. An integrated model is employed to assess potential conditions based on hydrologic variability and streamflow policies. The model indicates that large-scale development typically produces b-c ratios from 1.6-2.1 under historical climate regimes for the projects specified. Climate change scenar-ios indicate potential for small b-c increases, but reflect possible significant decreases. stochastic modeling of scenarios representing a doubling of the historical frequency of El niño events indicates b-c ratios as low as 1.0 due to a lack of timely water. An evaluation of expected energy growth rates reinforces the need for significant economic planning and the necessity of securing energy trade contracts prior to extensive devel-opment. A Ramsey growth model for energy development specifies project multipliers on total gdP over the 100-year simulation ranging from 1.7-5.2, for various climatologic conditions.
The Blue nile basin also holds possibility for improvement in rain-fed agricultural pro-duction through precipitation forecasting. one-season lead predictors for forecasting of the Kiremt season precipitation are identified from the large scale ocean-atmosphere-land system. This forecast is of tremendous value, giving farmers crucial indication of potential future climatic conditions, and is a solid improvement over climatology, as currently utilized by the Ethiopian national Meteorological Institute. Using crop yield potential from the 1961-2000 period and general seed costs, farmers basing cropping decisions on the forecast model, in lieu of climatology, would have experienced superior net incomes.
cpwf working paper 4
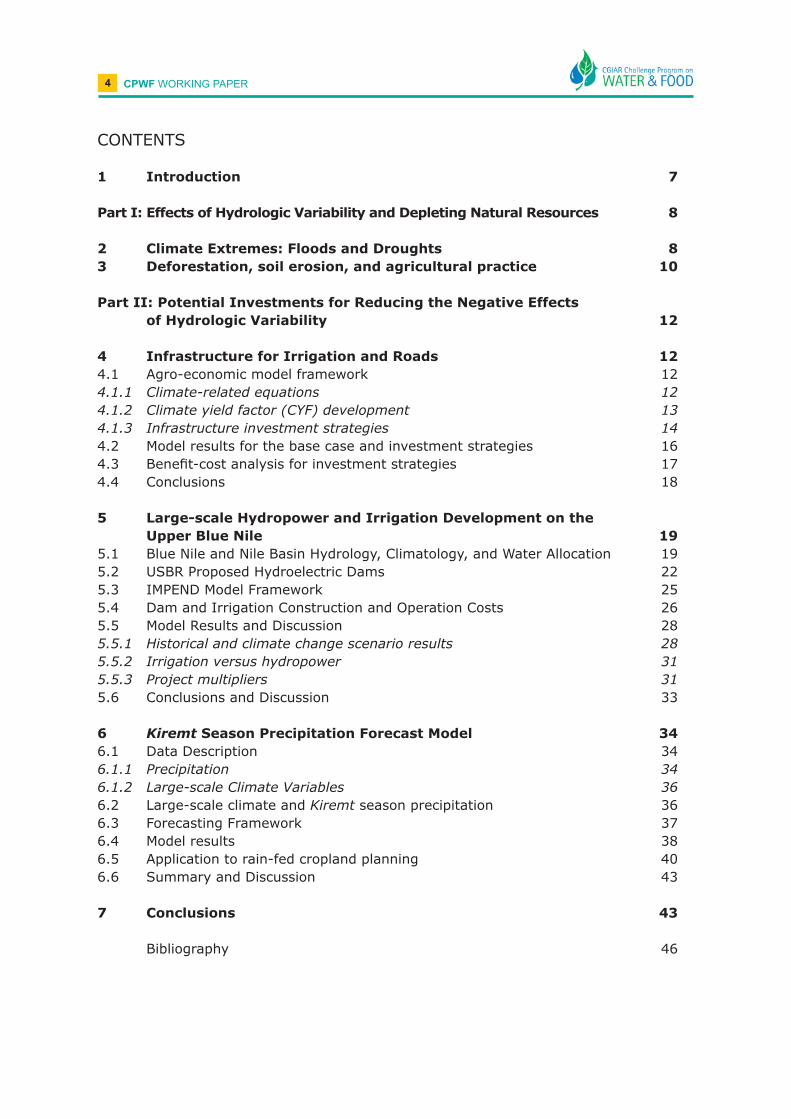
conTEnTs
1 Introduction 7
Part I: Effects of Hydrologic Variability and Depleting Natural Resources 8
2 Climate Extremes: Floods and Droughts 83 Deforestation, soil erosion, and agricultural practice 10
Part II: Potential Investments for Reducing the Negative Effects of Hydrologic Variability 12
4 Infrastructure for Irrigation and Roads 124.1 Agro-economic model framework 124.1.1 Climate-related equations 124.1.2 Climate yield factor (CYF) development 134.1.3 Infrastructure investment strategies 144.2 Model results for the base case and investment strategies 164.3 Benefit-cost analysis for investment strategies 174.4 conclusions 18
5 Large-scale Hydropower and Irrigation Development on the Upper Blue Nile 19
5.1 Blue nile and nile Basin Hydrology, climatology, and water Allocation 195.2 UsBR Proposed Hydroelectric dams 225.3 IMPEnd Model Framework 255.4 dam and Irrigation construction and operation costs 265.5 Model Results and discussion 285.5.1 Historical and climate change scenario results 285.5.2 Irrigation versus hydropower 315.5.3 Project multipliers 315.6 conclusions and discussion 33
6 Kiremt Season Precipitation Forecast Model 346.1 data description 346.1.1 Precipitation 346.1.2 Large-scale Climate Variables 366.2 large-scale climate and Kiremt season precipitation 366.3 Forecasting Framework 376.4 Model results 386.5 Application to rain-fed cropland planning 406.6 summary and discussion 43
7 Conclusions 43
Bibliography 46

cpwf working paper 5
lIsT oF TABlEs
Table 4.1: Base strategy economic indicators. 16Table 4.2: Irrigation strategy economic indicators. 16Table 4.3: Roads strategy economic indicators. 16Table 4.4: Irrigation and Roads combination strategy economic indicators. 17Table 4.5: Investment simulations: gdP and poverty rates. 17Table 4.6: Estimated costs for irrigation, roads and combination investments. 18Table 4.7: Benefit-cost ratios for investments. 18
Table 5.1: Proposed dam characteristics. 24Table 5.2: Proposed reservoir and power characteristics. 24Table 5.3: construction and operation costs for dams. 27Table 5.4: distribution of costs for initial dam construction. 27Table 5.5: Benefit-cost ratios for two flow policies for historical and
climate change scenarios. 28Table 5.6: Multipliers on total gdP utilizing IMPEnd and 0% prescribed
energy models. 32Table 5.7: Multipliers on total gdP utilizing IMPEnd and 3% prescribed
energy models. 32
Table 6.1: Potential large-scale predictors of kiremt season precipitation. 38Table 6.2: Exceedance and non-exceedance probabilities for forecasting
wet and dry years. 40Table 6.3: Yields, costs, and revenues associated with high and average
quality maize seeds assuming ideal precipitation conditions. 41

cpwf working paper 6
lIsT oF FIgUREs
Figure 2.1: 10-day running mean rainfall (mm) plots for 11 stations in Ethiopia.. 8Figure 2.2: Persons affected in Ethiopian drought 2003. 9Figure 2.3: Flood affected areas as of August, 2006, in Ethiopia.. 10
Figure 5.1: The nile basin. 20Figure 5.2: contributing rivers to the main nile discharge at lake nasser. 22Figure 5.3: Proposed hydroelectric dams along the Blue Nile in (a) plan and (b)
cross-sectional views, as proposed by the UsBR. 23Figure 5.4: designations for dam heights and heads. 24Figure 5.5: general schematics of IMPEnd stagger timeline. 26Figure 5.6: PDFs of net present worth for the historic (H), La Niña (LN),
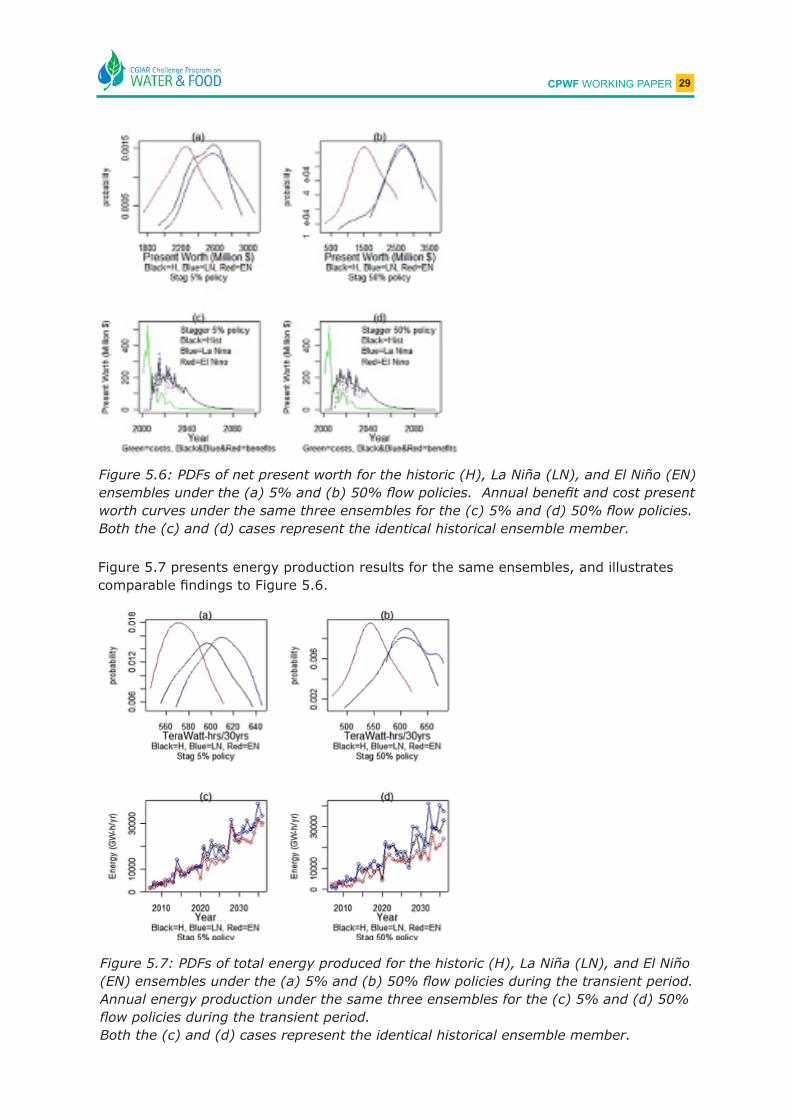
and El Niño (EN) ensembles under the (a) 5% and (b) 50% flow policies. Annual benefit and cost present worth curves under the same three ensembles for the (c) 5% and (d) 50% flow policies. 29
Figure 5.7: PDFs of total energy produced for the historic (H), La Niña (LN), and El Niño (EN) ensembles under the (a) 5% and (b) 50% flow policies during the transient period. Annual energy production under the same three ensembles for the (c) 5% and (d) 50% flow policies during the transient period. 29
Figure 5.8: Cumulative storage for the first ten years of each historical (top) and El Niño (bottom) ensemble member for the 5% and 50% flow policies. 30
Figure 6.1: The upper Blue nile basin, Ethiopia. 35Figure 6.2: Correlation map of the first principal component of UBN summer
precipitation and global sea-surface temperatures. 37Figure 6.3: local polynomial modeling approach forecast results. 39Figure 6.4: PDF for wet (top) and dry (bottom) years. 39Figure 6.5: stylized representation of yield response of maize to precipitation. 41Figure 6.6: cumulative income for Farmers A-d over a 40-year span.. 42Figure 6.7: cumulative income for Farmers A-d over a 10-year span. 43

cpwf working paper 7
1 InTRodUcTIon
Ethiopia, one of the poorest countries in the world, is desperate to support its burgeon-ing population. A heavy reliance on agriculture, combined with a susceptibility to fre-quent climate extremes, has left it in a precarious position, striving not only to stay on par, but to prevent vast numbers of people from falling deeper into disparity. Hydrologic year-to-year variability has long contested Ethiopia’s ability to prosper. Eighty-five per-cent of the population lives in rural areas, with most being subsistence farmers. Even several successful growing seasons may quickly be nullified by one devastating year. The future of the country and her people, though, is not without promise. Ethiopia pos-sesses immense water resources and agricultural potential, predominantly all of which remain untapped. Unfortunately, past civil wars and political instability, combined with limited financial resources or foreign investment, have hampered efforts to develop these resources.
The focus of this work is to evaluate relevant investments in agriculture, transporta-tion, energy, and forecast modeling that may lead to a country less vulnerable to hy-drologic variability. controlling or preventing hydrologic variability is improbable, as it is a product of climatic conditions; combating the devastating effects of this variability, both physically and economically, however, does appear feasible. Irrigation of crops leads to less susceptibility in dry or drought years, while transportation infrastructure allows a product to reach a market, even in wet periods. Energy development, specifi-cally through hydropower, leads to a sustainable electrical source and streamflow man-agement. Finally, a forecast model, devised for prediction of seasonal rains, provides crucial cropping information to farmers concerning quality and quantity.
This paper is divided into two sections. The first section outlines factors that lead to hydrologic variability and, when tied to current practices, how it creates conditions of vulnerability. The goal of the section is to qualitatively depict the current state of af-fairs governed by this variability. Chapter 2 briefly assesses the climatic conditions of the country and their predominant effects on agriculture and the economy. chapter 3 presents the depletion and loss of critical natural resources that are exacerbated by hydrologic variability.
The second section, which constitutes the bulk of this paper, focuses on evaluation of potential investments that may help to mitigate or alleviate some of Ethiopia’s vulner-ability to hydrologic variability. Each chapter addresses a separate investment project and policy, which attempts to negate the effects of hydrologic variability by boosting the economy, either on a country-wide scale, or on an individual farmer basis. chapter 4 weighs investment in irrigation for agriculture versus investment in roads by means of a benefit-cost analysis and the ensuing investment effect on common economic indicators. chapter 5 explores the possibilities of investment in hydropower and irrigation, with project success measured by benefit-cost ratios and resulting multipliers on gross do-mestic product. Chapter 6, the final investment strategy evaluated, focuses on a local level, demonstrating the benefits of including a precipitation forecast in farm planning. The paper finishes with a concluding chapter.

cpwf working paper 8
PaRt I: EFFEcTs oF HYdRologIc VARIABIlITY And dEPlETIng nATURAl REsoURcEs
2 Climate Extremes: Floods and DroughtsThe climate in Ethiopia is geographically quite diverse, due to its equatorial positioning and varied topography. Three general temperature zones are apparent – cool, temper-ate, and hot – categorized predominantly by elevation. The cool zone incorporates parts of the northwestern plateau, at elevations above 2,400 meters; the temperate zone lies between 1,500 and 2,400 meters, and supports most of the population. The hot zone, at elevations below 1,500 meters, constitutes much of the eastern and southern por-tions of the country, as well as the tropical valleys in the west and north.
Precipitation patterns vary widely throughout the country due to elevation, atmospheric pressure patterns, and local features. Figure 2.1 presents monthly precipitation distri-bution for most parts of the country, and clearly illustrates the diversity between re-gions. In the lowlands, rainfall is typically quite meager, whereas the southwest, cen-tral, and northwest regions receive quite appreciable quantities, but in varying patterns. In the southwest, a relatively even month-to-month distribution may be observed, while the dominant pattern in the northwest and western regions, containing the Blue nile basin, is generally associated with tropical monsoon-type behavior, delivering significant June-september rainfall. other regions throughout the country, not necessarily adja-cent, demonstrate a distinct bimodal pattern.
Figure 2.1: 10-day running mean rainfall (mm) plots for 11 stations in Ethiopia..Under the station name, the top number represents mean and bottom standard devia-tion for the annual rainfall (mm) at the station.Courtesy of Seleshi and Zanke (2004).

cpwf working paper 9
It is the occurrence of climate extremes, or severe hydrologic variability, both annually and seasonally, which most seriously impacts regional agricultural and economic pro-duction, placing the populous in a susceptible situation. Unfortunately, these extreme conditions have become all too commonplace. whether the climate condition presents as drought or flood, it is likely that crop yields will either be seriously reduced or nonex-istent. For a country in which the vast majority of people are subsistence farmers, this correlates to a very sober condition.
drought has regrettably been long associated with Ethiopia, with records indicating such conditions as far back as 250 Bc. Additionally the frequency has also been increasing. In the 1970s and 1980s, droughts typically occurred on average once per decade; pres-ently, droughts are anticipated to occur about once in every three years (USAID, 2003). As 93% of all crops rely on rain for irrigation, this presents a serious conflict. Droughts need not extend the entire growing season, but may be detrimental even if existent only for short periods during critical growth stages. This places an unbelievable burden upon farmers, the national food and agriculture centers, and international assistance organi-zations. In addition, ranchers unable to lead their livestock to scarce water sources may quickly lose their entire herd. Although any given drought is rarely country-wide, any losses are difficult to absorb for a nation working at the margins, let alone management and distribution of food aid to effected regions. Figure 2.2 displays the large geographic area affected during the 2003 drought.
Figure 2.2: Persons affected in Ethiopian drought 2003.Courtesy of Disaster Prevention and Preparedness Agency.
Flooding within Ethiopia may be equally devastating, but often more localized than droughts. It may cause damage to crops, rotting the roots and killing the plant, dam-age to roads and infrastructure, and damage to animal and human lives in extreme situations. limited or decrepit infrastructure increases the possibility for loss of life during flood conditions. Additionally, animals are often not capable of handling the cold that may abruptly come with the rains (Smith, 2006). Figure 2.3 presents flood affect-ed areas as of August, 2006.

cpwf working paper 10
Figure 2.3: Flood affected areas as of August, 2006, in Ethiopia..Courtesy of United Nations World Food Program.
Many agricultural communities are inept to deal with either drought or flood conditions, yet often ravaged by both. In times of drought, they are unable to divert limited water from necessary domestic uses to thirsty crops; in times of flooding, they are ill-equipped to prevent the surging waters from carrying away precious topsoil and nutrients. Irriga-tion infrastructure certainly aids in alleviating drought conditions, but flood protection is not as straightforward. some communities have attempted to build levies, only to see them washed away. In most low-lying places, where agricultural conditions are good, it is nearly impossible to escape the excessive runoff or overflowing stream banks of a large storm event.
The economic impacts of floods and droughts vary depending upon the degree of sever-ity, but knowingly have a lasting negative influence. Both may be of a localized or wide-spread nature, and include hundreds to millions of people. In the recent 2002-2003 drought, it was estimated that 21% of the entire population required food aid, with international organizations and governments donating hundreds of millions of dollars.
3 Deforestation, soil erosion, and agricultural practiceMany of the natural resources within Ethiopia have been on the decline for decades, due to hydrologic variability and slow economic progress. The effects of this are evident throughout the country, especially concerning agricultural management and production, irrigation practices, water recharge and distribution, and local climates.

cpwf working paper 11
currently, 83 per cent of Ethiopia’s population lacks access to electricity, with 94 per cent still relying on fuel wood for daily cooking and heating (Tegenu, 2006). The obvi-ous effect of this is deforestation at an alarming rate. Forty years ago, 40 per cent of the country was covered with forests. Presently, estimates reveal that a mere three per cent of natural forests remain, and this resource may completely disappear in a matter of 15 to 20 years if current practices remain unchanged. (Bhalla, 2002). However, with-out an alternate source of electricity, it is unlikely that significant shifts away from wood for fuel will occur in the very near future unless the source is completely eliminated.
The need for fuel is only one competing demand on forested areas within Ethiopia. Other culprits of deforestation include agriculture, wild fires, and wood building materi-als. A ballooning population, tripling in the past 50 years, has created a demand for increased agricultural croplands and ranges for grazing, made available by clearing land. Wild fires consume an estimated 200,000 hectares of forests each year (Bhalla, 2002). It is common practice for farmers to deliberately set fire to their cropland to prepare for planting, however each year a few fires break out on a much larger scale, causing im-mense damage.
Beyond the loss of forests as a resource for fuel or building materials, deforestation also influences the micro climate and ecology. Local climatic changes have been reported by older farmers who began farming in times when their crops were surrounded by heav-ily forested areas, but are now surrounded by open, degraded, space. The predominant shift noted includes increasing temperatures and decreasing precipitation; even minor changes may have serious agricultural implications (IRIN, 2002). Not surprisingly, the continual decline of the forest population perpetuates this condition. An equally impor-tant ramification of deforestation more closely related to the hydrologic focus of this paper is ecological degradation. The absence of treed areas allows for precipitation to run off at a much faster rate. This has important implications for both groundwater and soil erosion. Increased runoff rates allow for less infiltration, which fails to recharge the groundwater, resulting in lower water tables (critical for rain-fed agriculture) or reduced flow in streams that intercept this source (Dubale, 2001). Soil erosion facilitates mul-tiple challenges. not only is the fertility of the cropland reduced, as an estimated one billion cubic meters of topsoil are lost each year (People’s Daily, 2002), but the receiving stream now carries a much higher sediment load, which may clog irrigation systems or render water unsuitable for domestic use. The rugged and sloped terrain, typically con-taining little to no terracing, coupled with regular intense rainfall, exacerbates the rate of sediment transport.
conservation measures to protect forested areas and reduce soil erosion have been implemented by the government since the mid-1970s, but with limited success (Bishaw, 2001). Common measures include building terraces and planting tree seedlings to limit soil erosion. Unfortunately, Ethiopia is overwhelmed with more immediate issues, and conservation measures are often demoted to a lower priority list. More recent efforts have encouraged local participation and management of afforestation practices to limit soil erosion and supply the local community with a necessary resource (Bishaw, 2001).The outcomes of an irreversable ecological imbalance await oncoming generations if current practices continue. It is not trivial to assess the dampening economic effects of deforestation, soil erosion, and degrading agricultural practices, nor is it the aim of this study, but management of these resources, coupled with alternatives explored in the following chapters, may serve to slow their effect.

cpwf working paper 12
PaRt II: PoTEnTIAl InVEsTMEnTs FoR REdUcIng THE nEgATIVE EFFEcTs oF HYdRologIc VARIABIlITY
This portion of the study focuses on potential investment strategies within Ethiopia in an effort to relevantly and realistically assist mitigation of the negative effects of hydrologic variability. The hope is that these strategies may provide insights into how Ethiopia should best proceed in the short and long term, on regional and country levels alike. goals set forth by the Ethiopian government are included explicitly, including plans for development in agriculture, water resources, and roadway infrastructure.
4 Infrastructure for Irrigation and RoadsTwo infrastructure investments, irrigation for agriculture and roadway development, are evaluated in this chapter to assess their respective influence on the Ethiopian economy. The irrigation investment focuses predominantly on the agricultural sector, and assumes to provide timely and sufficient irrigation to crops. The roads investment crosses over between the agricultural and non-agricultural sectors, providing a conduit for the flow of products to a viable market. Both are tied to hydrologic variability: the failure of crops during drought conditions, and the failure of crops and the impassability of roads dur-ing flooding conditions. Chapter 4 outlines the model utilized for evaluation, followed by results and recommendations.
4.1 agro-economic model frameworkAn agro-economic model for Ethiopia developed by the International Food Policy Re-search Institute (IFPRI), modified to account for climate variability, is utilized to com-pare these two infrastructure investments (Diao et al., 2005; Block et al., 2006a). It is designed to assess the benefits of investment strategies (costs are implemented ex-ternally) and afford recommendations based on forecasts of economic indicators. The model, which encompasses Ethiopia’s 11 administrative regions and 56 zones, attempts to stimulate growth through agricultural and non-agricultural investment strategies. It is agriculturally focused, with 34 agricultural commodities (cereals, cash crops, and live-stock products), yet includes two aggregate non-agricultural commodities as well. Both agricultural production and consumption are defined at the zonal level; the demand side is further disaggregated into rural and urban sectors.
The model was expanded to include an agricultural water extension in order to capture the important links between water demand-supply and economic activity in the agricul-ture sector. given its high dependency on rainfall for agricultural production and weak linkages between domestic prices at the regional level and world markets, hydrologic variability has potentially serious impacts on both agriculture and the whole economy. Moreover, with high transportation costs and poor access conditions to distant mar-kets, the local impact of hydrologic variability cannot always be buffered or amelio-rated through market links to other regions. There can be significant ‘threshold’ effects whereby prices have to rise above critical values before inducing trade with other re-gions or fall below a certain level to get access to world markets.
4.1.1 Climate-related equationsgeneral multi-market model equations, with brief description, are included in Appendix I of Block et al. (2006a). The yield function, representing all agricultural commodities, is of primary interest and re-presented in Equation 4.1, with further description.

cpwf working paper 13
iZRtiZRtiZR PY ,,
,,,ti,Z,R,,,, YA a= (4.1)
YR,Z,i is the yield for crop i in zone Z of region R. PR,Z,i is the producer price for the same commodity, i, while YAR,Z,i represents a climate shift parameter. This parameter de-pends on a monthly climate-yield factor (CYF), which is variable to reflect the true dy-namic climate. The climate shift parameter is defined in Equation 4.2. ( )
iZRYtiZRtiZR gCYF,,
1YAYA ti,Z,R,1,,,1,,, +⋅= ++ (4.2)
CYF is crop and zone specific, depending on the drought or flood-tolerant ability of the crop and the local climate condition. gY is the annual growth rate in yield productivity, based on historical data, and also varies by zone and crop. For irrigated crops, YAR,Z,i is not climate-yield factor dependent, and is assigned a value 50 percent higher than YAR,Z,i (producing a full yield) for the same crop depending on rainfall only. This enhancement can be attributed to additional fertilizers and pesticides and better seed a farmer will apply to a crop, due to their confidence in knowing that sufficient water will be available for irrigation, and a good yield will follow, barring any natural disaster.
4.1.2 Climate yield factor (CYF) developmentThe development of the climate-yield factor (CYF) is based on procedures summarized in the United Nation’s Food and Agriculture Organization’s (FAO) Publication 33, Yield Response to water, and Publication 56, crop Evapotranspiration: guidelines for com-puting crop water Requirements. The cYF for each crop in each zone is a single value that attempts to encompass crop location, soil and hydrologic characteristics, planting dates, crop duration, effective precipitation, and evapotranspiration (Rogers, 2004). It is essentially a measure, using all the aforementioned parameters, of the yield potential of rain-fed crops, based on water constraints or overabundance, for a given crop. Val-ues for CYF range from 0 to 1.0. A CYF of 1.0 implies ideal water conditions (i.e., all required water is available) for the crop. This, of course, does not ensure a full yield, as other variables, such as seed quality, pests, and natural disasters, to name a few, may still reduce the final yield; it only implies that water availability or overabundance will not reduce the yield. A cYF of 0.8, therefore, indicates that the yield of a crop is reduced to 80 percent of the full potential yield by water constraints or overabundance alone. cYF is a function of crop and actual evapotranspiration, as well as ky, the yield response factor, as outlined in Equation 4.3. This equation accounts for limited water or drought-related aspects.
−⋅−=
CS
CSCSCS ETC
ETAKyCYF
,
,,, 11
(4.3)
S refers to either a seasonal or crop stage value; c implies the specific crop considered. Ky values are predefined for each crop-stage and for the season as a whole, and can be found in FAo Publication 33. In general, ky values below 1.0 tend to indicate resistance to drought, or drought tolerance, while values above 1.0 point toward drought sensitiv-ity. It is imperative to analyze both seasonal values as well as crop-stage values, as one detrimental crop-stage could potentially ruin a crop. The cYF is therefore calculated for each crop-stage, including vegetation, flowering, yield, and ripening, and for the season as a whole. Seasonal actual evapotranspiration (ETA) and potential crop evapotrans-piration (ETC) or crop-stage ETA and ETC are correspondingly used. Once all the crop-stage and seasonal CYF values are established, the limiting CYF value (i.e., the lowest value) for each crop in each zone is retained. Typically, it is the seasonal CYF that pro-

cpwf working paper 14
duces the most restrictive value. climate extremes producing an excess of water are also apparent, and can equally dev-astate agricultural production and existing infrastructure. Too much precipitation can flood crops, rot or suffocate roots, wash out roads, and instigate an economic situation not entirely different than during drought conditions. The cYFs based on FAo recom-mendations appropriately model drought conditions, but do not consider conditions when excessive water is applied, and are therefore further modified by the addition of a flood factor. The flood factor (FF) is essentially a dynamic component that forces a de-crease of the CYF if the year is deemed significantly wet, in terms of precipitation. The criterion includes examining the standard normal distribution variable z, for precipitation data, as defined in Equation 4.4,
sm−
==xFFz
(4.4)
where x is the observed (actual) monthly precipitation, ì is the mean monthly precipita-tion, and ó is the standard deviation of the monthly precipitation data, all for a given zone. The flood factor is calculated twice in the evaluation of flooding on agricultural commodities: once during the vegetative/flowering stage, and once during the harvest stage. The exact months of these two stages are crop specific, but generally correspond with May through July for vegetative/flowering and August through October for harvest, representing the times when the crop is most vulnerable to flooding, and when the yield is most likely to be shocked negatively. The largest FF value for each of these two crop stages of each year is retained for evaluation. The magnitude of the FF, and its corre-sponding probabilistic chance of occurring, determines the extent to which the climate-yield factors are affected through a series of CYF reduction equations (not included.)
4.1.3 Infrastructure investment strategies Two major strategies —investment in irrigation for agriculture and investment in road construction and maintenance—are simulated in the model. The model brings agricul-tural supply, demand, and market opportunity issues together to assess the alternatives in investment strategies. The analysis gives a broad picture about agricultural growth and poverty reduction, and reveals some important economic linkages among agricul-tural sectors, between demand and supply, between exports and domestic markets, and between production and farmer income. It is not the purpose of the model to guide a specific investment decision for any agricultural sector in a precise region. Additionally, the analysis reveals the complexity of economic linkages and trade-offs among different investment goals. Model results are limited to four economic indicators for this study, including total gross domestic product (GDP) growth rate, agricultural GDP growth rate, non-agricultural gdP growth rate, and poverty rate.
The base strategy is considered a business-as-usual strategy, and predicts future con-ditions if current practices remain unchanged with no additional infrastructure invest-ments or major policy changes. Its parameters stay within the confines of historical growth rates.

cpwf working paper 15
The irrigation strategy is similar to the base framework, with the addition of implement-ing the Irrigation development Program of the water sector development Plan, con-structed by the Ethiopian Ministry of water. Approximately 200,000 hectares of crop area are currently being irrigated in Ethiopia, accounting for just over two per cent of all cropland. The new program details the addition of 274,000 hectares of irrigated crop-land, more than doubling the current investment. Just under one-half (46 per cent) of the newly irrigated crops will be devoted to small-scale projects, and the remainder to large and medium-scale projects. one-half of the newly irrigated cropland is assumed to be cereal crops, and one-half cash crops.
The roads strategy models transportation plans, as drawn up by the Ethiopian govern-ment. The goal is to improve road conditions, reduce transportation costs, and increase farmers’ accessibility to major markets. Ethiopia’s road network currently consists of approximately 3,800 kilometers of paved road and 29,000 kilometers of unpaved, gravel or earth roads. This density is reportedly below the African average, and results in 70 per cent of all farmers not being within a one-half day’s walk of a paved road. The Ethi-opian government’s 10-year Road sector development Program includes creating new roads and maintaining existing ones. The first half of the Program (1997-2002) focused on rehabilitating the existing road network with only modest amounts of new road, and was substantially successful. The second half of the program also has a rehabilitation component, but aims to increase the road network by 5,000 to 8,000 kilometers of all types of road. Road construction costs in Ethiopia are highly variable and relatively unknown, due to the extreme terrain and torrential rains. For the purpose of a roads strategy, two fundamental principles are utilized as a surrogate to reflect this infra-structure improvement. The first is to gradually lower the marketing margins between producers and consumers and between surplus and deficit regions over the 12 years, and the second is to increase the productivity of the service sector, also gradually over the same timeframe.
The final strategy incorporates irrigation and road investments simultaneously into the model. Both plans, as previously described, are implemented in full, and the strategy reaps the benefits of both. As one might expect, this produces a positive feedback be-tween the agriculture sector and the market/infrastructure sector, improving the poten-tial for positive results.
with 100 years of available cYF data, nine different 12-year combinations were formed: 1900-1912, 1913-1924, 1925-1936, 1937-1948, 1949-1960, 1961-1972, 1973-1984, 1985-1996, and 1989-2000. Each set is run through each strategy (base, irrigation, roads, and irrigation-and-roads combination) to provide nine simulations per strategy. These ensembles, of course, do not encompass all possibilities and admittedly cor-respond to a stylized stochastic process, as opposed to other approaches that gener-ate ensembles using a random or weighting scheme for assimilating months (Prairie et al., 2005). But they do offer robust insights into the variability and its response on the economy. Additionally, the ensemble may also be compared with historical data and trends, as available in literature.

cpwf working paper 16
4.2 Model results for the base case and investment strategiesTwo economic indicators, gdP and poverty rate, are retained for evaluation and com-parison of the base case and investment strategies. It is worth noting again that the agro-economic model reflects only benefits of the investment strategies to the econo-my; associated costs and analysis are included in a subsequent section.
Tables 4.1-4.4 display the base case and investment results for the nine sets run through the model. Mean refers to the mean of the nine sets; Range of Sets refers to the minimum and maximum values from the nine sets.
strategy - Base
Mean Range of sets
Economic Indicator Min Max
gdP growth rate 1.78 1.23 2.32
Ag gdP growth rate 1.47 0.58 2.06
nAg gdP growth rate 2.17 0.68 2.71
Poverty rate in 2003 (%) 41.55 - -
Poverty rate by 2015 (%) 54.77 46.82 65.52
Table 4.1: Base strategy economic indicators.
strategy - Irrigation
Mean Range of sets
Economic Indicator Min Max
gdP growth rate 2.73 2.25 3.22
Ag gdP growth rate 3.13 2.39 3.62
nAg gdP growth rate 2.14 0.66 2.69
Poverty rate in 2003 (%) 41.55 - -
Poverty rate by 2015 (%) 50.50 42.70 61.36
Table 4.2: Irrigation strategy economic indicators.
strategy - Roads
Mean Range of sets
Economic Indicator Min Max
gdP growth rate 2.53 2.00 3.08
Ag gdP growth rate 1.64 0.75 2.22
nAg gdP growth rate 3.61 2.11 4.16
Poverty rate in 2003 (%) 41.55 - -
Poverty rate by 2015 (%) 51.71 43.37 62.96
Table 4.3: Roads strategy economic indicators.

cpwf working paper 17
strategy - Irri/Roads Combo
Mean Range of sets
Economic Indicator Min Max
gdP growth rate 3.43 2.95 3.92
Ag gdP growth rate 3.29 2.56 3.78
nAg gdP growth rate 3.59 2.09 4.14
Poverty rate in 2003 (%) 41.55 - -
Poverty rate by 2015 (%) 47.74 39.77 58.77
Table 4.4: Irrigation and Roads combination strategy economic indicators
In contrast to the base case, the Means for the investment strategies have improved due to the growth of irrigated agriculture, better transportation and easier flow of com-modities to and from markets, or a combination of the two. The irrigation investment clearly boosts the agricultural gdP growth rate, while the roads investment enhances the non-agricultural gdP. Both are positively affected in the combination approach. From a benefit only perspective, the irrigation investment slightly outperforms the roads investment, but overall is quite close. not surprisingly, the combination approach sur-passes both.
Values in the twelfth (or final year) of the simulation, are tabulated in Table 4.5.
Strategy GDP (log million $US) Poverty Rate (%)
Range of sets Range of sets
Investment Mean Min Max Mean Min Max
Irrigation 4.13 4.06 4.11 39.3 42.7 61.4
Roads 4.13 4.05 4.10 39.8 43.4 63.0
combination 4.17 4.10 4.15 36.2 39.8 58.9
Table 4.5: Investment simulations: GDP and poverty rates.
Here, the economic indicators for the roads strategy appear to be nearly on par with the irrigation indicators, showing signs of being only slightly less effective in boosting the Ethiopian economy.
4.3 Benefit-cost analysis for investment strategiesThe cost for implementation of these strategies varies to a wide degree due to the uncertainty in material and labor costs, material transportation, and geographic loca-tion and extent of the projects. nonetheless, a general range may be estimated by observation of similar projects within Ethiopia and neighboring countries. Table 4.6 lists estimates for relevant project costs from various sources (Inocencio, 2005; ChinaDaily, 2006; Tekle, 2006; WWP, 2006).

cpwf working paper 18
Strategy Quantity Unit Cost total Cost
$US Billion $US
Irrigation 274,000 hectares 4,000 – 5,500 1.1 – 1.5
Roads 5,000 km –8,000 km 261,000 – 400,000 1.3 – 2.02.1 – 3.2
combination 2.4 – 3.5 3.2 – 4.7
Table 4.6: Estimated costs for irrigation, roads and combination investments.
The roads and combination investments list ranges for both the 5,000 km and 8,000 km road construction distances. clearly there is some overlap between the irrigation and road investments, but the road costs appear to be predominantly higher, even for the 5,000 km distance. combining these costs with the gdP results in the previous sec-tion can provide a benefit-cost type ratio for comparison. The ratios are created in this study by dividing the mean net GDP in the final strategy year (investment strategy GDP minus base GDP) by the total project costs. Table 4.7 displays these ratios.
Strategy Mean GDP Net GDP total Cost Ratio
Billion $US Billion $US Billion $US
Base 12.30 0 - -
Irrigation 13.49 1.19 1.1 – 1.5 1.08 – 0.79
Roads 13.49 1.19 1.3 – 2.02.1 – 3.2 0.92 – 0.600.57 – 0.37
combination 14.79 2.49 2.4 – 3.53.2 – 4.7 1.04 – 0.710.78 – 0.53
Table 4.7: Benefit-cost ratios for investments.
Although the ratios are primarily below 1.0, this does not suggest that the projects are not worthwhile. These simulations only aggregate the benefits after twelve years, significantly shorter than the anticipated life span of either the irrigation equipment or roads. Evaluation of the ratios suggests that either the irrigation investment or combi-nation investment with 5,000 km of road prove to be most prosperous.
Probabilistic risk may also be evaluated based on the stochastic model and cost analy-sis. This tool provides planners and decision-makers with a range of expected outcomes based on their respective level of risk. Preliminary results are available in Block et al. (2006a).
4.4 Conclusionsoverall, as demonstrated in this study, the irrigation investment strategy tends to fare slightly better than the roads investment strategy. The benefit side of this is due in part to the fact that additional irrigation has particularly strong impacts on reducing the neg-ative effects on production and farm income of drought. since drought has a persistent impact on income and food security, prevention or reduction in severity of drought has long term benefits. It is also worthwhile to note that the combination strategy of both irrigation and roads is slightly greater than the sum of the two individual strategies, in-dicating the feedbacks between agricultural and non-agricultural sectors in the model. The combination investment including only 5,000 km of roads also fared well, nearly

cpwf working paper 19
on par with the irrigation investment. Increasing the road construction distance from 5,000 km to 8,000 km appears to decrease the benefit-cost ratio. This may suggest that the benefits generated by the positive feedback of road construction on the agricul-tural sector outweigh the road construction costs at the lesser distance, but not at the greater distance. The next steps involve finding the optimal road construction distance to compliment the irrigation project, providing the best overall benefit-cost ratio.
5 Large-scale Hydropower and Irrigation Development on the Upper Blue NileEighty-three percent of Ethiopians currently lack access to electricity, with 94 percent still relying on fuel wood for daily cooking and heating (Tegenu, 2006). Ethiopia pos-sess abundant water resources and hydropower potential, second only to the demo-cratic Republic of congo in all of Africa, yet only three percent of this potential has been developed (World Energy Council, 2001). Likewise, less than 5% of irrigable land in the Blue Nile basin has been developed for food production (Arsan and Tamrat, 2005). Recent government plans and programs to develop hydropower and irrigation, in an effort to substantially reduce poverty and create an atmosphere for social change, are actively being pursued. It has been demonstrated that access to electricity, including rural areas, is a key to poverty reduction (MoFED, 2006). Implementation, however, is not trivial, especially due to financing and investment challenges.
numerous hydrologic models have been developed to assess hydropower and agricultur-al irrigation potential within Ethiopia and the whole of the nile River basin. These mod-els aid in identifying worthwhile and sustainable projects, with implications to hydrol-ogy and economics of the entire basin. Four large-scale dams and reservoirs along the Blue nile River within Ethiopia, as proposed by the United states Bureau of Reclamation (USBR) in 1964, are often included in these models, due to the enormity of their poten-tial for hydropower generation and irrigation supply. This chapter utilizes the IMPEnd model for hydropower and irrigation analysis to combat several critical aspects for which other models fail to account, including the transient stages of the reservoirs and as-sociated downstream ramifications, effects on the Ethiopian economy during this pe-riod, and the implications of stochastic modeling of variable climate and climate change during both the transient and long-term stages. The aim of the project is to reduce the vulnerability of the Ethiopian people and economy to shocks resulting from interannual variability.
The chapter begins with Blue nile basin details, a brief depiction of the proposed UsBR dams and an outline of the IMPEnd model. subsequently, model results for varying flow policies and climatic conditions are presented, including probable multipliers to the Ethiopian economy due to the influx of energy and agricultural production. The chapter concludes with a summary and discussion.
5.1 Blue Nile and Nile Basin Hydrology, Climatology, and Water allocationThe Blue nile headwaters emanate at the outlet of lake Tana in the Ethiopian highlands, as presented in Figure 5.1. It is joined by many important tributaries, draining the central and southwestern Ethiopian highlands, becoming a mighty river long before it reaches the lowlands and crosses into sudan. It stretches nearly 850 kilometers be-tween lake Tana and the sudan-Ethiopia border, with a fall of 1300 meters; the grades are steeper in the plateau region, and flatter along the low lands. From approximately 30 kilometers downstream of Lake Tana and into Sudan, the river flows through deep rock-cut channels.

cpwf working paper 20
Figure 5.1: The Nile basin.Courtesy of the World Bank.

cpwf working paper 21
Very few stream gauges exist along the Blue nile River within Ethiopia, and those that do tend to have spotty or limited records, and are often not publicly available. Upon leaving lake Tana, the next station location of substantial length is at Roseires, sudan. stations with shorter records, at kessie, downstream of lake Tana, and El diem, at the Sudan-Ethiopia border, exist, but provide only a few years of monthly flows.
The climate experienced by the Blue nile River varies greatly between its inception in the highlands of Ethiopia and its confluence with the White Nile River. Lake Tana sits at 1830 meters above sea level with annual average precipitation totals of nearly 1000 mm and evaporation totals of 1150 mm per year. Most of the highlands of Ethiopia, at elevations between 1500 and 3000 meters, is wet, lush and green, and has daily mean temperatures that fluctuate between 15-18 degrees Celsius. As the Blue Nile drops into the lowlands and into southern sudan, rainfall totals decrease and evaporation rates increase, causing a significant net loss. Temperatures also increase in variability, and reach substantially higher levels than at lake Tana. The sennar area experiences evaporation rates that total 2500 mm per year, yet only receives 500 mm of rain annu-ally. Mean daily temperatures approach 30 degrees Celsius (Shahin, 1985; Sutcliffe and Parks, 1999).
Monthly precipitation records indicate a summer monsoon season, with highest totals in the June-september months. near sennar, rains during this season account for nearly 90% of total annual precipitation, while in the Ethiopian highlands, approximately 75% of the annual precipitation comes during the monsoon season. August is typically the peak month, with 2-3 hours of average daily sunshine and humidity levels close to 85% in the Ethiopian highlands (Shahin, 1985; Conway, 2000). Although the deserts receive no precipitation during the monsoon season, this intense upstream episode gives rise to the annual Nile flood, whose impacts are felt throughout the entire basin.
due to its equatorial positioning, the nile River is ripe for evaporation in its channels and reservoirs, and evapotranspiration through irrigation practices. It is estimated that tens of billions of cubic meters are lost annually from these processes.
The Blue nile is predominantly utilized for irrigation purposes in Ethiopia and sudan. Ethiopia is the richest basin country in terms of water resources, as it contributes ap-proximately 84% of the inflow to Lake Nasser at Aswan, Egypt, through the Blue and Atbara Rivers (Figure 5.2.) Ironically, Ethiopia has the fewest privileges, in terms of water allocation; Egypt and sudan, through the Agreement of 1959, are allotted 55.5 and 18.5 billion cubic meters, respectively, each year, with no allotment to Ethiopia (Said, 1993; Johnson and Curtis, 1994). Water allocation of the Nile has been a contro-versial topic for decades, and is becoming even more heated as countries gain indepen-dence and demand rights to this precious resource, pronouncing the 1959 Agreement no longer valid. In 1998, the nile Basin Initiative was created to formulate cooperation between all countries in the nile basin and work toward amicable alternatives and solu-tions for water resources benefits (Nile Basin Initiative, 1999).

cpwf working paper 22
Figure 5.2: Contributing rivers to the main Nile discharge at Lake Nasser.Courtesy of Hurst (1952).
5.2 USBR Proposed Hydroelectric DamsIn 1964, the UsBR, upon the invitation of the Ethiopian government, performed a thor-ough investigation and study of the hydrology of the upper Blue nile basin. This was during the time of construction of the Aswan High dam in Egypt. Included in the UsBR’s study was an optimistic list of potential projects within Ethiopia, including preliminary designs of dams for irrigation and hydroelectric power along the Blue nile and Atbara Rivers. The four major hydroelectric dams along the Blue nile, as proposed by the UsBR, are presented in Figure 5.3a.
The karadobi dam and reservoir would be located just upstream of the guder River confluence (see Figure 5.3b [Bureau of Reclamation, 1964]), approximately 385 km downstream of lake Tana, and would be responsible for controlling a draining area of nearly 60,300 square kilometers. The Mabil dam would sit 145 km further downstream, 25 km downstream of the confluence with the Birr River. The Mendaia and Border Dams would be constructed about 175 km and 21 km upstream of the sudan-Ethiopia border, respectively. Further dam details and characteristics are provided in Tables 5.1 and 5.2 (Bureau of Reclamation, 1964). Figure 5.4 illustrates the designations for heights and heads from Table 5.1.
operating in tandem, these four dams would impound a total of 73.1 billion cubic me-ters, which is equivalent to approximately 1.5 times the average annual runoff in the basin. The total installed capacity at design head would be 5570 megawatts (MW) of power, about 2.5 times the potential of the Aswan High dam in Egypt, and capable of providing electricity to millions of homes. This would be an impressive upgrade over the existing 530 Mw of hydroelectric power within Ethiopia.

cpwf working paper 23
Preliminary plans ordered the construction of the dams to be from upstream to down-stream, beginning with Karadobi and finishing with Border. More recent schemes, though, have altered the construction order to be: Karadobi, Border, Mabil, and finally Mendaia (Harshadeep, 2006). This new plan attempts to capture flows leaving the country earlier in the construction timeline to take advantage of hydroelectric potential. Models and evaluations in this study incorporate the revised order.
Figure 5.3: Proposed hydroelectric dams along the Blue Nile in (a) plan and (b) cross-sectional views, as proposed by the USBR.Figure (b) courtesy of USBR report (1964).

cpwf working paper 24
Project Name Structural Crest Design Min. Oper. Intake (m) Length (m) Head (m) Height (m) Head (m)
karadobi 252 980 181.4 116 102.5
Mabil 171 856 113.6 73.8 59.7
Mendaia 164 1134 117.4 109.8 70.4
Border 84.5 1200 75 68.4 27.8
Table 5.1: Proposed dam characteristics.
Project Name Reservoir Flow at Design Installed Power at
Capacity (m3) Head (m3/s) Design Head (MW)
karadobi 32.5 billion 948 1350
Mabil 13.6 billion 1346 1200
Mendaia 15.9 billion 1758 1620
Border 11.1 billion 2378 1400
Table 5.2: Proposed reservoir and power characteristics.
Figure 5.4: Designations for dam heights and heads.

cpwf working paper 25
5.3 IMPEND Model FrameworkThe Investment Model for Planning Ethiopian Nile Development (IMPEND) is a stand-alone optimization model, written in GAMS, requiring a single input file including streamflow and net evaporation at the four dam locations and Roseires, Sudan (Block, 2006b). It encompasses the Blue Nile River from its headwater at Lake Tana to the Roseires dam, just beyond the sudan-Ethiopia border. The current version weighs the tradeoff value of hydropower, at 8-cents per kilowatt-hour, and water for irrigation, pro-ducing crops estimated at $325 per hectare, with the total present worth as the objec-tive value. Viable outcomes may include allocating all water resources to one of the options, or, more commonly, to a combination of the two. stipulations on the minimum allowable downstream flow (at Roseires) also regulate the model. The time-frame is ad-justable, but held constant at 30 years for the transient portion of this analysis. Exten-sions for benefits to 100 years are also computed. The generic period is associated with 2000-2099.
A noteworthy feature of IMPEnd is its perfect foresight ability. For any given run, the model will produce the absolute best (largest) objective value possible. This is analo-gous to operating the system of dams and irrigation perfectly, as if privy to all future streamflow and climate information. While this methodology may ultimately be unre-alistic, it does allude to the full potential of a given scenario, and provides a consistent framework for comparison between scenarios.
optimization of electric energy is formulated around the head level in each reservoir. All operational aspects are nonlinear functions of head, including the reservoir storage, reservoir surface area for determining evaporative losses, quantity of water released through the turbines, turbine efficiency, and reservoir spilling. These functions have been derived from either relationship curves in the preliminary UsBR report, or typi-cal relationships based on site specific characteristics. The model is driven by monthly climatic inputs, which vary from year to year, as prescribed by the input file. This allows for scenarios from the historical climate record, or potential future climates, including climate change.
The Ethiopian Ministry of water’s 2002 Irrigation development Plan recommends expan-sion of irrigated cropland along the western border region. The plan here incorporates approximately 250,000 hectares, or 35% of the estimated total irrigable land in the Blue Nile basin (Arsano and Tamrat, 2005). Therefore, releases for irrigation are only allowed from the Mendaia and Border reservoirs. withdrawals from the deep rock-cut channel reservoirs may still not be an easy feat, but has been assumed as a plausible opportunity. Full development and implementation of the irrigation scheme is set for 2007 in IMPEnd.
A final important characteristic of IMPEND is the flexibility in interest rates and down-stream flow policies. The interest (or discount) rate may be set at any value for use in determining the present worth of the hydropower and irrigation benefits. Obviously, the model will respond differently to a scenario depending on the severity of discount-ing. The downstream flow constraint is established at the entrance to Roseires Dam and may follow one of two policies, both of which are dependent upon the model’s perfect foresight. The first policy allows for a percentage of the annual flow to be retained within Ethiopia (5% in this study.) The specific methodology to accomplish this is not specified; the constraint simply requires that by the twelfth month, the annual flow less

cpwf working paper 26
the 5% held. Again, the methodology is not stipulated, but the constraint requirements must be satisfied by the end of the twelfth month.
The time horizon, albeit adjustable, is assumed to be 100 years, 2000-2099, for all scenarios. This includes a period of construction of seven years (2000-2006) before any benefits may be realized. The 30-year transient portion of the model thus starts at 2007, when water may first be impounded, and continues until 2036. Full benefits may or may not be reached at this point, depending upon hydrologic conditions. Benefits beyond 2036 are assumed to be constant at the design level. This assumption may be a slight under or over approximation, but is deemed appropriate, as the present worth of benefits beyond 36 years for most discount rates becomes relatively small.
For this study, the dams are presupposed to come online in seven year intervals. Figure 5.5 illustrates the timeline.
Stagger Case: Design Benefits
karadobi Border Mabil Mendaia
construction construction construction construction
2000 2007 2014 2021 2028 2036
Figure 5.5: General schematics of IMPEND stagger timeline.
Benefits for each dam may begin post-construction of that dam. Full benefits for each dam may or may not be reached in the transient period, again, depending upon hydro-logic conditions.
Relevant climate scenarios for streamflow and net evaporation along the upper Blue Nile River include analyses based on historical (1961-1990) data, and also those involv-ing potential climate changes. El Niño Southern Oscillation (ENSO) events have been shown to have significant influence in the upper Blue Nile region, producing wetter conditions under la niña and drier conditions under El niño. Analyses of future climate change, though, do not give clear indication of expected conditions in the basin; litera-ture specifies that climate change may result in an increase in either El Niño or La Niña events (IPCC, 2001; Conway, 2004). The climate change scenarios, therefore, address the possibilities of doubling the frequency of El niño or la niña events. An ensemble approach, generating 50 plausible climate scenarios for stochastic analysis of historical and Enso based scenarios, is also employed.
5.4 Dam and Irrigation Construction and Operation CostsThe dam and irrigation costs are external to IMPEnd, but connected through a post-processing arrangement for the generic 2000-2099 time period. The predominant pur-pose for inclusion is benefit-costs analysis. Costs have been updated to the start year (2000), as necessary, and distributed as described in the following paragraphs.
Preliminary costs for each dam and associated appurtenances are included in the UsBR study. These costs consist of the initial one-time construction fee (labor and materi-als) and annual costs, including operation and maintenance, scheduled replacement, and insurance. Initially listed in 1964 Ethiopia dollars, the figures have been updated to 2000 U.S. dollars, using a conversion rate of 2.5 Ethiopian dollars to 1 U.S. dollar (Glob-

cpwf working paper 27
al Financial Data, 2006) and a dam cost index ratio of 0.19, implying a nearly 5-fold increase of costs (US Army Corps of Engineers, 2006). Table 5.3 lists the initial and an-nual costs for each dam site in 2000 U.s. dollars.
Project Name Initial Construction Costs annual Costs
(million US $) (million US $)
karadobi $ 2,213 $ 15.9
Mabil $ 1,792 $ 13.5
Mendaia $ 2,114 $ 17.9
Border $ 1,985 $ 17.2
Table 5.3: Construction and operation costs for dams.
The initial costs for each dam are distributed over seven years, as displayed in Table 5.4. All annual costs begin in the first year post-construction, when dam benefits may be realized.
Irrigation construction costs for the 250,000 hectares are estimated at one billion Us dollars, or $4,000 per hectare (Inocencio, 2005; Diao et al., 2004). These costs are dis-tributed evenly over three years, 2004-2006, to coincide with the beginning of the tran-sient period (2007) for relevant scenarios. If deemed optimal by IMPEND, all 250,000 hectares may be irrigated beginning in 2007.
It is important to note that the above costs reflect estimated labor, materials, and an-nual costs, but do not include a provision for additional security for construction in an unstable region. currently, Ethiopia appears to boast a relatively stable and safe en-vironment, but this was certainly not the case in the recent past. If security becomes an issue, costs may escalate substantially, with estimates ranging from a 25% - 100% increase, depending on the level of severity (Chinowsky, 2006). For this study, only the original estimates are considered, but clearly the benefit-cost ratios would be reduced if security is a necessary measure.
Another issue not considered in this study, but worth mentioning, is the potential for this large-scale project to create an environment of micro-inflation during the construc-tion period. It is certainly plausible that an influx of skilled workers to the region could pump significant money into the local economy, resulting in a greater disparity in wag-es, increasing the overall standard of living and inflation, and then producing a vacuum post-construction, once the skilled laborers left. As serious as this may be, external costs and benefits to the project are typically not considered in analysis by organizations such as the World Bank (Rosegrant, 2006).
5.5 Model Results and Discussion
Year 1 Year 2 Year 3 Year 4 Year 5 Year 6 Year 7
10% 15% 20% 20% 20% 10% 5%
Table 5.4: Distribution of costs for initial dam construction.

cpwf working paper 28
An endless number of scenarios may be fabricated for assessing hydropower and ir-rigation optimization with the basin, including variations in flow policies, interest rates, climatic conditions, the timing of bringing the dams online, etc. considering an assess-ment of two flow policies, four interest rates, three climate conditions, and two timing states, this accounts to 48 model scenarios. For an ensemble approach of 50 members each, this quickly soars to 2400 model runs! Therefore, the number of scenarios for this study was selectively pared down with the intention of adequately scoping a relevant range of possibilities.
5.5.1 Historical and climate change scenario results It is imperative to assess results founded on historical or potential climate change, be it to a wetter or drier state, especially considering the intended longevity of the project. Table 5.5 presents benefit-cost (b-c) ratios for varying historical and potential climate conditions. The climate condition has been imposed on IMPEnd for the transient period only (2007-2036), when the flow policies are in effect. For the remaining years un-til 2099, it has been assumed that design energy and full irrigation for agriculture are achieved annually.
Scenario: Historic 2 x La Nina 2 x El Nino
Flow Policy
5% Policy 1.48 - 1.72 1.49 - 1.76 1.43 - 1.66
50% Policy 1.18 - 1.82 1.41 - 1.91 1.07 - 1.63
Table 5.5: Benefit-cost ratios for two flow policies for historical and climate change scenarios.Interest rate is 10%.
The expected b-c ratios for a doubling of la niña are approximately equal to those of the historic ensemble for the 5% policy, but slightly better for the 50% policy, due to generally wetter conditions. contrarily, the El niño ensembles produces noticeably lower b-c ratios compared to the historical ensembles, due to drier conditions, result-ing in less opportunity for water-related benefits. This is especially obvious in the 50% flow policy scenario in which one of the El Niño ensemble members plummets to a b-c ratio just greater than 1.0. This is a direct result of not only generally drier conditions, but also a lack of timely water (i.e. numerous early dry years) and clearly represents conditions in which construction of the hydropower and irrigation project may not prove worthwhile. In actuality, the b-c ratios for the doubling of El niño may well be an over-estimation, as the likelihood of achieving design benefits for irrigation and hydropower beyond the transient stage is small.
Figures have been created for visual representation, including present worth and energy output for the historical, la niña, and El niño ensembles. Figures 5.6a and 5.6b com-pare the PDFs of net present worth for all three ensembles under the two flow policies. As reflected in Table 5.5, the El Niño PDFs are noticeably lower than the other two, and the la niña PdFs are approximately equal to the historical PdFs. Figures 5.6c and 5.6d contrast benefits for the representative present worth member of each ensemble. The cost curve is also included. Again, as expected, the El Niño benefit curve is lower than the other two benefit curves for much of the transient period; the La Niña benefit curve is not dissimilar to the historical benefit curve.
cpwf working paper 29
Figure 5.6: PDFs of net present worth for the historic (H), La Niña (LN), and El Niño (EN) ensembles under the (a) 5% and (b) 50% flow policies. Annual benefit and cost present worth curves under the same three ensembles for the (c) 5% and (d) 50% flow policies.Both the (c) and (d) cases represent the identical historical ensemble member.
Figure 5.7 presents energy production results for the same ensembles, and illustrates comparable findings to Figure 5.6.
Figure 5.7: PDFs of total energy produced for the historic (H), La Niña (LN), and El Niño (EN) ensembles under the (a) 5% and (b) 50% flow policies during the transient period. Annual energy production under the same three ensembles for the (c) 5% and (d) 50% flow policies during the transient period.Both the (c) and (d) cases represent the identical historical ensemble member.

cpwf working paper 30
not all members of the El niño ensembles produce feasible results in IMPEnd under the 50% flow policy case. All results to this point for these cases have not considered the infeasible runs, as they have been purged prior to analysis. It is paramount, though, to realize that the prospects of infeasibilities are real, due to lack of water quantity and timeliness. Infeasibilities are typically a result of early dry years or successive dry years, when no water may be impounded, yet large evaporative demands and down-stream requirements must still be met. Figure 5.8 illustrates cumulative storage for the first ten years of each historical and El Niño ensemble member run through IMPEND for the 5% and 50% flow policies. The dashed lines represent ensemble means. Any stor-age equal to zero implies an infeasible run.
Figure 5.8: Cumulative storage for the first ten years of each historical (top) and El Niño (bottom) ensemble member for the 5% and 50% flow policies. The dashed lines represent ensemble means. Any storage equal to zero implies an in-feasible run.
The 5% flow policy storage results are quite tightly grouped, as expected, due to the assurance of water annually. For the 50% flow policy, no infeasibilities transpire in the historical ensemble; just over half of El niño ensemble members, however, are infea-sible. This coincides with the fact that annual streamflow for 2/3rd of all years in the El niño ensemble fall below the historic 50th percentile. Obviously this flow policy does not perform well under dry conditions, and is not preferable if justifiable speculation toward a drier state exists. However, due to its slightly superior performance for wetter condi-tions, this policy should not be completely eliminated from consideration.

cpwf working paper 31
Climate change influences could play a major role in determining the success or failure of the proposed hydropower and irrigation project. Overall, the 5% flow policy appears to be more robust to modeled climate changes than the 50% flow policy. It consistently outperforms the 50% flow policy in drier conditions, and is nearly on par with it in wet-ter conditions.
5.5.2 Irrigation versus hydropower Irrigation and hydropower benefits have thus far been lumped together for analysis. The two work in complimentary fashion in IMPEnd by reason of the downstream diver-sion location for irrigation. This allows the water to remain in the system as long as possible for hydropower generation, and still be utilized for crops. In the historical and la niña scenarios, hydropower and irrigation are almost always both maximized, imply-ing that no tradeoff is necessary. Irrigation b-c ratios are generally quite close to 1.0. However, for drier conditions, such as the El niño scenario, IMPEnd will opt to reserve water for hydropower generation and forego crop irrigation in order to meet down-stream flow requirements, or be forced to pass all water downstream with the hope of generating some hydropower along the way. For the El Niño 5% flow policy, the number of hectares irrigated in the very early years may not attain the 250,000 maximum, but grows quickly, generally reaching this level within a 2-4 year period. For the El niño 50% flow policy, though, it is common for no irrigation to take place during the transient stage, or for spotty irrigation, which is not especially helpful for cropland management and planning, and obviously results in b-c ratios below 1.0. Understandably, a surge in crop yields or commodity prices, associated with a lessening in demand for energy may reverse these trends. Another important consideration, not addressed in this study, is the issue of food security for this famine-prone country.
5.5.3 Project multipliers To assess the influence of the proposed project on the Ethiopian economy as a whole, a series of Ramsey economic growth models are developed. The basic premise of the model is to balance capital, labor, and the energy sector (collectively constituting gross domestic product) with consumption and investment. Equation 5.1 presents the key relationship:
ttttttt IEicETEKLA ++=+gba *** (5.1)
A is a calibration parameter to rectify units, and t is the time step, in months. L repre-sents the labor force, initially equal to 37.5 million, growing at a rate consistent to the population growth rate of 2.9% (CIA, 2006). K is the capital within the country, initially set at 16.5 billion US dollars (Economic Commission for Africa data), growing with in-vestment. E symbolizes the energy sector, set to 4643 gwh in the base year, and represents energy that is consumed by Ethiopia, while ET represents energy gen-erated beyond the country’s ability to absorb, available for trade to neighboring countries. The exponents represent the value share, and follow a cobb-douglas approach summing to 1.0 (Mansfield and Yohe, 2004). For this model, á, â, and ã are set to 0.446, 0.48, and 0.074, respectively. c stands for the country-wide consumption, and i the investment. IE represents the specific investment in the energy sector (infrastructure and associated costs.)

cpwf working paper 32
Equation 5.2 demonstrates the objective function of the model, to be maximized.
( )[ ]∑= t tt cdU log* (5.2)
U symbolizes the country-wide utility, and d the discount factor. The project multipliers derived here represent a multiplier on the gross domestic product (GDP) over the 100-year simulation, giving indication of the potential benefit of the project, including associated benefits through economic feedbacks. They result from a combination of the total gross domestic product (discounted from Equation 5.1) from these Ramsey growth models utilizing energy from IMPEnd or prescribed energy growth. Equation 5.3 presents the relationship (Yohe, 2006).
)(
)(Pr)(
IMPEND
escribedIMPEND
PWTotalGDPTotalGDP
Multiplier−
= (5.3)
The numerator represents the difference between the total gdP from the Ramsey model using energy from IMPEND (first term) and prescribed energy (second term.) PW repre-sents the present worth of the hydropower project, discounting benefits and costs. The Ramsey model utilizing prescribed energy eliminates the ET and IE terms. The objective is to evaluate if the country-wide economy is better off with or without the implementa-tion of the project. A multiplier greater than 1.0 indicates economic growth if the proj-ect is realized; less than 1.0 implies that the project may not be economically wise. To reiterate, the multiplier is not simply a benefit-cost ratio of the project, but reflects the potential impact on the total gdP.
The following tables present expected multipliers for the three climatic conditions under the two flow policies. Table 5.6 assumes a prescribed energy growth rate of 0%; Table 5.7 assumes a 3% prescribed energy growth rate.
Scenario: Historic 2 x La Nina 2 x El Nino
Flow Policy
5% Policy 4.3 4.2 5
50% Policy 4.3 3.8 5.2
Table 5.6: Multipliers on total GDP utilizing IMPEND and 0% prescribed energy models.
Scenario: Historic 2 x La Nina 2 x El Nino
Flow Policy
5% Policy 1.9 1.9 2.2
50% Policy 1.9 1.7 2.3
Table 5.7: Multipliers on total GDP utilizing IMPEND and 3% prescribed energy models.
cpwf working paper 33
clearly all ranges of multipliers are well above 1.0, indicating the potential strength of the project on the economy as a whole. The values for the El niño condition are slightly higher based on lower overall present worth values, but may indicate a greater overall risk.
5.6 Conclusions and Discussionnumerous hydrologic models have been developed to assess hydropower and agricul-tural irrigation potential within the upper Blue nile basin, yet often fail to adequately address critical aspects, including the transient stages of large-scale reservoirs, relevant flow retention policies and associated downstream ramifications, and the implications of stochastic modeling of variable climate and climate change. The IMPEnd hydrologic model with dynamic climate capabilities is constructed to assess these aspects. climate change scenarios indicate potential for small b-c increases, but reflect possible notewor-thy decreases. stochastic modeling of scenarios representing a doubling of the histori-cal frequency of El niño events indicates b-c ratios as low as 1.0, with numerous runs producing potentially infeasible projects due to a lack of timely water. Project multipli-ers on total gdP over the 100-year simulation range from 1.7-5.2 for various climato-logic conditions.
Although considerable effort has been devoted to creating as comprehensive and ac-curate a model as possible, IMPEnd is only as good as the data it is supplied. The Blue nile within Ethiopia remains largely ungauged, and a certain degree of latitude is neces-sary in developing specific hydrologic and climatic conditions. Undoubtedly, site spe-cific testing and modern technology will alter plans as designed by the USBR, possibly changing the potential or overall scope of the hydropower and irrigation project. Among this uncertainty, though, the results of this study are thought to be sound and represen-tative of prospective future scenarios, and at the least give indication to the feasibility under varying conditions.
The commencement of water resources planning and strategizing with downstream ri-parian countries is vital to the success of the project. There are many opportunities for win-win situations, with bargaining chips including energy and food production, regu-lated streamflow, water conservation through reduced evaporation losses, and water rights, to name a few. It is heartening to note the progress that is currently being made through organizations such as the nile Basin Initiative.
Additional aspects and scenarios not considered in this study also warrant further atten-tion and analysis with IMPEND. The model could be modified to create more realistic reservoir operations by looking at a smaller time window, perhaps on an annual basis, without the benefit of perfect foresight providing streamflow knowledge of the entire scenario. This may be accomplished by solving the model yearly with the expecta-tion that the following year would produce average hydrologic conditions. In a sepa-rate variation, a form of the precipitation forecast model developed in chapter 2 could be directly tied to IMPEnd to guide reservoir operations on a continuing basis. A third approach may be to condition the operations based on current hydrology and a K-nn weather generator for the relevant climatic condition.

cpwf working paper 34
The inclusion of supply and demand curves into IMPEnd, both for hydropower and agri-culture, may also prove valuable. This would provide a dynamic aspect to reflect pricing and availability, which would undoubtedly change throughout the project life. Addition-ally, the curves could also play a key role in assessment of varying climatic conditions, as marginal prices may be noticeably different between scenarios. Including more crops and respective irrigation requirements would also increase the IMPEnd level of detail.
6 Kiremt Season Precipitation Forecast ModelEthiopia is predominantly an agricultural society, and the success of seasonal crops has large implications, ranging from the state of the countrywide economy to the survival of the subsistence farmer. As the vast majority of agriculture is rain-fed, precipitation plays a pivotal role in the country’s welfare. Roughly 70 percent of annual precipitation in the upper Blue nile basin of Ethiopia is delivered during the Kiremt season, composed of the June-September months (Conway, 2000); during this season, 85-95 percent of annual crops are produced (Degefu, 1987). Precipitation also plays another equally im-portant role in the Ethiopian highlands, feeding the headwaters of the Blue Nile (shown in Figure 6.1) and Atbara Rivers, which eventually supply the mighty Nile River. Runoff in these basins contributes almost 70 percent of the annual Nile flow into Egypt, with the vast majority occurring during the Kiremt season (Shahin, 1985; Yates and Strze-pek, 1998). Policy and planning tools, including water management, economic, hydro-power, and irrigation models for Ethiopia and other downstream countries, rely heavily on precipitation and streamflow as key parameters. Therefore, understanding and pre-dicting the year-to-year variability of the seasonal rainfall is of immense importance in mitigating potential disasters, and may serve as a valuable tool for farm management. Presently, the Ethiopian national Meteorological services Agency relies solely on clima-tology and persistence in forecasting seasonal precipitation (Gissila et al., 2004). This motivates the current research to develop a robust framework for generating ensemble forecasts of the Kiremt season precipitation.
This chapter begins with a description of the data sets utilized, followed by background on Ethiopian climatology and interannual variability. next, the nonparametric regres-sion model for producing ensemble forecasts is briefly presented, along with relevant predictors. Results of the Kiremt seasonal precipitation forecast are subsequently pro-vided, followed by applications to cropland farming, including planning with and with-out the forecast model. The chapter concludes with a summary and discussion of the results.
6.1 Data Description2.1 Data Description 6.1.1 Precipitation2.1.1 Precipitation The precipitation data utilized for this study is part of the cRU Ts 2.0 dataset, obtained from the University of East Anglia, Norwich, U.K. (Mitchell, 2004). It consists of month-ly rainfall data on a 0.5o x 0.5o grid for the period 1901-2000. The 1961-2000 monthly data is derived by means of a thin-plate spline technique utilizing all available precipita-tion stations. The 1901-1960 monthly data is produced by combining monthly anomaly grids, interpolated from surface climate data, to the 1961-1990 mean monthly climatol-ogy (New et al., 2000). This study includes only 1961-2000, minimizing the anomaly-based data and reducing the likelihood of unwanted trends or potential persistence in the data. Additionally, since this study focuses on the Kiremt season, only the seasonal total for the June-september data are retained for each year. The upper Blue nile basin within Ethiopia constitutes 68 grid cells at 0.5o x 0.5o.

cpwf working paper 35
Figure 6.1: The upper Blue Nile basin, Ethiopia.Figure 2.1: The Upper Blue Nile Basin, Ethiopia.Base map courtesy of PLC map collection, University of Texas.

cpwf working paper 36
6.1.2 Large-scale Climate VariablesGlobal atmospheric and oceanic variables including, sea-surface temperature (SST), sea-level pressure (SLP), geopotential height, air temperature, and outgoing long-wave radiation (OLR), were obtained from the National Oceanic and Atmospheric Administra-tion’s (NOAA) climate diagnostics center (CDC), based on NCEP/NCAR re-analysis data (Kalnay et al., 1996). These are monthly average values on a 2.5o x 2.5o grid for 1949 to the present. Although widely utilized, ncEP/ncAR reanalysis data is known to con-tain some discontinuities among climatic variables (e.g., Camberlin et al., 2001), espe-cially in the 1960s over Africa, due to improved measuring and recording techniques; no efforts were made to deal with these inconsistencies. Palmer drought severity Index (PDSI) values (Dai et al., 2004), also at monthly time scales and on a 2.5o x 2.5o grid, for 1870-2003, were provided by the national center for Atmospheric Research’s cli-mate and global dynamics division.
6.2 Large-scale climate and Kiremt season precipitationTwo main rainy seasons exist within Ethiopia: the Belg (“small rains” in March-May) and the Kiremt (“big rains”.) The Kiremt season is part of a larger east African monsoon season spurred on by the shifting of the Intertropical Convergence Zone (ITCZ) north-ward (Griffiths, 1972; Gamachu, 1977). During the pre-monsoon season (March-May) the Tropical north African and south Asian land is predominantly dry, resulting in a gen-eral warming of the regional land and atmosphere. The ITcZ is formed where the wet southeasterly winds meet the dry northeasterly winds. Moist air is forced upward and condenses. The shifting of the ITcZ is a direct result of solar heating and warming of the surface (Griffiths, 1972; Gamachu, 1977), following the migration of the sun. This creates a low pressure, and pulls the ITcZ to the north from the equatorial region. The northern reach of the ITcZ is one of the dominant factors in controlling the timeliness and quantity of Kiremt rains. simultaneous to the shifting of the ITcZ, high-pressure systems in the south Atlantic and Indian oceans, coupled with the Arabian and the su-dan thermal lows, allow for the influx of moisture into the upper Blue Nile basin (NMSA, 1996; Seleshi and Zanke, 2004). The highlands and Blue Nile basin are predominantly fed by moisture advected over the Congo basin, transported via a southwesterly flow, and released due to orographic effects. This pattern persists until september or octo-ber, when the north-easterly continental airstream is re-established, and the ITcZ shifts south (Conway, 2000).
Interannual variability of precipitation within the upper Blue nile basin has been investi-gated by previous researchers (see e.g., Eklundh and Pilesjo, 1990; Seleshi and Dema-ree, 1995; camberlin, 1995; conway, 2000; osman and sauerborn, 2002; segele and Lamb, 2005). Factors influencing the variability include the El Niño Southern Oscilla-tion (ENSO) phenomenon, tropical depressions over the Indian Ocean, onset and ces-sation of the Kiremt rains, and periods of anomalous warming over the Indian ocean. Temporal correlations of upper Blue Nile basin (UBN) boreal summer rains with ENSO have shown that warm ENSO periods (El Niño years) are typically associated with lower precipitation and drought years, while cold periods (La Niña years) are associated with higher precipitation quantities (Seleshi and Zanke, 2004; Nicholson and Kim, 1997; Bel-trando and Camberlin, 1993). Precipitation in the basin is intrinsically tied to regional pressure and wind patterns; warm Enso events alter these zonal circulation patterns, disrupting the flow of moisture to the basin, often resulting in drought circumstances (Camberlin, 1995). Segele and Lamb (2005) also corroborate the critical influence of atmospheric circulation over the basin during the Kiremt season, and its important con-nection to large-scale teleconnections.

cpwf working paper 37
A map of the temporal correlation coefficients between the first principal component of UBn rainfall and the simultaneous summer sea-surface temperature at different loca-tions is shown in Figure 6.2. The ENSO pattern is quite clear in the Pacific Ocean cor-roborating earlier studies, and giving further credence to Enso being the leading factor of variability for the Kiremt season precipitation.
Figure 6.2: Correlation map of the first principal component of UBN summer precipita-tion and global sea-surface temperatures.Shaded regions are significant at the 90% confidence interval.
6.3 Forecasting FrameworkThe motivation in this study is to utilize a robust modeling framework for assessment of cropland farming. To this end, a nonparametric modeling approach based on a local polynomial method is chosen. nonparametric methods provide an attractive alterna-tive for addressing the drawbacks of traditional linear regression. In the nonparametric approach, estimation of the function f is performed ‘locally’ at the point to be estimated. This ‘local’ estimation provides the ability to capture features (i.e. nonlinearities) that might be present locally, without granting outliers any undue influence in the overall fit. The local polynomial nonparametric model development details may be found in Block and Rajagopalan (2006c).
Predictor sets for inclusion in the local polynomial model are included in Table 6.1. sea-level pressure, sea-surface temperature, and air temperature predictors are composed of positively and negatively correlated regions to form an index. The suite of predictors and model parameters chosen for this assessment are presented in Block and Rajago-palan (2006c). Predictor values are a composite of the preceding season (March-May), except the Palmer drought severity Index, for which only the May value is utilized.

cpwf working paper 38
Correlation with
Model Predictor Region UBn Precipitation
sea-level pressure 20.0 - 27.5n, 122.5 - 130w + 0.57
sea-level pressure 20.0 - 22.5n, 80.0 - 85.0E - 0.51
Sea-level pressure index + 0.60
sea-surface temperature 25.7n, 155.6 - 157.5w + 0.53
sea-surface temperature 16.2 – 20.0s, 110.5 – 120.0w - 0.44
Sea-surface temperature index + 0.56
Geopotential height (500mb) 30.0 – 35.0S, 10.0 – 25.0W - 0.48
Air temperature 17.5n, 37.5 – 40.0E + 0.14
Air temperature 15.0n, 32.5 – 35.0E - 0.29
air temperature index + 0.45
Palmer Drought Severity Index 13.75-16.25n, 41.25-43.75E + 0.33
Table 6.1: Potential large-scale predictors of Kiremt season precipitation.Bold represent optimal set.
Ensembles of seasonal predictions are created by adding random normal deviates of model errors to the predicted value. This is repeated 500 times for each Kiremt season to give a sense of the variability associated with each prediction.
6.4 Model results cross-validated ensemble predictions of the Kiremt season UBn rainfall, generated from the local polynomial forecast model for the historic 1961-2000 period, are illustrated in Figure 6.3.
Figure 6.3a compares the observed and forecasted ensemble means of seasonal precipi-tation, while Figure 6.3b presents seasonal ensembles depicted as box plots, with the box covering the 25th and 75th percentile, the horizontal line inside the box represent-ing the median, whiskers extending to the 5th and 95th percentile of the ensembles, and outliers shown as circles. dotted horizontal lines are also included for the 5th, 25th, 50th, 75th, and 95th percentiles from the observed record.
The ensembles also provide the forecast of the Probability Density Functions (PDF). Figure 6.4 demonstrates PDF from the nonparametric ensembles (dashed line) and from the observed data (i.e. climatological PDF, solid line) for two wet years (1968 and 1974) and two dry years (1978 and 1982). The observed UBN precipitation value for the year is indicated by the dotted vertical line.

cpwf working paper 39
Figure 6.3: Local polynomial modeling approach forecast results. Observed data shown as solid red line; cross-validated model estimates shown as dashed line and boxes:a) observed and cross-validated means (R2 = +0.67) with horizontal lines at per-centiles from the observed seasonal precipitationb) box plots of cross-validated ensembles with horizontal lines at percentiles from the observed seasonal precipitation
Figure 6.4: PDF for wet (top) and dry (bottom) years.Climatological PDF shown as solid line; ensemble forecast PDF shown as dashed line. The observed precipitation is shown as a dotted vertical line.

cpwf working paper 40
The PDF are estimated using a nonparametric kernel density estimator (Bowman and Azzalini, 1997). For the wet years, the PDF from the forecast ensembles are shifted to the right of the climatological PdF, indicative of increased precipitation. The observed value in 1968 is in the center of the ensemble PDF, indicating an excellent fit, while in 1974 the rightward shift is clear but not perfect, as the observed value was relatively extreme. Inspection of the dry years leads to similar findings, as the PDF are shifted to the left of the climatological PdF, indicative of drier conditions. The ensembles and PdF provide a structure in which threshold exceedance probabili-ties may be obtained (Sankarasubramanian, 2003). For demonstration, thresholds were selected at 1070mm (90th percentile) and 805mm (10th percentile) to represent flood and drought conditions, respectively. This implies that climatologically, there is a 10% chance in any given year of having a flood or an equal chance of experiencing a drought. By visual inspection, Figure 6.4 clearly improves upon this prediction. Table 6.2 presents the exceedance (for floods) and non-exceedance (for droughts) probabili-ties, which show considerably higher probabilities than climatology. note that seasonal precipitation for 1964, 1974, 1982 and 1987 are outside their respective threshold limits (implying flood or drought conditions), while 1968 and 1978 are not. 1964 and 1987 are the wettest and driest seasons in the 1961-2000 record.
Year climatology linear Approach local Polynomial Approach
Exceedance (wet) / Non-exceedance (dry) Probability, %
1964(wet) 10.0 39.0 21.0
1968 (wet) 10.0 25.8 34.3
1974 (wet) 10.0 32.6 42.5
1987 (dry) 10.0 42.9 25.2
1978 (dry) 10.0 32.2 30.1
1982 (dry) 10.0 40.8 57.9
Table 6.2: Exceedance and non-exceedance probabilities for forecasting wet and dry years.
such exceedance probability forecasts, if provided in advance of the Kiremt season to water managers and decision-makers within the basin, is of tremendous value. It allows them to make educated judgments about reservoir operation, crop irrigation, conserva-tion measures (droughts), potential emergency response measures (floods), or a num-ber of other critical aspects.
6.5 application to rain-fed cropland planningA brief demonstration is presented here to illustrate the applicability and advantages of the forecast model to rain-fed cropland planning. Four farmers are considered, farmer A who always plants using a high quality seed (hybrid) and a high level of fertilizer and pesticide, farmer B who always plants using an average quality seed (local) and a moderate level of fertilizer and pesticide, and farmer c who, utilizing the forecast model developed in this study, may plant either quality seed, with the respective fertilizer and pesticide quantities, or decide not to plant any crop for a given season. The final mem-ber, farmer d, mimics the actions of farmer c, but is presupposed to have a perfect forecast model; this demonstrates the full potential of the approach.
Table 6.3 presents the costs, revenues, and potential yields for high and average qual-

cpwf working paper 41
ity maize seeds on a per hectare basis, assuming ideal precipitation conditions (Negeri and Adisu, 2001). Figure 6.5 is a stylized representation of yield response for differ-ent levels of precipitation, based on the historical record. This figure implies that if the seasonal precipitation is outside of the 912-964 mm range, the yield will be reduced accordingly. clearly, many other factors not included here may also contribute to yield reductions, including local effects, crop management, precipitation onset and frequency, etc.
Table 6.3: Yields, costs, and revenues associated with high and average quality maize seeds assuming ideal precipitation conditions.
Type of Return High Quality Seed Average Quality Seed (maize)
Yield (Quintal/ha) 60 40
Market Price (Birr/tonne) 650 650
Total Revenue (Birr) 3900 2600
Seed Cost (Birr/ha) 220 16
Fert. & Pest Cost (Birr/ha) 750 500
Net Revenue (1/ha) 2930 2084
Figure 6.5: Stylized representation of yield response of maize to precipitation.

cpwf working paper 42
The 1961-2000 period is employed for demonstration. Figure 6.6 illustrates the cumu-lative net income for each farmer on a per hectare basis, each starting from the same base in 1961. Due to poor forecasts in the first few years of the time period, evident in Figure 6.3, farmer c initially lags behind, but eventually surpasses both farmer A and B. not surprisingly, farmer A generates greater overall income than farmer B due to larger returns, even though the required investment level is higher. Unfortunately, many Ethi-opian farmers are forced to manage like farmer B because of little savings to buy the initial high quality seed, fertilizer, and pesticide, or cannot take the risk of falling deeply in debt. Farmer D far exceeds any other farmer, with a final net income approximately 1.6 times that of farmer A and 1.8 that of farmer B. clearly, as the forecast model is improved, the potential returns to farmers increase.
Figure 6.6: Cumulative income for Farmers A-D over a 40-year span..
choosing the 1982-1992 decade, with each farmer starting at the same base in 1982, the forecast model performs much better, due to overall better predictions. This period is illustrated in Figure 6.7.
In addition to the simplifications previously noted, other factors held constant in this demonstration also play pivotal roles, including market fluctuations and international food aid. The forecast model may also be of assistance on this front as well, giving indication of a potentially low production year wherein food aid may be necessary. This advance notice may literally have life or death implications.
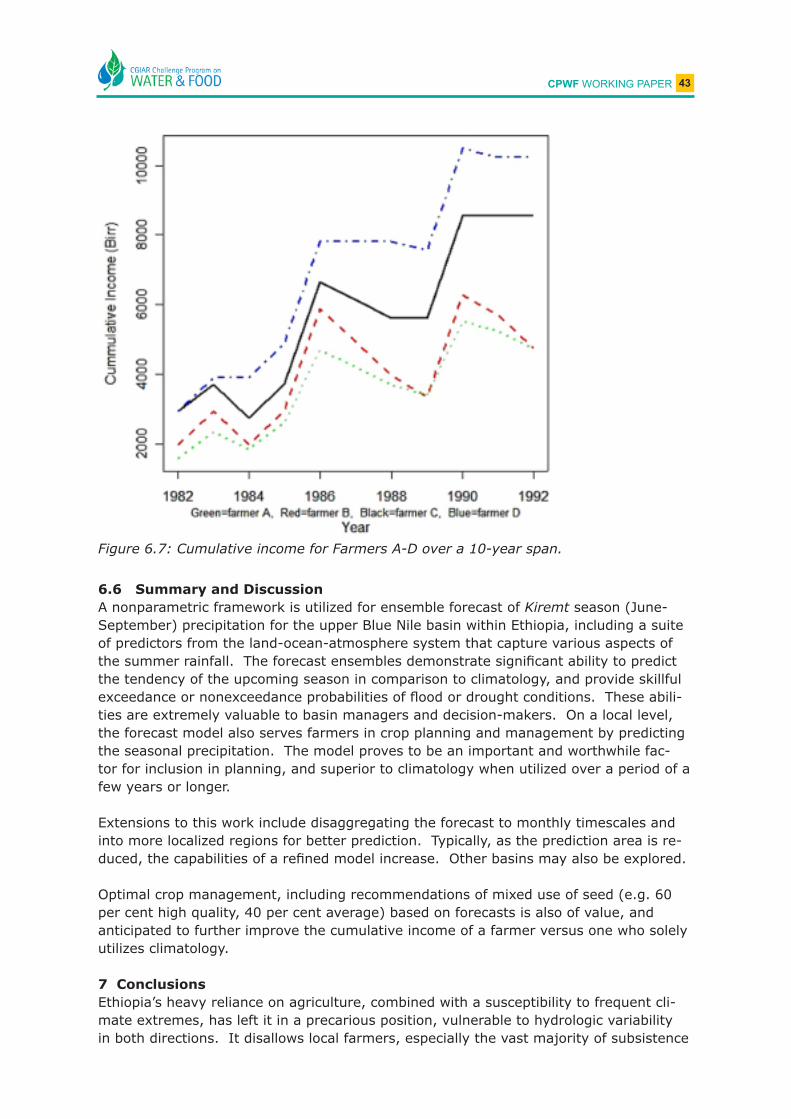
cpwf working paper 43
Figure 6.7: Cumulative income for Farmers A-D over a 10-year span.
6.6 Summary and DiscussionA nonparametric framework is utilized for ensemble forecast of Kiremt season (June-September) precipitation for the upper Blue Nile basin within Ethiopia, including a suite of predictors from the land-ocean-atmosphere system that capture various aspects of the summer rainfall. The forecast ensembles demonstrate significant ability to predict the tendency of the upcoming season in comparison to climatology, and provide skillful exceedance or nonexceedance probabilities of flood or drought conditions. These abili-ties are extremely valuable to basin managers and decision-makers. on a local level, the forecast model also serves farmers in crop planning and management by predicting the seasonal precipitation. The model proves to be an important and worthwhile fac-tor for inclusion in planning, and superior to climatology when utilized over a period of a few years or longer.
Extensions to this work include disaggregating the forecast to monthly timescales and into more localized regions for better prediction. Typically, as the prediction area is re-duced, the capabilities of a refined model increase. Other basins may also be explored.
Optimal crop management, including recommendations of mixed use of seed (e.g. 60 per cent high quality, 40 per cent average) based on forecasts is also of value, and anticipated to further improve the cumulative income of a farmer versus one who solely utilizes climatology.
7 ConclusionsEthiopia’s heavy reliance on agriculture, combined with a susceptibility to frequent cli-mate extremes, has left it in a precarious position, vulnerable to hydrologic variability in both directions. It disallows local farmers, especially the vast majority of subsistence

cpwf working paper 44
farmers, from building any investment, as even several consecutive successful growing seasons may quickly be nullified by one devastating year. The same may be said for the country-wide economy, as it is based predominantly on the agricultural sector.
The first part of this paper outlines the effects and conditions of hydrologic variability, as well as associated depleting natural resources. climate extremes are not uncommon, causing floods or droughts, which have been reported to occur nearly once every three years. deforestation and land degradation are creating massive amounts of soil ero-sion, robbing fertile cropland of nutrients and increasing the sediment load of rivers and streams. groundwater is also unable to be recharged to the same degree, and there is believable speculation that the local climate has changed in the absence of trees.
The second part of the paper presents investment strategies aimed at decreasing Ethiopia’s vulnerability to hydrologic variability. Three projects and policies are evalu-ated. The objective of each project is to assess its influence on the economy, be it at a country-wide or local scale. The first investment project weighs irrigation against roads, and ultimately favors the irrigation project, which includes infrastructure for irrigating 274,000 hectares. The benefit-cost ratio over the 12-year simulation varies between 1.08-0.79, providing a belief that over the life of the project, the benefit-cost ratio would be greater than 1.0, making it a viable project. This does not imply that infra-structure for road construction is not a practical project, as a combination of the two also fares quite well. Although the current version of the model is not capable of finding the optimal combination of irrigation and road construction, that is ultimately the next logical step. It is quite clear that the implementation of this (these) projects decreases the vulnerability to hydrologic variability; irrigation alleviates potential crop failure in drought or dry years and increases crop yields over rain-fed production, and all-weather road construction allows a product, whether it’s a crop or other commodity, to be trans-ported to a market.
The second project includes hydropower and irrigation development in the Blue nile basin. The IMPEnd model is employed to evaluate energy and crop production under a variety of streamflow policies and climatic conditions. Most simulations produce benefit-cost ratios above 1.4 for the 5% policy case, and above 1.2 for the 50% policy case, with the exception of simulations including a growing number of El niño events and as-sociated decreased basin-wide precipitation, where benefit-cost ratios are as low as 1.0. Using a simple Ramsey growth model, the project also produces multipliers on gross do-mestic product ranging from 1.7-5.2 for various, giving further credence to the project viability. The irrigation portion of this project obviously lends itself toward heading off vulnerability in much the same way as the first project. Energy development, though, decreases vulnerability by creating a large sustainable boost to the economy through the energy sector, in both electrifying Ethiopia and selling excess energy to neighboring countries. This sustainable source helps to alleviate potential shocks created by climate extremes. Even in relatively dry years, once the reservoirs are filled, some energy will still likely be produced. The danger comes, however, if the basin climate shifts sub-stantially toward drier conditions and the reservoirs are rarely at design height. This projection, if it came to fruition in the first half of the century, could render the project impractical.The final project involves creating a forecast model for summertime precipitation to be utilized in basin management and farm planning. The model clearly outperforms clima-tology, giving good indication of the expected condition (shifts toward wet, normal, or dry seasons), and the potential of drought or flood conditions. This information allows
cpwf working paper 45
basin managers to prepare accordingly, and is especially instrumental if food aid may be necessary, giving them some lead time. A demonstration of the usefulness of the model for farm planning is also presented. Farmers utilizing the forecast to determine which quality of seed to plant tend to fair better in the long run than farmers strictly utiliz-ing high or average quality seed. The present forecast model version will not outper-form climatology for each individual year, but does prove successful over the long term. The implications of using the model to combat vulnerability are quite clear, although not without fail. some years, the model may recommend not planting any crop if the forecast is for very dry or very wet conditions, but this may not be a viable option for a subsistence farmer. surveys have often portrayed farmers in developing countries as hesitant to change, with strong tendencies toward safety and security. Future versions of the farm planning model, including the forecast model, may incorporate some form of these qualitative parameters.
Potential combinations of investments have not been explicitly evaluated, however all three projects tend toward viability. The first and second projects have some overlap in irrigation development, but the projects would otherwise be separate and non-interfer-ing. Although the investment costs for the third project were not determined, it would certainly have the smallest requirement, and may most easily be combined with one of the other two. This is logical from both a financial and inclusive perspective, focusing on both irrigation and rain-fed croplands.
continued conservation efforts are also important for mitigating long-term vulnerability, specifically afforestation and land management. This is arguably difficult to accomplish, given limited means and the lack of immediate returns, but may be successful at the local level. Increasing treed areas not only retains soil for fertility, but gives the local community wood for fuel and building. success demands constant, sustainable rates of planting and cutting.
Even amongst the backdrop of extreme hydrologic variability, the future of Ethiopia is not without promise. Ethiopia possesses immense water resources and agricultural potential, predominantly all of which remain untapped. well designed investments and conservation may begin to bring economic stability and decreased vulnerability. The steps may be slow and small, but toward a stronger country.

cpwf working paper 46
BIBlIogRAPHY
Abdelhadi, A., A. Mishra, T. Hata, H. Tanakamaru, and A. Tada, 2005: Simulation of Dams Operation along the Blue Nile with Real-Time Planning for Winter Plantation in the Sudan. ealfor.ans.kobe-u.ac.jp/hadi/Indiaconference.pdf
Arsano, Y. and I. Tamrat, 2005: Ethiopia and the Eastern nile Basin. Aquatic Sciences 67, 15-27.
Balmaseda, M., d. Anderson, and M. davey, 1994: Enso prediction using a dynamical ocean model coupled to statistical atmospheres. Tellus 46a, 497-511.
Beltrando, g., P. camberlin, 1993: Interannual variability of rainfall in the eastern Horn of Africa and indicators of atmospheric circulations. International Journal of Climatology 13, 533-546.
Bishaw, B., 2001: deforestation and land degradation in the Ethiopian Highlands: A strategy for Physical Recovery. Northeast African Studies 8(1), 7-26.
Bhalla, n., 2002: Ethiopia’s forests face extinction. January 17, 2002. BBc news.
Block, P., k. strzepek, M. Rosegrant, and X. diao, 2006a: Impacts of considering cli-mate Variability on Investment decisions in Ethiopia. EPT Discussion Paper 150, Inter-national Food Policy Research Institute, washington, d.c.
Block, P., 2006b: Integrated Management of the Blue Nile Basin in Ethiopia: Precipita-tion Forecast, Hydropower, and Irrigation Modeling. Phd dissertation, University of colorado – Boulder.
Block, P. and B. Rajagopalan, 2006c: Interannual Variability and Ensemble Forecast of Upper Blue nile Basin Kiremt season Precipitation. Journal of Hydrometeorology (ac-cepted).
Bodo, B., 2001: Monthly discharge data for world Rivers. dss.ucar.edu/datasets/ds552.1
Bourne, s., 2005: Personal communication at gwRI.
Bowman, A., and A. Azzalini, 1997: Applied smoothing techniques for data analysis. ox-ford University Press, new York.
Bureau of Reclamation, Us department of Interior, 1964: land and water Resources of Blue nile Basin: Ethiopia. Main Report and Appendices I-V. Government Printing Office, washington, d.c.
Bureau of Reclamation, Us department of Interior, 1976: selecting Hydraulic Reaction Turbines. Water Resources Technical Publication, Engineering Monograph No. 20. gov-ernment Printing Office, Washington, D.C.
camberlin, P., 1995: June-september rainfall in north-eastern Africa and atmospheric

cpwf working paper 47
signals over the tropics: A zonal perspective. International Journal of Climatology 15, 773-783.
camberlin, P., 1997: Rainfall anomalies in the source region of the nile and their con-nection with Indian summer monsoon. Journal of Climate 10, 1380-1392.
camberlin, P., s. Janicot, and I. Poccardi, 2001: seasonality and atmospheric dynamics of the teleconnection between African rainfall and tropical ocean surface temperature: Atlantic vs. Enso. International Journal of Climatology 21(8), 973-1005.
CIA (Central Intelligence Agency), 2006: The World Factbook. cIA, washington, d.c.
chinadaily.com, 2006: Chinese Firm wins Ethiopia’s road construction contract. chinadaily,com, July 30, 2006.
chinowsky, P., 2006: Personnel communication at the University of colorado-Boulder.
clark, M., s. gangopadhyay, d. Brandon, k. werner, l. Hay, B. Rajagopalan, and d. Yates, 2004: A resampling procedure for generating conditioned daily weather sequenc-es. Water Resources Research 40, w04304.
Conway, D. and M. Hulme, 1993: Recent fluctuations in precipitation and runoff over the nile sub-basins and their impact on nile discharge. Climate Change 25(2), 127-151.
conway, d., 1996: The Impacts of climate Variability and Future climate change in the nile Basin on water Resources in Egypt. International Journal of Water Resources De-velopment 12(3), 277-296.
conway, d., 2000: The climate and hydrology of the Upper Blue nile, Ethiopia. Geo-graphical Journal 166, 49-62.
conway, d., 2004: From headwater tributaries to international river: observing and adapting to climate variability and change in the nile basin. Global Environmental Change 15, 99-114.
cook, k., 1997: large-scale Atmospheric dynamics and sahelian Precipitation. Journal of Climate 10, 1137-1152.
craven, P., and g. wahba, 1979: smoothing noisy data with spline functions. Journal of Numerical Mathematics 31, 377-403.
cropwat, Version 4.3, 1999: Rome: Food and Agriculture organization of the United nations.
dai, A., k. Trenberth, and T. Qian, 2004: A global data set of Palmer drought severity Index for 1870-2002: Relationship with soil moisture and effects of surface warming. Journal of Hydrometeorology 5, 1117-1130.
degefu, w., 1987: some aspects of meteorological droughts in Ethiopia. Drought and Hunger in Africa. Glantz MH (ed.) Cambridge University Press.

cpwf working paper 48
diao, X., A. nin Pratt , M. gautam, J. keough, J. chamberlin, l. You, d. Puetz, d. Resnick, and B. Yu. 2005: growth options and poverty reduction in Ethiopia, A spatial, economywide model analysis for 2004–15. DSG Discussion Paper No. 20. International Food Policy Research Institute, washington, d.c.
Dreamflows, 2006: www.dreamflows.com
druyan, l., and R. koster, 1989: sources of sahel precipitation for simulated drought and rainy seasons. Journal of Climate 2, 1438-1446.
dubale, P., 2001: soil and water Resources and degradation Factors Affecting Produc-tivity in the Ethiopian Highlands Agro-Ecosystems. Northeast African Studies 8(1), 27-52.
Eklundh, l., P. Pilesjo, 1990: Regionalization and spatial estimation of Ethiopian mean annual rainfall. International Journal of Climatology 10, 473-494.
Eldaw, A., J. Salas, L. Garcia, 2003: Long-range forecasting of the Nile River flows using climatic forcing. Journal of Applied Meteorology 42, 890-904.
FAo, 1998: crop Evapotranspiration: guidelines for computing crop water Require-ments. FAO Irrigation and Drainage Paper No. 56. Rome: Food and Agriculture organi-zation of the United nations.
FAo of the United nations/government of Italy cooperative Program. Nile Basin Water Resources Management. Rome, Italy, 2004.
FAosTAT data, 2004: faostat.fao.org
gamachu, d., 1977: Aspects of climate and water budget in Ethiopia. Addis Ababa Uni-versity Press: Addis Ababa.
gAMs 2.0.29.8, 2005: general Algebraic Modeling software. washington, d.c.
georgakakos, A., 2004: Decision Support Systems for Integrated Water Resources Man-agement with and Application to the Nile Basin. IFAc workshop, Venice, Italy.
gissila, T., E. Black, d. grimes, J. slingo, 2004: seasonal forecasting of the Ethiopian summer rains. International Journal of Climatology 24, 1345-1358.
gleick, P., 1991: The vulnerability of runoff in the nile basin to climate changes. The Envir. Profl. 13(1), 66-73.
global Financial data, 2006: www.globalfindata.com.
grantz, k., B. Rajagopalan, M. clark and E. Zagona, 2005: seasonal shifts in the north American Monsoon, Journal of Climate (in review).
Griffiths, J., 1972: Ethiopian Highlands. World Survey of Climatology, Landsberg H (ed.). climates of Africa, vol. 10. Elsevier: Amsterdam, 369-388.

cpwf working paper 49
guariso, g., and d. whittington, 2002: Implications of Ethiopian Water Development for Egypt and Sudan in Water Resources and Economic Development. Edward Elgar Pub-lishing, chapter 10.
guttman, n., J. wallis, and J. Hosking, 1992: spatial comparability of the Palmer drought severity Index, Water Resources Bulletin 28, 1111- 1119.
Haile, T., 1987: A case study of seasonal forecasting in Ethiopia. WMO regional associa-tion I. geneva, switzerland, 53-76.
Harshadeep, n., 2006: Personal communication at the world Bank.
Helsel, d., R. Hirsch, 1995: Statistical methods in water resources. Elsevier science: Amsterdam.
Hurst, H.E., 1952: The Nile. England: constable and company.
Inocencio, A., M. kikuchi, d. Merrey, M. Tonosaki, A. Maruyama, I. de Jong, H. sally, and F. Penning de Vries, 2005: lessons from Irrigation Investment Experiences: cost-reduc-ing and Performance-enhancing options for sub-saharan Africa. Final Report. Interna-tional water Management Institute.
IPCC (Intergovernmental Panel on Climate Change), 2001: Climate Change 2001: The Scientific Basis. cambridge University Press, cambridge, U.k.
IRIN (Integrated Regional Information Network), 2002: Ethiopia: Report warns of loom-ing environmental disaster. January 7, 2002. United Nations Office for the Coordination of Human Affairs, new York, UsA.
Jabbar, M., J. Pender, and s. Ehui, 2000: Policies for sustainable land management in the highlands of Ethiopia: summary of papers and proceedings of a seminar held at IlRI, Addis Ababa, Ethiopia, 22-23 Amy 2000. Socio-economics and Policy Research Working Paper 30. ILRI (International Livestock Research Institute), Nairobi, Kenya.
Johnson, P. and P. curtis, 1994: water Balance of Blue nile River Basin in Ethiopia, Jour-nal of Irrigation and Drainage Engineering 120(3), 573-590.
kalnay, E., M. kanamitsu, R. kistler, w. collins, d. deaven, l. gandin, M. Iredell, s.saha, g. white, J. woollen, Y. Zhu, M. chelliah, w. Ebisuzaki, w. Higgins, J.Janowiak, k. c. Mo, c. Ropelewski, J. wang, A. leetmaa, R. Reynolds, R. Jenne, and d. Joseph, 1996: The ncEP/ncAR reanalysis 40-year project. Bulletin of the American Meteorology Society 77, 437-471.
kaczmarek, Z., 1993: water balance model for climate impact analysis, ACTA Geophysi-cal Polonica 41(4), 1-16.
kite, g., 1981: Recent changes in the levels of lake Victoria. Hydrological Sciences Bul-letin 26(3), 233-243.
lall, U., 1995: Recent advances in nonparametric function estimation: Hydraulic applica-

cpwf working paper 50
tions. Reviews of Geophysics 33, 1093-1102.
lall, U., and A. sharma, 1996: A nearest neighbor bootstrap for resampling hydrologic time series, Water Resources Research 32, 679-693.
levy, B. and g. Baecher, 1999: nilesim: A windows-based Hydrologic simulator of the nile River Basin, Journal of Water Resources Planning and Management 125(2), 100-106.
loader, c., 1999: Local Regression Likelihood. springer: new York.
Mansfield, E. and G. Yohe, 2004: Microeconomics, 11th Edition, w.w. norton & company, new York.
Mitchell, T., T. carter, P. Jones, M. Hulme, M. new, 2004: A comprehensive set of high-resolution grids of monthly climate for Europe and the globe: the observed record (1901-2000) and 16 scenarios (2001-2100). Tyndale Working Paper 55, Tyndale cen-ter, UEA, norwich, U.k.
MoFED (Ministry of Finance and Economic Development), 2006: Ethiopia: Status Re-port on the Brussels Programme of Action for Least Developed Countries. Addis Ababa, Ethiopia.
Mohamed, Y., B. van den Hurk, H. savenije, and w. Bastiaanssen, 2005: Hydroclimatol-ogy of the nile: results from a regional climate model. Hydrol. Earth Syst. Sci. Discus-sions 2, 319-364.
Moorehead, A., 1971: The White Nile, Harper & Row, new York.
Morel-seytoux, H., H. Fahmy, and J. lamagat, 1993: A composite hydraulic and statisti-cal flow-routing method. Water Resources Research 29(2), 413-418.
Murakami, M., 1995: Managing Water for Peace in the Middle East: Alternative Strate-gies. United nations University Press: Tokyo, new York, Paris.
Mutai, c. and M. ward, 2000: East African rainfall and the tropical circulation/convection on intraseasonal to interannual timescales. Journal of Climate 13(22), 3915-3939.
nakicenovic, n. et al., 2000: Special Report on Emissions Scenarios: A Special Report of Working Group III of the IPCC. cambridge University Press, cambridge, U.k.
nicholson, s., J. kim, 1997: The relationship of the El niño-southern oscillation to the African rainfall. International Journal of Climatology 17, 117-135.
nile Basin Initiative, 1999: www.nilebasin.org.
ntale, H., T. gan, 2004: East African rainfall anomaly patterns in association with El niño/southern oscillation. Journal of Hydrologic Engineering 9, 257-268.
nMsA, 1996: Climate and agroclimate resources of Ethiopia. nMsA Meteorological Re-

cpwf working paper 51
search Report series, vol. 1, no. 1, Addis Ababa.
o’lenic, E., 2006: Personal communication at 2006 Joint Assembly.
osman, M., P. sauerborn, 2002: A preliminary assessment of characteristics and long-term variability of rainfall in Ethiopia – basis for sustainable land use and resource management. Conference in International Agriculture Research, Deutscher Tropentag, witzenhausen, 9-11 october.
Palmer, T., 1986: Influence of the Atlantic, Pacific, and Indian Oceans on Sahel rainfall. Nature 322, 251-253.
People’s daily, 2002: Roundup: Ethiopia faces worsening forest denudation. August 25, 2002. People’s daily online.
Prairie, J., B. Rajagopalan, U. lall and T. Fulp, 2005: A stochastic nonparametric Tech-nique for Space-Time Disaggregation of Streamflows. Water Resources Research (in review).
Rajagopalan, B., and U. lall, 1999: A k-nearest neighbor simulator for daily precipitation and other weather variables. Water Resources Research 35(10), 3089-3101.
Rajagopalan, B., k. grantz, s. Regonda, M. clark and E. Zagona, 2005: Ensemble streamflow forecasting: Methods and Applications. Advances in water science Method-ologies, Ed by U. Aswathanarayana, Taylor and Francis, netherlands.
Regonda, s., B. Rajagopalan, U. lall, M. clark and Y. Moon, 2005a: local polynomial method for ensemble forecast of time series, Nonlinear Processes in Geophysics, special issue on “Nonlinear Deterministic Dynamics in Hydrologic Systems: Present Activities and Future Challenges” 12, 397-406.
Regonda, s., B. Rajagopalan, M. clark and E. Zagona, 2005b: Multi-model Ensemble Forecast of spring seasonal Flows in the gunnison River Basin. Water Resources Re-search (in review).
Rao, c., and H. Toutenburg, 1999: Linear Models: Least Squares and Alternatives. springer, new York.
Reynolds, c., 2005: low water levels observed on lake Victoria. Report published on the web site for the Production Estimates and crop Assessment division of the UsdA Foreign Agricultural service, september 26, 2005.
Rogers, c. 2004: Development of a climate yield factor to assess climate-based risk to rainfed agriculture in Ethiopia: Description of methodology and results of Ethiopian climate data analysis. washington, d.c. International Food Policy Research Institute.
Rosegrant, M., 2006: Personnel communication at the International Food Policy Re-search Institute.

cpwf working paper 52
said, R., 1993: The River Nile: geology, hydrology and utilization. Pergamon Press.
saunders, M., and c. Fletcher, 2004: Verification of Spring 2004 UK City Temperature Seasonal Forecasts. department of space and climate Physics, University college, lon-don, Uk.
seleshi, Y., g. demaree, 1995: Rainfall variability in the Ethiopian and Eritrean highlands and its link with the southern oscillation index. Journal of Biogeography 22, 945-952.
seleshi, Y., U. Zanke, 2004: Recent changes in rainfall and rainy days in Ethiopia. Inter-national Journal of Climatology 24, 973-983.
shahin, M., 1985: Hydrology of the Nile Basin, Elsevier, Amsterdam.
singhrattna, n., B. Rajagopalan, M. clark and k. krishna kumar, 2005: Forecasting Thai-land summer monsoon rainfall. International Journal of Climatology 25, 649-664.
smith, R., 2006: Rains only add to Ethiopian hardships. April 7, 2006. BBc news.
Souza, F., and U. Lall, 2003: Seasonal to interannual ensemble streamflow forecast for ceara, Brazil: applications of a multivariate, semi-parametric algorithm. Water Resourc-es Research 39, 1307-1320.
strzepek, k., d. Yates, and d. El Quosy, 1996: Vulnerability assessment of water re-sources in Egypt to climatic change in the nile Basin. Climate Research 6(2), 89-95.
strzepek, k., 2006: Personnel communication at the University of colorado-Boulder.
sutcliffe, J., 1974: A hydrological study of the southern sudd region of the Upper nile. Hydrological Sciences Bulletin 19(2), 237-255.
sutcliffe, J. and Y. Parks, 1987: Hydrologic modeling of the sudd and Jongeli canal. Journal of Hydrologic Science 32(2), 143-159.
Tegenu, A., 2006: United nations commission on sustainable development. new York, nY.
Tekle, B., 2006: Construction of Kenya-Ethiopia highway begins. dehai news, July 13, 2006.
UsAId, 2003: Planning for the Next Drought: Ethiopia Case Study. March, 2003, wash-ington, d.c.
U.s. Army corps of Engineers, 2006: Civil Works Construction Cost Index System. washington, d.c.
Von storch, H., and F. w. Zwiers, 1999: Statistical Analysis in Climate Research. cam-bridge Univ. Press, cambridge.
walpole, R., R. Myers, s. Myers, k. Ye, and k. Yee, 2002: Probability and Statistics for
cpwf working paper 53
Engineers and Scientists. Prentice Hall, Upper saddle River, new Jersey.
whittington, d., X. wu, and c. sadoff, 2005: water resources management in the nile basin: the economic value of cooperation. Water Policy, 7, 227-252.
wilks, d., 1995: Statistical methods in atmospheric science: An Introduction. Academic Press: san diego.
willmott, c. and k. Matsuura, 2001: Terrestrial air temperature and precipitation: monthly and annual time series (1950-1999). center for climatic Research, department of geography, University of delaware, newark, dE.
WMO (World Meteorological Organization), 1981: Hydrometeorological survey of the catchments of lakes Victoria, kyoga, and Mobutu sese seko. wMo, geneva.
world Energy council, 2001: Survey of Energy Resources 2001. london, Uk.
world news network, 2006: Ethiopia Country Analysis Brief. www.wn.com
WWP (World Wide Projects, Inc.), 2006: Ethiopia: Construction contract award for planned $31,300,000 highway. Business Opportunities in Africa & the Middle East, sep-tember, 2004.
Xie, P., and P. Arkin, 1997: global precipitation: A 17-year monthly analysis based on gauge observations, satellite estimates, and numerical model outputs. Bulletin of the American Meteorological Society 78, 2539-2558. data provided by noAA/oAR/EsRl Psd at www.cdc.noaa.gov
Yates, d., 1996: watBal: An Integrated water Balance Model for climate Impact As-sessment of River Basin Runoff. International Journal of Water Resources Development 12(2), 121-139.
Yates, d. and k. strzepek, 1998: Modeling the nile basin under climate change. Journal of Hydrologic Engineering 3, 98-108.
Yates, d., s. gangopadhyay, B. Rajagopalan, and k. strzepek, 2003: A technique for generating regional climate scenarios using a nearest-neighbor algorithm. Water Re-sources Research 39(7), 1199.
Yohe, g., 2006: Personal communication at wesleyan University, Middletown, connecti-cut.