cprht wrnn & trtn -...
TRANSCRIPT

Copyright Warning & Restrictions
The copyright law of the United States (Title 17, UnitedStates Code) governs the making of photocopies or other
reproductions of copyrighted material.
Under certain conditions specified in the law, libraries andarchives are authorized to furnish a photocopy or other
reproduction. One of these specified conditions is that thephotocopy or reproduction is not to be “used for any
purpose other than private study, scholarship, or research.”If a, user makes a request for, or later uses, a photocopy orreproduction for purposes in excess of “fair use” that user
may be liable for copyright infringement,
This institution reserves the right to refuse to accept acopying order if, in its judgment, fulfillment of the order
would involve violation of copyright law.
Please Note: The author retains the copyright while theNew Jersey Institute of Technology reserves the right to
distribute this thesis or dissertation
Printing note: If you do not wish to print this page, then select“Pages from: first page # to: last page #” on the print dialog screen

The Van Houten library has removed some of thepersonal information and all signatures from theapproval page and biographical sketches of thesesand dissertations in order to protect the identity ofNJIT graduates and faculty.

PACKED BED HEAT TRANSFER
BY
ANTHONY W. SPOSARO
A THESIS
PRESENTED IN PARTIAL FULFILLMENT OF
THE REQUIREMENTS FOR THE DEGREE
OF
MASTER OF SCIENCE WITH A MAJOR IN CHEMICAL ENGINEERING
AT
NEWARK COLLEGE OF ENGINEERING
This thesis is to be used only with due regard tothe rights of the author. Bibliographical refer-ences may be noted, but passages must not be copiedwithout permission of the College and without creditbeing given in subsequent written or published work.
Newark, New Jersey1962
Library
Newark College of Engineerirtg

The use of various published correlations to deter-
mine apparent thermal conductivities was found to give
results of differing magnitudes. For this reason when
these values were utilized in the theoretical relation-
hips proposed by McAdams:
tw -t2/tw-t1 = 0.692e-23.14X + 0.1312e-121.9X+ 0.0535e -299.6
in which. X is defined as
X = (KaL/CpG0Dt2)
for packed bed systems the results were found to be
inconsistent.
In this investigation a dimensionless equation:
Ka/kg = K1.32a 0.00105(DpGo/εpμ)
has been developed which permits the prediction of apparent
thermal conductivities to air flowing through a 1 inch tube
packed with glass beads. The eouation gives satisfactory
results for ratios of Dp/Dt from 0.15 to 0.22 and a modified
Reynolds number of 526 to 3990.
The effect of voids in the packing material was studied
and a porosity was included in the modified Reynolds number
used in correlating the data.

APPROVAL OF THESIS
FOR
DEPARTMENT OF CHEMICAL ENGINEERING
NEWARK COLLEGE OF ENGINEERING
BY
FACULTY COMMITTEE
APPROVED:
NEWARK, NEW JERSEY
JUNE, 1962
11

ACKNOWLEDGEMENT
The author acknowledges with gratitude his debt to
Doctor Jerome J Salamone, who guided the course of this
investigation and the writing of this manuscript. He is
indebted also to Robert S. Emanuel, Division Plant Super-
intendent, at the Harrison Gas plant of the Public Service
Electric and Gas Company of New Jersey for supplying the
space and equipment and to his wife who typed this manus-
cript.
ii

TABLE OF CONTENTS
ABSTRACT i
APPROVAL OF THESIS BY FACULTY COMMITTEE ii
ACKNOWLEDGEMENTS iii
LIST OF FIGURES v
LIST OF TABLES vi
INTRODUCTION TO THESIS INVESTIGATION 1
THEORY OF HEAT TRANSFER TN PACKED BED SYSTEMS 4
REVIEW OF PRIOR WORK IN PACKED BED HEAT TRANSFER 8
DESCRIPTION OF APPARATUS 17
PROCEDURE OF TESTS 25
DISCUSSION OF RESULTS AND CONCLUSIONS 29
RECOMMENDATIONS FOR FUTURE WORK 33
TABLE OF NOMENCLATURE 34
REFERENCES 37
APPENDIX 39
iv

LIST OF FIGURES
1.
APPARATUS FOR DETERMINATION OF HEAT-TRANSFER-COEFFICIENTS
202.
HEAT TRANSFER BED CHAMBER 213.
THERMOCOUPLE WELL STUFFING BOX 22
4.
ROTANETER CALIBRATION CURVE 23
5.
HEAT TRANSFER THROUGH THE PACKED BED 32

LIST OF TABLES
1.
ROTAMETER CALIBRATION CURVE DATA 22
2.
TEMPERATURE SUMMARY, 4mm PARTICLES, 24 INCH
BED HEIGHT RUN No.1 and No.2 513.
TEMPERATURE SUMMARY, 5mm PARTICLES, 24 INCH
BED HEIGHT RUN No.1 and No.2 52
4.
TEMPERATURE SUMMARY, 6mm PARTICLES, 24 INCH
BED HEIGHT RUN No.1 and No.2 52
5.
TEMPERATURE SUMMARY, 4mm PARTICLES, 36 INCH
BED HEIGHT RUN Noel 54
6.
TEMPERATURE SUMMARY, 4mm PARTICLES, 36 INCH
BED HEIGHT RUN No.2 55
7.
TEMPERATURE SUMMARY, 5mm PARTICLES, 36 INCH
BED HEIGHT RUN No.1 and No.2 56
8.
TEMPERATURE SUMMARY, 6mm PARTICLES, 36 INCH
BED HEIGHT RUN No.1 and No.2 57
9.
EXPERIMENTAL DATA SUMMARY, 4mm PARTICLES,
24 INCH BED HEIGHT RUN No.1 and No.2 58
10.
EXPERIMENTAL DATA SUMMARY, 5mm PARTICLES,
24 INCH BED HEIGHT RUN N-0.1 and No.2 59
11.
EXPERIMENTAL DATA SUMMARY, 6mm PARTICLES,
24 INCH BED HEIGHT RUN N0.1 and No.2 60
12.
EXPERIMENTAL DATA SUMMARY, 4mm PARTICLES,
36 INCH BED HEIGHT RUN No.1 61
13.
vi

13.
EXPERIMENTAL DATA SUMMARY, 4mm PARTICLES,
36 INCH BED HEIGHT RUN No.2 62
14.
EXPERIMENTAL DATA SUMMARY, 5mm PARTICLES,
36 INCH BED HEIGHT RUN No.1 and No. 6315.
EXPERIMENTAL DATA SUMMARY, 6mm PARTICLES,
36 INCH BED HEIGHT RUN No.1 and No. 64
vii

INTRODUCTION
McAdams 12 proposed that when a fluid flows at a
constant mass rate through a packed bed system and heat
is supplied or removed at the wall, an apparent thermal
conductivity could be defined by the following equation:
Cjt - K a. ((fat 4 1 .4. t 6.2 tcfX GoCp crr (1-x (1)
Neglecting axial conduction, equation (1) was in-
tegrable for a constant wall temperature and uniform
mass velocity and becomes:
t -to 4X - 0.892e -23 ' 14X+0.1312e-121 ' - +0.0535e -299 ' 6Xtw-tl (2
in which X is defined as:
= (ICaL/CpG0Df) (3 )
For X values greater than 0.04 or for (t w-t2/t -ti)
less than 0.28 equation (2) will be accurate within one
percent and only the first part of equation (2) need be
used.
It was also proposed by McAdams 12 that the results
for packed bed systems could be expressed as the mean
heat-transfer-coefficient. The mean heat-transfer-coef-
ficient is based on the area of the tube wall and the
logarithmic mean of the terminal temperature differences:
hm = q/A(tw-t)m (4)

hm 5.79 ).1. 0.0912 CpG D L (5)
therefore for values of (tw-t2/tw-t1) less than 0.'8 ,
the first part of ecu tion (2) may be expressed in terms
of the mean heat-transfer-coefficient:
0
The theoretical relationship proposed by McAdams ¹²
for packed bed heat transfer has been found to be incon-
sistent when utilized with different apparent thermal con-
ductivities as determined by various published correlations.
The use of these correlations to calculate the apparent
thermal conductivity resulted in widely different values.
Due to the varying magnitudes of the apparent thermal con-
ductivity values obtained, it was felt that these correla-
tions were not especially practical for general design pur-
poses. It became apparent then that these published cor-
relations were valid only for the particular apparatus used
by the various investigators.
Due to the dubious results obtained, it was felt that
an investigation should be conducted to establish a rela-
tionship which would be useful for general design purposes.
It is not the objective of this investigation to solve the
problem of packed bed heat transfer completely. Due to the
complexity of the problem this investigation was limited to
the use of glass beads of several different diameters and
air as the fluid medium.

3
The investigational data was limited to mass rates of
flow and temperature differences of the fluid. It eras there-
fore decided to utilize the mean heat-transfer-coefficient
which could be calculated from the available experimental
data. Once the heat-transfer-coefficient was obtained, the
value of an apparent thermal conductivity was determined by
use of equation (5). It then became possible to derive a
dimensionless equation. This equation could then be used
to determine the apparent thermal conductivity of a packed
bed system within the limits of this investigation®

THEORY
Heat transfer in packed bed systems with a uniform
wall temperature takes place as a result of a combination
of the three basic methods of heat transfer. The temper-
ature gradient that exists between the conduit wall and
the bed transmits heat by conduction and convection to the
bed particles. The mechanics of heat transfer from the
bed to the fluid flowing through the bed takes place by
forced-convection and is affected by the mechanics of fluid
flow occurring adjacent to the solid surface. Heat trans-
fer can take place only when the temperature of the conduit
wall is different from the temperature of the fluid flowing
through the conduit. The mechanism of fluid flow past a
particle also governs the rate of heat and mass transfer in
forced-convection. Various studies have indicated that
turbulence-promoters such as bed particles materially increase
the rate of heat transfer to the flowing fluid.
When heat transfer takes place, the fluid, which is
glowing through a packed bed, is at the temperature of the
solid particles which make up the bed. At some distance
from the bed, the fluid is at a temperature of the undis-
turbed stream which is known as the thermal boundary region.
During turbulent flow the resistance to heat transfer is
composed of the resistance of the laminar sublayer, the
buffer layer, and the turbulent core?.

Since the investigations of Colburn 4 in 1931, numerous
studies have been conducted with different types of pack-
ing mat eri al to evaluate the relati onship that exists be-
tween heat-transfer coefficients, effective thermal con-
ductivity, and radial profiles within a packed bed, The
heat transf erred to air flowing through a tube packed with
solid spherical particles and having a uniformly heated
wall t emperature were measured by Col burn, These studies
were primarily conducted from an academic standpoint; how-
ev er, with the increased interest of the process industries
in re generators, which contained catalytic beds, they stim-
ul at ed the interest of numerous investigators in the
mechanism of heat transfer within packed bed systems. The
various mechanisms of transfer of heat which contribute to
the heat- transf er- coef ficient have been investigated and an
effective thermal conductivity has been defined. Argo1
suggest s that the effective thermal conductivity consists
of various heat transfer mechanisms and proposed the theory
that there was molecular conduction in the fluid phase,
radiation from one solid particle to another adjacent par-
ti cl e; turbulent mixing in the fluid phase, and by conduc-
tion from particle to particle by direct solid contact®
Kwong8 found, in hiss investigations, that the variations in
the eff ective thermal conductivity were only about 2% be-
tween alumina particles and steel balls when used as pack-
5

in material so that the heat transfer characteristics of a
packed bed are not -greatly improved by changing the packing
mat eri al.
Col burn established a relationship as a result of ex--
perimental data by which heat--transfer-coefficients could
be predict ed when the pressure drop through the packed bed
i s determined. Leva9 advances the theory that radial heat
conduction through the packing material affected the heat-
transfer-coefficient, and that the greater portion of the
heat transf erred to the core of the tube was through con-
vection and turbulence. It was also assumed that due to
the point to point contact between spheres in the packed
bed, the gas stream conveys heat to the side of the par-
t cl e that is nearer the center of the tube. The mechanism
i s characteri zed by heat flowing through the interface be-
tween the packing material surf ace and the gas fluid stream.
It was also established by experimental data that heat ex-
change between rough surfaces and moving fluids occurs at a
faster rate then heat exchang e over smooth planes. These
results are corroborated by findings of Reynolds and others.
The local convection-heat-transfer-coefficient is re-
lated to the temperature gradient at the surf ace of the
solid particle. Knudsen ? proposed the following equation on
f or flow past immersed particles:
6

Dimensionless groups such as the Nusselt, Prandtl,
peclet, and Stanton numbers are of particular interest and
physical significance. The Nusselt number is a ratio of
temperature gradients; the Prandtl number is a ratio of
the molecular diffusivity of momentum and molecular dif-
fusivity of heat; the Peclet number is a ratio of heat
transferred by convection and the heat transferred by con-
duction; the Stanton number is a ratio of the all heat
transfer rate and the heat transferred by convection. The
viscosity ratio group is also important in which it is a
ratio of the viscosity of fluid at bulk temperature and
the viscosity of the fluid at wall temperature.
7

REVIEW OP PRIOR 1071C
A search of a number of the numerous studies has been
made and an abstract of their significant findings in re-
lationship to heat transfer, packing material, correlating
factors, proposed equations to determine heat-transfer-
coefficients and the mechanics of heat-transfer-coefficients
and the mechanics of heat transfer is presented in the works
of the following authors
The relationship of heat-transfer-coefficients to
the packing material in a uniformly heated cylinder wall
with a fluid flowing through the bed was first investigated
by Colburn 4. He established, by experimental data, that
the heat-transfer-coefficients varied with the 0.83 power
of the mass velocities and with a function of the container.
Heat-transfer-coefficients could be estimated when air was
used as the fluid medium from the following derived equa-
tion;0.83
h = A' Go (7)
To obtain a general equation that would apply to any
gas in turbulent flow, the Reynolds equation was modified
and included with equation (7) to give the following gen-
eral equation;
0.2 0.83h 8A'Cp Go (8)

The experimental data obtained indicated that the
ratio of the diameter of the particle to the diameter of
the tube was the controlling factor in the differences ob-
tained with the various types of packing material studied.
The maximum heat-transfer-coefficient occurred at a ratio
of 0.15. Heat-transfer-coefficients were predicted for all
sizes of tubes and particles which have a ratio of Dp/Dt
between 0.04 to 0.32.
The thermal conductivity of packed beds without fluid
flow was investigated by Polock, Schumann, and Voss ²¹ in
1934. The thermal conductivity of a packed bed without
fluid flow which was due to radiation was derived by use
of the following equation:
3Kr 0.692C-0 DP( T\
100 (9)
In the absence of radiation and natural-convection s
the thermal conductivity of the bed was correlated by the
use of the following ratio of relationships:
KB/kg verses ks/kg (10)
Further investigations to determine a steady-state
heat transfer to gases flowing in turbulent flow through
Packed tubes vies started by Leva 9 ' 10 : 11 in 1947 and con-
tinued for a number of years. Heat-transfer-film-coeffici-
ents were determined and a general working equati on which
9

could be used to predict heat-transfer-coefficients for
similar systems was established. The original packing
material used has a low thermal conductivity and the shape
was roughly spherical, the surface smooth, and the ratios
of Dp/Dt was varied between 0.05 to 0.30.
The following equation was derived for the determin-
ation of heat-transfer-coefficients for Dp/Dt from 0.05
to 0.30:
-6Dp/Dtx0.90h 0.813(—) DpGo
DteM)(11)
equation (11) has a limitation in which heat-transfer-
coefficients can be predicted only when the value of the
Prandtl number was allowed to vary between 0.74 to 0.80.
This investigation also substantiated Colburn's data in
which the maximum heat-transfer-coefficient is attained
when the ratio of Dp/Dt is equal to 0.15.
Further investigations were conducted with the use of
several smooth, spherical non-uniform packings with differ-
ently shaped particles such as smooth cylinders and Raschig
rings. The thermal conductivity of these various packings
with differently shaped particles and varying surface
roughness could be predicted when the average arithmetic
diameter of the packing mixture was chosen for the diameter
of the material (Dp). Thermal conductivity of the various
10

packing materials was also found to influence the heat
transfer through the packed tubes. In order to substan-
tiate equation (11) the following equation was proposed
to predict heat-transfer-coefficients:
(12)
Systems having a ratio of Dp/Dt greater than 0.35
were found to have an effect on heat-transfer-coefficient
because of fluid channeling. Fluid channeling between th
bed and the tube wall resulted as the diameter ratio of
Dp/Dt was increased. When spherical packing arrangement
along the inside tube was in a regular geometric pattern,
the void space was predicted to be 47.5g. To compensate
for the variation created by fluid channeling, the follow-
ing eauation was proposed for values of Dp/D t that varied
from 0.35 to 0.60:
(13)
Radial temperature profiles of packed beds of alumina
and steel spheres were investigated by Kwong 8 and Smith.
The effective thermal conductivity was calculated with the
use of an IBM card-programmed computer from temperature
profiles at two bed depths. It was found that the thermal
conductivity varied considerably with the change of radial
positions within the packed bed and decreased rapidly near
11

12
the tube wall. When based on theory, calculated values of
the effect of particle size, fluid properties, and solid
properties were within reasonable limits at high Reynolds
numbers but below reasonable limits at low Reynolds num-
bers. However, to apply the calculations of the theory
proposed by Argo. Kwong found it necessary to have infor-
mation of the mass velocities, Peclet number, void fraction
profiles, and convection heat-transfer-coefficients between
the bed particles and the fluid.
The radial temperature profiles of a packed tube of
alumina cylinders were measured by Bunnell ³ et al. The mea-
surements were made at seven points across the bed diameter
and at various bed depths. Measurements indicated that the
gas and solid temperatures were identical near the center
of the tube. Temperature was found to vary considerably
with the mass velocity, which indicated that under the con-
ditions of the investigation the radial heat transfer de-
pended primarily on the characteristics of the gas rather
than the packing material. Effective thermal conductivities
were found to be about 0.1 to 0.4 B.t.u./(hr)(ft)(°F), and
were directly proportional to the mass velocity of the fluid
flow.
In an attempt to remove the effect of temperature, the
effective thermal conductivity was related to the physical
properties of the system. The final form of the proposed

relationship for the central portion of the tube is:
(14)
When the effect of temperature was considered in the cal-
culations of effective thermal conductivity, it was found
that it increased in direct proportion to the Reynolds
number. Results of the investigations also indicated that
there was no appreciable change in the effective thermal
conductivity with radial position until the tube wall was
approached.
The effective thermal conductivity of lead and steel
balls was investigated from the view-point of the theory
of heat-transfer mechanics by Singer and Wilhelm- 18. It
was proposed that the transfer of heat flows between par-
ticles through the points of contact of the bed particles
and the adjoining stagnant fluid. The heat flow then con-
tinues through the fluid phase by molecular conduction and
turbulent eddy conduction. An equation was derived from
this theory to calculate the effective conductivity of a
system:
(15)
in which kg is a function of the Reynolds number. With
Particles of low conductivity, the ratio of Ks/kg can be
neglected in equation (15). A correlation of Ka/kg as a
function of the Reynolds number was not obtainable for lead
13

and steel ball particles.
The effective thermal conductivities for cylindrical
and spherical packings having thermal conductivities from
0.1 to 100 B.t.u./(hr)(ft)(°F) were calculated by Felix
and Neill¹² . Their investigations resulted in a correla-
tion in which the following equation was proposed to cal-
culate effective thermal conductivities:
(16)
in which the values of 01 and C2 were 3.65 and 0.0106 for
cylindrical packings, and ³.4 and 0.00584 for spherical
packings.
The effective thermal conductivities of packing ma-
terial were investigated by Hougen and Piret6 in relation-
ship to the surface area of one piece of packing material
in a packed bed. With the use of dimensionless analysis
a correlation was obtained for the effective thermal con-
ductivity of a packed bed. The proposed equation is:
(17)
where the value of (Go 410-)44 ) varied from 130 to 2800 inGo
the investigations.
14

15
Values of effective conductivities were also
investigated by Vershoor and Schuit¹². Various types of
packing material were investigated and a correlation was
obtained with experimental data which were valid within
161; accuracy.
(18)
equation (18) was modified so that it could be used for
spherical particles:
(19)
The heat and mass transfer from a tube wall to the
fluids flowing through packed beds were investigated by
Yogi. and Wakao²³. In heat transfer, air was used as the
fluid and solid particles with low and high thermal con-
ductivities were included in their investigation to deter-
mine the effective thermal conductivities and wall heat-
transfer-coefficients. The dissolution rate of the coated.
material on the innerwall of the packed tube was measured
and wall mass-transfer coefficients were calculated. A
close similarity was found to exist between the jH and jD
factors for wall-transfer coefficients in the turbulent
flow region.

Steady-state heat transfer experiments were carried
out by Baumeister and Bennett² in a 4 inch I.D. transite
tube which was packed with steel spheres that varied from
5/32 to 3/8 inch diameters. Heat was generated in the
pellets by means of a high-frequency induction coil sur-
rounding the packed bed section. Average heat-transfer-
coefficients were calculated between the packing bed steel
spheres and the stream of air passing through the bed for
Reynolds numbers in the region of 200 to 10,400.
Reilly 17 proposed a new method by which the dif-
ferential equations which describe the unsteady-state heat
transfer in a stationary bed of small granular solid par-
ticles through which a fluid is flowing could be solved.
The method permits an arbitrary initial solid temperature
distribution and an arbitrary variation of inlet fluid
temperature. The solution derived from the new method
appeared easier to apply in practical applications rather
than methods previously published and that it afforded an
example of the versatility of the Fourier integrals and
series.
16
DESCRIPTION OF APPARATUS
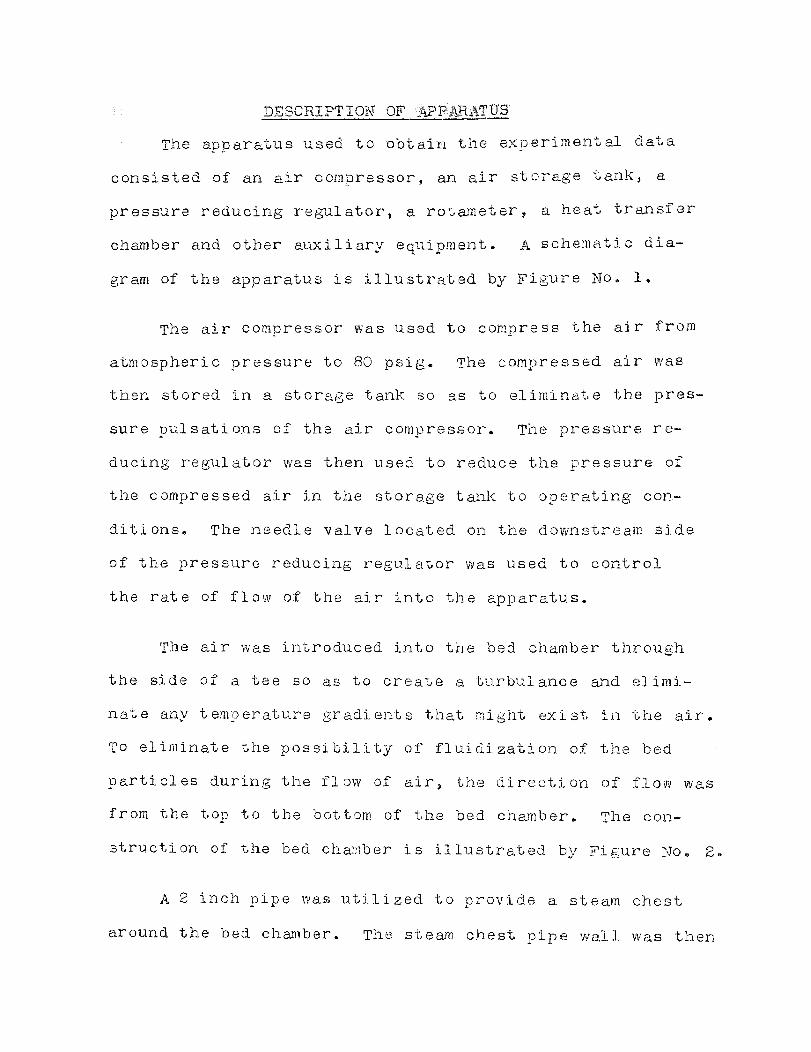
The apparatus used to obtain the experimental data
consisted of an air compressor, an air storage tank, a
pressure reducing regulator, a rotameter, a heat transfer
chamber and other auxiliary equipment. A schematic dia
gram of the apparatus is illustrated by Figure No, 1.
The air compressor was used to compress the air from
atmospheric pressure to 80 psig. The compressed air was
then stored in a storage tank so as to eliminate the pres
sure pulsations of the air compressor. The pressure re
ducing regulator was then used to reduce the pressure of
the compressed air in the storage tank to operating con
ditions. The needle valve located on the downstream side
of the pressure reducing regulator was used to control
the rate of flow of the air into the apparatus.
The air was introduced into the bed chamber through
the side of a tee so as to create a turbulance and elimi
nate any temperature gradients that might exist in the air.
To eliminate the possibility of fluidization of the bed
particles during the flow of air, the direction of flow was
from the top to the bottom of the bed chamber. The con
struction of the bed chamber is illustrated by Figure No. 2.
A 2 inch pipe was utilized to provide a steam chest
around the bed chamber. The steam chest pipe wall was then

18
drilled and tapped to install a steam trap, vents, a
steam gauge and a thermocouple well. The entire appara
tus was then lagged with 2 inches of magnesia pipe insula
tion and Super 66 insulation cement.
The temperature of the air at the rotameter was
measured by a mercurial thermometer, while the air at the
top of the packed bed particles, bottom of the packed bed
particles, and the inner tube wall surrounded by the steam
chest was measured by use of iron-constantan thermocouple
wire. One thermocouple well was placed approximately 1/4
inch below the perforated screen, another was placed approx
imately 1/2 inch above the bed. Particles while a third was
inserted into the steam chest so that it touched the wall
of the bed chamber. All the thermocouple wells were held
in place by a special designed stuffing box which is illus
trated by Figure No. 3. The voltages produced by these
thermocouples were measured with a portable millivolt poten
tiometer with an ice bath as the cold reference junction.
The various potentials produced by the thermocouples
immersed in the area above and below the packed bed particles
were influenced by local convection and radiation heat trans
fer. It was therefore necessary to correct the potentials
to obtain the true temperature of the air.
In order to ascertain the validity of the thermocouple

19
temperature as that of the entire bed chamber wail, a
steam pressure gauge was installed quite a distance from
the point of installation of the thermocouple in the
steam chest. An investigation was made of the wall tem-
perature of the bed chamber obtained by the thermocouple
and the saturated steam pressure. Comparison of the tem-
peratures indicated that the temperature difference ob-
tained by the two methods were negligible. Due to this
fact the temperature of the thermocouple was considered
valid for the entire wall surface of the bed chamber.
The rotameter was of the conventional laboratory test
type. Due to its range a set of two test meters were used
to calibrate the rotameter to standard conditions. The
calibration curve is illustrated by Figure No. 4.
The porosity of the various packed bed particles was
determined by first weighing a number of the glass particles
and then relating this weight to the weight of the actual
bed particles. The volume they occupied was then compared
to the volume of the empty tube. Then the porosity of the
packed bed was calculated.

1- PRESSURE GAUGE2- VENT3- STEAM INLET4- STEAM TRAP5- 2" SCH 40 PIPE
6- I"'SCH 40 PIPE7- THERMOCOUPLE8 - THERMOMETER9- ROTAMETER
10- PRESSURE REGULATOR11- AIR TANK12- AIR COMPRESSOR
FIGURE N° I APPARATUS FOR DETERMINATION OF HEAT-TRANSFER COEFFICIENTS

21
I - THERMOCOUPLE2- I" SCH 40 PIPE3 - 2" SCH 40 PIPE4- MAGNESIA PIPE
INSULATION5- GASKETS6- SCREEN7- PACKED BED8- PRESSURE GAUGE
FIGURE N°21 HEAT TRANSFER BED CHAMBER

2 9
STANDARD 1/8MALE F PIPE THREAD
9/.4 N°16 THREAD
4-.. 1.D, x 9,46 0.D. X 3/32
- ASBESTOS PACKING
FIGURE N°3: THERMOCOUPLE WELL STUFFING BOX

50
100
150
200
250
300
FIG
UR
E N
°4: R
OTA
MET
ER C
ALI
BR
ATI
ON
CU
RVE

TABLE NO. 1
ROTAMETER CALIBRATION CURVE DATA
SCALE
CUBIC FEET
TEMP.
BARO + METER
CORR
CORR. VOL.
READING
PER HOUR
DEG F
PRESS. " Hg FACTOR23CF/HR
1 .0
10.68
70.0
³0.20
.9806
10.48
11.5
21.40
71.0
30.25
.9795
20,97
2.0
32,95
69.0
³0.³3
.9876
32.55
³.0
51.15
70.0
30.32
.9846
50.37
5.0
91.37
70.0
30,41
.9875
90.23
7.0
1³4.25
71,0
30,40
.9845
132.17
9.0
180.88
72.0
30.52
.9858
178.32
11.0
226.28
70.0
30.71
.9920
224.47
1³.0
273.16
70.0
³0.74
.9985
272.76
15.0
322.66
71.0
30.76
.9964
³21,50

TEST PROCEDURE
The following procedure was followed to obtain ex-
perimental data for the various packed beds at different
superficial velocities:
1. The 1 inch bed chamber was filled with 4mm dia-
meter glass particles to a height of 12 inches. The
weight of the glass particles needed for this bed height
was determined by taking the weight of the particles be-
fore and after the bed height was established. The bed
chamber was then closed and the thermocouple above the bed
particles was adjusted to 1/2 inch above the 12 inch bed.
The apparatus was then pressure tested for leaks by closing
the downstream cock of the bed chamber and allowing the
pressure within the bed chamber to build up to 5 psig. At
this point the upstream cock to the bed chamber was closed.
If the pressure remained constant, both cocks were opened.
2. Once the apparatus was pressure tested, air was
allowed to flow through the rotameter and into the bed
chamber. The rate of flow through the bed chamber was then
adjusted to the desired rate by use of the needle valve at
the pressure regulator.
3. Steam was then admitted to the steam chest. To
eliminate any trapped air or water, the steam chest was
vented through the vent located at the top of the steam

25
chest and the condensate drain valve. After the steam chest
was completely vented and drained, the vent was closed and
the steam trap was put into service.
4. The air and steam were allowed to enter the appara-
tus until a steady-state of heat transfer had occurred. A
steady-state of heat transfer was indicated by constant
voltage readings from the various thermocouples installed
in the apparatus.
5. The rotameter was then rechecked for the desired
rate of flow through the bed chamber.
6. After the air rate and the voltages produced re
mained constant, the following experimental data was ob
tained:
a. Voltages produced at the top of the bed,
bottom of the bed, and at the steam chest.
b. Mercurial thermometer reading at the
rotameter.
c. Rotameter tube scale reading.
7. The experimental data was obtained at 5 minute
intervals for a period of 20 minutes. The average arith
metic value of the data obtained for the 20 minute test
period was then used for the final data calculation.
8. The air rate through the bed chamber was then

changed and steps o through 7 .Je -L'e repeated for the new
rate of flow.
9. Step 8 was then repeated for at least five dif-
ferent rates of flow through the bed chamber.
10. In order to reproduce the experimental data
steps through 9 were repeated with the same bed height.
11. The bed chamber was then disconnected and the
bed height was raised to 24 inches. The weight of the
glass particles needed for the increase of the bed height
was then determined by taking the weight of the particles
before and after the bed height was established. The bed
chamber was then pressure tested for leaks.
12. A series of tests was then conducted for the 24
inch bed height as outlined in steps 2 through 10.
13. The bed chamber was then disconnected and the bed
height was raised to ³6 inches. The weight of the glass
particles needed for the increase in bed height was then
determined by taking the weight of the particles before
and after the bed height was established. The bed chamber
was then pressure tested for leaks.
14. A series of tests was then conducted, namely steps
2 through 10 for the 36 inch bed height.

15. The bed chamber was then disconnected and the
4mm diameter particles were removed from the chamber.
16. Steps 1 through 15 were then repeated for the
5mm diameter particle,
17. Steps 1 through 15 were then repeated for the
6mm diameter particles.
28

DISCUSSION OF RESULTS AND CONCLUSIONS
it is difficult to prepare packed beds of various
particle diameters with the same tube diameter that would
result in the same percentage voids. For this reason, the
porosity of the various packed beds investigated was de-
termined and found to vary from 0.308 to 0.386. As
the ratio of the particle diameter to the tube diameter
increases, so does fluid channeling through a packed bed
system. The increase in fluid channeling results in lower
rates of heat transfer at similar rates of mass flow vel-
ocities. This fact is shown by the experimental data which
indicates that the mean heat-transfer-coefficient increased
as the porosity decreased. Since the porosity of a packed
bed system was found to exert an influence on the rate of
heat transfer, it became necessary to include it in one of
the parameters of the proposed new correlation.
The value of the mean heat-transfer-coefficient was
found to increase as the mass rate of flow was increased.
The experimental data indicates that the value of the mean
heat-transfer-coefficient varied from 0.747 to 69.0 as the
superficial velocity was increased from 132 to 4130. The
increase in heat transfer in turn resulted in apparent
thermal conductivity values which varied from 0.0099 to
0.979. Since the apparent thermal conductivity increased

with an increase in the mass rate or flow it became evident
that it must also be included in any new correlation.
The height of the steam chest was 48 inches, regard-
less of the height of the particles in the bed chamber.
Review of the experimental data obtained with the 12 inch
bed height indicated that the results were not reliable.
Furthermore the values of the unaccomplished temperature
ratio were greater than 0.28 which were not within the
limits of this investigation. For these reasons the data
obtained with the 12 inch bed heights were not included
in deriving the new correlation.
A plot of the average value obtained in the other
two runs conducted for the various diameter particles at
bed height of 24 inches and 36 inches are illustrated by
Figure No, 5. Inspection of the experimental data plotted
in Figure Na. 5 indicated that a fairly good straight line
existed between the two parameters. The equation of this
line is:
(20)
The values of the ratio of the apparent thermal con-
ductivity and the thermal conductivity of the gas were
calculated by means of equation (20). Comparison of the
results calculated by means of equation (20) and the ex-

perimental data resulted in a scattering of ± 15 percent.
This indicates that equation (20) can be used to estimate
heat transfer values for packed bed systems when the ratio
(Dp/Dt ) is 0.15 to 0.22 and the modified Reynolds number
falls between 526 and 3990.
The Prandtl numbers of carbon monoxide, hydrogen,
nitrogen, and oxygen are similar to air when calculated
at one atmosphere and 212 degrees Fahrenheit. Due to this
fact it is feasible to assume that heat transfer data may
be estimated for gases other than air by means of equation
(20). However due to the limited scope of this investiga-
tion it is only possible to predict heat transfer data for
a system of air and glass bead particles.
31

3 9
FIGURE N° 5: HEAT TRANSFER THROUGH THE PACKED BED

RECOMMENDATION FOR FUTURE V1 013K
This investigation indicates that heat transfer data
through packed tubes could be predicted for an air and glass
bed system by use of equation (20). However this equation
does not show the relationship that may exist in different
packing material or gas characteristics.
Due to the limits of this investigation future work
should give consideration to the effects of various types
of packing material such as iron balls, zinc balls, alumi-
num balls and copper balls. Other gases such as nitrogen,
oxygen and carbon dioxide should also be considered as the
fluid medium. Another variable to be considered is tube
diameter and its effect on heat transfer values. It is
suggested that the tube diameters be varied from 1/2 inch
to 3 inches.
Future work should also indicate whether equation (20)
may be applied to other packed tube systems or must be mod-
ified so that it would predict heat transfer data for dif-
ferent packing material or gas characteristics.

TABLE OF NOMENCLATURE
A Area of heat transfer surface, square feet; Ap for
surface area of particle; Al for ratio of Dp/Dt.
a Surface area of packing per unit volume of packed
bed, square feet per cubic foot.
CID Specific heat of fluid at constant pressure, Btu/
(lb)(deg F).
• Diameter, feet; D o for the outside diameter of tube;
DID for particle diameter; D t for inside diameter of
tube.
E Eddy diffusivity of heat, sq ft per hr.
e Base of Napierian or natural loarithms, 2.718.
IT Friction factor, dimensionless, defined by Eq. (12).
G Mass velocity of fluid, lb/(hr)(sq ft); Go for super-
ficial mass velocity based on total cross section
without particles.
gc Conversion factor in Newton's law of motion, 32.2 (ft)
(pounds matter)/(sec)(sec)(pounds force).
h Coefficient of heat transfer, Btu/(hr)(sq ft) (deg F);
hm for mean coefficient of heat transfer; h e for local
convection heat-transfer-coefficient; h„ for local

convection heat transfer correction;' h r for local
radiation heat transfer correction.
K Thermal conductivity of a fluid-solid system, Btu/
(hr) (sq ft)(deg F per ft); Kafor apparent thermal
conductivity; KB for thermal conductivity of packed
bed without fluid flow; Kr for thermal conductivity
of packed bed due to conduction through solids and
fillets at points of contact.
k True thermal conductivity, Btu/(hr)(sq ft)(deg F
per ft); kg for the gas; k s for the solid particles.
L Length of exchanger or packed bed, feet.
Q Volumetric flow rate, cubic feet per second.
q Heat transfer rate, Btu/hour.
r Radius, feet; r8 for volume of packing per unit
surface of packing®
T Temperature, degrees Fahrenheit absolute; (t+460).
t Temperature, degrees Fahrenheit; tl at inlet; t2 at
outlet; tg of gas; to at potentiometer; -Co ol' undis-
turbed stream; tw at wall.
V Velocity, feet per second.
w Mass rate of flow of fluid, pounds per hour.
35

36
X Dimensionless group defined by Eq. ( 3 )-
x Axial position from inlet, feet.
Greek
00 Molecular thermal diffusivity of fluid, sq ft per hr.
it Maximum fluctuation in regenerator outlet.
E" Emmissivity of solid surface, dimensionless.
ep Average fraction void in bed, dimensionless.
AL Viscosity of fluid, lb/(hr)(ft).
Density of fluid, lb per cubic foot; g for the
density of the gas; s for the true density of the
solid particles.
Stefan-Boltzman constant, 0.1714 X 10 -8 .

REFERENCES
I. Argo, W.B. Smith, J.M., "Heat Transfer in PackedBeds", Chem.Engr.Progr., Vol. 49, (195³), p.443,448
2. Baumeister, E.B., Bennett, C.O., "Fluid ParticleHeat Transfer in Packed Beds", J.A.I.Ch.E., Vol.4,(1958), p.69
3. Bunnell, D.G., Smith, J.M., "Effective ThermalConductivities in Gas-Solids Systems", Ind.Engr.Chem.,V01.41, (1949), p.1977
A. Colburn, A.P., "Heat Transfer and Pressure Drop inEmpty Baffled and Packed Tubes", Ind.Engr.Chem.,Vol.23, (1931), p.910
5. Eckert, E.R.G., Hartnett, J.P., Irvine, T.F., "ChemicalEngineering Review", Ind.Engr.Chem., Vol.51, (1959),p.45³
6. Hougen, J.0., Piret, "Effective Thermal Con-ductivity of Granular Solids Through which Gases are
Flowing.", chem.Engr.Pro,gr. , Vol.47, (1951), p.295
7. Knudsen, J., Katz, D., "Fluid Dynamics and Heat Trans-fer", McGraw-Hill, N.Y., (1958), p.353,354
8. Kwong, S.S., Smith, J.M., "Radial Heat Transfer inPacked Beds", Ind.Engr.Chem., Vol.49, (1957), p.894,897
9. Leva, N., "Heat Transfer to Gases Through Packed Tubes",Ind.Engr.Chem., V01.39, (1947), p.857,860
10. Leva, M., Grummer, M., "Heat Transfer to Gases ThroughPacked Tubes", Ind.Engr.Che., V01.40, (1948), p.415
11. Leva, M., "Packed Tube Heat Transfer", Ind.Engr.Chem.,V01.42, (1950), p.2498
12. McAdams, W.H., "Heat Transmission", McGraw-Hill, 3rd Ed.,N.Y., (1954), Chapter 11
13. McCabe, W.L., Smith, J.C., "Unit Operations of ChemicalEngineering", McGraw-Hill, N.Y., (1956)
14. Molino, E., Haugen, O., "Thermal Conductivity of GranularSolids Through which Gases are Flowing, Chem.Engr.Progr., (1952), p.141
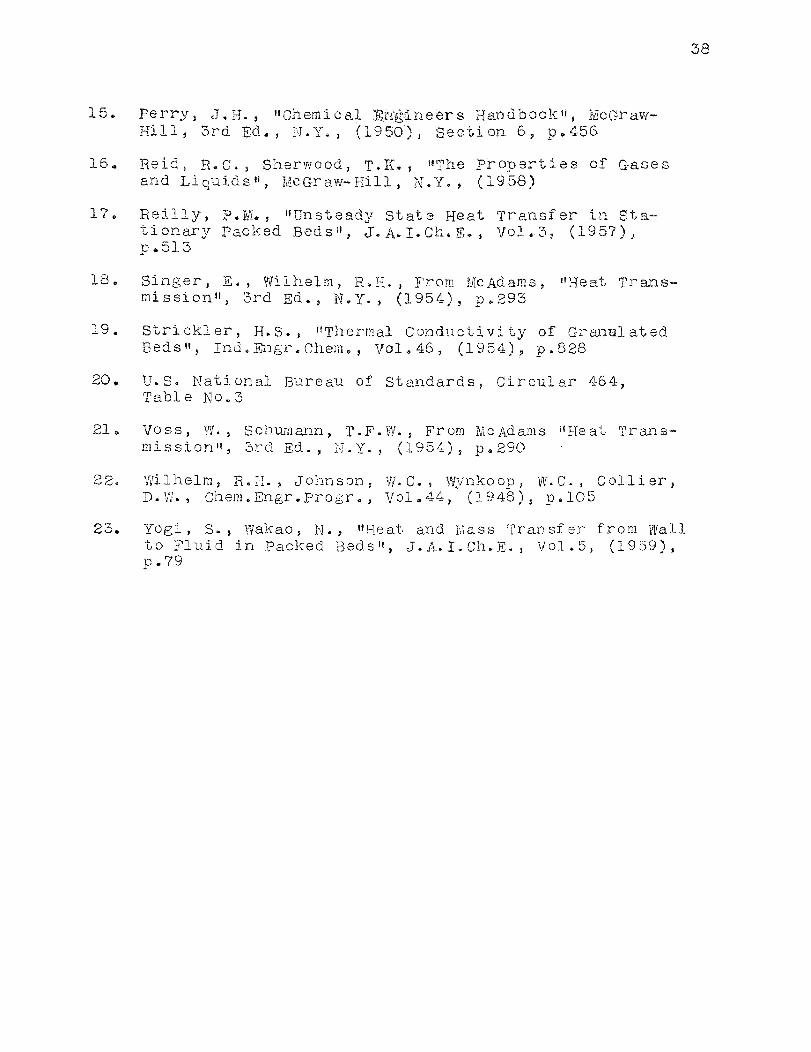
15. Perry, J.H., "Chemical Engineers Handbook", McGraw-Hill, 3rd Ed., N.Y., (1950), Section 6, p.456
16. Reid, R.C., Sherwood, T.K., The Properties of Gasesand Liquids", McGraw-Hill, N.Y., (1958)
17. Reilly, P.M., "Unsteady State Heat Transfer in Sta-tionary Packed Beds", J.A.I. Ch.E., Vol.3, ( 19 5 7 ))n.51³
18, Singer, E., Wilhelm, R.H., From McAdams, "Heat Trans-mission", 3rd Ed., N.Y., (1954), p.29³
19. Strickler, H.S., "Thermal Conductivity of GranulatedBeds", Ind.Engr.Chem., Vol.46, (1954), p.828
20. U.S. National Bureau of Standards, Circular 464,Table No.3
21, Voss, W., Schumann, T.F.W., From McAdams "Heat Trans-mission", 3rd Ed., N.Y., (1954), p.290
22. Wilhelm, R.H., Johnson, W.C., Wynkoop, W.C., Collier,D.W., Chem.Engr.Progr., Vol.44, (1948), 0.105
23. Yogi, S., Wakao, N., "Heat and Mass Transfer from Wallto Fluid in Packed Beds", J.A.I.Ch.E., V01.5, (1959),p.79
38

APPENDIX
Conversion Factors.
1 foot = 304.8mm
1 centipoise 2.42 lb/ft-hr
Dimensions of Steel Pipe.
1 inch Sch 40 steel pipe
Inside diameter 0.0875 ft
Cross sectional area 0.006 sq ft
Surface area 0.2745 Sq ft/ft
Ref: McCabe and Smith¹³ , Appendix 4, page 912
Viscosity of Air.
100°F 0.0438 lb/ft-hr
150°F 0.0479 lb/ft-hr
180°F 0.0484 lb/ft-hr
190°F 0.0490 lb/ft-hr
200°F 0.0503 1b/ft-hr
210°F 0.0510 lb/ft-hr
220°F 0.0517 lb/ft-hr
230°F 0.0524 lb/ft-hr
Ref: McCabe and Smith¹³ , Appendix 7, page 917
ific Heat of Air.
0°F 0.250 Btu/(lb)(°F)
200°F 0.252 Btu/(lb)(°F)
Ref: McAdams¹² , Figure A-3, page 464

Thermal Conductivity.
Air:
32°F 0.0140 Btu/(hr)(sq ft)(°F/ft)
150°F 0.0169 Btu/(hr)(sq ft)(°F/ft)
180°F 0.0173 Btu/(hr)(sq ft)(°F/ft)
190 0F 0.0178 Btu/(hr)(sq ft)(°F/ft)
200°F 0.0181 Btu/(hr)(sq ft)(°F/ft)
2120F 0.0184 Btu/(hr)(sq ft)(°F/ft)
220°F 0.0187 Btu/(hr)(sq ft)(°F/ft)
230°F 0.0190 Btu/(hr)(sq ft)(°F/ft)
Ref: McAdams 12 , Table A-12, page 457
Packing Material:
Borosilicate type glass 0.63 Btu/(hr)(sq ft)(°F/ft)
Ref: McAdams 1 2, Table A7-5, page 450
Emissivity of Material.
Stainless steel-type 304(Cr;18Ni) = 0.44-0.36
Ref: McAdams 12 , Table ,k-23, page 475
40

41
Bill of Material.
Quantity Description
2 1%48 " Soh 40 steel pipe
1 1 "X 48 Soh 40 steel pipe
1 1/2"X48" Sch 40 steel pipe
1 1 1%1 2" Soh 40 steel pipe
2 1 "X 3 " Soh 40 nipples
4 1 "X 6 " Sch 40 nipples
4 1/2 "`X 6 " Sch 40 nipples
3 l/2 "XI" Sch 40 reducers
2 1/21 "X1/2" Sch 40 elbows
4 "X1 "X 1 " Sch 40 tees
2 1 " Sob. 40 unions
2 1U Soh 40 screw type flanges
2 1" Bronze stop cocks, 150 psig WOG
1 1/4" Bronze test cock
3 1/2" Bronze gate -valves, 125 psig WOG
4 3/8 "X 4 it bolts
4 3/8" nuts
2 1/8" thick durabula gaskets
50 ft 1/29 0.D. copper tubing, type "iv
4 1/4"X1/2" copper tubing adaptors
4 1/2" 0.D. copper tubing flare fittings
1 1-1/2" diameter steel screen, .0030" thick,
.0420" hole diameter, .0782" holes, center to center
6-1/2 ft 2" pipe size magnesia pipe insulation

42
Pill of Material (continued)
Quantity Description
1/2 ft 5n pipe size magnesia pipe insulation
2 lbs Super 66 insulation cement
1 1/4n steam pressure gauge, 0-30 psig range
1 1/44 steam trap, 0-200 psig range, type AHV,
Nicholson Trap Co.
15 ft 1/211 O.D. stainless steel tubing, type #304(18-8),
.020" wall thickness
50 ft No. 20 gauge thermocouples, Iron-constantan,
fiber-glass insulated
3 1/2n bronze tubing adapters, swagelok type
1 1/211 pressure regulator, 0-30 psig range, type
67-49, Fisher Govenor Co.
1 Rotameter, 0-325 cubic feet per hour range
1 Millivolt potentiometer, model #8686, :Leeds-
Northrup Co.
3 lbs 4mm diameter glass beads, Kimax-KG-33
3 lbs 5mm diameter glass beads, Kimax-KG-33
3 lbs 6mm diameter glass beads, Kimax-KG-33
1 Test meter, type #AL: 0-20 cfh range, American
Meter Co.
1 Test meter, model #10-500, 0-600 cfh range,
Rockwell Manufacturing Co.
1 Stop watch
1 Manometer, 0-12u differential

Bill of Material (continued)
quantity Description
1 Barometer
1 Glass beaker, 60 mls
1 Copper beaker, 1,000 mis
1 Balance, Model Selecta, Sartorius Instrument Co.
1 Balance, double beam
2 Mercury thermometers, 0-220 deg F range
2 ft 1/4" I.D. rubber tubing
20 lbs Crushed ice
1 1/4" needle valve
43

To substantiate the validity of the use of equation
(5), the mean heat-transfer-coefficient was equated to
its values in the following manner:
44

45
ln 0.692 a 23.14KaL 421h;2! -0.3677
GoCpD GoCPDtf
4Lhm 0.3677 23.14KaLGoCpDt GoCpDt²
4 -m = 0.3677(GoCpDt)+ 23.14KaLDt
hm O.3677(GopDt) 23.14Ka4L 4 Dt
hm .O912GoCpDt 5.79KaDt

46
In order to obtain an average curve of the experimen-
tal data, the logarithm of average points resulted in a
group of five points which are listed below:
y 0.640 0.981 1.225 1.464 1.633
x 2.774 3.031 3.220 3.404 3.515
the average point of the first two points is (0.811, 2.903);
the average point of the last three points is (1.441, 3.380);
the slope was calculated by means of the following relation-
ship:
y2-y1 (1.441-0.811) 1.32x 2-x1 (3.380-2.903)
Since the points lie in an approximate straight line on
logarithmic coordinate paper, a curve of the power form is
indicated.
Y - Yl = m(x-xl)
y-O.811 1.32 (x-2.903)
y 1.32,x-3.021 = cxb
Therefore b = 1.32 and log c (-.021) , so that c .00105
the resultant collation is:
y .00105x 1.32
in which y is equal to Ka/kg and x is equal to (DpGo/epu).

47
SAMPLE CALCULATIONS
The following calculations ations are an example of the
numerous results found in the experimental data. summaries
of this thesis. Run No, 1, Test No. 3 of the 4mm diameter
glass beads at a bed height of 36 inches was sel ected as
an example.
Standard Cubic Feet per Hour.
1. Uncorrected volume 32.55 cfh
2. Air temperature, of 72.0
3. Temperature correction factor:
4. Corrected volume to standard conditions:
(Uncorr. Vol.) (Temp. Corr. Factor) 7. Corr. Vol .
at 60°F (32.55) (1.012) 32.94 cfh at 60°F
Density.
(29) ( 492)/359(Abs.temp.°F) lbs/cf
(14, 270 )/(191,000) r. 0.0747 lbs/cf
Mass Flow.
(Corr.Vol . at std, conditions) (Density) lbs/hr
( 32. 94) ( .0747) 2.46 lbs/hr
48
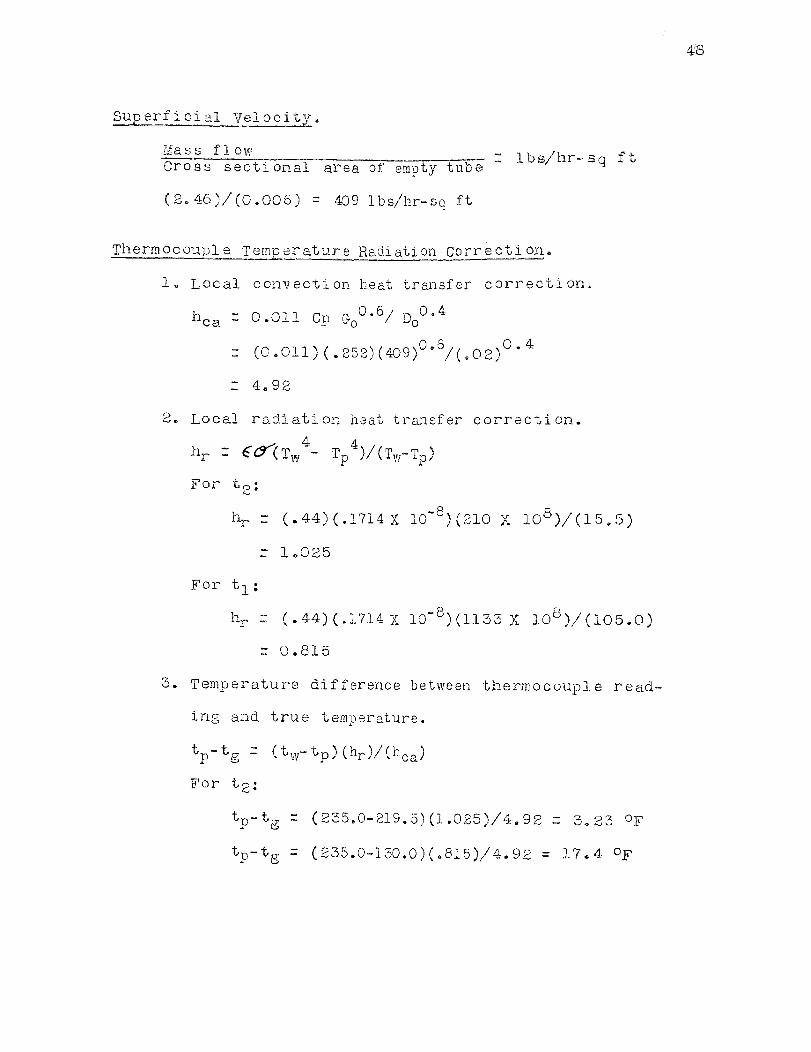
Superfici al is Velocity.
Cross sectional area of empty tube = lbs/hr- se ft
(2.46)/(0.005) = 409 lbs/hr-so ft
Thermocouple Temperature Radiation Correction.
1. Local convection heat transfer correction.
hca0.011 C13 Go0.6/ D00.4
(0.011) (.252)(4O9) ° 6 /(.02)0.4
4.92
2. Local radiation heat transfer correction.
hr eσ(Tw4 - Tp4)/(Tw-Tp)
For t2;
hr (.44)(.1714 X 10 -8 )(210 X 10 8 )/(15.5)
1.025
For t 1 :
hr (.44) (.1.714 X 10 -8 )(1133 X 10 8 )/(105.0)
0.815
3. Temperature difference between thermocouple
reading and true temperature.
tp- tg = (tw-tp) (hr)/(hca)
For t2:
tp- tg (235.0-219.5)(1.025)/4.92 3.23 °F
tp-tg (235.0-130.0)(.815)/4.92 = 17.4 °F
Mass fl ow

49
Porosity of Packed Bed.
Volume of voids porosityTotal vol. of empty tube
1. 50 particles of 4mm size 3.638 grams
36 inch bed height 738.6 grams
3. (738.6 / 3.6382) = ;03.4
4. (20 3.4)(50) = 10,185 particles
5. Volume of 4mm sphere:
(Diameter of sphere)³(0.5236)
(0.0131² ft) 3 (0.5²36) 7. 1.194 X 10 -6 cf
6. 36 inch bed of 4mm particles:
(Vol. of 1 sphere)(Total number of particles in bed)
(1.194 X 10⁻⁶ cf)(10,185) = .01215 cf(Vol. of bed)
7. Volume of empty tube:
(Diameter of circle)²(.7854)(feet of bed)
(.0875) 2 (.7854)(3.0) = 0.01806 of (Vol. of tube)
8. Porosity of bed:
(Area of tube-Area of ;particles) Area of empty tube
(.01806 - .01215) 0.3280.01806
Average Mean Heat-Transfer-Coefficient.
hm = q/A(tw - t) m
(w)(Cp)A[(t2-t1)
3.446(4. ²59(103.7) 7 ² f 1J3.7 1n(2.088/1.2
= 2.84 L..1,10( y
Newark College of Engineer i ng

Apparent Thermal Conductivity.
hm 5.79Ka/Dt -t- 0.0912(CpGoDt/L)
= 5.79Ka/0.0875 0.091 [(.25) (409) ( .0875)/3.0]
Ka (2.84-.273)(.0878)/(5.79)
.7. .0389
Ratio Ka/kg.
(.0389)/(.0171) "..1 2.27
Log 2.27 = 0.356
Ratio DpGo/ Fpm.
(.01312)(409)/(.328)(.0482) = 339
Log 339 = 2.530
Unaccomplished Temperature Ratio.
(tw-t2)/(tw-t1)
(235.0-216.3)/(235.0-1]2.6) = 0.166
50

TABLE No. 2
TEMPERATURE SUMMARY
4 mm GLASS BEADS - 24 INCH BED HEIGHT'
RUN TEST
POTENTIOMETER DEG F
AIR
tw-t2
NO
NO MILLIVOLTS
DEGREES F
(CORR.) TEMP.
twt
2t3tit2
tiDEG F tw-
tl
tw
11
6.110 5.662 3.985 240.0 225.0 169.1 222.7 159.2
70.0 0.214
1 2
6.090 5.810 3.170 239.3 230.0 142.0 228.9 133.0
70.3 0.098
1 3
6.075 5.851 2.874 239.0 231.5 131.7 230.9 124.3
71.3 0.070
14
6.015 5.850 2.690 236.9 231,3 125.7 231.0 119.6
74.3 0.050
1 5
5.965 5.810 2.605 235.3 230.0 122.9 229,6 117.8
73.3 0,049
2
16.115 5.660 3.980 240.1 225.0 169.0 222.8 159.2
77,3 0.214
2
2
6.080 5.795 2.954 239.0 229.5 133.9 228.4 124.4
74.1 0.093
2
3
6.085 5.850 2.775 239.1 231.3 328.5 230.9 120.9
74.1 0.069
2
4
6.070 5.900 2.775 238.7 233.0 128,5 232.6 122.3
73.9 0.052
2
5 6.080 5,930 2.995 239.0 234.0 135,9 233.7 131.0
74.1 0.049

TABLE No. 3
TEMPERATURE SUMMARY
5 mm GLASS BEADS - 24 INCH BED HEIGHT
RUN TEST
POTENTIOMETER DEG F
AIR
tw-t2
NO
NO,
MILLIVOLTS
DEGREES F
(CORR.) TEMP.
twt
2t1
t ,Iv
t2t1
t2
t/
DEG F tw-t1
1 1
6.025 5.865 5,355 237,1 231.9 214.9
230.8 211.2
80.5 0.243
1 2
6.190 5.940 4.075 242,7 234,3 172.2
233,4 165.3
83.1 0.120
13
6.255 6.000 3.815 243.6 236.3 163.4
235.8 157,3
86.1 0.090
14
6.205 6.020 3.625 243.1 237.0 157.2
236.6 152.7
85.7 0.072
15
6,190 6.010 2.535 242.7 236.7 120.4
236,4 115.4
84.0 0.050
2 1
6.245 6.045 5.425 244.1 237.8 217.1
237.1 212.9
83.1 0.224
2 2
6.275 5.990 4,285 245.1 256.0 379.1
239,1 172.2
83,3 0.137
2
36.3
00 6
.065 3
.845 2
46.0
238.5
164.5
237.7
157.9
80.5
0.0
94
24
6.2
95 6
.095 3
.725 2
45.9
239,5
160.4
239.0
155.8
79.7
0.0
77
2
56.2
95 6
.110 2
.605 2
45.9
240.0
122.8
239.6
11
7.7
21.1
0.0
40
01

TA
BLE
No.
4
TE
MPE
RA
TU
RE
SU
MM
AR
Y
6 m
m G
LA
SS
BE
AD
S -
24 I
NC
H B
ED
HE
IGH
T
RU
N T
ES
T P
OT
EN
TIO
ME
TE
R D
EG
F
AIR
tw-t
2N
O.
NO
,M
IL
LIV
OL
TS
D
EG
RE
ES
F
(C
OR
R.)
TE
MP
.tw
t2
ti
t2
t1
DE
G F
tw-
-t1
ti
tw
t2
11
6.1
60 5
.840 4
.915 2
41.7
231.0
200.1
229.5
193.8
74.9
0.2
55
12
6.1
70 5
.940 4
.635 2
42.0
234.3
190.9
233.6
185.6
74.7
0.1
49
13
6.1
65 5
.965 4
.335 2
41.9
235.1
180.9
234.5
176.0
76.0
0.1
12
14
6.1
75 5
.975 3
.945 2
42.1
235.5
167.9
235.1
163.9
75.9
0.0
89
15
6.2
05 6
.035 3
.710 2
43.1
257.5
160.0
237.2
156.1
75.7
0.0
68
21
6.1
20 5
.800 4
.900 2
40.3
229.7
199.7
228,2
193.9
77.0
0.2
61
2 2
6.1
35 5
.905 4
.645 2
40.9
233.1
191,1
232.3
186.3
77.0
0.1
57
23
6.1
35 5
.935 4
. 310 2
40.9
234.1
380.0
233.5
175.1
77.1
0.1
12
24
6.1
45 5
.945 3
.905 2
41.1
234.5
166.5
234.1
, 162.5
77.1
0.0
89
25
6.1
15 5
.950 3
.730 2
40.1
234.7
160.7
234.5
157.1
77.3
0.0
67

TABLE No, 5
TEMPERATURE SUMMARY
4 mm GLASS BEADS - 36 INCH BED HEIGHT
RUN TEST POTENTIOMETER
DEG F
AIR
tw-t2
NO.
NO. MILLIVOLTS
DEGREES F
(CORR.)
TEMP.
t
t2
tl
tw
t2
ti
t2
t1
DEG F tw-t1
w
11
6.015 5.320 3.660 237.9 213.7 158.3 205.2 132.1 75.3 0.309
12
5.925 5.295 3.520 233.9 212.9 153.7 207.4 134.0 75,3 0.265
13
5.960 5.495 2.820 235.0 219.5 130.0 216.3 112.6 72.7 0.166
1 4
5,940 5,585 2.170 234.3 221.3 108.0 219.6
93.8 72.0 0.105
1 5
6.010 5.710 2.12O 236.7 226.7 106.0 225.4
95.1 72.0 0.080
16
6.010 5.76O 2.045 236.7 228.7 103.5 228.0
95.1 72.7 0.062
17
6.010 5.780 1.965 236.7 229.0 100.9 228.4
93.1 72.7 0.058
18
6.010 5.855 1.800 236.7 231.1
95.0 230.8
88.0 72.5 0,040
01

TABLE No. 6
TEMPERATURE SUMMARY
4 mm GLASS BEADS - 36 INCH BED HEIGHT
RUN TEST POTENTIOMETER DEG F
AIR tw-t2
NO.
NO, MILLIVOLTS
DEGREES F ____L_ (CORR.).
twt2
ti
tw
t2
ti
t2
t1
DEG F tw-tl
2 1
5.960 5.264 3.625 235.0 211.8 157.1 204.0 131.7 75.0 0.300
22
5.955 5.316 3.530 234.8 213.6 154.0 208.1 134.2 75.0 0.266
2 3
5.950 5.500 2.815 234.7 219.6 129.9 216.4 112.5 72.5 0.150
24
5.940 5.540 2.175 234.3 221.0 108.1 219.3
93.9 72.3 0.107
25
5.950 5.660 2.105 234.7 225.0 105.5 223.9
94.9 72.7 0.078
26
5.950 5.620 1.990 234.7 223.7 101.7 222.8
93.5 72.5 0.084
2 7
6.010 5.785 1.970 236.7 229.1 101.0 228.5
93.2 72.7 0.057
2 8
5.950 5.790 1.790 234.7 229.3
94.7 229.0
87.9 72.7 0.039
5 5

TABLE No. 7
TEMPERATURE SUMMARY
5 mm GLASS BEADS - 36 INCH BED HEIGHT
.
RUN TEST
POTENTIOMETERDEG F
AIR
tw-tT
NO.
NO. MILLIVOLTS
DEGREES F
(CORR.) TEMP.
tw
t2
t1
tw
t2
ti
t2
t1
DEG F tw
-tl
11
6.305 5.970 3.O00 246.1 235.3 136.0 233.0 121.5 83.1 0.105
12
6.T75 6.060 2.695 T45.1 238.3 125.9 237.0 114.9 85.0 0.06'4
13
6.335 6.195 2.690 247.1 241.5 125.7 241.3 117.2 85.3 0.045
14
6.230 6.090 2.410 243.7 239.3 116.O 239,0 109,0 83.3 0.035
15
6,190 6.090 2.310 242.7 239.3 112.7 239.1 106.9 83.1 0.027
2 1
6.280 5.950 2.980 245.3 234.7 135.3 232.4 120.4 89.3 0.203
2 T
6.T40 6.035 2.755 244,0 237.5 127.9 236.8 217.3 89.3 0.057
2
3
6.210 6.020 2.680 243.3 237.0 125.3 236.6 117.3 89,9 0.053
24
6.170 6.045 2.535 242,0 237.9 120.5 237,6 113.9 85.0 0.034
2
5
6.235 6.130 2.430 243.9 240.7 116.7 240.5 111.0 85.7 0.026

TABLE No. 8
TEMPERATURE SUMMARY
6 mm GLASS BEADS - 36 INCH BED HEIGHT'
RUN
TEST
POTENTIOMETER
DEC. W
AIR
tw-t2
NO.
NO,
MILLIVOLTS
DEGREES F
(CORR.) TEMP.
twtT
ti
tw
t2
t1
t2
ti DEG F tw-tl
11
6.180 5.880 2.360 242.3 T32.3 114.3 230.8 98.4 75.3 O.080
1 2
6.180 5.960 2.T65 24T.3 T35.0 131.1 234.3 99.7 75.3 0.056
13
6.180 6.010 2.060 242.3 236.7 104.0 236.3 95.3 75.1 0.041
1 4
6.200 6.055 1.990 243.0 238.1 101.7 237.7 94.2 75.3 0.035
1 5
6.185 6.055 1.905 T42.5 238.1
98.9 237.7 92.4 75.0 0.032
2
16.210 5.905 2.315 T43.3 233.1
11T.9 T31.6 97.4 76.0 O.(0
2
2
6.240 6.000 2.175 244.0 236.3 108.1 235.6 96.3 76.0 0.057
2
3
6.270 6.090 2.050 245.0 239.3 103.7 238.7 94,..3 75.9 0.042
2
4
5.930 5.790 1.965 234.0 229.7 10O.9 228.9 94.0 76.9 0.036
2 5
5.97O 5.845 1.800 235.3 231.1
97.3 230.9 91.2 78.5 0.031
5

TABLE No. 9
EXPERIMENTAL DATA SUMMARY
mm GLASS BEADS - 24 INCH BED HEIGHT
Log
RUN TEST
Ka
Log
DpGo DpG
o
\TO. NO
SCFH
Go
kg
hm
Ka
kg
Ka/kg
AL
11
50.6T .0743 3.77 628 .0182 .0492 6.35 .0567 4,76 0.678
545 2.735
12
91.58 .0739 6.76 1127 .0173 .0484 14.26 .203 11.72 1.068
992 2.995
13 146.50 .0740 10.88 1810 .0173 .0484 25.00 .352 20.35 1.308 1550 3.189
14 199.80 .O739 14.76 2460 .0173 .0434 42.00 .598 34.55 1.538 2170 3.335
15 272.1O .0745 T0.T8 3380 .0172 .0483 58.80 .837 45.60 1.587 2970 3.472
2
151.88 .0739 3.82 637 .0182 .0492 6.40 .O873 4.80 0.680
545 2.735
2
2
91.13 .0741 6.75 1126 .0172 .0483 14.34 .200 11.57 1.063
988 2.994
2
3 142.80 .0740 10.55 176O .0173 .0484 25.T5 .356 20.52 1.312 1550 3.189
2
4 199.80 .0739 14.76 2460 .0173 .O484 41.T0 .585 33.51 1.529 2170 3.335
2
5 272.10 .0741 20.20 3365 .0173 .0484 60.00 .858 49.80 1.697 2960 3.421
Note: Porosityof bed i O:308
(1 Co

TABLE No. 10
EXPERIMENTAL DATA SUMMARY
5 mm GLASS BEADS - 44 INCH BED HEIGHT
Log
RUN TEST
Ka
Log DpG0 DpGo
W.). NO
SCFH
w
Go
kg
4
hm
Ka
g
Ka/kg epu e
1,7,4
-
1
51.38 .0735 3.78 630 .0187 .0517 5.47 .0732 3.93 0.593 546 2.737
1 2
92.31 .0732 6.76 1127 .0181 .0503 13.90 .1935 10.65 1.027 1002 3.000
13
140.00 .0728 10.20 1700 .O180 .0499 23.T0 .326 18.05 1.275 1525
14
264.00 .O728 19.21 3T05 .018O .0499 48.8
.691 38.35 1.583 2890 ,/,./.
160
1 5
338.10 .0731 24.75 4125 .0173 .0484 69.0 .979 56.5 1.754 3820 3.561
21
51.53 .0732 3.77 629 .0189 .0523 7.05 .0972 5.19 0.714 539 2.730
2
2
92.31 .0732 6.76 11T7 .018T .0507 13.3O .1840 10.15 1.O06 998 T.998
2
3
138.90 .0735 9.90 1650 .0180 .0499 22.21 .3110 17.26 1.236 1485 3.170
2
4
262.00 .0735 19.28 3215 .0180 .0499 47.50 .6700 37.30 1.571 2895 3.461
2
5
338.00 .0734 24.78 4130 .0173 .0484 69.10 .9810 56.70 1.754 3820 3.581
01Note: Porosity of bed is 0,365.

TABLE No. 11
EXPERIMENTAL DATA SUMMARY
6 mm GLASS BEADS - '44 INCH BED HEIGHT
Log
RUN TEST
Ka
Log DpGo DpGo
NO NO
SCFH
aGo
kg
A,
NI
Ka
77, Ka/kg epu
1 1
51.0 .0741 3.78 630 .0184 .0511 6.18 .0841 4.56 0.660 638 2.804
12
91.5 .0741 6.78 1130 .0183 .0510 13.59 .1855 10.10 1.005 1141 3.056
13
134.5 .O741 9.96 1660 .0182 .0507 22.10 .310 17.0O 1.230 1688 3.227
14
253.5 .0741 18.75 3130 .0181 .0503 44.50 .625 34.50 1.538 3210 3.506
15
316.2 .0741 23.45 3915 .0160 .0499 62.20 .882 49.00 1.690 3990 3.600
21
51.1 .0739 3.78 630 .O184 .0511 6.13 .0839 4.55 0.658 638 2.804
2 2
91.7 .0739 6.75 1126 .0383 .0510 9.73 .1270 6.94 0.841 1141 3.056
2 3
134.5 .0739 9.91 1654 .0182 .0507 21.95 .307 16.85 1.T26 1638 3.T27
2 4
253,5 .0739 18.70 3120 .0181 .0503 43.70 .6150 3
3.95 1.530 3210 3.506
25
316.2 .0739 23.40 3898 .0180 .0499 63.20 .8970 49.80 1.697 3990 3.600
Note: Porosity of bed is 0.381
0):
0

TABLE No. 12
EXPERIMENTAL DATA SUMMARY
4 mm GLASS BEADS - 36 INCH BED HEIGHT
Log
RUN TEST
KaLog
DpGo DpGo
NO. NO.
SCFH
a
w
Go
kg
A4
hm
Ka
kg
Ka /kg
epu
6.1),
“
1
1
10.64 .0743
.79
132 .0171 .0482
.75 .0099
.59
110 2.041
12
21.28 .0743 1.58
264 .0169 .0479 1.56 .0209 1.24 0.092
220 2.343
1
3
32.94 .0747 2.46
409 .0171 .0482 2.84 .0389 2.27 0.356
339 2.530
1
4
50.97 .0747 3.80
633 .0370 .0480 4.94 .0684 4.02 0.604
526 2.722
1
5
94.40 .0745 7.05 1174 .0171 .0482 10.18 .142
8.30 0.918
977 2.990
16
151.6O .O745 11.T8 1880 .0171 .0482 18.20 .256 14.98 1.174 1564 3.194
1 7
178.90 .0745 13.32 2212 .O171 .0482 20.00 .311 18.16 1.259 1836 3.264
18
214.00 .0745 15.92 2660 .0171 .0482 28.75 .407 23.80 1.376 2210 3.344
Note: Porosity of bed is 0.328

TABLE
EXPERIMENTAL DATA SUMMARY
4 mm GLASS BEADS - 36 INCH BED HEIGHT
Log
RUN TEST
Ka
Log
DpGo DpG
o NO, NO.
SCFH
(a
w
Go
kg
AA
hm
Na
77
Ka/kg
epu
epu
2
1
10.64 .0743
.79 132 .0171 .0482
.75 .0100
.59
110 2.041
2
2
21.28 .0743 1.58 264 .0169 .0479 1.56 .0209 3.24 0.092
220 2.343
2
3
32.90 .0747 2.46 409 .0171 .0482 2.87 .0392 2.29 0.360
339 2.530
2
4
50.97 .0746 3.80 633 .0170 .0480 4.89 .0676 3.98 0.600
526 2.722
2
5
94.40 .0745 7.05 1174 .0171 .0482 10.28 .1435 8.39 0.923
977 2.990
2
6
151.60 .0745 11.28 1880 .0171 .048T 15.92 .T22 1T.98 1.112 1564 3.194
2
7
178.90 .0745 13.32 2212 .0171 .0482 22.00 .311 18.16 1.259 1836 3.264
2
8
214.40 .0745 15.92 2660 .0171 .0482 32.00 .458 T6.80 1.428 TT10 3.344
Note; porosity of bed is 0.328
(J)
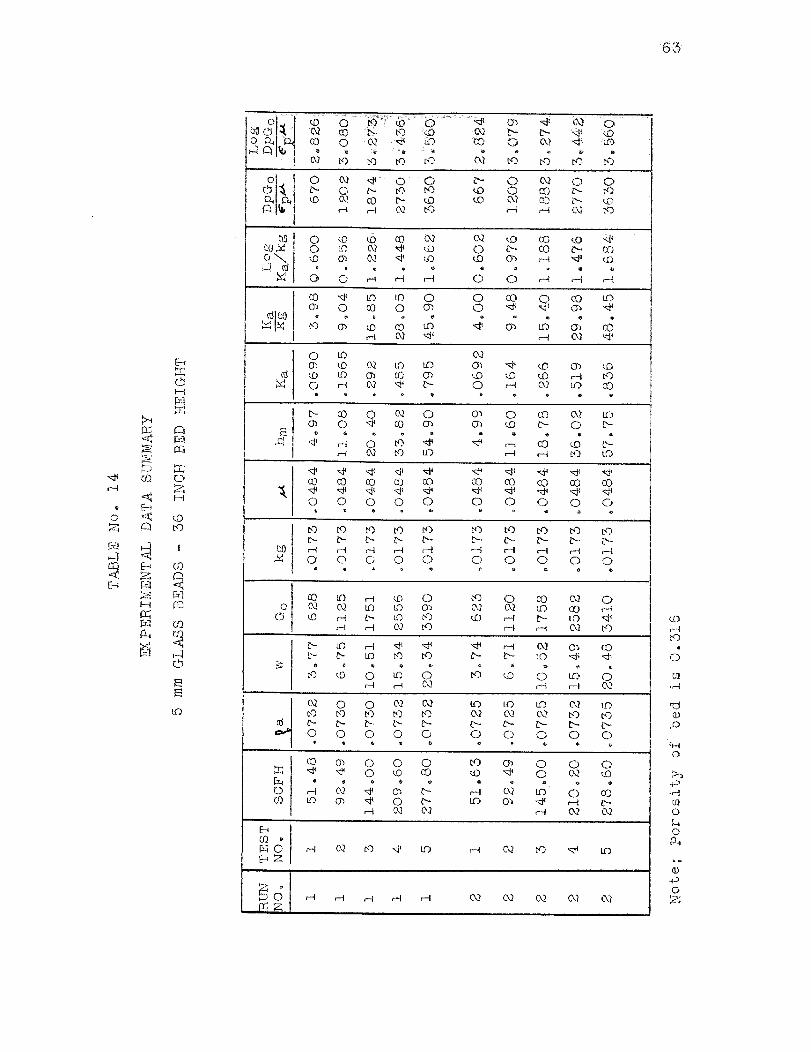
TABLE No. 14
EXPERIMENTAL DATA SUMMARY
5 mm GLASS BEADS - 36 INCH BED HEIGHT
Log
RUN TEST
KaLog DpGo DpGo
NO. NO.
SCFH
%a
Iv
Go
kg
A4
urn
Ka
kg
Ka/kg
epu
9
AA.
-v
1 1
51.48 .0732 3.77 628 .0173 .0484 4.97 .0690 3.98 0.600
670 2.826
1
2
92.49 .0730 6.75 1125 .0173 .0484 11.08 .1565 9.04 0.956 1202 3.080
13
144.00 .0730 10.51 1751 .0173 .0484 20.40 .292 16.85 1.226 1874 3.273
1
4
209.60 .0732 15.34 2556 .0173 .0484 33.82 .485 28.05 1.448 2730 3.436
15
277.80 .0732 2O,34 3390 .0173 .0484 54.90 .795 45.90 1.662 3630 3.560
2
151.63 .0725 3.74 623 .0173 .0484 4.99 .069T 4.00 0.602
667 2.824
2
2
92.49 .0725 6.71 1120 .0173 .0484 11.60 .164
9.48 0,976 1200 3.079
2
3
145.00 .0725 10.5T 1758 .0173 .0484 18.78 .266 15.40 1.188 1882 3.274
2
4
T10.20 .0732 15.49 2582 .0173 .0484 36.02 .519 29.98 1.476 2770 3.442
2
5 278.60 .0735 T0.48 3410 .0173 .0484 57.75 .836 48.45 1.684 3630 3.560
Note: Porosity of be is 0.316
(A.

TABLE No. 15
EXPERIMENTAL DATA SUMMARY
6 mm GLASS BEADS - 36 INCH BED HEIGHT
UN TEST
Ka
Log DpGo DpGo
NO. NO.
SCFH *a. w Go kg u hm Ka IT Ka/kg
epu
1 1
51.1 .0741 3.79 632 .0171 .0482 5.42 .0756 4.42 0.645
660 T.824
12
91.6 .0741 6.78 1129 .O171 .0482 1T.74 .1813 30.60 3.O26 1191 3.076
13
138.9 .0741 1O.30 1718 .0171 .0482 19.35 .276 16.10 1.207 1814 3.258
14
199.2 .0741 14.78 2462 .0173 .0482 31.20 .446 26.18 1.418 26O1 3.414
15
263.5 .O741 39.50 3255 .0171 .0482 43.75 .631
36.90 1.566 3458 3.535
2
1
51.1 .0741 3.79 632 .0172 .0483 5.42 .0756 4.42 0.645
668 2.824
2
2
91.6 .0741 6.78 1129 .0172 .0483 11.18 .1578 9.23 0.964 1191 3.076
2
3
138.9 .O741 10.30 1718 .0172 .0483 19.48 .2780 16.25 1.211 1814 3.258
2
4
199.2 .0741 14.78 2462 .0172 .0483 31.70 .4550 26.58 1.424 2601 3.414
2
5
T63.8 .O738 19.40 3240 .017O .0480 47.00 .6780 39.60 1.598 3455 3.535
Note: Porosity of bed is 0.386