cpr report, 07-2009 - gls - sba servicing asset valuation, …glsolutions.us/files/jul 2009 cpr...
TRANSCRIPT

Bob Judge, Government Loan Solutions, Editor
Bob Judge is a partner at Govern-ment Loan Solutions. Government Loan Solutions is a provider of valuation services, pre-payment analytics and operational support for the SBA marketplace. Bob has 25 years of experience in the fixed income markets. He holds a B.A. in Economics from Vassar College and an M.B.A. in Finance from NYU Stern School of Busi-ness.
Coleman Government Loan Solutions’ CPR Report Providing the most detailed monthly SBA 7(a) and 504 prepayment, default and market information
© 2009 Coleman and Government Loan Solutions. All Rights Reserved.
Volume 3 , Issue #7
J U N E CPR: P R E PA Y M E N T S H I T 2009 L OW S
July , 2009
Special points of interest:
• Prepayments at 2009 Lows
• July TALF Update
• Value Indices Mostly Higher
• Default Ratios Decrease
I N S I D E T H I S I S S U E :
June CPR 1-2, 11-12
July TALF 1 & 3
Sale & Settle Tip 5
GovGex Corner 6
Value Indices 7, 9-11
Default Rate 8
Default Ratios 8 & 15
J U LY TAL F U P DA T E
By Bob Judge July TALF saw a 25% increase in small business funding, which includes both 7(a) pools and 504 debentures. The actual total for July was $101.5 million, versus $81.5 million in June and $86.6 mil-lion in May. While the NY Fed does not break out the num-bers between 7(a) and 504, rhetorically we hear that some-thing less than 50% of the pre-vious months totals were 7(a) pools. Continued on page 3
While any increase is welcome, the numbers are still too small to have any appreciable impact on the 7(a) secondary market, regardless of the breakdown. Considering that upwards of $200-$300 million of guaran-teed portions are sold into the secondary market in any given month, $50 to $100 million in 7(a) pools will have very little impact on clearing new pool production, let alone the back-log of inventory in the market.
Overall prepayment speeds decreased by 17%, falling to CPR 8.10%, which represents the low for 2009.
This decrease was pri-marily caused by another fall in the Default CPR (red line), which moved from DCPR 6.61% to 5.35%.
The Prepay CPR (green line) fell below 3%,
reaching a YTD low of PCPR 2.75%.
For June, the overall pre-payment rate fell by dou-ble-digits in five of the six maturity categories. This extensive decrease caused the YTD CPR to fall to CPR 9.56% from CPR 9.84%.
Turning to individual ma-turity sectors, the long-end decreased by 17.11%, falling to CPR 6.42%, the
lowest reading since De-cember, 2008 when it hit CPR 6.18%. Other sec-tors that decreased in-cluded the 8-10 year bucket (-19.63%, CPR 13.00% to CPR 10.45%), 10-13 bucket (-12.95%, CPR 13.47% to CPR 11.73%) 13-16 sector (-21.04%, CPR 8.35% to CPR 6.60%) and the 16-
Continued on page 2
At current market levels, TALF levered returns using the five-year loan term are in the low single-digits. Considering that other asset classes are trading in the +10% IRR range, not many will consider 7(a) pools for TALF. While it is true that the secon-dary market has performed well without help from TALF, the fundamentals that have sup-ported higher pricing and pool

or below 10% for the remain-der of 2009.
For further information on the terminology and concepts used in this article, please refer to the “Glossary and Definitions” at the end of the report.
EDITOR DISCLAIMER DISCLAIMER OF WARRANTIES – GOV-ERNMENT LOAN SOLUTIONS (GLS) MAKES NO REPRESENTATIONS OR WARRANTIES REGARDING THE ACCU-RACY, RELIABILITY OR COMPLETE-NESS OF THE CONTENT OF THIS RE-PORT. TO THE EXTENT PERMISSIBLE BY LAW, GLS DISCLAIMS ALL WARRAN-TIES, EXPRESS OR IMPLIED, INCLUD-ING BUT NOT LIMITED TO IMPLIED WARRANTIES OF MERCHANTABILITY AND FITNESS FOR A PARTICULAR PURPOSE. Limitation of Liability - GLS shall not be liable for damages of any kind, including without limitation special or consequential damages, arising out of your use of, or reliance upon, this publication or the con-tent hereof. This Report may contain advice, opinions, and statements of various information providers and content providers. GLS does not represent or endorse the accuracy or reliability of any advice, opinion, statement or other information provided by any infor-mation provider or content provider, or any user of this Report or other person or entity. Reliance upon any such opinion, advice, statement, or other information shall also be at your own risk. Prior to the execution of a purchase or sale or any security or investment, you are advised to consult with investment profes-sionals, as appropriate, to verify pricing and other information. Neither GLS, its informa-tion providers or content providers shall have any liability for investment decisions based upon, or the results obtained from, the information provided. Neither GLS, its information providers or content providers guarantee or warrant the timeliness, se-quence, accuracy, or completeness of any such information. Nothing contained in this Report is intended to be, nor shall it be construed as, investment advice.
Coleman
© 2009 Coleman and GLS. All Rights Reserved
Bob Judge can be reached at (216) 456-2480 ext. 133 or
“Whatever the reason for the decrease, it
continues the trend of sub-10% prepayment speeds, the
continuation of which can only
help market participants.”
20 sector (-46.97%, CPR 9.99% to CPR 5.30%).
The only sector that increased was the <8 bucket, which rose by 13.31%, moving from CPR 11.75% to CPR 13.31%.
The decrease in the Default CPR for the second month in a row was another pleasant sur-prise after hitting a decade high of 7.68% in April. Specifically, The default CPR came in at DCPR 5.35%, the lowest read-ing this year.
While a decrease in default ac-tivity is always welcome, it is a
surprise considering the state of the US economy.
Whatever the reason for the decrease, it continues the trend of sub-10% prepayment speeds, the continuation of which can only help market participants.
With voluntary prepayments now sub-3%, prepayments can sustain a default CPR of 7% and remain below the psycho-logically important 10%.
Barring a sudden increase in defaults, we should be able to maintain prepayment speeds at
Page 2
JU N E CPR. . .CO N T I N U E D
Data on pages 11-12
Government Loan Solutions’ CPR Report

Page 3 Coleman Government Loan Solutions’ CPR Report
J U LY TAL F U P DA T E . . .C O N T I N U E D
sales may not last as the econ-omy begins to recover. Accord-ing to market participants, cur-rent pool investors have the following characteristics: 1. Small to mid-size domestic
banking institutions. 2. Foreign banks, that were
large buyers in the past, are still out of the market.
I presume that small to mid-size banks that are buying SBA pools are doing so because of swelling deposits from an increasing sav-ings rate in the US, combined with a low demand for loans. Since they have to invest these deposits somewhere, govern-ment guaranteed, floating-rate SBA pools are an attractive alter-native. This is all well and good during the recession, where the avail-ability and demand for loans is low and deposits are high.
Economic Growth
However, what happens when economic growth returns to the US economy? Let’s take a look at the charac-teristics of economic growth: 1. Economic growth breeds
demand and origination of loans in the banking system.
2. SBA lending should also increase as eco-nomic growth causes small business to grow their business via bor-rowing.
3. With growing demand for loans, small to mid-size banks no longer need to purchase SBA pools to fill the gaps in their balance sheets.
4. In fact, the current buyers of pools may wish to sell them to fund internally gener-ated loans.
5. Deposits may become harder to come by as indi-viduals invest in riskier as-sets, such as the stock mar-ket.
So, economic growth should cause bank lending to rise faster than deposits. If this in fact occurs, banks will cease buying SBA pools and may even wish to sell them back to pool assem-blers. If this comes to pass, the current investor base for SBA pools will cease to purchase pools, just as SBA lending increases and the supply of pools rise. Who then will buy SBA pools?
We can’t depend on previous investors, such as foreign banks, to return to the market, espe-cially with the concern over the value of the dollar. It is at this point where a func-tioning TALF program can add value. By having soaked up inventory, as well as being struc-tured to support current market pricing, the TALF can backstop the potential loss of the current investor base. Otherwise, the next stop on the investor parade are more “opportunistic” investors who seek much higher returns, such as hedge funds. If this is the group that the mar-ket comes to depend upon, the secondary market will have no
choice but to fall to early-2009 levels in order to satisfy their demand for yield.
Conclusion
While the secondary market is now performing admirably, this is not the time to ignore the potential pitfalls. If the Fed assumes that the problem is fixed and that they do not need to structure the TALF to support the secondary market, they should consider the impact of a growing economy. Please feel free to comment on this article. The CPR Report welcomes other views on this important topic.
GLS provides valuations for: • SBA 7(a), 504 1st mortgage and USDA servicing
rights • SBA 7(a) and 504 1st mortgage pools • Guaranteed and non-guaranteed 7(a) loan portions
Interest-only portions of SBA and USDA loans
Government Loan Solutions The nationwide leader in the valuation of SBA and USDA assets.
In these times of market uncertainty, let GLS help you in determining the value of
your SBA and USDA related-assets.
For further information, please contact Rob Herrick at (216) 456-2480 ext. 144 or at

Government Loan Solutions’ CPR Report Page 4 Coleman

Page 5 Coleman Government Loan Solutions’ CPR Report
GLS 7(a) Sale & Settlement Tip of the Month By Scott Evans
Sale and Settlement Strategies: Tip #11 – Knowledge is King...
Said differently, know your secondary market, particularly by communicating with col-leagues at other institutions involved in selling their SBA loan production. Knowing current market trends and pricing provides valuable insight into the value of the various bids received on any given sale. In addition, this information can be a useful tool in forecasting revenue from upcoming sales and assists in timing those sales to achieve best execution.
Scott Evans is a partner at GLS. Mr. Evans has over 18 years of trading experience and has been involved in the SBA secondary markets for the last eight of those years. Mr. Evans has bought, sold, settled, and securitized nearly 20,000 SBA loans and now brings some of that expertise to the CPR Report in a recurring article called Sale and Settlement Tip of the Month. The article will focus on pragmatic tips aimed at helping lenders develop a more consis-tent sale and settlement process and ultimately deliver them the best execution possible.
Increase your premium dollars by eliminating brokerage fees and selling your SBA and USDA Loans “Investor Direct” to
Thomas USAF, America’s largest direct investor.
Contact Mike or Vasu at 404-365-2040

The GovGex Corner
Maturity Prime + 1% Prime + 2% 10 years 100.75 104.16 25 years 102.29 105.08
Three-month trailing average for high bids: April - June 2009
Coleman Government Loan Solutions’ CPR Report Page 6
GovGex reports that in June premiums continued to rise on GovGex.com, the fair and open exchange for buying and selling government guaranteed loans. Activity on GovGex for Q2 reached a record level, with $109M presented for sale. Lenders have recently received premiums reaching just shy of 109% on GovGex.
Note: the above tables present aggregated data. Subscribers of the GovGex Independent Pricing Service™ receive daily up-dates of actual transactions and bid levels on GovGex - including loan details and high premium and par bids. Recent reports show P+2.75 transactions at 102% to mid 108% range, with only slight changes in loan structure driving premiums. Lenders use the pricing service to structure deals in light of what the market is currently valuing. The GovGex Independent Pricing Service is the only service to provide actual bid levels based on real transactions as seen on GovGex.
About GovGex.com GovGex is the secure online exchange for selling SBA and USDA loans. GovGex works with a network of over 20 Buyers to ensure loans receive full exposure. GovGex is an independent source for secondary market pricing information - built on actual bid levels as seen on GovGex from all the Buyers. Contact GovGex for all of your secondary market needs.
To learn more, or for a free membership, visit www.GovGex.com, or contact us at (617) 381-4906
With this edition of GovGex Corner, we are introducing a new pair of premium indices – the GovGex PriceEdge, which more robustly capture month-to-month pricing trends, while also controlling for factors including the age of the loan at the time of sale. The numbers below represent what a Prime + 2 loan of the given term that had just been funded would sell for in each month. For 10 year loans, the premium rose more than one percent between May and June, and for 25 year loans, the increase was over 1.5%.
GovGex PriceEdgeTM (Prime +2)
Month 10 Year 25 Year April 103.79 104.66 May 104.37 104.92 June 105.49 106.42
GLS provides valuations for: • SBA 7(a), 504 1st mortgage and USDA servicing
rights • SBA 7(a) and 504 1st mortgage pools • Guaranteed and non-guaranteed 7(a) loan portions
Interest-only portions of SBA and USDA loans
Government Loan Solutions The nationwide leader in the valuation of SBA
and USDA assets.
In these times of market uncertainty, let GLS help you in determining the value of
your SBA and USDA related-assets.
For further information, please contact Rob Herrick at (216) 456-2480 ext. 144 or at
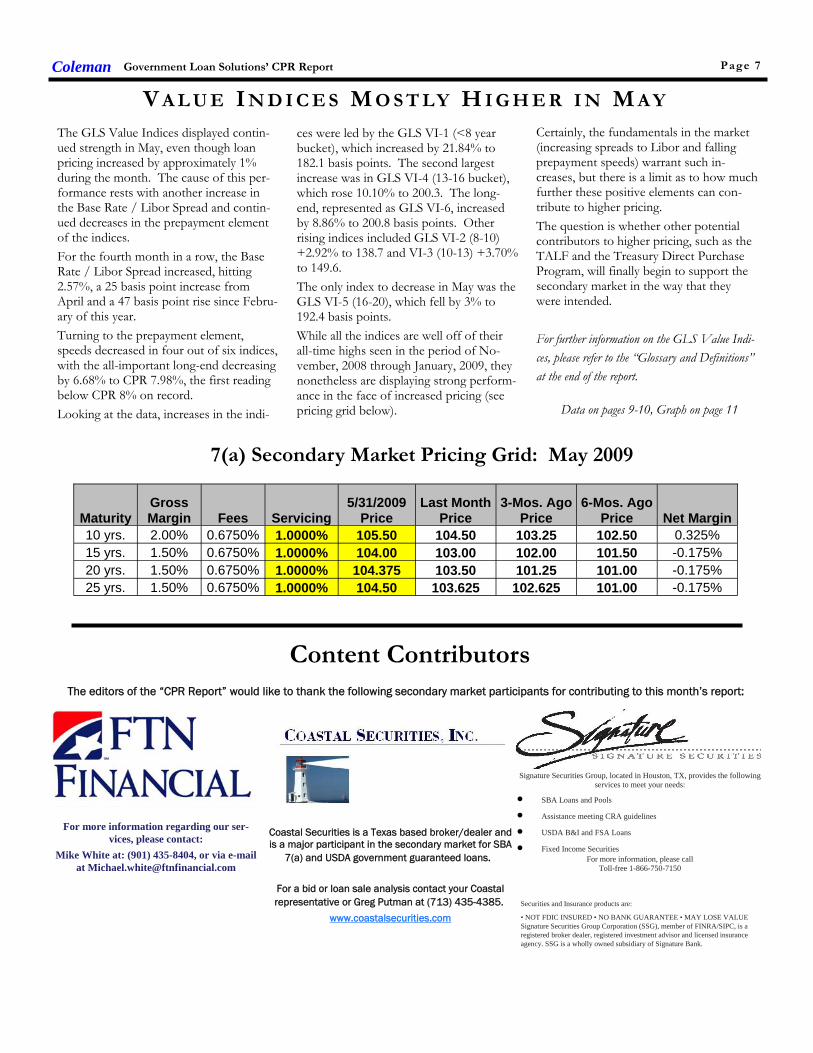
V A L U E I N D I C E S M O S T LY H I G H E R I N M A Y The GLS Value Indices displayed contin-ued strength in May, even though loan pricing increased by approximately 1% during the month. The cause of this per-formance rests with another increase in the Base Rate / Libor Spread and contin-ued decreases in the prepayment element of the indices. For the fourth month in a row, the Base Rate / Libor Spread increased, hitting 2.57%, a 25 basis point increase from April and a 47 basis point rise since Febru-ary of this year. Turning to the prepayment element, speeds decreased in four out of six indices, with the all-important long-end decreasing by 6.68% to CPR 7.98%, the first reading below CPR 8% on record. Looking at the data, increases in the indi-
ces were led by the GLS VI-1 (<8 year bucket), which increased by 21.84% to 182.1 basis points. The second largest increase was in GLS VI-4 (13-16 bucket), which rose 10.10% to 200.3. The long-end, represented as GLS VI-6, increased by 8.86% to 200.8 basis points. Other rising indices included GLS VI-2 (8-10) +2.92% to 138.7 and VI-3 (10-13) +3.70% to 149.6. The only index to decrease in May was the GLS VI-5 (16-20), which fell by 3% to 192.4 basis points. While all the indices are well off of their all-time highs seen in the period of No-vember, 2008 through January, 2009, they nonetheless are displaying strong perform-ance in the face of increased pricing (see pricing grid below).
Certainly, the fundamentals in the market (increasing spreads to Libor and falling prepayment speeds) warrant such in-creases, but there is a limit as to how much further these positive elements can con-tribute to higher pricing. The question is whether other potential contributors to higher pricing, such as the TALF and the Treasury Direct Purchase Program, will finally begin to support the secondary market in the way that they were intended. For further information on the GLS Value Indi-ces, please refer to the “Glossary and Definitions” at the end of the report.
Data on pages 9-10, Graph on page 11
Coleman Government Loan Solutions’ CPR Report Page 7
Maturity Gross Margin Fees Servicing
5/31/2009 Price Net Margin
10 yrs. 2.00% 0.6750% 1.0000% 105.50 0.325% 15 yrs. 1.50% 0.6750% 1.0000% 104.00 -0.175% 20 yrs. 1.50% 0.6750% 1.0000% 104.375 -0.175% 25 yrs. 1.50% 0.6750% 1.0000% 104.50 -0.175%
Last Month Price
104.50 103.00 103.50 103.625
3-Mos. Ago Price
103.25 102.00 101.25 102.625
6-Mos. Ago Price
102.50 101.50 101.00 101.00
7(a) Secondary Market Pricing Grid: May 2009
Content Contributors The editors of the “CPR Report” would like to thank the following secondary market participants for contributing to this month’s report:
For more information regarding our ser-vices, please contact:
Mike White at: (901) 435-8404, or via e-mail at [email protected]
Coastal Securities is a Texas based broker/dealer and is a major participant in the secondary market for SBA
7(a) and USDA government guaranteed loans.
For a bid or loan sale analysis contact your Coastal representative or Greg Putman at (713) 435-4385.
www.coastalsecurities.com
Signature Securities Group, located in Houston, TX, provides the following services to meet your needs:
• SBA Loans and Pools
• Assistance meeting CRA guidelines
• USDA B&I and FSA Loans
• Fixed Income Securities For more information, please call
Toll-free 1-866-750-7150
Securities and Insurance products are: • NOT FDIC INSURED • NO BANK GUARANTEE • MAY LOSE VALUE Signature Securities Group Corporation (SSG), member of FINRA/SIPC, is a registered broker dealer, registered investment advisor and licensed insurance agency. SSG is a wholly owned subsidiary of Signature Bank.

Government Loan Solutions’ CPR Report Coleman
D E FA U L T R A T I O S : 7 ( A ) A N D 5 0 4 D E C R E A S E
While both default ratios fell in May, they continued the trend of recession-level readings of 30%+ for 7(a) and 20%+ for 504 loans that began in May of last year. For the second month in a row, the 7(a) default ratio decreased, falling to 66.03% from 67.52%. For the first time since last November, the 504 default ratio also fell, declining to 59.05% from 62.56%. Below we attempt to analyze these results:
SBA 7(a) Default Ratios For the thirteenth month in a row, the 7(a) default ratio exceeded 30%, well above our recessionary hurdle rate of 20%. The dollar amount of defaults fell by 20.77% to $121.7 million from $153.6 million in April. Voluntary prepayments decreased 15.29% to $62.6 million, which represents a decade-low. While we are seeing better performance for 7(a) loans, we still expect the default ratio to remain above 50% into 2010.
SBA 504 Default Ratios Also for the thirteenth month in a row, the 504 default ratio came in above 20%, which is our threshold for recessionary conditions in the 504 small business sec-tor. May represents the first time since last July that the 504 default ratio did not set an all-time high. After one-month above 60%, the ratio fell back, but the 59.05% reading still represents the second-highest on re-cord. Specifically, the dollar amount of defaults actually increased 1.13% to a record $80.6 million from $79.7 million, but higher vol-untary prepayments caused the ratio to decrease. Turning to voluntary prepayments, they increased by 17.19% to $55.9 million from $47.7 million in April.
Summary
While the numbers are slightly better than the past few months, we still see weakness in the small business sector, as represented by 7(a) and 504 loans.
Graph on page 15
Page 8
D E FAU LT R A T E F A L L S B E L OW 6% For the second month in a row, the theoretical default rate de-clined, hitting 5.60% in May. Since March, the default rate has fallen by 27%, after hitting a dec-ade high of 7.68% in that month.
The 5.60% reading is the lowest this year, suggesting that, for the time being, 7(a) defaults have be-gun to level off.
Turning to the actual data, the dollar amount of defaults de-creased by $32 million, moving from $153.6 million to $121.7 million. This is the lowest dollar reading since November, 2008.
Could this mean that the recession has begun to mod-erate and “green shoots” are truly beginning to sprout for small business in the US?
I am still some-what skeptical about any eco-nomic recovery having begun, but I have been wrong before, and likely will be again in the future. For further information on the terminology and concepts used in this
article, please refer to the “Glossary and Definitions” at the end of the report.
Talf.info THE PLACE for up-to-date
information on the Fed’s TALF Program.

Table 1:
Rolling six-month CPR speeds for all maturity buckets. Source: Colson Services
N E W V A L U E IN D I C E S : SU P P O RT I N G D A TA
Page 9 Government Loan Solutions’ CPR Report Coleman
Month BUCKET
1 CPR BUCKET
2 CPR BUCKET
3 CPR BUCKET
4 CPR BUCKET
5 CPR BUCKET
6 CPR Dec-05 18.52% 17.42% 17.58% 13.93% 14.55% 18.65% Jan-06 18.48% 17.14% 16.95% 13.99% 16.33% 19.23% Feb-06 19.11% 17.71% 16.26% 14.05% 17.38% 19.73% Mar-06 17.77% 17.57% 15.15% 14.19% 17.91% 19.51% Apr-06 18.11% 17.27% 14.15% 14.36% 19.55% 20.04% May-06 18.84% 17.05% 13.80% 14.99% 19.00% 20.39% Jun-06 19.80% 18.23% 13.34% 15.88% 19.57% 21.59% Jul-06 20.48% 19.32% 13.77% 16.88% 19.58% 22.41%
Aug-06 19.27% 19.32% 14.15% 17.76% 20.10% 23.06% Sep-06 20.33% 19.89% 14.29% 18.83% 20.84% 24.55% Oct-06 19.72% 19.72% 14.32% 19.17% 20.42% 24.51% Nov-06 18.17% 19.54% 14.82% 19.32% 20.91% 24.83% Dec-06 16.78% 18.62% 14.44% 18.97% 20.67% 24.48% Jan-07 16.44% 17.36% 13.95% 18.23% 20.89% 24.14% Feb-07 17.47% 17.00% 13.86% 17.95% 21.81% 24.21% Mar-07 16.07% 16.65% 13.54% 17.22% 20.95% 23.23% Apr-07 16.21% 16.49% 13.55% 17.99% 19.52% 23.13% May-07 18.09% 17.35% 13.47% 18.38% 19.68% 22.95% Jun-07 18.39% 17.03% 13.89% 18.96% 20.60% 22.97% Jul-07 18.52% 17.35% 14.00% 19.55% 20.25% 23.25%
Aug-07 17.72% 17.15% 13.56% 19.48% 18.01% 23.10% Sep-07 19.18% 17.10% 14.19% 19.85% 18.61% 23.98% Oct-07 18.14% 17.04% 14.59% 19.16% 18.57% 23.85% Nov-07 17.68% 16.02% 14.82% 18.87% 18.32% 24.16% Dec-07 17.14% 15.38% 14.42% 17.22% 17.99% 23.23% Jan-08 15.70% 14.68% 13.96% 16.44% 17.45% 22.00% Feb-08 15.91% 13.98% 14.19% 16.20% 17.53% 21.19% Mar-08 15.58% 13.42% 13.27% 15.08% 15.41% 19.34% Apr-08 16.16% 13.40% 13.05% 14.59% 15.19% 18.74% May-08 15.49% 12.93% 12.65% 13.77% 14.33% 17.33% Jun-08 15.29% 13.36% 12.96% 14.75% 13.62% 17.14% Jul-08 15.70% 13.03% 12.78% 14.40% 12.49% 16.59%
Aug-08 15.45% 13.28% 12.87% 13.73% 12.24% 15.89% Sep-08 14.03% 12.49% 12.77% 13.28% 12.36% 15.20% Oct-08 12.98% 11.67% 12.16% 12.13% 11.97% 14.06% Nov-08 12.08% 12.36% 11.45% 11.49% 11.49% 13.22% Dec-08 12.37% 11.81% 10.46% 9.79% 11.08% 11.41% Jan-09 12.86% 11.55% 10.45% 9.29% 10.61% 10.40% Feb-09 12.30% 11.30% 10.36% 8.39% 9.99% 9.30% Mar-09 12.96% 11.97% 10.58% 8.57% 10.47% 8.79% Apr-09 13.23% 12.34% 11.23% 8.75% 9.81% 8.55% May-09 13.12% 11.89% 11.80% 8.68% 9.92% 7.98%

Page 10
Table 2:
GLS VI values for all maturity buckets for last 42 months.
N E W V A L U E IN D I C E S : HI S TO R I C A L VA L U E S
INDICES LEGEND HIGHEST READING LOWEST READING
Government Loan Solutions’ CPR Report Coleman
MONTH WAVG LIBOR
WAVG BASE
BASE LIBOR
SPD GLS VI-1
GLS VI-2
GLS VI-3
GLS VI-4
GLS VI-5
GLS VI-6
Dec-05 4.45% 7.06% 2.61% 21.8 2.6 15.0 58.3 51.0 2.5 Jan-06 4.58% 7.28% 2.70% 11.0 17.2 12.7 43.5 6.1 -15.3 Feb-06 4.74% 7.50% 2.76% 10.0 16.3 21.3 39.5 23.7 -18.3 Mar-06 4.89% 7.56% 2.66% 7.0 -1.4 27.0 42.5 3.1 -25.0 Apr-06 5.03% 7.75% 2.72% 24.2 13.1 36.4 57.6 -3.6 -25.5 May-06 5.18% 7.94% 2.76% 18.4 18.8 33.5 30.2 21.0 -19.5 Jun-06 5.37% 8.03% 2.66% -22.8 -0.1 25.0 29.6 -6.4 -37.9 Jul-06 5.48% 8.25% 2.77% -5.9 3.6 31.2 22.0 0.9 -59.1
Aug-06 5.40% 8.25% 2.85% 3.8 21.4 39.8 -33.9 19.7 -43.5 Sep-06 5.37% 8.25% 2.88% 17.8 21.0 49.8 36.2 -12.4 -38.1 Oct-06 5.37% 8.25% 2.88% 10.0 11.3 46.3 5.4 19.1 -43.5 Nov-06 5.37% 8.25% 2.88% 10.9 7.0 33.7 1.4 6.2 -46.7 Dec-06 5.36% 8.25% 2.89% 34.6 24.0 41.1 31.0 8.0 -63.8 Jan-07 5.35% 8.25% 2.90% 31.0 29.8 48.6 21.3 -30.1 -59.4 Feb-07 5.36% 8.25% 2.89% 9.2 25.4 39.4 21.3 -57.0 -65.7 Mar-07 5.34% 8.25% 2.91% 35.9 28.9 45.0 28.5 -12.7 -60.9 Apr-07 5.35% 8.25% 2.90% 18.8 19.4 43.4 -2.9 -12.5 -53.0 May-07 5.35% 8.25% 2.90% 24.5 8.5 37.6 18.9 -1.4 -50.0 Jun-07 5.36% 8.25% 2.89% 16.3 25.2 40.6 18.6 7.0 -22.1 Jul-07 5.35% 8.25% 2.90% 6.8 20.9 38.1 22.2 30.1 -29.9
Aug-07 5.48% 8.25% 2.77% 12.9 33.5 59.8 43.6 57.8 7.0 Sep-07 5.70% 8.21% 2.51% -7.3 32.2 38.1 36.3 33.3 -14.1 Oct-07 5.05% 7.74% 2.69% 70.2 61.9 75.6 52.2 61.9 14.6 Nov-07 4.96% 7.50% 2.54% 42.6 46.7 50.5 57.8 48.7 -4.3 Dec-07 5.02% 7.35% 2.33% 30.4 55.2 54.4 57.0 46.7 7.9 Jan-08 3.77% 6.86% 3.09% 105.1 118.6 124.7 121.4 140.1 96.8 Feb-08 3.10% 6.00% 2.90% 94.4 98.7 98.6 93.3 118.0 69.9 Mar-08 2.90% 5.95% 3.05% 118.1 120.5 116.2 112.0 128.8 107.4 Apr-08 2.81% 5.25% 2.44% 69.9 79.5 77.4 90.6 100.8 77.4 May-08 2.78% 5.15% 2.37% 61.2 66.7 64.1 82.9 60.5 65.1 Jun-08 2.67% 5.00% 2.33% 44.1 47.4 59.8 74.6 66.9 47.2 Jul-08 2.75% 5.00% 2.25% 41.7 43.4 55.3 60.8 89.1 61.6
Aug-08 2.74% 5.02% 2.27% 44.0 52.5 70.1 47.4 95.8 83.1 Sep-08 3.00% 5.00% 2.00% 73.3 91.2 88.5 111.3 85.2 94.2 Oct-08 4.43% 4.56% 0.12% 2.3 -3.1 -38.6 30.5 -51.0 -12.9 Nov-08 2.06% 4.00% 1.94% 203.9 187.0 143.2 161.1 236.0 196.6 Dec-08 1.64% 3.89% 2.25% 162.2 144.9 170.3 151.0 212.5 238.6 Jan-09 1.11% 3.25% 2.14% 164.8 185.5 181.7 233.2 218.3 204.4 Feb-09 1.15% 3.25% 2.10% 203.6 179.5 157.4 162.9 201.5 171.3 Mar-09 1.06% 3.25% 2.19% 135.3 150.3 151.6 220.4 138.0 169.7 Apr-09 0.96% 3.28% 2.32% 149.4 134.8 144.3 182.0 198.3 184.5 May-09 0.70% 3.26% 2.57% 182.1 138.7 149.6 200.3 192.4 200.8

Table 3:
2009 monthly prepayment speeds broken out by maturity sector. Source: Colson Services
Table 4:
2009 pool age broken out by maturity sector. Source: Colson Services
YTD P R E PA Y M E N T SP E E D S
Coleman Government Loan Solutions’ CPR Report Page 11
CPR/MO. <8 8 - 10 10 - 13 13 - 16 16 - 20 20+ ALL
Jan-09 16.67% 9.11% 10.27% 10.30% 8.75% 9.67% 9.94%
Feb-09 10.84% 11.48% 13.12% 7.36% 8.85% 8.09% 9.67%
Mar-09 14.52% 14.16% 11.41% 9.86% 12.85% 7.42% 9.52%
Apr-09 11.84% 12.82% 14.16% 8.76% 6.40% 8.74% 10.30%
May-09 11.75% 13.00% 13.47% 8.35% 9.99% 7.74% 9.79%
Jun-09 13.31% 10.45% 11.73% 6.60% 5.30% 6.42% 8.10%
Grand Total 13.18% 11.85% 12.36% 8.57% 8.73% 8.02% 9.56%
POOL AGE <8 8 - 10 10 - 13 13 - 16 16 - 20 20+ ALL
Jan-09 21 Mos. 27 Mos. 23 Mos. 59 Mos. 42 Mos. 47 Mos. 39 Mos.
Feb-09 21 Mos. 27 Mos. 23 Mos. 59 Mos. 43 Mos. 47 Mos. 40 Mos.
Mar-09 21 Mos. 28 Mos. 24 Mos. 60 Mos. 43 Mos. 47 Mos. 40 Mos.
Apr-09 22 Mos. 27 Mos. 25 Mos. 61 Mos. 43 Mos. 47 Mos. 41 Mos.
May-09 22 Mos. 27 Mos. 26 Mos. 62 Mos. 43 Mos. 48 Mos. 41 Mos.
Jun-09 23 Mos. 28 Mos. 26 Mos. 62 Mos. 43 Mos. 48 Mos. 42 Mos.

Page 12
2009 YTD CPR by maturity and age bucket. Source: Colson Services
Table 5:
Y E A R-T O -D A T E CPR D A TA
Government Loan Solutions’ CPR Report Coleman
< 8 BY AGE 0-12 Mos. 13-24 Mos. 25-36 Mos. 37-48 Mos. 48+ Mos.
Jan-09 7.35% 31.58% 10.94% 15.95% 2.41% Feb-09 13.53% 10.26% 6.52% 4.50% 21.72% Mar-09 9.36% 19.91% 14.43% 15.20% 18.36% Apr-09 16.19% 11.44% 8.89% 5.24% 6.89% May-09 14.49% 13.28% 6.28% 10.88% 10.10% Jun-09 15.17% 12.41% 11.87% 18.19% 6.68%
Grand Total 12.65% 17.03% 9.91% 11.92% 11.18%
10-13 BY AGE 0-12 Mos. 13-24 Mos. 25-36 Mos. 37-48 Mos. 48+ Mos.
Jan-09 9.56% 13.20% 7.40% 8.64% 8.76% Feb-09 10.87% 16.62% 12.39% 8.83% 11.78% Mar-09 11.51% 14.64% 9.99% 5.24% 7.45% Apr-09 7.86% 20.69% 12.62% 15.73% 6.49% May-09 11.87% 17.74% 12.49% 9.50% 8.90% Jun-09 13.83% 14.17% 10.21% 7.70% 5.97%
Grand Total 10.82% 16.21% 10.92% 9.36% 8.20%
16-20 BY AGE 0-12 Mos. 13-24 Mos. 25-36 Mos. 37-48 Mos. 48+ Mos.
Jan-09 5.25% 6.38% 17.21% 6.73% 10.29% Feb-09 0.00% 13.17% 5.76% 4.81% 12.03% Mar-09 8.52% 19.83% 4.91% 10.43% 12.05% Apr-09 6.41% 2.64% 5.11% 0.89% 12.02% May-09 1.01% 8.14% 14.23% 10.61% 13.93% Jun-09 1.10% 5.73% 10.50% 0.77% 5.97%
Grand Total 3.88% 9.62% 9.65% 5.70% 11.10%
8-10 BY AGE 0-12 Mos. 13-24 Mos. 25-36 Mos. 37-48 Mos. 48+ Mos.
Jan-09 7.89% 12.32% 8.52% 3.96% 12.50% Feb-09 11.59% 11.43% 15.08% 5.57% 12.29% Mar-09 11.28% 22.85% 10.72% 10.13% 12.67% Apr-09 12.82% 21.12% 11.37% 5.64% 7.08% May-09 11.09% 21.71% 8.76% 6.27% 10.23% Jun-09 6.57% 16.04% 8.81% 6.67% 10.70%
Grand Total 10.26% 17.94% 10.64% 6.36% 10.93%
13-16 BY AGE 0-12 Mos. 13-24 Mos. 25-36 Mos. 37-48 Mos. 48+ Mos.
Jan-09 0.00% 9.70% 0.00% 10.03% 11.28% Feb-09 20.67% 4.28% 0.00% 7.21% 7.03% Mar-09 0.00% 2.39% 14.62% 5.15% 12.71% Apr-09 8.89% 9.78% 0.00% 4.95% 10.55% May-09 0.00% 32.61% 0.00% 6.13% 8.85% Jun-09 0.00% 15.88% 0.55% 4.14% 7.32%
Grand Total 5.60% 10.86% 2.36% 6.57% 9.61%
20+ BY AGE 0-12 Mos. 13-24 Mos. 25-36 Mos. 37-48 Mos. 48+ Mos.
Jan-09 10.77% 12.40% 10.16% 7.43% 8.21% Feb-09 3.56% 6.57% 12.17% 5.72% 9.25% Mar-09 6.12% 9.38% 7.45% 5.64% 7.61% Apr-09 7.53% 12.23% 10.84% 5.36% 7.91% May-09 6.47% 9.24% 10.55% 4.41% 7.66% Jun-09 5.38% 9.05% 5.77% 1.86% 7.58%
Grand Total 6.74% 9.82% 9.60% 4.99% 8.03%

GLOSSARY AND DEFINITIONS: PART 1 Default Ratios
Default ratios, or the percentage of secondary loan prepayments that are attributable to defaults, can be considered a measurement of the health of small business in the U.S. GLS, with default and borrower prepayment data supplied by Colson Services, has calculated default ratios for both SBA 7(a) and 504 loans since January, 2000. The default ratio is calculated using the following formula:
Defaults / (Defaults + Prepayments) By definition, when the default ratio is increasing, defaults are increasing faster than borrower prepayments, suggesting a difficult busi-ness environment for small business, perhaps even recessionary conditions. On the flip side, when the ratio is decreasing, either de-faults are falling or borrower prepayments are outpacing defaults, each suggesting improving business conditions for small business. Our research suggests that a reading of 20% or greater on 7(a) default ratios and 15% or greater on 504 default ratios suggest eco-nomic weakness in these small business borrower groups.
Theoretical Default Rate Due to a lack of up-to-date default data, we attempt to estimate the current default rate utilizing two datasets that we track: 1. Total prepayment data on all SBA pools going back to 2003. This is the basis for our monthly prepayment information. Total prepayment data on all secondary market 7(a) loans going back to 1999, broken down by defaults and voluntary prepayments. This is the basis for our monthly default ratio analysis. With these two datasets, it is possible to derive a theoretical default rate on SBA 7(a) loans. We say “theoretical” because the reader has to accept the following assumptions as true: 1. The ratio of defaults to total prepayments is approximately the same for SBA 7(a) pools and secondary market 7(a) loans. Fact: 60% to 70% of all secondary market 7(a) loans are inside SBA pools. 2. The default rate for secondary market 7(a) loans closely approximates the default rate for all outstanding 7(a) loans. Fact: 25% to 35% of all outstanding 7(a) loans have been sold into the secondary market. While the above assumptions seem valid, there exists some unknown margin for error in the resulting analysis. However, that does not invalidate the potential value of the information to the SBA lender community. The Process
To begin, we calculated total SBA pool prepayments, as a percentage of total secondary loan prepayments, using the following for-mula:
Pool Prepay Percentage = Pool Prepayments / Secondary Loan Prepayments This tells us the percentage of prepayments that are coming from loans that have been pooled. Next, we calculated the theoretical default rate using the following equation:
((Secondary Loan Defaults * Pool Prepay Percentage) / Pool Opening Balance) * 12 This provides us with the theoretical default rate for SBA 7(a) loans, expressed as an annualized percentage.
GLS Long Value Indices
Utilizing the same maturity buckets as in our CPR analysis, we calculate 6 separate indexes, denoted as GLS VI-1 to VI-6. The num-bers equate to our maturity buckets in increasing order, with VI-1 as <8 years, VI-2 as 8-10 years, VI-3 as 10-13 years, VI-4 as 13-16 years, VI-5 as 16-20 years and ending with VI-6 as 20+ years.
The new Indices are basically weighted-average spreads to Libor, using the rolling six-month CPR for pools in the same maturity bucket, at the time of the transaction. While lifetime prepayment speeds would likely be lower for new loans entering the secondary market, utilizing six-month rolling pool speeds allowed us to make relative value judgments across different time periods.
We compare the bond-equivalent yields to the relevant Libor rate at the time of the transaction. We then break the transactions into the six different maturity buckets and calculate the average Libor spread, weighting them by the loan size.
For these indices, the value can be viewed as the average spread to Libor, with a higher number equating to greater value in the trading levels of SBA 7(a) loans.
Coleman Government Loan Solutions’ CPR Report Page 13

GLOSSARY AND DEFINITIONS: PART 2 Prepayment Calculations
SBA Pool prepayment speeds are calculated using the industry convention of Conditional Prepayment Rate, or CPR. CPR is the an-nualized percentage of the outstanding balance of a pool that is expected to prepay in a given period. For example, a 10% CPR sug-gests that 10% of the current balance of a pool will prepay each year. When reporting prepayment data, we break it into seven different original maturity categories: <8 years, 8-10 years, 10-13 years, 13-16 years, 16-20 years and 20+ years. Within these categories we provide monthly CPR and YTD values. In order to get a sense as to timing of prepayments during a pool’s life, we provide CPR for maturity categories broken down by five different age categories: 0-12 months, 13-24 months, 25-36 months, 37-48 months and 48+ months. As to the causes of prepayments, we provide a graph which shows prepayment speeds broken down by voluntary borrower prepay-ment speeds, denoted VCPR and default prepayment speeds, denoted as DCPR. The formula for Total CPR is as follows:
Total Pool CPR = VCPR + DCPR
SBA Libor Base Rate The SBA Libor Base Rate is set on the first business day of the month utilizing one-month LIBOR, as published in a national financial newspaper or website, plus 3% (300 basis points). The rate will be rounded to two digits with .004 being rounded down and .005 be-ing rounded up. Please note that the SBA’s maximum 7(a) interest rates continue to apply to SBA base rates: Lenders may charge up to 2.25% above the base rate for maturities under seven years and up to 2.75% above the base rate for maturities of seven years or more, with rates 2% higher for loans of $25,000 or less and 1% higher for loans between $25,000 and $50,000. (Allowable interest rates are slightly higher for SBAExpress loans.)
Risk Types The various risk types that impact SBA pools are the following: Basis Risk: The risk of unexpected movements between two indices. The impact of this type of risk was shown in the decrease in the Prime/Libor spread experienced in 2007 and 2008. Prepayment Risk: The risk of principal prepayments due to borrower voluntary curtailments and defaults. Overall prepayments are expressed in CPR, or Conditional Prepayment Rate. Interest Rate Risk: The risk of changes in the value of an interest-bearing asset due to movements in interest rates. For pools with monthly or quarterly adjustments, this risk is low. Credit Risk: Losses experienced due to the default of collateral underlying a security. Since SBA loans and pools are guaranteed by the US government, this risk is very small.
TALF The TALF, or Term Asset-Backed Security Loan Facility, was announced by the Federal Reserve Bank and the US Treasury on November 25, 2008. The purpose of the TALF is to make credit available to consumers and small businesses on more favorable terms by facilitating the issuance of asset-backed securities (ABS) and improving the market conditions for ABS more generally. The most recent update was released by the Federal Reserve on May 19th, 2009. The Federal Reserve Bank of New York will make up to $1 trillion of loans under the TALF. TALF loans will have a term of three years; will be non-recourse to the borrower; and will be fully secured by eligible ABS. The US Treasury Department will provide $100 billion of credit protection to the Federal Reserve in connection with the TALF. SBA Pools issued in 2008 and beyond are considered eligible securities. SBA Pools are eligible for 3 or 5 year TALF loans.
Coleman Government Loan Solutions’ CPR Report Page 14

Coleman Government Loan Solutions’ CPR Report Page 15
Let GLS Value your Mortgage Servicing Rights
Government Loan Solutions, the national leader in SBA servicing portfolio valuation, now offers it’s market-based valuation
methodology to the mortgage servicing industry.
If your firm provides mortgage servicing, we can provide you with the same loan-by-loan detail and stress testing that we provide to our
SBA servicing clients.
For more information, please contact Rob Herrick at 216-456-2480 ext. 144 or by e-mail at [email protected]

Powered By:
www.glsolutions.us
Government Loan Solutions’ CPR Report is a monthly elec-tronic newsletter published by
Coleman. The opinions, unless otherwise stated, are exclusively those of
the editorial staff. This newsletter is not to be reproduced or distributed in any form or fashion, without the express written consent of Coleman or Government Loan
Solutions. Government Loan Solutions’ CPR Report is distributed in
pdf format via e-mail. Spread-sheets relating to the presented data are available to paid sub-
scribers upon request. The subscription to the Gov-ernment Loan Solutions’ “CPR Report” is free to all members
of the SBA Community. To subscribe, please contact
Coleman at (800) 617-1380 or via email at:
Partners
Scott Evans Bob Judge
Rob Herrick
812 Huron Road Cleveland, OH 44115
Government Loan Solut ions
Phone: (216) 456-2480 Fax: (216) 456-2481 Web Site: www.glsolutions.us E-mail: [email protected]
Government Loan Solutions, Inc. (GLS) was founded by three former Bond Traders in Cleveland, OH. Scott Evans, Rob Herrick and Bob Judge possess a combined 70 years experi-ence in the institutional fixed income markets, 40 of which are in the SBA securitization busi-ness. GLS formally began operations in January, 2007. Our mission is as follows:
“The purpose of Government Loan Solutions is to bring greater efficiency, productivity and transparency to the financial markets. Through the use of proprietary technology, we intend to aid lenders in all aspects of their government lending, help pool assemblers be more productive in their operational procedures and provide quality research to the investor community .”
Services available include:
Lenders: • Manage loan sales to the secondary market • Process loan settlements via our electronic platform, E-Settle • Third-Party servicing and non-guaranteed asset valuation • Model Validation • Specialized research projects • Mortgage Servicing Valuation
Pool Assemblers:
• Manage loan settlements and pool formation • Loan and IO accounting • Loan, Pool and IO Mark-To-Market • Specialized research projects
Institutional Investors:
• Loan, Pool, and IO Mark-To-Market • Specialized research projects • Portfolio consulting, including TALF
For additional information regarding our products and capabilities, please contact us at: Phone: (216)456-2480 E-mail at: [email protected] web: www.glsolutions.us
Coleman Government Loan Solutions’ CPR Report Page 16