covid-19 pandemic impact, response, & recovery study
TRANSCRIPT

India Report
COVID-19 Pandemic Impact, Response, & Recovery Study
J U N E 2 0 2 1
Table of Contents
Study OverviewTop 10 TakeawaysCaregiving, Household Activity, and Paid Work Impacts
I. Gendered Impacts of COVID-19 PandemicII. COVID-19 Effect on Paid Work
Satisfaction with Government’s Response / Government Programs
I. PMJDY Financial Inclusion ProgramII. MGNREGA Employment ProgramIII. Gender-Based Violence Support Services
Perceptions of International SupportAppendix
I. Study MethodologyII. About Fraym

STUDY OVERVIEW
3Fraym • Mapping Humanity
COVID-19 Pandemic Impact, Response, & Recovery Study
The COVID-19 pandemic is a once-in-a century crisis. Well over 3 million people have died as of June 2021, and entire economies have been disrupted in ways previously unimaginable.
This study analyzes the social, economic, and personal security impacts of the COVID-19 pandemic as well as the reach and impact of government response programs. More specifically, Fraym designed this study and related survey questionnaires to better understand the gendered impacts of the pandemic in these important areas.
We conducted large, georeferenced, and nationally-representative surveys in India, Kenya, and South Africa. All of these countries have been hard struck by the pandemic, particularly India and South Africa.
All data collection was conducted in April 2021 via a combination of online, mobile phone, and face-to-face interviews. These three surveys included nearly 50,000 respondents overall, making this one of the largest gender-disaggregated and spatially-enabled studies of the COVID-19 pandemic focused on developing economies.
This report details findings from India.
In India, Fraym conducted a nationally-representative survey of 27,354 respondents from 9-29 April 2021.1 The survey captured how COVID-19 directly affected people’s lives, as well as their perceptions of how the pandemic and government response influenced the lives of others, including important issues such as:
The survey data was weighted to reflect the most recent population parameters available from the Indian Ministry of Statistics and Programme Implementation across gender, age, education, and state levels. Additional methodological information is available in the appendix.
Effects on employment, income, and household resources
Effects on non-employment activities like family care, shopping, and household chores
Effects on household food security
Perceptions of gender differences in health, economic, caregiving, and safety impacts of COVID-19
Perceptions of programs related to child support and gender-based violence
Perceptions of the national government’s and international community’s response to COVID-19
5
6
1
2
3
4
Note: This survey was conducted prior a further spike in cases in India in May 2021 and may not capture the most current and complete impacts of the COVID-19 pandemic.
TOP 10 TAKEAWAYS
4Fraym • Mapping Humanity
INDIA
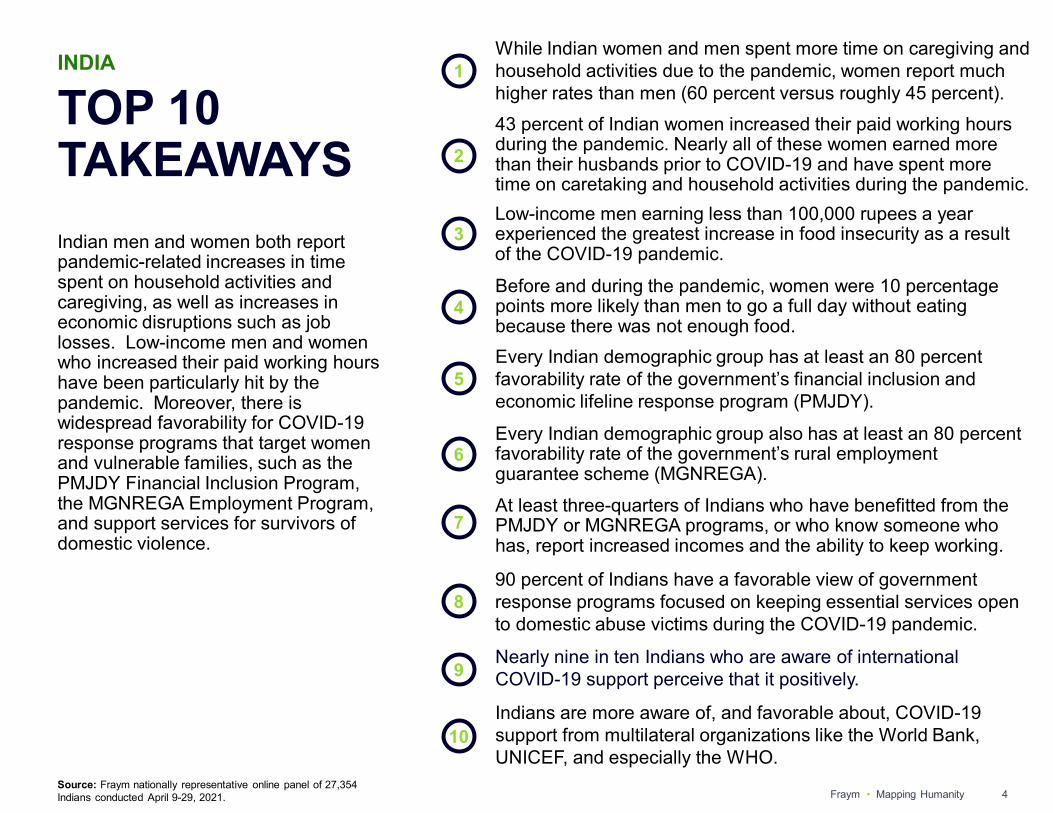
Indian men and women both report pandemic-related increases in time spent on household activities and caregiving, as well as increases in economic disruptions such as job losses. Low-income men and women who increased their paid working hours have been particularly hit by the pandemic. Moreover, there is widespread favorability for COVID-19 response programs that target women and vulnerable families, such as the PMJDY Financial Inclusion Program, the MGNREGA Employment Program, and support services for survivors of domestic violence.
7
8
1
4
2
3
5
6
While Indian women and men spent more time on caregiving and household activities due to the pandemic, women report much higher rates than men (60 percent versus roughly 45 percent). 43 percent of Indian women increased their paid working hours during the pandemic. Nearly all of these women earned more than their husbands prior to COVID-19 and have spent more time on caretaking and household activities during the pandemic.
Before and during the pandemic, women were 10 percentage points more likely than men to go a full day without eating because there was not enough food.
Low-income men earning less than 100,000 rupees a year experienced the greatest increase in food insecurity as a result of the COVID-19 pandemic.
At least three-quarters of Indians who have benefitted from the PMJDY or MGNREGA programs, or who know someone who has, report increased incomes and the ability to keep working.
Every Indian demographic group has at least an 80 percent favorability rate of the government’s financial inclusion and economic lifeline response program (PMJDY).
9
10
Every Indian demographic group also has at least an 80 percent favorability rate of the government’s rural employment guarantee scheme (MGNREGA).
Nearly nine in ten Indians who are aware of international COVID-19 support perceive that it positively.
Indians are more aware of, and favorable about, COVID-19 support from multilateral organizations like the World Bank, UNICEF, and especially the WHO.
Source: Fraym nationally representative online panel of 27,354 Indians conducted April 9-29, 2021.
90 percent of Indians have a favorable view of government response programs focused on keeping essential services open to domestic abuse victims during the COVID-19 pandemic.

Caregiving, Household Activity, and Paid Work Impacts
5Fraym • Mapping Humanity

Caregiving and Household Activity Impacts
6Fraym • Mapping Humanity
INDIA
The majority of Indian men and women report increasing the hours they devote to caregiving and household activities as a result of the COVID-19 pandemic. However, women report spending additional time at higher rates than men in each examined category.
Three in five Indian women report spending more time cooking, cleaning and serving meals during the pandemic. Fifty seven percent of women report increased time caring for children, and roughly half report more hours providing care for older or sick adult household members.
Note: Respondents could report increased, decreased, or unchanged hours, as well as not normally doing that activity in their household.
Source: Fraym nationally representative online panel of 27,354 Indians conducted April 9-29, 2021.
% reporting the COVID-19 pandemic increased the hours they devote to household activities, by gender
+13pp
+9
+6
+5
+4
+4
+3
DifferentialWomenMen

Food Insecurity and Job Losses
7Fraym • Mapping Humanity
INDIA
Note: Respondents could report increased, decreased, or unchanged hours, as well as not normally doing that activity in their household.
Source: Fraym nationally representative online panel of 27,354 Indians conducted April 9-29, 2021.
Food Insecurity:
Before the pandemic, women were nearly 10 percentage points more likely than men to go the whole day and night without eating due to lack of food. This disparity did not change during the pandemic.
However, among all groups examined by gender and income, men making less than 100,000 rupees per year (or USD $3.75 per day) experienced the greatest increase in food insecurity during the pandemic – that is, they were not food insecure before the pandemic but were food insecure in the last 30 days prior to the survey.
Job Losses:
Half of Indians believe that men and women have been affected about the same by job losses due to school closures.

Gendered Impacts of the COVID-19 Pandemic
8Fraym • Mapping Humanity
INDIA
Indians are roughly twice as likely to believe that increased caregiving and household activity responsibilities have affected women more than men during the pandemic. At the same time, there are sizable numbers of Indians (roughly 40 percent) who believe that men and women have been impacted about the same in these areas.
In general, men are more likely to feel the impact of the pandemic is about the same between genders, while women are more likely to answer that women have been affected more.2
There is not a significant gender-based difference in Indians’ beliefs about whether job losses due to school closures have impacted women more, men more, or about the same.Note 1: Difference between men and women. Respondents could select women more, men more, about the same, or not an impact.
Note 2: This analysis not shown on this report.
Source: Fraym nationally representative online panel of 27,354 Indians conducted April 9-29, 2021.
Differential1
+19pp
+18
+12
+17
-3
-2
% that reported the pandemic affected women more, men more, or about the same

COVID-19 Pandemic Effects on Paid Work
9Fraym • Mapping Humanity
INDIA
More than two in five Indian women have increased their paid working hours during the pandemic. By comparison, less than three in ten men have increased their paid working hours.
Men were 1.5 times more likely to have lost their job since the pandemic began than women (10 percent versus 6 percent of respondents).
Source: Fraym nationally representative online panel of 27,354 Indians conducted April 9-29, 2021.
% that saying that their hours of paid work __
WomenMen Differential
+15 pp
-8
-4
+3
-2

COVID-19 Pandemic Effects onWorking Women
10Fraym • Mapping Humanity
INDIA
Women who have increased hours devoted to paid work mostly work for businesses, earned more than their partners/husbands prior to the pandemic, and have also increased the number of hours devoted to caretaking of children and family members during the pandemic.1
Note 1: Sample size for the number of women who increased the number of hours devoted to paid work since the pandemic is 4,831.
Source: Fraym nationally representative online panel of 27,354 Indians conducted April 9-29, 2021.
Women who increased the number of hours devoted to paid work since the pandemic began… Percentage
Described their occupation before the COVID-19 pandemic as…
Worked for pay: companies (including working for family business) 86%Worked for pay: household or person 2%Owned business: did not employ people (“freelancer”) 3%Owned business: employed other people 9%Compared their income to their partner/husband before the COVID-19 pandemic as…
More than my partner/husband 84%Less than my partner/husband 8%About the same 7%I don’t know 0%I had no earnings 1%Partner/husband had no earnings 0%Have also increased the number of hours devoted to ___ due to the COVID-19 pandemic.
Caring for children including feeding, cleaning, physical care 47%Assisting older/sick/disabled adults with medical care, feeding, cleaning, physical care 60%Assisting older/sick/disabled adults in other ways than physical care 58%Affective/emotional support for adult family members 61%

State-Level Impacts of COVID-19 on Household Income
11Fraym • Mapping Humanity
INDIA
Two thirds of Indians in Manipur reported a decrease in household income from work due to the COVID-19 pandemic, while only ten to fifteen percent of people in nearby Mizoram and Tripura states – other agriculture-based economies – reported similar income declines. The growing services sector of Kerala has been hit hard by pandemic job loss and high COVID-19 infection rates.
Note: The states of Jammu and Kashmir and Arunachal Pradesh are disputed territory but are included in the map since the populations were enumerated for the survey. Data is not included for any state that had fewer than 30 respondents (shown in gray on the map). Source: Fraym nationally representative online panel of 27,354 Indians conducted April 9-29, 2021.
State Highlighted states0 100%
States with the highest% of people with
decreased household income due to COVID-19
States with the lowest % of people with
decreased household income due to COVID-19
Manipur 67% Mizoram 10%Kerala 53% Tripura 14%Jharkhand 48% Nagaland 17%Goa 45% Meghalaya 20%Punjab 43% Uttarakhand 25%Odisha 42% Madhya Pradesh 26%Puducherry 41% Delhi 27%Assam 40% Himachal Pradesh 27%Uttar Pradesh 40% West Bengal 28%Andhra Pradesh 39% Chandigarh 30%
Mizoram
Insufficient data
Kerala
Manipur
Tripura

Attitudes about Government Responses
12Fraym • Mapping Humanity
INDIA
Seventy percent of Indians report being satisfied with their government’s COVID-19 response to economic disruptions, despite the deteriorating situation during the survey period (April 2021). Only 16 percent reported being unsatisfied.
Older Indians are significantly more satisfied with the government’s response, while younger generations view the response less favorably.
Indians from Scheduled Castes are significantly more likely to have a positive perception of the government’s response than other designated groups.
Women were more likely to support the government’s response to economic disruption than men.
Note: Other gender includes transgender, 3rd gender, and non-binary individuals (1% of sample).
Source: Fraym nationally representative online panel of 27,354 Indians conducted April 9-29, 2021.
% saying they are __ with India's response to COVID-19 economic disruption
Very / somewhat unsatisfied Very / somewhat satisfied
State-Level Attitudes About Government Responses
13Fraym • Mapping Humanity
INDIA
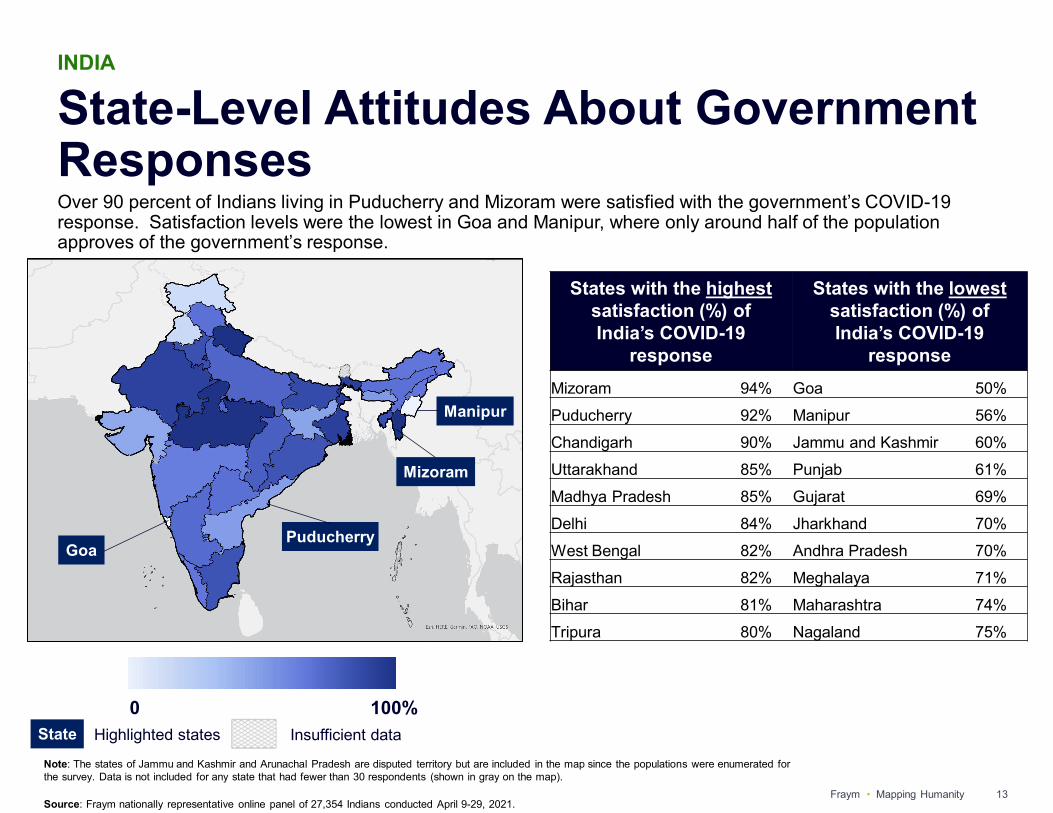
Over 90 percent of Indians living in Puducherry and Mizoram were satisfied with the government’s COVID-19 response. Satisfaction levels were the lowest in Goa and Manipur, where only around half of the population approves of the government’s response.
State Highlighted states0 100%
States with the highest satisfaction (%) of India’s COVID-19
response
States with the lowest satisfaction (%) of India’s COVID-19
responseMizoram 94% Goa 50%Puducherry 92% Manipur 56%Chandigarh 90% Jammu and Kashmir 60%Uttarakhand 85% Punjab 61%Madhya Pradesh 85% Gujarat 69%Delhi 84% Jharkhand 70%West Bengal 82% Andhra Pradesh 70%Rajasthan 82% Meghalaya 71%Bihar 81% Maharashtra 74%Tripura 80% Nagaland 75%
Puducherry
Mizoram
Manipur
Goa
Insufficient data
Note: The states of Jammu and Kashmir and Arunachal Pradesh are disputed territory but are included in the map since the populations were enumerated for the survey. Data is not included for any state that had fewer than 30 respondents (shown in gray on the map).
Source: Fraym nationally representative online panel of 27,354 Indians conducted April 9-29, 2021.
Loss of Paid Income & Attitudes about Government Response
14Fraym • Mapping Humanity
INDIA
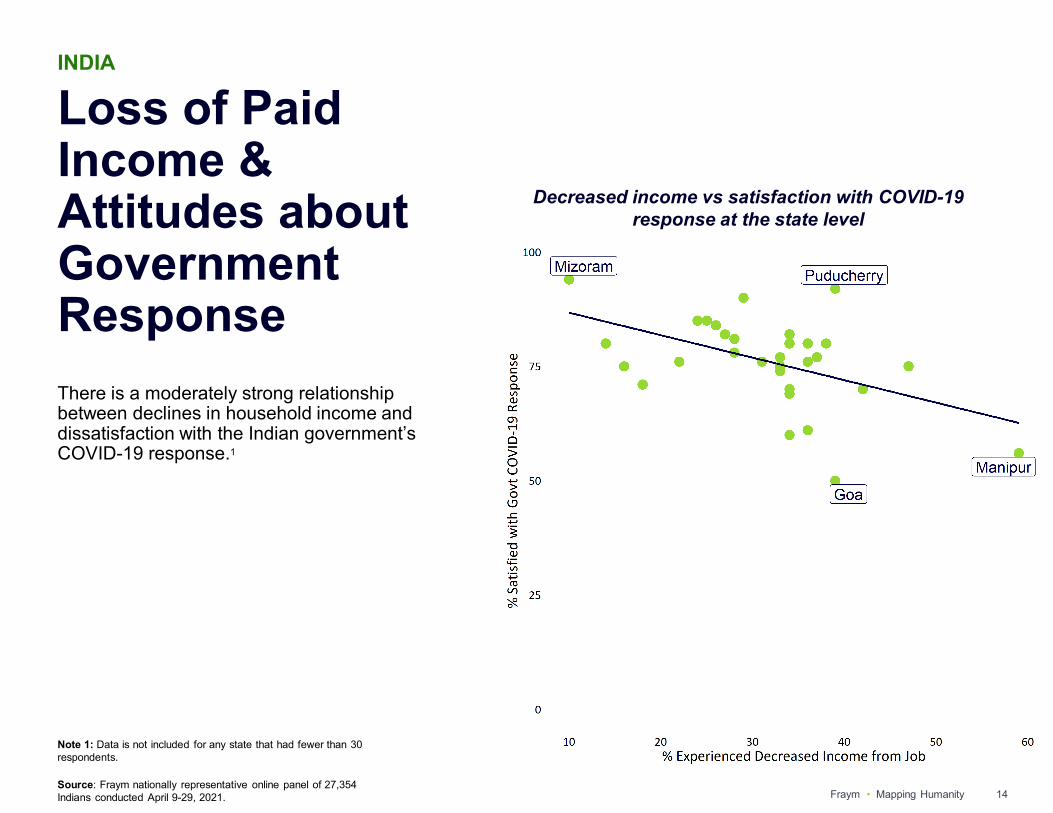
There is a moderately strong relationship between declines in household income and dissatisfaction with the Indian government’s COVID-19 response.1
Note 1: Data is not included for any state that had fewer than 30 respondents.
Source: Fraym nationally representative online panel of 27,354 Indians conducted April 9-29, 2021.
Decreased income vs satisfaction with COVID-19 response at the state level

PMJDY Financial Inclusion Program
15Fraym • Mapping Humanity

About PMJDY
16Fraym • Mapping Humanity
INDIA
Pradhan Mantri Jan Dhan Yojana (PMJDY) is a financial inclusion scheme to expand bank account access. These accounts were used to target cash transfers to women from April to June 2020.
Note 1: Source: https://pmjdy.gov.in/
Note 2: Source: https://www.business-standard.com/article/current-affairs/pradhan-mantri-jan-dhan-yojana-accounts-cross-410-million-finance-ministry-121011901438_1.html and https://www.downtoearth.org.in/news/governance/covid-19-relief-didn-t-reach-jan-dhan-a-cs-of-many-women-survey-72113
Note 3: source: http://documents1.worldbank.org/curated/en/467521607723220511/pdf/Social-Protection-and-Jobs-Responses-to-COVID-19-A-Real-Time-Review-of-Country-Measures-December-11-2020.pdf
Note 4: Source: https://egc.yale.edu/reaching-indias-poorest-women-covid-19-relief and https://www.findevgateway.org/blog/2021/03/catalyzing-womens-bank-account-use-through-covid-19-relief
Pradhan Mantri Jan-Dhan Yojana (PMJDY) aims to provide every Indian adult with financial services by enabling the opening of a basic savings bank deposit account. The accounts earn interest, include a debit card with accident insurance, are eligible for certain direct cash transfer programs, and do not have minimum balance requirements.1
There are about 400 million PMJDY accounts in India and about 54 percent are held by women.2
Between April and June 2020, the government transferred Rs500 (US$ 6.50) per month to all female PMJDY account holders in response to the economic disruptions from the COVID-19 pandemic.3
Banks holding PMJDY accounts saw an uptick in account use as well as new accounts being opened during the period of this support.4 However, analysis of the program does indicate that it may have been difficult for some women to access the funds because of inoperative accounts and other barriers to financial inclusion.
1
2
3
4

Attitudes about PMJDY
17Fraym • Mapping Humanity
INDIA
Every demographic group in our survey has a highly favorable view of the government’s PMJDY financial inclusion program.
Every group (gender, ethnicity/caste, age, or marital status) has at least an 80 percent favorability rate, illustrating strong broad-based support for the program.
Note: Other gender includes transgender, 3rd gender, and non-binary individuals (1% of sample). Other group includes all groups not included in the three presented (35% of sample). Other living situation includes married but separated, widowed and not remarried, and divorced and not remarried (2% of sample).
Source: Fraym nationally representative online panel of 27,354 Indians conducted April 9-29, 2021.
% with __ opinion of PMJDY
Very / somewhat unfavorable Very / somewhat favorable

Beneficiaries of PMJDY
18Fraym • Mapping Humanity
INDIA
Roughly three in five Indians have either benefitted – or know someone who has benefited – from the PMJDY program.
Married, Scheduled Caste, and older Indians report having benefitted or knowing someone who has benefited at higher rates.
Note: Other gender includes transgender, 3rd gender, and non-binary individuals (1% of sample). Other group includes all groups not included in the three presented (35% of sample). Other living situation includes married but separated, widowed and not remarried, and divorced and not remarried (2% of sample).
Only those that were aware of the program were asked to report if they were beneficiaries or know someone who has benefitted.
Source: Fraym nationally representative online panel of 27,354 Indians conducted April 9-29, 2021.
% who has benefitted from or knows someone who has benefitted from the PMJDY

Beliefs about Gendered Impacts of PMJDY
19Fraym • Mapping Humanity
INDIA
Nationally, half of Indians believe that the PMJDY benefits men and women equally.
Although women report high levels of benefiting or knowing someone who has benefited from the program, only 17 percent of Indians believe the PMJDY program benefits women more than men.
Women were 11 percentage points more likely than men to believe the program benefited men more.
Younger Indians and Indians that identify as an Other Backward Caste are more likely to see the program as benefiting both genders equally.
Note: Other gender includes transgender, 3rd gender, and non-binary individuals (1% of sample). Other group includes all groups not included in the three presented (35% of sample).
Source: Fraym nationally representative online panel of 27,354 Indians conducted April 9-29, 2021.
% that believes PMJDY benefits __ more

State-Level Beneficiaries of PMJDY
20Fraym • Mapping Humanity
INDIA
Residents of Madhya Pradesh and Himachal Pradesh are most likely to report being beneficiaries or knowing a beneficiary of the PMJDY program. The program’s reach is much less in Arunachal Pradesh and Goa, the latter being one of the wealthiest Indian states.
0 100%
States with the highest beneficiaries (%) of the
PMJDY program
States with the lowest beneficiaries (%) of the
PMJDY programMadhya Pradesh 76% Arunachal Pradesh 38%Himachal Pradesh 73% Goa 40%Bihar 72% Kerala 42%West Bengal 72% Meghalaya 43%Uttarakhand 71% Puducherry 47%Haryana 69% Mizoram 48%Tripura 69% Jammu and Kashmir 49%Delhi 68% Punjab 49%Uttar Pradesh 67% Manipur 52%Chandigarh 67% Andhra Pradesh 52%
Madhya Pradesh
Himachal Pradesh
State Highlighted states Insufficient data
Arunachal Pradesh
Goa
Note: The states of Jammu and Kashmir and Arunachal Pradesh are disputed territory but are included in the map since the populations were enumerated for the survey. Data is not included for any state that had fewer than 30 respondents (shown in gray on the map). Only those that were aware of the program were asked to report if they were beneficiaries or know someone who has benefitted.
Source: Fraym nationally representative online panel of 27,354 Indians conducted April 9-29, 2021.

State-Level Awareness of PMJDY
21Fraym • Mapping Humanity
INDIA
Public awareness of the PMJDY financial inclusion program is highest in the northern states of Himachal Pradesh and Haryana, although nearby Punjab has one of the lowest awareness rates. In the state of Mizoram in northeastern India, only around half of Indians have heard of the PMJDY program.
0 100%
States with the highest awareness (%) of the
PMJDY program
States with the lowest awareness (%) of the
PMJDY program
Himachal Pradesh 91% Mizoram 54%Haryana 88% Punjab 69%Madhya Pradesh 88% Puducherry 71%West Bengal 88% Meghalaya 72%Telangana 86% Jharkhand 74%Rajasthan 86% Chhattisgarh 75%Karnataka 86% Andhra Pradesh 75%Manipur 85% Kerala 76%Uttar Pradesh 85% Chandigarh 76%Bihar 84% Jammu and Kashmir 77%
Punjab
Haryana
Himachal Pradesh
Mizoram
State Highlighted states Insufficient data
Note: The states of Jammu and Kashmir and Arunachal Pradesh are disputed territory but are included in the map since the populations were enumerated for the survey. Data is not included for any state that had fewer than 30 respondents (shown in gray on the map).
Source: Fraym nationally representative online panel of 27,354 Indians conducted April 9-29, 2021.

PMJDYImpacts
22Fraym • Mapping Humanity
INDIA
Economic Impacts: Three in four Indians who benefited from the program directly, or report knowing someone who benefited, report that it led to an increased ability to work. Three in four also report increased incomes as an important program impact.
Health and Physical Safety Impacts: Respondents report that the PMJDY program also has contributed to improved nutrition, emotional health, and physical safety for beneficiaries.
Note: Only those who benefited or knew someone who benefited were asked about impacts. Respondents could select more than one impact.
Source: Fraym nationally representative online panel of 27,354 Indians conducted April 9-29, 2021.
% who reported PMJDY had provided ___benefits

MGNREGA Employment Program
23Fraym • Mapping Humanity

About the MGNREGA Program
24Fraym • Mapping Humanity
INDIA
Mahatma Gandhi National Rural Employment Guarantee Scheme (MGNREGA) provides up to 100 days of paid unskilled manual labor per year on public works projects with specific gender provisions. The MGNREGA became a lifeline for many Indians as lockdown measures and follow-on economic disruptions pushed urban migrants back to rural areas. The Indian government allocated an all-time high for MGNREGA funding in fiscal year 2020/21.
Note 1: https://nregaconsortium.in/download/articles/nrega-women.pdf
Note 2: Source: https://economictimes.indiatimes.com/news/economy/indicators/mgnrega-played-a-critical-role-in-providing-wage-employment-during-the-pandemic-says-tomar/articleshow/81188282.cms?utm_source=contentofinterest&utm_medium=text&utm_campaign=cppst
Note 3: Source: http://documents1.worldbank.org/curated/en/467521607723220511/pdf/Social-Protection-and-Jobs-Responses-to-COVID-19-A-Real-Time-Review-of-Country-Measures-December-11-2020.pdf
The MGNREGA provides several gender-specific provisions, including: • Ensuring equal pay for equal work for men and women• One third of all employment is reserved for women, although
the percent of female participants varies by state, with some above 60 percent and some below the statutory one-third level at the start of the pandemic.
• Childcare facilities located at the worksite, which assists female caretakers in the labor force.1
Women represent 52 percent of participants as of March 2021. The scheme reports that 71 million households have benefited in the current fiscal year (April 2020 to March 2021) to date.2
In response to the economic disruptions, wages were increased by roughly 8 percent from increased from Rs180 (US$ 2.38) to Rs202 (US$ 2.67) per day.3
1
2
3

Attitudes About MGNREGA
25Fraym • Mapping Humanity
INDIA
As with the PMJDY, every demographic group in India has a favorable view of the government’s MGNREGA rural employment guarantee scheme.
Every group (gender, ethnicity/caste, age, urban/rural, or marital status) has over an 80 percent favorability rate, illustrating strong broad-based support for the program.
Note: Other gender includes transgender, 3rd gender, and non-binary individuals (1% of sample). Other group includes all groups not included in the three presented (35% of sample). Other living situation includes married but separated, widowed and not remarried, and divorced and not remarried (2% of sample).
Source: Fraym nationally representative online panel of 27,354 Indians conducted April 9-29, 2021.
% with __ opinion of MGNREGA
Very / somewhat unfavorable Very / somewhat favorable

Beneficiaries of MGNREGA
26Fraym • Mapping Humanity
INDIA
Three in five Indians have benefited, or know someone who has benefited, from the MGNREGA employment program and it is overwhelmingly viewed as a positive intervention.
The program reaches Scheduled Caste and Scheduled Tribe Indians at far higher rates than for other groups, suggesting that the program reaches some of the most vulnerable groups in the country.
Note: Other gender includes transgender, 3rd gender, and non-binary individuals (1% of sample). Other group includes all groups not included in the three presented (35% of sample). Other living situation includes married but separated, widowed and not remarried, and divorced and not remarried (2% of sample).
Only those that were aware of the program were asked to report if they were beneficiaries or know someone who has benefitted.
Source: Fraym nationally representative online panel of 27,354 Indians conducted April 9-29, 2021.
% who has benefitted or knows someone who has benefittedfrom MGNREGA

Beliefs about Gendered Impacts of MGNREGA
27Fraym • Mapping Humanity
INDIA
More than half of Indians believe that the MGNREGA program benefits both genders equally, and only 13 percent of Indians believe the MGNREGA employment program benefits women more than men.
Indians younger than 54 believe that the program benefits both genders about the same, while half of Indians 55 years and older believe that the program benefits men more.
Indians that identify with as OBC are more likely to see the MGNREGA program as benefiting both genders equally, while scheduled castes are also more likely to believe that MGNREGA benefits men more than women.
Note: Other gender includes transgender, 3rd gender, and non-binary individuals (1% of sample). Other group includes all groups not included in the three presented (35% of sample).
Source: Fraym nationally representative online panel of 27,354 Indians conducted April 9-29, 2021.
% that believes MGNREGA benefits __ more

State-Level Beneficiaries of MGNREGA
28Fraym • Mapping Humanity
INDIA
Indians in fast-growing agricultural states of Uttarakhand and Mizoram are most likely to be beneficiaries or know a beneficiary of the MGNREGA scheme, while Indians in the wealthier state of Goa are less likely to be a beneficiary or know one.
States with the highest beneficiaries (%) of the
MGNREGA program
States with the lowest beneficiaries (%) of the
MGNREGA program
Uttarakhand 89% Goa 57%Mizoram 89% Gujarat 63%Bihar 88% Kerala 63%Puducherry 88% Maharashtra 66%Manipur 88% Karnataka 68%Chandigarh 86% Meghalaya 68%Madhya Pradesh 86% Rajasthan 70%Himachal Pradesh 85% Jharkhand 74%Tripura 85% Odisha 74%West Bengal 84% Andhra Pradesh 75%
0 100%
Uttarakhand
Gujarat
Goa
State Highlighted states Insufficient data
Mizoram
Note: The states of Jammu and Kashmir and Arunachal Pradesh are disputed territory but are included in the map since the populations were enumerated for the survey. Data is not included for any state that had fewer than 30 respondents (shown in gray on the map).
Source: Fraym nationally representative online panel of 27,354 Indians conducted April 9-29, 2021.

State-Level Awareness of MGNREGA
29Fraym • Mapping Humanity
INDIA
Awareness of the MGNREGA employment program is generally highest in the northern parts of the country. Nearly all Indians in Himachal Pradesh have heard of the program, while only half of Indians in coastal Puducherry state are familiar with the MGNREGA scheme.
States with the highest awareness (%) of the MGNREGA program
States with the lowest awareness (%) of the MGNREGA program
Himachal Pradesh 97% Puducherry 53%Nagaland 91% Goa 61%Manipur 91% Mizoram 64%Rajasthan 88% Kerala 66%Uttar Pradesh 86% Andhra Pradesh 67%Madhya Pradesh 85% Meghalaya 71%Bihar 85% Gujarat 72%Haryana 85% Maharashtra 73%West Bengal 83% Tamil Nadu 73%Assam 83% Chandigarh 75%
0 100%
Nagaland
Himachal Pradesh
State Highlighted states Insufficient data
GoaPuducherry
Note: The states of Jammu and Kashmir and Arunachal Pradesh are disputed territory but are included in the map since the populations were enumerated for the survey. Data is not included for any state that had fewer than 30 respondents (shown in gray on the map).
Source: Fraym nationally representative online panel of 27,354 Indians conducted April 9-29, 2021.

MGNREGAImpacts
30Fraym • Mapping Humanity
INDIA
Economic Impacts: Four in five Indians who benefited from the program directly, or report knowing someone who has benefited, report that the extra support has contributed to increased incomes and the ability to continue working.
Health and Physical Safety Impacts: Three in cite improved nutrition, emotional health, and physical safety impacts.
Note: Only those who benefited or knew someone who benefited were asked about impacts. Respondents could select more than one impact.
Source: Fraym nationally representative online panel of 27,354 Indians conducted April 9-29, 2021.
% who reported MGNREGA had provided ___benefits

Gender-Based Violence Support Services
31Fraym • Mapping Humanity

Gender-Based Violence Services Overview
32Fraym • Mapping Humanity
INDIA
Stay-at-home orders may have increased women’s exposure to abusive partners. In response, the Indian government at the national and state levels took steps to provide support for survivors of intimate partner violence, including maintaining and establishing helplines and points of services.
In the first week following the lockdown orders, the National Commission for Women recorded more than a two-fold increase in domestic violence and sexual assaults.1
The Ministry of Health and Family Welfare issued guidance for One Stop Centres and local health centres to ensure continuity of service for survivors of gender-based violence.2
The Government of India strengthened existing, and launched new, helplines for women affected by domestic violence and intimate partner violence.
The National Commission for Women launched a number accessible via WhatsApp and SMS.3
The Uttar Pradesh Police launched a special helpline with a front-page advertisement in a newspaper with the catchphrase: “Suppress corona, not your voice.”1
Note 1: Source: https://www.thehindu.com/news/national/ncw-launches-domestic-violence-helpline/article31312219.ece
Note 2: Source: Information provided by UN Women and/or UNDP country office (https://data.undp.org/gendertracker/)
Note 3: Source: https://economictimes.indiatimes.com/news/politics-and-nation/ncw-launches-whatsapp-number-to-report-domestic-violence-during-covid-19-lockdown/articleshow/75082848.cms)
1
2
3
4

Attitudes About GBV Support Services
33Fraym • Mapping Humanity
INDIA
Over 90 percent of women, gender-nonbinary, and transgender Indians have positive perceptions the Indian government keeping One Stop Centres open and helplines for women affected by violence.
Nearly nine in ten Indian men also have a favorable view of the government’s GBV-related services.
Older Indians (55+) support these support services and policies more than younger generations.
Indians who are married or living with a partner are more likely to have a favorable opinion of programs for women affected by violence.
Note: Other gender includes transgender, 3rd gender, and non-binary individuals (1% of sample). Other group includes all groups not included in the three presented (35% of sample). Other living situation includes married but separated, widowed and not remarried, and divorced and not remarried (2% of sample).
Source: Fraym nationally representative online panel of 27,354 Indians conducted April 9-29, 2021.
% with __ opinion of the government One Stop Centres and helplines
Very / somewhat unfavorable Very / somewhat favorable

Beneficiaries of GBV Services
34Fraym • Mapping Humanity
INDIA
Nationally, nearly three in five Indians have benefited – or know someone who has benefited – from the One Stop Centres and helplines open for women.
Married and cohabitating women, transgender, and non-binary Indiansreport benefitting, or knowing someone who has benefited, at the highest rates.
As with other government response programs, Scheduled Caste Indians have benefitted or know someone who has benefitted at far higher rates than the country overall (80 percent versus 58 percent).
Note: Other gender includes transgender, 3rd gender, and non-binary individuals (1% of sample). Other group includes all groups not included in the three presented (35% of sample). Other living situation includes married but separated, widowed and not remarried, and divorced and not remarried (2% of sample).
Only those that were aware of the program were asked to report if they were beneficiaries or know someone who has benefitted.
Source: Fraym nationally representative online panel of 27,354 Indians conducted April 9-29, 2021.
% who has used or knows someone who has used One Stop Centres or helplines

Beliefs about Gendered Impacts of GBV Support Services
35Fraym • Mapping Humanity
INDIA
Note: Other gender includes transgender, 3rd gender, and non-binary individuals (1% of sample). Other group includes all groups not included in the three presented (35% of sample).
Source: Fraym nationally representative online panel of 27,354 Indians conducted April 9-29, 2021.
Two in five Indians believe that GBV support services have benefitted men and women about the same. About three in ten believe these services benefit women more than men.
Roughly one third of Indians under 55 years old believe that GBV services benefit women more, while the plurality believes that the services benefit both genders about the same.
Nearly two in five Indians from a scheduled tribe believe that the service benefits women more than men, and about half of Indians that belong to a scheduled caste believe the program benefits men more.
% that believes One Stop Centres or helplines benefit __ more
State-Level Beneficiaries of GBV Services
36Fraym • Mapping Humanity
INDIA
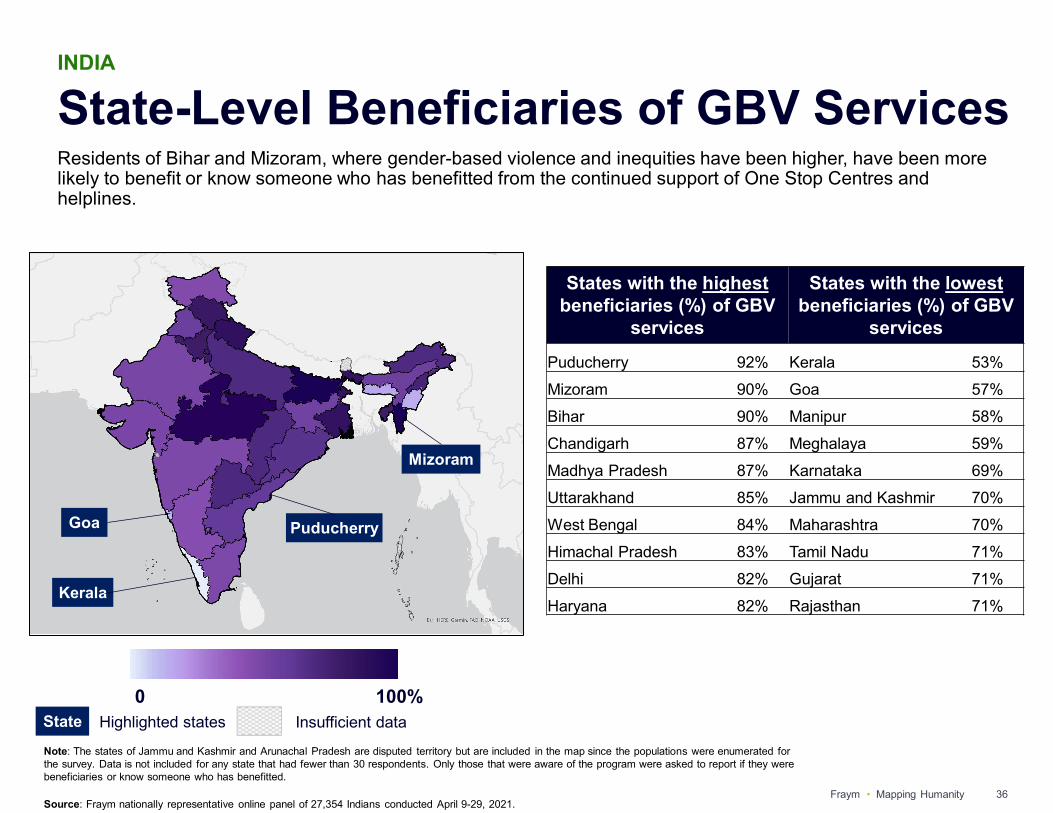
Residents of Bihar and Mizoram, where gender-based violence and inequities have been higher, have been more likely to benefit or know someone who has benefitted from the continued support of One Stop Centres and helplines.
States with the highest beneficiaries (%) of GBV
services
States with the lowest beneficiaries (%) of GBV
services
Puducherry 92% Kerala 53%Mizoram 90% Goa 57%Bihar 90% Manipur 58%Chandigarh 87% Meghalaya 59%Madhya Pradesh 87% Karnataka 69%Uttarakhand 85% Jammu and Kashmir 70%West Bengal 84% Maharashtra 70%Himachal Pradesh 83% Tamil Nadu 71%Delhi 82% Gujarat 71%Haryana 82% Rajasthan 71%
0 100%State Highlighted states Insufficient data
Goa
Kerala
Puducherry
Mizoram
Note: The states of Jammu and Kashmir and Arunachal Pradesh are disputed territory but are included in the map since the populations were enumerated for the survey. Data is not included for any state that had fewer than 30 respondents. Only those that were aware of the program were asked to report if they were beneficiaries or know someone who has benefitted.
Source: Fraym nationally representative online panel of 27,354 Indians conducted April 9-29, 2021.

State-Level Awareness of GBV Services
37Fraym • Mapping Humanity
INDIA
While over 85 percent of Indians in the northeastern state of Nagaland have heard of the continued services provided to victims of gender-based violence during the COVID-19 pandemic, less than half of Indians in nearby Meghalaya state are aware of the services.
States with the highest awareness (%) of GBV
services
States with the lowest awareness (%) of GBV
services
Tripura 89% Meghalaya 48%Nagaland 86% Goa 54%Madhya Pradesh 82% Arunachal Pradesh 55%Bihar 82% Jammu and Kashmir 64%West Bengal 81% Punjab 65%Himachal Pradesh 80% Kerala 65%Uttarakhand 80% Chhattisgarh 68%Uttar Pradesh 78% Maharashtra 69%Assam 78% Puducherry 69%Telangana 78% Mizoram 70%
0 100%
Goa
State Highlighted states Insufficient data
Nagaland
Tripura
Meghalaya
Note: The states of Jammu and Kashmir and Arunachal Pradesh are disputed territory but are included in the map since the populations were enumerated for the survey. Data is not included for any state that had fewer than 30 respondents.
Source: Fraym nationally representative online panel of 27,354 Indians conducted April 9-29, 2021.

GBV Support Service Impacts
38Fraym • Mapping Humanity
INDIA
Health and Physical Safety Impacts: Over 80 percent of those who benefited or knew someone who benefited cite improved physical safety and emotional health as key benefits of the government’s GBV-related services and policies. Unlike the other examined government response programs (PMJDY and MGNREGA), Indians cite health and physical safety benefits at higher rates than economic benefits.
Economic Impacts: Eight in ten Indians cite the increased ability to work as a key benefit.
Note: Only those who benefited or knew someone who benefited were asked about impacts. Respondents could select more than one impact.
Source: Fraym nationally representative online panel of 27,354 Indians conducted April 9-29, 2021.
% who reported One Stop Centres and helplines had provided __ benefits

International Support
39Fraym • Mapping Humanity
I. G7 and Other Bilateral SupportII. Multilateral Organization Support
Attitudes on G7 Support
40Fraym • Mapping Humanity
INDIA
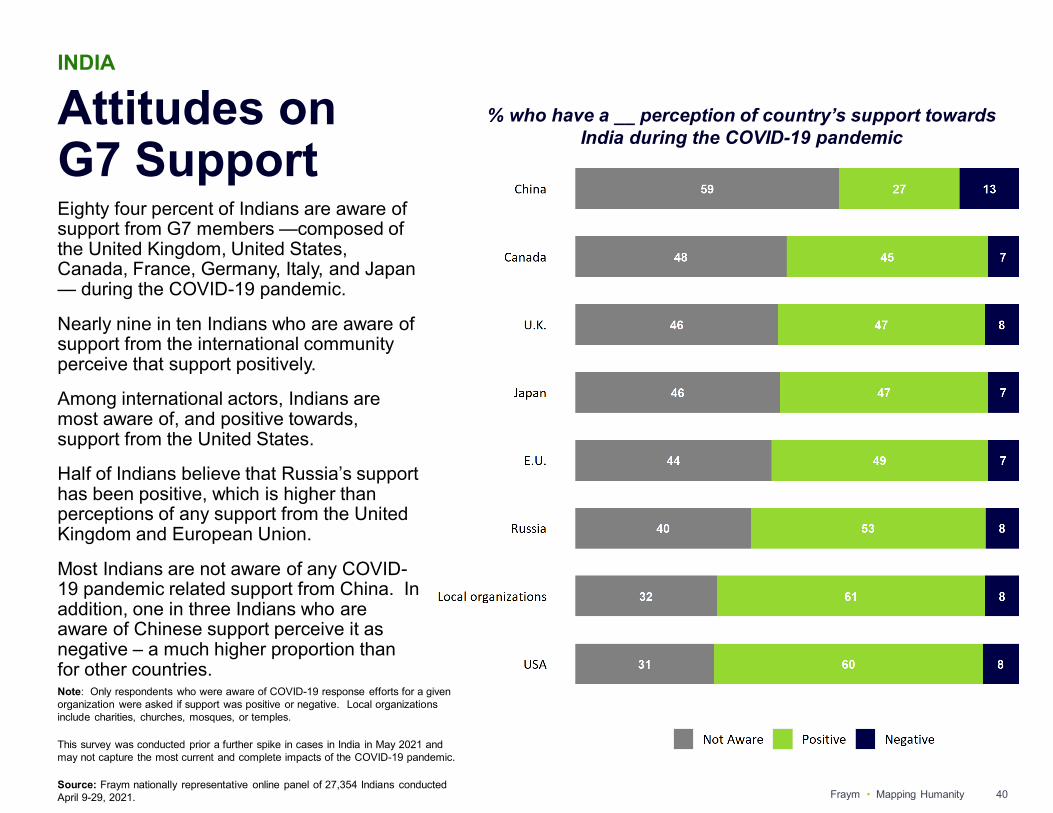
Eighty four percent of Indians are aware of support from G7 members —composed of the United Kingdom, United States, Canada, France, Germany, Italy, and Japan — during the COVID-19 pandemic.
Nearly nine in ten Indians who are aware of support from the international community perceive that support positively.
Among international actors, Indians are most aware of, and positive towards, support from the United States.
Half of Indians believe that Russia’s support has been positive, which is higher than perceptions of any support from the United Kingdom and European Union.
Most Indians are not aware of any COVID-19 pandemic related support from China. In addition, one in three Indians who are aware of Chinese support perceive it as negative – a much higher proportion than for other countries. Note: Only respondents who were aware of COVID-19 response efforts for a given organization were asked if support was positive or negative. Local organizations include charities, churches, mosques, or temples.
This survey was conducted prior a further spike in cases in India in May 2021 and may not capture the most current and complete impacts of the COVID-19 pandemic.
Source: Fraym nationally representative online panel of 27,354 Indians conducted April 9-29, 2021.
% who have a __ perception of country’s support towards India during the COVID-19 pandemic

Attitudes on Multilateral Organizations’ Support
41Fraym • Mapping Humanity
INDIA
Three in four Indians have a positive view of support from the World Health Organization (WHO).
Roughly six in ten Indians believe that the World Bank and UNICEF have positively supported the country during the COVID-19 pandemic. This is on par with views of local organizations’ support.
Note: Only respondents who were aware of COVID-19 response efforts for a given organization were asked if support was positive or negative. Local organizations include charities, churches, mosques, or temples.
Source: Fraym nationally representative online panel of 27,354 Indians conducted April 9-29, 2021.
% who have a __ view of multilateral organization’s support towards India during the COVID-19 pandemic

Appendix
42Fraym • Mapping Humanity

Study Methodology
43Fraym • Mapping Humanity
INDIA
Fraym conducted a survey of 27,354 Indian respondents via a demographically and geographically-targeted online panel. Data was collected between 9-29 April, 2021.
The respondents identified the following gender identities: 11,846 females (43%), 15,079 males (55%), and 429 (2%) respondents who identified as transgender woman, transgender man, other (3rd
gender/non-binary), or preferred not to answer. India’s 36 states and union territories were represented as follows:
Andaman and Nicobar Islands, 15 (0.05%), Andhra Pradesh, 894 (3.27%), Arunachal Pradesh, 30 (0.11%), Assam, 467 (1.71%), Bihar, 1,175 (4.30%), Chandigarh, 297 (1.09%), Chhattisgarh, 273 (1.00%), Dadra and Nagar Haveli, 11 (0.04%), Daman and Diu, 11 (0.04%), Delhi, 1,781 (6.51%), Goa, 95 (0.35%), Gujarat, 1,200 (4.39%), Haryana, 649 (2.37%), Himachal Pradesh, 250 (0.91%), Jammu and Kashmir, 165 (0.60%), Jharkhand, 362 (1.32%), Karnataka, 2,141 (7.83%), Kerala, 978 (3.58%), Lakshadweep, 3 (0.01%), Madhya Pradesh, 1,355 (4.95%), Maharashtra, 3,586 (13.11%), Manipur, 36 (0.13%), Meghalaya, 36 (0.13%), Mizoram, 86 (0.31%), Nagaland, 56 (0.20%), Odisha, 561 (2.05%), Puducherry, 31 (0.11%), Punjab, 557 (2.04%), Rajasthan, 1,223 (4.47%), Sikkim, 14 (0.05%), Tamil Nadu, 1,909 (6.98%), Telangana, 1,111 (4.06%), Tripura, 144 (0.53%), Uttar Pradesh, 2,467 (9.02%), Uttarakhand, 445 (1.63%), West Bengal, 2,940 (10.75%).
The average survey completion time was 18 minutes for respondents. The survey consisted of about 70 questions. Topics included demographics, impacts of the COVID-19 pandemic, perceptions of the gender burden of these impacts as well as attitudes toward support from international, national, and local actors.
The survey firm adheres to industry best-practices for online panel sample monitoring and quality assurance. These include: (i) regularly testing/validating on a rolling basis to ensure participants and their responses are real/accurate; (ii) comparing answers from respondents to pre-collected information on the same respondents for consistency, such as same age, gender, socio-economic status, and geography; (iii) using automated natural language processing (NLP) on open-ended responses to detect non-sensical language etc.; (iv) check for straight lining (e.g. answering the first response for all questions); and (v) checking speed of completion rates, (e.g. flagging anyone who spends 1/3 or less of the median time to complete the questionnaire). Responses that fail any one of these tests were removed from the data and possibly lead to the removal from the vendor’s sample pool as well.
The data was designed to be nationally representative. Modest divergence was found between sample characteristics and the population parameters according to available Ministry of Statistics and Programme Implementation (MoSPI) data. Post-hoc weights were created to correct for these differences. An iterative proportional fitting process was used to simultaneously balance the distributions of the following parameters: gender, age, urban status, and the population in each of India’s 36 states and union territories.

Note 1: Gething, Peter, Andy Tatem, Tom Bird, and Clara R. Burgert-Brucker. 2015. Creating Spatial Interpolation Surfaces with DHS Data DHS Spatial Analysis Reports No. 11. Rockville, Maryland, USA: ICF International. Other notable, relevant work includes: Weiss DJ, Lucas TCD, Nguyen M, et al. Mapping the global prevalence, incidence, and mortality of Plasmodium falciparum, 2000–17: a spatial and temporal modelling study. Lancet 2019 and Tatem A, Gething P, Pezzulo C, Weiss D, and Bhatt S. 2014. Final Report: Development of High-Resolution Gridded Poverty Surfaces. University of Southampton. https://www.worldpop.org/resources/docs/pdf/Poverty-mapping-report.pdf
Fraym has built machine learning (ML) software that weaves together geo-tagged household survey data with satellite imagery to create localized population information (1 km2).
The primary ML model input is data from high-quality, geo-tagged household surveys. Key indications of a high-quality household survey include implementing organization(s), sample design, sample size, and response rates. After data collection, post-hoc sampling weights are created to account for any oversampling and ensure representativeness.
The second major data input is satellite imagery and related derived data products, including Earth observation (EO) data, gridded population information (e.g., human settlement mapping, etc.), proximity to physical locations (e.g., health clinics, ports, roads, etc.) and biophysical surfaces like soil characteristics. As with the survey data, Fraym data scientists ensure that the software only uses high-quality imagery and derivative inputs.
To create spatial layers from household survey data, Fraym leverages machine learning to predict an indicator of interest at a 1 square kilometer resolution. This methodology builds upon existing, tested methodologies for interpolation of spatial data. The resulting model is used to predict the survey data for all non-enumerated areas. A similar approach was originally developed by academic researchers focused on health outcomes, which were expanded upon by USAID’s Demographic and Health Surveys program since then by Fraym and others.1
12
3
About Fraym
44Fraym • Mapping Humanity
