covid 19 monthly epidemiological report
TRANSCRIPT

01/19/2021 1
COVID-19 Monthly Epidemiological Report
December 2020
I. Current Status and Overview of COVID-19 in Bexar County
Key Takeaways
Increase in Cases • December saw a substantial increase in the rolling 7-day average of new COVID-19 cases, with daily counts surpassing
the previous peak from the summer surge. The 7-day average was 736 on 12/1 and 1,164 on 12/31, a 58% increase.
• Over 30% of all COVID-19 cases to date occurred in December.
Other Trends • December saw the second highest positivity rate to date (23.2%), only surpassed by early July (24.2%).
• The highest rates of COVID-19 cases have occurred in zip-codes near Downtown and Southern Bexar County, with rates as high as 3,300 new cases per 100,000 population (3.3% of residents) in December alone.
• Residents in their 20’s continued to account for over 20% of all cases to date.
• Risk of death in congregate settings has decreased— down from nearly 8% in the first quarter to just under 2% in recent months.
• Case fatality rate among those living in private residences has remained at 1 - 2% - the same since June.
Hospitalizations and Deaths • Hospitals experienced an increase in the number of COVID-positive occupied beds in the month of December. ICU
cases account for approximately one-third of those hospitalized individuals.
• Cases among those 50 and older comprise 90% of COVID-19 deaths seen to date in Bexar County.
Unless otherwise indicated, data for analyses in this report were extracted from Texas Health Trace on 01/10/2021 and include cases with event dates
through 12/31/2020. Results are subject to change.
Bexar County reported 36,392 new cases
during December, for a total of 127,083
cases in 2020. December also reported
101 COVID-19 related deaths, bringing
the total COVID-19 related deaths for
the year to 1,635.
After a major surge during June and July,
transmission declined through August
and September. A slight increase during
October was followed by a second and
more extensive surge throughout
November and December.
Weekly case totals saw a continued
increase throughout the end of the year,
with 32% more new cases reported in
the last week of December than in the
last week of November.
Hospitalizations and the testing
positivity rate saw similar upward
trends, with a 215% increase in
hospitalizations, and a 7.5% point
increase (of all tests) in positivity rate.

01/19/2021 2
COVID-19 Monthly Epidemiological Report
December 2020
II. Testing & Positivity Rate
Bexar County’s COVID-19 weekly positivity rate began climbing in early June and reached a record high in early July
(24.2%), indicating the height of the 2-month surge that we experienced across early summer. Since then the weekly
positivity rate declined, but has seen an increase since October. The increase to the 2nd highest weekly positivity rate
ever reported in Bexar county occurred during the final week of 2020 reaching 23.2%.
Source: Aggregate Labs Report of labs conducting COVID-19 testing.
III. Trends & Demographic Characteristics among COVID-19 Cases
60.2%
27.7%
7.7%
2.9%1.6%
Race and Ethnicity in Bexar County(N=1,952,843)
HISPANIC
NH WHITE
NH BLACK
NH ASIAN
NH OTHER
December continued to see a substantial increase in new COVID-19 cases, introducing the highest peak in case count
ever recorded in the county. Preliminary data suggest that the increase in new cases will continue into 2021.
*: Event Date is the date of symptom onset. For asymptomatic cases, the test collection date is used. This differs from reported date, which is the
date when related results are received by Metro Health.
**: Data for days not shown or lightened in color have yet to be fully completed.
%
5%
10%
15%
20%
25%
30%
0
10,000
20,000
30,000
40,000
50,000
60,000
5/3
1 -
6/6
6/07
- 6/
13
6/14
- 6/
20
6/21
- 6/
27
6/2
8 -
7/4
7/5
- 7
/11
7/1
2-7
/18
7/1
9-7
/25
7/2
6 -
8/1
8/2
- 8/8
8/9
- 8
/15
8/1
6-8
/22
8/2
3-8
/29
8/3
0 -
9/5
9/16
- 9/
12
9/1
3-9
/19
9/2
0-9
/26
9/2
7-1
0/3
10
/4-1
0/1
0
10/1
1-10
/17
10/1
8 -1
0/24
10
/25
- 1
0/3
1
11
/1-1
1/7
11
/8-1
1/1
4
11/1
5-11
/21
11/2
2-11
/28
11
/28
-12
/4
12
/5-1
2/1
1
12/1
2-12
/18
12/1
9-12
/25
12
/26
-1/1
Number of Tests and Percent Positive by Week(May 31st- January 1st)
Positive Tests Negative and Inconclusive Tests Percent Positive (Positivity Rate)
%
10%
20%
30%
40%
50%
0
500
1,000
1,500
2,000
2,500
3,000
6/1 6/11 6/21 7/1 7/11 7/21 7/31 8/10 8/20 8/30 9/9 9/19 9/29 10/9 10/19 10/29 11/8 11/18 11/28 12/8 12/18 12/28
Po
siti
vity
Rat
e %
Bexar County COVID-19 Cases by 7 Day Average of Event Date* and Positivity Rate
Daily New Cases
7 Day New Case Average
Positivity Rate

01/19/2021 3
COVID-19 Monthly Epidemiological Report
December 2020
III. A. Race/Ethnicity Distribution of Cases
75.3%
18.2%
4.7%1.5%
0.3%
Cases with Race and Ethnicity Data(N=74,372)
Among cases for whom race/ethnicity data are available (58%), Hispanic individuals make up a larger proportion of
cases than they do of the general population of Bexar County. This pattern is observed across every age-group, and may
suggest that the pandemic has particularly affected Hispanic individuals.
60.2%
27.7%
7.7%
2.9%1.6%
Race and Ethnicity in Bexar County(N=1,952,843)
HISPANIC
NH WHITE
NH BLACK
NH ASIAN
NH OTHER
Notes regarding Race and Ethnicity data:
Due to limitations inherent in our database, data collection procedures, and/or our sources, data on race and/or
ethnicity are currently unavailable for over 42% of cases. For this reason, meaningfully accurate determination of racial
and ethnic disparities in COVID-19 diagnoses is currently not possible.
Per current data, 30% of all COVID-19 cases
ever recorded in Bexar county had their
onset occur during the month of December.
Additionally, 52% of all reported cases
occurred some time between October and
the end of the year, compared to 48% across
March through September.
These numbers are based on Event Date: the
date of first symptoms or test collection date
if the person was asymptomatic.

01/19/2021 4
COVID-19 Monthly Epidemiological Report
December 2020
20 to 29 year-olds continue to make up about one-fifth of COVID-19 cases, a rate consistent throughout the pandemic.
The 20-29, 30-39, and 40-49 age groups continue to comprise over half of all reported cases.
Even with schools returning to some in-person learning, the proportion of pediatric cases remained relatively
unchanged.
III. B. Age and Gender Distribution of Cases
III. C. Characteristics of Close Contacts among Cases
Since COVID-19 is transmitted through close contact
between persons, identifying the location of exposure is
critical in preventing the spread of this disease. The vast
majority (92%) of close contacts, who were interviewed
and knew where they had become infected, reported
being a household member of a case.
Approximately 3% of reported close contacts were
exposed in a community setting -- meaning a grocery
store, public or shared transit, etc. Another 3% of
contacts reported “Other” locations such as schools, day
cares, healthcare settings, and hotels. A smaller
proportion of about 2% reported work as their location of
exposure—a small decrease from the previous month.
For December cases, each had an average of two
contacts while they were infectious.
NOTE: These data are based on only 18% of all December
cases. The data may be skewed due to reporting and
selection biases.
91.9%
3.1%1.9% 3.1%
Location of Exposure to Confirmed Case
Total N= 6,891December Cases
Household Community Work Other
5.7%
11.2%
21.0%
18.0%15.8%
13.1%
8.5%
4.3%1.8%
0.5% 0.0%
0-9 10-19 20-29 30-39 40-49 50-59 60-69 70-79 80-89 90-99 100+
Total Cases by Age Group(N = 126,979)

01/19/2021 5
COVID-19 Monthly Epidemiological Report
December 2020
IV. The Extent of COVID-19 in the Bexar County Population
0
2,000
4,000
6,000
8,000
10,000
0-9 10-19 20-29 30-39 40-49 50-59 60-69 70-79 80+
Case
s p
er 1
00,0
00 P
op
ula
tio
n
Age Group (years)
Age-Specific COVID-19 Incidence Rates by Gender(per 100,000 population)
(N available = 125,414)
FEMALE
MALE
COVID-19 incidence rates through
December 31 were 6,704 per 100,000 for
females and 6,133 per 100,000 for males.
All together, 6.4% of the Bexar County
population has been diagnosed with COVID
-19 by a positive test.
Among young children and seniors (ages
60+), incidence rates do not differ by
gender, except in age group 70-79 where
the male rate is higher than female.
NOTE: For 1.3% of cases (N=1,669) gender
or age is not available. These cases are not
included in these rates.
Source: US Census, 2019 ACS 5-Year Estimate
10 8 6 4 2 0 2 4 6 8 10
0-9
10-19
20-29
30-39
40-49
50-59
60-69
70-79
80+
Percentage of All Residents
Age
Gro
up
Distribution of Bexar County Residents by Gender and Age(n=1,952,843)
Male Female
15 10 5 0 5 10 15
0-9
10-19
20-29
30-39
40-49
50-59
60-69
70-79
80+
Age
Gro
up
Distribution of COVID-19 Cases by Gender and Age with Respective Case Rate Per 100*
(n=127,083)
% of Cases, Male % of Cases, Female Male Case Rate Per 100 Pop Female Case Rate Per 100 Pop
*Excludes cases with no known gender or age
The distribution of COVID-19 cases
stratified by age and gender shows a
relative overrepresentation of the 20
-29 year old age-group among both
males and females. This age-group
comprises approximately 16% of the
Bexar County general population, but
21% of COVID-19 cases.
Conversely, we see a relative
underrepresentation of children
aged 0-9 and 10-19 among
COVID-19 cases, compared to the
general population.
Overall, adult case rates, when
standardized to the general
population, show a somewhat similar
pattern to the age distribution of
COVID-19 cases. The 20-29 age-
group has the highest case rate at
9.5 per 100 population.

01/19/2021 6
COVID-19 Monthly Epidemiological Report
December 2020
December 2020 COVID-19 Case Rate per 100,000 Population
COVID-19 Case Rate per 100,000 Population
The geographic distribution of COVID-19 cases
geographically by zip code, there is a similar
pattern between overall case rates and
December 2020 case rates. Both data show that
zip codes near downtown and in southern Bexar
County have the highest rates of COVID-19
cases per 100,000 population. Zip codes in the
northern and northwestern portion of the
county continue to see lower case rates over
time and monthly, compared to zip codes in the
southern portion of Bexar County.
Source: SAMHD COVID-19 case data up to 01/10/2021, event dates through
12/31/2020; U.S. Census, ACS 2019 5-year Population Estimates, Table S0101.
December 2020 COVID-19Case Rate per 100,000Population
192.1 - 1,331.4
1,331.5 - 1,682.3
1,682.4 - 1,914.1
1,914.2 - 2,174.2
2,174.3 - 3,300.1
Suppressed due to counts <5
COVID-19 Case Rate per100,000 Population
1,250.0 - 4,370.6
4,370.7 - 5,148.3
5,148.4 - 6,246.2
6,246.3 - 7,744.0
7,744.1 - 11,856.1
Suppressed due to counts <5

01/19/2021 7
COVID-19 Monthly Epidemiological Report
December 2020
V. Congregate Setting & School-Related Cases
Cases occurring in congregate settings substantially increased during the month of December, much like cases seen
within the local community. During late December, case counts appeared more irregular due to outbreaks across
varying congregate setting facilities. The total number of deaths associated with a congregate setting has increased to
318 as of January 3rd.
108
228
51
91100
64
4016 27 28
6274
5168
56
82
154
283
178
228
0
50
100
150
200
250
300
Nu
mb
er
of C
ase
s Id
en
tifi
ed
Week Identified
COVID-19 Cases Identified Weekly in a Congregate Setting
3 7 10 15 2340 43 44
7470
80
132
225
275
73
289 291
135
111
0
50
100
150
200
250
300
350
Nu
mb
er o
f Cas
es
Specimen Collection Date
COVID-19 Cases in Bexar County SchoolsPreviously Reported New Data
Excluding the holiday break in November, cases within schools have shown a slight increase. However, these data also
show a substantial drop towards the end of December. This shift in numbers may be partially attributed to the
extracurricular activities and school closures during the holiday break.
It is important to note that the majority of these cases were not associated with in-school exposure. To date, there
have been 10 outbreaks in Bexar County schools during which in-school transmission was recorded. These outbreaks
account for only 56 of the 1,841 cases denoted below.

01/19/2021 8
COVID-19 Monthly Epidemiological Report
December 2020
VI. Hospitalizations and Deaths among COVID-19 Cases
*: Data was not reported on 9/7/2020 due to Labor Day.
*
0
5
10
15
20
25
30
0
200
400
600
800
1,000
1,200
1,400
1,600
6/1/2020 7/1/2020 7/31/2020 8/30/2020 9/29/2020 10/29/2020 11/28/2020 12/28/2020
7 D
ay D
eat
hs
Ave
rage
7 D
ay A
vera
ge E
ven
t Dat
e &
Pat
ien
ts in
Ho
spit
al
Bexar County Cases by 7 Day Average of Event Date, STRAC COVID-19 Hospitalizations and Date of Death
7 Day Avg Event Date
7 Day Avg Patients in Hospital
7 Day Deaths Avg
VI. A. Hospitalizations
When examining the 7 day average of event date, overlaid with 7-day averages for current hospitalizations and deaths, a
lag time of about 14 days between peak case average and peak hospitalizations can be observed. There is also about a 20
day lag time between peak case average and average deaths. This pattern continues during the second surge, with
hospitalizations rising after an increase in cases then a subsequent increase in deaths. Note: We are seeing a substantial
increase of hospitalizations in January 2021 that will be reflected in the January Report, to be published on February 16th.
Since the beginning of April, Bexar County has kept an average of about 4,511 total staffed beds and 911 available staffed
beds per day. Prior to July 8th, available staffed beds averaged 1,482 per day and non-COVID-19 patients occupied an
average of 2,977 beds per day. From July 9th to August 1st, as the surge of COVID-19 patients began to peak, total staffed
beds and available staffed beds considerably dropped to an average of 3,878 and 441 beds per day, respectively. From
November 5th to December 31st, beds occupied by COVID-19 patients increased to an average of 633 beds per day and
non-COVID-19 patients decreased to an average of 3,330 beds per day. However, from August 8th to December 31st
available staffed beds saw a stabilization at an average of 611 beds per day.
0
1,000
2,000
3,000
4,000
5,000
6,000
4/1/2020 5/1/2020 6/1/2020 7/1/2020 8/1/2020 9/1/2020 10/1/2020 11/1/2020 12/1/2020
Tota
l Sta
ffe
d B
ed
s
STRAC Hospital Capacity
Occupied COVID Occupied Non COVID Available Staffed Beds
12/31/2020
01/19/2021 9
COVID-19 Monthly Epidemiological Report
December 2020
7.9%
8.9%
11.3%
15.0%
27.6%
36.9%
37.3%
0% 5% 10% 15% 20% 25% 30% 35% 40%
Immunocompromised
Asthma
Kidney Disease
Lung Condition
Hypertension
Diabetes
Cardiovascular Disease
Hospitalized Cases with Underlying Conditions(N=5,581)
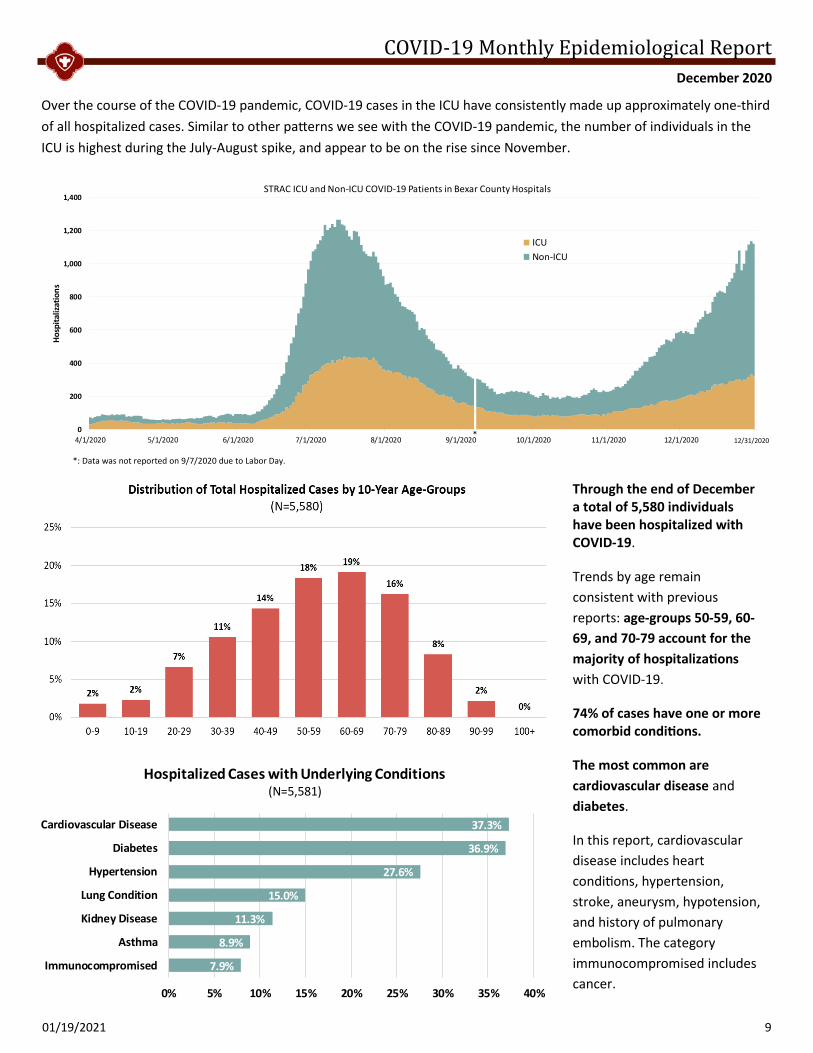
Through the end of December a total of 5,580 individuals have been hospitalized with COVID-19.
Trends by age remain
consistent with previous
reports: age-groups 50-59, 60-
69, and 70-79 account for the
majority of hospitalizations
with COVID-19.
74% of cases have one or more comorbid conditions.
The most common are
cardiovascular disease and
diabetes.
In this report, cardiovascular
disease includes heart
conditions, hypertension,
stroke, aneurysm, hypotension,
and history of pulmonary
embolism. The category
immunocompromised includes
cancer.
Over the course of the COVID-19 pandemic, COVID-19 cases in the ICU have consistently made up approximately one-third
of all hospitalized cases. Similar to other patterns we see with the COVID-19 pandemic, the number of individuals in the
ICU is highest during the July-August spike, and appear to be on the rise since November.
*: Data was not reported on 9/7/2020 due to Labor Day.
* 0
200
400
600
800
1,000
1,200
1,400
4/1/2020 5/1/2020 6/1/2020 7/1/2020 8/1/2020 9/1/2020 10/1/2020 11/1/2020 12/1/2020 1/1/2021
Ho
spit
aliz
atio
ns
STRAC ICU and Non-ICU COVID-19 Patients in Bexar County Hospitals
ICU
Non-ICU
12/31/2020

01/19/2021
COVID-19 Monthly Epidemiological Report
December 2020
0%
10%
20%
30%
40%
50%
60%
70%
80%
90%
100%
Age-Group (years)
Cas
e F
atal
ity
Rat
e (
%)
Month of COIVD-19 Onset
Age-Specific Case Fatality Rates over Time, among Cases in Selected Congregate Living Settings*
(N's available = 337 Deaths among 2,850 Cases with Onset March - December)
0%
10%
20%
30%
40%
50%
60%
70%
80%
90%
100%
MarApr
MayJun
Jul
Aug
Sep
Oct
Nov
Dec
Age-Group (years)
Case
Fat
alit
y R
ate
(%)
Month of COVID-19 Onset
Age-Specific Case Fatality Rates over Time, among Cases Living in Private Residences
(N's available = 1,279 Deaths among 119,534 Cases with Onset March - December)
VI. B. Deaths People living or working in congregate settings* were at particularly high risk of COVID-19 during the first months of the
pandemic. The highest case fatality rates occurred during these early months, particularly among the most elderly
residents. Deaths associated with congregate settings accounted for 30% of COVID-19 related deaths among cases with
disease onset during March-May.
Risk of death in congregate settings has decreased—down from nearly 8% in the first quarter to just under 2% in recent
months. Subsequent reductions in new infections and deaths may reflect improved infection prevention strategies,
testing regimens and medical management; and possibly the previous deaths of the most at-risk residents.
*In this analysis: Long-term acute care, Long-term living, Assisted living, Rehabilitation, State supported living facilities.
Among deceased cases, Hispanic
individuals account for 67% of
COVID-19 related deaths to date.
Adjusted to the Bexar County
population, the highest COVID-19
mortality rate was among Hispanic
individuals, particularly males age 50
and older (not shown).
NOTE: Race/ethnicity was not
available for 101 deceased cases
(6%).
66.7%
21.0%
6.2% 5.1%1.0%
0%
20%
40%
60%
80%
100%
Hispanic NH White Unknown NH Black Other
Distribution of Total Deceased Cases by Race/Ethnicity
(N=1,635)

01/19/2021
COVID-19 Monthly Epidemiological Report
December 2020
COVID-19 Case Fatality Rate per 100 Cases
(Excluding Congregate Settings) This map shows COVID-19 case fatality
rates per 100 COVID-19 cases, excluding
those in congregate settings (defined
here as nursing homes, assisted living
facilities, jails, and rehabilitation
facilities). Geographically, the highest
rates of COVID-19 deaths (and cases)
have occurred in zip codes near and to
the south of downtown San Antonio.
20 15 10 5 0 5 10 15 20
10-19
20-29
30-39
40-49
50-59
60-69
70-79
80+
Age
Gro
up
Distribution of COVID-19 Deaths by Gender and Age with Respective Case-Fatality Rate Per 1,000*
(n=1,635)
% of Deaths, Male % of Deaths, Female
Male Case-Fatality Rate Per 1000 Pop Female Case-Fatality Rate Per 1000 Pop
*Excludes cases with no known gender or age
This graph, when compared with the Bexar
County population pyramid (page 5),
highlights the disparate burden of death
due to COVID-19 among older individuals
in both genders. Males accounted for a
higher proportion of death overall.
Males and females over the age of 50
make up 90% of COVID-19 deaths seen to
date in Bexar County, with males 50+
comprising 50% and females 50+ at 40%.
This finding, alongside the higher case rates
among women, and the elevated gender,
age, and population controlled case-fatality
rate suggest that males carry a higher
burden of COVID-19 related deaths.
Case Fatality Rate, per 100Cases, excludingCongregate Settings
0.3 - 0.7
0.8 - 0.9
1.0 - 1.2
1.3 - 1.6
1.7 - 5.1
Suppressed due to counts <5
Source: SAMHD COVID-19 case data up to
01/10/2021, event dates through
12/31/2020; U.S. Census, ACS 2019 5-year
Population Estimates, Table S0101.

01/19/2021
COVID-19 Monthly Epidemiological Report
December 2020 VII. Percent Change of COVID-19 Case Rates, November—December
Percent Change in COVID-19 Cases from Nov to Dec 2020 by Zip Code
Percent Change in COVID-19 Cases from Nov to Dec 2020 by Council District
Report completed by the City of San Antonio COVID-19 Response Data Team
Darker shades of red correspond to zip codes with
the largest increase in number of cases, compared
to November. The majority of these zip codes are
south-east of the city center. Across the entire
county, only three zip codes - 78154, 78234, and
78236 - had fewer cases in December than in
November.
Percent Change in COVID-19Cases from November 2020to December 2020
-63.9% - 82.1%
82.2% - 97.0%
97.1% - 118.7%
118.8% - 136.7%
136.8% - 275.0%
Suppressed due to counts <5
During the month of December 2020,
Council District 1 and Council District
3 had the highest percent increase in
case rates compared with November
2020, with 141.1% and 135%
increases, respectively. During this
month, Council Districts to the north,
particularly Council District 8 and 10,
had the lowest increase in new cases
compared to November 2020.