covered california delivering on the promise of care · covered california –delivering on the...
TRANSCRIPT

Covered California – Delivering on the Promise of Care
State of Reform Health Policy Conference
Anne Price
November 6, 2015

• Better Care
• Healthier People
• Lower Cost
How Covered California Makes the Promise Real:
Covered California’s Promise:
BEING AN
ACTIVE
PURCHASER
OFFERING
AFFORDABLE
PRODUCTS
EFFECTIVELY
REACHING AND
ENROLLING
CONSUMERS
ENCOURAGING
THE RIGHT
CARE AT THE
RIGHT TIME
1

1.3MILLIONconsumers have active
health insurance asof September 2015
Covered California is now
the second-largest purchaser
of health insurance in the
state for those under age 65.
Covered California’s size
gives it the clout to shape
the health insurance
market.
$6.5BILLION
estimate of fundscollected from
premiums in 2015
More than 700,000
Californians have
benefited from
coverage through
Covered California.
Many of them now have
either employer-based
coverage or Medi-Cal.
2+
MILLIONconsumers served since
Covered California began offering
coverage
Covered California Is Big and Making Big
ImpactsIt is now one of the largest purchasers of health insurance in California and the nation.
2
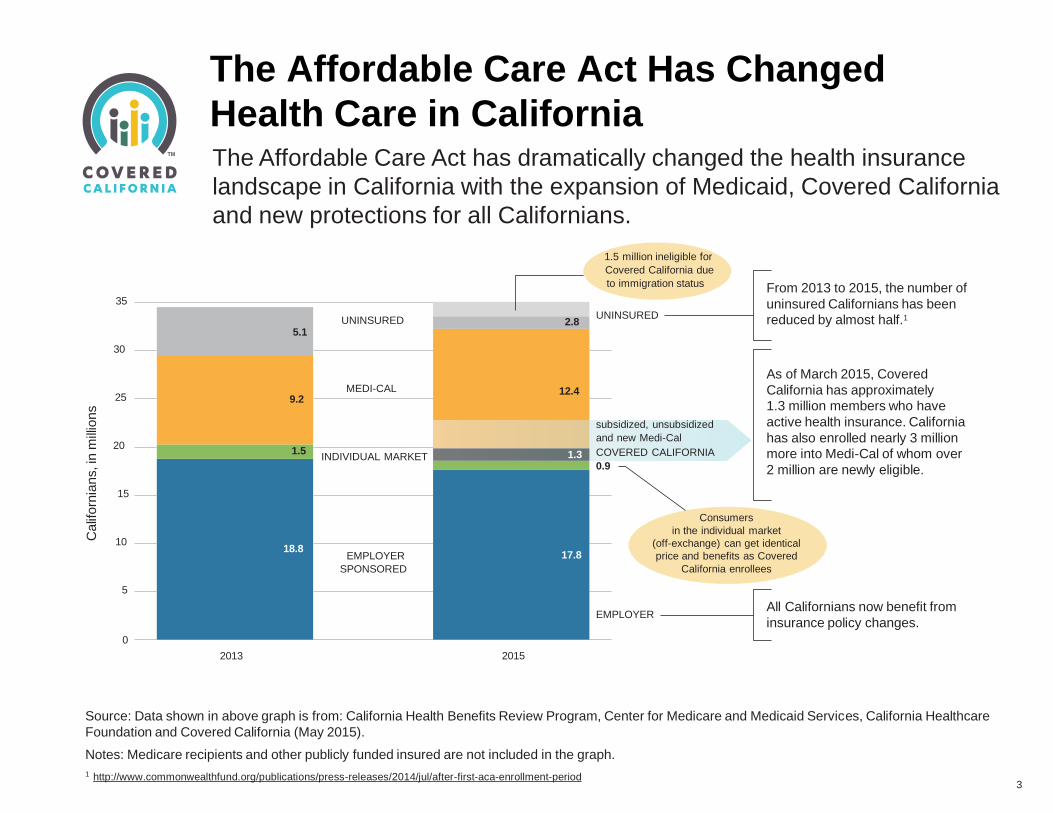
The Affordable Care Act has dramatically changed the health insurance
landscape in California with the expansion of Medicaid, Covered California
and new protections for all Californians.
Source: Data shown in above graph is from: California Health Benefits Review Program, Center for Medicare and Medicaid Services, California Healthcare
Foundation and Covered California (May 2015).
Notes: Medicare recipients and other publicly funded insured are not included in the graph.
1 http://www.commonwealthfund.org/publications/press-releases/2014/jul/after-first-aca-enrollment-period
The Affordable Care Act Has Changed
Health Care in CaliforniaC
alif
orn
ians, in
mill
ions
UNINSURED
EMPLOYER
SPONSORED
MEDI-CAL
INDIVIDUAL MARKET
5.12.8
17.818.8
9.2
5
10
15
20
25
30
35
As of March 2015, Covered
California has approximately
1.3 million members who have
active health insurance. California
has also enrolled nearly 3 million
more into Medi-Cal of whom over
2 million are newly eligible.
EMPLOYER
1.3
All Californians now benefit from
insurance policy changes.
UNINSURED
From 2013 to 2015, the number of
uninsured Californians has been
reduced by almost half.1
1.5
subsidized, unsubsidized
and new Medi-Cal
COVERED CALIFORNIA
12.4
1.5 million ineligible for
Covered California due
to immigration status
Consumers
in the individual market
(off-exchange) can get identical
price and benefits as Covered
California enrollees
0.9
0
2013 2015
3

Covered California Health Plan Offerings for 2016:
Broader Choice, More Local Options and Better Trend
4

5

By offering fewer, but standardized products, Covered California
offers better options, creating more value for consumers.
The number of health insurance products available at the Silver tier:
Los Angeles
7Silver plans offeredthrough 6 carriers
Denver
35Silver plans offeredthrough 8 carriers
Miami
33Silver plans offeredthrough 6 carriers
0 15 5
The Value of Standard Benefit Design:
A Tale of Three Cities
6
The number of silver products requiring full deductible
to be met before outpatient care is covered:

Affordability Made Real by Financial Help to
Pay Premiums
• Active membership is strong and meeting projections:
o ~1,307,000 members in June
2015
• Special Enrollment sign-ups above expectations
o Rate of churn out of exchange to other coverage also higher than forecast
• Enrollment model is still evolving:
o Based on less than one full cycle
of experience — especially true
when focusing on “churning”
consumers.
7

Premium Assistance – Bringing Coverage
within Reach
8
Average Premiums, Average APTC,
and APTC as % of Gross Premium
by Subsidy — Policy level Month of June 2015
Subsidy Eligible
Number of policies 777,758
Average Gross Premium $ 594
Average Net Premium $ 157
Average APTC $ 436
Average Net Premium as
percent of Gross70%
Unsubsidized
Number of policies 83,677
Average Gross Premium $ 516
Premium data is at the "policy" level, which is not necessarily the member level: many policies include more than one member.

Native Hawaiian
and other Pacific Islander <1%
Black/African-American 4%
American Indian
and Alaska Native <1%
Other 3%
Mixed Race 3%
White
34 %
Asian18%
Latino
37%
Second Open Enrollment Nov. 1, 2014 - Feb. 15, 2015
1 CalSIM version 1.91 Statewide Data Book 2015-2019
http://bit.ly/1Que1NV
2 Henry J. Kaiser Family Foundation. 2015. “Coverage Expansions and
the Remaining Uninsured: A Look at California During Year One of ACA
Implementation.” Menlo Park, CA.
An independent study conducted by the Kaiser
Family Foundation2 confirmed that:
• Covered California enrollees are more racially diverse
than the group of Californians with private coverage.
60 percent identify as a race/ethnicity other than
white. Latinos make up 37 percent of the total.
Estimated subsidy-eligible population of the
state developed by the University of California’s
statistical model1:
38 34 21 5% % % %
LATINO WHITE ASIAN/PACIFIC
ISLANDER
AFRICAN-
AMERICAN
Enrollment data proves that our efforts to reach California’s diverse
population is working
Covered California is Enrolling All Communities
Across Our State
9

Covered California: Assuring Contracted
Plans Promote Affordability AND Quality Care
10
The following link shows the contract terms all Covered California plans must agree to. Specifically, Attachment 7 addresses quality, network management and delivery system
standards: http://hbex.coveredca.com/solicitations/QHP/library/QHPModelContractAttachments-Final.pdf.
Enrollees are able to receive quality care at the right place and the right time

A Kaiser Family Foundation independent survey of consumer released in May 2015 reported on services
through the Fall of 2014.
• 91 percent of Covered California enrollees reported it was “very” or “somewhat easy” to travel to their
usual source of care, which matches the Other Private markets (Figure 19).
• 59 percent of Covered California enrollees had a check-up or preventive care visit by the Fall of 2014,
which is nearly twice the rate for preventive visits amongst the uninsured (Figure 20). This is not
significantly statistically different from other private market, and if extrapolated over time, this means more
than 800,000 preventive visits have been provided through Covered California since Jan. 2014.
Source: Henry J. Kaiser Family Foundation. 2015. “Coverage Expansions and the Remaining Uninsured:
A Look at California During Year One of ACA Implementation.” Menlo Park, CA.
Health Care Access Improving for both
Covered California and Medi-Cal Enrollees
Figure 19
82% 82%85%
89%*
83%
91%* 91%*
NOTES: Includes adults ages 19-64. “Previously Insured” includes people who were insured as of interview date and have been insured since before January 2014;
some of these people may have switched coverage type. “Newly Insured” include people who were insured as of int erview date and gained coverage since January
2014. “Uninsured” includes people who lacked coverage as of the interview date. “Usual Source o f Care” does not include care received at an emergency
department. *Significantly different from Uninsured at the p<0.05 level.
SOURCE: 2014 Kaiser Survey of Low-Income Americans and the ACA.
Ease of Travel to Usual Source of Care Among Nonelderly Adults
in California, by Insurance Coverage and Type in Fall 2014
Share reporting it was “very” or “somewhat easy” to travel to their usual source of care:
Uninsured Newly insured Previously
insured
Uninsured Newly insured Covered
California
Previously
insured
45%
58%*
45%
31%
47%*
66%*
31%
58%* 59%*
65%*
Figure 20
Use of Medical Services Among Nonelderly Adults in California,
by Insurance Coverage and Type in Fall 2014
80%*77%*
71%*
78%*
NOTES: Includes adults ages 19-64. “Previously Insured” includes people who were insured as of interview date and have been insured since before January 2014;
some of these people may have switched coverage type. “Newly Insured” include people who were insured as of interview date and gained coverage since January
2014. “Uninsured” includes people who lacked coverage as of the interview date. *Significantly different from Uninsured at the p<0.05 level.
SOURCE: 2014 Kaiser Survey of Low-Income Americans and the ACA.
Used any medical services Had check-up or preventive care visit
Uninsured Newly insured Previously
insured
Uninsured Newly insured Previously
insured
Previously
insured
11

Information for consumers
CoveredCA.com
Information on exchange-related activities
hbex.CoveredCA.com
12