cover tjms journal vol 13 no 1 - tecnia institute …...patron dr. r.k.gupta chairman, tecnia group...
TRANSCRIPT

TECNIA Journal of Management Studies
ISSN – 0975 – 7104Regn. No.: DELENG/2006/20585
Bi-Annual Double Blind Peer Reviewed Refereed Journal
TECNIA Journal of Managem
ent Studies
TECNIA INSTITUTE OF ADVANCED STUDIES
(Approved by AICTE, Ministry of HRD, Govt. of India and affiliated to GGSIP University, Recognized under Sec 2(f) of UGC Act 1956)Rated as “A++” Category - Best Business School by AIMA & 'A' by Govt. NCT of Delhi
Indexed in J. Gate E-Content
Where Dreams are Chiselled into Reality
TECNIA INSTITUTE OF ADVANCED STUDIES
Madhuban Chowk, Rohini, Delhi-110 085Ph.: 011-27555121-124, Fax: 011-27555120E-Mail: [email protected], Website: www.tiaspg.tecnia.in ISO 9001-2015
Certified Institute
(Approved by AICTE, Ministry of HRD, Govt. of India and affiliated to GGSIP University, Recognized under Sec 2(f) of UGC Act 1956)
ISO 14001ISC GLOBAL
ISO 14001:2015
ISO 9001
ISO 9001:2015
ISC GLOBAL
Impact of Make in India program- Is lion moving Backward?
Sandeep Kumar, Sweta Bakshi
Role of innovation in entrepreneurship of globalised world - a case study
Sambhavana Gupta, Ritesh Gupta, DD Chaturvedi, Sandeep Kumar
Emerging Issues and Changing Face of Accounting
Anurag Agnihotri, Julee Banerjee, Surbhi Gupta and Krishna Gupta
7 P’s of marketing mix in the selected hotels of Rajsthan
Vandana Gupta
Bancassurance: Convergence of Banking and Insurance and its Implications on
the Development of Banking and Insurance Industry
R P Tulsiyan, MK Gupta, Ashok Aggarwal and Rakesh Gupta
A Descriptive Study on Factors Affecting the Quality of the Indian Higher Education
Madhavendra Nath Jha and Urvashi Ghai Khosla
An Assessment of Factors of Social Media Advertisement on Purchase Intention
Karishma Arora, Prof R. K. Sharma
A Case Study on Pre and Post Joint Venture Analysis of Ntt Docomo and Tata Teleservices With
Financial and HR Perspective
Lata Rani, Chanchal Sharma and Swati Shrivastava
NAAC ACCREDITED GRADE “A” INSTITUTE
Vo
l. 13 N
o. 1
.Ap
ril 2018
– S
ep
tem
ber 2
018
Vol. 13 No. 1. April 2018 - September 2018


PATRON
Dr. R.K.GuptaChairman,Tecnia Group of Institutions
Editorial BoardDr. Ajay Kumar Dr. Sandeep Kumar
Dr. Sandeep KumarEditor
Editorial Board MembersDr. Sandhya BindalDr. Rajesh Bajaj Dr. Ajay Pratap SinghDr. Namita MishraDr. Vishal Khatri
Editorial AssistanceMr. Pradeep Kumar Palei
Editorial Office & AdministrativeAddress
The EditorTecnia Institute of Advanced Studies,3-PSP, Institutional Area,Madhuban Chowk, Rohini, Delhi-110085.Tel: 011-27555121-124,Fax:011-27555120
E-mail: [email protected] Website: http://www.tecnia.in
Tecnia Journal of Management Studies.
13 No. 1 April 2018 – September 2018
EDITORIAL ADVISORY BOARD
Prof. G.N. TiwariProfessor, IIT Delhi
Prof. (Dr.) R.C. Singh Professor, Mahatama Gandhi Chitrakoot Gramodaya Vishvavidyalaya, Chitrakoot
Dr. Nasib S. Gill Director, DDE MD University, Rohtak
Prof. Mukesh Dhunna Professor, MD University, Rohtak
Dr. Nirmal Singh Former Professor, IIT, Delhi
Prof. R.P. Tulsian Professor University of Delhi
Prof. R.K Agrawal Director Finance, HAL (Retd.)
Prof. M.P. GuptaFormer Dean, Faculty of Management StudiesUniversity of Delhi, Delhi.
Published & Printed by Dr. Ajay Kumar on behalf of Tecnia Institute of Advanced Studies. Printed at Rakmo Press Pvt. Ltd., C-59, Okhla Industrial Area, Phase-I, New Delhi-110020. Published from Tecnia Institute of Advanced Studies, 3 PSP, Institutional Area, Madhuban Chowk, Rohini, Delhi-85.

From The Editor’s Desk
I take this opportunity to thank all contributors and readers for making Tecnia Journal of Management Studies an astounding success. The interest of authors in sending their research-based articles for publication and overwhelming response received from the readers is duly acknowledged. I owe my heartfelt gratitude to all the management institutes for sending us their journals on mutual exchange basis, and their support to serve you better.We are happy to launch the Twenty five issue of our academic journal. The present issue incorporates the following articles:Impact of Make in India program - Is lion moving Backward? Role of Innovation in Entrepreneurship of Globalized World - A Case Study
Emerging Issues and Changing Face of Accounting
7 P’S Of Marketing Mix in the Selected Hotels of Rajasthan
Bancassurance: Convergence of Banking and Insurance and its Implications on the Development of Banking and Insurance Industry
A Descriptive Study on Factors Affecting the Quality of the Indian Higher Education
An Assessment of Factors of Social Media Advertisement on Purchase Intention
A Case Study on Pre and Post Joint Venture Analysis of NTT Docomo and Tata Teleservices with Financial and HR Perspective
My thanks to the authors, Sandeep Kumar, Sweta Bakshi, Sambhavana Gupta, Ritesh Gupta, DD Chaturvedi, Sandeep Kumar, Anurag Agnihotri, Julee Banerjee, Surbhi Gupta, Krishna Gupta, R P Tulsiyan, MK Gupta, Ashok Aggarwal, Rakesh Gupta, Madhavendra Nath Jha, Urvashi Ghai Khosla, Karishma Arora, Lata Rani, Chanchal Sharm and Swati Shrivastava, who have sent their manuscripts in time and extended their co-operation particularly in following the American Psychological Association (APA) Style Manual in the references.I extend my sincere thanks to our Chairman Dr. R. K. Gupta, who has always been a guiding light and prime inspiration to publish this journal. I am grateful for his continuous support and encouragement to bring out the Journal in a proper form. I also appreciate Editorial Committee Members for their assistance, advice and suggestion in shaping up the Journal. My sincere thanks to our distinguished reviewers and all team members of Tecnia family for their untiring efforts and support in bringing out this bi-annual Journal.I am sure the issue will generate immense interest among corporate members, policy-makers, academicians and students.
Editor

Contents 1. Impact of Make in India program- Is lion moving Backward? .................................. 1 Sandeep Kumar, Sweta Bakshi
2. Role of innovation in entrepreneurship of globalised world - a case study .............. 5 Sambhavana Gupta, Ritesh Gupta, DD Chaturvedi, Sandeep Kumar
3. Emerging Issues and Changing Face of Accounting .................................................10 Anurag Agnihotri, Julee Banerjee, Surbhi Gupta, Krishna Gupta
4. 7 P’s of marketing mix in the selected hotels of Rajasthan .................................... 14 Vandana Gupta
5. Bancassurance: Convergence of Banking and Insurance and ................................... 20 its Implications on the Development of Banking and Insurance Industry R P Tulsiyan, MK Gupta, Ashok Aggarwal, Rakesh Gupta
6. A Descriptive Study on Factors Affecting .................................................................... 24 the Quality of the Indian Higher Education Madhavendra Nath Jha,Urvashi Ghai Khosla
7. An Assessment of Factors of Social Media ................................................................ 42 Advertisement on Purchase Intention Karishma Arora, Prof R. K. Sharma
8. A Case Study on Pre and Post Joint Venture Analysis of ........................................... 53 NTT Docomo and Tata Teleservices with Financial and HR Perspective Lata Rani, Chanchal Sharm, Swati Shrivastava
General Information
• Tecnia Journal of Management Studies is published half-yearly. All editorial and administrative correspondence for publication should be addressed to the Editor, Tecnia Institute of Advanced Studies, 3 PSP, Institutional Area, Madhuban Chowk, Rohini, Delhi-110085.
• The received articles for publication are screened by the Evaluation Board for approval and only the selected articles are published. Further information on the same is available in the “Guidelines for Contributors”.
• Annual subscription details with the format for obtaining the journal are given separately and the interested persons may avail the same accordingly.
• Views expressed in the articles are those of the respective authors. Tecnia Journal of Management Studies, its Editorial Board, Editor and Publisher (Tecnia Institute of Advanced Studies) disclaim the responsibility and liability for any statement of fact or opinion made by the contributors. However, effort is made to acknowledge source material relied upon or referred to, but Tecnia Journal of Management Studies does not accept any responsibility for any inadvertent errors & omissions.
• Copyright © Tecnia Institute of Advanced Studies, Delhi. All rights reserved. No part of this publication may be reproduced, stored in a retrieval system or transmitted, in any form or by any means, electronic, mechanical, photocopying, recording or otherwise, without the prior permission of the Publisher.
• Registration Number : DELENG/2006/20585
• ISSN – 0975 - 7104
• Printed & Published by : Dr. Ajay Kumar Tecnia Institute of Advanced Studies, Madhuban Chowk, Rohini, Delhi-110085.
• Printed at: Rakmo Press Pvt.Ltd. C-59, Okhla Industrial Area, Phase-I, New Delhi-110020.

Impact of Make in India program - Is lion moving Backward? 1
Tecnia Journal of Management Studies Vol. 13 No. 1, April 2018 - September 2018
1. IntroductionThe Centre is functioning on a ‘compliance report’ of its flagship ‘Make In India’ (MII) initiative that attempts to transform India into a global design and manufacturing hub as well as create large-scale employment. The average GDP growth in the manufacturing sector was 9.5 per cent in the early nineties when the economic reform process was initiated. Thereafter, from 1996-97 onwards a decline in manufacturing sector GDP was witnessed till 2001-02. From 2002-03 there was a resurgence and the sector recorded an average double digit growth of 10.1 per cent during the period from 2005-06 to 2009-10. But from 2010-11 onwards again a decline in GDP growth was witnessed with the sector recording a negative growth of 0.7 per cent in 2013-14. To give a boost to the manufacturing sector growth and to make the sector globally competitive, the government had announced the National Manufacturing Policy in 2011.The policy visualized enhancing the share of manufacturing to GDP from 16 to 25 per cent and to create 100 million jobs by 2022. The policy visualized
the Centre to provide an enabling framework and incentives for infrastructure development on a PPP mode and the State Governments to be encouraged to adopt the instrumentalities provided in the policy viz; setting up of National Investment and Manufacturing Zones, rationalization and simplification of business regulations, incentives for small & medium enterprises, industrial training and skill up gradation measures among others. However, the manufacturing sector growth continued to be a cause of concern. With nearly 63 per cent of the population in the working age group (15-64 years) the Prime Minister in his Independence Day Speech in 2014 invited the world to ‘Make in India’, ‘Manufacture in India’ and indicated that growth of manufacturing sector is must for employment generation of the youth. The Make in India initiative announced officially in September 2014, aims to facilitate investment, foster innovation, enhance skill development, protect intellectual property and build best in class manufacturing infrastructure and convert India into a manufacturing hub of the world.
Impact of make In IndIa program- Is lIon movIng Backward?
Abstract: The Centre is functioning on a ‘compliance report’ of its flagship ‘Make In India’ (MII) initiative that attempts to transform India into a global design and manufacturing hub as well as create large-scale employment. The MII scheme covers 25 focus sectors ranging from automobiles to wellness. The ‘MII Action Plan’ had set short-term (one year) and medium-term (three years) targets “to boost investments in the 25 sectors” and to “raise the contribution of the manufacturing sector to 25% of the GDP by 2020”. “FDI inflows in India’s manufacturing sector grew by 82% year-on-year to $16.13 billion during April-November 2016,” according to the IBEF, a trust formed by the Commerce Ministry to promote of the ‘Made in India’ label overseas
Make in India opened new doors for investment. Relaxation of Foreign Direct Investment (FDI) norms enhanced the investor perception, and the industry observed a rush in automotive and electronics manufacturing investments. The liberalization of FDI policy permitted for over 50 percent of the investments in 25 sectors
Sandeep Kumar*Sweta Bakshi**
*Dr. Sandeep Kumar, Professor, Tecnia Institute of Advanced Studies Delhi**Sweta Bakshi, Assistant Professor, ITS Mohan Nagar, Ghaziabad

2 Sandeep Kumar, Sweta Bakshi
Tecnia Journal of Management Studies Vol. 13 No. 1, April 2018 - September 2018
In this paper an attempt has been made to see the employment potential of the Make in India initiative.The objective of the exercise, among other things, is to determine whether the government departments and agencies implementing the MII programme are meeting the deadlines visualize in the ‘MII Action Plan’ of December 2014.
2. Research Methodology.The present study is based on secondary data. The data has been extracted from various sources like research articles, publications from Ministry of Commerce, Government of India, various bulletins of RBI and authenticated websites.
3. Make in India Initiative (MII)The MII scheme covers 25 focus sectors ranging from automobiles to wellness. The ‘MII Action Plan’ had set short-term (one year) and medium-term (three years) targets “to boost investments in the 25 sectors” and to “raise the contribution of the manufacturing sector to 25% of the GDP by 2020”. At a national workshop held in December 2014 on these 25 sectors, an Action Plan was confirmed with the assistance of Secretaries to the Indian Government as well as industry leaders. According to National Manufacturing Policy, “the share of manufacturing in India’s GDP has stagnated at 15%-16% since 1980 while the contribution of similar economies in Asia is much higher at 25%-34%.”Government sources said a comprehensive study is also being undertaken on the impact of the MII initiative including a sector-wise evaluation regarding job creation and foreign direct investment inflows using the National Industrial Classification Code.
4. RBI, CSO dataData from the Reserve Bank of India and the Central Statistics Office are also being looked into in this regard, they said, adding that inputs are being required from the State governments as well. The compliance report is being monitored and evaluated at the highest level, including by the Prime Minister’s Office, the sources said. Recently, the Parliamentary Standing Committee on Commerce wanted an appraisal to be done on how the MII initiative has helped the country’s micro, small and medium enterprises. It recommended that dedicated steps should be taken to make sure that FDI endorses the MSME sector, and required to know the factors behind the Foreign Portfolio Investments turning negative and its impact
on the Indian industry. The panel also wanted to study if the MII initiative has seized the opportunity of demographic dividend in the country.
5. $1 trillion by 2025According to the India Brand Equity Foundation (IBEF), “India’s manufacturing sector has the potential to touch $1 trillion by 2025. There is potential for the sector to account for 25-30% of the country’s GDP and generate up to 90 million domestic jobs by 2025.” “FDI inflows in India’s manufacturing sector grew by 82% year-on-year to $16.13 billion during April-November 2016,” according to the IBEF, a trust formed by the Commerce Ministry to promote of the ‘Made in India’ label overseas. It said, “The government has an ambitious plan to locally manufacture as many as 181 products. The move could facilitate infrastructure sectors … that entail large capital expenditure and revive the $27.75 billion Indian capital goods business.”
6. The Parliamentary Standing Committee on Commerce’s recent report had also said manufacturing growth in the country has to become healthy, adding that “the manufacturing sector has grown only by an average of 1.6% in the last five years till 2015-16.” Underlining the significance of the capital goods sector for the country’s industrial growth, the panel said, “Appropriate measures may be taken to revitalize the growth of capital goods sector.” A December 2016 a ‘policy brief’ prepared by K.S. Chapatti Rao, Professor (Retd.), Institute for Studies in Industrial Development, and Biswajit Dhar, Professor, Jawaharlal Nehru University, had suggested the examination of FDI in the 25 sectors under the MII initiative “from the points of (i) adding fresh domestic production capacities (including meaningful indigenisation), (ii) net addition to capital instead of round-tripping of funds remitted abroad on one pretext or the other, (iii) the monetary value of all the incentives and exemptions availed and (iv) ...delayed reporting and gross inaccuracies.”According to a report, Future of Jobs in India by EY and NASSCOM highlighted India’s two challenges: the 17 million new entrants into the workforce year-on-year against the 5.5 million jobs created. According to a recent data published by Centre for Monitoring Indian Economy (CMIE), the unemployment rate has doubled between July 2017 and April 2018. It also states that the number of jobs in the country in the last financial year 2017-18 has also fallen from 406.7 million to 406 million.Make in India, launched in 2014, was one of the

Impact of Make in India program - Is lion moving Backward? 3
Tecnia Journal of Management Studies Vol. 13 No. 1, April 2018 - September 2018
flagship programs of the Indian Government. The program will celebrate its fourth anniversary this year. However, is the initiative falling shortly after four years? During its launch, Prime Minister quoted the initiative as the “lion step” towards promoting the manufacturing sector and generating millions of jobs. Is the lion really moving forward? Can we achieve 25% of the GDP by 2020 and create 100 million jobs through this program?
7. The successes and the disappointments: Make in IndiaNarendra Modi, Prime Minister of India, with the view to invigorating the country’s manufacturing sector announced his plan to launch Make in India in September 2014. The focus of the program was the National Manufacturing Policy, the purpose of which is to make India a global manufacturing center. The key objective of the program is to:• Make India a manufacturing center• Augment manufacturing’s share in the country’s
GDP from 16 percent to 25 percent by 2022• Generate 100 million jobs
8. The policy identified 25 key sectors namely:The spotlight of Make in India programme is on 25 sectors. These include: automobiles, aviation, chemicals, IT & BPM, pharmaceuticals, construction, defence manufacturing, electrical machinery, food processing, textiles and garments, ports, leather, media and entertainment, wellness, mining, tourism and hospitality, railways, automobile components, renewable energy, biotechnology, space, thermal power, roads and highways and electronics systems.In order to magnetize foreign investment, improve the sector’s growth and generate employment, the government implemented new policies and processes to deconstruct the old system and bring in the new system to promote business partnerships and ease of doing businesses.
9. The Hits of Make in India:Make in India opened new doors for investment. Relaxation of Foreign Direct Investment (FDI) norms enhanced the investor perception, and the industry observed a rush in automotive and electronics manufacturing investments. The liberalization of FDI policy permitted for over 50 percent of the investments in 25 sectors.The FDI inflow grew by 20 percent each in 2014-15 and 2015-16. However, in 2016-17, the country attracted the highest ever FDI inflow of 60 billion USD. In 2017-18, the nation saw the FDI equity inflow
of worth $33.75 in the first half of this fiscal, and the country is poised to see FDI inflows in 2017-18 surpassing even the record $60 billion it received in the last financial year.According to the data published by Department of Industrial Policy & Promotion (DIPP) in December 2016, highlighted that the industrial activity rose by 29 percent. Much of this growth was concentrated in three states- Karnataka, Madhya Pradesh, and Maharashtra. India jumped up 30 notches in the top 100 rankings on the World Bank’s ease of doing business’ index.Alain Spohr, Managing Director, India & South Asia, Alstom shares, “The Government’s visionary Make-in-India programme brought together businesses and consumers towards a common goal of nation-building. This added to the Prime Minister’s push to simplify investments and procurements in the country enabled most sectors to create business opportunities within the country and even attract international businesses. India’s rank in the ease of doing business was an affirmation of this very change. Not only did this create a momentum in the creation of jobs, but also brought the focus back to the need to bridge the gap between the skill imparted in college vis-à-vis that required in the market. We see the Government’s Skill India initiative working to bridge this gap in partnership with private players. Public-Private Partnership is the most effective tool to empower such movements and Alstom has been committed to supporting both these Government initiatives.”
10. The Misses:The country’s Gross Domestic Product (GDP) growth rate has fall from a high of 9.2 percent in the third quarter of 2016 to 5.7 percent in the third quarter of 2017. Economist attributes this mostly to the government’s demonetization drive and poor implementation of the new Goods and Service Tax (GST).As per the economic survey (2015-16), the rate of unemployment has augmented from 3.8 percent (2011-12) to 5 percent (2015-16). Additionally, in 2015 only 1.35 lakh jobs were added in eight labor-intensive sectors, compared to 9.3 lakh jobs that were added in 2011-12.From July 2014 to December 2016, in the eight major sectors i.e. manufacturing, trade, construction, education, health, IT, transportation, and accommodation and restaurants, only 6,41,000 jobs were produced.In comparison, these same sectors added a total of 128 lakh jobs from July 2011 to Dec 2013. The

4 Sandeep Kumar, Sweta Bakshi
Tecnia Journal of Management Studies Vol. 13 No. 1, April 2018 - September 2018
Economic Survey 2016-17 indicated a shift in the pattern of employment from permanent jobs to casual and contract jobs. This temporary nature of work has adversely affected the wages, employment stability and social security of the workers.Table: Unemployment rates from 2013-14 to 2015-16
Gender Year Unemployment Rate
Total 2013-14 4.9
Male 2013-14 4.1
Female 2013-14 7.7
Total 2015-16 5
Male 2015-16 4
Female 2015-16 8.7
Source: Ministry of Labour and EmploymentAccording to reports, the unemployment rate in the country rose from 3.39% in July 2017 to 6.23% in March 2018 and is projected to reach 6.75% in April 2018, according to the CMIE data.
11. Conclusion:While the Modi government has taken triumphant action in some areas, by cutting red tape, India jumped 30 places in the World Bank’s Ease of Doing Business rankings to enter into the top 100 nations. However, as per economists, manufacturing in India’s economic output has tapered in the wake of demonetization and the confused launch of a goods and services tax (GST). While manufacturing has come out as one of the fastest growing sectors in India but with services sector picking up in the early 2000s, manufacturing saw a fall in its contribution to overall GDP..
only about two percent of Indian workers are competent for certificates documenting their mastery of professional skills in comparison with about 70 percent of workers in Europe and 80-90 percent in East Asian countries like Japan and South Korea. Hence, the genuine challenge is not employment but employability. As mentioned in the World Economic Outlook and the Economic Survey, a single-minded approach to increasing country’s manufacturing base might not yield the results. Hence, there is a requirement to align Skill India and Make-in-India which can create a significant impact on the industry and the economy.
References• K. Kalaivani “A Study on the Impact of Make in
India on HRM Practices –An overview”. Indian Journal of applied research, Volume 5 Issue 4April2015
• Dr. K. V. Ramana “Make in India Illusion or Possible Reality Project? International Journal of Academic Research,April-June, 2015
• .Dr Rajeshwari M. Shettar Impact of Make in India campaign:a global perspective. Journal of Research in Business and Management, Volume 5 ~ Issue 2 (2017)
• S. Soundhariya “Make in India Scheme for transforming India” Global Journal for Research Analysis (GJRA),September, 2015
• Dr. Puneet Aneja “Make in India: New Paradigm for Socio Economic Growth in India”, PARIPEX
Indian Journal of research, April, 2016.• Seema Sangwan Making “Make in India” realism:
role of FDI, International Journal of Applied research, 2015.Dr. T. Vijayragavan Make in India and its Strength to Become India’s Manufacturing Hub,International Journal of Engineering, Business and Enterprise Applications, (IJEBEA), 2015.
• Seema Sangwan “Making Make in India a realism: role of FDI”, International Journal of Applied Research, 2015.
• Samridhi Goyal, Prabhjot Kaur and Kawalpreet Singh “Role of HR and Financial Services in Making Make in India Campaign a success”, IOSR Journal of Business and Management (IOSR-JBM),February,2
• https://www.peoplematters.in/article/jobs/is-the-lion-moving-backward-hits-and-misses-of-make-in-india-program-18308
Sources: Sociate Generale Cross AssetExperts think unavailability of skills is a key obstruction in creating employment. According to the National Institute of Public Finance and Policy,
Manufacturing’s share of Indian GDP has been failling(Gross value added, in percent)
FY2012 13 14 15 16 17 18
17.517.016.516.0
Fiscal year ends in March *Projection
Role of innovation in entrepreneurship of globalised world- a case study 5
Tecnia Journal of Management Studies Vol. 13 No. 1, April 2018 - September 2018
1. IntroductionInnovation means “to renew or change”. Although the term is broadly used, innovation generally refers to the creation of better or more effective products, processes, technologies, or ideas that are accepted by markets, governments, and society. Innovation differs from invention or renovation in that innovation generally signifies a substantial positive change as compared to incremental changes. The following diagram is referred to as an Innovation Value Chain because it represents the very general sequence of activities that create value in our society and economy. Simply put: discoveries result in new ideas in the form of knowledge and concepts,
inventions result in new technologies and business models, and innovation exploits inventions to allow for the creation of value through commodities, goods, services and experiences.
Innovation is the specific tool of entrepreneurs, the means by which they exploit change as an opportunity for a different business or a different service. It is capable of being learned, capable of being practiced. Entrepreneurs need to search purposefully for the sources of innovation, the change and their symptoms that indicate opportunities for a successful innovation. And they need to know and to apply the principles of successful innovation. Of these factors: natural raw materials, physical and mental labor
role of InnovatIon In entrepreneurshIp of gloBalIsed world - a case study
Abstract: Entrepreneurship can be viewed as a creative and innovative response to the environment and an ability to recognize, initiate and exploit an economic opportunity. An entrepreneur is an innovator who introduces something new in an economy. Entrepreneurship is doing things that are generally not done in the ordinary course of business. Innovation may be in; introducing a new manufacturing process that has not yet been tested and commercially exploited, introduction of a new product with which the customers are not familiar or introducing a new quality in an existing product, locating a new source of raw material or semi finished product that was not exploited earlier, opening a new market, hitherto unexploited, where the company products were not sold earlier, developing a new combination of means of production. Innovation involves problem solving and an entrepreneur is a problem solver. An entrepreneur does things in a new and a better way. A traditional businessman working in a routine manner is not entrepreneurial. Innovation leads to the dynamics that governs the interaction between science, industry, and society. Innovative organization wants must have to prepare for renewing the offerings and its delivery process to its stakeholders to survive in today’s globalised world. In the present paper, concept of innovation and entrepreneurship has been studied by the authors. The paper aims to examine the role of innovative entrepreneurs in the innovation of products/services that helps the business in survival and growth in present globalised market place.
Sambhavana Gupta*Ritesh Gupta**DD Chaturvedi***Sandeep Kumar****
*Dr. Sambhavana Gupta, Visiting Faculty, GGSIP University, New Delhi.**Ritesh Gupta, Head, Deptt. of Business Entrepreneurship and Management, FDDI, Chandigarh.***DD Chaturvedi, Associate Professor, Guru Gobind Singh College of Commerce, New Delhi.****Dr. Sandeep Kumar, Faculty, Deptt. of Commerce, ARSD College, University of Delhi, Delhi
6 Sambhavana Gupta, Ritesh Gupta, DD Chaturvedi, Sandeep Kumar
Tecnia Journal of Management Studies Vol. 13 No. 1, April 2018 - September 2018
and capital. An innovation is a new combination of these three things. Entrepreneurs, as innovators, are people who create new combinations of these factors and then present to the market for assessment by consumers. This is a technical conceptualization of what is innovation is about. It does not give the practicing entrepreneur much of a guide to what innovation to make, or how to make it, but it should warn that innovation is a much broader concept then just inventing new products. It also involves bringing them to market.
2. Importance of innovation in entrepreneurshipAny business is integral to the economy. Without it, our economy would not survive. But a business must also sustain itself, be able to constantly evolve to fulfill the demands of the community and the people. In every business, it is imperative to be industrious, innovative and resourceful.
Entrepreneurship produces financial gain and keeps the economy afloat, which gives rise to the importance of innovation in entrepreneurship. Entrepreneurs are innovators of the economy. It is not just the scientist who invents and come up with the solutions
The importance of innovation in entrepreneurship is another key value for the longevity of a business. Entrepreneurs and businesses began with a need. They saw the need within the community and among themselves that they have come up with a solution. They seize the opportunity to innovate to make the lives more comfortable. And these solutions kept evolving to make it better, easier and more useful. Entrepreneurs must keep themselves abreast with the current trends and demands. Manufacturers are constantly innovating to produce more without sacrificing the quality. Companies and enterprises keep innovation as part of their organization. Innovations contribute to the success of the company. Entrepreneur, as innovators, see not just one solution to a need. They keep coming up with ideas and do not settle until they come up with multiple solutions. Innovation is extremely important that companies often see their employees’ creativity as a solution. They come up with seminars and trainings to keep their employees stimulated to create something useful for others and in turn, financial gain for the company.
Other factors that raises the importance of innovation in entrepreneurship is competition. It stimulates any entrepreneur to come up with something much better than their competition in a lower price, and still be
cost-effective and qualitative. Small businesses see the importance of innovation in entrepreneurship. They were able to compete with large industry and see their value in the economy. Small businesses are important as they are directly involved in the community and therefore, contribute to their financial and economic gain. These small businesses know exactly what community needs and fulfill them. All things start small. Innovation is important not just in entrepreneurship. As individuals, we are innovators by adapting well to our needs and create our own solutions. Entrepreneurs are the same. The innovation in entrepreneurship helped the country by changing with the times and producing new products and service from ones that already exists. And, being innovative has helped us become successful in all our endeavors
3. The face of the Innovative entrepreneurThere are really two parts that go into innovative entrepreneurship; one is the invention -coming up with a new idea for a good or service. But the other is successfully converting that idea into a product or service and commercializing it. In that sense, an electric car that really worked and was well-adopted by consumers would be an innovation. Even though electric cars have been produced (invented) before, they have yet to be successfully commercialized. Innovators also might look quite different from one another; there are innovators who develop new technologies, like we’re seeing right now with biotechnology. There are innovators like Michael Dell who pair existing technologies with a creative business model. And there are entrepreneurs who find innovative ways to improve applications of new and existing technologies, as Innovative Solutions & Support Inc. did when designing flat-screen displays for airplane cockpits. The common thread among each type of innovator is that they all continue to innovate to sustain their business. “Motorola began by making converters and has transitioned from there to car radios, to mobile radios for World War II, to TVs, to stereos, and to cell phones. Faced with new low cost producers for its existing product line, the company would have failed had it not continuously innovated.” But for the entrepreneur looking to innovate, whether by developing a new good or service, employing a new business model, or applying existing technologies in new ways. ”The Phoenix Company TGen, for example, quite consciously pursues innovation through state-of-the-art research. Right now they’re trying to take the latest developments in medicine and transfer them to the bedside to serve a global population. In

Role of innovation in entrepreneurship of globalised world- a case study 7
Tecnia Journal of Management Studies Vol. 13 No. 1, April 2018 - September 2018
contrast, Another Phoenix Company, JDA Software, was created when its founder realized that then-available supply chain management software for retail companies wasn’t sophisticated enough. He took that realization and turned it into an innovation, which now serves a global population.
4. Objective of the Study(a) To study entrepreneurship and innovation
(b) To study role of the innovative entrepreneur in economy.
(c) To study and present examples of innovative entrepreneurs.
5. The roe of the innovative entrepreneur in the economyInnovative entrepreneurship impacts the economy at three levels: at the aggregate level, at the consumer level, and at the firm level. The positive effects of innovation percolate through the economy. At the aggregate level, innovative entrepreneurship, like its replicative cousin, benefits the overall economy by creating new jobs and increasing income, raising the potential for new investments. In fact, new research demonstrates that it is the gazelles -innovative companies that have experienced annual growth rates greater than 20 percent for four or more years-that create the largest number of new jobs. At the consumer level, the effect of innovation is the added value for consumers - the improved products or services available to them at lower costs. At the firm level, innovators can out-compete other companies that are not innovators, because of the cost advantages that innovation produces. Furthermore, firms that produce innovative goods and services are also more likely to adopt new innovations.
6. Cultivating innovative EntrepreneurshipIt’s not likely that policymakers can directly guide innovation, but they can provide the kind of environment that fosters it”. Furthermore, R&D is very important. Clearly all of the most famous clusters of innovation—Silicon Valley, Route 128 in Boston, the Research Triangle in North Carolina—they all have universities in proximity producing basic R&D that can ultimately be commercialized. The famous clusters of innovation have another factor in common: a critical mass of companies involved in innovation. “Silicon Valley became the innovation Mecca. It is today almost by accident. HP started there in a rented-out garage, and its presence attracted other companies, which attracted
others, and so on. This type of clustering produces is called network externalities. Innovative firms accrue production advantages from their proximity to other innovators. The clustering provides synergy, a knowledge base, a talent base and an efficient means of transferring information.
The presence of large innovating companies is important. If you want to cultivate innovative entrepreneurship, you have to have large innovative companies, because they spawn start-ups. A lot of innovative entrepreneurs get their technical experience working for a large company. Once they come up with the innovative idea, they leave the company to go out on their own. The presence of a well-funded university involved in R&D is also a critical factor for an innovative economy. A highly trained labor force and a culture of lifelong learning are important factors in the cultivation of innovative entrepreneurship. In addition to serving as centers for R&D, universities also must do well at educating innovative entrepreneurs. There are two types of education that innovative entrepreneurs need to be successful: on one hand, they need a really solid technical understanding; and on the other hand they need an education that stimulates creativity and imagination.”
Innovation involves changing the status quo with respect to customer experiences, product performance, business processes, alliances, and the channels of distribution or the way the product or service is ultimately delivered to consumers. Thus, teaching innovation is not just about teaching students how to develop new goods or services, but how to explore their ideas, and develop their latent potential for innovation.
7. Some of the Famous Innovative Entrepreneurs
BILL GATESWilliam Gates the III, the former CEO of Microsoft, for short period of time, had assets worth over 100 billion dollars, making him the world’s first cent billionaire. Today his assets are half that but he remains, as he has for the past decade and then some, the world’s wealthiest man according to Forbes.
Gates was born on 28 October, 1955 in Seattle, Washington to a successful family and was able to attend a Seattle private school. His mother was a schoolteacher and his father a Seattle attorney. He developed interest in software and began programming at age 13 when the school acquired an ASR-33 teletype terminal from a mother’s

8 Sambhavana Gupta, Ritesh Gupta, DD Chaturvedi, Sandeep Kumar
Tecnia Journal of Management Studies Vol. 13 No. 1, April 2018 - September 2018
rummage sale. Because of their exploits of bugs in the school’s second computer: a DEC PDP-10, owned by Computer Center Corporation, Gates and a number of other students, including Paul Allen-Microsoft’s co-founder, were offered unlimited computer time in exchange for debugging the company’s computers. After CCC went out of business, the students were hired by Sciences Inc. To writ e a payroll program. The students were successful and were received royalties on the program.
RATAN NAVAL TATARatan Naval Tata (born 28 December 1937) is the present chairman of Tata sons and therefore, Tata Group. He is also the chairman of major Tata companies such as Tata steel, Tata Motors, Tata Power, TCS, Tata Tea, Tata Chemicals, The Indian Hotel Company and Tata teleservices. Ratan Tata was adopted by Naval Tata and Soonoo Commissariat in the Tata Family a prominent family belonging to the Parsi community. He is the great-grandson of Tata group founder Jamshedji Tata. After his parents separated in 1944, he was brought up by his grandmother Lady Navajbai and did his schooling in Mumbai from Campion School. Later, he enrolled in Cornell University, where he earned a B.S in architecture with structural engineering in 1962, and has also completed the Advanced Management Program at Harvard business school (Class of 1975).
VIJAY MALLYA(Born 18 December 1955) is an Indian liquor baron and Rajya Sabha MP. The son of industrialist Vittal Mallya, he is the Chairman of the United Breweries Group and Kinfisher Airlines, which draws its name from United Breweries Group’s flagship beer brand, Kingfisher. He also co-owns the Formula One team Force India, the Indian Premier League team Bangalore Royal Challengers, and the I-League team East Bengal FC. According to Forbes.com, as of March 2011, Mallya, is worth US $1.4 billion. He is ranked 879 in The Forbes World Billionaires Ranking (2011), and 38th in India. He receives substantial press coverage that focuses on his lavish parties, villas, automobiles, Force India, Royal Challengers Bangalore and his yacht, the Indian Empress. Mallya was born into a Konkani Goud Saraswat Brahmin family which originally from the town of Bantawal, near Mangalore in Karnataka. He is the son of Vittal Mallya and Lalitha Ramaiah. He was educated at La Martiniere for Boys School; Calcutta and completed his degree at St. Xavier’s college Kolkata.
RAGHAV BAHLHe is an Indian Businessman best known for his ownership of several television channels, including TV-18 India. He received schooling from St. Xavier’s School Delhi and attained a Masters in Business Administration from FMS Delhi. He is responsible for directing most of the work of TV-18 and channels like CNBC-Awaaz, Nickelodeon and colors. Recently he has written a book ‘Super Power?’ which compares the two developing countries China and India. Raghav “earned” his 2007 Entrepreneur of the year award of Ernst and young. Around 50, he is a first generation Entrepreneur. He started Newtwork-18 as a television software house in the mid nineties. He developed the India Show and The India Business Report for BBC very successfully. He saw hard times for many years but he and his team were able to come through the Agni pariksha very well. Now he has in his media house three of the best global properties CNBC, CNN and VIACOM. Raghav was born in IAS family and his grandfather was principal of a government college. He studied at St. Stephen college MBA from DU and went to Columbia for his doctorate on scholarship but decided to come back to do what he loved to do.
JAWED HABIBJawed Habib who was “Entrepreneured” into 220 Jawed Habib Salon and 42 Training Academies not just in India but across Asia, from Malaysia to Nepal and beyond. Last year he launched Hair Express outlets, offering hair cut at just Rs 99 each. Jawed, is a post Graduate in French Literature from JNU, New Delhi. He went to London’s Morris School of Hair Dressing and London School of Fashion for a 2 year course in the art and science of hair style and grooming. He is already there in the Limca Book of world Record with Feat of 410 nonstop haircuts in a day.
KIRAN MAZUMDAR-SHAWThe stud lady from India’ (Managing Director of Biocon Limited a biotechnology company based in Bangalore (Bangaluru), India. Kiran Mazumdar-Shaw was born on March 23, 1953 (age 58) in Bangalore, India. Kiran Mazumdar-Shaw completed her schooling from the city’s Bishop Cotton Girl’s High School (1968). She wanted to join medical school but instead took up biology and completed her BSc Zoology Honors course from Mount Carmel College, Bangalore University (1973). She later did her post-graduation in Malting and Brewing from

Role of innovation in entrepreneurship of globalised world- a case study 9
Tecnia Journal of Management Studies Vol. 13 No. 1, April 2018 - September 2018
Ballarat College, Melbourne University (1975). She worked as a Trainee Brewer in Carlton and United Breweries, Melbourne and as a Trainee Malster at Barrett Brothers and Burston, Australia. She also worked for some time as a Technical Consultant at Jupiter Breweries Limited, Calcutta and as a Technical Manager at Standard Maltings Corporation, Baroda She started Biocon in 1978 and spearheaded its evolution from an industrial enzymes manufacturing company to a fully integrated bio-pharmaceutical company with a well-balanced business portfolio of products and a research focus on diabetes, oncology and auto-immune diseases. She also established two subsidiaries: Syngene (1994) to provide development support services for discovery research and Clinigene (2000) to cater to clinical development services. Her pioneering work in the sector has earned her several awards, including the prestigious Padma Shri (1989) and the Padma Bhushan (2005) from the government of India. She was recently named among TIME magazine’s 100 most influential people in the world. She is also on the Forbes list of the world’s 100 most powerful women, and the Financial Times’ top 50 women in business list.
8. ConclusionWith rising population of the world, the world’s need and necessities pattern had also evolved through the years. To sustain the ever increasing demand and supply of products, right entrepreneurship skills and innovation are much more needed. Without new business ideas and technology to support it, no consumer demand will be fulfilled completely. Thus, innovation and entrepreneurship is the need of hour and needs to be adopted by one and all business enterprises.
Innovation and Entrepreneurship is a good resource for categorizing and identifying sources of
innovation. Entrepreneur does an excellent job of organizing the key elements involved in innovation and there is a fair amount of real world examples that help others understand the concepts. Innovation and Entrepreneurship is more about creating a framework for innovation that can be used to compartmentalize current practices and shed light on their origins. To accurately point out, the least likely sources of innovation are from new knowledge and bright ideas. The insight into this alone, makes the concept well worth understanding.
References• Batra Promod, Batra Vijay, Outside the Box-
Great Ideas that transformed Business, published by Promod batra Vijay batra and Associates, New Delhi
• Bedi Kanishka, Management and Entrepreneurship, oxford university press, New Delhi
• Hisrich D Robert, Peters P Michael, Shepherd A Dean, Entrepreneurship, sixth edition (2007), Tata McGraw-hill publishers, New Delhi.
• Oats David, A Guide to Entrepreneurship, second edition (2007), Jaico publishing house, Mumbai
• h t t p : / / s m a r t e c o n o m y . t y p e p a d . c o m /entrepreneurship_and_inno/ How to double and triple the success rate of all entrepreneurs in a country.
• http://hbswk.hbs.edu/item/6168.html/Do Innovation and Entrepreneurship Have to Be Incompatible with Organization Size?
• http://creativityandinnovation.blogspot.com/ Creativity and Innovation Driving Business -Innovation Index

10 Anurag Agnihotri, Julee Banerjee, Surbhi Gupta, Krishna Gupta
Tecnia Journal of Management Studies Vol. 13 No. 1, April 2018 - September 2018
1. IntroductionTo enhance the efficiency of the Capital Markets around the world, there is need for the firms to provide accurate, reliable and timely information to the market players i.e. investors, financial institutions, creditors. The essential components for the flow of the information to the capital markets participants are Accounting, Auditing and the Corporate Governance. However Various Scandals in the last decade all over the world like Enron Scandal (2001), WorldCom Scandal(2002),Tyco Scandal (2002),Health South Scandal(2003),Freddie Mac Scandal(2003),American Insurance Group Scandal(2005),Lehman Brothers Scandal(2008), Bernic Madoff Scandal(2008),Satyam Scandal(2009) had focused on the emergent need for the substantial improvements in the accounting and auditing Practices all over the world. There are number of Emerging accounting issues to be considered but in the current study we have pointed out some of the very main issues.
2. IFRS and Globalization With the rising level of trade and investment all over the world it is becoming more pervasive for the financial information to be reliable, transparent and more importantly comparable. Since each country has its own accounting standards International Financial Reporting Standards aspires to make the international financial reporting comparisons easier. For example Indian GAAP is different from US GAAP. Synchronizing accounting standards all over the world is an ongoing process. GAAP in India is influenced by the number of regulatory bodies like RBI, SEBI, and IRDA and also by the number of Act and Laws i.e. Companies Act, Income Tax Act, and Banking Regulation Act etc. The Regulatory and the legal requirement will prevail over the IFRS, in case of differences. ICAI is boosting the IASB’s announcement in the country with an aim to facilitate Global harmonization of the Accounting Practices.
Adoption of IFRS by the Indian Corporate
Emerging Issues and Changing Face of Accounting
Abstract: Various Scandals in the last decade all over the world like Enron Scandal (2001), World Com Scandal (2002), Tyco Scandal (2002), Health South Scandal (2003), Freddie Mac Scandal (2003), American Insurance Group Scandal (2005), Lehman Brothers Scandal (2008), Bernic Madoff Scandal (2008), Satyam Scandal (2009) had focused on the emergent need for the substantial improvements in the accounting and auditing Practices all over the world. To enhance the efficiency of the Capital Markets around the world, there is need for the firms to provide accurate, reliable and timely information to the market players i.e. investors, financial institutions, creditors. There are number of Emerging accounting issues to be considered in the recent years but in the current study we have pointed out some of the very main issues i.e. IFRS & Globalization, Sustainability Reporting, Reverse Mortgage, Global Code of Conduct & Environmental Accounting.
Anurag Agnihotri*Julee Banerjee**Surbhi Gupta***Krishna Gupta****
*Dr. Anurag Agnihotri, Faculty, Deptt. of Commerce, CVS, University of Delhi**Dr. Julee Banerjee, Faculty., Army Institute of Management & Technology, Greater Noida.***Surbhi Gupta, Faculty, Vivekananda College, University of Delhi***Dr. Krishna Gupta, Associate Professor, Deptt. of EAFM, University of Rajasthan, Jaipur

Emerging Issues and Changing Faceof Accounting 11
Tecnia Journal of Management Studies Vol. 13 No. 1, April 2018 - September 2018
Convergence with IFRS has gained impulse all over the world in recent years. Large number of countries including European Union, Australia, China, New Zealand, and Russia, Japan, Sri Lanka, Canada and Korea have also graved to adopt IFRS from 2011.In this phase of globalization, India cannot isolate itself from the developments taking place all across the world. The economic environment shift in India in last few years has led to increasing consideration to the accounting standards as a means towards ensuring transparent financial reporting by the firms. The main aim of Institute of Chartered accountant of India has always been to frame high quality accounting standards and it has been succeeded in doing it. As the world globalizes the convergence of National Accounting Standards with the IFRS has increased significantly. As the world is globalizing, the various discussion on convergence of the Indian Generally Accepted Accounting Principles with IFRS has significantly increased. Some of the main developments are as:
• Formation of Task Force of IFRS by the Council of ICAI
• Recommendation Submission of the IFRS Task Force to the Council
• Entire adoption of IFRS from the accounting period starting on or after 1 April 2011
• IFRS is proposed to be applicable to and public interest entities such as insurance Companies, banks and large sized entities
• Involvement of large number of regulating bodies such as MCA, RBI, IRDA, Tax authorities and SEBI
• Outlining of Schedule VI and the Accounting Standard 1 (Exposure Draft) in consistent with IFRS
• Presentation of the Convergence Strategy by Technical Directorate of ICAI on 02.02.2009:
ICAI has started the procedure of issuing the IFRS equivalent Accounting Standard with following projected changes:
• Removal of all the alternative treatments
• Requirement of the Additional disclosures
• IFRS number will be given in the Parenthesis along with the AS number
• IFRICs will be issued as appendices
• ICAI has formed a Group in contact with the
government & other regulatory authorities and the group has a Also established separate core groups to discover the inconsistencies between IFRS and the various relevant acts.
3. Benefits in IFRS Adoption • Increased Access to International Capital Markets
• Transparent Reporting leading to better Investment Opportunities
• Multiple Reporting Avoidance
• Reduction in the cost of Capital.
4. Challenges in IFRS Adoption Despite of various benefits there are also various
protests that will be confronted on the way of IFRS convergence.
• People: Shortage of skilled Manpower and Resources
• System and Process: Huge cost involved in the enactment of IT System
• Reporting: Acceptance by Tax Authorities and other Regulatory Authorities, Problems in Accounting Reporting Policies, Analysis &Disclosures.
• Business: Management of the expectations of the Market & Relationship with the Investors
5. Need for Sustainability Reporting To improve the efficiency of the Corporate to Enhance the Reputation of the Management Sustainability Reporting is required to meet the rising competition In India very less reporters have sustainability strategy with well Planned objectives and SMART (Specific, Measurable, Achievable, Realistic and Time-bound) targets. This indicates that although many Indian companies have started reporting their sustainability performance but they have not imparted their attempts under a well defined sustainability strategy. Some of the Companies which have started the sustainability practices in India are:
• Coca Cola
• Ford Motor
• Wipro,
• Infosys, TCS,
• ITC
• Intel
• Nike

12 Anurag Agnihotri, Julee Banerjee, Surbhi Gupta, Krishna Gupta
Tecnia Journal of Management Studies Vol. 13 No. 1, April 2018 - September 2018
CSR and Sustainability reporting, is a recent trend which has developed over the last two decades. Many companies now develop an annual sustainability report and there are large range of ratings and standards. There are a number of reasons that companies choose to produce these reports, but at their core they are intended to be “accountability & vessels of transparency “. There is a greater need for the corporate to adopt the sustainability Reporting practice.
6. Reverse Mortgage Scheme Reverse Mortgage Scheme is a scheme developed in 2007 in India and is already a very popular scheme in the west. The reverse mortgage scheme (or lifetime mortgage) is a loan which available only to the senior citizens. As its name suggest it’s simply opposite of the of a normal housing loan.
7. Objective of the scheme The main objective of the scheme is to provide a source of additional income for senior citizens who own self acquired House property in India.
8. Working of the scheme Under this scheme, once the house is pledge for the ‘reverse mortgage’, the bank will reach at the value of the house after carrying out its due diligence. After creation of room for interest costs and the fluctuation of the price, the bank will pay the balance amount to the citizen depending upon the payment option that is being opted. On every payment that the bank gives to the citizen the equity in the house decreases. This period of credit is open, generally for a period of 15 years. Even after the tenure fixed the citizen can continue to live in their house. Only in case if the resident permanently leaves the property or in case if he/she dies, the lending institution will sale out the property, and from the sales proceeds it will take the amount that is payable by the citizen to the bank and the balance amount will be given to the legal heirs. The bank will also do the period valuation of the property, generally after five years, to ensure that the value of the house is higher than the total amount payable by the citizen.
9. Features of the loan The guidelines prepared by Reserve Bank of India of on reverse mortgage in have the following attributes:
• To be eligible for the Reverse Mortgage Scheme the Owner of the house should be above 60 years of age.
• The maximum amount of the loan benefit is up to the 60 per cent of the value of the residential property.
• The maximum period of time of the mortgaging the property is 15 years with a bank or HFC (housing finance company).
• The borrower can opt for a monthly, quarterly, annual or lump sum payments at any point, as per his requirement.
• The bank or HFC will do the revaluation of the property after every five years.
• The money obtained through reverse mortgage will not attract any tax liability as it is considered as loan and not income.
• Reverse mortgage rates can vary as per the market conditions depending on the interest rate regime opted by the borrower. And hence can be floating or fixed.
10. Global Code of Conduct Large number of scams and scandals in the last decade like Enron, WorldCom, Lehman Brothers, Satyam scandals are the eyes openers and has focused on need for having a global code of conduct and ethics. The International Ethics Standards Board for Accountants (IESBA), an independent standard-setting board within the International Federation of Accountants (IFAC), has recently updated and strengthened the independence requirements contained in the IFAC Code of Ethics for Professional Accountants (2011).Some of the corporate who have opted for it are: Pepsico ,Dell, Coca Cola. There is a greater need to protect the fundamental attributes of the profession and for that we need to strengthen the issue.
11. Environmental Accounting An enterprise is a corporate citizen. Every corporate has the paramount responsibility to make efficient use of material and resources. No doubt that India is a developing county and growing at a very fast pace but the sad part is that we are neglecting the social responsibility for the better growth and development of the Indian Economy. Responsibility towards the environment has become one of the most prominent areas of social responsibility. Currently it has been that there is a rising concern for the degradation of the environmental resources taking place in the form of pollution of various types, viz. water pollution, air pollution, sound pollution, Erosion of soil, deforestation, etc. It has become worldwide issue and phenomenon. It is spoiling health of human’s

Emerging Issues and Changing Faceof Accounting 13
Tecnia Journal of Management Studies Vol. 13 No. 1, April 2018 - September 2018
human, reducing economic productivity and has also resulted in loss of amenities. The developing countries like India are facing the twin problem of protecting the environment and encouraging economic growth & development. A trade-off between environmental protection and economic development is required. A careful assessment of the benefits and costs of environmental damages is requisite to find the safe limits of degradation of environment and the required level of development. The cost of the damage to the environment in India is estimated to about Rs. 34,000 cr per year, about 9.5 per cent of gross domestic product. But until or unless the sufficient accounting work is done either by the individual firm or by the Government itself, it cannot be ascertained that both has been fulfilling their responsibilities towards environment or not. Therefore, there is a need for the emergence of Environmental Accounting.
12. ConclusionThere is a need for the firms to provide accurate, reliable and timely information to the players in the market i.e. investors, financial institutions and creditors for enhancing the efficiency of the Indian Capital Markets. Auditing, Accounting and corporate governance are the important components for the flow of the information to the capital markets. However Various Scandals in the last decade all over the world like Enron Scandal (2001), WorldCom Scandal (2002), Tyco Scandal (2002), Health South Scandal (2003), Freddie Mac Scandal (2003), American Insurance Group Scandal (2005), Lehman Brothers Scandal (2008), Bernic Madoff Scandal (2008), Satyam Scandal (2009) had focused on the emergent need for the substantial improvements in the accounting and auditing Practices all over the world. There are number of Emerging accounting issues to be considered but in the current study we have pointed out some of the very main issues i.e. IFRS & Globalization, Sustainability Reporting, Reverse Mortgage, and Global Code of Conduct
& Environmental Accounting. The economic environment shift in India in last few years has led to increasing consideration to the accounting standards as a means towards ensuring transparent financial reporting by the firms. CSR and Sustainability reporting, is a recent trend which has developed over the last two decades. Many companies now develop an annual sustainability report and there are a wide range of ratings and standards around. Reverse Mortgage Scheme is another important emerging issue which is gaining momentum. Various Scams all over the world has also focused on need for having a global code of conduct and ethics. An enterprise is a corporate citizen. Every corporate has the paramount responsibility to make efficient use of material and resources. No doubt that India is a developing county and growing at a very fast pace but the sad part is that we are neglecting the social responsibility for the better growth and development of the Indian Economy and hence there is an emerging need for Environmental Accounting.
References: • Asiemo, P. (N.D.). Managing the Challenges of
IFRS Transitions. Working Paper.
• Chauhan, M. (2005). Concept of Environmental Accounting and Practice in India.
• Eugene.A.Imhoff, (2003). Accounting Quality, Auditing and Corporate Governance. 117-128.
• International Financial Reporting Standards (IFRS) In Indian Context. (N.D.).
• Jain, P. (N.D.). IFRS Implementation in India: Opportunities and Challenges. Working Paper, 1-12.
• N, S. T. (2005, December). International Financial Reporting Standards. Michigan bar Journal, 14-17.
• Shil, N. C. (2008). Accounting For Good Corporate Governance. Joaag (1), 22-31.

14 Vandana Gupta
Tecnia Journal of Management Studies Vol. 13 No. 1, April 2018 - September 2018
1. IntroductionThe marketing mix is a useful model to generate and implement various marketing strategies. The elements are the marketing tactics or strategies, also known as the ‘four Ps’, the marketing mix elements are price, place, product, and promotion. The model was launched by Neil Borden who first started using the truism in 1949. Fastidious attention being paid to services promoting in recent years; theorists have known extra variables that might be value-added to the four P’s.
There are two concepts for marketing mix: 4P and 7P. The concept of 4Ps (product, price, place and promotion) has been long used for the product industry while the latter has risen as a fruitful suggestion for the services industry.
Marketing mix is starting from the single P (price) of economic theory (Chong, 2003). McCarthy (1964) offered the “marketing mix”, usually observed because the “4Ps”, as a way of understanding endorse and promoting designing into applies (Bennett, 1997).
Marketing mix is not a logical hypothesis, but simply an abstract framework that acknowledges the principal deciding managers create in arrangement
their offerings to suit customers’ desires. The tool can be utilized to develop both long term systems and short term strategic projects (Palmer, 2004). The idea of the marketing mix is Associate in nursing indistinguishable thought from once mixing a cake. A pastry specialist will adjust the ingredients in a cake depending upon which type of cake needs. The magnitude in the marketing mix can be changed in the same way and be different from the product to product (Hodder Education, n.d).
The marketing mix management model has dominated marketing/promoting thought, analysis and apply (Grönroos, 1994), and “as a creator of differentiation” (Van Waterschoot, n.d) since it had been introduced in1940s. Kent (1986) refers to the 4Ps of the marketing mix/promoting combine as “the holy quadruple…of the marketing faith written in remedy of stone”. Marketing mix has been enormously prominent in informing the expansion of both marketing theory and practice (Möller, 2006)
Fifield and Gilligan perceived the three more factors as an integral part of marketing mix process, people and physical evidences. At the purpose once combination these mix elements, marketers should think about their objective market. These seven P’s are the variables that the marketing manager can
7 p’s of marketIng mIx In the selected hotels of rajasthan
Abstract: This paper investigates the marketing mix for the selected hotel and in Rajasthan. The hypothetical part of the work deals with function and role of 7 P’s in marketing mix and make clear that all variables or element of marketing mix are important. For this review the information was collected from 240 consumers (respondents) in Rajasthan state. For the purpose of analysis percentage analysis, weighted average, rank analysis and Chi-square test used for analyzing primary data to find the relation between Place and Price (first and second rank variables) of marketing mix. In light of the investigation, a few recommendations and suggestions were given.
Vandana Gupta*
*Dr. Vandana Gupta, Assistant Professor, Faculty of Commerce and Management Studies, L M College of Science & Technology (Autonomous), Jodhpur [email protected]

7 P’s of Marketing Mix in The Selected Hotels of Rajasthan 15
Tecnia Journal of Management Studies Vol. 13 No. 1, April 2018 - September 2018
control, subject to the personal and outer boundaries of the marketing environment. The objective is to make decisions that center the seven P’s on the client within the objective market with a selected finish goal to make perceived worth and generate a positive response.
2. Hotel IndustryThere is no official standard definition or meaning of what hotel comprises is. In simple terms, the Oxford English Dictionary online characterizes a hotel is “An establishment which providing accommodation, meals, enjoying place, swimming, games and offering other services for travelers and tourists, by the night’.
The hospitality industry is one of the leading and fastest developing industries in the world over. The business involves different sub-sectors which incorporate the hotel sector, restaurant and resort. The tourism and hospitality industry is a sector that most nations around the globe try to expand.
The business of the hotel industries have been one of the significant employers throughout the world. The hotel industry being an indispensable part of the more wide-ranging hospitality industry occupies an important place in the economy for most countries.
This analysis proposes to inspect or examine the Impacts of Marketing Mix on the Consumer Experience in hospitality settings, cordial reception particularly in the hotel business. The aim of composing this research to investigate the effect of marketing mix on the customer experience in hotel industry; the way marketing mix has changed the industry and how it can be utilized to additionally build up the business and to make a positive image of a hotel in the mind of the customer.
Marketing could be a fundamental component or a basic part in maintaining any business. Despite the actual fact that is turned out to be an important factor which decides the accomplishment of hotel unit, yet it is a phenomenon which is regularly underestimated.
3. Hotel Marketing MixMarketing mix alludes to a mixture of varied elements or components which is made into a work-able program to create an entire. It includes different elements that influence marketing efforts. The primary marketing mix includes the four P’s of marketing (product, price, place, promotion). And the additional three P’s are (people, physical evidence and process) were later value-added to the initial four P’s to make the extended promoting P’s.
The specialist will adhere to the 4P’s of marketing in light of the fact that they were the ones that are broadly utilized and acknowledged by marketing professionals.
The figure below demonstrates the 4 P’s of marketing mix.
The Four P’s of the marketing mix
(Adapted from: http://business-fundas.com/2011/the -4 -ps -o f -market ing- the-market ing-mix-strategies/)
Elements of Marketing Mix (7 P’s)Product: The product could be a mix of tangible and intangible aspects of the product offered by the producer or manufacturer to the customers.
Price: Price involves the monetary value of the product has been predefined for exchange purpose. The price is the sum a customer ready to pay for the product.
Place: Place represents the point or area wherever the product is made accessible to buy. It is required that the products and customer ought to be accessible at some extent then solely the sales would be conceivable. It can include any physical store and additionally virtual stores on the Internet.
Promotion: It include all means for communication a marketer utilizes as a part of the market for their product or services in order to create awareness, convince the customer to purchase and retain in future too. The promotional mix comprises advertising, promotion personal selling, sales, public relations, direct marketing and corporate image.
People: The services are being given the support of employees and to the customer. There is direct get in touch with for delivery of the services to the customer. The kind of people giving the services are important consequently, people are to be selected, trained and motivated intentionally to make the

16 Vandana Gupta
Tecnia Journal of Management Studies Vol. 13 No. 1, April 2018 - September 2018
customers content with the efficient service provided.
Process: proceeds for a specific service, certain exercises are to be performed which requires a strategy, tactics system and flow of activities by which services are to be conveyed. It is important to keep up a standard format for availing the services without which the service can’t be conveyed properly with uniformity.
Physical Evidence: The physical evidences create the atmosphere in which the service or product is delivered. It include two types – Internal evidence, for example, interiors of the environment, stylistic layout and so forth and external evidences, for example, building, parking place, door and a long drive-way and so on.
4. Customer ExperienceAn increasing tendency is going on towards creating extraordinary “knowledge” for customers so as to understand a competitive advantage, particularly for those within the service sector.
The concept of customer experience is hardly a new concept, for the reason that market researchers requires nurturing and focusing on the consumption experience for the past few decades. Though, this incidence has not been a necessary ingredient of the economy within the past decades.
5. Review Of LiteratureAs per Neil Borden (1964) who initially began using the phrase in 1949, the Marketing mix is a model of generating, creating and implementing marketing strategies. It focuses on the blending of various factors in such the way that each organizational and client targets area unit achieved. The important components are the marketing strategies, tactics otherwise called the ‘four Ps’, the marketing mix components are product, price, place, and promotion.
As indicated by Lauterborn (1990), the review claims that each of these factors (4 P’s) ought to similarly can be seen from a consumer’s viewpoint. As indicated by Gronroos (1994), the Marketing mix is a concept of the marketer as a “mixer of ingredients” that arrangements different method for competition and mixes them into a “marketing mix” so that a benefit capacity is advanced, or rather fulfilled.
According to Peter Doyle (2000), the study claims that the Marketing mix approach prompts to unprofitable or unappreciated decisions as a result of its financial objectives such as increasing shareholder value. It has never been clear that which criteria to use in determining the perfect Marketing mix.
According to Moller (2005), the review highlighted some key reactions against the Marketing mix system that the combination does not consider customer or client behavior but rather is internally oriented. As indicated by Fakeideas (2009), the review found that mix doesn’t think the one combination is useful for all types of elements for selling.According to Rafiq and Ahmed (2012), the review found that there is a high level of disappointment with the 4Ps, however, 4Ps believed to be most applicable for introductory marketing and consumer marketing. The outcome additionally proposes that the 7Ps system has as of now accomplished a high level of acceptance as a generic marketing mix or can say generic promoting combine.So, this paper will concentrate on the re-emergence of experience and its significance of customer experience at the present time.
6. Objectives Of The StudyTo find the inspiring element of the marketing mix model which makes the customer to use particular hotel or restaurant in Rajasthan.
To analyses impact of the people, process, price and physical evidence towards the customers.
7. HypothesisTo understand the relationship and the impacts of marketing mix on the customers, various hypotheses have been formulated.H0: There is no significant relationship among
marketing mix elements and consumer experience about the hotel and restaurant of Rajasthan.
H1: There is significant relationship among marketing mix elements and consumer experience about the hotel and restaurant of Rajasthan.
8. MethodologyRajasthan has been selected for the study. Statistical tools such as percentage analysis, weighted average rank analysis and chi-square test analysis are used for this study. The primary data was collected through survey method using interview schedules.
9. Analysis And InterpretationTable: 1 Profile of Respondents
Factor Particular No.of respondents
percen -tage
Cumulative percentage
Gender Female 86 35.84 35.84Male 154 64.16 100
7 P’s of Marketing Mix in The Selected Hotels of Rajasthan 17
Tecnia Journal of Management Studies Vol. 13 No. 1, April 2018 - September 2018
Age
Below 20 86 35.83 35.8320-35 110 45.84 81.67
36-50 44 18.33 10050 and above
0 0 0
Marital status
Married 100 41.66 41.66Unmarried 140 58.37 100
Frequency of visit
Twice a Week
62 25.83 39.99
Twice a Month
116 48.34 88.33
Twice a Year
28 11.67 100
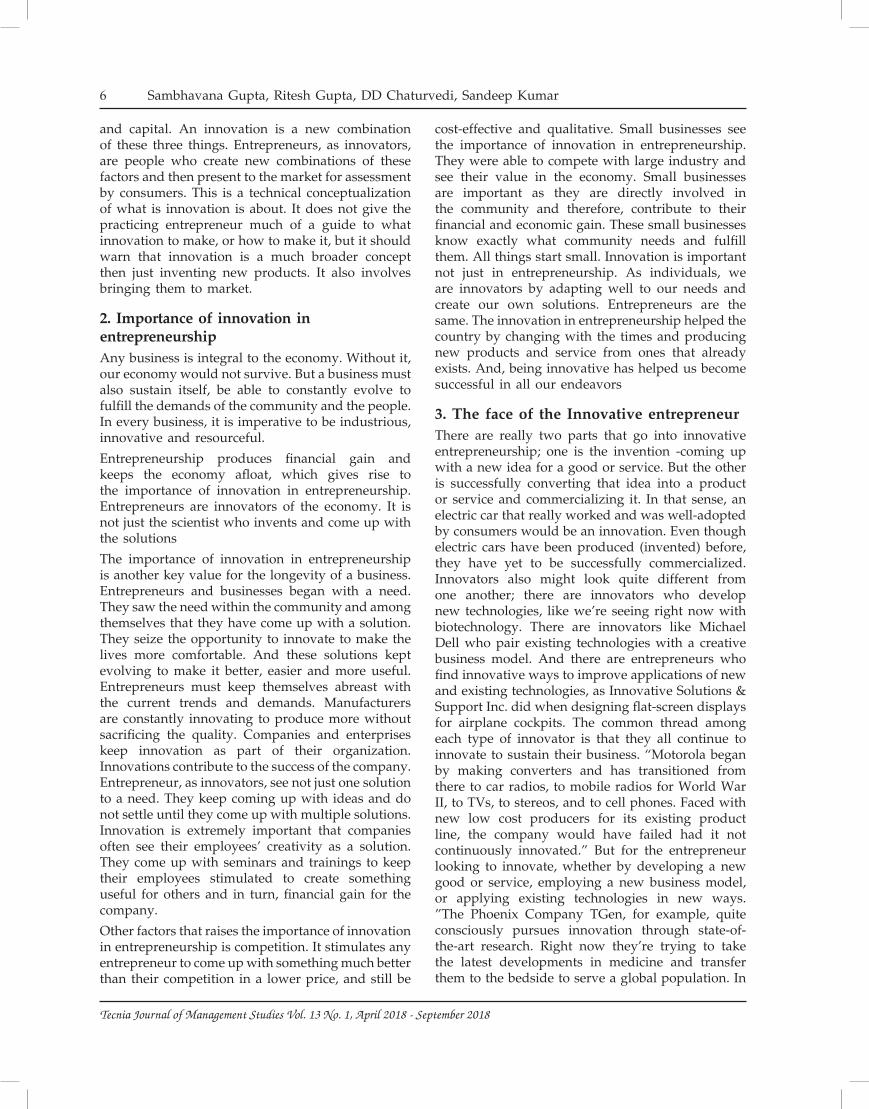
Above table 1, presented the descriptive statistics of respondents which shoes that out of 240 respondents 64.16% were male and 35.84% are female. Whereas from the various as groups 35.83% were from below 20, 45.84 from 20-35 age groups, 18.33 were from 36-50 and no one respondents were from above than 50 age groups amongst those filled questionnaire. 41.66 % were married and 58.37 were unmarried respondents. Means the frequency of unmarried respondents is higher who are using hotels for accommodation as compare to married peoples. About frequency of visits by the respondents it seen that 25.83% visited twice in a week, 48.34% visited twice in a month and 11.678% visited twice in a year for their business or service training purpose.
Table 2:- Motivating Factor among the Various Marketing Mix Elements Weighted Average Rank
Method
Variable/Rank
1 2 3 4 5 6 7 TSV AVS Ranks
Product 114 40 28 22 16 14 6 572 476 VI
Price 4 6 12 20 16 146 36 1340 1116 II
Place 6 8 4 28 16 42 136 1430 1190 I
Promotion 10 14 22 26 132 18 18 1102 920 III
Process 14 18 34 108 42 6 18 956 796 IV
People 70 128 14 10 8 6 4 512 426 VII
Physical Evidence
22 26 126 26 10 8 22 808 672 V
The table2 shows the ranks assigned to the variables of marketing mix using the weighted average ranking method. The first rank has been assigned to “Place”, the second rank to “Price”, third rank to “promotion”, fourth rank to “process”, fifth rank to “physical evidence”, sixth rank to “product” and seventh rank to “people”. That means when customers are searching the hotels they first prefer the place (Location where hotel situated they prefer their convenience) and then compares the price and so on.
Table: 3 Satisfaction Level of Marketing Mix Element
S. No.
Satisfactory level No of respondents
Percentage (%)
1 Highly satisfied 24 102 Satisfied 104 443 Neutral 86 364 Dissatisfied 18 75 Highly dissatisfied 8 3 Total 240 100
When respondents asks about their level of satisfaction towards the marketing mix using by hotels only 10% were highly satisfied, 44% were satisfied, 36% were neutral, 7% were dissatisfied and only 3% were highly dissatisfied with the marketing mix using by hotels which services they are using.
To understand the relationship between the place and price the following hypothesis has been established and analyzed by chi square parametric test.
H02: There is no significant relationship between the place and price of the marketing mix.
H12: There is significant relationship between the place and price of the marketing mix.
Table: 4 Associations
Oij Eij Oij-Eij (Oij-Eij)2 ∑ (Oij-Eij)2/Eij
100 96 4 16 0.168 9 -1 1 0.1112 15 -3 9 0.610 20.8 -10.8 116.64 5.66 1.94 4.06 16.48 8.4910 3.24 6.76 45.69 14.182 75.2 6.8 46.24 0.614 7.04 -3.04 9.24 1.318 11.74 -3.74 13.98 1.19
Total
between People and ProcessFactors Degree of
FreedomTable value
Calculated value
Relationship
Place and Price 4 9.488 16.05 Significant
Result: Table value is lesser than the calculated value, the null hypothesis is rejected and the alternative hypothesis is accepted. There is significant relationship between the place and price of the marketing mix.
Marketing mix is characterized by seven different variables such as product, price, place, promotion, people, physical evidence and process and it shows that all variable are equally important. The results illustrated in this paper remark that the hotel industry uses the traditional 4Ps and new 3Psfor the promotion of their hotels.

18 Vandana Gupta
Tecnia Journal of Management Studies Vol. 13 No. 1, April 2018 - September 2018
However, not all variables are equally weighted. In this competitive era for the marketing strategy should go one better than it will be required for the hotel industry to re-examine their tactics and strategies. If one variable out weights the other this doesn’t necessarily entail that the strategy is not effective. It can be effective, but probably does not have greater concert or the business does not consider that each variable is of equal importance on their strategy.
Specific attention has been given on all aspects of questionnaire but still due to the low response rate the results in some cases were not as expected which becomes the limitation of this study. Further research should be done with a more representative sample in order to extract more appropriate results. It was expected that the seven variables of marketing mix will have a significant impact on the average full occupancy level.
However, this was not shown on the results. This can be attributed to the fact that residence level possibly depends on other issues that were not included in the model. In addition, the average full residence level as presented on the questionnaire was reported as a binary variable.
In addition, research with financial and competitive market dealings will be valuable in order to recognize the effectiveness of the 7 P’s of marketing mix in the hotel industry. Hotel category has an impact on the use of each marketing variables.
This can be justified as their target groups may differ. As the market is very competitive it is of vital importance for specialists to take over the marketing strategies and have specific strategies in order to have the ultimate profitability.
10. Limitations of The Study• The numbers of respondents are limited to 240.
• The area of study is limited to a Rajasthan state only.
• The findings and observation are based on the respondents answer which may be affected by the personal bias.
11. Suggestion:• They may perhaps try to adopt modernization
to overcome the challenges and difficulties.
• Hotel and restaurant are responding with new offerings and pricing strategies.
• They can practice frequent enhancement and improvement in their menu and services facilities.
12. ConclusionThe hotel industry has its difficulties, from rising food costs, economic recession and changing perception about wellbeing. The real issues confronted by the hotel business include the developing eateries, wellbeing related issues, changing trends, changing consumer preferences, long service hours and benefit repatriation. There are numerous ways being received by these enterprises to defeat the difficulties. Marketing mix strategies are helpful to meet the new challenges in hotel industry.
References• Bennett, A. R. (1997). The Five Vs - A Buyer’s
Perspective of the Marketing Mix. Marketing Intelligence & Planning, 15(3), 151-156.
• Chong, K. W. (2003). The Role of Pricing in Relationship Marketing - A Study of the Singapore Heavy Equipment Spare Parts Industry, PhD Dissertation, International Graduate School of Management, University of South Australia.
• Christian Grönroos, (1994) “From Marketing Mix to Relationship Marketing: Towards a Paradigm Shift in Marketing”, Management Decision, Vol. 32 Iss: ...
• Fifield, P. and Gilligan, C. (2000) Strategic Marketing Management: Planning and Control, London, UK, Butter worth Heinemann (CIM Diploma Workbook)
• Grönroos, C. (1994). From Marketing Mix to Relationship Marketing: Towards A Paradigm Shift in Marketing. Management Decision, 32(2), 4-20.
• Hodder Education (n.d). Introduction to the Marketing Mix - Pricing. [Online] Available: http://www.hoddersamplepages.co.uk/pdfs/cceabus6.pdf.
• Kent, R. A. (1986). Faith in the four Ps: An alternative. Journal of Marketing Management, 2, 145-154.
• Kotler, Philip. 2009.PhilipKotler Marketing Group. http://www.kotlermarketing.com
• Lauterborn, R. (1990). New marketing litany: 4P’s passé; c-words take over. Advertising Age, (October 1), p. 26.
• McCarthy, E. J. (1964). Basic Marketing, IL: Richard D. Irwin.
• Möller, K. (2006). The Marketing Mix Revisited: Towards the 21st Century Marketing by E. Constantinides. Journal of Marketing Management, 22(3), 439-450.

7 P’s of Marketing Mix in The Selected Hotels of Rajasthan 19
Tecnia Journal of Management Studies Vol. 13 No. 1, April 2018 - September 2018
• Neil H. Borden; Martin V. Marshall (1959). Advertising Management: Text and Cases. Richard D. Irwin.
• Palmer, A. (2004). Introduction to Marketing - Theory and Practice, UK: Oxford University Press.
• Peter Doyle (2000), Value-based marketing: marketing strategies for corporate growth and shareholder value, Wiley, 2000, 16 Mar 2011
• T.N. Srivatsava, Shailaja Rego (2010). Business Research Methodology. Tata McGraw Hill Education Pvt. Ltd., New Delhi.
• Van Waterschoot, W. (n.d). Chapter 9: The Marketing Mix as a Creator of Differentiation, Blois: The Oxford Textbook of Marketing, Instructor’s Manual, Oxford University Press. [Online] Available: http://www.oup.com/uk/orc/bin/9780198775768/freelecturer/manual/imchap09.pdf.
• http://articles.economictimes.indiatimes.com/ keyword/marketing-mix
• http://extension.umd.edu/agmarketing/marketing- 101/mark
• http://www.theseus.fi/bitstream.

20 R P Tulsiyan, MK Gupta, Ashok Aggarwal, Rakesh Gupta
Tecnia Journal of Management Studies Vol. 13 No. 1, April 2018 - September
1. IntroductionThe world has moved from narrow banking to broad and need based banking. Customer Satisfaction has become the key to modern day successful banking. The modern day customer looks at one step solution for all his financial needs. Separation of banking and other financial roles has become outmoded now. Post Gramm-Leach-Bliley (GLB) Act, 1999 scenario has indicated the increased preference for banks to deal with other non-banking financial products. Financial liberalization and financial novelty have desegmented financial industry. Banks have now entered the untrodden path of insurance through Bancassurance.
Bancassurance means selling insurance product through banks. Bancassurance is an Amalgamation of two words, banks and insurance. Banks and insurance company came up in a partnership wherein the banks sell the tied insurance company’s insurance products to its clients. It represents the distribution of insurance products through banking channels. (Bancassurance was developed in France in 1980s and then it spread to Continental Europe, Asia and India in particular. With the recommendation of First Narasimham Committee for financial reforms, the financial landscape was reshaped. Banks scenario over the years has changed because of assimilation of
global financial markets, universialisation of banking operations, diversification of banks into non-banking activities and innovation in technology. These factors have demolished the confines existing between various financial services leading to development of new concepts like Bancassurance. Bancassurance can be defined as a partnership between banks and insurance companies, wherein insurance products are sold by banks. According to IRDA, banks act as corporate agents or brokers for insurers to distribute insurance products which include life and non-life insurance products.
Bancassurance is a system where a bank has a corporate agency with one or more insurance companies to sell its insurance products to the bank’s own customers. By selling insurance policies banks earn revenue apart from its fund based income, called fee based income or non-interest income and it is risk free income as the bank plays the role of an intermediary in Bancassurance. The bank’s customers get their choice of insurance products from their banks itself, the banks earn a revenue and for the insurance companies, its one new customer for them.
2. Review of LiteratureGoran Bergandahi (1995) has said that the expansion of Bancassurance relied on three perquisites cross
Bancassurance: convergence of BankIng and Insurance and Its ImplIcatIons on the development
of BankIng and Insurance Industry
Abstract: Bancassurance is the result of the blend of two terms, bank and insurance where insurance products are sold through banks. Now a days over 40% of insurance business is being done through Bancassurance channel where by banks earn a revenue stream call fee based income which is a risk free income and insurance companies sell their products to a large segment through their banking partner. This paper tries to understand the concept of Bancassurance and its development in India with particular highlight on the benefits earned from this model.
R P Tulsiyan*MK Gupta**Ashok Aggarwal***Rakesh Gupta****
*Prof. R P Tulsiyan, Deptt. of Commerce, Bhagat Singh College, University of Delhi**Dr. MK Gupta, Deptt. of Commerce, JLN College, Faridabad***Dr. Ashok Aggarwal, Deptt. of ABST, University of Rajasthan, Jaipur****Dr. Rakesh Gupta, Deptt. of ABST, University of Rajasthan, Jaipur

Bancassurance: Convergence of Banking and Insurance and its Implications on the Development of Banking and Insurance Industry 21
Tecnia Journal of Management Studies Vol. 13 No. 1, April 2018 - September 2018
selling through existing branch network, sale of insurance products to customer of the bank, products produced by a subsidiary to the bank. The author verified these assumptions in many of the banks in Europe. The author also found that, where customers per branch are sufficiently large and if cross-selling ratio is acceptable, in that particular branch, with investment appraisal assistance Bancassurance came out successful.
Swiss Re (2002) in its study on Asia has pointed out that Bancassurance penetration is expected to tangibly increase in Asia over next 5 years and this has been greatly proved by 2010.
Vineet Agarwal (2004) has observed that the key issues faced by the banking sector today are intense competition along with falling interest margin in banks creates an urgent need for developing sophisticated financial products and innovations. Insurance has come as an ideal option for the banks. It fulfills the major requirements for a successful insurance business viz.,asset management and investment skills, distribution and capital adequacy. The author made a note in his study that French banks, those pre-dominantly choose to start Bancassurance market shares.
Knight (2006) has said that Bancassurance promises to combine insurance companies’ competitive edge in the production of insurance products with banks edge in their distribution through their vast retail networks.
Rao (2006) has mentioned that Bancassurance is a new delivery channel which is revolutionizing the process of selling insurance products with the wide banking network especially in rural areas.
Popli and Rao (2009) has opined that after opening up of the Insurance sector, new opportunities have emerged for insurance and banking sectors in India. In such a scenario Bancassurance is a very successful phenomenon for insurance distribution.
Sreedharan G and Allimuthu S. (2009) have discussed the benefits of Bancassurance for the bankers, insurance companies and customers.
Nandita Mishra (2012) has listed out the issues and problem of Bancassurance in India. Lack of interest and motivation among the bank staff in promoting Bancassurance products was the major issue. Transactional model and Relationship-model are used to sell the Bancassurance products.
3. Objectives of the Study• To examine Bancassurance in India
• To evaluate the benefits of Bancassurance
4. Research MethodologyThe present study is exploratory in nature and is purely based on secondary data. The data has been collected form secondary sources such as journals, text books, magazines, RBI and IRDA Reports, etc.
5. Bancassurance in IndiaThe Indian insurance industry is majorly driven by higher disposable incomes of the people, the demographical variety in the country, government efforts, and launch of new products, lesser complexities and entry of foreign players. This sector is not only increasing India’s economic growth figures, but has proved as an important financial segment. After the recommendations of the Malhotra Committee Report, in 1999, the Government constituted the Insurance Regulatory and Development Authority (IRDA) as an autonomous body to regulate and develop the insurance industry. The IRDA opened up the market in August 2000 with the invitation for application for registrations from insurance companies. Today there are about 28 non-life insurance companies 24 life insurance companies and in the country. With opening up of the economy, the insurance companies perceive the immensely potential Indian market and are running to establish multiple distribution channels such as agency, brokers, Bancassurance and direct marketing. Bancassurance is coming up as one of the strongest distribution channels of insurance products. Banks have become major distribution channels for insurance companies. The insurance companies take the advantage of banks as distributors at a low cost. There are more than 80,000 banks out of which 65% of the branches are located in rural and semi urban areas and the rest 35% in urban and metropolitan areas. Apart from commercial banks, India also has a large network of rural cooperative and urban cooperative banks which acts as an impetus for Bancassurance. In India banking and insurance sectors are regulated by two different apex bodies, Reserve Bank of India for banks and Insurance Regulatory and Development Authority (IRDA) for insurance sector. As Bancassurance is the amalgamation of the two sectors, it comes under the purview of both the regulators. Each of them has elaborate and distinctive rules, restrictions and guidelines.
6. RBI has the following conditionsAny scheduled commercial bank can undertake insurance business as agent of insurance companies on fee basis, without any risk participation and

22 R P Tulsiyan, MK Gupta, Ashok Aggarwal, Rakesh Gupta
Tecnia Journal of Management Studies Vol. 13 No. 1, April 2018 - September
the subsidiaries of banks will also be allowed to undertake distribution of insurance products on agency basis. The eligibility criteria for joint venture participant are as under:
1. The bank’s owned funds shall not be less than Rs.500 crore.
2. The NPA should not be more than 1% of the total advances.
3. The bank should have registered net profits for 3 continuous years.
4. The performance of subsidiaries should be satisfactory.
5. The net worth of the bank shall not be less than 30% of aggregate risk weighted assets on balance sheet and risk adjusted value of off balance sheet items.
7. Distribution Models1. Distribution agreements: Banks act as tied agents
and sell the insurance products of one insurer extensively on standalone basis or together with other bank products.
2. Strategic Alliance: In this case, Banks are involved in product development, providing services and channel management in insurance business.
3. Joint Venture: Here large banks with powerful customer database partner with large insurance companies with strong and good products and channel experience. This is done in order to develop a powerful distribution model.
4. Financial Service Group: Under this, an insurance company can either build or buy a bank or a bank can build or buy an insurance company.
5. Bank Referral: Here the banks instead of issuing policies to the customers, they furnish the database to the insurance company partners. The insurance companies convince, sell and issue the policies to the customers and pay commission to banks for referral. Bancassurers have not only targeted the mass market but have also carefully begun to segment the market which has resulted in the tailor-made or rather perfect products for each segment.
8. Benefits of BancassuranceBancassurance has brought with itself a new age insurance service through banking channel and has made the boundaries between financial services vanish. Bancassurance has various advantages for banks and insurance companies.
9. Benefits to Banks:• The cut throat competition has put pressure on
banks to look for alternate avenues for Income generation and Bancassurance gives banks the opportunity to earn fee income.
• Retention of customers has become a major problem for banks and bancassurance helps in retaining customer by providing financial services at their door step as multiple services at one place satisfies customers.
• Bancassurance helps banks to increase their returns on assets (ROA). This is possible when banks cross sell financial products to existing customers and leverage their distribution and processing capabilities to achieve profitable operating expense ratio.
• Banks have a sizeable customer base and can effectively use their manpower to cross sell insurance products without any extra expenditure on sales.
• Banks through their multiple communication channels like direct mails, ATMs, telemarketing, etc, can market the insurance products to both existing and new customers also.
• As Bancassurance is a personalized medium of selling insurance products, it has helped to penetrate the untapped middle income group.
10. Benefits to Insurance Companies• Insurance Company through banking network
can reach to more customers.
• Varieties of products offered by insurance companies reduce the risk and increase the opportunities to tap more customers.
• The insurance company reaps benefits from the trustworthy image and reliability that customers have with their banks.
• An insurance company can establish itself more quickly in a new market by using a local bank’s existing network.
11. ConclusionLow (2004) has rightly pointed out that, the changing mindset is cascading through the banking sector in India and this would be a right time for banks to resort to Bancassurance, especially in the context of proactive policy environment of regulatory authorities and the Government. The success of Bancassurance relies on customer relationship management of the bank and on IT services of banks. So far Bancassurance in India has been a win-win

Bancassurance: Convergence of Banking and Insurance and its Implications on the Development of Banking and Insurance Industry 23
Tecnia Journal of Management Studies Vol. 13 No. 1, April 2018 - September 2018
model for all, because insurance companies are able to sell more and reach a wider database. Banks with the same infrastructure and no additional resources are able to earn fee base income. And customers are able to get all financial services at one stop. Yet the credibility of this model will come into question if there is mis-selling and it will impact the bank-customer relationship which has developed over the years. So there is definitely a need for caution to be exercised by the bankers. Yet, Bancassurance model is the only way by which insurance companies can reach the untapped rural market benefiting bankers, insurance company and customers and India has a huge potential for growth of Bancassurance.
References• Aggarwal, Vineet. (2004). Bancassurance:
Concepts, Framework and Implementations. The Journal of Insurance Institute of India, July-Dec 2004, 34 –51.
• Barathi, C. and Balaji, C.D. (2011). Innovative strategies to catalyze growth of Indian Life insurance sector – an analytical review. Indian Journal of Commerce and Management studies, Vol – II, 136-145.
• Barua, Abheek. (2004). Bancassurance–New Concept catching up fast in India. The Chartered Accountant, June 2004, 1348 –1351.
• Chaudhary, Amitesh. (2004). Bancassurance –The Most Challenging Insurance Distribution Channel with special reference to SBI. Management Accountant, April 2004.
• Gupta, Mukul. (2006). Bancassurance: Taking the Lead-online edition of Hindu Business Line
• Krishnamurthy, R. (2003). Bringing Bancas-surance to India – Blue prints for Success. IRDA Journal, Aug, 20 - 23.
• Lalit K pain and Sukhmaya Swain (2013)–Bancassurance and Indian Banks. IJRDMR, Vol-II, Issue 1, 2013.
• Malpani, Sudarshan. (2003). Many roads to Bancassurance. IRDA Journal, Aug, 24-25.
• Morris Graham, “Bancassurance in India–the seeds are sown–www. TSONWYATT.com
• Neelamegam, R. and Veni, K. Pushpa. (2009) .Bancassurance - An Emerging Trend in Indian service Sector, Indian Journal of Marketing, October, 50-54.
• Parakala, V.S. Maharaja Rao. (2004). Alternative channels of Insurance Distribution in India, SAJMMR Volume 2, Issue 7 (July, 2012) ISSN 2249-877X South Asian Academic Research Journals http://www.saarj.com - 143.

24 Madhavendra Nath Jha, Urvashi Ghai Khosla
Tecnia Journal of Management Studies Vol. 13 No. 1, April 2018 - September 2018
1. IntroductionInternationally, the Indian higher education sector is the third largest, with an extensive network of more than 900 universities and 50,000 higher education institutes and is expanding with higher pace in light of growing demand for quality education in the country and abroad. Further, India also has the world’s largest population in the age bracket 18 to
23 years (eligible population for higher education) highlighting the large addressable market for this sector and harnessing potential for human capital.
Indian higher education sector is a mix of government-operated & privately operated educational institutions in India, highly influenced by various government schemes and policies launched primarily to improve the quality of education. According to
a descrIptIve study on factors affectIng the QualIty of the IndIan hIgher educatIon
Abstract: In the ever-increasing overall growth curve of the innovation & industry, especially since last decade, Higher Education plays the most crucial role to meet and match the requirement of the former with enhanced quality & quantity of its output globally. In this paper, the problems and prospects of the Indian Higher Education have been highlighted and analysed. The study found that the Higher Education sector has witnessed an increase in its institutional capacity from the years since 2011-12 & onward. The study has observed the fact that in-spite of the enhanced overall GER moving towards achieving 30% GER objective by 2030, the GERs of women and backward castes is still on lower side comparing to national average. The study further observed the truth that the challenges of higher education have been caused due to the low pace of improvement in GER, lack of infrastructure, lopsided college density, under-utilisation of private colleges, continuous deterioration in the Pupil Teacher Ratio, under focused research, a smaller number of universities comparing even some major countries. Though the Indian higher education system continues to demonstrate many structural shortcomings which in turn create challenges in meeting future expectations, which can be met by reforming the system by changing policy with the consent of all stakeholders. Challenges have been created by structural shortcomings of the Indian higher education which can be met by changing policy and effective implementation thereof. Therefore, this paper is mainly focused on the overall scenario of higher education in India.
Keywords: Higher Education
Madhavendra Nath Jha*Urvashi Ghai Khosla**
* Dr. Madhavendra Nath Jha, Professor, Delhi Institute of Advanced Studies, Approved by AICTE and Affiliated with GGSIP University, New Delhi. ** Dr. Urvashi Ghai Khosla , Assistant Professor, Delhi Institute of Advanced Studies, Approved by AICTE and Affiliated with GGSIP University, New Delhi.

A Descriptive Study on Factors Affecting the Quality of the Indian Higher Education 25
Tecnia Journal of Management Studies Vol. 13 No. 1, April 2018 - September 2018
various experts, a majority of the graduates from universities are not easily employable. In order to enhance the quality of Indian higher education, certain specific institutions have been levelled as the Institutes of National Importance (INI). Further, due to an increasing competition coupled with the increasing need to provide quality education and generate positive learning outcomes, the Indian higher education sector is slowly but steadily moving on the reforms track, which propelled & witnessed a paradigm shift from its market size from Rs. 2230 (billion) market size in 2016-17 to Rs. 3100 (billion) in 2019-20.
2. Problem StatementWhy the Indian higher education system seems clueless to match and meet the requirement of the industry & expectations of the job market and what are those factors which affect overall quality performance of this sector comparing to major countries?
3. Review of LiteratureNational Knowledge Commission Report (2006) pointed out that “the existing framework, rather than fostering accountability, constrains the supply of good-quality institutions whilst excessively regulating the existing institutions in the wrong places and is not conducive to innovation or creativity”. These findings are backed up by another report which describes the Indian higher education sector as: ‘Over-regulated and under-governed’. At the same time, quantity expansion has also been grossly inadequate, making the challenges daunting on dual fronts of quantity and quality.
NASSCOM McKinsey Report (2005) pointed out that those employers stating their dissatisfaction with the quality of graduates. There are jobs — in the IT sector, for instance — but not enough qualified engineers to fill them.
Inadequate number of universities have been damaging the quality of higher education in India. On the 29th of November 2006, the Chairman National Knowledge Commission wrote to the Prime Minister, recommending 1500 universities from India. Again, 2 years later, in 2008, Yasphal Committee recommended 1500 universities from India but just crossed 900 universities after 10 years of recommendation by bona-fide commission/committee constituted by the GoI.
Chief Human Resources. ICICI prudential Life Insurance Company Ltd, Judhajit Das, opined that “The issue of employability is cantered on two
challenges. The first one is lack of access to education and skills, and the second is rigour in education quality standards. Calculated investment and new technology can take care of the first issue. The second challenge is more about quality of students which results in aspiration mismatch between skills and job/salary expected”.
International educator, Philip G. Altbach expressed during an interview by the Business Standard on December 25, 2012 that “India is a world-class country without world-class universities”. He also opined that “The rise in the number of part-time teachers and the freeze on new full-time appointments in many places have contributed to a decline in the commitment and morale of the academic profession.”
India is facing an emergency situation in the higher education segment, according to the India Labour Report by TeamLease Services (2013), more than half of the young Indians suffer from some degree of skill-deprivation. The study also showed that non-availability of courses, inadequate infrastructure facilities, low college enrolment, employability crisis, inadequate financial resources, lack of flexibility of education sector and autonomy to the institutions among others have dented efforts in improving the quality and scale of education, employability and employment. The study also states that the challenges of higher education been caused due to of unskilled labour and lack of flexibility of the education sector.
(Business Standard, January-20, 2013)
Later, the authenticity of the problem has been reflected by Pavan Agrawal, then Secretary, Higher Education of India that “Indian higher education system is lack of competition and culture” (Agarwal P., 2015).
An article in the reputed newspaper published having contents as “India needs a world-class higher educational system. Between 1950 and 2014, the number of universities in India increased by 34 times. And, between 1950 and 2013, colleges increased by 74 times”. The Economic Times, Indo-Asia News Agency, Oct 11, 2018.
4. Objectives of the Study• To evaluate the Growth of higher education
enrolment/teaching staff/university/colleges/ students
• To examine the college density and location of the major institutions
• To study inter-state & inter-national (comparison

26 Madhavendra Nath Jha, Urvashi Ghai Khosla
Tecnia Journal of Management Studies Vol. 13 No. 1, April 2018 - September 2018
with USA & China) Gross Enrolment Ratio
• To evaluate the Pupil-Teacher Ration
• To evaluate the foreign students enrolment
• To examine the world ranking of Indian universities & status of PhD enrolment
5. MethodologyThe study is mainly based on secondary data, collected from All India Survey on Higher Education, Ministry of Higher Education- Government of India, University Grants Commission reports, Reports of various committee/commission, Opinions of experts and other published and unpublished reports which is relevant to the study. Simple statistical tools like percentages and averages have been used to interpret & analysed the secondary data along-with Tables, Charts & Graphs have been used to make the collected data detailed.
6. Interpretation, Analysis & Observation
1. Growth of Enrolment, Teaching staffs, Universities, Colleges & Stand-alone Institutions:Growth of Higher Education is directly proportionate to the growth of student-enrolment, universities, colleges, stand-alone institution and teaching staffs.
This research has revealed the fact that the student-
enrolment, teaching staffs, universities & colleges have registered growth of 26% (7.6 million), 3% (37302), 41% (261) & 12% (4142) respectively from 2011-12 to 2017-2018, on the other hand stand-alone institutions has shrank down by 12% (1345) as per TABLE-1 & Chart- 1A & 1B.
In-spite of 26 % growth in the enrolment from 2011-12 to 2017-18, India has registered merely 3% increase in the number of teaching staff from 2011-12 to 2017-18. In this seven years phase, male teachers strength gone down by 0.8% whereas female teachers strength has gone up, meagrely, by 9.8% as per TABLE-2 & Chart- 2A.
It has been observed that the 41% growth in the number of total universities comprises the maximum growth 71% in the Medical followed by 66% in General (Management etc) Universities, 42% in Technical (Engineering & allied), 40% in Agriculture and 20% in Law as per TABLE-3 & Chart-3A.
On interpreting the data related to 26% enrolment growth, as enumerated above, it has been established, vide TABLE-4 & Chart- 4A, that though the enrolment in the general category has declined by 9.92 % from 2011-12 to 2017-18, other categories like Scheduled Cast, Scheduled Tribe, OBC & Minorities have registered growth of 2.20%, 0.70%, 4.90% & 2.12% respectively during the same time period of seven years.
TABLE- 1:Enrolment, Universities, Colleges & Stand-Alone Institutions
2011-12 2012-13 2013-14 2014-15 2015-16 2016-17 2017-18 % Change
Total Enrolment (‘00000) 292 302 323 342 346 357 368 26
Total Universities (Unit) 642 667 723 760 799 864 903 41
Total Colleges (‘00) 349 355 366 385 391 400 391 12
Total Stand Alone (‘00) 114 116 117 123 119 117 100 (-)12

A Descriptive Study on Factors Affecting the Quality of the Indian Higher Education 27
Tecnia Journal of Management Studies Vol. 13 No. 1, April 2018 - September 2018
Table:2 Teaching Staffs
2011-12 2012-13 2013-14 2014-15 2015-16 2016-17 2017-18 % Change
Teaching Staffs (‘000)
1,247 1,309 1,368 1,473 1,519 1,366 1,285 3
Male (‘000) 761 798 834 899 926 833 745 (-)0.8
Female (‘000) 487 510 533 575 592 533 540 9.8Source: All India Survey on Higher Education (AISHE)
Table:3 Total Universities with Programme-wise Break-up
2011-12 2012-13 2013-14 2014-15 2015-16 2016-17 2017-18 % Change
Total Universities 642 667 723 760 799 864 903 41
General 301 375 398 430 459 488 500 66
Technical 88 90 90 90 101 114 126 42
Agriculture & Allied
50 61 61 61 64 67 70 40

28 Madhavendra Nath Jha, Urvashi Ghai Khosla
Tecnia Journal of Management Studies Vol. 13 No. 1, April 2018 - September 2018
Medical 34 38 43 45 50 52 58 71
Law 18 18 20 20 20 19 22 22
Others 78 78 74 78 78 85 106 36Source: All India Survey on Higher Education (AISHE)
Table: 4 Category-wise Break-up of Enrolment
2011-12 2012-13 2013-14 2014-15 2015-16 2016-17 2017-18 % Change
General Enrolment % 47.62 45.5 43.6 42.56 41.05 39.2 37.7 (-)9.92
Scheduled Casts Enrolment %
12.2 12.8 13.1 13.44 13.9 14.2 14.4 2.20
Scheduled Tribes Enrolment %
4.5 4.4 4.6 4.8 4.9 5.1 5.2 0.70
OBC Enrolment % 30.1 31.2 32.4 32.8 33.75 34.4 35 4.90
Minorities Enrolment %
5.58 6.1 6.3 6.4 6.4 7.1 7.7 2.12
Source: All India Survey on Higher Education (AISHE)

A Descriptive Study on Factors Affecting the Quality of the Indian Higher Education 29
Tecnia Journal of Management Studies Vol. 13 No. 1, April 2018 - September 2018
Analysing the data mentioned in the TABLE-5 & depicted in the Chart- 5A/5B/5C, it has been interpreted that growth in the UG enrolment is not tuning the pace of growth pertaining to overall enrolment. UG enrolment has registered negative growth after 2011-12 & 2012-13 so far percentage of the total enrolment is concerned but numbers of enrolment have gone up every year comparing to its preceding year from 2012-13 up to 2017-18. Further it is revealed that enrolment percentages in the major programmes like Arts/Humanity/Social science, Engineering & Technology and Commerce have registered negative growth but Science has kept its pace of increasing numbers and percentage of enrolment both continuously from 2011-12.
Table:5 Total Enrolment vs UG Enrolment
Total Enrolment (Million) 29.2 30.2 32.3 34.2 34.6 35.7 36.8
UG Enrolment (Million) 23.36 24.16 25.52 27.15 27.44 28.35 29.15
UG Enrolment % 80.00 80.00 79.00 79.40 79.30 79.40 79.20
A r t s / H u m a n i t y / S o c i a l science %
40.00 41.00 40.40 40.00 40.00 38.00 36.40
Engineering & Technology % 17.00 17.30 17.40 16.00 15.60 14.70 14.10
Commerce % 15.00 14.40 13.90 14.00 14.10 14.10 14.10
Science % 12.00 12.60 13.80 15.00 16.00 16.70 17.10
Source: All India Survey on Higher Education (AISHE)

30 Madhavendra Nath Jha, Urvashi Ghai Khosla
Tecnia Journal of Management Studies Vol. 13 No. 1, April 2018 - September 2018
2. College density: It is the number of colleges per lakh eligible population. Southern states of India have higher college density, almost double of the national average since 2011-12 to 2017-18. On the other hand Bihar & Jharkhand have registered the lowest college density, which has been almost one-fourth of the national average during same period of seven years. On comparing data, it has revealed that the college density curves at all India level and also in the states like Bihar & Jharkhand are moving up but the same in the south Indian states is moving down as per the TABLE- 6 & Chart- 6A.
It indicates that the country is heading towards evenly-poised college density since 2011-12 but at very slow pace.
Table: 06: COLLEGE DENSITY
2011-12 2012-13 2013-14 2014-15 2015-16 2016-17 2017-18
College Density(All India)
25 25 26 27 28 28 28
B o t t o m ( B i h a r /Jharkhand)
6 6 7 7 7 7 7
T o p ( P u d u c h e r r y /Telangana/Karnataka)
64 62 60 60 60 59 51
Source: All India Survey on Higher Education (AISHE)

A Descriptive Study on Factors Affecting the Quality of the Indian Higher Education 31
Tecnia Journal of Management Studies Vol. 13 No. 1, April 2018 - September 2018
3. Location of University/College/Institution: Most of the private-unaided colleges, maximum percentage of college in a single district and top 50 nationally ranked universities are situated in southern states. Private-unaided college constitutes 82% & 76.2% of total colleges in Andhra Pradesh/Telangana and Tamil Nadu respectively. Only 13% (appx) of total colleges in Bihar/Assam is Private-unaided college. Moreover, top 50 districts, mostly from south India, have been provided with 33.5% of overall university/colleges in the country as per the TABLE- 7 & Chart- 7A.
TABLE- 7
2017-18
Private-unaided college % in Andhra Pradesh/Telangana 82
Private-unaided college % in Tamil Nadu 76.2
Private-unaided college % in Bihar/Assam 13
Overall University/College % in Top 50 Districts out of 723 Districts 33.5
Maxm % of College in a Single District Urban Bangalore 2.29
Universities % amongst Top 50 Universities fall in 4 States of South India 40
Source: All India Survey on Higher Education (AISHE)
4. Private Colleges (Aided/Unaided):Study has established, as per the TABLE- 8 & Chart- 8A, that Private colleges (aided/un-aided) are not catering the students in proportion to their size in the higher education industry. One way of interpretation may be that these colleges remained un-utilised around 18% (on & average) every year from 2011-12 to 2017-18.
Table: 8 Private Colleges vs Enrolment
2011-12 2012-13 2013-14 2014-15 2015-16 2016-17 2017-18
Private Sector Colleges (Aided/Unaided) %
73 75 75 77 78 78 78
Catering % of Total Enrolment 61 63 65 67 67 67 67
Source: All India Survey on Higher Education (AISHE)
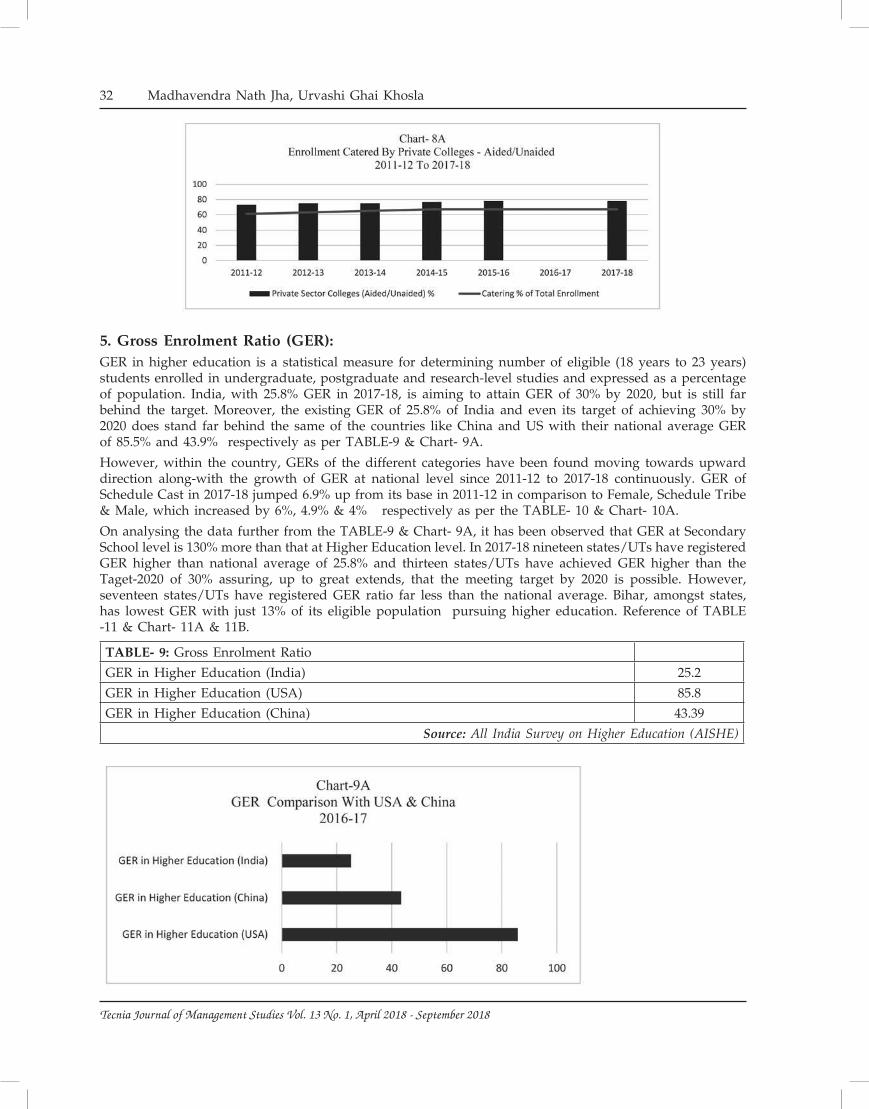
32 Madhavendra Nath Jha, Urvashi Ghai Khosla
Tecnia Journal of Management Studies Vol. 13 No. 1, April 2018 - September 2018
5. Gross Enrolment Ratio (GER): GER in higher education is a statistical measure for determining number of eligible (18 years to 23 years) students enrolled in undergraduate, postgraduate and research-level studies and expressed as a percentage of population. India, with 25.8% GER in 2017-18, is aiming to attain GER of 30% by 2020, but is still far behind the target. Moreover, the existing GER of 25.8% of India and even its target of achieving 30% by 2020 does stand far behind the same of the countries like China and US with their national average GER of 85.5% and 43.9% respectively as per TABLE-9 & Chart- 9A.
However, within the country, GERs of the different categories have been found moving towards upward direction along-with the growth of GER at national level since 2011-12 to 2017-18 continuously. GER of Schedule Cast in 2017-18 jumped 6.9% up from its base in 2011-12 in comparison to Female, Schedule Tribe & Male, which increased by 6%, 4.9% & 4% respectively as per the TABLE- 10 & Chart- 10A.
On analysing the data further from the TABLE-9 & Chart- 9A, it has been observed that GER at Secondary School level is 130% more than that at Higher Education level. In 2017-18 nineteen states/UTs have registered GER higher than national average of 25.8% and thirteen states/UTs have achieved GER higher than the Taget-2020 of 30% assuring, up to great extends, that the meeting target by 2020 is possible. However, seventeen states/UTs have registered GER ratio far less than the national average. Bihar, amongst states, has lowest GER with just 13% of its eligible population pursuing higher education. Reference of TABLE -11 & Chart- 11A & 11B.
TABLE- 9: Gross Enrolment Ratio
GER in Higher Education (India) 25.2
GER in Higher Education (USA) 85.8
GER in Higher Education (China) 43.39
Source: All India Survey on Higher Education (AISHE)

A Descriptive Study on Factors Affecting the Quality of the Indian Higher Education 33
Tecnia Journal of Management Studies Vol. 13 No. 1, April 2018 - September 2018
Table: 10: Gross Enrolment Ratio
2011-12 2012-13 2013-14 2014-15 2015-16 2016-17 2017-18
GER in Senior Secondary (17-18) %
45.9 40.8 52.2 54.2 56.2 58 60
GER in Higher Education (18-23) %
20 21.5 23 24.3 24.5 25.2 25.8
Male 22.1 22.7 23.9 25.3 25.4 26 26.3
Female 19.4 20.1 22 23.2 23.5 24.5 25.4
Scheduled Cast 14.9 16 17.1 19.1 19.9 21.1 21.8
Scheduled Tribe 11 11.1 11.3 13.7 14.2 15.4 15.9
Source: All India Survey on Higher Education (AISHE)
Table:11 GROSS ENROLLMENT RATION IN HIGHER EDUCATION (18-23 YEARS)
SN State/UT State GER in ascending
order </= target-2020
SN State/UT State GER in ascending
order =/> target-2020
1 Daman and Diu 5.2 TARGET - 2020 30
2 Lakshadweep 7.6 25 Punjab 30.3
3 Dadar & Nagar N 9.1 26 AP 30.9
4 Bihar 13 27 Maharashtra 31.1
5 Nagaland 17.8 28 Manipur 31.8
6 Jharkhand 18 29 Telangana 35.7
7 Assam 18.2 30 Kerala 36.2
8 Chhattisgarh 18.4 31 Uttarakhand 36.3
9 West Bengal 18.7 32 Sikkim 37.4
10 Gujarat 20.1 33 HP 37.9

34 Madhavendra Nath Jha, Urvashi Ghai Khosla
Tecnia Journal of Management Studies Vol. 13 No. 1, April 2018 - September 2018
11 Tripura 21.2 34 Pondicherry 45.4
12 MP 21.2 35 Delhi 46.3
13 Rajasthan 21.7 36 Tamil Nadu 48.6
14 Andaman & Nicobar 21.8 37 Chandigarh 56.4
15 Odisha 22
16 Mizoram 22.9
17 Meghalaya 24.7
18 ALL INDIA 25.8
19 UP 25.9
20 J & K 27.7
21 Karnataka 27.8
22 Goa 28
23 Haryana 28.7
24 Arunachal Pradesh 29.7
TARGET – 2020 30
Source: All India Survey on Higher Education (AISHE)

A Descriptive Study on Factors Affecting the Quality of the Indian Higher Education 35
Tecnia Journal of Management Studies Vol. 13 No. 1, April 2018 - September 2018
6. Pupil Teacher Ratio (PTR): PTR is a statistical ratio to measure the availability of teaching staffs for apportioning the number of students intake. Higher the percentage, lower the availability of teachers for students.
Study has revealed that the situation is alarming due to declining national average from 21% in 2011-12 to 25% in 2017-18. Baring Sikkim & Tamil Nadu, all states and national average have registered continuous deterioration, varying from 7.14% (Kerala & Goa) to 93.33% (UP) as detailed out in the TABLE- 12 & Chart- 12A.
Table:12 Pupil Teacher Ratio (PTR)
States / All India 2011-12 2017-18 % Change
Sikkim 14 14 0
Tamil Nadu 15 15 0
Kerala 14 15 7.14
Goa 14 15 7.14
Karnataka 13 16 23.08
Andhra Pradesh 15 18 20
All India 21 25 19.05
Jharkhand 40 56 34.78
UP 30 58 93.33
Bihar 43 61 41.86
Source: All India Survey on Higher Education (AISHE)
7. Number of Foreign Students: There is an improvement in number of foreign students enrolled —46144 in 2017-18 from 33151 in 2011-12, reflecting a surge of around 40% but it is still falling far short of number of foreign students studying in China, where 2,10,000 enrolled for the higher education in 2016.
Number of countries from where these students come to India for higher studies have also increased from 155 in 2011-12 to 166 in 2017-18.
In-spite of the quantitative improvement in the intake of foreign students, the qualitative improvement has yet to be attained as maximum source of enrolment, around 64% in 2017-18, is from neighbouring countries, African and Middle East countries of which only Nepal constitutes 25% followed by Afghanistan (9.5%),

36 Madhavendra Nath Jha, Urvashi Ghai Khosla
Tecnia Journal of Management Studies Vol. 13 No. 1, April 2018 - September 2018
Bhutan (4.3%), Sudan (4.8%), Nigeria (4%), Bangladesh/Iran (3.4%), Yemen (3.2%), US (3.1%), Sri Lanka(2.7% ) etc. Detailed have been worked out in TABLE- 13/14 and Chart- 13A/14A.
Table:13 Foreign Students
2011-12 2012-13 2013-14 2014-15 2015-16 2016-17 2017-18
Foreign Students Enrolment (‘00)
332 348 395 423 454 476 462
No of Countries Foreign Students from
155 160 158 164 165 162 166
% of Students from Top 10 countries, mostly neighbours
64 64 65 64 62 62 63.4
Highest Share of a Single Country (Nepal) %
19 21 21 21 21 24 25
Source: All India Survey on Higher Education (AISHE)
Table: 14 Foreign Students
2017
Nepal 25
Afghanistan 9.5
Sudan 4.3
Bhutan 4.8
Nigeria 4
Bangladesh 3.4
Iran 3.4
Yemen 3.2
USA 3.1
Sri Lanka 2.7
Source: All India Survey on Higher Education (AISHE)

A Descriptive Study on Factors Affecting the Quality of the Indian Higher Education 37
Tecnia Journal of Management Studies Vol. 13 No. 1, April 2018 - September 2018
8. Gender Parity Index (GPI): GPI is calculated as quotient of number of females by number of males enrolled. GPI equal to 1 indicates balanced, value less than 1 indicated disparity in favour of males.
India has registered its best performance on the GPI in last seven years, 0.97 in 2017-18 from 0.88 in 2011-12. GPI in Scheduled Cast & Scheduled Tribe categories have also improved almost in the same pace. In thirteen states — Chandigarh, Delhi, Goa, Haryana, Punjab, Himachal Pradesh, UP, Karnataka, Meghalaya, J&K, Sikkim and Kerala — women in higher education have outnumbered men as per the TABLE- 15/16 & Chart- 15A/16A.
Table:15 Gender Parity Index
2011-12 2012-13 2013-14 2014-15 2015-16 2016-17 2017-18
Gender Parity Index - All India 0.88 0.89 0.92 0.92 0.92 0.94 0.97
Scheduled Cast 0.88 0.89 0.92 0.91 0.91 0.93 0.96
Scheduled Tribe 0.78 0.79 0.81 0.81 0.83 0.85 0.87
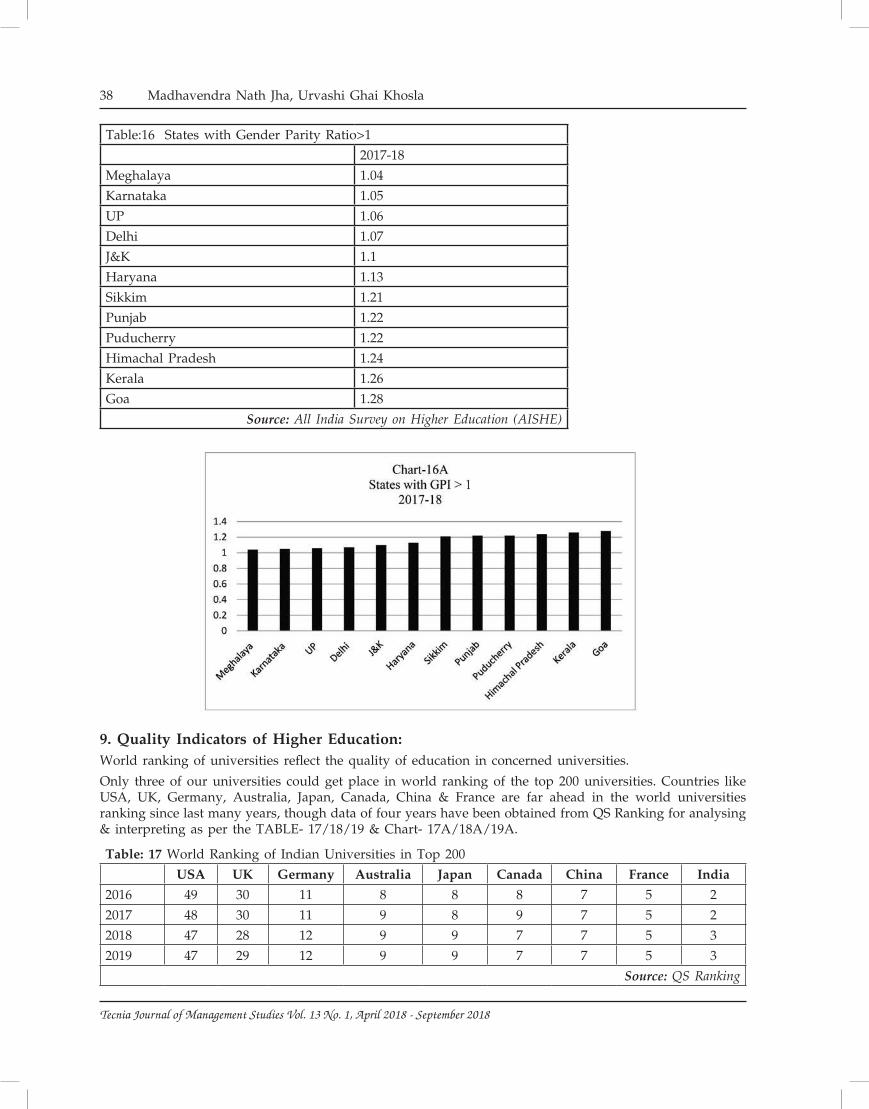
38 Madhavendra Nath Jha, Urvashi Ghai Khosla
Tecnia Journal of Management Studies Vol. 13 No. 1, April 2018 - September 2018
Table:16 States with Gender Parity Ratio>1
2017-18
Meghalaya 1.04
Karnataka 1.05
UP 1.06
Delhi 1.07
J&K 1.1
Haryana 1.13
Sikkim 1.21
Punjab 1.22
Puducherry 1.22
Himachal Pradesh 1.24
Kerala 1.26
Goa 1.28
Source: All India Survey on Higher Education (AISHE)
9. Quality Indicators of Higher Education:World ranking of universities reflect the quality of education in concerned universities.
Only three of our universities could get place in world ranking of the top 200 universities. Countries like USA, UK, Germany, Australia, Japan, Canada, China & France are far ahead in the world universities ranking since last many years, though data of four years have been obtained from QS Ranking for analysing & interpreting as per the TABLE- 17/18/19 & Chart- 17A/18A/19A.
Table: 17 World Ranking of Indian Universities in Top 200
USA UK Germany Australia Japan Canada China France India
2016 49 30 11 8 8 8 7 5 2
2017 48 30 11 9 8 9 7 5 2
2018 47 28 12 9 9 7 7 5 3
2019 47 29 12 9 9 7 7 5 3
Source: QS Ranking

A Descriptive Study on Factors Affecting the Quality of the Indian Higher Education 39
Tecnia Journal of Management Studies Vol. 13 No. 1, April 2018 - September 2018
Table:18 Ph.D
2011-12 2012-13 2013-14 2014-15 2015-16 2016-17 2017-18
PhD Enrolment % of Total Enrolment
0.50% 0.40% 0.40% 0.34% 0.40% 0.40% 0.50%
PhD Degree awarded 21,544 23,650 23861 21,830 24,171 28779 34400
Male 13748 14855 14,223 13,252 14,887 16,274 20179
Female 7796 8775 9638 8,578 9,284 12,505 14221
Source: All India Survey on Higher Education (AISHE)/ MHRD/ UGC
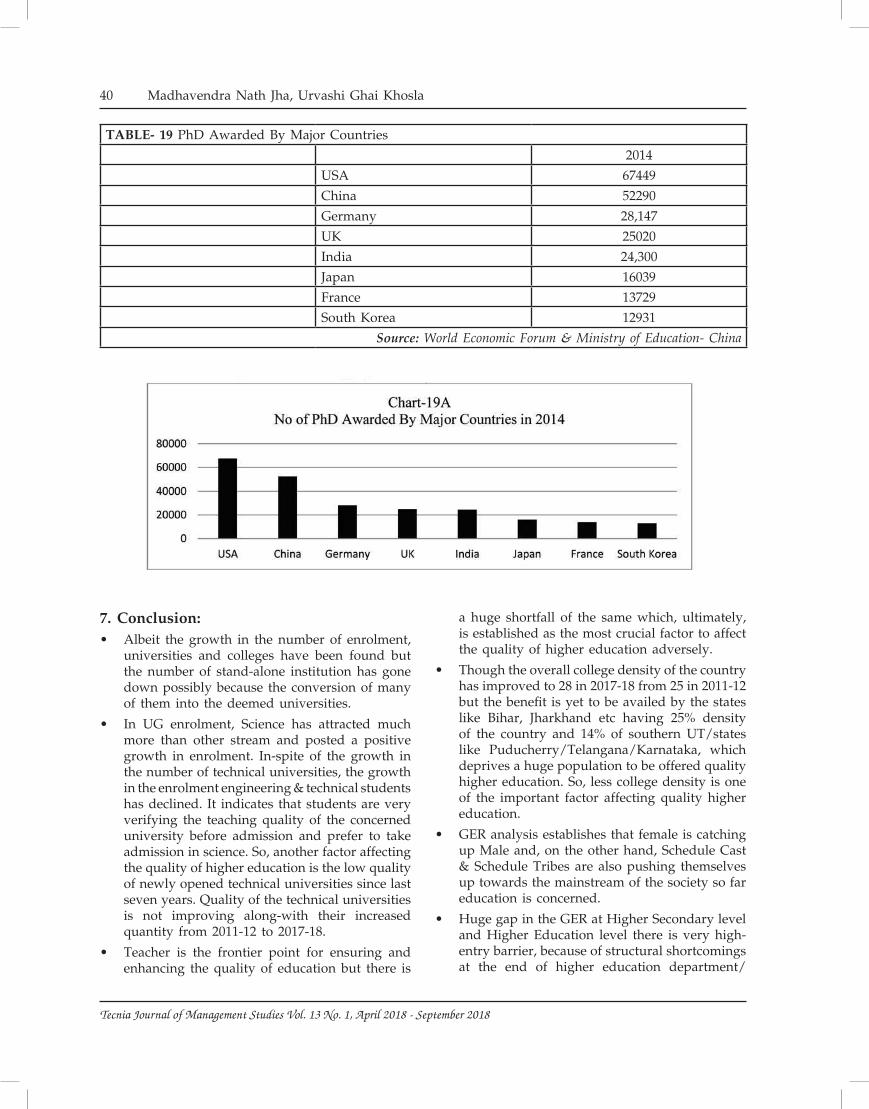
40 Madhavendra Nath Jha, Urvashi Ghai Khosla
Tecnia Journal of Management Studies Vol. 13 No. 1, April 2018 - September 2018
TABLE- 19 PhD Awarded By Major Countries
2014
USA 67449
China 52290
Germany 28,147
UK 25020
India 24,300
Japan 16039
France 13729
South Korea 12931
Source: World Economic Forum & Ministry of Education- China
a huge shortfall of the same which, ultimately, is established as the most crucial factor to affect the quality of higher education adversely.
• Though the overall college density of the country has improved to 28 in 2017-18 from 25 in 2011-12 but the benefit is yet to be availed by the states like Bihar, Jharkhand etc having 25% density of the country and 14% of southern UT/states like Puducherry/Telangana/Karnataka, which deprives a huge population to be offered quality higher education. So, less college density is one of the important factor affecting quality higher education.
• GER analysis establishes that female is catching up Male and, on the other hand, Schedule Cast & Schedule Tribes are also pushing themselves up towards the mainstream of the society so far education is concerned.
• Huge gap in the GER at Higher Secondary level and Higher Education level there is very high-entry barrier, because of structural shortcomings at the end of higher education department/
7. Conclusion: • Albeit the growth in the number of enrolment,
universities and colleges have been found but the number of stand-alone institution has gone down possibly because the conversion of many of them into the deemed universities.
• In UG enrolment, Science has attracted much more than other stream and posted a positive growth in enrolment. In-spite of the growth in the number of technical universities, the growth in the enrolment engineering & technical students has declined. It indicates that students are very verifying the teaching quality of the concerned university before admission and prefer to take admission in science. So, another factor affecting the quality of higher education is the low quality of newly opened technical universities since last seven years. Quality of the technical universities is not improving along-with their increased quantity from 2011-12 to 2017-18.
• Teacher is the frontier point for ensuring and enhancing the quality of education but there is

A Descriptive Study on Factors Affecting the Quality of the Indian Higher Education 41
Tecnia Journal of Management Studies Vol. 13 No. 1, April 2018 - September 2018
policy-makers which make it very difficult for the students, in mass from school level, to be enrolled in the college.
• Though GER of 13 UT/States are much better than GER at country level, 25.8 but is still far away from the target to achieve 30 by 2020. Moreover, in global context, USA & China are 72% & 242% ahead over our national GER which reflects that a huge number of potential students have not been included to educate and improve quality.
• Overall deterioration in Pupil-Teacher Ratio at national level and state level, barring Sikkim & Tamil Nadu indication sever crisis of the higher education system causing the most important reason to dent the quality education.
• There has not been much improvement in the internationalisation of education in the country. No improvement in making the India destination of the foreign students. Students from USA, China and other major/western/developed countries are not opting Indian universities/colleges/institutions. Steps are required to be taken up to make the academics of international level to attract quality international students.
• Only three of the Indian universities have place in the top 200 universities. It affects the policy to make the India education centre and destination of quality hardly academics to meet to reduce the gap between academia & industry globally.
• A meagre percentage (0.50) of total students enrolled, since last seven years, have registered for PhD in India.. At international front, India stands only after USA, China, Germany & UK. Moreover, the gap between the students enrolled in USA/China and India is huge. It is a clear indication of lacking research environment in the Indian universities
References:• Agarwal, P. (2015, November 22). Can India
Build World Class Universities? Retrieved from www.shanghairanking.com/wcu/wcu5/15.pdf
• Altbach, Philip G. “India: a World-Class Country without World-Class Higher Education.”- Page 18-20, International Educator, Nov-Dec - 2005.
• Care Ratings Professional Risk Opinion, June 25-2018
• Higher Education in India: issues, concerns and new directions, University Grants Commission, New Delhi
• National Knowledge Commission, Report to the Nation 2006. New Delhi: National Knowledge Commission, 2007 Retrieved from http://knowledgecommission.gov.in/report2006/default.asp
• Yashpal Committee Report – AICTE. (2015, October 25). Retrieved from www.aicte-india.org/misyashpal.php.

42 Karishma Arora, Prof R. K. Sharma
Tecnia Journal of Management Studies Vol. 13 No. 1, April 2018 - September 2018
1. IntroductionThe online information platform has evolved from a world in which users searched and consulted information (Web 1.0) to a world where they are now able to generate and spread information themselves (Web 2.0) (A. M. Kaplan & Haenlein, 2010).
Social Media as defined by (Kietzmann, Hermkens, McCarthy, & Silvestre, 2011) “Social media are computer-mediated technologies that allow the creating and sharing of information, ideas, career, interests and other forms of expression via virtual communities and networks.” The emergence of Social Media has opened a direct and cost-efficient platform for organisation to reach out to mass audience.
Not only large-scale companies but small-scale companies can also tap the benefits of social media advertisement. Social media provide various ways of communication such as online word-of-mouth forums, fan pages, blogs, company-sponsored discussion boards and chat rooms, grievance redressal forums, reviewing and rating consumer products or services, comments, tweeting, like, share, subscribe, follow fan pages, use hashtags to bring an issue to notice etc. Consumers are shifting from the
traditional sources of advertising like radio, television, magazines, newspapers and are depending more on Social Media to search information about products, ask queries online and then make purchase decision. It has found through many studies that various aspects of consumer behaviour are being influenced by Social Media. Social media has been described as “hybrid element of the promotion mix” because it has enabled companies to talk to their customers, as well as customers also get to talk directly to one another(Mangold & Faulds, 2009).
The businesses are thus required to evolve their marketing strategies to enhance purchase intentions of consumers through social media advertisements.
2. Literature Review
Social MediaSocial media has been described as a s set of communication processes which links ‘many-to-many’(A. Kaplan & Mazurek, 2018). Few people agree that social media has increased social capital and well-being, while few criticize that this has led to intruding into privacy of people (Popović & Popović, 2018). Previously social media was used only for reading, watching, and buying products
an assessment of factors of socIal medIa advertIsement on purchase IntentIon
Abstract: The growth of social media has created a new place of interaction and communication among people. Individual are constantly connected with each other to share information, opinions and experiences. As businesses are shifting towards social media for promotion of their products, it is essential to study how this medium can be utilized to deliver the message to potential customers in the most efficient manner. Thus, this study aims to identify the main factors related to social media advertising that could predict purchase intention. Exploratory factor analysis has been performed on a sample of 286 respondents to explore the factors of social media advertisements and a relationship among the identified factors has been established with help of linear regression model.
Keywords: Social Media, Social Media Advertisement, Attitude, Purchase Intentions
Karishma Arora*Prof R. K. Sharma**
*Karishma Arora, School of Management Studies, IGNOU, Research Scholar, [email protected]**Prof. R. K. Shrama, BVIMR, Paschim Vihar, New Delhi-110063

An Assessment of Factors of Social Media Advertisement on Purchase Intention 43
Tecnia Journal of Management Studies Vol. 13 No. 1, April 2018 - September 2018
and services. But now consumers are utilizing platforms-such as content sharing sites, blogs, social networking, and wikis-to create, modify, share, and discuss Internet content. Social media is emerging as a phenomenon (Kietzmann et al., 2011), which can make significant impact on a firm’s sales, profits and even survival. Study by (Asur & Huberman, 2010) showed that social media content can predict real-world outcomes. forecasting power of social media. (de Vries, Gensler, & Leeflang, 2017) brought out that communication of social messages from firms to customers complement traditional advertising efforts. Thus, traditional advertising together with firm’s social media activities may improve a firm’s brand image and enhance customer acquisition. (Allahawiah & Tarawneh, 2018) studied that the perceptions of respondents toward social networks and consumer purchasing decision were high. They recommended that the website designers and marketers must aim at convincing users to increase their awareness of the methods of social communication and learn how to apply these tools in order to increase the effectiveness and interaction of websites and their impact on purchasing decisions. (Naidoo, 2011). (Lee, Hosanagar, & Nair, 2014) conducted case study of Facebook and found that firms benefit from sharing their brand personality and information about their social initiatives on social media.
Social Media AdvertisingSocial media applications are building rich user-generated consumer communities which are emerging as new market place for marketers to meet their potential customers (Akar & Topçu, 2011). Social media marketing has provided a place to connect and interact on a much more personalised and dynamic level as compared to traditional marketing. Online advertisement which use the internet to deliver promotional marketing messages to consumers can be very effective and useful for marketers. It may be done through email marketing, search engine marketing, social media marketing, many types of display advertising (including web banner advertising), and mobile advertising (Davidavičienė, 2013). Social Media Advertisements must be congruent and aligned with the different needs of social media users (Zhu & Chen, 2015). Companies are venturing to take advantage of social media advertising to deliver their advertisements to appropriate customers. (Li & Shiu, 2012). Social media advertisements stimulate external factors and then influence the consumer’s perception, and ultimately impacting consumers’ purchase intention
(Maoyan, Zhu, & Sangyang, 2014).
Social Media Advertisements have become an important marketing tool to reach millennials. Internet is playing an important role in modern marketing, enabling marketers to reach customers faster and more efficiently (Balakrishnan, Dahnil, & Yi, 2014). The marketers only need to explore the best techniques of advertising to reach their target audience and create maximum impact of their message (Zipporah & Mberia, 2014).
Factors affecting Social Media AdvertisementsRelationships fall everywhere along the spectrum of Social media(Gilbert & Karahalios, 2009). Various factors come into play when we strive to study impact on purchase intentions of consumers through the social media. (Harshini C S, Government R C College, & Bangalore University, 2015) have brought out new set of characteristics that effect consumers’ response towards Social Media ads with respect to Purchase Intention. The characteristics given are information, credibility, entertainment and interactivity.
Attractiveness can be a dominant factor which influence consumer perceptions regarding online advertisements.(Bhatt & Bhatt, 2012). An effective and attracting advertisement (Bakar, Desa, & Mustafa, 2015; Wirtz, Piehler, & Ullrich, 2013) can increase the impact of social media advertisement. Further, the advertising appeal can effectively influence the consumer purchase intention(He & Qu, 2018).
Engagement or interactions with social media advertising itself is key in explaining how social media engagement is related to advertising evaluation (Voorveld, Araujo, Bernritter, Rietberg, & Vliegenthart, 2018). Further, it is important to know how consumers respond on social media. Interactivity is one of the key characteristics that differentiates between traditional and social media (Chung & Zhao, 2010). Interactivity on the internet shifts the ways in which users perceive advertising (Hadija, Barnes, & Hair, 2012).
Usage characteristics (Duffett, 2015; Pütter, 2017) of a social media can impact the effectiveness of social media advertisements being shown.
Next time factor is credibility. Customers on social media will be convinced to buy a product only if they are able to generate trust towards the advertisement and its contents. Social media facilitate the social interaction of consumers, leading to increased trust and intention to buy (Hajli, 2014). Social media can play an important role in image building,
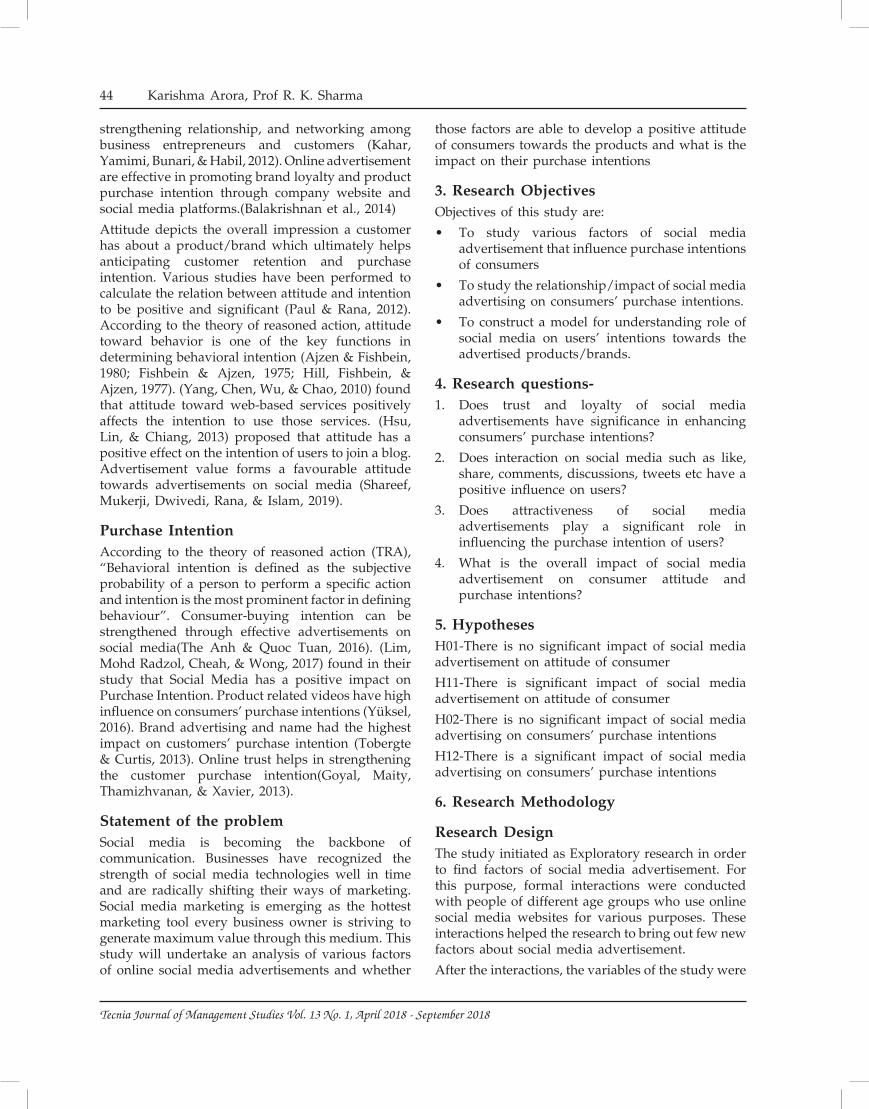
44 Karishma Arora, Prof R. K. Sharma
Tecnia Journal of Management Studies Vol. 13 No. 1, April 2018 - September 2018
strengthening relationship, and networking among business entrepreneurs and customers (Kahar, Yamimi, Bunari, & Habil, 2012). Online advertisement are effective in promoting brand loyalty and product purchase intention through company website and social media platforms.(Balakrishnan et al., 2014)
Attitude depicts the overall impression a customer has about a product/brand which ultimately helps anticipating customer retention and purchase intention. Various studies have been performed to calculate the relation between attitude and intention to be positive and significant (Paul & Rana, 2012). According to the theory of reasoned action, attitude toward behavior is one of the key functions in determining behavioral intention (Ajzen & Fishbein, 1980; Fishbein & Ajzen, 1975; Hill, Fishbein, & Ajzen, 1977). (Yang, Chen, Wu, & Chao, 2010) found that attitude toward web-based services positively affects the intention to use those services. (Hsu, Lin, & Chiang, 2013) proposed that attitude has a positive effect on the intention of users to join a blog. Advertisement value forms a favourable attitude towards advertisements on social media (Shareef, Mukerji, Dwivedi, Rana, & Islam, 2019).
Purchase IntentionAccording to the theory of reasoned action (TRA), “Behavioral intention is defined as the subjective probability of a person to perform a specific action and intention is the most prominent factor in defining behaviour”. Consumer-buying intention can be strengthened through effective advertisements on social media(The Anh & Quoc Tuan, 2016). (Lim, Mohd Radzol, Cheah, & Wong, 2017) found in their study that Social Media has a positive impact on Purchase Intention. Product related videos have high influence on consumers’ purchase intentions (Yüksel, 2016). Brand advertising and name had the highest impact on customers’ purchase intention (Tobergte & Curtis, 2013). Online trust helps in strengthening the customer purchase intention(Goyal, Maity, Thamizhvanan, & Xavier, 2013).
Statement of the problemSocial media is becoming the backbone of communication. Businesses have recognized the strength of social media technologies well in time and are radically shifting their ways of marketing. Social media marketing is emerging as the hottest marketing tool every business owner is striving to generate maximum value through this medium. This study will undertake an analysis of various factors of online social media advertisements and whether
those factors are able to develop a positive attitude of consumers towards the products and what is the impact on their purchase intentions
3. Research ObjectivesObjectives of this study are:
• To study various factors of social media advertisement that influence purchase intentions of consumers
• To study the relationship/impact of social media advertising on consumers’ purchase intentions.
• To construct a model for understanding role of social media on users’ intentions towards the advertised products/brands.
4. Research questions-1. Does trust and loyalty of social media
advertisements have significance in enhancing consumers’ purchase intentions?
2. Does interaction on social media such as like, share, comments, discussions, tweets etc have a positive influence on users?
3. Does attractiveness of social media advertisements play a significant role in influencing the purchase intention of users?
4. What is the overall impact of social media advertisement on consumer attitude and purchase intentions?
5. HypothesesH01-There is no significant impact of social media advertisement on attitude of consumer
H11-There is significant impact of social media advertisement on attitude of consumer
H02-There is no significant impact of social media advertising on consumers’ purchase intentions
H12-There is a significant impact of social media advertising on consumers’ purchase intentions
6. Research Methodology
Research DesignThe study initiated as Exploratory research in order to find factors of social media advertisement. For this purpose, formal interactions were conducted with people of different age groups who use online social media websites for various purposes. These interactions helped the research to bring out few new factors about social media advertisement.
After the interactions, the variables of the study were
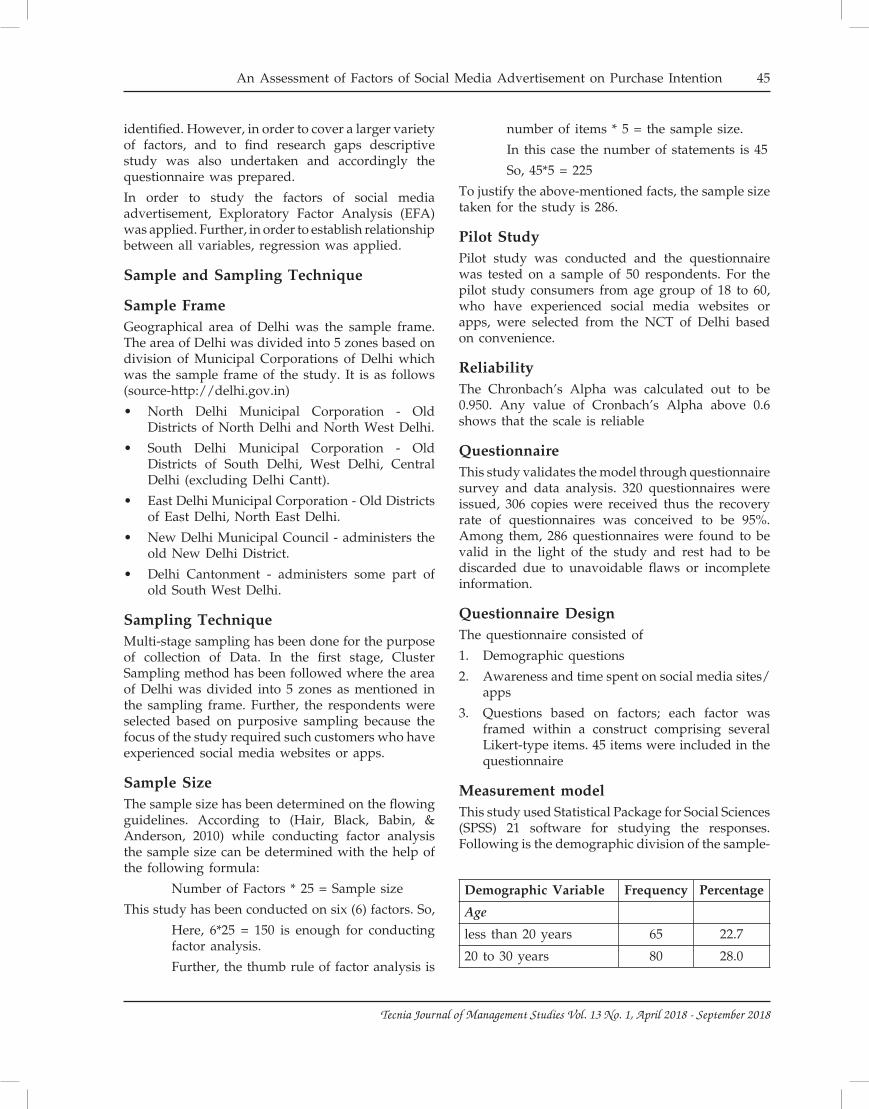
An Assessment of Factors of Social Media Advertisement on Purchase Intention 45
Tecnia Journal of Management Studies Vol. 13 No. 1, April 2018 - September 2018
identified. However, in order to cover a larger variety of factors, and to find research gaps descriptive study was also undertaken and accordingly the questionnaire was prepared.
In order to study the factors of social media advertisement, Exploratory Factor Analysis (EFA) was applied. Further, in order to establish relationship between all variables, regression was applied.
Sample and Sampling Technique
Sample FrameGeographical area of Delhi was the sample frame. The area of Delhi was divided into 5 zones based on division of Municipal Corporations of Delhi which was the sample frame of the study. It is as follows (source-http://delhi.gov.in)
• North Delhi Municipal Corporation - Old Districts of North Delhi and North West Delhi.
• South Delhi Municipal Corporation - Old Districts of South Delhi, West Delhi, Central Delhi (excluding Delhi Cantt).
• East Delhi Municipal Corporation - Old Districts of East Delhi, North East Delhi.
• New Delhi Municipal Council - administers the old New Delhi District.
• Delhi Cantonment - administers some part of old South West Delhi.
Sampling TechniqueMulti-stage sampling has been done for the purpose of collection of Data. In the first stage, Cluster Sampling method has been followed where the area of Delhi was divided into 5 zones as mentioned in the sampling frame. Further, the respondents were selected based on purposive sampling because the focus of the study required such customers who have experienced social media websites or apps.
Sample SizeThe sample size has been determined on the flowing guidelines. According to (Hair, Black, Babin, & Anderson, 2010) while conducting factor analysis the sample size can be determined with the help of the following formula:
Number of Factors * 25 = Sample size
This study has been conducted on six (6) factors. So,
Here, 6*25 = 150 is enough for conducting factor analysis.
Further, the thumb rule of factor analysis is
number of items * 5 = the sample size.
In this case the number of statements is 45
So, 45*5 = 225
To justify the above-mentioned facts, the sample size taken for the study is 286.
Pilot StudyPilot study was conducted and the questionnaire was tested on a sample of 50 respondents. For the pilot study consumers from age group of 18 to 60, who have experienced social media websites or apps, were selected from the NCT of Delhi based on convenience.
ReliabilityThe Chronbach’s Alpha was calculated out to be 0.950. Any value of Cronbach’s Alpha above 0.6 shows that the scale is reliable
Questionnaire This study validates the model through questionnaire survey and data analysis. 320 questionnaires were issued, 306 copies were received thus the recovery rate of questionnaires was conceived to be 95%. Among them, 286 questionnaires were found to be valid in the light of the study and rest had to be discarded due to unavoidable flaws or incomplete information.
Questionnaire DesignThe questionnaire consisted of
1. Demographic questions
2. Awareness and time spent on social media sites/apps
3. Questions based on factors; each factor was framed within a construct comprising several Likert-type items. 45 items were included in the questionnaire
Measurement modelThis study used Statistical Package for Social Sciences (SPSS) 21 software for studying the responses. Following is the demographic division of the sample-
Demographic Variable Frequency Percentage
Age
less than 20 years 65 22.7
20 to 30 years 80 28.0
46 Karishma Arora, Prof R. K. Sharma
Tecnia Journal of Management Studies Vol. 13 No. 1, April 2018 - September 2018
30 to 40 years 51 17.8
40 to 50 years 45 15.7
more than 50 years 45 15.7
Total 286 100.0
Gender
female 148 51.7
Male 138 48.3
Total 286 100.0
Educational Qualification
Doctorate 35 12.2
Post-Graduate 87 30.4
Graduate 86 30.1
senior Secondary(12th) or below
78 27.3
Total 286 100.0
Employment sector
government sector 46 16.1
Private sector 66 23.1
S e l f - e m p l o y e d /entrepreneur
49 17.1
free lancer 14 4.9
student/unemployed 109 38.1
others 2 .7
Total 286 100.0
Monthly Income
Rs0-Rs30,000 132 46.2
Rs30,001-Rs50,000 41 14.3
Rs50,001-Rs80,000 35 12.2
Rs-80,001-Rs1,00,000 39 13.6
above Rs1,00,000 39 13.6
Total 286 100.0
7. Data Analysis
Exploratory Factor Analysis It is a statistical method used to develop factors from a large number of measurable variables. This
technique is usually followed ‘when the researcher has no a priori hypothesis about factors or patterns of measured variables.’ Exploratory factor analysis helps in identifying a set of latent constructs underlying the measured variables (Kline, 2013; Yong & Pearce, 2016). Once the grouping of variables has been done by the software, the task of a researcher is to name the groups as factors and segregate independent and dependent variables. In simple terms, this technique can be understood as a data reduction technique in SPSS, which takes a large set of variables to be reduced or summarised using a smaller set of factors or components (Cappelleri & Gerber, 2013; de Winter, Dodou, & Wieringa, 2009; Hayton, Allen, & Scarpello, 2004).
8. Data SuitabilityOnce the factors are obtained through Exploratory Factor Analysis (EFA), it is important to check the sustainability or validity of the scale. Two statistical measures: Bartlett’s Test of Sphericity and Kaiser-Meyer-Olkin Measure of Sampling Adequacy (KMO) helps in validating the scale of factors so obtained. Kaiser-Meyer-Olkin MSA was calculated which is found to be 0.917. This value indicates that the sample is good enough for sampling (Tabachnick and Fidell, 2007).
9. FactorizationFor this study we have taken value of 0.50. So, any variable with a loading of less than 0.5 have been rejected. The Components Matrix has been rotated using Varimax Rotation to assist interpretation of its results (Malhotra, 2007), displaying only loadings of 0.5.
Generally, loadings above 0.44 are considered salient. All the loadings in this study are found to be positive.
After running EFA on the data collected, six factors have been identified, each having Eigen value exceeding 1. The percentage of total variance indicates how well the total factor solution accounts for what the variables together represent. The index for present solution accounted for 61.298% of the total variations towards purchase intention in relation to social media advertisement. Few of the variables have been lost during extraction which accounted for 38.702% information content for purchase intention. The details of variance explained have been presented in the tables below. The proportion of variance in any one of the original variables, which is being captured by the extracted factor, is known as communality (Nargundkar, 2002).
Factors were obtained as follows:

An Assessment of Factors of Social Media Advertisement on Purchase Intention 47
Tecnia Journal of Management Studies Vol. 13 No. 1, April 2018 - September 2018
Factor No 1: Attractiveness % of Variance Explained
Items Factor Loadings
Extraction Sums of Squared Loadings
Rotation Sums of Squared Loadings
Usage of melodious music in advertisement 0.806 32.270 14.710
Celebrity’s opinion as a customer of the brand in the advertisement
0.799
Usage of attractive catchy taglines 0.781
Background and picturization of the advertisement 0.768
Humor appeal 0.752
Emotional appeal 0.743
Models/brand ambassadors associated with the advertisement
0.71
Create mystery matter to generate gossip, speculation and new stories in the market.
0.655
Sex appeal 0.645
Visual appeal 0.624
Self enhancement appeal 0.599
Table 1: Factor 1- Attractiveness
Factor No 2: Credibility % of Variance Explained
Items Factor Loadings
Extraction Sums of Squared Loadings
Rotation Sums of Squared Loadings
Do you agree that social media provides an effective and powerful platform for consumers to communicate with each other and with the companies?
0.776 10.723 13.373
Social media provides me a platform to inquire and clear my doubts about a product before buying it.
0.773
Do you think social media is an effective way to reach you as customers and influence your buying decision?
0.758
Are you likely to change your attitude towards a certain brand or product or service after you have read positive comments/reviews/online articles etc. about it?
0.737
Do you think that social media has a provided more effective platform to introduce new products/services/brands?
0.726
Social media is a good platform to be heard for grievances.
0.715
Social media makes me aware about new products launching in the market.
0.701
Would you recommend your friends to trust social media ads?
0.589

48 Karishma Arora, Prof R. K. Sharma
Tecnia Journal of Management Studies Vol. 13 No. 1, April 2018 - September 2018
I am influenced to buy a product based on the information I receive through a social media.
0.556
Do you agree that your judgement through social media advertisement about a product/service is accurate?
0.515
Table 2: Factor 2- Credibility
Factor No 3: Usability % of Variance Explained
Items Factor Loadings
Extraction Sums of Squared Loadings
Rotation Sums of Squared Loadings
I use social media to stay up to date with my social circle.
0.754 5.725 9.925
I use social media for networking, i.e connecting with people
0.749
I use social media for sharing information/inviting people to events
0.71
I use social media for reading reviews and ratings about products
0.678
I use social media for posting pictures/videos 0.647
I use social media for checking out deals/promotions/sales on products that I am interested in.
0.63
Social media enables two-way communication 0.549
Table 3: Factor 3- Usability
Factor No 4: Purchase Intention % of Variance Explained
Items Factor Loadings
Extraction Sums of Squared Loadings
Rotation Sums of Squared Loadings
After seeing an advertisement on social media, it is likely that I will purchase that product.
0.766 5.167 8.105
If I were going to buy a product, I would recall the social media advertisements.
0.763
There is a probability that I would consider buying a product after seeing its advertisement on social media
0.749
My willingness to buy the product increases after watching an advertisement on social media websites/apps.
0.745
If I were going to buy a product, the probability of buying through a social media platform is high
0.649
After seeing an advertisement on social media, it is likelihood that I will purchase that product.
0.536

An Assessment of Factors of Social Media Advertisement on Purchase Intention 49
Tecnia Journal of Management Studies Vol. 13 No. 1, April 2018 - September 2018
Table 4: Purchase Intention
Factor No 5: Attitude % of Variance ExplainedItems Factor
LoadingsExtraction Sums
of Squared Loadings
Rotation Sums of Squared Loadings
I find social media advertisements to be fun and entertaining
0.741 3.938 7.814
I inquire more about a product after seeing the advertisement on social media
0.72
I have a positive reaction to the advertisements that I see on social media
0.679
I feel involved when I watch am ad on social media 0.671The ads on social media grab my attention 0.604
Table 5: Factor 5- Attitude
Factor No 6: Interactivity % of Variance Explained
Items Factor Loadings
Extraction Sums of Squared Loadings
Rotation Sums of Squared Loadings
Autonomous questions and discussions about a product on social media platforms effect my purchase decision.
0.749 3.472 7.414
Comments and tweets about a product effect my purchase decision
0.738
Videos about hands-on experience of a product effect my purchase decision
0.716
User reviews and ratings given to a product effect my purchase decision
0.675
I buy a product more confidently after inquiring about it on social media.
0.544
Table 6: Factor 6- Interactivity
To sum up following factors have been identified
• Attractiveness of SMA
• Credibility of SMA
• Usability of Social media websites/apps
• Purchase Intention impacted by SMA
• Attitude towards SMA
• Interactivity on Social Media
10. Regression AnalysisTo study the strength of the relationship between the explored independent variables of social media advertisement and their impact on dependent variable (purchase intentions) towards social media advertisement is studied with help of the regression analysis. The global fitness of the model was tested with f-statistics. Significance level in Anova was
found to be 0.000 which is less than p value 0.05, thus it indicated that the model is significant.
Three equations were calculated.
1) First equation shows that purchase intention towards social media advertisement is predicted by the 0.086 unit increase of usability, 0.199 unit increase of interactivity, 0.091 unit increase of attractiveness, 0.146 unit increase of credibility. The equation also signifies that if there are no usability, interactivity, attractiveness or credibility, even then Purchase Intention will be atleast 3.18 in regards with Social media Advertisement.
• The beta values were as follows- usability=.113 significant at 90% confidence, Interactivity= .228 significant at 95% confidence, Attractiveness= .185 significant at 99% confidence, Credibility=

50 Karishma Arora, Prof R. K. Sharma
Tecnia Journal of Management Studies Vol. 13 No. 1, April 2018 - September 2018
.264 significant at 99% confidence
2) Second equation shows that attitude towards social media advertisement is predicted by the 0.092 unit increase of usability, 0.04 unit increase of interactivity, 0.042 unit increase of attractiveness, 0.207 unit increase of credibility. The equation also signifies that if there are no usability, interactivity, attractiveness or credibility, even then Attitude will be atleast 2.016 in regards with Social media Advertisement.
• The beta values as follows- usability=1.54 significant at 95% confidence, Interactivity= .058 not significant, Attractiveness= .109 significant at 95% confidence, Credibility= .474 significant at 99% confidence.
3) Third equation signifies that if there is no other factors, even then Purchase Intention will be atleast 12.793 in regards with Social Media Advertisement. Further, the equation shows that purchase intention towards social media advertisement is predicted by the 0.506 unit increase of attitude, added to 12.793.
• The beta value for attitude was found to be .399 significant at 99% confidence
Following model has been fit: -
social media advertisement on purchase intentions of the viewers.
The research suggested that people will notice an advertisement on social media if it is attractive. Marketers must work upon visual appeal, humour appeal, emotional appeal, self-enhancement appeal, celebrity opinions, taglines, melodious music, background and picturization of advertisement to attract people of different age groups. It is important to have clear proposition for consumers. The second most important factor for a social media advertisement to be effective is credibility of the advertisement in terms of the content shown and the amount of trust gained through the advertisement. Third factor was found to be usability of social media advertisements. As WhatsApp, YouTube, Facebook, Instagram, Quora are highly used apps, they can prove to be excellent delivery platform for the advertisements. People use these platforms for various purposes such as connecting and networking, posting pictures, videos, collecting study/work related material, reading reviews etc.
Everything is available on the internet and are becoming a vital part of daily lives of people. People like to interact and discuss about common topics of interests. So, interactivity becomes an essential feature of social media advertisement. Attractiveness, credibility, usability and interactivity are integral elements to bolster positive attitude of consumers towards the advertisement. Faithful attitude towards the advertisements will ultimately reinforce purchase intentions. Our study has brought out a strong relationship attitude and purchase intentions. The relationships among all the factors has been well represented with the help of a model.
References• Ajzen, I., & Fishbein, M. (1980). Understanding
attitudes and predicting social behavior. Englewood Cliffs, N.J. : Prentice-Hall.
• Akar, E., & Topçu, B. (2011). An examination of the factors influencing consumers’ attitudes toward social media marketing. Journal of Internet Commerce. https://doi.org/10.1080/15332861.2011.558456
• Allahawiah, S. R., & Tarawneh, M. M. (2018). The impact of social networks in influencing the consumer purchasing decision via the internet: Analytical study in Albalqa applied university. Journal of Theoretical and Applied Information Technology.
• Asur, S., & Huberman, B. A. (2010). Predicting the
• * p < 0.10, ** p < 0.05, *** p < 0.000, ns= non-significant
11. ConclusionWith the growth of internet and social media people are becoming more aware and alert as consumers. The technological advancement is increasing competition in the market. If businesses have to retain their share in markets and uplift profits, the social media can provide the competitive edge. This study has been performed appropriately to explore the impact of

An Assessment of Factors of Social Media Advertisement on Purchase Intention 51
Tecnia Journal of Management Studies Vol. 13 No. 1, April 2018 - September 2018
future with social media. Proceedings - 2010 IEEE/WIC/ACM International Conference on Web Intelligence, WI 2010. https://doi.org/10.1109/WI-IAT.2010.63
• Bakar, M. H. A., Desa, M. A. M., & Mustafa, M. (2015). Attributes for Image Content that Attract Consumers’ Attention to Advertisements. Procedia - Social and Behavioral Sciences. https://doi.org/10.1016/j.sbspro.2015.06.349
• Balakrishnan, B. K. P. D., Dahnil, M. I., & Yi, W. J. (2014). The Impact of Social Media Marketing Medium toward Purchase Intention and Brand Loyalty among Generation Y. Procedia - Social and Behavioral Sciences. https://doi.org/10.1016/j.sbspro.2014.07.032
• Bhatt, S., & Bhatt, A. (2012). Factors Influencing Online Shopping : An Empirical Study in Ahmedabad. Journal of Marketing Management.
• Cappelleri, J., & Gerber, R. (2013). Exploratory Factor Analysis. In Encyclopedia of Biopharmaceutical Statistics, Second edition. https://doi.org/10.1201/b14760-53
• Chung, H., & Zhao, X. (2010). Effects of Perceived Interactivity on Web Site Preference and Memory: Role of Personal Motivation. Journal of Computer-Mediated Communication. https://doi.org/10.1111/j.1083-6101.2004.tb00232.x
• Davidavičienė, V. (2013). Effectiveness Factors of Online Advertising. https://doi.org/10.3846/bm.2012.106
• de Vries, L., Gensler, S., & Leeflang, P. S. H. (2017). Effects of Traditional Advertising and Social Messages on Brand-Building Metrics and Customer Acquisition. Journal of Marketing. https://doi.org/10.1509/jm.15.0178
• de Winter, J. C. F., Dodou, D., & Wieringa, P. A. (2009). Exploratory factor analysis with small sample sizes. Multivariate Behavioral Research. https://doi.org/10.1080/00273170902794206
• Duffett, R. G. (2015). Facebook advertising’s influence on intention-to-purchase and purchase amongst millennials. Internet Research. https://doi.org/10.1108/IntR-01-2014-0020
• Fishbein, M., & Ajzen, I. (1975). Chapter 2. Theories of Attitude. Belief, Attitude, Intention, and Behavior, An Introduction to Theory and Research. https://doi.org/10.2307/2065853
• Gilbert, E., & Karahalios, K. (2009). Predicting tie strength with social media. Proceedings of the 27th International Conference on Human Factors in Computing Systems - CHI 09. https://doi.
org/10.1145/1518701.1518736
• Goyal, A., Maity, M., Thamizhvanan, A., & Xavier, M. J. (2013). Determinants of customers’ online purchase intention: An empirical study in India. Journal of Indian Business Research. https://doi.org/10.1108/17554191311303367
• Hadija, Z., Barnes, S. B., & Hair, N. (2012). Why we ignore social networking advertising. Qualitative Market Research.
https://doi.org/10.1108/13522751211191973
Hair, J. F., Black, W. C., Babin, B. J., & Anderson, R. E. (2010). Multivariate data analysis. In Pearson custom library. https://doi.org/10.1038/259433b0
• Hajli, M. N. (2014). A study of the impact of social media on consumers. International Journal of Market Research. https://doi.org/10.2501/IJMR-2014-025
• Harshini C S, Government R C College, R. R. C. R. S., & Bangalore University. (2015). Influence of Social Media Ads on Consumer’s Purchase Intention. In International Journal of Current Engineering and Scientific Research (Ijcesr). https://doi.org/10.1182/blood-2010-05-284984
• Hayton, J. C., Allen, D. G., & Scarpello, V. (2004). Factor Retention Decisions in Exploratory Factor Analysis: A Tutorial on Parallel Analysis. Organizational Research Methods. https://doi.org/10.1177/1094428104263675
• He, Q., & Qu, H. (2018). The Impact of Advertising Appeals on Purchase Intention in Social Media Environment-Analysis of Intermediary Effect Based on Brand Attitude. Journal of Business Administration Research. https://doi.org/10.5430/jbar.v7n2p17
• Hill, R. J., Fishbein, M., & Ajzen, I. (1977). Belief, Attitude, Intention and Behaviour: An Introduction to Theory and Research. Contemporary Sociology. https://doi.org/10.2307/2065853
• Hsu, C. L., Lin, J. C. C., & Chiang, H. Sen. (2013). The effects of blogger recommendations on customers’ online shopping intentions. Internet Research. https://doi.org/10.1108/10662241311295782
• Kahar, R., Yamimi, F., Bunari, G., & Habil, H. (2012). Trusting the Social Media in Small Business. Procedia - Social and Behavioral Sciences. https://doi.org/10.1016/j.sbspro.2012.11.301
• Kaplan, A. M., & Haenlein, M. (2010). Users of the world, unite! The challenges and opportunities
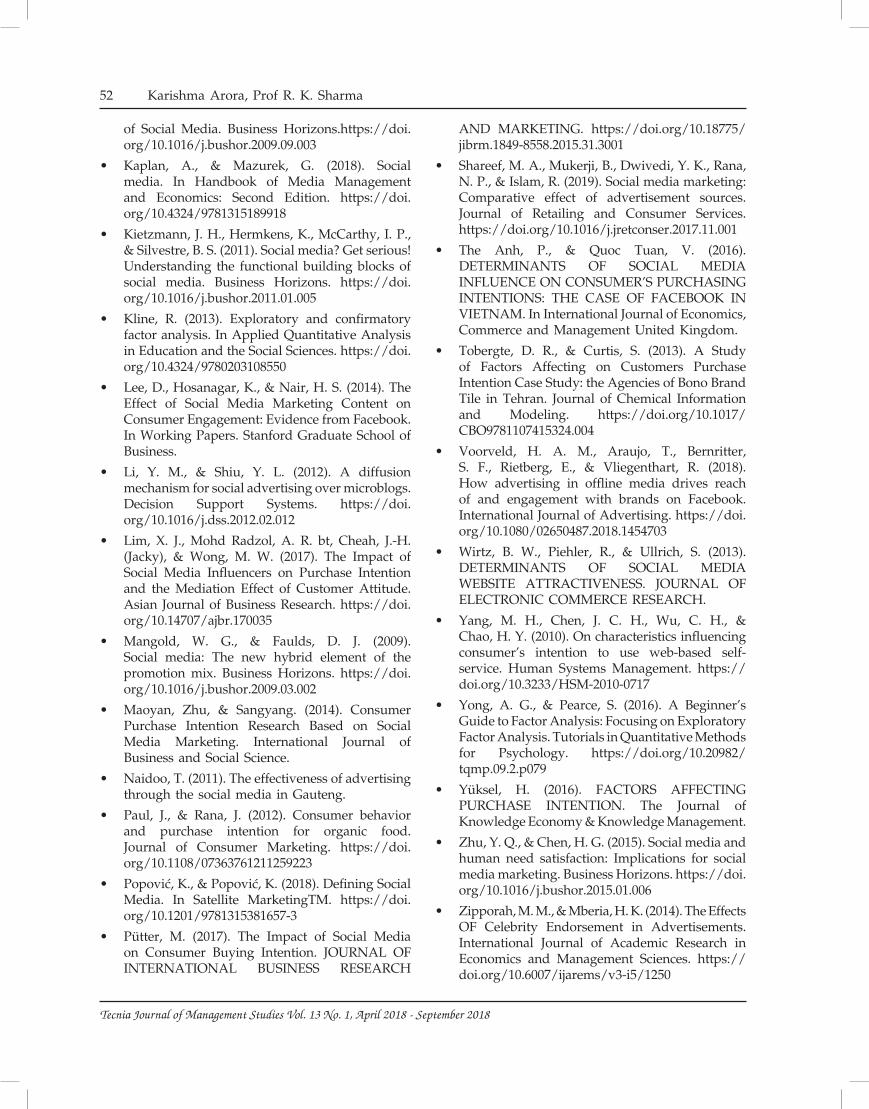
52 Karishma Arora, Prof R. K. Sharma
Tecnia Journal of Management Studies Vol. 13 No. 1, April 2018 - September 2018
of Social Media. Business Horizons.https://doi.org/10.1016/j.bushor.2009.09.003
• Kaplan, A., & Mazurek, G. (2018). Social media. In Handbook of Media Management and Economics: Second Edition. https://doi.org/10.4324/9781315189918
• Kietzmann, J. H., Hermkens, K., McCarthy, I. P., & Silvestre, B. S. (2011). Social media? Get serious! Understanding the functional building blocks of social media. Business Horizons. https://doi.org/10.1016/j.bushor.2011.01.005
• Kline, R. (2013). Exploratory and confirmatory factor analysis. In Applied Quantitative Analysis in Education and the Social Sciences. https://doi.org/10.4324/9780203108550
• Lee, D., Hosanagar, K., & Nair, H. S. (2014). The Effect of Social Media Marketing Content on Consumer Engagement: Evidence from Facebook. In Working Papers. Stanford Graduate School of Business.
• Li, Y. M., & Shiu, Y. L. (2012). A diffusion mechanism for social advertising over microblogs. Decision Support Systems. https://doi.org/10.1016/j.dss.2012.02.012
• Lim, X. J., Mohd Radzol, A. R. bt, Cheah, J.-H. (Jacky), & Wong, M. W. (2017). The Impact of Social Media Influencers on Purchase Intention and the Mediation Effect of Customer Attitude. Asian Journal of Business Research. https://doi.org/10.14707/ajbr.170035
• Mangold, W. G., & Faulds, D. J. (2009). Social media: The new hybrid element of the promotion mix. Business Horizons. https://doi.org/10.1016/j.bushor.2009.03.002
• Maoyan, Zhu, & Sangyang. (2014). Consumer Purchase Intention Research Based on Social Media Marketing. International Journal of Business and Social Science.
• Naidoo, T. (2011). The effectiveness of advertising through the social media in Gauteng.
• Paul, J., & Rana, J. (2012). Consumer behavior and purchase intention for organic food. Journal of Consumer Marketing. https://doi.org/10.1108/07363761211259223
• Popović, K., & Popović, K. (2018). Defining Social Media. In Satellite MarketingTM. https://doi.org/10.1201/9781315381657-3
• Pütter, M. (2017). The Impact of Social Media on Consumer Buying Intention. JOURNAL OF INTERNATIONAL BUSINESS RESEARCH
AND MARKETING. https://doi.org/10.18775/jibrm.1849-8558.2015.31.3001
• Shareef, M. A., Mukerji, B., Dwivedi, Y. K., Rana, N. P., & Islam, R. (2019). Social media marketing: Comparative effect of advertisement sources. Journal of Retailing and Consumer Services. https://doi.org/10.1016/j.jretconser.2017.11.001
• The Anh, P., & Quoc Tuan, V. (2016). DETERMINANTS OF SOCIAL MEDIA INFLUENCE ON CONSUMER’S PURCHASING INTENTIONS: THE CASE OF FACEBOOK IN VIETNAM. In International Journal of Economics, Commerce and Management United Kingdom.
• Tobergte, D. R., & Curtis, S. (2013). A Study of Factors Affecting on Customers Purchase Intention Case Study: the Agencies of Bono Brand Tile in Tehran. Journal of Chemical Information and Modeling. https://doi.org/10.1017/CBO9781107415324.004
• Voorveld, H. A. M., Araujo, T., Bernritter, S. F., Rietberg, E., & Vliegenthart, R. (2018). How advertising in offline media drives reach of and engagement with brands on Facebook. International Journal of Advertising. https://doi.org/10.1080/02650487.2018.1454703
• Wirtz, B. W., Piehler, R., & Ullrich, S. (2013). DETERMINANTS OF SOCIAL MEDIA WEBSITE ATTRACTIVENESS. JOURNAL OF ELECTRONIC COMMERCE RESEARCH.
• Yang, M. H., Chen, J. C. H., Wu, C. H., & Chao, H. Y. (2010). On characteristics influencing consumer’s intention to use web-based self-service. Human Systems Management. https://doi.org/10.3233/HSM-2010-0717
• Yong, A. G., & Pearce, S. (2016). A Beginner’s Guide to Factor Analysis: Focusing on Exploratory Factor Analysis. Tutorials in Quantitative Methods for Psychology. https://doi.org/10.20982/tqmp.09.2.p079
• Yüksel, H. (2016). FACTORS AFFECTING PURCHASE INTENTION. The Journal of Knowledge Economy & Knowledge Management.
• Zhu, Y. Q., & Chen, H. G. (2015). Social media and human need satisfaction: Implications for social media marketing. Business Horizons. https://doi.org/10.1016/j.bushor.2015.01.006
• Zipporah, M. M., & Mberia, H. K. (2014). The Effects OF Celebrity Endorsement in Advertisements. International Journal of Academic Research in Economics and Management Sciences. https://doi.org/10.6007/ijarems/v3-i5/1250

A Case Study on Pre and Post Joint Venture Analysis of Ntt Docomo and Tata Teleservices with Financial and HR Perspective 53
Tecnia Journal of Management Studies Vol. 13 No. 1, April 2018 - September 2018
1. IntroductionThe telecommunication industry is the fastest developing industry in every country. Over the last decade and particularly over the last five years, a remarkable development has been registered by India in the telecommunications sector. India’s tele-density has reached 76.55%, with the total subscriber
base reaching 957.61 million that comprises of 569.56 million in urban and 388.05 million in rural territory (TRAI, Market Research). India today has the world’s second largest network which is developing at a notable rate which is incomparable by any other country in the world. In today’s information era, the telecommunication sector plays a very essential role.
a case study on pre and post joInt venture analysIs of ntt docomo and tata teleservIces
wIth fInancIal and hr perspectIve
Abstract: As India’s Telecommunication industry is the world’s second largest industry which contribute a major portion in GDP. Telecommunication sector has turned up as a substantial performer in the Indian services demesne. Telecom industries have opted for Joint Ventures and Acquisitions as a strategic tool to elevate their performances. This study aims to investigate the impact of “Joint Venture and M&As (Mergers and Acquisitions)” in the Indian Telecom sector by basically comparing the performance of the corporate involved in M&A and joint venture before and after. M&As is the basic tool used for restructuring the corporate financially and strategically and the researchers found it desirable to analyse the effect of M&A and Joint Venture on financial performance as a value creation tool in Indian firms. The objective of the paper is to investigate several dimensions of joint venture by throwing some light on the financial and HR perspective related to Indian telecom sector in particular.
To highlight the impact of “joint venture” a case study on NTT DoCoMo with Tata Teleservices has been taken into consideration. In this paper we basically compared the status of the firm during the pre and post joint venture period with the help of financial parameters like ratio analysis such as Return on Total Assets (ROTA), Return on Capital Employed (ROCE), return on Equity (ROE), Gross Profit Margin, Net Profit Margin, and Debt-Equity Ratio. Several studies have also highlighted that Companies pay ample amount of attention to financial and strategic issues during joint ventures and M&As, but they often ignore human resource affairs. The role of personnel is oftentimes stationed in a marginal stance. Therefore, this study will try to address all the financial and HR issues generated out of M&As and joint ventures.
KEYWORDS: Telecom in India, Merger and Acquisition, joint venture, Financial and HR Perspective
Lata Rani*Chanchal Sharma**Swati Shrivastava***
*Dr. Lata Rani, Associate Professor, University of Engineering and Management, Jaipur**Ms. Chanchal Sharma, Asst. Professor/IEC College of Engineering & Technology, Gr. Noida/UPTU, Lucknow***Ms. Swati Shrivastava, Asst. Professor/IEC College of Engineering & Technology, Gr. Noida/UPTU, Lucknow

54 Lata Rani, Chanchal Sharma, Swati Shrivastava
Tecnia Journal of Management Studies Vol. 13 No. 1, April 2018 - September 2018
Indian Telecommunication industry is more than 165 years old. Telecommunications was first introduced in 1851 in India. The first operational land lines were laid by the government near Kolkata (then Calcutta), although telephone services were formally introduced in India much later in 1881. In 1947, after India attained independence, all foreign telecommunication companies were nationalized to form the Posts, Telephone and Telegraph (PTT), a body that was governed by the Ministry of Communication. The government exemplifies its previous efforts towards the growth R&D in the sector by setting up an autonomous body – Centre for Development of Telematics (C-DOT) in 1984 to expand state-of-the-art telecommunication technology to meet the developing needs of the Indian telecommunication network. The actual development of the industry commenced after the Government divided the Department of Post and Telegraph in 1985 by setting up the Department of Posts and the Department of Telecommunications (DoT).
2. Concept of Joint VentureJoint Venture is a kind of business arrangement in which two or more parties come to an agreement to pool their resources with an intention to attain a specific task. This task can be a new project or any other business activity. In a joint venture, each party is accountable for profits, losses and costs related with it. However, the venture is its own entity, separate and apart from the participants’ other business interests. In a joint venture, the parties agree to expand, for a limited period of time, a new entity and new assets by dispensing equity. They exercise control over the enterprise and consequently share revenues, expenses and assets.
The definition of a joint venture is a business deal in which two or more people combine their competence and impart the risk, profits and liabilities. Joint Ventures Companies are formed under Indian Companies Act. These Companies may be a private limited or a public limited. A joint venture has the following advantages:-
• more resources
• increased capacity
• rise in technical competence
• entry to recognized markets and the medium of distribution
3. Joint Venture in Telecom SectorIf we talk about overseas joint venture, General
Electric and Ericsson Company in recent times have entered a joint venture for the production of cellular telephone and mobile radio systems for the U.S. and Canadian markets.
Recently British Telecom Vodafone is looking forward for the 100 percent parent stake in Indian joint ventureby its Indian partners, including Ajay Piramal-led Piramal Healthcare and Analjit Singh.
4. Importance of The StudyFinancial restructuring is the basic and the most important tool to gain synergy in this competitive scenario and in the past decade financial restructuring tools have created major impact in the corporate sector....Joint venture is the important form of corporate restructuring which do a create a great synergy for the companies involved in the event. Lots of researchers have studied on mergers and acquisitions but still there are very less studies which basically emphasize on joint ventures. This area of financial restructuring is still untouched taking into consideration these important facts, the researchers have undertaken this study to highlight the impact and significance of the not too touched form of financial restructuring that is “Joint venture”. In this particular research we have taken into consideration the case study method so that we can have an in-depth knowledge of the factor which is creating impact during the event.
5. Objectives of The StudyThe study has been done to make some significant contribution towards the following broad objectives-
• To find out the major impact of financial restructuring like “Joint venture” in Indian telecom Sector with the help of a case study.
a. To investigate the impact of joint-venture with the help of comparative analysis of financial ratio.
b. To study the impact of joint-venture with the help of comparative analysis of HR perspectives
6. Hypotheses of The StudyThe following hypotheses have been formulated and tested to draw the conclusions:
H0: There is no considerable difference between pre and post joint venture financial performance.
(a) There is no significant difference between pre and post joint venture “Gross-Profit Ratio”

A Case Study on Pre and Post Joint Venture Analysis of Ntt Docomo and Tata Teleservices with Financial and HR Perspective 55
Tecnia Journal of Management Studies Vol. 13 No. 1, April 2018 - September 2018
(b) There is no significant difference between pre and post joint venture “Net-Profit Ratio”
(c) There is no significant difference between pre and post joint venture “ROI” Ratio
(d) There is no significant difference between pre and post joint venture “Debt –Equity Ratio
(e) There is no significant difference between pre and post joint venture “Dividend Pay-out Ratio”
(f) There is no significant difference between pre and post joint venture “EPS Ratio”
7. Data and Methodology
DATA
During past decade financial restructuring has emerged as an impact creating tool for the companies. In this particular research we have taken into consideration a case study on “Joint venture of NTT DOCOMO and TATA TELE SERVICES” for the period 2004-05 to 2011-12. And to maintain the authenticity of the research we have basically collected the data on annual basis from secondary source of information such as financial website, annual reports, journals, newspapers & magazines. To compare the pre and post joint venture financial performance of the company various influencing variables like “Gross-profit, Net profit, EPS, ROI, Debt equity ratio etc have been taken into consideration. For HR perspective we have collected the content from annual reports, newsletters, editorial expert views etc.
8. Research Methodology
To maintain the authenticity of the research we have applied difference of mean technique on the variables taken into the consideration. The independent sample t –test is used to check the significance which the event has created and the result was checked on the significance level of 95%. As referred in several papers the Independent sample T-test is the appropriate methodology used for the comparison among the average value of two groups,“Nidhi Nalwaya and Rahul Vyas” have also used independent sample t –test to compare the Pre and Post “M&A” in telecommunication sector. For HR perspective we have applied the content analysis methodology.
9. Sample Size and Sample SelectionTo make this study more precise researchers have selected a convenient sample of 01 company.
Acquirer Company
Year Targeted Company
Deal Value
Tata Teleservices
November, 2008
NTT DoCoMo
$ 2.7 Billion
10. Tools and TechniquesFor the analysis of the available financial information of the sample company, several techniques of applied research and accounting like comparative ratios have been employed. We have tried to calculate the following 6 major financial ratios which play a very important role in comparing the pre and post financial performance and their means were calculated for analyzing the accurate financial performance of the companies:
• Gross Profit Ratio (GPR)
• Net Profit Ratio (NPR)
• Return on Investment (ROI)
• Earnings Per Share(EPS)
• Debt -Equity Ratio (DER)
• Dividend Payout Ratio (DPR)
To maintain the authenticity and reliability of the analytical result these average ratios were further compared using Paired Sample’s’ test. And confidence interval of 95%has been set for difference in means.
11. Analysis of The Financial ResultsWe have broadly divided our result of the research in two main section the first section mainly emphasizes on the financial ratios in this section we have compared the pre and post event ratios and have highlighted the discovered facts and figures in the next section to be more precise and accurate with our findings we have applied the “Independent sample “T- test “and have presented the significance which the event has created.
In the below mentioned table a comparative analysis of pre and post joint venture Ratios hasbeen presented.

56 Lata Rani, Chanchal Sharma, Swati Shrivastava
Tecnia Journal of Management Studies Vol. 13 No. 1, April 2018 - September 2018
PRE AND POST JOINT VENTURE FINANCIAL PERFORMANCE OF SAMPLE CASECASE STUDY: TATA TELESERVICES AND NTT DoCoMo (YEAR OF JOINT VENTURE: 2007-08)
Table 1: Financial results of Tata Teleservices and NTT DoCoMo during pre and post joint venture period
RATIOS PRE MERGER PERIOD
NTT DOCOMO TATA TELE SERVICES
2004-05 2005-06 2006-07 2007-08 AVERAGE 2004-05 2005-06 2006-07 2007-08 AVERAGE
Gross Profit Ratio (%)
61.55 60.98 58.53 58.37 59.8575 47.03 50.6 55.16 57.56 52.5875
Net Profit Ratio (%)
15.43 12.81 9.55 10.42 12.0525 -65.37 -49.41 -22.08 -7.37 -8.73
Return on I n v e s t m e n t (%)
15.69 12.71 9.6 10.37 12.0925 -14.95 -14.66 -7.67 -2.69 -9.9925
Earnings per Share
158.11 134.58 103.74 114.11 127.635 -3.29 -3.17 -1.71 -0.62 -2.1975
D i v i d e n d Payout Ratio (%)
29.60% 38.50% 42.00% 43.00% 38.28% — — — —
Debt-Equity Ratio
0.2 0.15 0.11 0.09 0.1375 1.14 1.22 0.91 1.06 1.0825
RATIOS POST MERGER PERIOD
NTT DOCOMO TATA TELE SERVICES
2008-09 2009-10 2010-11 2011-12 AVERAGE 2008-09 2009-10 2010-11 2011-12 AVERAGE
Gross Profit Ratio (%)
61.77 62.68 60.09 60.52 61.265 54.85 51.97 48.88 38.925
Net Profit Ratio (%)
10.61 11.55 11.61 10.94 11.1775 -8.73 -15.16 3.54 -20.95 -10.325
Return on Investment (%)
9.76 9.75 9.39 8.79 9.4225 -3.11 -5.19 1.18 -8.52 -3.91
Earnings per Share
111.72 118.64 117.97 111.87 115.05 -0.79 -1.48 0.37 -2.41 -1.0775
D i v i d e n d Payout Ratio (%)
44% 44.1 50.1 50.2 36.21 — — — —
D e b t - E q u i t y Ratio
0.14 0.09 0.05 0.04 0.08 1.35 1.59 1.88 — 1.6
Section 1-: Analysis on the basis of Comparision of Financial RatiosBased on the explanations from the above parameters which determine the profitability of the company, it can be concluded that both the company have suffered losses after this particular joint venture, NTT DoCoMo was performing much better before this joint venture while Tata Teleservices was already facing losses before this joint venture and this venture didn’t helped both the companies in any sense.
Gross Profit Ratio (GPR)When we compare the average of Gross Profit Ratio (GPR) for NTT DoCoMoCompany before joint venture it was 59.8% while that of the Tata Teleservices was 59.6%. After joint venture the average gross profit ratio of NTT DoCoMohas increased to 61.26% and that of Tata Teleservices has declined to 38.925%. This shows that the company NTT DoCoMo has increased its gross profit margin to some level after the joint venture, but Tata Teleservices was not able to make profit out of this
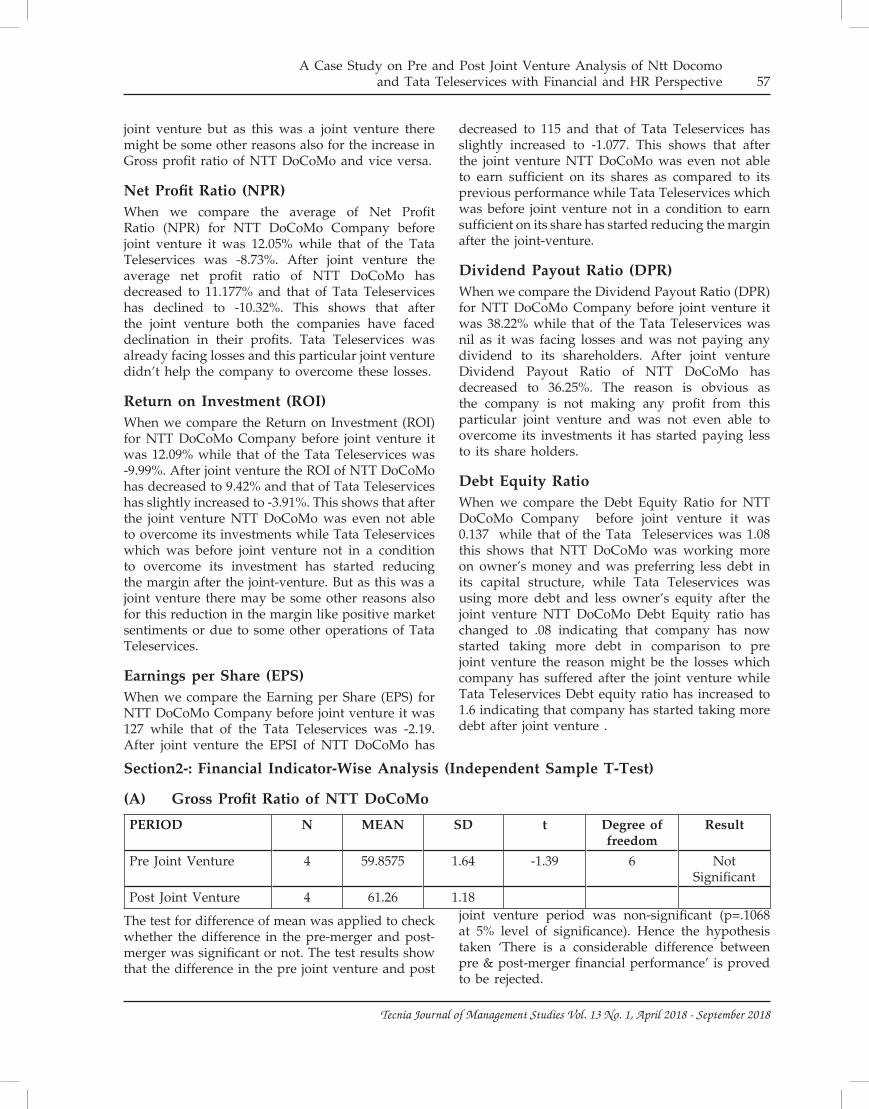
A Case Study on Pre and Post Joint Venture Analysis of Ntt Docomo and Tata Teleservices with Financial and HR Perspective 57
Tecnia Journal of Management Studies Vol. 13 No. 1, April 2018 - September 2018
joint venture but as this was a joint venture there might be some other reasons also for the increase in Gross profit ratio of NTT DoCoMo and vice versa.
Net Profit Ratio (NPR)When we compare the average of Net Profit Ratio (NPR) for NTT DoCoMo Company before joint venture it was 12.05% while that of the Tata Teleservices was -8.73%. After joint venture the average net profit ratio of NTT DoCoMo has decreased to 11.177% and that of Tata Teleservices has declined to -10.32%. This shows that after the joint venture both the companies have faced declination in their profits. Tata Teleservices was already facing losses and this particular joint venture didn’t help the company to overcome these losses.
Return on Investment (ROI)When we compare the Return on Investment (ROI) for NTT DoCoMo Company before joint venture it was 12.09% while that of the Tata Teleservices was -9.99%. After joint venture the ROI of NTT DoCoMo has decreased to 9.42% and that of Tata Teleservices has slightly increased to -3.91%. This shows that after the joint venture NTT DoCoMo was even not able to overcome its investments while Tata Teleservices which was before joint venture not in a condition to overcome its investment has started reducing the margin after the joint-venture. But as this was a joint venture there may be some other reasons also for this reduction in the margin like positive market sentiments or due to some other operations of Tata Teleservices.
Earnings per Share (EPS)When we compare the Earning per Share (EPS) for NTT DoCoMo Company before joint venture it was 127 while that of the Tata Teleservices was -2.19. After joint venture the EPSI of NTT DoCoMo has
decreased to 115 and that of Tata Teleservices has slightly increased to -1.077. This shows that after the joint venture NTT DoCoMo was even not able to earn sufficient on its shares as compared to its previous performance while Tata Teleservices which was before joint venture not in a condition to earn sufficient on its share has started reducing the margin after the joint-venture.
Dividend Payout Ratio (DPR)When we compare the Dividend Payout Ratio (DPR) for NTT DoCoMo Company before joint venture it was 38.22% while that of the Tata Teleservices was nil as it was facing losses and was not paying any dividend to its shareholders. After joint venture Dividend Payout Ratio of NTT DoCoMo has decreased to 36.25%. The reason is obvious as the company is not making any profit from this particular joint venture and was not even able to overcome its investments it has started paying less to its share holders.
Debt Equity RatioWhen we compare the Debt Equity Ratio for NTT DoCoMo Company before joint venture it was 0.137 while that of the Tata Teleservices was 1.08 this shows that NTT DoCoMo was working more on owner’s money and was preferring less debt in its capital structure, while Tata Teleservices was using more debt and less owner’s equity after the joint venture NTT DoCoMo Debt Equity ratio has changed to .08 indicating that company has now started taking more debt in comparison to pre joint venture the reason might be the losses which company has suffered after the joint venture while Tata Teleservices Debt equity ratio has increased to 1.6 indicating that company has started taking more debt after joint venture .
Section2-: Financial Indicator-Wise Analysis (Independent Sample T-Test)
(A) Gross Profit Ratio of NTT DoCoMo
PERIOD N MEAN SD t Degree of freedom
Result
Pre Joint Venture 4 59.8575 1.64 -1.39 6 Not Significant
Post Joint Venture 4 61.26 1.18
The test for difference of mean was applied to check whether the difference in the pre-merger and post-merger was significant or not. The test results show that the difference in the pre joint venture and post
joint venture period was non-significant (p=.1068 at 5% level of significance). Hence the hypothesis taken ‘There is a considerable difference between pre & post-merger financial performance’ is proved to be rejected.

58 Lata Rani, Chanchal Sharma, Swati Shrivastava
Tecnia Journal of Management Studies Vol. 13 No. 1, April 2018 - September 2018
Graphical representation of the above the above position- Figure 1: Pre & Post Merger Gross Profit Ratio Position of NTT DoCoMo
(B) Gross Profit Ratio of TATA TELESERVICES
PERIOD N MEAN SD t Degree of freedom
Result
Pre Joint Venture 4 52.5875 4.69 .219 6 Not Significant
Post Joint Venture 4 38.925 2.98
The test for difference of mean was applied to check whether the difference in the pre-merger and post-merger was significant or not. The test results show that the difference in the pre joint venture and post joint venture period was non-significant (p=.4172 at 5% level of significance). Hence the hypothesis taken ‘There is a considerable difference between pre & post-merger financial performance’ is proved to be rejected.
Graphical representation of the above the above position- Figure 2: Pre & Post joint venture Gross Profit Ratio Position of TATA TELESERVICES
(C) Net Profit Ratio of NTT DoCoMo
PERIOD N MEAN SD t Degree of freedom
Result
Pre Joint Venture 4 12.05 2.64 .651 6 Not Significant
Post Joint Venture 4 11.177 .484
The test for difference of mean was applied to check whether the difference in the pre-merger and post-merger was significant or not. The test results show that the difference in the pre joint venture and post joint venture period was non-significant (p=.0.269283771 at 5% level of significance). Hence the hypothesis taken

A Case Study on Pre and Post Joint Venture Analysis of Ntt Docomo and Tata Teleservices with Financial and HR Perspective 59
Tecnia Journal of Management Studies Vol. 13 No. 1, April 2018 - September 2018
‘There is a considerable difference between pre & post-merger financial performance’ is proved to be rejected.
Graphical representation of the above the above position- Figure 3: Pre & Post joint venture Net Profit Ratio Position of NTT DoCoMo
(D) Net Profit Ratio of TATA TELESERVICES
PERIOD N MEAN SD t Degree of freedom
Result
Pre-Merger 4 -8.73 26.177 -1.8 6 Not Significant
Post-Merger 4 -10.325 10.504
The test for difference of mean was applied to check whether the difference in the pre-merger and post-merger was significant or not. The test results show that the difference in the pre joint venture and post joint venture period was non-significant (p=.058938at 5% level of significance). Hence the hypothesis taken ‘There is a considerable difference between pre & post merger financial performance’ is proved to be rejected.
Graphical representation of the above the above position- Figure 4: Pre & Post joint ventureNet Profit Ratio Position of TATA TELESERVICES
(E) Return On Investment of NTT DoCoMo
PERIOD N MEAN SD t Degree of freedom
Result
Pre-Merger 4 12.09 2.73 1.923 6 Not Significant
Post-Merger 4 9.42 .455
The test for difference of mean was applied to check whether the difference in the pre-merger and post-merger was significant or not. The test results show that the difference in the pre joint venture and post joint venture period was non-significant (p=.051938at 5% level of significance). Hence the hypothesis taken

60 Lata Rani, Chanchal Sharma, Swati Shrivastava
Tecnia Journal of Management Studies Vol. 13 No. 1, April 2018 - September 2018
‘There is a considerable difference between pre & post-merger financial performance’ is proved to be rejected.
Graphical representation of the above the above position- Figure 5: Pre & Post joint venture ROI Ratio Position of NTT DoCoMo
(F) Return On Investment of TATA TELESERVICES
PERIOD N MEAN SD t Degree of freedom
Result
Pre-Merger 4 -9.99 5.91 -1.6 6 Not Significant
Post Merger 4 -3.91 4.05
The test for difference of mean was applied to check whether the difference in the pre merger and post merger was significant or not. The test results show that the difference in the pre joint venture and post joint venture period was non-significant (p=.0.070501at 5% level of significance). Hence the hypothesis taken ‘There is a considerable difference between pre & post merger financial performance’ is proved to be rejected.
Graphical representation of the above the above position- Figure 6: Pre & Post Merger ROI Ratio Position of TATA TELESERVICES
(G) Earnings Per Share of NTT DoCoMo
PERIOD N MEAN SD t Degree of freedom
Result
Pre-Merger 4 127.635 24.01 1.035 6 Not Significant
Post-Merger 4 115.05 3.76
The test for difference of mean was applied to check whether the difference in the pre-merger and post-merger was significant or not. The test results show that the difference in the pre joint venture and post

A Case Study on Pre and Post Joint Venture Analysis of Ntt Docomo and Tata Teleservices with Financial and HR Perspective 61
Tecnia Journal of Management Studies Vol. 13 No. 1, April 2018 - September 2018
joint venture period was non-significant (p=0.170238at 5% level of significance). Hence the hypothesis taken ‘There is a considerable difference between pre & post merger financial performance’ is proved to be rejected.
Graphical representation of the above the above position- Figure 7: Pre & Post joint ventureEPS Ratio of NTT DoCoMo
(H) Earning Per Share of TATA TELESERVICES
PERIOD N MEAN SD t Degree of freedom
Result
Pre-Merger 4 -2.19 1.27 -1.2 6 Not Significant
Post-Merger 4 -1.8775 1.17
The test for difference of mean was applied to check whether the difference in the pre merger and post-merger was significant or not. The test results show that the difference in the pre joint venture and post joint venture period was non-significant (p=0.121517at 5% level of significance). Hence the hypothesis taken ‘There is a considerable difference between pre & post-merger financial performance’ is proved to be rejected.
Graphical representation of the above the above position- Figure 8: Pre & Post joint venture EPS Ratio Position of TATA TELESERVICES
(I) Dividend Payout Ratio of NTT DoCoMo
PERIOD N MEAN SD t Degree of freedom
Result
Pre Merger 4 38.28 .06 -2.98 6 Not Significant
Post Merger 4 36.21 24.01
The test for difference of mean was applied to check whether the difference in the pre-merger and post-

62 Lata Rani, Chanchal Sharma, Swati Shrivastava
Tecnia Journal of Management Studies Vol. 13 No. 1, April 2018 - September 2018
merger was significant or not. The test results show that the difference in the pre joint venture and post joint venture period was significant (p=.012262 at 5% level of significance). Hence the hypothesis taken ‘There is no considerable difference between pre & post-merger financial performance’ is proved to be rejected
Graphical representation of the above the above position- Figure 9: Pre & Post Merger Dividend Payout Ratio Position of NTT DoCoMo
(J) Dividend Payout Ratio of Tatatele Services
PERIOD N MEAN SD t Degree of freedom
Result
Pre-Merger 4 - - - 6 *
Post-Merger 4 - -
Graphical representation of the above the above position- Figure 10: Pre & Post Joint venture Dividend Payout Ratio Position of TATATELESERVICES
(K) Debt Equity Ratio of NTT DoCoMo
PERIOD N MEAN SD t Degree of freedom
Result
Pre-Merger 4 0.1375 .485 1.72 6 Not Significant
Post-Merger 4 0.08 .414
The test for difference of mean was applied to check whether the difference in the pre-merger and post-merger was significant or not. The test results show that the difference in the pre joint venture and post joint venture period was non-significant (p=0.06729 at 5% level of significance). Hence the hypothesis taken ‘There is a considerable difference between pre & post-merger financial performance’ is proved to be rejected.
Graphical representation of the above the above position- Figure 11: Pre & Post joint venture Debt Equity Ratio Position of NTT DoCoMo
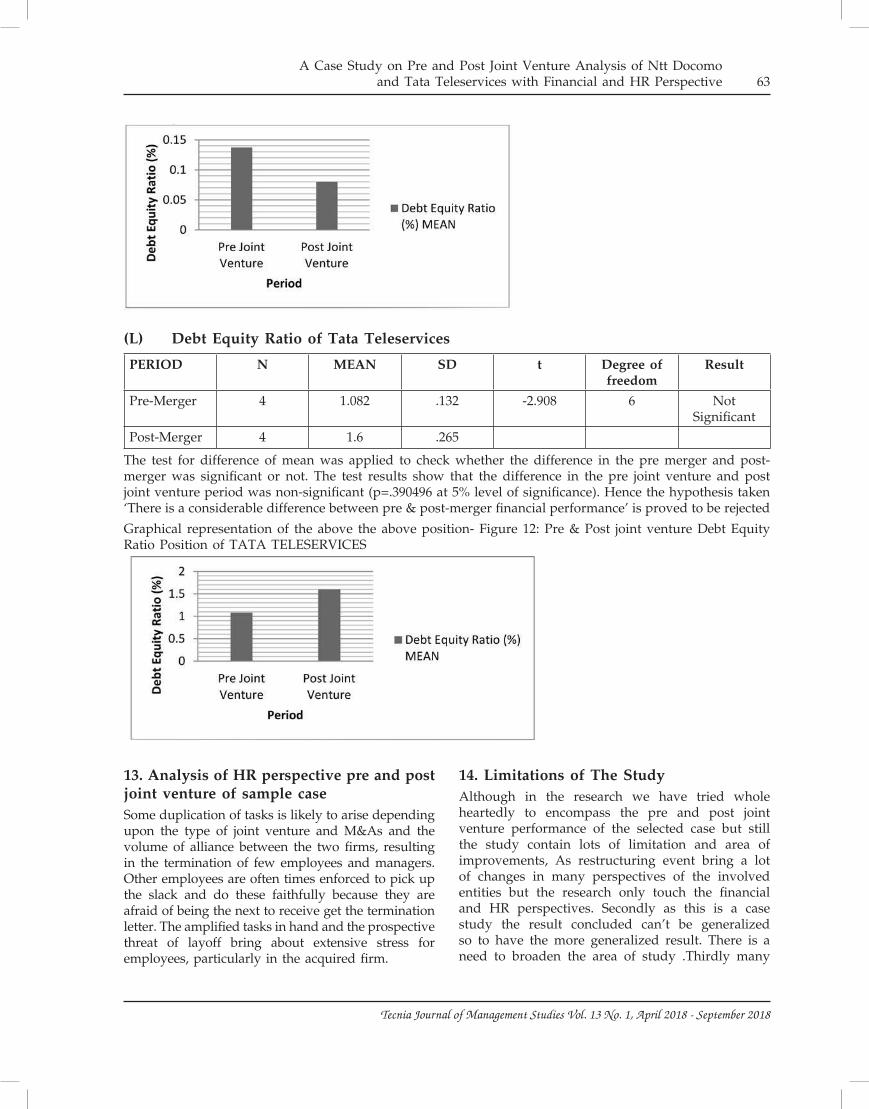
A Case Study on Pre and Post Joint Venture Analysis of Ntt Docomo and Tata Teleservices with Financial and HR Perspective 63
Tecnia Journal of Management Studies Vol. 13 No. 1, April 2018 - September 2018
(L) Debt Equity Ratio of Tata Teleservices
PERIOD N MEAN SD t Degree of freedom
Result
Pre-Merger 4 1.082 .132 -2.908 6 Not Significant
Post-Merger 4 1.6 .265
The test for difference of mean was applied to check whether the difference in the pre merger and post-merger was significant or not. The test results show that the difference in the pre joint venture and post joint venture period was non-significant (p=.390496 at 5% level of significance). Hence the hypothesis taken ‘There is a considerable difference between pre & post-merger financial performance’ is proved to be rejected
Graphical representation of the above the above position- Figure 12: Pre & Post joint venture Debt Equity Ratio Position of TATA TELESERVICES
13. Analysis of HR perspective pre and post joint venture of sample caseSome duplication of tasks is likely to arise depending upon the type of joint venture and M&As and the volume of alliance between the two firms, resulting in the termination of few employees and managers. Other employees are often times enforced to pick up the slack and do these faithfully because they are afraid of being the next to receive get the termination letter. The amplified tasks in hand and the prospective threat of layoff bring about extensive stress for employees, particularly in the acquired firm.
14. Limitations of The StudyAlthough in the research we have tried whole heartedly to encompass the pre and post joint venture performance of the selected case but still the study contain lots of limitation and area of improvements, As restructuring event bring a lot of changes in many perspectives of the involved entities but the research only touch the financial and HR perspectives. Secondly as this is a case study the result concluded can’t be generalized so to have the more generalized result. There is a need to broaden the area of study .Thirdly many

64 Lata Rani, Chanchal Sharma, Swati Shrivastava
Tecnia Journal of Management Studies Vol. 13 No. 1, April 2018 - September 2018
financial indicators are still untouched which can be responsible for major changes. Finally the limitation of the availability of HR related data.
15. ConclusionsTo analyze the financial performance of sample case during pre & post joint venture period, six major financial ratios were used as financial indicators. On the basis of analytical study of the sample case, the following conclusions have been drawn which are perfectly in the line of objectives predetermined:
• The results of independent Sample-t test were not significant which further proves that this particular joint venture was not fruitful for the Tata Teleservices and NTT DoCoMo. The hypothesis has also been proved as null. The sample-t test was undertaken to calculate the difference between the mean values. But, the difference between pre and post joint ventures was not much which further signifies that the company was earning losses.
• Although this particular case study shows that this joint venture was not successful but still there can be another reasons also which plays an important role such as the HR related issues, government policies, decrease in the shareholder’s wealth.
• Tata Teleservices was already suffering from loss but after the joint venture NTT DoCoMo also started suffering loss. Due to this very reason NTT DoCoMo has moved from this particular joint venture.
16. SuggestionsAfter concluding the results of this study, the following suggestions have been laid out:
• To have more generalized result the area of the study need to more broaden and diversified.
• In this sample study we have observed that economic environment like limited resources, obsolete technology, poor management pattern,
inadequate marketing efforts and weak government policies etc. are the basic reason of lesser growth of telecommunication sector It is therefore suggested to re-organize this sector through financial restructuring but in financial restructuring supportive and flexible government policies are must..
• In order to make sense of HRM challenges in the different types of joint ventures a strategic fit should be built between joint ventures and HRM strategies.
• More case studies can be taken to be compared with each other so that we can have more precise factors for the failure and success of the restructuring events.
References• Bower, J.L. (2001) ‘Not all M&As Are Alike and
that Matters’, Harvard Business Review, Reprint R0103F
• Chandler, A. (1962) Strategy and Structure. Cambridge, MA: MIT Press.
• Fombrun, C., Tichy, N. and Devanna, M. (1984) Strategic Human Resource Management. New York: Wiley.
• Nalwaya N. and Vyas R. (2014) ‘Merger and Acquisition in the Telecom Industry: An Analysis of Financial Performance of Vodafone Plc and Hutchison Essar’ Journal of Marketing & Communication, Vol. 9 Issue 3
• Pikula, Deborah A. (1999) Mergers & Acquisitions: Organizational Culture & HR Issues
• Sanz-Valle, R., Sabater-Sanchez, R. and Aragon-Sanchez, A. (1999) ‘Human Resource Management and Business Strategy Links: An Empirical Study’, International Journal of Human Resource Management, 10: 655–71.
• Schuler, R. and Jackson, S. (1987) ‘Linking Competitive Strategy and Human Resource Management Practices’, Academy of Management Execvutive, 3: 207–19.

65
Tecnia Journal of Management Studies Vol. 13 No. 1, April 2018 - September 2018
tecnIa journal of management studIes Policies, Ethics and Guidelines
Tecnia Journal of Management Studies is a bi-annual, double blind peer-reviewed Journal published by
Tecnia Institute of Advanced Studies. The journal focuses on publishing scholarly articles from the area of management sciences.
TJMS provides a platform to the Academicians, Research Scholars, Corporate Executives and Management Students to sharpen their knowledge in their respective areas of specialization in Management Studies. Through peer-review process, the professional development of scholars, practitioners, and doctoral students are enhanced.
TJMS seeks original manuscripts that identify, extend, unify, test or apply scientific and multi-disciplinary knowledge concerning management field.
The following types of papers are considered for
publication :
• Original research works in the field of management.
• Surveys, opinions, abstracts and essays related tothe research based Management issues.
• Few Book review papers may also be considered for publication, if the author has done considerable professional work in that area.
• Case studies related to management domain.
More specifically, TJMS publishes papers that :
• Address the interface between theoretical insight and practical application.
• Enhance the teaching of management, especially through the use of experiential pedagogies.
• Represent the early stages of theorizing about management and organizing in unique and perceptive ways.
• Serve as a resource for our readers’ professional development.
Policies and ethics
Policies for authors
The publication of an article in a peer-reviewed journal is an important building block in the development of a coherent and respected network of knowledge. It is a direct reflection of the quality of work of the author and the institutions that support them. Peer-reviewed articles support and embody the scientific method. It is therefore important to agree upon standards of projected ethical behavior.
Following is the Information for authors about how to publish ethically :-
Ethics topics to consider when publishing:
• Authorship of the paper: Authorship should be limited to those who have made a significant contribution to the conception, design, execution, or interpretation of the reported study.
• Originality and plagiarism: The authors should ensure that they have written entirely original works, and if the authors have used the work and/or words of others that this has been appropriately cited or quoted.
• Data access and retention: Authors may be asked to provide the raw data in connection with a paper for editorial review, and should be prepared to provide public access to such data.
• Multiple, redundant or concurrent publication: An author should not in general publish manuscripts describing essentially the same research in more than one journal or primary publication. TJMS does not view the following uses of a work as prior publication: publication in the form of an abstract; publication as an academic thesis; publication as an electronic preprint.
• Acknowledgement of sources : Proper acknowledgment.
• Disclosure and conflicts of interest: All submissions must include disclosure of all relationships that could be viewed as presenting a potential conflict of interest.
• Fundamental errors in published works: When an author discovers a significant error or inaccuracy in his/her own published work, it is the author’s obligation to promptly notify the journal editor or publisher and cooperate with the editor to retract or correct the paper.
• Reporting standards: Authors of reports of original research should present an accurate account of the work performed as well as an objective discussion of its significance.
• Hazards and human or animal subjects: Statements of compliance are required if the work involves chemicals, procedures or equipment that have any unusual hazards inherent in their use, or if it involves the use of animal or human subjects.
• Use of patient images or case details: Studies on patients or volunteers require ethics committee

66
Tecnia Journal of Management Studies Vol. 13 No. 1, April 2018 - September 2018
approval and informed consent, which should be documented in the paper.
Research Paper Submission ...
All manuscripts must be submitted by email to the editor at [email protected] attached file should be named according to the title of your article and mention the journal name while submitting for review.
Before submitting your manuscripts please make sure that you have gone through the Guidelines for Author section. Also ensure that your article confirms to the terms and conditions specified. After receiving your research article, we will send the acknowledgement email with a manuscript number within 1-2 days. And for any future correspondence with us, please mention your manuscript number.
Review Process ...
The objective of review process is to ensure that high quality and original scientific studies are published. The research paper/articles submitted by the authors’ undergo following processes before publication.
• After receiving the manuscript, a n acknowledgement is sent to the author. All manuscripts submitted for publication are initially viewed by minimum two members of the editorial board. The author(s) are fully responsible for the originality of the articles contributed.
• After initial screening process, the manuscripts are sent to two referees for double blind review. The referees are chosen according to their expertise in the field. They evaluate the manuscript based on the reviewers guideline and recommend for publication/rejection. For articles that are not accepted for publication, authors are informed accordingly.
• After favorable opinion from referees, the editorial board will take the final decision for publication of the article in particular volume of the journal, dependent upon the pendency in hand. At this stage, an acceptance letter is sent to the author, confirming the tentative time frame for the publication of the article. Along with the confirmation, a performa on “confirmation of the originality and exclusiveness of the submission” is sent to the author. This performa duly filled in and signed by the author is to be sent back to the institute within one week of its receipt.
• An effort is made to complete the above listed review process within time span of three months of the receipt of the article, subject to absolute adherence to the Institute guidelines and completeness in all respects.
Conditions apply : The editorial board of the journal reserves the right to make suitable amendments in the final draft of the articles to suit the journal’s standard
and other requirements.
Guidelines for Authors ...
Authors can submit the manuscript provided it contains original work and not published either in any print or online journal or book. Also it must not be under consideration for publication elsewhere. Authors are expected to meet the following guidelines :
Copyright : The copyright for articles published in journal are retained by the authors with first publications right granted to the journal. The journal or editors are not responsible for any successive use of the author(s) work. It is the author’s responsibility to take any infringement action, if so desired by the author.
General Instructions : The manuscripts should be error free to the maximum extent possible. Along with the manuscript, author(s) should provide declaration that the article is the original work of the author(s) and that it has not been published or submitted for publication anywhere else. Authors are requested to submit the manuscript (hardcopy) along with a softcopy (CD-ROM) using MS Word processing package. The soft copy of the manuscript may also be sent through e-mail* with attachment. The selection of papers for publication will be based on their originality, relevance and clarity, the extent to which they advance knowledge, understanding and application and their likely contribution towards inspiring further research and development.
The articles will be sent to the evaluation board for approval and only the selected articles will be published. Authors may be asked to revise and resubmit the manuscript based on the referees’ comments. Unaccepted papers will not be sent back. Copyright of all accepted papers will vest with the journal.
Guidelines : The copyright for articles published in journal are retained by the authors with first publications right granted to the journal. The journal or editors are not responsible for any successive use of the author(s) work. It is the author’s responsibility to take any infringement action, if so desired by the author.
Based on American Psychological Association (APA) Style Manual :
1. Manuscripts must be typed on one side of the page in 12-point font on A-4 size paper in doublespace, with the margins of 1.5 inches on all sides to facilitate editing and styling. All text, including abstract, quotations, notes and references should be typed in double-space.
2. The page number must be on all pages of the paper, including the title page. Use Arabic numerals and position the page number one inch from the right hand edge of the paper, in the space between the top edge of the paper and the first line of text.
67
Tecnia Journal of Management Studies Vol. 13 No. 1, April 2018 - September 2018
3. The title of the paper must be typed in upper and lower case letters, and is centered between the left and right margins and positioned in the upper half of the page. If the title is two or more lines in length, double-space between the lines.
4. The manuscript must include a reference list at the end, which list the articles, books, etc. cite in the paper. The reference list must be double-spaced, and in alphabetical order.
5. The manuscript should be sent along with a cover page containing article title, author’s name, designation, official address, contact address, phones, fax numbers, and e-mail address. Details of the author’s name and other information should not appear elsewhere in the manuscript.
6. The cover letter should indicate the title, the names, addresses, phone, fax numbers and e-mail addresses of two or three relevant reviewers for your paper. These may or may not be considered by the Editorial Advisory Board.
7. Manuscripts should be in English language(British version) only. There should not be any grammatical and sentence composition errors. Articles should not ordinarily exceed 5000 words exclusive of charts, tables and other graphics. Present each figure and table on a separate sheet of paper, gathering them together at the end of the article. Use short and crisp titles and headings in tables and figures. Include a mention of each figure or table in the text itself in the margin where the figure or table should go.
8. Abstract (between 150-200 words) outlining the purpose, scope and conclusions of the paper. No abstracts are required for review essays or case studies.
9. Quotes should be cited accurately from the original source, should not be edited and should give the page numbers of the original publication.
10. Notes should be numbered serially and presented at the end of the article.
11. No stop after abbreviations (ISO, USA, BBS, MBA etc.) Use stop after initials (B.P. Singh).
12. Only those book reviews will be accepted that pertain to Business Management or allied disciplines. The book review must contain the title of the book, author’s name, publisher’s name, year of publication, price, ISBN etc. The review should not normally exceed 2000 words.
13(A). Rules for citing the books on the reference list.
a) Use the author’s surname and initial(s) only. Donot use first names, degrees, and the like.
b) Cite all authors listed for the book in the order they are listed.
c) Follow the author’s name with the year of publication. Year of publication will be in parentheses.
d) The title of the book is next and it is italicized. Only the first word in the title or any proper name should be in upper case.
e) The place of publication follows.
f) The publisher of the book is listed last followed by a period ( . ).
g) Space must be after periods that separate the parts of the citation and after the periods of the initials in personal names.
h) Often, no single example from the manual will fit your citation exactly; in that case follow the closest example possible or combine appropriate elements from two examples.
References : Books (Citation)
Zeithaml, V.A., Parasuraman, A. & Berry, L.L. (1990). Delivering Quality Service: Balancing Customer Perceptions and Expectations: p.18. New York: The Free Press.
Edited Book
Harrington, D.M. (1990). The Ecology of Human Creativity: A psychological perspective. In Runco, M.A., & Albert, R.S., (Eds). Theories of creativity (pp. 143-169). Newbury Park, CA: Sage.
Book by a Corporate Author
Committee of Public Finance. (1979). Public finance. New York: Pitman.
13(B). Rules for citing the periodical articles on the reference list.
The Reference section appears at the end of the paper and lists all the research materials, which have been used.
a) Use the author’s surname and initial(s) only. Do not use first names, degrees, and the like.
b) Cite all authors in the Reference list in the order they are listed with the source.
c) Following the author information, give the date of publication in parentheses.
d) For weekly and daily periodical/magazines such as newspapers and popular magazines, cite the year, month and day.
For monthly article/magazine, cite the year and the month.
For the professional journals, cite only the year.
e) The title of the article follows. Only the first letter of the first word of the title or subtitle or any proper name appearing in the title should be in upper case.

68
Tecnia Journal of Management Studies Vol. 13 No. 1, April 2018 - September 2018
f) The title of the journal (in italic) comes next, followed by the volume number, and if appropriate, the issue number. If the journal uses continuous pagination, i.e., it runs page numbers throughout a year or volume; no reference to an issue number is needed. In that case, the title of the journal is italicized, as well as the volume number.
g) If the journal is re-paged issue by issue, i.e., each issue has a page number 1, then the issue number must follow the volume number. The issue number is in parentheses but is not italicized.
References : Articles (Citation)
Weekly Magazine/Article :
Singh, N. and Srinivasan T.N. (2005, May 21-27). Foreign Capital, Deficits and Growth. Economic and Political Weekly, XL, (21), 2196-2197.
Monthly Magazine/Article :
Gupta, K. (2005, May). Durables: On a Fast Track. Pitch 11(8), 42-50.
Professional Journal (continuous pagination)
Taylor, M.A. & Callahan, J.L. (2005). Bringing creativity into being: Underlying assumptions that influence methods of studying organizational creativity. Advances in Developing Human Resources, 7, 247-270.
(Re-paged issue)
Prasad, T. (2005). Mandi: A Field Sales Campaign for Teaching Personal Selling Skills through Experiential Approach. IIMB Management Review Advances in Developing Human Resources, 17(1), 87-94.
13(C). Other References (Citation)
Newspaper Article
Maira, A. (2005, February 25). Putting humanity into capitalism. The Economic Times. P.16.
Computer Software
Soldan, T.J. & Spain J.D. (1984). Population growth [Computer software]. City, state (2 letters): Conduit.
Electronic Database
U.S. Department of Labor (1991). What work requires of schools. Retrieved August 15, 24, from http://wdr. doleta.gov/SCANS/whatwork/whatwork.pdf
Paper Presentation
McCollum, E.E. & Callahan, L.L. (22, November). The narrative assessment interview: The use of a psychoanalytic tool to evaluate a leadership development program. Paper presented at the American Evaluation Association Conference, Washington, DC.
Ph.D Thesis
Kumar, Ajay. (2005) “Human Resource Development Practices and their impact on Organizational Effectiveness (A Study of Selected Industrial Organizations)”, Ph.D. Thesis, University of Delhi, Delhi.
Call for Papers ...
TJMS invites scholars, researchers, professionals and academicians to publish their research papers in the journal. The author(s) can submit their manuscript covering any of the following areas of business and management.
All the manuscript should be submitted in soft-copies to [email protected].
Author(s) must ensure that the manuscript is a original work and is not submitted for publication elsewhere.
Please see author guidelines.
• The research paper submitted by the authors’ will undergo a review process to ensure publication of high quality work. Please see the review process.
• A sample research paper is available on the journal site. This can be used as a template by the author(s) for developing manuscript.
Accounting and Finance International Business Research Methodology IT Management
General Management Entrepreneurship Hospitality Management Retail Management
Human Resource Management Operations Management Project Management Real Estate Management
Marketing Management Organizational Behavior Strategic Management Supply Chain & Logistic


TECNIA Journal of Management Studies
ISSN – 0975 – 7104Regn. No.: DELENG/2006/20585
Bi-Annual Double Blind Peer Reviewed Refereed Journal
TECNIA Journal of Managem
ent Studies
TECNIA INSTITUTE OF ADVANCED STUDIES
(Approved by AICTE, Ministry of HRD, Govt. of India and affiliated to GGSIP University, Recognized under Sec 2(f) of UGC Act 1956)Rated as “A++” Category - Best Business School by AIMA & 'A' by Govt. NCT of Delhi
Indexed in J. Gate E-Content
Where Dreams are Chiselled into Reality
TECNIA INSTITUTE OF ADVANCED STUDIES
Madhuban Chowk, Rohini, Delhi-110 085Ph.: 011-27555121-124, Fax: 011-27555120E-Mail: [email protected], Website: www.tiaspg.tecnia.in ISO 9001-2015
Certified Institute
(Approved by AICTE, Ministry of HRD, Govt. of India and affiliated to GGSIP University, Recognized under Sec 2(f) of UGC Act 1956)
ISO 14001ISC GLOBAL
ISO 14001:2015
ISO 9001
ISO 9001:2015
ISC GLOBAL
Impact of Make in India program- Is lion moving Backward?
Sandeep Kumar, Sweta Bakshi
Role of innovation in entrepreneurship of globalised world - a case study
Sambhavana Gupta, Ritesh Gupta, DD Chaturvedi, Sandeep Kumar
Emerging Issues and Changing Face of Accounting
Anurag Agnihotri, Julee Banerjee, Surbhi Gupta and Krishna Gupta
7 P’s of marketing mix in the selected hotels of Rajsthan
Vandana Gupta
Bancassurance: Convergence of Banking and Insurance and its Implications on
the Development of Banking and Insurance Industry
R P Tulsiyan, MK Gupta, Ashok Aggarwal and Rakesh Gupta
A Descriptive Study on Factors Affecting the Quality of the Indian Higher Education
Madhavendra Nath Jha and Urvashi Ghai Khosla
An Assessment of Factors of Social Media Advertisement on Purchase Intention
Karishma Arora, Prof R. K. Sharma
A Case Study on Pre and Post Joint Venture Analysis of Ntt Docomo and Tata Teleservices With
Financial and HR Perspective
Lata Rani, Chanchal Sharma and Swati Shrivastava
NAAC ACCREDITED GRADE “A” INSTITUTE
Vo
l. 13 N
o. 1
.Ap
ril 2018
– S
ep
tem
ber 2
018
Vol. 13 No. 1. April 2018 - September 2018