cover page - corporate ip management benchmarking survey · 1. 2011 ipo corporate ip management...
TRANSCRIPT

© 2011 Intellectual Property Owners Association
2011 IPO Corporate IP Management
Benchmarking Survey
November 2011
© 2011 Intellectual Property Owners Association
Table of Contents Page
PART I: Organizational Data (Industry sector, total employee numbers, size of IP budget as compared to research and development)……………………………………………………………………….1
PART II: IP Staffing (Employee numbers by industry in IP departments, worldwide)……………………………..11
PART III: IP Department Structure/Function (Reporting structure, percent time of spent by in-house professionals on various issues)…………………………………………………………………………………………….…15 PART IV: Financial (Dollars spent by industry on patent procurement, treatment of IP generated income)......20
PART V: Outside Counsel (Billing arrangements, cost of opinions, number of outside firms and size of firm used, insurance issues)……………………………………………………………………..….…22
PART VI: Operational Data (Invention disclosures received, applications filed, use of outsourcing various functions, foreign filing activity, awards/financial incentives for inventors)………………....33
Notes:
1. This is the third time IPO has conducted this survey. It incorporates many of the questions from IPO’s 2006 and 2009 benchmarking surveys.
2. In some industries, the response rate was extremely low. While the data for those industries is not as meaningful as others, the data is presented in a format similar to the 2009 survey report to enable comparison.
3. The survey was developed by IPO's Corporate IP Management Committee with the help of the IPO staff. We extend special thanks to Russell Binns and John Williamson.
4. The survey respondents were primarily Chief Patent Counsel and Chief IP Counsel with responsibility for patents and trademarks at their companies.
5. Numbers in parentheses represent the number of respondents.
1. 2011 IPO Corporate IP Management Benchmarking Survey
Page 1
PART I: ORGANIZATIONAL DATA
1. Identify the single industry sector that most closely describes your company: 58 Companies
2. Number of total worldwide employees:
Chemical/Pharmaceutical/Biotechnology/Medical Devices: Consumer Products/Food & Beverage: 6 Companies
20 Companies
Electrical/Electronics/Components: 10 Companies Information Services/Other Communications
/Media: 3 Companies

1. 2011 IPO Corporate IP Management Benchmarking Survey
Page 2
Mechanical and Machinery: 3 Companies Software/Computers/Peripherals: 3 Companies
Other: 13 Companies
2.1. Percentage of employees in the U.S.:
58 Companies Mean Median
Chemical/Pharmaceutical/Biotechnology/Medical Devices: 20 Companies 45% 50%
Consumer Products/Food & Beverage: 6 Companies 51% 50%
Electrical/Electronics/Components: 10 Companies 42.5% 43.5%
Information Services/Other Communications/Media: 3 Companies 57% 50%
Mechanical and Machinery: 3 Companies 55% 50%
Software/Computers/Peripherals: 3 Companies 36% 30%
Other: 13 Companies 48% 35%
1. 2011 IPO Corporate IP Management Benchmarking Survey
Page 3
3. Number of total worldwide R&D employees:
Chemical/Pharmaceutical/Biotechnology Consumer Products/Food & Beverage: 6 Companies
/Medical Devices: 20 Companies
Electrical/Electronics/Components: 10 Companies Information Services/Other Communications
/Media: 3 Companies
Mechanical and Machinery: 3 Companies Software/Computers/Peripherals: 3 Companies
Other: 13 Companies
1. 2011 IPO Corporate IP Management Benchmarking Survey
Page 4
3.1. Percentage of R&D employees in the U.S.:
4. Last completed fiscal year revenue range:
Chemical/Pharmaceutical/Biotechnology Consumer Products/Food & Beverage: 6 Companies
/Medical Devices: 20 Companies
Electrical/Electronics/Components: 10 Companies Information Services/Other Communications
/Media: 3 Companies
Mechanical and Machinery: 3 Companies Software/Computers/Peripherals: 3 Companies
58 Companies Mean Median
Chemical/Pharmaceutical/Biotechnology/Medical Devices: 20 Companies 57% 69%
Consumer Products/Food & Beverage: 6 Companies 73% 80%
Electrical/Electronics/Components: 10 Companies 55% 59%
Information Services/Other Communications/Media: 3 Companies 63% 50%
Mechanical and Machinery: 3 Companies 72% 68%
Software/Computers/Peripherals: 3 Companies 43% 40%
Other: 13 Companies 63% 80%
1. 2011 IPO Corporate IP Management Benchmarking Survey
Page 5
Other: 13 Companies
5. Last completed fiscal year budget for Research & Development:
Chemical/Pharmaceutical/Biotechnology Consumer Products/Food & Beverage: 6 Companies
/Medical Devices: 20 Companies
Electrical/Electronics/Components: 10 Companies Information Services/Other Communications
/Media: 3 Companies
Mechanical and Machinery: 3 Companies Software/Computers/Peripherals: 3 Companies
1. 2011 IPO Corporate IP Management Benchmarking Survey
Page 6
Other: 13 Companies
6. Are all intellectual property functions centralized in one Intellectual Property Department?
Chemical/Pharmaceutical/Biotechnology Consumer Products/Food & Beverage: 6 Companies
/Medical Devices: 20 Companies
Electrical/Electronics/Components: 10 Companies Information Services/Other Communications
/Media: 3 Companies
Mechanical and Machinery: 3 Companies Software/Computers/Peripherals: 3 Companies
1. 2011 IPO Corporate IP Management Benchmarking Survey
Page 7
Other: 13 Companies
6.1. What functions are included in or controlled by the Intellectual Property Department?
(check all that apply)
6.2. How many other departments have intellectual property attorneys or intellectual property functions?
Intellectual Property Department?
7. Last completed fiscal year budget for Intellectual Property Department:
Chemical/Pharmaceutical/Biotechnology Consumer Products/Food & Beverage: 6 Companies
/Medical Devices: 20 Companies
11 Companies %
Patent Prosecution 100%
IP Litigation 45%
IP Licensing 82%
Trademarks 73%
Transaction/Commercial/Contracting 64%
Copyrights 73%
M&A IP due diligence 82%
Other 9%
11 Companies Mean Median
2 2

1. 2011 IPO Corporate IP Management Benchmarking Survey
Page 8
Electrical/Electronics/Components: 10 Companies Information Services/Other Communications
/Media: 3 Companies
Mechanical and Machinery: 3 Companies Software/Computers/Peripherals: 3 Companies
Other: 13 Companies
8. The percentage of the IP budget to the R&D budget for the last completed fiscal year:
Chemical/Pharmaceutical/Biotechnology Consumer Products/Food & Beverage: 6 Companies
/Medical Devices: 20 Companies
1. 2011 IPO Corporate IP Management Benchmarking Survey
Page 9
Electrical/Electronics/Components: 10 Companies Information Services/Other Communications
/Media: 3 Companies
Mechanical and Machinery: 3 Companies Software/Computers/Peripherals: 3 Companies
Other: 13 Companies
9. The percentage of the IP budget to the revenue for the last completed fiscal year:
Chemical/Pharmaceutical/Biotechnology Consumer Products/Food & Beverage: 6 Companies
/Medical Devices: 20 Companies

1. 2011 IPO Corporate IP Management Benchmarking Survey
Page 10
Electrical/Electronics/Components: 10 Companies Information Services/Other Communications
/Media: 3 Companies
Mechanical and Machinery: 3 Companies Software/Computers/Peripherals: 3 Companies
Other: 13 Companies

1. 2011 IPO Corporate IP Management Benchmarking Survey
Page 11
PART II: IP STAFFING
10. List the number of full‐time equivalent worldwide IP professionals and full‐time equivalent support staff
employed at the end of the last completed fiscal year and indicate whether or not they were employed in
the company's IP department with Y/N/Mixed. [Ex. 30/Y]
Chemical/Pharmaceutical/Biotechnology/Medical Devices: 20 Companies
Professionals Worldwide (Including U.S.)
Resident in IP Dept.?(Y/N/Mixed)
Mean Median
Professionals
Patent Attorneys 36 12.5 Y
Trademark Attorneys 2.25 1 Mixed
Patent Agents 5.5 2 Y
Patent Paralegals 10 4.5 Y
Trademark Paralegals 3 1 Y
Litigation Attorneys 2 .75 N
Litigation Paralegals 1 0 Mixed
Other Attorneys in IP Group 1 0 Y
Non‐Attorney Professionals 7 1 Y
Support Staff
Docket Clerical 6 1 Y
Secretaries/Administrative 14 4
Dedicated Computer Support 0 0
Other 0 0
Total Professionals and Support Staff 83.5 36.5
Consumer Products/Food & Beverage:4 Companies
Professionals Worldwide (Including U.S.)
Resident in IP Dept.?(Y/N/Mixed)
Mean Median
Professionals
Patent Attorneys 38 11 Y
Trademark Attorneys 11 .75 Y
Patent Agents 12 4
Patent Paralegals .4 .5
Trademark Paralegals 4 .75 Y
Litigation Attorneys .6 0
Litigation Paralegals .3 0
Other Attorneys in IP Group 0 0
Non‐Attorney Professionals 24 5
Support Staff
Docket Clerical 7 1
Secretaries/Administrative 21 4
Dedicated Computer Support 1 1
Other .3 0
Total Professionals and Support Staff 38 33

1. 2011 IPO Corporate IP Management Benchmarking Survey
Page 12
Electrical/Electronics/Components: 10 Companies Professionals Worldwide
(Including U.S.) Resident in IP Dept.?
(Y/N/Mixed)
Mean Median
Professionals
Patent Attorneys 14 4 Y
Trademark Attorneys 1.5 0
Patent Agents 3 2 Y
Patent Paralegals 5.5 4.5
Trademark Paralegals 1 1
Litigation Attorneys 2 1
Litigation Paralegals 1 1
Other Attorneys in IP Group 2.5 2.5
Non‐Attorney Professionals 17 7.5
Support Staff
Docket Clerical 6 1 Y
Secretaries/Administrative 3 2
Dedicated Computer Support 1 1
Other 0 0
Total Professionals and Support Staff 44 18.5
Information Services/Other Communications/Media: 3 Companies
Professionals Worldwide (Including U.S.)
Resident in IP Dept.?(Y/N/Mixed)
Mean Median
Professionals
Patent Attorneys 6 6 Y
Trademark Attorneys 1 1
Patent Agents .5 .5 Y
Patent Paralegals 3 3 Y
Trademark Paralegals 1 1 Y
Litigation Attorneys .5 .5
Litigation Paralegals .5 .5
Other Attorneys in IP Group 0 0
Non‐Attorney Professionals 18 3 Y
Support Staff
Docket Clerical 2 1 Y
Secretaries/Administrative 2 1 Y
Dedicated Computer Support 0 0
Other 0 0 Y
Total Professionals and Support Staff 11.75 11.75
2011 IPO Corporate IP Management Benchmarking Survey
Page 13
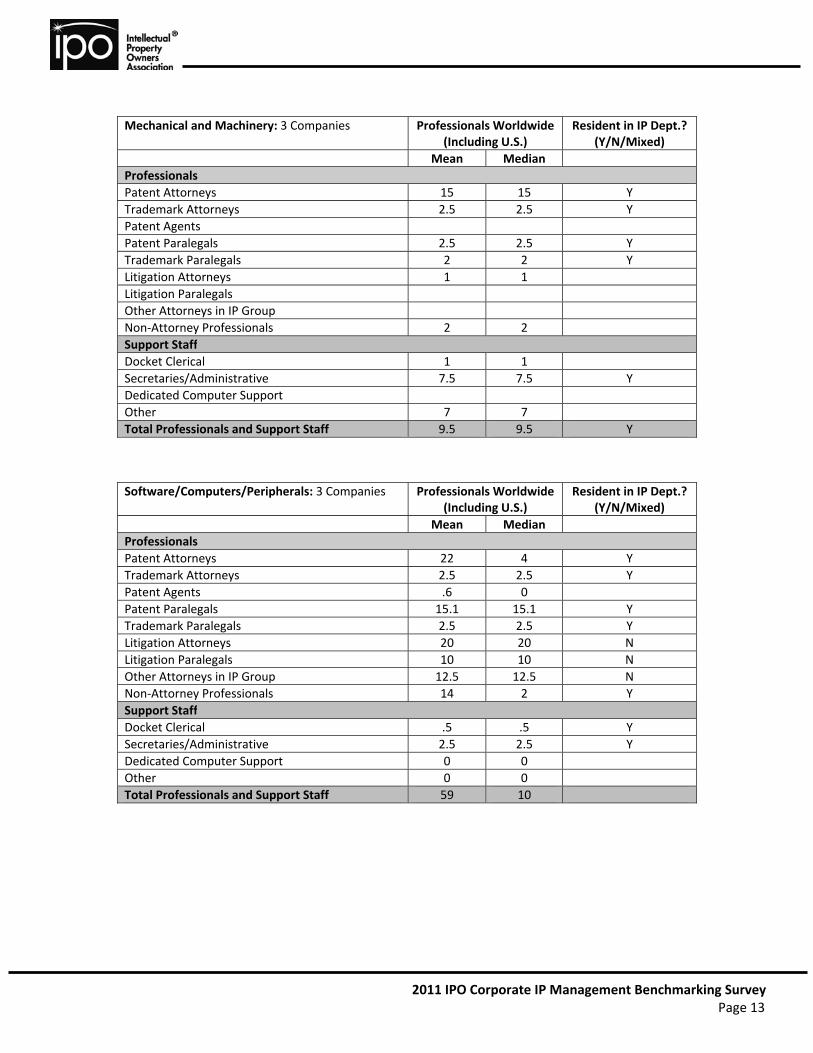
Mechanical and Machinery: 3 Companies Professionals Worldwide (Including U.S.)
Resident in IP Dept.?(Y/N/Mixed)
Mean Median
Professionals
Patent Attorneys 15 15 Y
Trademark Attorneys 2.5 2.5 Y
Patent Agents
Patent Paralegals 2.5 2.5 Y
Trademark Paralegals 2 2 Y
Litigation Attorneys 1 1
Litigation Paralegals
Other Attorneys in IP Group
Non‐Attorney Professionals 2 2
Support Staff
Docket Clerical 1 1
Secretaries/Administrative 7.5 7.5 Y
Dedicated Computer Support
Other 7 7
Total Professionals and Support Staff 9.5 9.5 Y
Software/Computers/Peripherals: 3 Companies Professionals Worldwide (Including U.S.)
Resident in IP Dept.?(Y/N/Mixed)
Mean Median
Professionals
Patent Attorneys 22 4 Y
Trademark Attorneys 2.5 2.5 Y
Patent Agents .6 0
Patent Paralegals 15.1 15.1 Y
Trademark Paralegals 2.5 2.5 Y
Litigation Attorneys 20 20 N
Litigation Paralegals 10 10 N
Other Attorneys in IP Group 12.5 12.5 N
Non‐Attorney Professionals 14 2 Y
Support Staff
Docket Clerical .5 .5 Y
Secretaries/Administrative 2.5 2.5 Y
Dedicated Computer Support 0 0
Other 0 0
Total Professionals and Support Staff 59 10
2011 IPO Corporate IP Management Benchmarking Survey
Page 14
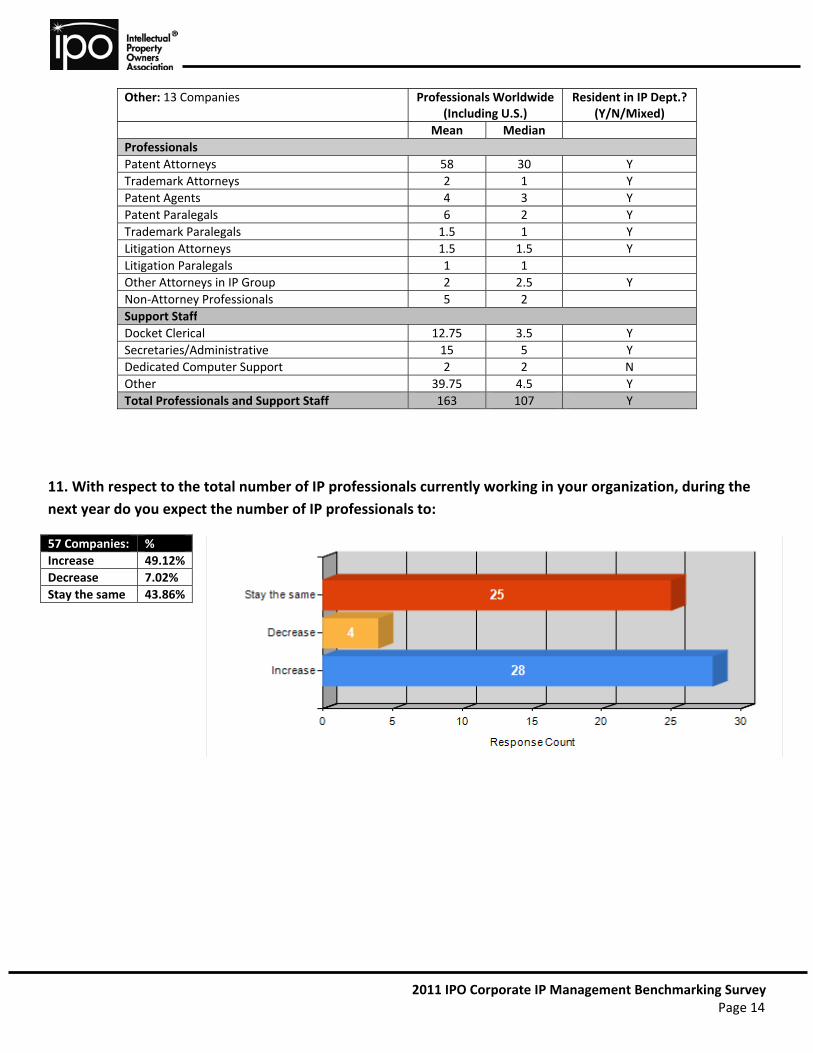
Other: 13 Companies Professionals Worldwide (Including U.S.)
Resident in IP Dept.?(Y/N/Mixed)
Mean Median
Professionals
Patent Attorneys 58 30 Y
Trademark Attorneys 2 1 Y
Patent Agents 4 3 Y
Patent Paralegals 6 2 Y
Trademark Paralegals 1.5 1 Y
Litigation Attorneys 1.5 1.5 Y
Litigation Paralegals 1 1
Other Attorneys in IP Group 2 2.5 Y
Non‐Attorney Professionals 5 2
Support Staff
Docket Clerical 12.75 3.5 Y
Secretaries/Administrative 15 5 Y
Dedicated Computer Support 2 2 N
Other 39.75 4.5 Y
Total Professionals and Support Staff 163 107 Y
11. With respect to the total number of IP professionals currently working in your organization, during the
next year do you expect the number of IP professionals to:
57 Companies: %
Increase 49.12%
Decrease 7.02%
Stay the same 43.86%
2011 IPO Corporate IP Management Benchmarking Survey
Page 15
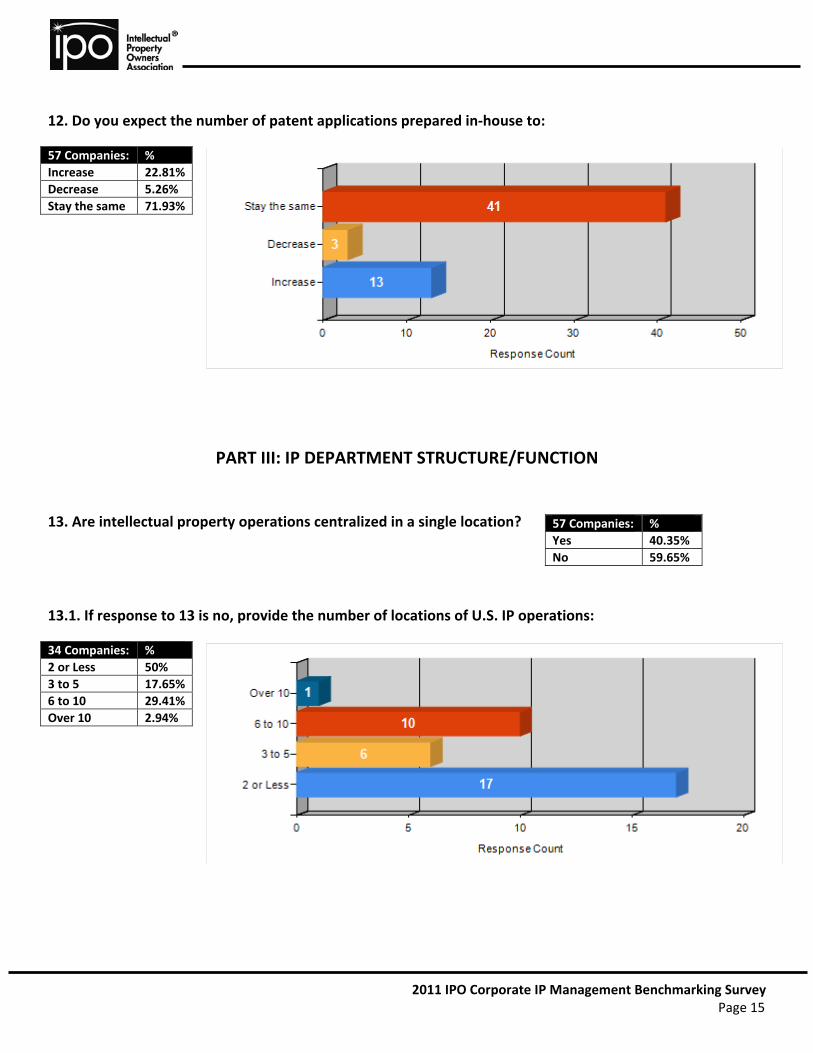
12. Do you expect the number of patent applications prepared in‐house to:
PART III: IP DEPARTMENT STRUCTURE/FUNCTION
13. Are intellectual property operations centralized in a single location?
13.1. If response to 13 is no, provide the number of locations of U.S. IP operations:
57 Companies: %
Increase 22.81%
Decrease 5.26%
Stay the same 71.93%
57 Companies: %
Yes 40.35%
No 59.65%
34 Companies: %
2 or Less 50%
3 to 5 17.65%
6 to 10 29.41%
Over 10 2.94%
2011 IPO Corporate IP Management Benchmarking Survey
Page 16
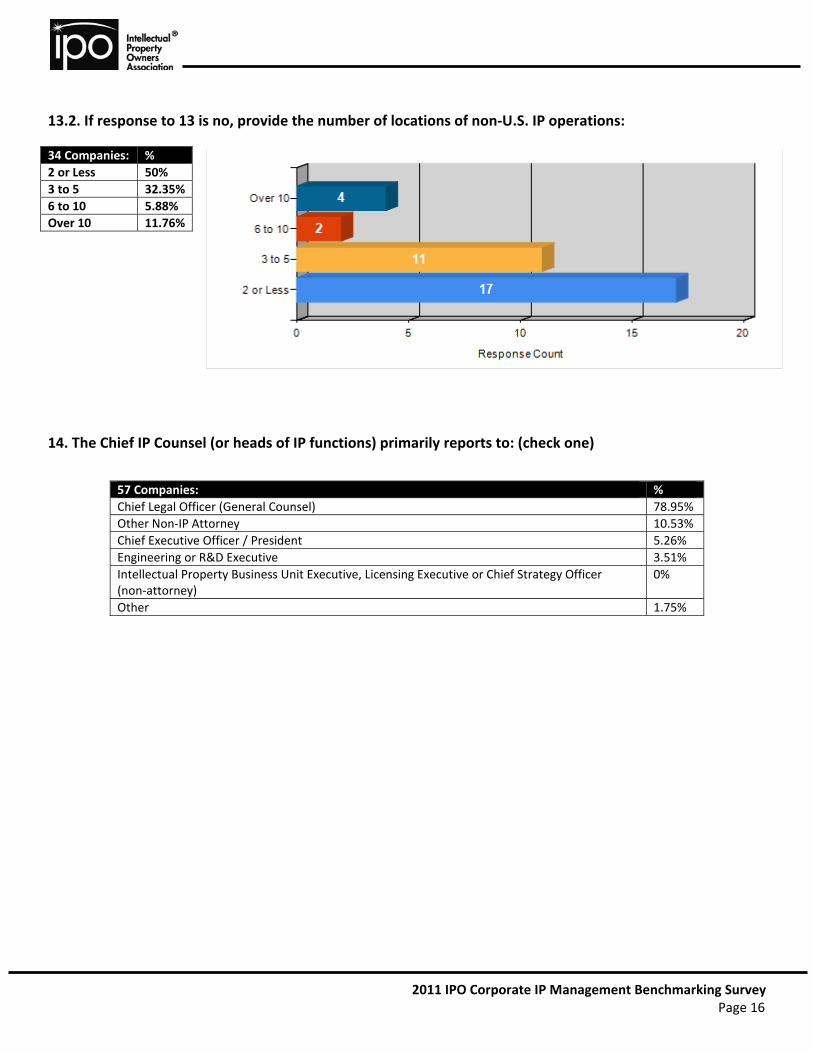
13.2. If response to 13 is no, provide the number of locations of non‐U.S. IP operations:
14. The Chief IP Counsel (or heads of IP functions) primarily reports to: (check one)
34 Companies: %
2 or Less 50%
3 to 5 32.35%
6 to 10 5.88%
Over 10 11.76%
57 Companies: %
Chief Legal Officer (General Counsel) 78.95%
Other Non‐IP Attorney 10.53%
Chief Executive Officer / President 5.26%
Engineering or R&D Executive 3.51%
Intellectual Property Business Unit Executive, Licensing Executive or Chief Strategy Officer (non‐attorney)
0%
Other 1.75%

2011 IPO Corporate IP Management Benchmarking Survey
Page 17
15. Estimate the percentage of time spent (including management of outside counsel) on the following by
in‐house professionals (e.g. attorneys, licensing executives, portfolio managers, patent agents) in support of
the overall IP function (Total should equal 100):
Chemical/Pharmaceutical/Biotechnology/Medical Devices: 20 Companies Mean % Median
US and foreign patent preparations, filing and prosecution (including disclosure review and novelty searching)
34.5 40
Validity and infringement studies 14 15
Commercial support/agreement work 13 11
M&A support 5 4
Trademark preparation, filing and prosecution 3.5 3
Trademark counseling 3 2
Copyright preparation and filing .5 0
Copyright counseling .5 0
Other counseling (trade secret, mask works, etc.) 4 1
Patent Litigation 8 5
Trademark Litigation 1 0
Copyright Litigation 0 0
Licensing/Monetization 5.5 4.5
IP Department administration 6.5 5
Other 1 0
Total 100%
Consumer Products/Food & Beverage: 5 Companies Mean % Median
US and foreign patent preparations, filing and prosecution (including disclosure review and novelty searching)
24.25 25
Validity and infringement studies 16.25 20
Commercial support/agreement work 7 5
M&A support 4 3
Trademark preparation, filing and prosecution 13 10
Trademark counseling 7 5
Copyright preparation and filing .25 0
Copyright counseling .25 0
Other counseling (trade secret, mask works, etc.) 5.5 5
Patent Litigation 8.5 10
Trademark Litigation 3.5 5
Copyright Litigation 0 0
Licensing/Monetization 5.25 5
IP Department administration 5.25 5
Other 0 0
Total 100%

2011 IPO Corporate IP Management Benchmarking Survey
Page 18
Electrical/Electronics/Components: 9 Companies Mean % Median
US and foreign patent preparations, filing and prosecution (including disclosure review and novelty searching)
33.5 35
Validity and infringement studies 8 7
Commercial support/agreement work 10 10
M&A support 6 5
Trademark preparation, filing and prosecution 3.5 3
Trademark counseling 2.5 1
Copyright preparation and filing .25 0
Copyright counseling .25 0
Other counseling (trade secret, mask works, etc.) 2.5 1
Patent Litigation 17 15
Trademark Litigation 1.5 0
Copyright Litigation 0 0
Licensing/Monetization 7 5
IP Department administration 7.5 9
Other .5 0
Total 100%
Information Services/Other Communications/Media: 2 Companies Mean % Median
US and foreign patent preparations, filing and prosecution (including disclosure review and novelty searching)
35 35
Validity and infringement studies 5.5 5.5
Commercial support/agreement work 14.5 14.5
M&A support 5.5 5.5
Trademark preparation, filing and prosecution 5.5 5.5
Trademark counseling 3 3
Copyright preparation and filing 3 3
Copyright counseling 1 1
Other counseling (trade secret, mask works, etc.) 0 0
Patent Litigation 12.5 12.5
Trademark Litigation 0 0
Copyright Litigation 0 0
Licensing/Monetization 3.5 3.5
IP Department administration 8.5 8.5
Other 2.5 2.5
Total 100%
2011 IPO Corporate IP Management Benchmarking Survey
Page 19
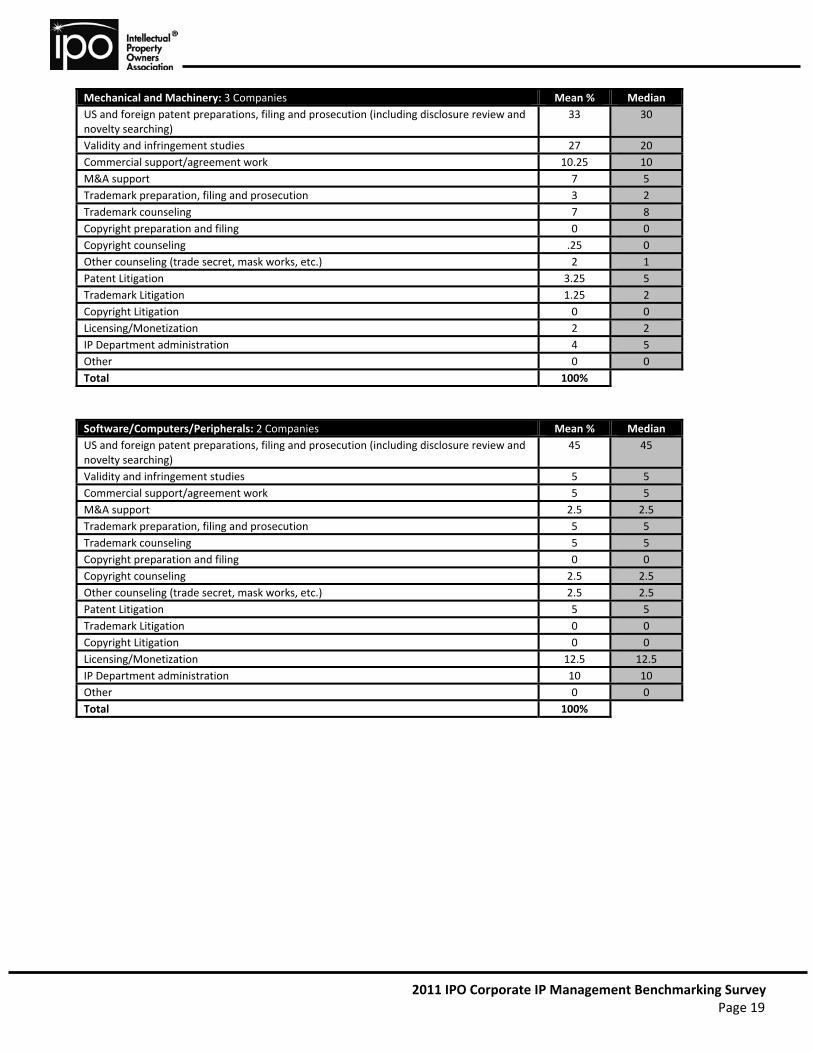
Mechanical and Machinery: 3 Companies Mean % Median
US and foreign patent preparations, filing and prosecution (including disclosure review and novelty searching)
33 30
Validity and infringement studies 27 20
Commercial support/agreement work 10.25 10
M&A support 7 5
Trademark preparation, filing and prosecution 3 2
Trademark counseling 7 8
Copyright preparation and filing 0 0
Copyright counseling .25 0
Other counseling (trade secret, mask works, etc.) 2 1
Patent Litigation 3.25 5
Trademark Litigation 1.25 2
Copyright Litigation 0 0
Licensing/Monetization 2 2
IP Department administration 4 5
Other 0 0
Total 100%
Software/Computers/Peripherals: 2 Companies Mean % Median
US and foreign patent preparations, filing and prosecution (including disclosure review and novelty searching)
45 45
Validity and infringement studies 5 5
Commercial support/agreement work 5 5
M&A support 2.5 2.5
Trademark preparation, filing and prosecution 5 5
Trademark counseling 5 5
Copyright preparation and filing 0 0
Copyright counseling 2.5 2.5
Other counseling (trade secret, mask works, etc.) 2.5 2.5
Patent Litigation 5 5
Trademark Litigation 0 0
Copyright Litigation 0 0
Licensing/Monetization 12.5 12.5
IP Department administration 10 10
Other 0 0
Total 100%
2011 IPO Corporate IP Management Benchmarking Survey
Page 20
PART IV: FINANCIAL
(Information provided in USD for previous fiscal year.)
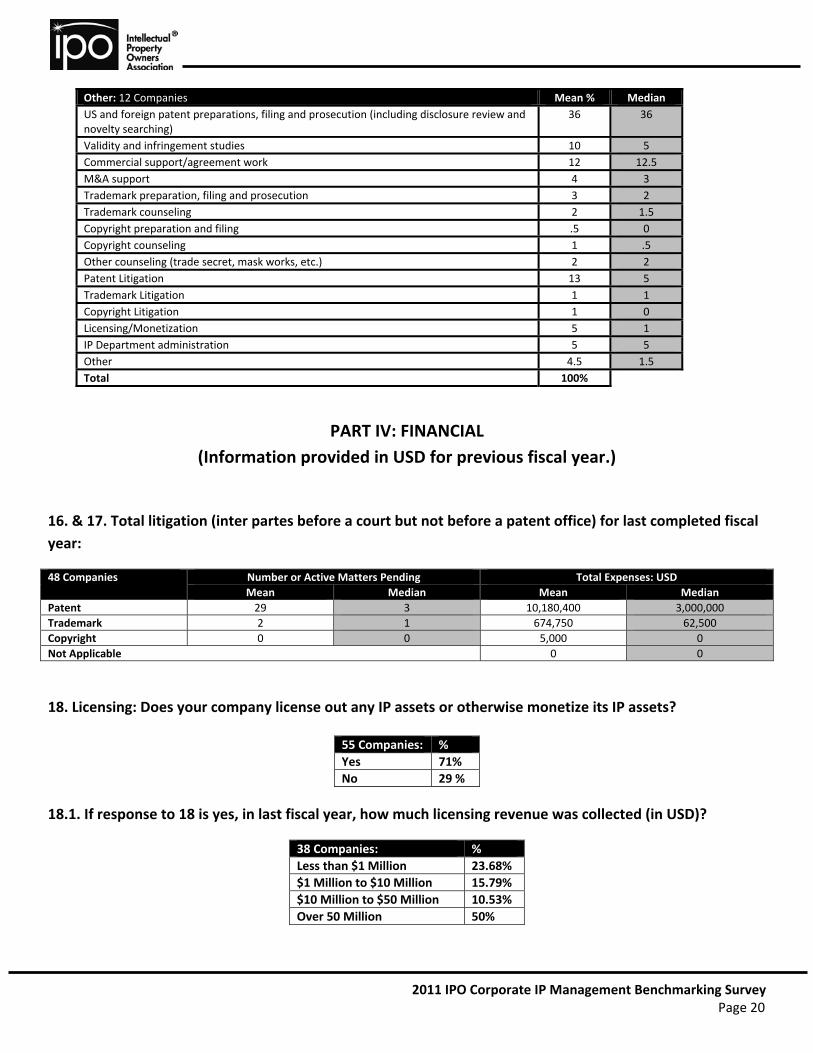
16. & 17. Total litigation (inter partes before a court but not before a patent office) for last completed fiscal
year:
48 Companies Number or Active Matters Pending Total Expenses: USD
Mean Median Mean Median
Patent 29 3 10,180,400 3,000,000
Trademark 2 1 674,750 62,500
Copyright 0 0 5,000 0
Not Applicable 0 0
18. Licensing: Does your company license out any IP assets or otherwise monetize its IP assets?
18.1. If response to 18 is yes, in last fiscal year, how much licensing revenue was collected (in USD)?
Other: 12 Companies Mean % Median
US and foreign patent preparations, filing and prosecution (including disclosure review and novelty searching)
36 36
Validity and infringement studies 10 5
Commercial support/agreement work 12 12.5
M&A support 4 3
Trademark preparation, filing and prosecution 3 2
Trademark counseling 2 1.5
Copyright preparation and filing .5 0
Copyright counseling 1 .5
Other counseling (trade secret, mask works, etc.) 2 2
Patent Litigation 13 5
Trademark Litigation 1 1
Copyright Litigation 1 0
Licensing/Monetization 5 1
IP Department administration 5 5
Other 4.5 1.5
Total 100%
55 Companies: %
Yes 71%
No 29 %
38 Companies: %
Less than $1 Million 23.68%
$1 Million to $10 Million 15.79%
$10 Million to $50 Million 10.53%
Over 50 Million 50%
2011 IPO Corporate IP Management Benchmarking Survey
Page 21
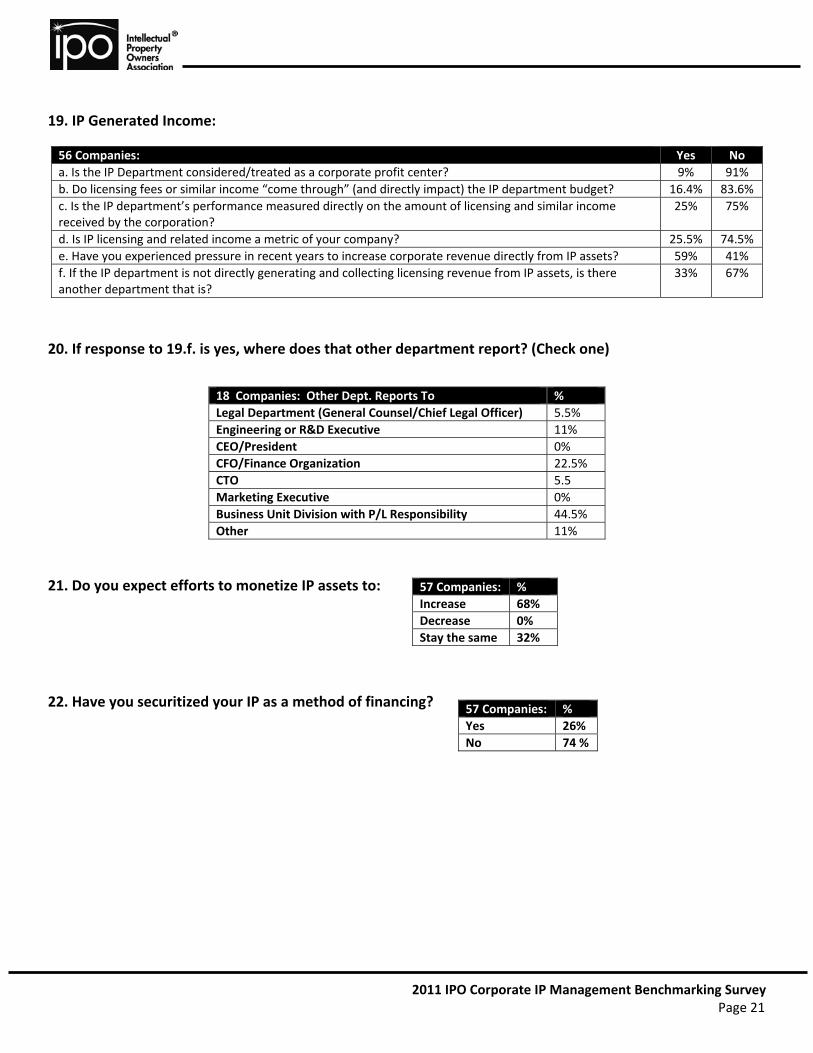
19. IP Generated Income:
56 Companies: Yes No
a. Is the IP Department considered/treated as a corporate profit center? 9% 91%
b. Do licensing fees or similar income “come through” (and directly impact) the IP department budget? 16.4% 83.6%
c. Is the IP department’s performance measured directly on the amount of licensing and similar income received by the corporation?
25% 75%
d. Is IP licensing and related income a metric of your company? 25.5% 74.5%
e. Have you experienced pressure in recent years to increase corporate revenue directly from IP assets? 59% 41%
f. If the IP department is not directly generating and collecting licensing revenue from IP assets, is there another department that is?
33% 67%
20. If response to 19.f. is yes, where does that other department report? (Check one)
21. Do you expect efforts to monetize IP assets to:
22. Have you securitized your IP as a method of financing?
18 Companies: Other Dept. Reports To %
Legal Department (General Counsel/Chief Legal Officer) 5.5%
Engineering or R&D Executive 11%
CEO/President 0%
CFO/Finance Organization 22.5%
CTO 5.5
Marketing Executive 0%
Business Unit Division with P/L Responsibility 44.5%
Other 11%
57 Companies: %
Increase 68%
Decrease 0%
Stay the same 32%
57 Companies: %
Yes 26%
No 74 %
2011 IPO Corporate IP Management Benchmarking Survey
Page 22
PART V: OUTSIDE COUNSEL
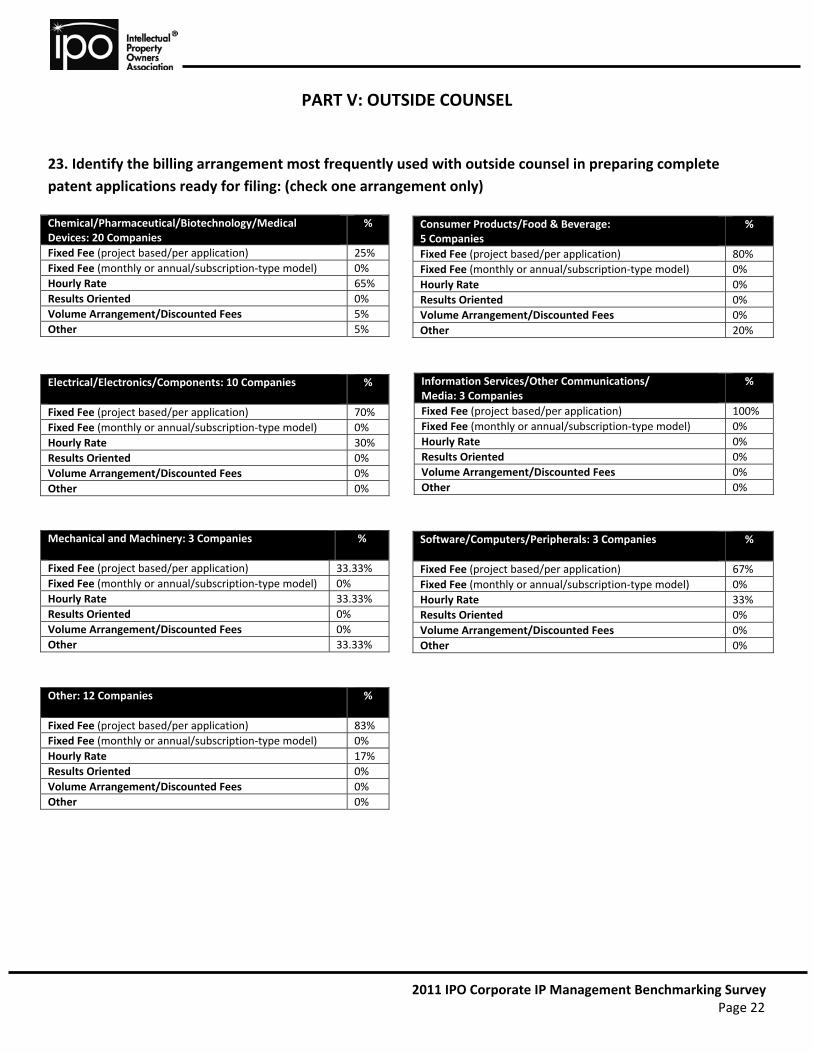
23. Identify the billing arrangement most frequently used with outside counsel in preparing complete
patent applications ready for filing: (check one arrangement only)
Chemical/Pharmaceutical/Biotechnology/Medical Devices: 20 Companies
%
Fixed Fee (project based/per application) 25%
Fixed Fee (monthly or annual/subscription‐type model) 0%
Hourly Rate 65%
Results Oriented 0%
Volume Arrangement/Discounted Fees 5%
Other 5%
Consumer Products/Food & Beverage: 5 Companies
%
Fixed Fee (project based/per application) 80%
Fixed Fee (monthly or annual/subscription‐type model) 0%
Hourly Rate 0%
Results Oriented 0%
Volume Arrangement/Discounted Fees 0%
Other 20%
Electrical/Electronics/Components: 10 Companies
%
Fixed Fee (project based/per application) 70%
Fixed Fee (monthly or annual/subscription‐type model) 0%
Hourly Rate 30%
Results Oriented 0%
Volume Arrangement/Discounted Fees 0%
Other 0%
Information Services/Other Communications/ Media: 3 Companies
%
Fixed Fee (project based/per application) 100%
Fixed Fee (monthly or annual/subscription‐type model) 0%
Hourly Rate 0%
Results Oriented 0%
Volume Arrangement/Discounted Fees 0%
Other 0%
Software/Computers/Peripherals: 3 Companies
%
Fixed Fee (project based/per application) 67%
Fixed Fee (monthly or annual/subscription‐type model) 0%
Hourly Rate 33%
Results Oriented 0%
Volume Arrangement/Discounted Fees 0%
Other 0%
Mechanical and Machinery: 3 Companies
%
Fixed Fee (project based/per application) 33.33%
Fixed Fee (monthly or annual/subscription‐type model) 0%
Hourly Rate 33.33%
Results Oriented 0%
Volume Arrangement/Discounted Fees 0%
Other 33.33%
Other: 12 Companies
%
Fixed Fee (project based/per application) 83%
Fixed Fee (monthly or annual/subscription‐type model) 0%
Hourly Rate 17%
Results Oriented 0%
Volume Arrangement/Discounted Fees 0%
Other 0%
2011 IPO Corporate IP Management Benchmarking Survey
Page 23
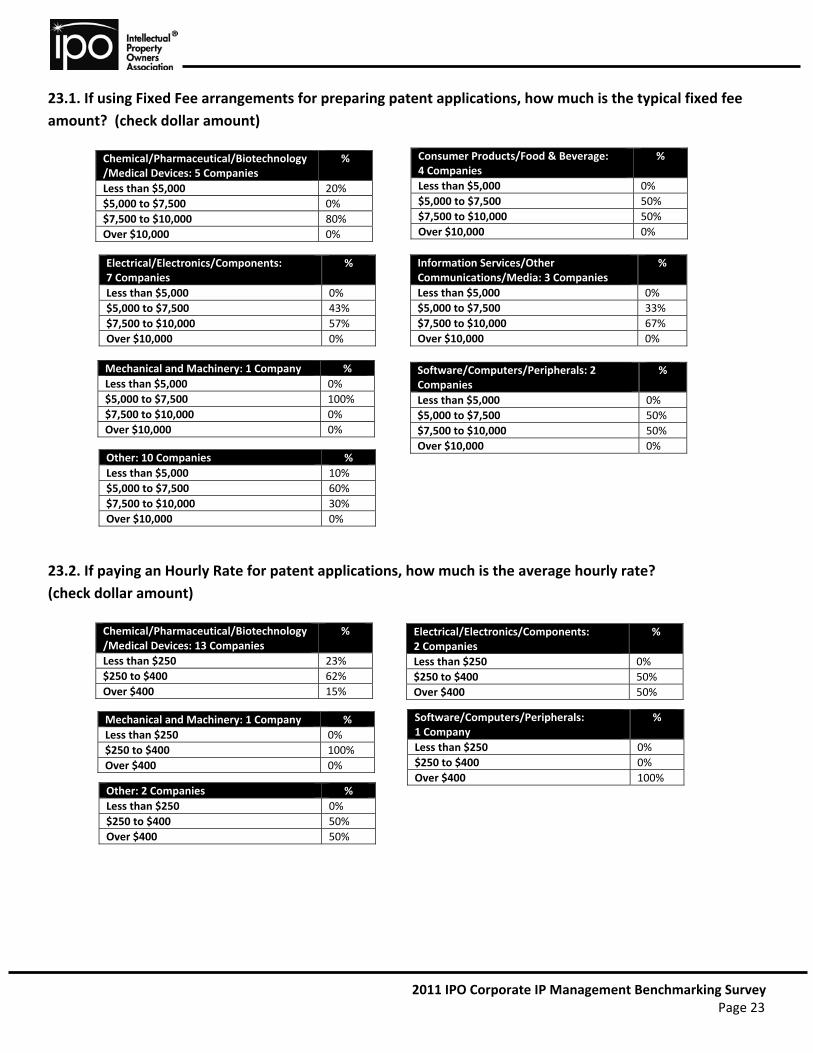
23.1. If using Fixed Fee arrangements for preparing patent applications, how much is the typical fixed fee
amount? (check dollar amount)
23.2. If paying an Hourly Rate for patent applications, how much is the average hourly rate?
(check dollar amount)
Chemical/Pharmaceutical/Biotechnology/Medical Devices: 5 Companies
%
Less than $5,000 20%
$5,000 to $7,500 0%
$7,500 to $10,000 80%
Over $10,000 0%
Consumer Products/Food & Beverage: 4 Companies
%
Less than $5,000 0%
$5,000 to $7,500 50%
$7,500 to $10,000 50%
Over $10,000 0%
Electrical/Electronics/Components: 7 Companies
%
Less than $5,000 0%
$5,000 to $7,500 43%
$7,500 to $10,000 57%
Over $10,000 0%
Information Services/Other Communications/Media: 3 Companies
%
Less than $5,000 0%
$5,000 to $7,500 33%
$7,500 to $10,000 67%
Over $10,000 0%
Software/Computers/Peripherals: 2 Companies
%
Less than $5,000 0%
$5,000 to $7,500 50%
$7,500 to $10,000 50%
Over $10,000 0%
Mechanical and Machinery: 1 Company %
Less than $5,000 0%
$5,000 to $7,500 100%
$7,500 to $10,000 0%
Over $10,000 0%
Other: 10 Companies %
Less than $5,000 10%
$5,000 to $7,500 60%
$7,500 to $10,000 30%
Over $10,000 0%
Chemical/Pharmaceutical/Biotechnology/Medical Devices: 13 Companies
%
Less than $250 23%
$250 to $400 62%
Over $400 15%
Electrical/Electronics/Components: 2 Companies
%
Less than $250 0%
$250 to $400 50%
Over $400 50%
Mechanical and Machinery: 1 Company %
Less than $250 0%
$250 to $400 100%
Over $400 0%
Software/Computers/Peripherals: 1 Company
%
Less than $250 0%
$250 to $400 0%
Over $400 100% Other: 2 Companies %
Less than $250 0%
$250 to $400 50%
Over $400 50%
2011 IPO Corporate IP Management Benchmarking Survey
Page 24
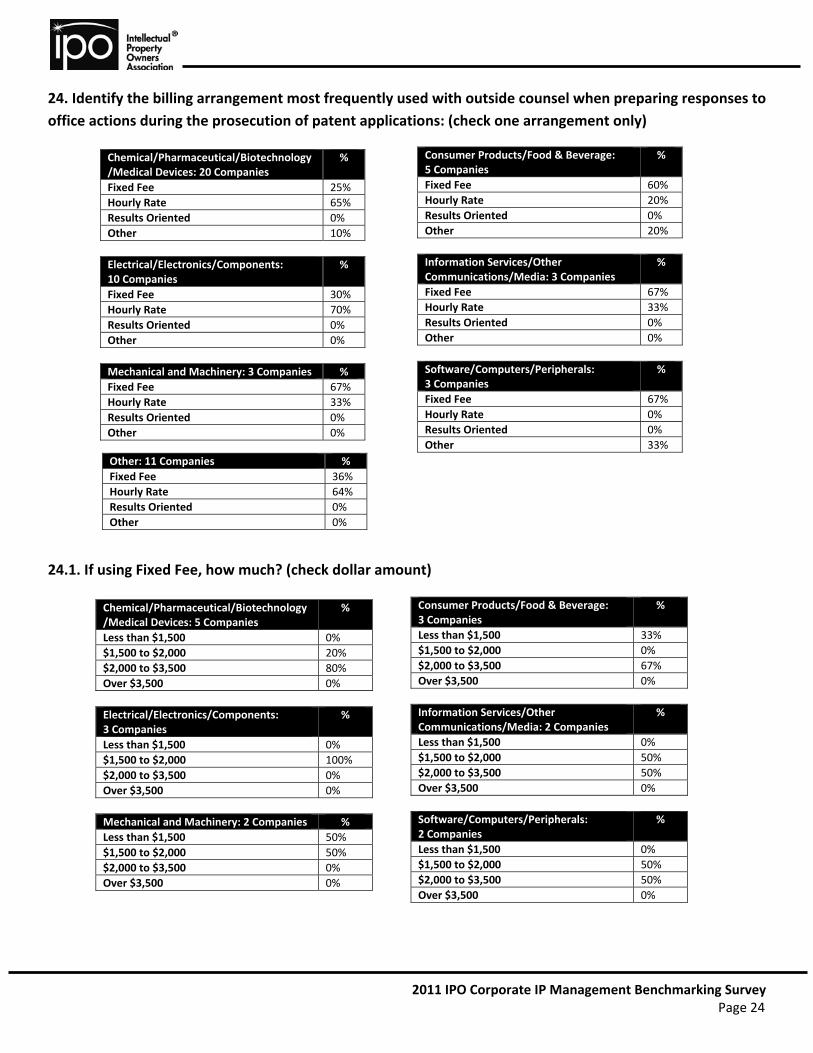
24. Identify the billing arrangement most frequently used with outside counsel when preparing responses to
office actions during the prosecution of patent applications: (check one arrangement only)
24.1. If using Fixed Fee, how much? (check dollar amount)
Chemical/Pharmaceutical/Biotechnology /Medical Devices: 20 Companies
%
Fixed Fee 25%
Hourly Rate 65%
Results Oriented 0%
Other 10%
Consumer Products/Food & Beverage: 5 Companies
%
Fixed Fee 60%
Hourly Rate 20%
Results Oriented 0%
Other 20%
Electrical/Electronics/Components: 10 Companies
%
Fixed Fee 30%
Hourly Rate 70%
Results Oriented 0%
Other 0%
Information Services/Other Communications/Media: 3 Companies
%
Fixed Fee 67%
Hourly Rate 33%
Results Oriented 0%
Other 0%
Mechanical and Machinery: 3 Companies %
Fixed Fee 67%
Hourly Rate 33%
Results Oriented 0%
Other 0%
Software/Computers/Peripherals: 3 Companies
%
Fixed Fee 67%
Hourly Rate 0%
Results Oriented 0%
Other 33%
Other: 11 Companies %
Fixed Fee 36%
Hourly Rate 64%
Results Oriented 0%
Other 0%
Chemical/Pharmaceutical/Biotechnology/Medical Devices: 5 Companies
%
Less than $1,500 0%
$1,500 to $2,000 20%
$2,000 to $3,500 80%
Over $3,500 0%
Consumer Products/Food & Beverage: 3 Companies
%
Less than $1,500 33%
$1,500 to $2,000 0%
$2,000 to $3,500 67%
Over $3,500 0%
Electrical/Electronics/Components: 3 Companies
%
Less than $1,500 0%
$1,500 to $2,000 100%
$2,000 to $3,500 0%
Over $3,500 0%
Information Services/Other Communications/Media: 2 Companies
%
Less than $1,500 0%
$1,500 to $2,000 50%
$2,000 to $3,500 50%
Over $3,500 0%
Mechanical and Machinery: 2 Companies %
Less than $1,500 50%
$1,500 to $2,000 50%
$2,000 to $3,500 0%
Over $3,500 0%
Software/Computers/Peripherals: 2 Companies
%
Less than $1,500 0%
$1,500 to $2,000 50%
$2,000 to $3,500 50%
Over $3,500 0%
2011 IPO Corporate IP Management Benchmarking Survey
Page 25
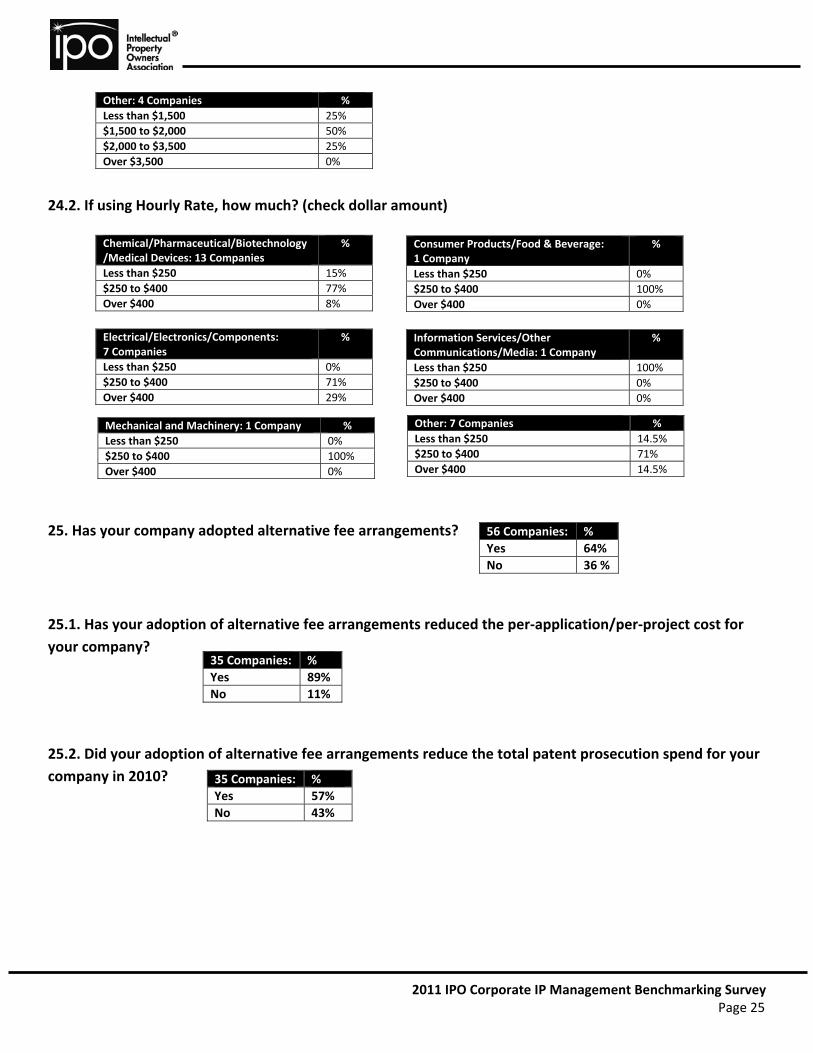
24.2. If using Hourly Rate, how much? (check dollar amount)
25. Has your company adopted alternative fee arrangements?
25.1. Has your adoption of alternative fee arrangements reduced the per‐application/per‐project cost for
your company?
25.2. Did your adoption of alternative fee arrangements reduce the total patent prosecution spend for your
company in 2010?
Other: 4 Companies %
Less than $1,500 25%
$1,500 to $2,000 50%
$2,000 to $3,500 25%
Over $3,500 0%
Chemical/Pharmaceutical/Biotechnology/Medical Devices: 13 Companies
%
Less than $250 15%
$250 to $400 77%
Over $400 8%
Consumer Products/Food & Beverage: 1 Company
%
Less than $250 0%
$250 to $400 100%
Over $400 0%
Electrical/Electronics/Components: 7 Companies
%
Less than $250 0%
$250 to $400 71%
Over $400 29%
Information Services/Other Communications/Media: 1 Company
%
Less than $250 100%
$250 to $400 0%
Over $400 0%
Mechanical and Machinery: 1 Company %
Less than $250 0%
$250 to $400 100%
Over $400 0%
Other: 7 Companies %
Less than $250 14.5%
$250 to $400 71%
Over $400 14.5%
56 Companies: %
Yes 64%
No 36 %
35 Companies: %
Yes 89%
No 11%
35 Companies: %
Yes 57%
No 43%
2011 IPO Corporate IP Management Benchmarking Survey
Page 26
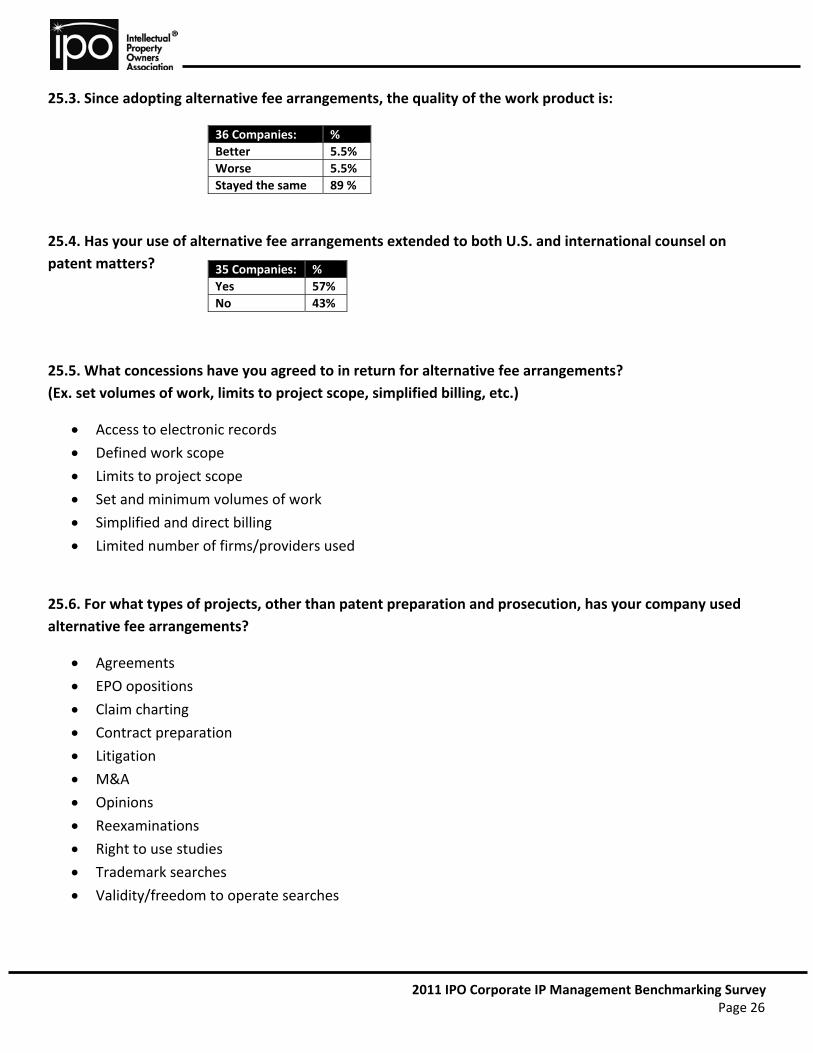
25.3. Since adopting alternative fee arrangements, the quality of the work product is:
25.4. Has your use of alternative fee arrangements extended to both U.S. and international counsel on
patent matters?
25.5. What concessions have you agreed to in return for alternative fee arrangements?
(Ex. set volumes of work, limits to project scope, simplified billing, etc.)
Access to electronic records
Defined work scope
Limits to project scope
Set and minimum volumes of work
Simplified and direct billing
Limited number of firms/providers used
25.6. For what types of projects, other than patent preparation and prosecution, has your company used
alternative fee arrangements?
Agreements
EPO opositions
Claim charting
Contract preparation
Litigation
M&A
Opinions
Reexaminations
Right to use studies
Trademark searches
Validity/freedom to operate searches
36 Companies: %
Better 5.5%
Worse 5.5%
Stayed the same 89 %
35 Companies: %
Yes 57%
No 43%
2011 IPO Corporate IP Management Benchmarking Survey
Page 27
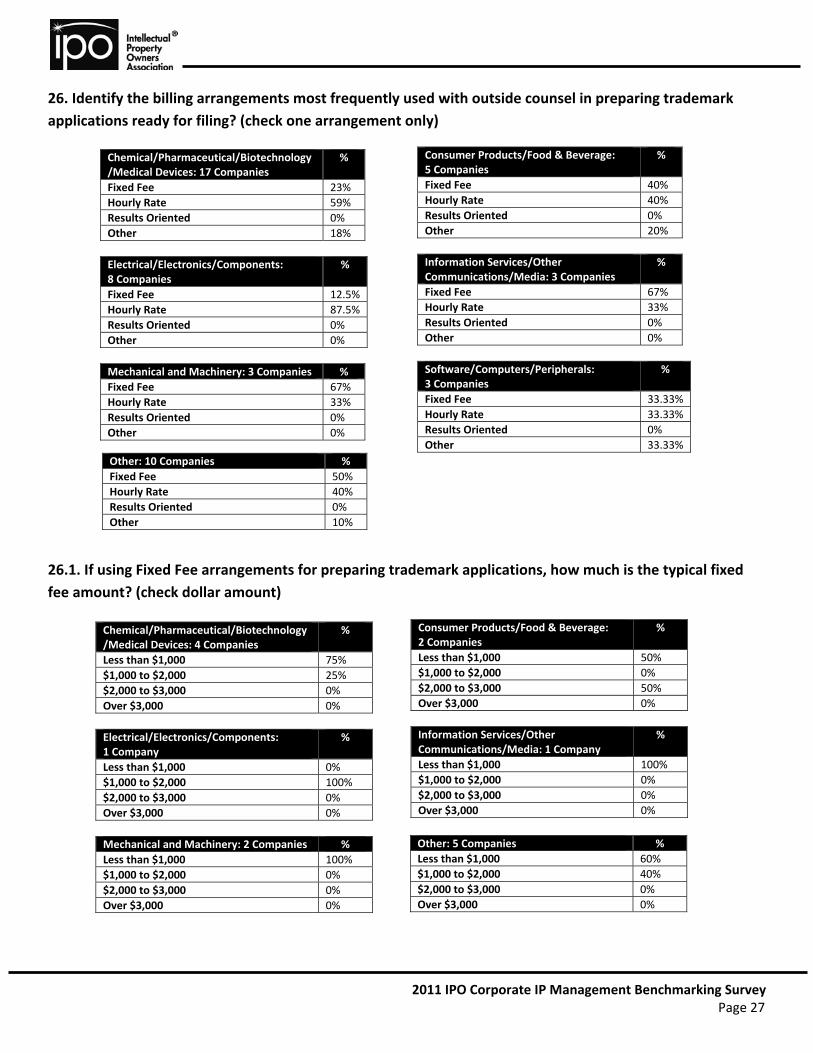
26. Identify the billing arrangements most frequently used with outside counsel in preparing trademark
applications ready for filing? (check one arrangement only)
26.1. If using Fixed Fee arrangements for preparing trademark applications, how much is the typical fixed
fee amount? (check dollar amount)
Chemical/Pharmaceutical/Biotechnology /Medical Devices: 17 Companies
%
Fixed Fee 23%
Hourly Rate 59%
Results Oriented 0%
Other 18%
Consumer Products/Food & Beverage: 5 Companies
%
Fixed Fee 40%
Hourly Rate 40%
Results Oriented 0%
Other 20%
Electrical/Electronics/Components: 8 Companies
%
Fixed Fee 12.5%
Hourly Rate 87.5%
Results Oriented 0%
Other 0%
Information Services/Other Communications/Media: 3 Companies
%
Fixed Fee 67%
Hourly Rate 33%
Results Oriented 0%
Other 0%
Mechanical and Machinery: 3 Companies %
Fixed Fee 67%
Hourly Rate 33%
Results Oriented 0%
Other 0%
Software/Computers/Peripherals: 3 Companies
%
Fixed Fee 33.33%
Hourly Rate 33.33%
Results Oriented 0%
Other 33.33%
Other: 10 Companies %
Fixed Fee 50%
Hourly Rate 40%
Results Oriented 0%
Other 10%
Chemical/Pharmaceutical/Biotechnology/Medical Devices: 4 Companies
%
Less than $1,000 75%
$1,000 to $2,000 25%
$2,000 to $3,000 0%
Over $3,000 0%
Consumer Products/Food & Beverage: 2 Companies
%
Less than $1,000 50%
$1,000 to $2,000 0%
$2,000 to $3,000 50%
Over $3,000 0%
Electrical/Electronics/Components: 1 Company
%
Less than $1,000 0%
$1,000 to $2,000 100%
$2,000 to $3,000 0%
Over $3,000 0%
Information Services/Other Communications/Media: 1 Company
%
Less than $1,000 100%
$1,000 to $2,000 0%
$2,000 to $3,000 0%
Over $3,000 0%
Mechanical and Machinery: 2 Companies %
Less than $1,000 100%
$1,000 to $2,000 0%
$2,000 to $3,000 0%
Over $3,000 0%
Other: 5 Companies %
Less than $1,000 60%
$1,000 to $2,000 40%
$2,000 to $3,000 0%
Over $3,000 0%
2011 IPO Corporate IP Management Benchmarking Survey
Page 28
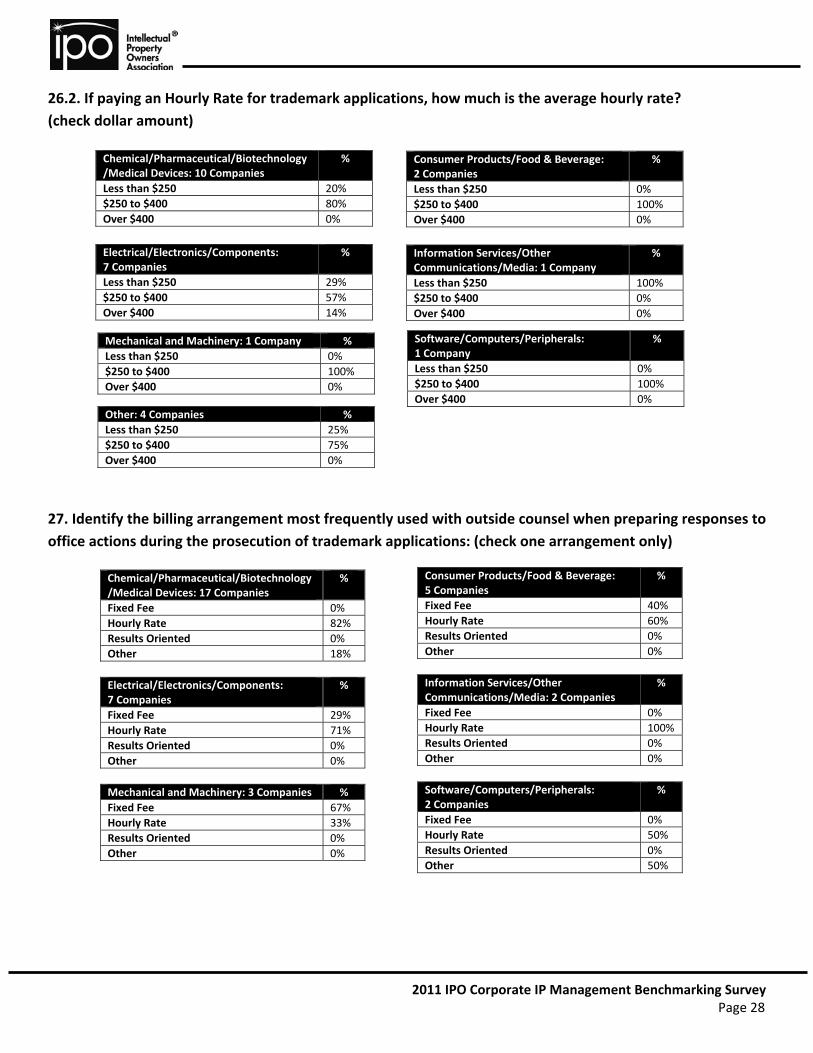
26.2. If paying an Hourly Rate for trademark applications, how much is the average hourly rate?
(check dollar amount)
27. Identify the billing arrangement most frequently used with outside counsel when preparing responses to
office actions during the prosecution of trademark applications: (check one arrangement only)
Chemical/Pharmaceutical/Biotechnology/Medical Devices: 10 Companies
%
Less than $250 20%
$250 to $400 80%
Over $400 0%
Consumer Products/Food & Beverage: 2 Companies
%
Less than $250 0%
$250 to $400 100%
Over $400 0%
Electrical/Electronics/Components: 7 Companies
%
Less than $250 29%
$250 to $400 57%
Over $400 14%
Information Services/Other Communications/Media: 1 Company
%
Less than $250 100%
$250 to $400 0%
Over $400 0%
Mechanical and Machinery: 1 Company %
Less than $250 0%
$250 to $400 100%
Over $400 0%
Software/Computers/Peripherals: 1 Company
%
Less than $250 0%
$250 to $400 100%
Over $400 0%
Other: 4 Companies %
Less than $250 25%
$250 to $400 75%
Over $400 0%
Chemical/Pharmaceutical/Biotechnology /Medical Devices: 17 Companies
%
Fixed Fee 0%
Hourly Rate 82%
Results Oriented 0%
Other 18%
Consumer Products/Food & Beverage: 5 Companies
%
Fixed Fee 40%
Hourly Rate 60%
Results Oriented 0%
Other 0%
Electrical/Electronics/Components: 7 Companies
%
Fixed Fee 29%
Hourly Rate 71%
Results Oriented 0%
Other 0%
Information Services/Other Communications/Media: 2 Companies
%
Fixed Fee 0%
Hourly Rate 100%
Results Oriented 0%
Other 0%
Mechanical and Machinery: 3 Companies %
Fixed Fee 67%
Hourly Rate 33%
Results Oriented 0%
Other 0%
Software/Computers/Peripherals: 2 Companies
%
Fixed Fee 0%
Hourly Rate 50%
Results Oriented 0%
Other 50%
2011 IPO Corporate IP Management Benchmarking Survey
Page 29
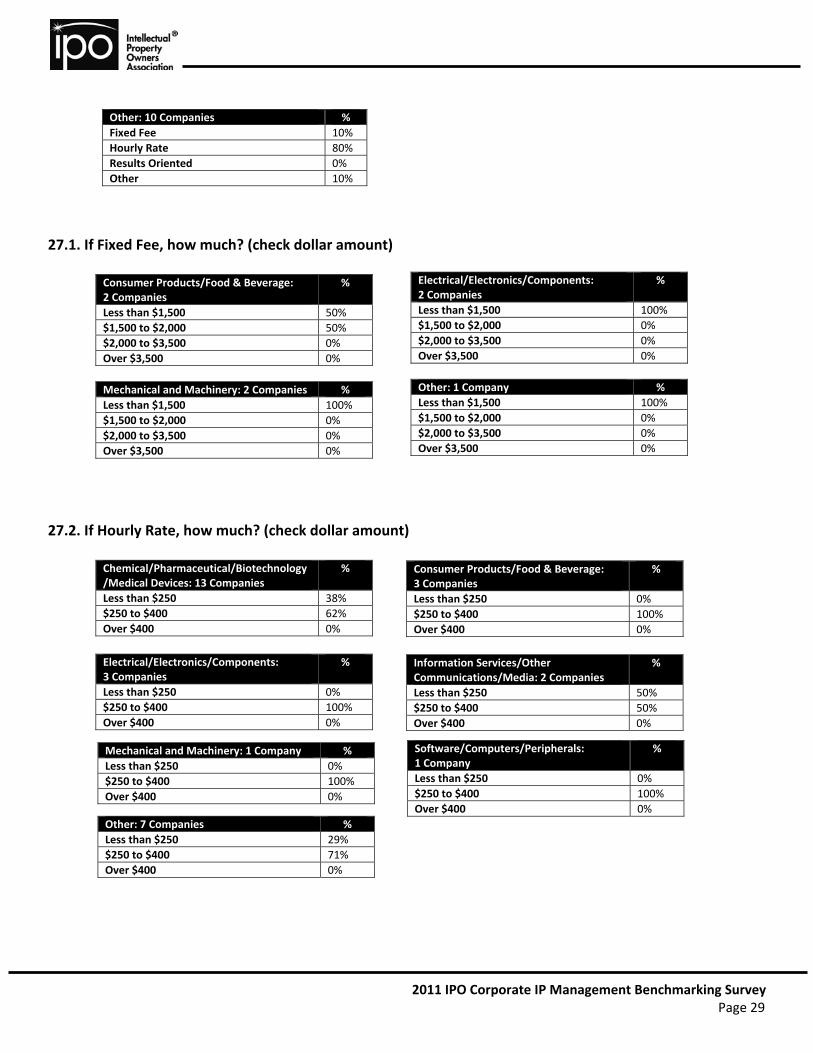
27.1. If Fixed Fee, how much? (check dollar amount)
27.2. If Hourly Rate, how much? (check dollar amount)
Other: 10 Companies %
Fixed Fee 10%
Hourly Rate 80%
Results Oriented 0%
Other 10%
Consumer Products/Food & Beverage: 2 Companies
%
Less than $1,500 50%
$1,500 to $2,000 50%
$2,000 to $3,500 0%
Over $3,500 0%
Electrical/Electronics/Components: 2 Companies
%
Less than $1,500 100%
$1,500 to $2,000 0%
$2,000 to $3,500 0%
Over $3,500 0%
Mechanical and Machinery: 2 Companies %
Less than $1,500 100%
$1,500 to $2,000 0%
$2,000 to $3,500 0%
Over $3,500 0%
Other: 1 Company %
Less than $1,500 100%
$1,500 to $2,000 0%
$2,000 to $3,500 0%
Over $3,500 0%
Chemical/Pharmaceutical/Biotechnology/Medical Devices: 13 Companies
%
Less than $250 38%
$250 to $400 62%
Over $400 0%
Consumer Products/Food & Beverage: 3 Companies
%
Less than $250 0%
$250 to $400 100%
Over $400 0%
Electrical/Electronics/Components: 3 Companies
%
Less than $250 0%
$250 to $400 100%
Over $400 0%
Information Services/Other Communications/Media: 2 Companies
%
Less than $250 50%
$250 to $400 50%
Over $400 0%
Mechanical and Machinery: 1 Company %
Less than $250 0%
$250 to $400 100%
Over $400 0%
Software/Computers/Peripherals: 1 Company
%
Less than $250 0%
$250 to $400 100%
Over $400 0%
Other: 7 Companies %
Less than $250 29%
$250 to $400 71%
Over $400 0%
2011 IPO Corporate IP Management Benchmarking Survey
Page 30
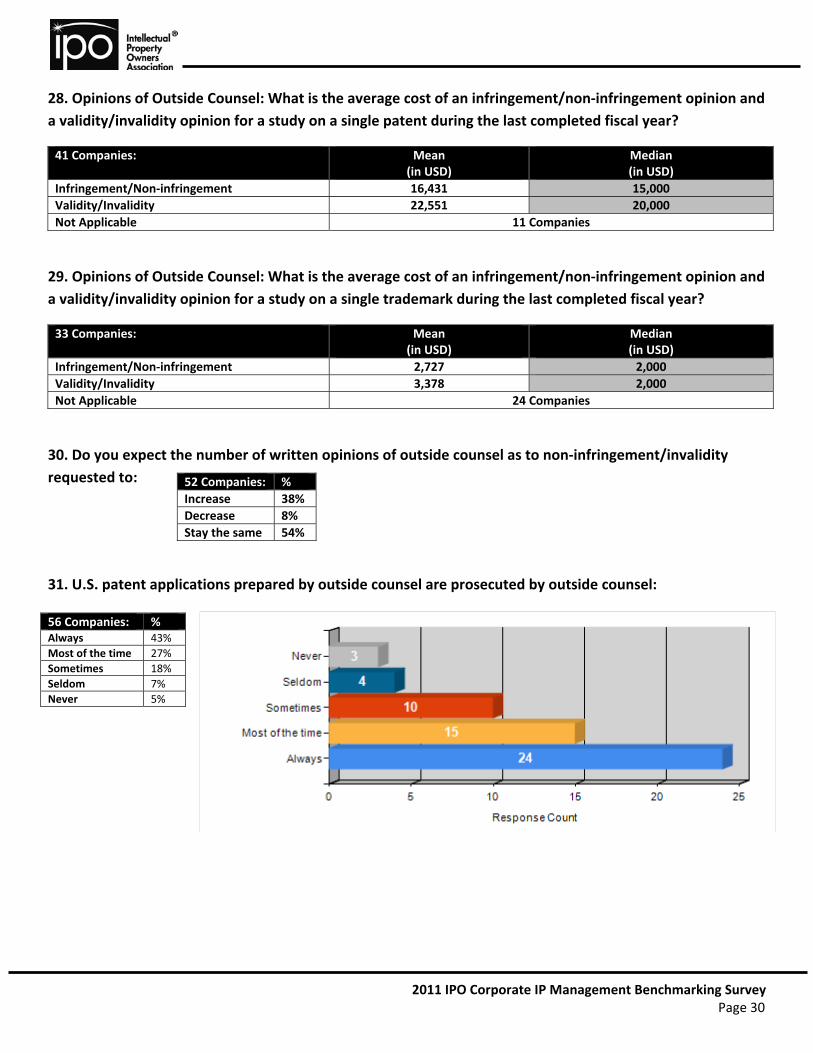
28. Opinions of Outside Counsel: What is the average cost of an infringement/non‐infringement opinion and
a validity/invalidity opinion for a study on a single patent during the last completed fiscal year?
41 Companies: Mean(in USD)
Median(in USD)
Infringement/Non‐infringement 16,431 15,000
Validity/Invalidity 22,551 20,000
Not Applicable 11 Companies
29. Opinions of Outside Counsel: What is the average cost of an infringement/non‐infringement opinion and
a validity/invalidity opinion for a study on a single trademark during the last completed fiscal year?
33 Companies: Mean(in USD)
Median(in USD)
Infringement/Non‐infringement 2,727 2,000
Validity/Invalidity 3,378 2,000
Not Applicable 24 Companies
30. Do you expect the number of written opinions of outside counsel as to non‐infringement/invalidity
requested to:
31. U.S. patent applications prepared by outside counsel are prosecuted by outside counsel:
52 Companies: %
Increase 38%
Decrease 8%
Stay the same 54%
56 Companies: % Always 43%
Most of the time 27%
Sometimes 18%
Seldom 7%
Never 5%
2011 IPO Corporate IP Management Benchmarking Survey
Page 31
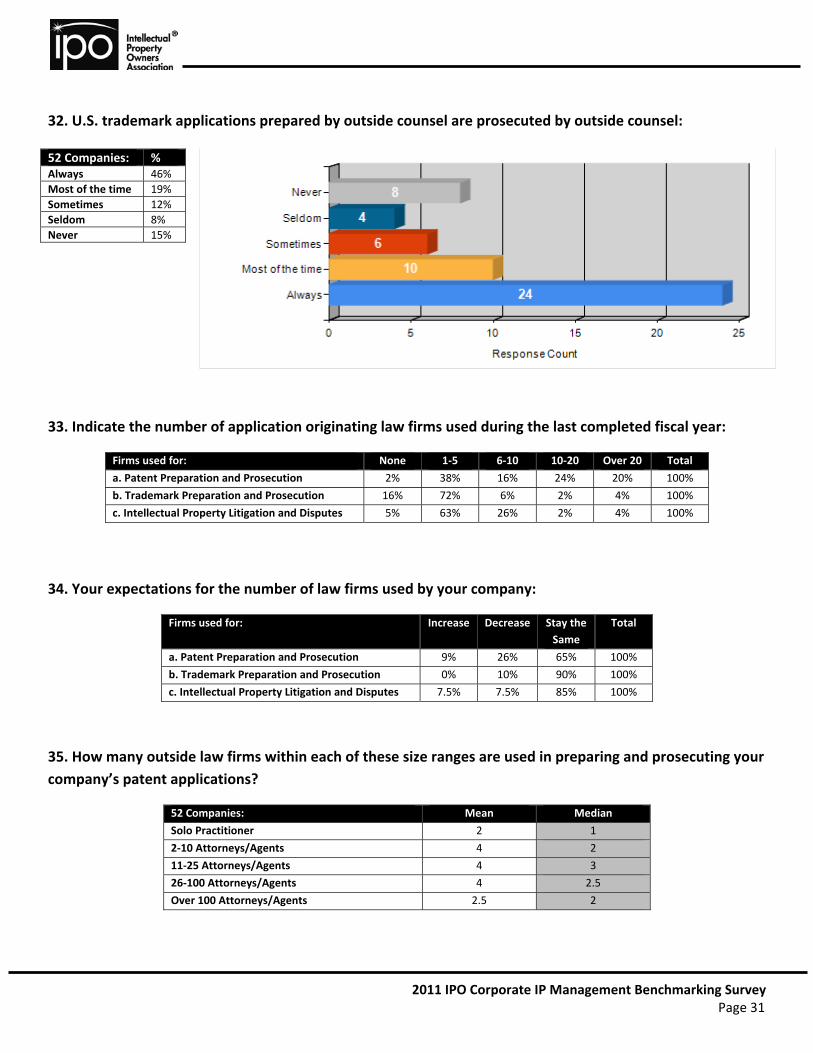
32. U.S. trademark applications prepared by outside counsel are prosecuted by outside counsel:
33. Indicate the number of application originating law firms used during the last completed fiscal year:
Firms used for: None 1‐5 6‐10 10‐20 Over 20 Total
a. Patent Preparation and Prosecution 2% 38% 16% 24% 20% 100%
b. Trademark Preparation and Prosecution 16% 72% 6% 2% 4% 100%
c. Intellectual Property Litigation and Disputes 5% 63% 26% 2% 4% 100%
34. Your expectations for the number of law firms used by your company:
Firms used for: Increase Decrease Stay the
Same
Total
a. Patent Preparation and Prosecution 9% 26% 65% 100%
b. Trademark Preparation and Prosecution 0% 10% 90% 100%
c. Intellectual Property Litigation and Disputes 7.5% 7.5% 85% 100%
35. How many outside law firms within each of these size ranges are used in preparing and prosecuting your
company’s patent applications?
52 Companies: Mean Median
Solo Practitioner 2 1
2‐10 Attorneys/Agents 4 2
11‐25 Attorneys/Agents 4 3
26‐100 Attorneys/Agents 4 2.5
Over 100 Attorneys/Agents 2.5 2
52 Companies: % Always 46%
Most of the time 19%
Sometimes 12%
Seldom 8%
Never 15%

2011 IPO Corporate IP Management Benchmarking Survey
Page 32
36. How many outside law firms within each of these size ranges are used in preparing and prosecuting your
company’s trademark applications?
44 Companies: Mean Median
Solo Practitioner 0 0
2‐10 Attorneys/Agents 2 1.5
11‐25 Attorneys/Agents 1.5 1
26‐100 Attorneys/Agents 2 1
Over 100 Attorneys/Agents 1.5 1
37. What is the number of IP litigation cases handled by outside counsel by firm size? [Ex. 3 cases]
38. In assigning patent work to outside counsel, do you prefer to use: (check one)
54 Companies %
Separate firms to handle each of 1)litigation; 2) preparation/prosecution; and 3) opinion work 44%
Separate firm to handle litigation, but the same firm for both preparation/prosecution and opinion work 50%
Separate firm to handle preparation/prosecution, but the same firm to handle both litigation and opinion work 4%
Same firm to handle litigation, preparation/prosecution and opinion work 2%
39. Average cycle time of outside law firms for patent preparation/prosecution from receipt of invention
submission to filing of application? (check one)
48 Companies Mean Median
1‐25 attorneys/agents 1 case 1 case
25‐100 attorneys/agents 4 cases 2 cases
Over 100 attorneys/agents 12 cases 3 cases
53 Companies %
60 Days or less 34%
61‐90 Days 45%
91‐120 Days 15%
More than 120 days 6%
2011 IPO Corporate IP Management Benchmarking Survey
Page 33
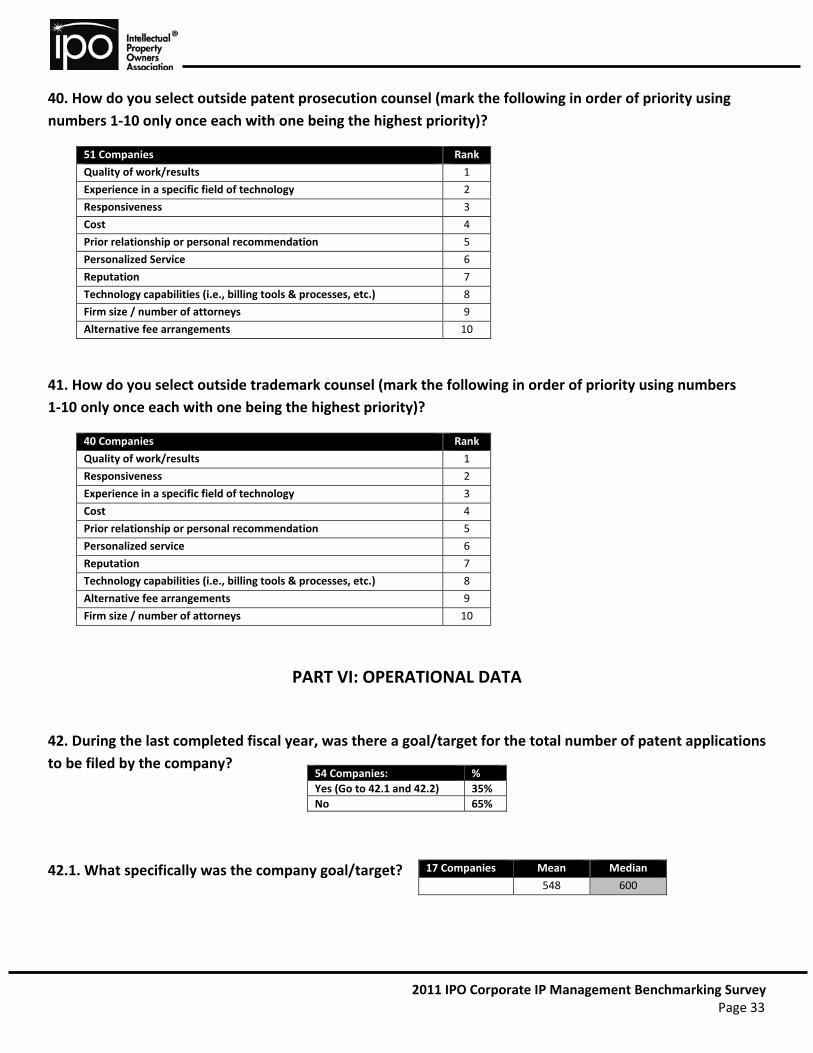
40. How do you select outside patent prosecution counsel (mark the following in order of priority using
numbers 1‐10 only once each with one being the highest priority)?
51 Companies Rank
Quality of work/results 1
Experience in a specific field of technology 2
Responsiveness 3
Cost 4
Prior relationship or personal recommendation 5
Personalized Service 6
Reputation 7
Technology capabilities (i.e., billing tools & processes, etc.) 8
Firm size / number of attorneys 9
Alternative fee arrangements 10
41. How do you select outside trademark counsel (mark the following in order of priority using numbers
1‐10 only once each with one being the highest priority)?
40 Companies Rank
Quality of work/results 1
Responsiveness 2
Experience in a specific field of technology 3
Cost 4
Prior relationship or personal recommendation 5
Personalized service 6
Reputation 7
Technology capabilities (i.e., billing tools & processes, etc.) 8
Alternative fee arrangements 9
Firm size / number of attorneys 10
PART VI: OPERATIONAL DATA
42. During the last completed fiscal year, was there a goal/target for the total number of patent applications
to be filed by the company?
42.1. What specifically was the company goal/target?
54 Companies: %
Yes (Go to 42.1 and 42.2) 35%
No 65%
17 Companies Mean Median
548 600
2011 IPO Corporate IP Management Benchmarking Survey
Page 34
42.2. Was the specific goal/target:
43. Did those patent attorneys who handle patent preparation and preparation/prosecution in‐house have
a set goal/target for the number of patent applications to be drafted personally during the last completed
fiscal year?
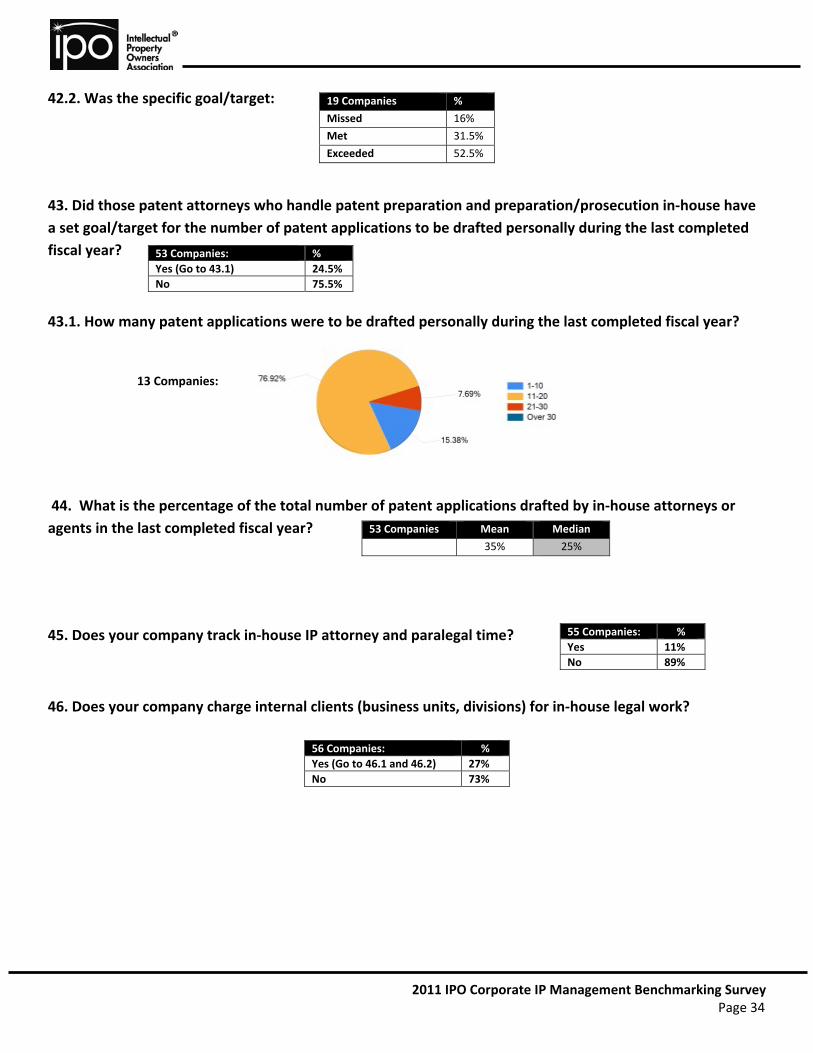
43.1. How many patent applications were to be drafted personally during the last completed fiscal year?
44. What is the percentage of the total number of patent applications drafted by in‐house attorneys or
agents in the last completed fiscal year?
45. Does your company track in‐house IP attorney and paralegal time?
46. Does your company charge internal clients (business units, divisions) for in‐house legal work?
19 Companies %
Missed 16%
Met 31.5%
Exceeded 52.5%
53 Companies: %
Yes (Go to 43.1) 24.5%
No 75.5%
53 Companies Mean Median
35% 25%
55 Companies: %
Yes 11%
No 89%
56 Companies: %
Yes (Go to 46.1 and 46.2) 27%
No 73%
13 Companies:
2011 IPO Corporate IP Management Benchmarking Survey
Page 35
46.1. Is charge based on (check one):
47. During the last completed fiscal year, identify:
Chemical/Pharmaceutical/Biotechnology/Medical Devices: 17 Companies Mean Median
Number of invention disclosures received 277 113.5
Number of original non‐provisional utility patent applications first filed in the U.S. 137 18
How many of the applications were prepared by in‐house counsel? 74 1.5
How many of the applications were prepared by outside counsel? 62 5.5
Number of provisional patent applications first filed in the U.S. 67 25
How many of the applications were prepared by in‐house counsel? 37 8
How many of the applications were prepared by outside counsel? 13 4
Number of original non‐provisional utility patent applications first filed other than in the U.S. 39 13.5
How many of the applications were prepared by in‐house counsel? 26 .5
How many of the applications were prepared by outside counsel? 14 11
Number of perfected utility patent applications filed from provisionals 238 11
How many of the applications were prepared by in‐house counsel? 173 3
How many of the applications were prepared by outside counsel? 46 1
Consumer Products/Food & Beverage: 3 Companies Mean Median
Number of invention disclosures received 934 1,000
Number of original non‐provisional utility patent applications first filed in the U.S. 281 300
How many of the applications were prepared by in‐house counsel? 10 10
How many of the applications were prepared by outside counsel? 271 290
Number of provisional patent applications first filed in the U.S. 14 20
How many of the applications were prepared by in‐house counsel? 1 0
How many of the applications were prepared by outside counsel? 12 15
Number of original non‐provisional utility patent applications first filed other than in the U.S. 66 50
How many of the applications were prepared by in‐house counsel? 1 0
How many of the applications were prepared by outside counsel? 65 45
Number of perfected utility patent applications filed from provisionals 11 15
How many of the applications were prepared by in‐house counsel? 1 0
How many of the applications were prepared by outside counsel? 10 10
15 Companies: %
Business Unit Driver (e.g. Headcount, R&D Expense, Sales) 7%
Average Hourly Rate 13%
Actual Legal Spend 67%
Other 13%
2011 IPO Corporate IP Management Benchmarking Survey
Page 36
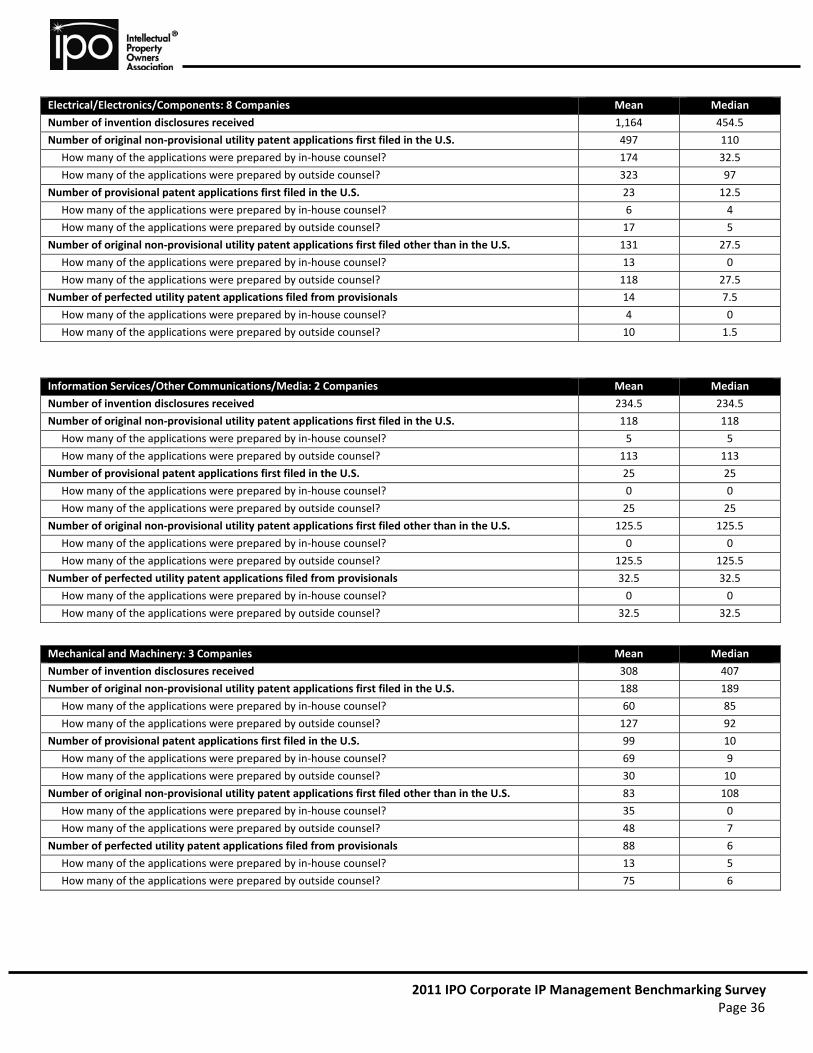
Information Services/Other Communications/Media: 2 Companies Mean Median
Number of invention disclosures received 234.5 234.5
Number of original non‐provisional utility patent applications first filed in the U.S. 118 118
How many of the applications were prepared by in‐house counsel? 5 5
How many of the applications were prepared by outside counsel? 113 113
Number of provisional patent applications first filed in the U.S. 25 25
How many of the applications were prepared by in‐house counsel? 0 0
How many of the applications were prepared by outside counsel? 25 25
Number of original non‐provisional utility patent applications first filed other than in the U.S. 125.5 125.5
How many of the applications were prepared by in‐house counsel? 0 0
How many of the applications were prepared by outside counsel? 125.5 125.5
Number of perfected utility patent applications filed from provisionals 32.5 32.5
How many of the applications were prepared by in‐house counsel? 0 0
How many of the applications were prepared by outside counsel? 32.5 32.5
Electrical/Electronics/Components: 8 Companies Mean Median
Number of invention disclosures received 1,164 454.5
Number of original non‐provisional utility patent applications first filed in the U.S. 497 110
How many of the applications were prepared by in‐house counsel? 174 32.5
How many of the applications were prepared by outside counsel? 323 97
Number of provisional patent applications first filed in the U.S. 23 12.5
How many of the applications were prepared by in‐house counsel? 6 4
How many of the applications were prepared by outside counsel? 17 5
Number of original non‐provisional utility patent applications first filed other than in the U.S. 131 27.5
How many of the applications were prepared by in‐house counsel? 13 0
How many of the applications were prepared by outside counsel? 118 27.5
Number of perfected utility patent applications filed from provisionals 14 7.5
How many of the applications were prepared by in‐house counsel? 4 0
How many of the applications were prepared by outside counsel? 10 1.5
Mechanical and Machinery: 3 Companies Mean Median
Number of invention disclosures received 308 407
Number of original non‐provisional utility patent applications first filed in the U.S. 188 189
How many of the applications were prepared by in‐house counsel? 60 85
How many of the applications were prepared by outside counsel? 127 92
Number of provisional patent applications first filed in the U.S. 99 10
How many of the applications were prepared by in‐house counsel? 69 9
How many of the applications were prepared by outside counsel? 30 10
Number of original non‐provisional utility patent applications first filed other than in the U.S. 83 108
How many of the applications were prepared by in‐house counsel? 35 0
How many of the applications were prepared by outside counsel? 48 7
Number of perfected utility patent applications filed from provisionals 88 6
How many of the applications were prepared by in‐house counsel? 13 5
How many of the applications were prepared by outside counsel? 75 6
2011 IPO Corporate IP Management Benchmarking Survey
Page 37
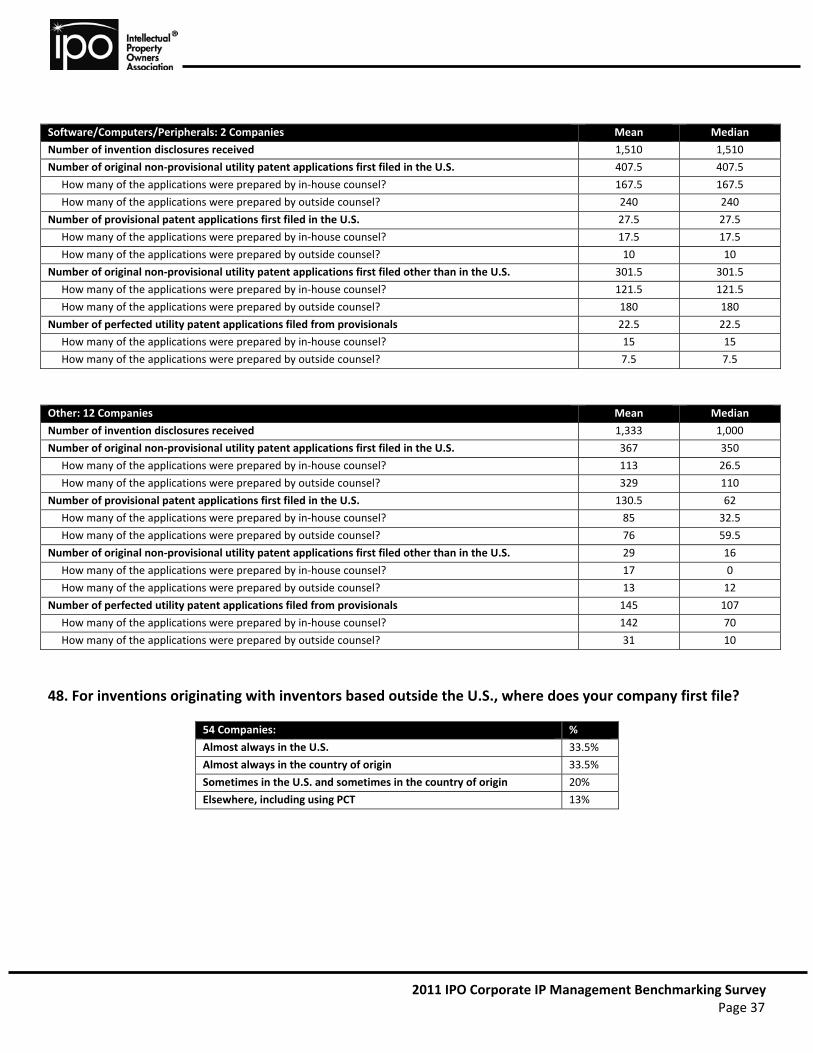
Software/Computers/Peripherals: 2 Companies Mean Median
Number of invention disclosures received 1,510 1,510
Number of original non‐provisional utility patent applications first filed in the U.S. 407.5 407.5
How many of the applications were prepared by in‐house counsel? 167.5 167.5
How many of the applications were prepared by outside counsel? 240 240
Number of provisional patent applications first filed in the U.S. 27.5 27.5
How many of the applications were prepared by in‐house counsel? 17.5 17.5
How many of the applications were prepared by outside counsel? 10 10
Number of original non‐provisional utility patent applications first filed other than in the U.S. 301.5 301.5
How many of the applications were prepared by in‐house counsel? 121.5 121.5
How many of the applications were prepared by outside counsel? 180 180
Number of perfected utility patent applications filed from provisionals 22.5 22.5
How many of the applications were prepared by in‐house counsel? 15 15
How many of the applications were prepared by outside counsel? 7.5 7.5
Other: 12 Companies Mean Median
Number of invention disclosures received 1,333 1,000
Number of original non‐provisional utility patent applications first filed in the U.S. 367 350
How many of the applications were prepared by in‐house counsel? 113 26.5
How many of the applications were prepared by outside counsel? 329 110
Number of provisional patent applications first filed in the U.S. 130.5 62
How many of the applications were prepared by in‐house counsel? 85 32.5
How many of the applications were prepared by outside counsel? 76 59.5
Number of original non‐provisional utility patent applications first filed other than in the U.S. 29 16
How many of the applications were prepared by in‐house counsel? 17 0
How many of the applications were prepared by outside counsel? 13 12
Number of perfected utility patent applications filed from provisionals 145 107
How many of the applications were prepared by in‐house counsel? 142 70
How many of the applications were prepared by outside counsel? 31 10
48. For inventions originating with inventors based outside the U.S., where does your company first file?
54 Companies: %
Almost always in the U.S. 33.5%
Almost always in the country of origin 33.5%
Sometimes in the U.S. and sometimes in the country of origin 20%
Elsewhere, including using PCT 13%

2011 IPO Corporate IP Management Benchmarking Survey
Page 38
49. & 50. During the last completed fiscal year, what was the total number of utility patents issued to your
company by the USPTO? What was the total number of utility patents issued to your company other than
those issued by the USPTO?
49 Companies: Utility Patents Issued by USPTO Other Utility Patents
(not issued by USPTO)
Mean Median Mean Median
From Worldwide (Including U.S.) Operations 335.5 209 885 276
51. & 52. At the end of the last completed fiscal year, what was the total number of utility patents owned
by your company in force in the U.S.? What was the total number of utility patents owned by your
company in force outside the U.S.?
44 Companies: Utility Patents in Force in U.S. Utility Patents in Force
Outside U.S.
Mean Median Mean Median
From Worldwide (Including U.S.) Operations 4,515 1,445.5 6,994 4,000
53. During the last completed fiscal year, at each U.S. maintenance interval, what percentage of U.S.
granted cases owned by your company were abandoned of the total number up for renewal in that period?
42 Companies: 10% or
less
11%‐
24%
25% or
more
At 3.5 Years: 81% 14% 5%
At 7.5 Years: 59.5% 35.5% 5%
At 11.5 Years: 49% 24% 27%
54. What percentage of patents worldwide owned by your company were abandoned during the last
completed fiscal year?
38 Companies Mean Median
9% 10%

2011 IPO Corporate IP Management Benchmarking Survey
Page 39
55. Foreign Filing: For all originally filed non‐provisional U.S. utility applications filed in the previous
completed fiscal year by or on behalf of your company, what was the percentage of those cases for which
foreign counterparts were filed?
Chemical/Pharmaceutical/Biotechnology/ Consumer Products/Food & Beverage: 3 Companies
Medical Devices: 17 Companies
18 Companies %
0%‐20% 17%
21%‐40% 0%
41%‐60% 17%
60%‐80% 66%
Electrical/Electronics/Components: 3 Companies Information Services/Other Communications/Media: 2 Companies
8 Companies %
0%‐20% 12.5%
21%‐40% 37.5%
41%‐60% 25%
60%‐80% 25%
Mechanical and Machinery: 3 Companies Software/Computers/Peripherals: 2 Companies
3 Companies %
0%‐20% 0%
21%‐40% 0%
41%‐60% 33%
60%‐80% 67%
Other: 3 Companies
13 Companies %
0%‐20% 15.5%
21%‐40% 15.5%
41%‐60% 23%
60%‐80% 46%
4 Companies %
0%‐20% 0%
21%‐40% 0%
41%‐60% 25%
60%‐80% 75%
2 Companies %
0%‐20% 50%
21%‐40% 50%
41%‐60% 0%
60%‐80% 0%
2 Companies %
0%‐20% 0%
21%‐40% 0%
41%‐60% 100%
60%‐80% 0%
2011 IPO Corporate IP Management Benchmarking Survey
Page 40
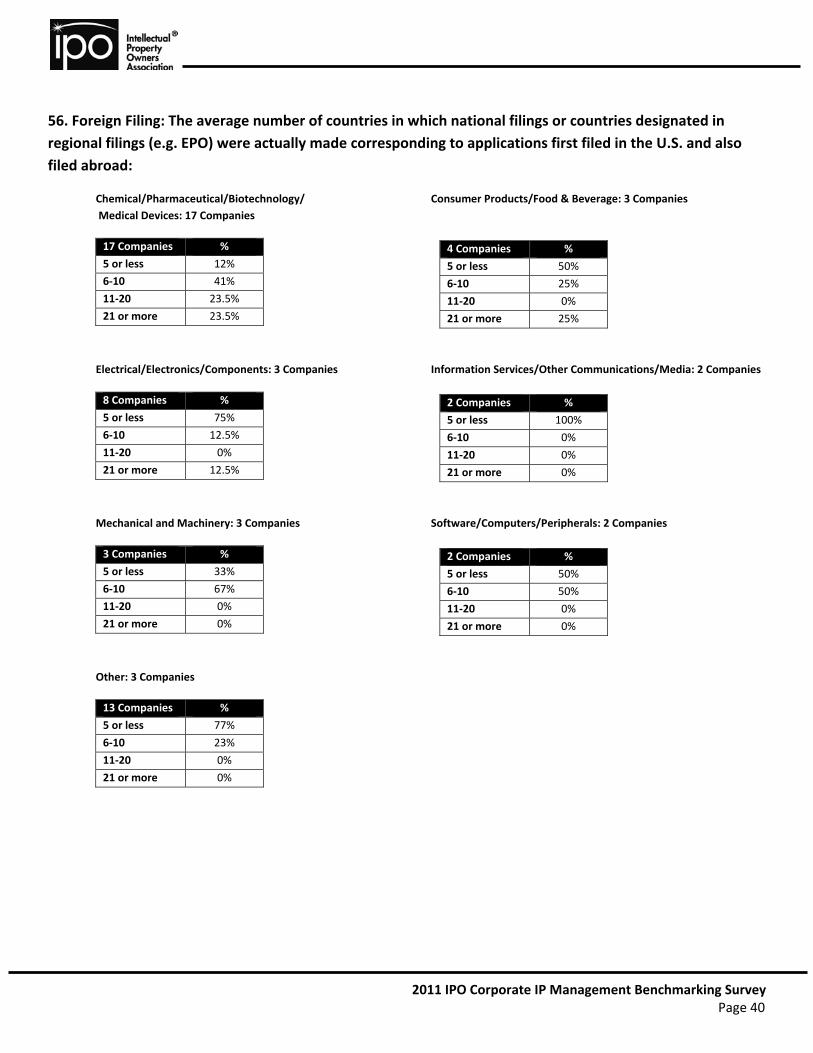
56. Foreign Filing: The average number of countries in which national filings or countries designated in
regional filings (e.g. EPO) were actually made corresponding to applications first filed in the U.S. and also
filed abroad:
Chemical/Pharmaceutical/Biotechnology/ Consumer Products/Food & Beverage: 3 Companies
Medical Devices: 17 Companies
17 Companies %
5 or less 12%
6‐10 41%
11‐20 23.5%
21 or more 23.5%
Electrical/Electronics/Components: 3 Companies Information Services/Other Communications/Media: 2 Companies
8 Companies %
5 or less 75%
6‐10 12.5%
11‐20 0%
21 or more 12.5%
Mechanical and Machinery: 3 Companies Software/Computers/Peripherals: 2 Companies
3 Companies %
5 or less 33%
6‐10 67%
11‐20 0%
21 or more 0%
Other: 3 Companies
13 Companies %
5 or less 77%
6‐10 23%
11‐20 0%
21 or more 0%
4 Companies %
5 or less 50%
6‐10 25%
11‐20 0%
21 or more 25%
2 Companies %
5 or less 100%
6‐10 0%
11‐20 0%
21 or more 0%
2 Companies %
5 or less 50%
6‐10 50%
11‐20 0%
21 or more 0%
2011 IPO Corporate IP Management Benchmarking Survey
Page 41
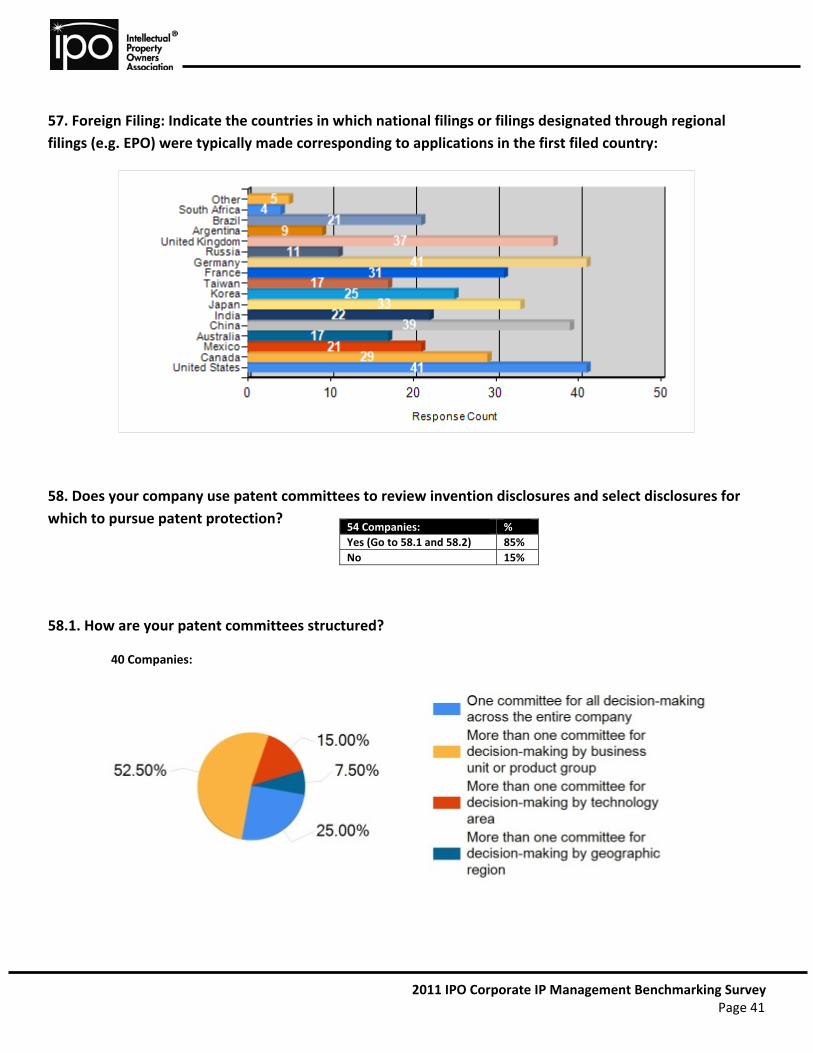
57. Foreign Filing: Indicate the countries in which national filings or filings designated through regional
filings (e.g. EPO) were typically made corresponding to applications in the first filed country:
58. Does your company use patent committees to review invention disclosures and select disclosures for
which to pursue patent protection?
58.1. How are your patent committees structured?
40 Companies:
54 Companies: %
Yes (Go to 58.1 and 58.2) 85%
No 15%

2011 IPO Corporate IP Management Benchmarking Survey
Page 42
58.2. What groups are represented on the patent committee(s)? (check all that apply)
59. How often does your company do product clearance patent searches on its new products?
54 Companies: % Always 31%
Most of the time 26%
Sometimes 30%
Seldom 9%
Never 4%

2011 IPO Corporate IP Management Benchmarking Survey
Page 43
60. How often does your company monitor patents issued to your competitors by the USPTO and major
foreign patent offices as they are issued?
61. How often does your company use patent landscaping and analysis software to develop technology and
business strategies?
62. Does your company have a financial reward (cash or stock payment) program for U.S. inventors?
53 Companies: % Always 17%
Most of the time 34%
Sometimes 26%
Seldom 21%
Never 2%
55 Companies: % Frequently 11%
Occasionally 69%
Never 20%
55 Companies: %
Yes (Go to 62.1) 69%
No 31%

2011 IPO Corporate IP Management Benchmarking Survey
Page 44
62.1. Indicate whether a standard payment is made and the standard amount paid for each of the following
events: (If the standard payment is made in shares of stock or options, please indicate the fair market value
[FMV] in lieu of dollar amount.)
30 Companies Mean Median
Submission of an invention disclosure $112.5 $50
Filing of the priority application $1,075 $1,000
Issuance of first patent $563 $500
Issuance of further patents $218 $0
Cumulative awards for multiple patents $1,818 $0
Other Financial Awards:
Inventor Remuneration Program for products that go to market, award is in stock between $20‐100K.
Reward based on use of granted patent by the company.
Commercial use
Letters and patent coins
Each inventor of highly rated invention submissions receives $200.
Inventor receives $1,000 upon approval to file.
Inventor receives $3,000 for usage and up to $50,000 from license income.
63. Does your company have a program of non‐financial recognition (plaque, memento, coin, ceremonies,
etc.) awards?
63.1. Which of the following types of recognition do you employ? (check all that apply)
53 Companies: %
Yes (Go to 63.1) 85%
No 15%
40 Companies: %
Inventor plaques, certificates or mementos, inclusion on inventor “honor roll” 90%
Inventor recognition ceremonies 62.5%
Public displays in company facilities 42.5%
Other non‐financial (please specify) 0%
2011 IPO Corporate IP Management Benchmarking Survey
Page 45
64. My company uses: (check all that apply)
54 Companies:
65. Have you benchmarked your operation with those of other companies in the past two years?
65.1. What benchmarking measures were used? (check all that apply)
65.2. Was a previous IPO survey your benchmark?
66. Is your IP operation managed against other particular external benchmarks?
54 Companies: %
Yes (Go to 65.1 and 65.2) 43%
No 57%
18 Companies: %
Patents or applications per R&D engineer 5.5%
Patents or applications per patent attorney 39%
Patent budget $/patent or application 44%
R&D expense $/patent or application 55.5%
Ratio of patent budget to R&D budget 33%
Ratio of patent budget to revenue 28%
Headcount: attorneys, engineers, etc. 72%
Other 28%
20 Companies: %
Yes 25%
No 75%
52 Companies: %
Yes (Go to 66.1) 17%
No 83%
2011 IPO Corporate IP Management Benchmarking Survey
Page 46
66.1. Which external benchmarks have you managed your operation against? (please specify)
Number of patents issued to competitors and innovative companies
Patents per R&D expenditures
Wall Street Journal/Patent Board Ratings
Other surveys
67. Outsourcing: During the last completed fiscal year, were any of your U.S. patent applications being
prepared or prosecuted by someone outside the U.S. for purposes of achieving cost savings?
67.1. In which country was the work performed? (check all that apply)
67.2. What type of work did you outsource? (check all that apply)
53 Companies: %
Yes (Go to 67.1 through 67.6) 15%
No 85%
53 Companies: %
Australia 14%
Canada 0%
China 28.5%
Europe 28.5%
India 86%
New Zealand 0%
Other (please specify): Germany 14%
7 Companies: %
Patent application drafting with claims 57%
Patent application drafting without claims 28.5%
Patent preparation/prosecution work 43%
Drawings 43%
Translations 57%
Patent mapping/analytics/IP landscaping 43%
Prior art searching 71%
Other (please specify): Proofreading 14%
2011 IPO Corporate IP Management Benchmarking Survey
Page 47
67.3. What was the average cost of a patent application prepared by the service provider in the lower cost
country (excluding government fees)?
67.4. What was the average cost of responding to a U.S. office action by the service provider outside the
U.S. (excluding government fees)?
67.5. Overall, what is your experience with outsourcing to someone outside the U.S.?
67.6. Has your experience with outsourcing improved from previous experiences?
8 Companies: %
Yes 62.5%
No 0%
Not Applicable 37.5%

2011 IPO Corporate IP Management Benchmarking Survey
Page 48
The following is a partial list of companies that participated in this survey:
3M Innovative Properties Co.
Agilent Technologies, Inc.
Air Liquide
Air Products & Chemicals, Inc.
Avaya Inc.
Baker Hughes Incorporated
Bausch & Lomb Inc.
Bridgestone Americas Holding, Inc.
Celanese International Corporation
Cephalon, Inc.
Deere & Co.
Dow Chemical Co.
Dow Corning Corp.
DuPont
Eli Lilly and Co.
Ford Global Technologies LLC
Freescale Semiconductor, Inc.
General Electric Co.
GlaxoSmithKline
Honeywell International Inc.
Illinois Tool Works Inc.
J.M. Huber Corporation
Jacuzzi Group Worldwide
Johnson & Johnson
Lutron Electronics Co., Inc.
Merck & Co., Inc.
Micron Technology, Inc.
The Nielsen Company
Procter & Gamble Co.
Pfizer, Inc.
Royal Philips Electronics
Siemens Corp.
STMicroelectronics, Inc.
Styron LLC
Tenneco Inc.

© 2011 Intellectual Property Owners Association
© 2011 Intellectual Property Owners Association
1501 M Street, NW, Washington, DC 20005
T: 202-507-4500 F: 202-507-4501 E: [email protected] W: www.ipo.org