cover-new alumni 2002-2003 - montclair state university · new alumni survey 2002-2003 report...
TRANSCRIPT

NEW ALUMNI SURVEY 2002-2003
Office of Institutional Research
February 2007

NEW ALUMNI SURVEY 2002-2003
Report Authors: Alexa Fernandez Gurvinder Khaneja
Data Tables Prepared By: Fenghua Peng
Office of Institutional Research Montclair State University
Steven L. Johnson, Director
Fenghua Peng, Research Associate Alexa Fernandez, Research Assistant
Denise Phillips-Clark, Program Assistant Elizabeth J. Keagy, Research Specialist
February 2007
MONTCLAIR STATE UNIVERSITY: UNDERGRADUATE CLASS OF 2002-2003 ONE-YEAR-OUT ALUMNI SURVEY
Introduction
Graduates are a success story of any institution. Assessment of their collegiate experience provides meaningful information about their tenure as a student at the university, as well as, assists the institution to reflect and modify its activities for current and new students. It also helps to understand and explain the institution’s commitment and contribution to the community, and assess their success in their post-baccalaureate activities. In the summer of 2004, the Office of Institutional Research worked with colleagues from Academic Affairs and Career Development to conduct a follow-up study of those students on whom a degree or a certificate was conferred by Montclair State University during 2002-2003. With the anticipated visit from the “Middle States” accreditation team in 2007, the Office of Academic Affairs intended to globally assess the alumni satisfaction with the institution. On the other hand, the Office of Career Development stressed a need to help the university gauge how well MSU graduates were faring in a difficult employment market and pursuing their post-baccalaureate educational goals.
Methodology
Survey Instrument The office of Institutional Research, in conjunction with Academic Affairs and Career Development, reviewed and modified the pre-existing survey instrument to gather relevant information. The survey, with 20 questions, inquired alumni about their academic and employment endeavors after they finished their studies at MSU. The survey also tapped into additional data about their experience at MSU a year ago and their satisfaction with various units of the university. A copy of the survey is attached at the end of this report. Graduates had the opportunity to complete the survey via the traditional paper survey or by completing the survey on the web. The scannable paper surveys were designed to be used with Remark OMR software and data from the web was added to these surveys. Survey Administration Overall, 2,026 undergraduates graduated with a baccalaureate degree from Montclair State University in May 2003. The MSU Alumni Office graciously supplied the database with updated addresses for these graduates. For the purpose of this study, students who resided outside of the USA were excluded from the mailing. Therefore, in all 1,747 graduates were mailed a complete set of the survey, including a cover letter, a survey and a pre-paid business reply envelope.

Since the survey was a little more detailed than in previous years, a coupon for a free transcript was given to students who completed the survey. After three mailings, a total of 411 surveys were received. Excluding bad addresses that could not be reached, a moderate response rate of 24 percent was achieved. Among those who responded, 87 percent completed the paper survey, while 13 percent completed the same on the web. The survey was analyzed using the SPSS-PC software and the results of the same are as discussed below. The open-ended questions were manually coded and were analyzed as well. Sample Table 1.0 provides comparative information about the number of students who graduated from MSU and those who responded to the survey for each major. The response or completion rates for colleges and schools were fairly comparable to the number of graduates that were initially surveyed from each college or school. The response rates for various colleges and schools were as follows: College of Education and Human Services (26 percent), College of Humanities and Social Sciences (24 percent), College of Science and Math (over 20 percent), School of Arts (over 21 percent), and the School of Business (24 percent). The highest response rates for majors awarding 10 or more degrees were achieved by graduates in Physical Education (31 percent), Molecular Biology (30 percent), Justice Studies (29 percent), Psychology (28 percent) and Business Administration (24 percent). Looking at all undergraduates who graduated during 2002 - 2003 shows that almost 62 percent were female and 38 percent were male. For our respondents, a slightly higher number of females (70 percent) and a slightly lower number of males (30 percent) answered the survey (table 2.0). Based on the findings above, it can be concurred that the results from the survey can be generalized to the population as the characteristics of the graduates and the respondents were very similar.

Findings
Alumni Activities Preparing students for a productive work experience is important to students and faculty alike. Responding to the CIRP survey in Fall 2005, 71 percent of the freshmen indicated that getting a good job was a major reason for attending MSU, while 58 percent emphasized the importance of college to prepare them for graduate school. Interestingly, 71 percent of our full-time faculty, who participated in the HERI faculty survey, expressed that preparing students for college after employment was an important goal for them. Additionally, 60 percent of the faculty also envisioned that preparing students for graduate or advanced education was very important for them. This itself is a strong basis for tapping into the employment and post-baccalaureate educational activities of our graduates The 2002-2003 survey of our one-year-out graduates inquired about the activities of the graduates, since they graduated from Montclair State University. Graduates had the option to select as many activities that they were engaged in, i.e., employed full- or part-time, attending graduate school full- or part-time, managing household, as well as, unemployed seeking or not seeking work. Almost 80 percent (329) of the respondents were employed full-time, while another 10 percent (41) were employed part-time. Almost 13 percent (98) of the graduates were attending graduate school part-time and over 8 percent (35) were attending a graduate school part-time. Almost 11 percent (45) were currently involved in managing household, while over 7 percent (30) were unemployed at the time (table 3.0). Teacher certification is an important program that is offered at Montclair State University. This enables our students to work as teachers at various levels in schools. Graduates were inquired if they had obtained a teacher certification, while studying at MSU. Almost 40 percent (68) of the graduates, who responded to the survey, indicated that they had obtained the certification before graduating from MSU. A large proportion of the graduates from the College of Education and Human Services (86 percent) and College of Science and Math (29 percent) cleared their certification, while at MSU (table 4.0). Table 5.0 provides information regarding current activities of the students by major. Overview and Employment Activities Almost 90 percent of the surveyed graduates were employed at the time when they completed the survey. Among those who provided information regarding the location of their employment, almost 89 percent indicated that they worked in New Jersey and another 9 percent were employed in New York (table 6.0). Job Market, Resources, and Relatedness Graduates were asked to rate job market in the their field on a scale of 1 to 5, where 1 = Excellent; 2 = Good; 3 = Fair; 4 = Poor, and 5 = Bleak. Graduates had the option to

indicate “Don’t know” if they were not aware about the job market. The average rating of 2.7 indicates that the job market was good with respect to the field that they graduated in. It is encouraging to note that almost half of the respondents (over 46 percent) who rated the job market indicated that the job market was either “Excellent” or “Good” in their field. Also, over 55 percent of the graduates from the College of Education and Human Services rated the job market as “Excellent” or “Good” in their field (table 7.0). Graduates who responded to the survey were asked to cite sources through which they found their current job. Departmental internships, Career Development Center, and Faculty member were cited by most graduates, as the sources through which graduates were aware of the jobs that helped them get into their current positions. Some of the other sources that were helpful in obtaining their jobs were: through networking, postings on web sites/internet, and job advertisements in newspapers (table 8.0). Graduates were asked to rate if their jobs were related to their majors that they pursued at MSU. They were asked to rate the relatedness of the job on a scale of 1 to 5 where 1 = Very related; 2 = Quite related; 3 = Somewhat related; 4 = Slightly related, and 5 = Not related. The overall average of 2.5 indicates that for most students the job was quite- or somewhat related to the major that they graduated with from MSU. Over 55 percent of the respondents indicated that their jobs were “Very related” or “Quite related” to their major. Almost 79 percent of the respondents from College of Education and Human Services, 54 percent from the College of Science and Math and 46 percent from School of the Arts were working on the jobs that were “Very related” to the majors they graduated with (table 9.0). Some of the reasons for finding jobs that were not related to the majors of the graduates were: no suitable position in my field or discipline, better opportunities in the current field than in my own field, and developed other career interests (table 10.0). Type of Companies/Industries Employed graduates were also asked to classify their jobs according to various companies/industries, i.e., Accounting Firm/Bank/Finance, Computer/Information systems, Chemical/Energy/Science Laboratory, School System (elementary/ secondary/ High), Government Agency, Health Care provider/Hospital, Law/Insurance Company, Library/Museum, Recreational Facility, Merchandising/Retail Store/Sales, and Telecommunications. Graduates represented in almost every category, but a large proportion of the responding graduates were employed in School system (30 percent), and Accounting Firm/Bank/Finance companies (over 10 percent) (table 11.0). Table 12.0 provides information regarding industries that our graduates are employed in with respect to their majors at Montclair State University. It is interesting to note that about 39 percent of the responding graduates from College of Education and Human Services were employed in school system. A similar trend was witnessed for the graduates from the College of Humanities and Social Sciences, with almost 46 percent employed in the school system. Similarly, about 28 percent of the respondents from the
School of Business with Business Administration major were employed in industries related to Accounting firms, bank or finance. This is not surprising, especially when we look at the large number of students who are enroll in and graduate with degrees in programs related to education and business. Table 13.0 provides information regarding the occupation of the employed alumni with respect to their major. As can be evidenced, MSU alumni are involved in a wide range of occupation, and in most cases associated to the major that they graduated with. Table 14.0 provides information regarding the employers of our graduates, classified by the major that they graduated with from MSU. It is important for our current students to understand the potential job market, especially the industries or employers that hire our alumni. The standing of the industry largely depends on the size of the organization and the potential for growth there. In order to gain insight on this aspect, alumni were asked to indicate the size of the company, ranging from a small organization with less than 50 employees, to a larger organization with over a 1,000 employees. Table 15.0 indicates that over a third of the alumni (over 37 percent) who responded to the survey, were employed in large organizations with over a 1,000 employees. MSU alumni who majored with an undergraduate degree in biology (58 percent), business administration and computer science (57 percent each) were employed in large organizations (table 15.0). Another question that is of importance to the institution is the salary of the alumni. This indirectly indicates if the skills of the alumni are appropriately compensated for. Additionally, the starting salary and the currently earned salary provides a hint about how well our alumni are faring on various jobs. Table 16.0 provides a comparison of starting and current salary of the responding alumni, on various salary ranges, that extend from less than $20,000 to over $80,000. Within approximately the first year of employment a number of alumni experienced salary changes. Table 16.0 indicates that over a third of the alumni (35 percent), who responded to the survey, earned less than $30,000 per annum as their starting salary. Comparatively, less than 20 percent were currently in the same salary range, indicating that definite progress has been made with respect to the salary and a large proportion was earning more money than they started with. However, the change was largely witnessed for alumni who indicated that they earned over $50,000 per annum. Compared to almost 3 percent of the alumni whose starting salary was above $50,000, over 15 percent had shifted in the category and made more than $50,000 per annum. Although business administration and biology majors drew annual salary above $50,000, alumni who graduated with majors such as fine arts, physical education, political science, psychology and computer science were earning over $50,000, within one year of their employment. Tables 17.0 and 18.0 provides a detailed breakdown of starting and current salary by school and major.
Alumni Job Satisfaction It is important to know if our alumni are satisfied with their employment. Graduates were also asked to rate their satisfaction with their jobs on a scale of 1 to 3 where, 1= very satisfied, 2 = somewhat satisfied and 3 = not satisfied. The average rating of 1.5 indicates that the alumni were quite satisfied with their jobs. It is encouraging to note that 93 percent of the students were either very or somewhat satisfied with their jobs. This trend was the similar for alumni from all five colleges and schools (Table 19.0).
Post-Baccalaureate Educational Activities Almost a third of the alumni (133), who responded to the survey, were enrolled in a graduate school pursuing post-baccalaureate studies. More than 68 percent (91) continue to study in state and 46 percent of those who study in state re-enrolled at Montclair State University. Among the students who enrolled in out-of-state colleges/universities, a large proportion of students were enrolled in various higher education institutions in New York (Table 20.0). Type of Degrees Pursued MSU graduates, responding to the study, indicated that they were pursuing various types of degrees after completing their baccalaureate study at MSU. However, most of the graduates, (73 percent) were enrolled in a masters level program, i.e., MA, MS, MAT, MPA, MED, MSW, and MBA. More than 13 percent were enrolled in specialized certification programs, while over 10 percent indicated that they were enrolled in a doctoral program, i.e., PHD, JD, DMD etc. (Table 21.0). Majors at Post-Baccalaureate Institutions Table 22.0 provides a list of the majors that respondents are pursuing in their graduate studies. A majority of the students were seeking post-baccalaureate education in the field of education, teaching and business. Table 23.0 compares respondents’ undergraduate MSU majors to their post-baccalaureate degree majors. Additionally, students were also asked if they intended to pursue an education in the future. Among those who responded, over 81 percent indicated that they will to pursue education, while nearly 12 percent were undecided about their opinion regarding further education (Table 24.0). Growth in Skills and Abilities
Alumni were provided with a list of 19 abilities or skills that one might expect to develop while pursuing a college education and asked how important they felt each one was to their personal and professional success. They were asked to rate these skills on a four point scale where, 1 = not at all important, 2 = a little, 3 = somewhat and 4 = very
important. Additionally, they were also asked to rate, on the same scale, if MSU helped them attain those skills. Table 25.0 provides results of their responses by school/college. Overall, speaking effectively in front of a group (average = 3.7) was cited as the most important skills for their personal and professional success. Although, over 94 percent of the respondents indicated that the skill was somewhat or very important to them, less than three quarters (73 percent), indicated that MSU helped them attain the skill. Close to 90 percent or more, of the respondents, indicated that the following skills or abilities were important to them: critical thinking and/or problem solving skills (93 percent); time management and organizational skills, applying moral or ethnical principles of everyday life, and using effective leadership skills (91 percent each), expressing themselves clearly in writing (90 percent) and making lifelong commitment to learning (over 89 percent). Over 70 percent of the respondents indicated that MSU helped them attain these skills and abilities, except for the ability to apply moral and ethical principles of everyday life, which 62 percent of the responding alumni indicated the institution helped somewhat or very much. The skills and abilities that were attained largely by being at Montclair State University were research skills (over 87 percent), working effectively with people in teams (over 85 percent), working effectively with a diverse population (82 percent), critical thinking and/or problem solving skills (81 percent), and making lifelong commitment to learning (75 percent). These skills were rated somewhat or very important by over 80 percent of the alumni, who responded to the study (Table 25.0). Table 25.0 also provides information regarding abilities and skills for alumni responding from various schools and colleges. Satisfaction with Montclair State University Table 26 provides information about the quality of programs that are offered by MSU, as rated by MSU alumni. The information is reported individually for each of the schools and colleges, as well as, for the entire institution. Alumni was asked to rate their agreement with various perspectives of the institution on a scale of 1 to 5 where, 1= strongly disagree, 2 = disagree, 3 = neutral, 4 = agree and 5 = strongly agree. It is encouraging to note that alumni were positive about their collegiate experience while at MSU. Alumni considered themselves as active learners, i.e., they read their assignments and contributed to class discussions etc. (average = 4.4). Alumni also indicated that the quality of instruction (education) in their major courses was excellent, that the course content was appropriate for their degree level and that their professors challenged them to give their best (average = 4.1 each). However students did not agree that participation in campus activities was an important part of their education (average = 2.8) (Table 26.0). Alumni were also asked to indicate the importance and their satisfaction with various units operating within the university. They were asked to rate the importance and their satisfaction with four broad areas, i.e., program and curriculum, faculty, advisement,

advisement and information provision and student services, on a scale of 1 to 4 where, 1= not at all, 2 = a little, 3 = a little, 4 = very. The areas that were tapped into were: program and curriculum, faculty, advisement/information provision and student services. Table 27 indicates that students were quite satisfied with faculty and program and curriculum, compared to advisement or information provision, or student services. Faculty Interesting, almost all of our alumni (99 percent) indicated that the quality of faculty was somewhat or very important for them, and that they were somewhat or very satisfied with the former (84 percent). More than 95 percent of the students cited, quality of student-faculty interaction, faculty teaching style and accessibility of faculty members, as somewhat or very important to them and over 75 percent of the alumni were satisfied with the same. Program and curriculum Program quality (average = 3.7), depth and breadth of curriculum (average = 3.6), academic rigor of the program (average = 3.6), and class size (average = 3.5) were cited to be somewhat or very important by over 90 percent of the graduates. More than 80 percent of the alumni indicated their satisfaction with these elements of the program and curriculum. Advisement/ Information Provision Clarity of degree completion requirements (average = 3.7) and quality of academic advisement (average = 3.6) were cited to be most important by the alumni. On the average, alumni were moderately satisfied with the same. Other areas of advisement and counseling were also rated to be very important by the alumni (average = 3.6), but they were not as satisfied with components (average = 2.7). Student Services Library resources (average = 3.7), campus safety (average = 3.6) and Public Safety (average = 3.5) were rated to be quite important by the alumni and over three-quarters expressed their satisfaction with the same. Overall Satisfaction Alumni were asked if they would recommend the program that they graduated from to students with similar academic and professional interests. They were asked to rate their responses n a scale of 1 to 5 where, 1= strongly disagree, 2 = disagree, 3 = neutral, 4 = agree and 5 = strongly agree. The indicator yielded an average of 4.0, indicated that that alumni would recommend their program to students who have similar interests. Alumni were also inquired about their choice of program if they had to start all over again. Approximately 64 percent of the alumni indicated that they would enroll in the same program if they had to start all over again (Table 26).
Additionally, alumni were asked to indicate their overall satisfaction with Montclair State University, one year after they had graduated from the university. The average rating on the five point rating scale where 1 = very dissatisfied, 2 = dissatisfied, 3 = neutral, 4 = satisfied and 5 = very satisfied, was 4.1, indicating that alumni were quite satisfied by the institution where they obtained their bachelor degree. More than one-third of the responding alumni indicated that they were very satisfied with Montclair State University (table 28.0)
Student Comments
One-year out graduates were asked to provide comments or suggestions to help our new graduates seeking job. Close to 300 comments were obtained from the alumni, of which almost 10 percent indicated they would suggest the current students to do an internship, followed by another 9 percent of students who expressed a desire to see additional or revised courses or programs. Some 8 percent were dissatisfied with college experience while 7 percent indicated that experience in the filed is very important for them and the importance of connections and networking. Over 5 percent re-iterated that they were very satisfied with Montclair State University and over 4 percent each indicated that it was difficult to find a job and indicated students need to look for jobs outside their major. Alumni also expressed that graduates should not give up and should research the availability of jobs in their major.
Conclusion One of the major goals of college for students, parents and faculty alike, is preparing students for a career. One way of finding out how well graduates are progressing in their career pursuits is by doing a post-graduate assessment. This particular survey looked at alumni early on in their careers; those who recently graduated in the 2002 academic year. A large number of the survey’s questions gathered work history information, e.g., type of professions, salary ranges, type of industries, work satisfaction, etc. The survey results showed that, in spite of a tough market, MSU graduates have been able to begin their careers. Almost 90 percent are working full- or part-time and most of them are contributing to New Jersey by working here in the Garden State. Today, post-baccalaureate education is often factored into career plans, so several survey questions asked alumni if they were pursuing a graduate education. More than 18 percent (116) of the graduates who responded to the survey were pursuing post-baccalaureate studies. Alumni were enrolled in various types of degrees, but most were in masters programs (MA, MSW, MIS, MBA, etc.). Almost two-thirds continue to study in state and almost 46 percent of those (41 respondents) re-enrolled at Montclair State University. While certainly not the main focus of this survey, one question did ask alumni about educational outcomes. Alumni were given a list of skills or abilities that might be
developed while pursuing a college education and asked how important they felt each skill or ability was to their personal/professional success. Almost 88 percent cited oral communication, time management, and organizational skills as very important skills. Critical thinking skills, written communication skills, working with people in teams and groups, and using effective leadership skills were also rated to be of major importance by over two-thirds of the respondents. Finally, of particular interest is the number of alumni who mentioned in their comments the usefulness of participating in internships, co-operative education experiences and volunteer work in finding employment.
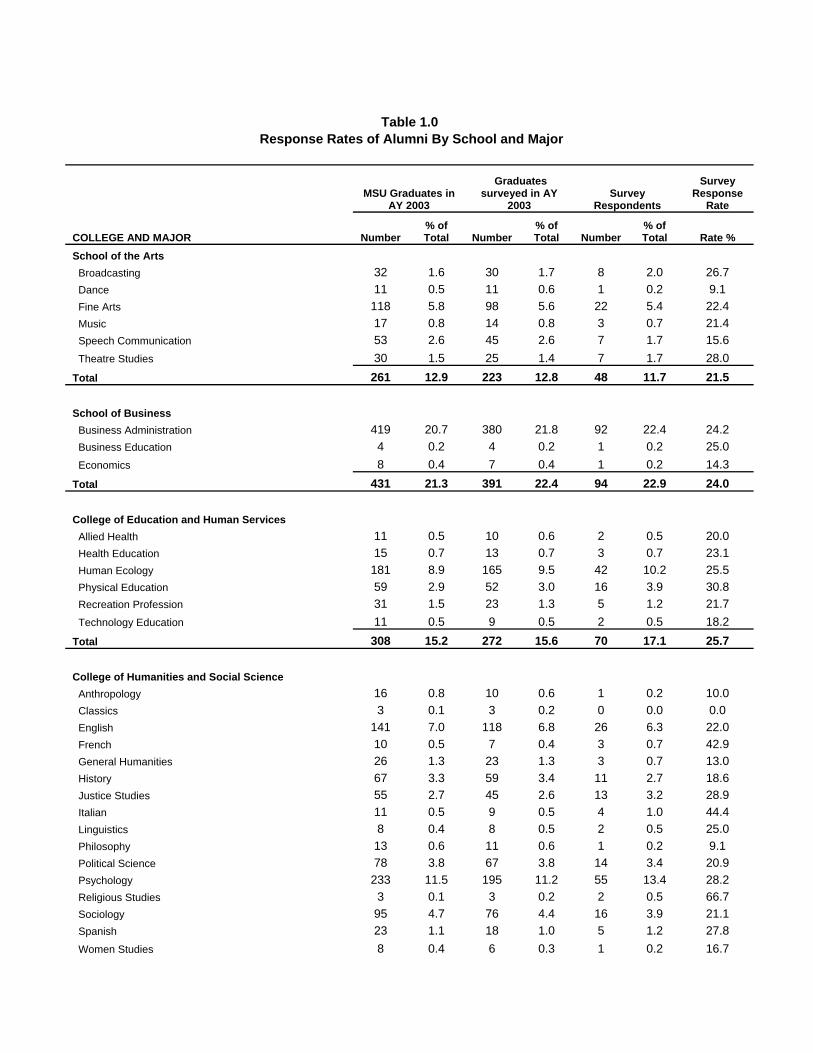
Table 1.0
Response Rates of Alumni By School and Major
MSU Graduates in
AY 2003
Graduates surveyed in AY
2003 Survey
Respondents
Survey Response
Rate
COLLEGE AND MAJOR Number % of Total Number
% of Total Number
% of Total Rate %
School of the Arts Broadcasting 32 1.6 30 1.7 8 2.0 26.7 Dance 11 0.5 11 0.6 1 0.2 9.1 Fine Arts 118 5.8 98 5.6 22 5.4 22.4 Music 17 0.8 14 0.8 3 0.7 21.4 Speech Communication 53 2.6 45 2.6 7 1.7 15.6 Theatre Studies 30 1.5 25 1.4 7 1.7 28.0 Total 261 12.9 223 12.8 48 11.7 21.5 School of Business Business Administration 419 20.7 380 21.8 92 22.4 24.2 Business Education 4 0.2 4 0.2 1 0.2 25.0 Economics 8 0.4 7 0.4 1 0.2 14.3 Total 431 21.3 391 22.4 94 22.9 24.0 College of Education and Human Services Allied Health 11 0.5 10 0.6 2 0.5 20.0 Health Education 15 0.7 13 0.7 3 0.7 23.1 Human Ecology 181 8.9 165 9.5 42 10.2 25.5 Physical Education 59 2.9 52 3.0 16 3.9 30.8 Recreation Profession 31 1.5 23 1.3 5 1.2 21.7 Technology Education 11 0.5 9 0.5 2 0.5 18.2 Total 308 15.2 272 15.6 70 17.1 25.7 College of Humanities and Social Science Anthropology 16 0.8 10 0.6 1 0.2 10.0 Classics 3 0.1 3 0.2 0 0.0 0.0 English 141 7.0 118 6.8 26 6.3 22.0 French 10 0.5 7 0.4 3 0.7 42.9 General Humanities 26 1.3 23 1.3 3 0.7 13.0 History 67 3.3 59 3.4 11 2.7 18.6 Justice Studies 55 2.7 45 2.6 13 3.2 28.9 Italian 11 0.5 9 0.5 4 1.0 44.4 Linguistics 8 0.4 8 0.5 2 0.5 25.0 Philosophy 13 0.6 11 0.6 1 0.2 9.1 Political Science 78 3.8 67 3.8 14 3.4 20.9 Psychology 233 11.5 195 11.2 55 13.4 28.2 Religious Studies 3 0.1 3 0.2 2 0.5 66.7 Sociology 95 4.7 76 4.4 16 3.9 21.1 Spanish 23 1.1 18 1.0 5 1.2 27.8 Women Studies 8 0.4 6 0.3 1 0.2 16.7
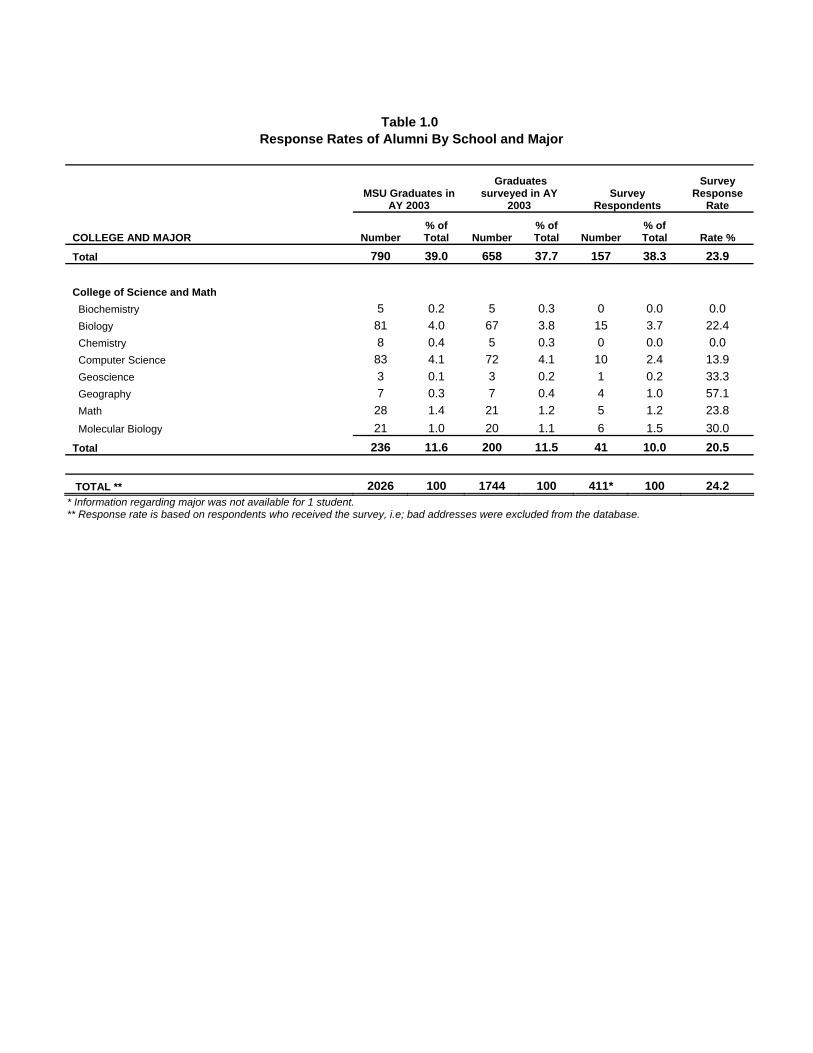
Table 1.0
Response Rates of Alumni By School and Major
MSU Graduates in
AY 2003
Graduates surveyed in AY
2003 Survey
Respondents
Survey Response
Rate
COLLEGE AND MAJOR Number % of Total Number
% of Total Number
% of Total Rate %
Total 790 39.0 658 37.7 157 38.3 23.9 College of Science and Math Biochemistry 5 0.2 5 0.3 0 0.0 0.0 Biology 81 4.0 67 3.8 15 3.7 22.4 Chemistry 8 0.4 5 0.3 0 0.0 0.0 Computer Science 83 4.1 72 4.1 10 2.4 13.9 Geoscience 3 0.1 3 0.2 1 0.2 33.3 Geography 7 0.3 7 0.4 4 1.0 57.1 Math 28 1.4 21 1.2 5 1.2 23.8 Molecular Biology 21 1.0 20 1.1 6 1.5 30.0 Total 236 11.6 200 11.5 41 10.0 20.5 TOTAL ** 2026 100 1744 100 411* 100 24.2
* Information regarding major was not available for 1 student. ** Response rate is based on respondents who received the survey, i.e; bad addresses were excluded from the database.
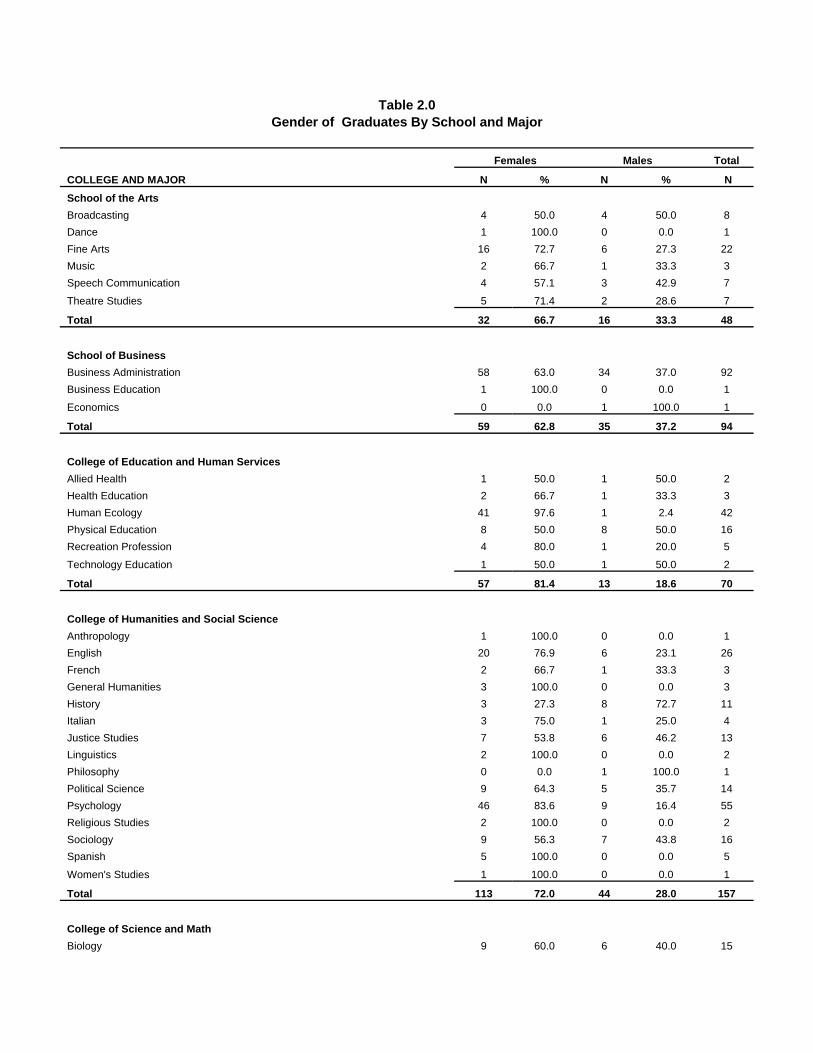
Table 2.0 Gender of Graduates By School and Major
Females Males Total
COLLEGE AND MAJOR N % N % N School of the Arts Broadcasting 4 50.0 4 50.0 8 Dance 1 100.0 0 0.0 1 Fine Arts 16 72.7 6 27.3 22 Music 2 66.7 1 33.3 3 Speech Communication 4 57.1 3 42.9 7
Theatre Studies 5 71.4 2 28.6 7
Total 32 66.7 16 33.3 48 School of Business Business Administration 58 63.0 34 37.0 92 Business Education 1 100.0 0 0.0 1
Economics 0 0.0 1 100.0 1
Total 59 62.8 35 37.2 94 College of Education and Human Services Allied Health 1 50.0 1 50.0 2 Health Education 2 66.7 1 33.3 3 Human Ecology 41 97.6 1 2.4 42 Physical Education 8 50.0 8 50.0 16 Recreation Profession 4 80.0 1 20.0 5
Technology Education 1 50.0 1 50.0 2
Total 57 81.4 13 18.6 70 College of Humanities and Social Science Anthropology 1 100.0 0 0.0 1 English 20 76.9 6 23.1 26 French 2 66.7 1 33.3 3 General Humanities 3 100.0 0 0.0 3 History 3 27.3 8 72.7 11 Italian 3 75.0 1 25.0 4 Justice Studies 7 53.8 6 46.2 13 Linguistics 2 100.0 0 0.0 2 Philosophy 0 0.0 1 100.0 1 Political Science 9 64.3 5 35.7 14 Psychology 46 83.6 9 16.4 55 Religious Studies 2 100.0 0 0.0 2 Sociology 9 56.3 7 43.8 16 Spanish 5 100.0 0 0.0 5
Women's Studies 1 100.0 0 0.0 1
Total 113 72.0 44 28.0 157 College of Science and Math Biology 9 60.0 6 40.0 15
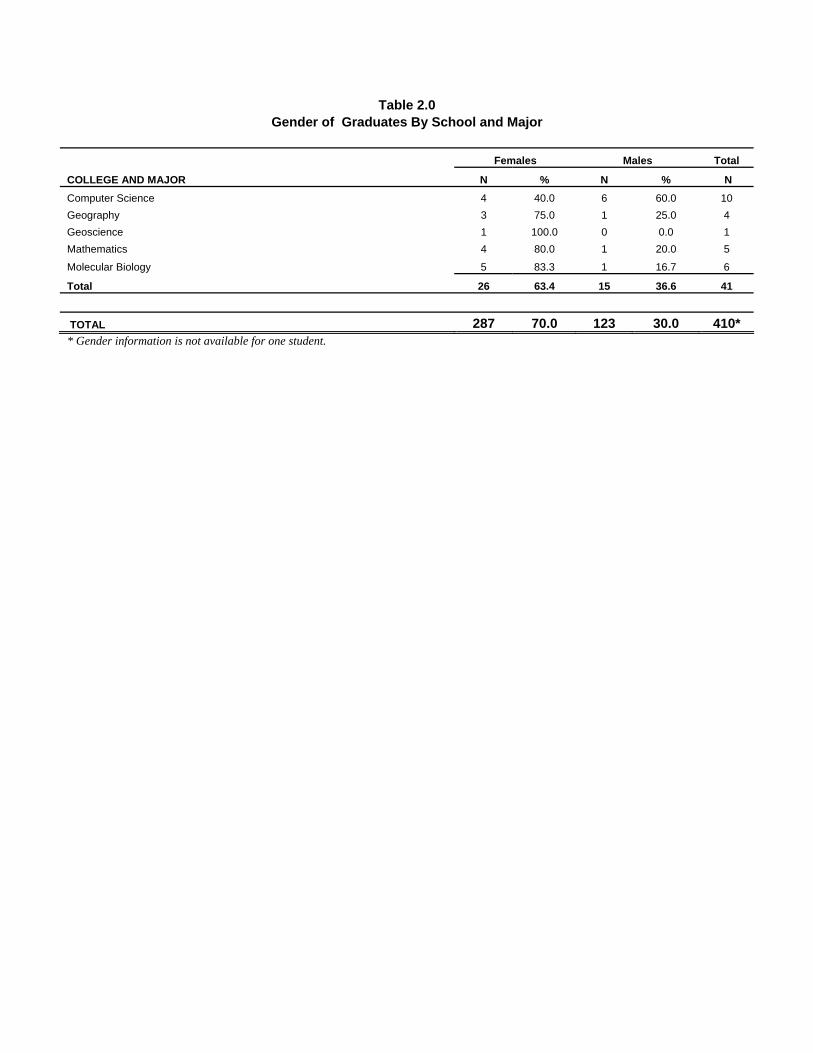
Table 2.0 Gender of Graduates By School and Major
Females Males Total
COLLEGE AND MAJOR N % N % N Computer Science 4 40.0 6 60.0 10 Geography 3 75.0 1 25.0 4 Geoscience 1 100.0 0 0.0 1 Mathematics 4 80.0 1 20.0 5
Molecular Biology 5 83.3 1 16.7 6
Total 26 63.4 15 36.6 41
TOTAL 287 70.0 123 30.0 410* * Gender information is not available for one student.
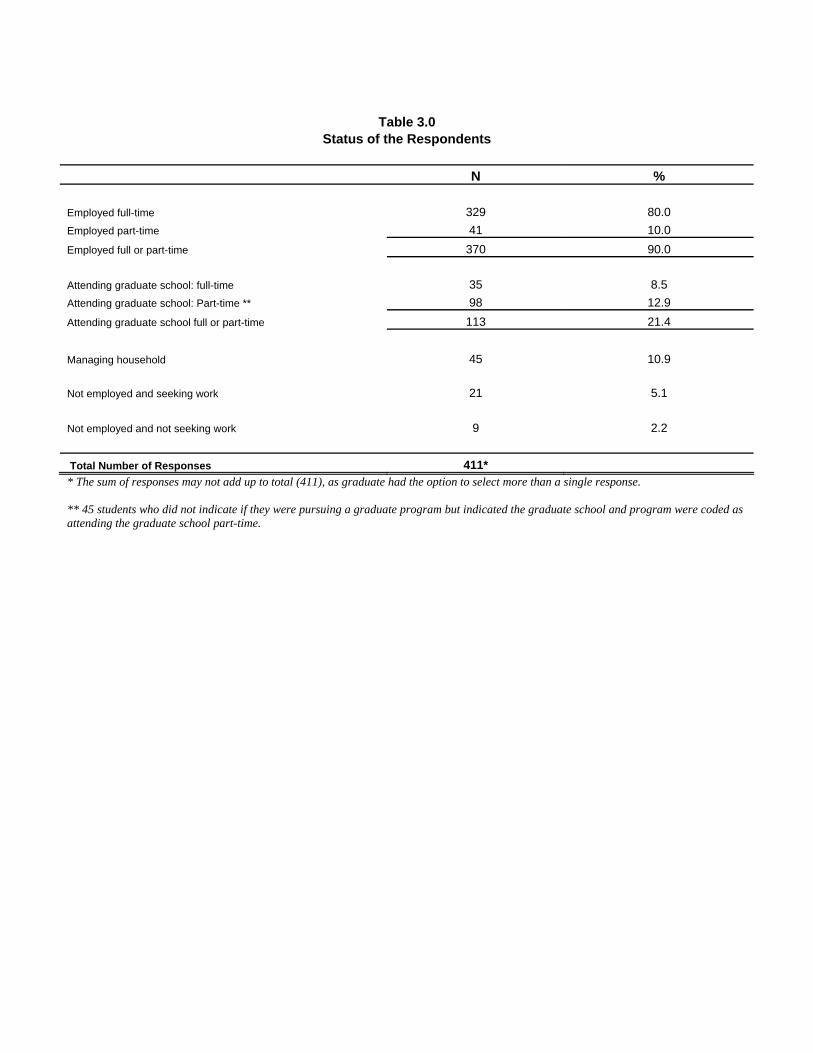
Table 3.0
Status of the Respondents
N % Employed full-time 329 80.0 Employed part-time 41 10.0 Employed full or part-time 370 90.0 Attending graduate school: full-time 35 8.5 Attending graduate school: Part-time ** 98 12.9 Attending graduate school full or part-time 113 21.4 Managing household 45 10.9 Not employed and seeking work 21 5.1 Not employed and not seeking work 9 2.2 Total Number of Responses 411* * The sum of responses may not add up to total (411), as graduate had the option to select more than a single response. ** 45 students who did not indicate if they were pursuing a graduate program but indicated the graduate school and program were coded as attending the graduate school part-time.
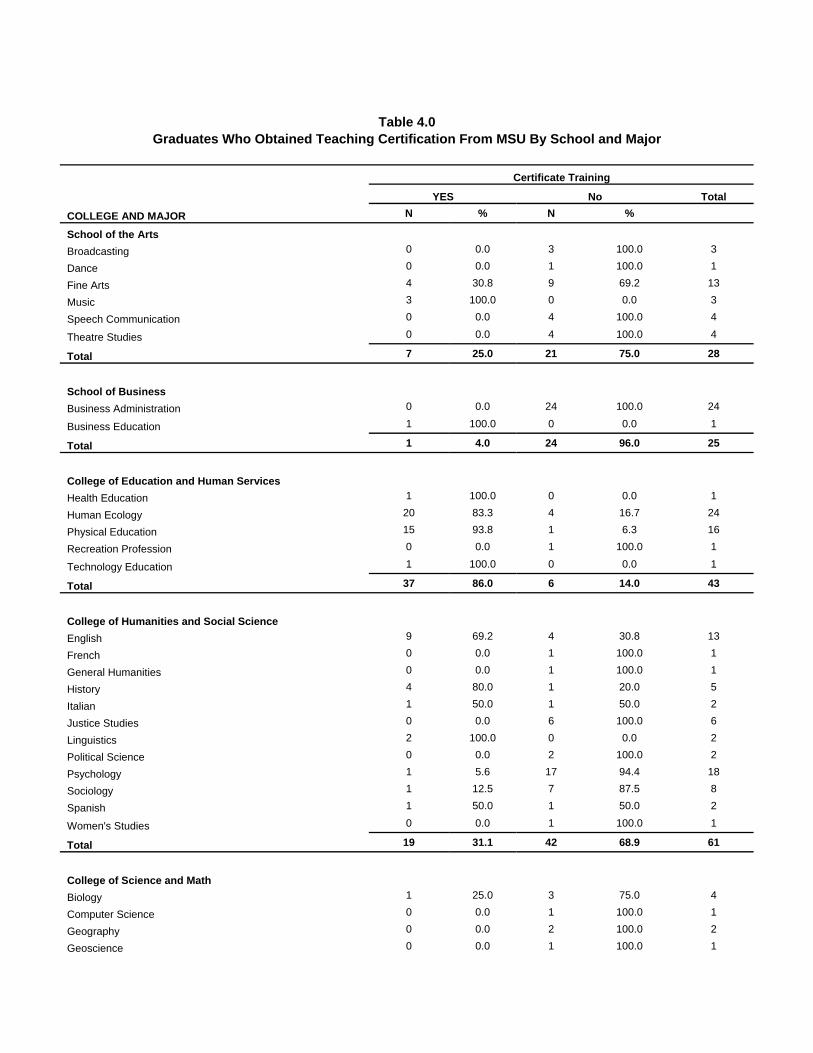
Table 4.0
Graduates Who Obtained Teaching Certification From MSU By School and Major
Certificate Training
YES No Total
COLLEGE AND MAJOR N % N % School of the Arts
Broadcasting 0 0.0 3 100.0 3
Dance 0 0.0 1 100.0 1
Fine Arts 4 30.8 9 69.2 13
Music 3 100.0 0 0.0 3
Speech Communication 0 0.0 4 100.0 4
Theatre Studies 0 0.0 4 100.0 4
Total 7 25.0 21 75.0 28
School of Business
Business Administration 0 0.0 24 100.0 24
Business Education 1 100.0 0 0.0 1
Total 1 4.0 24 96.0 25
College of Education and Human Services
Health Education 1 100.0 0 0.0 1
Human Ecology 20 83.3 4 16.7 24
Physical Education 15 93.8 1 6.3 16
Recreation Profession 0 0.0 1 100.0 1
Technology Education 1 100.0 0 0.0 1
Total 37 86.0 6 14.0 43
College of Humanities and Social Science
English 9 69.2 4 30.8 13
French 0 0.0 1 100.0 1
General Humanities 0 0.0 1 100.0 1
History 4 80.0 1 20.0 5
Italian 1 50.0 1 50.0 2
Justice Studies 0 0.0 6 100.0 6
Linguistics 2 100.0 0 0.0 2
Political Science 0 0.0 2 100.0 2
Psychology 1 5.6 17 94.4 18
Sociology 1 12.5 7 87.5 8
Spanish 1 50.0 1 50.0 2
Women's Studies 0 0.0 1 100.0 1
Total 19 31.1 42 68.9 61
College of Science and Math
Biology 1 25.0 3 75.0 4
Computer Science 0 0.0 1 100.0 1
Geography 0 0.0 2 100.0 2
Geoscience 0 0.0 1 100.0 1
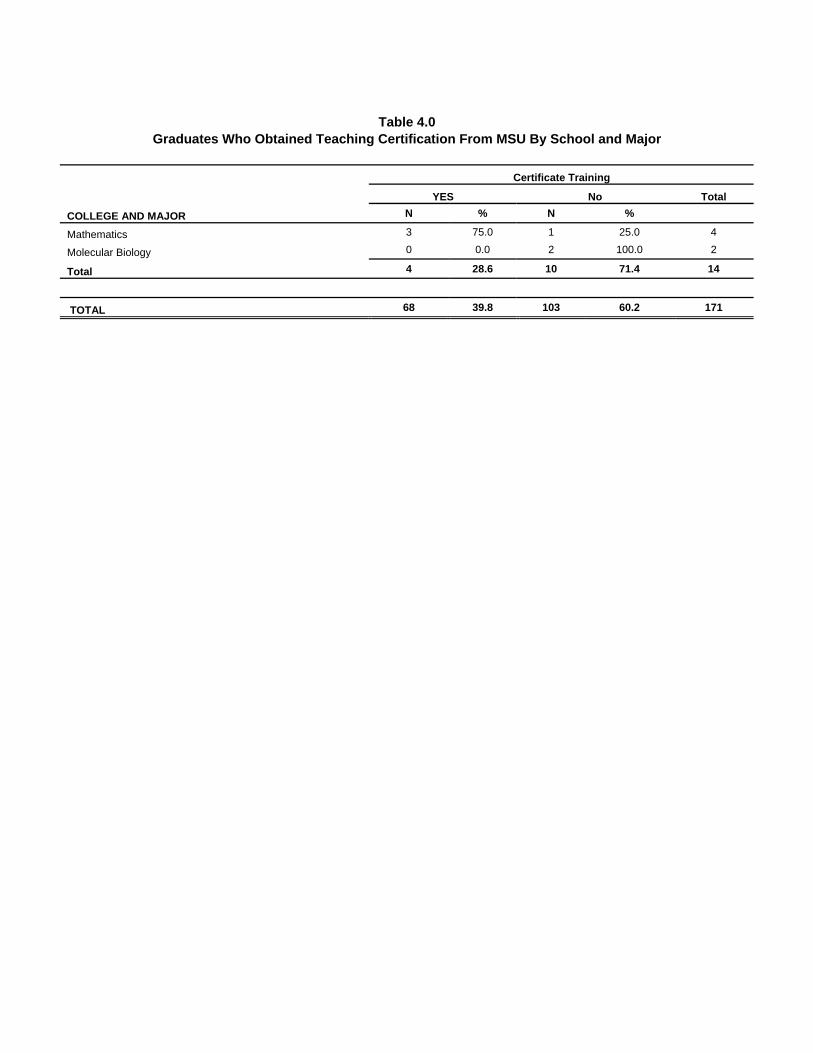
Table 4.0
Graduates Who Obtained Teaching Certification From MSU By School and Major
Certificate Training
YES No Total
COLLEGE AND MAJOR N % N % Mathematics 3 75.0 1 25.0 4
Molecular Biology 0 0.0 2 100.0 2
Total 4 28.6 10 71.4 14
TOTAL 68 39.8 103 60.2 171

Table 5.0
Current Activities of Alumni By School and Major
Employed Graduate Studies Managing household
Not Employed
Total Responses
UNDERGRADUATE Full-time Part-time
Full-time Part-time
COLLEGE AND MAJOR % % % % % % N
School of the Arts Broadcasting 77.8 11.1 0.0 0.0 11.1 0.0 9
Dance 100.0 0.0 0.0 0.0 0.0 0.0 1
Fine Arts 56.3 6.3 9.4 9.4 12.5 6.3 32
Music 40.0 20.0 20.0 0.0 20.0 0.0 5
Speech Communication 71.4 14.3 0.0 14.3 0.0 0.0 7
Theatre Studies 50.0 25.0 0.0 12.5 0.0 12.5 8
Total 59.7 11.3 6.5 8.1 9.7 4.8 62
School of Business
Business Administration 75.7 3.6 0.9 9.0 7.2 3.6 111
Business Education 0.0 50.0 0.0 0.0 50.0 0.0 2
Economics 100.0 0.0 0.0 0.0 0.0 0.0 1
Total 74.6 4.4 0.9 8.8 7.9 3.5 114
College of Education and Human Services
Allied Health 40.0 0.0 0.0 0.0 40.0 20.0 5
Health Education 25.0 25.0 25.0 0.0 0.0 25.0 4
Human Ecology 60.3 5.2 3.4 15.5 12.1 3.4 58
Physical Education 68.2 4.5 4.5 13.6 9.1 0.0 22
Recreation Profession 33.3 16.7 16.7 0.0 16.7 16.7 6
Technology Education 25.0 25.0 0.0 25.0 25.0 0.0 4
Total 56.6 7.1 5.1 13.1 13.1 5.1 99
College of Humanities and Social Science
Anthropology 50.0 0.0 0.0 0.0 50.0 0.0 2
English 71.9 3.1 6.3 6.3 3.1 9.4 32
French 60.0 0.0 0.0 40.0 0.0 0.0 5
General Humanities 75.0 0.0 0.0 0.0 25.0 0.0 4
History 60.0 0.0 6.7 26.7 0.0 6.7 15
Italian 25.0 12.5 0.0 25.0 12.5 25.0 8
Justice Studies 62.5 6.3 6.3 6.3 12.5 6.3 16
Linguistics 0.0 50.0 0.0 0.0 50.0 0.0 2
Philosophy 100.0 0.0 0.0 0.0 0.0 0.0 1
Political Science 64.7 5.9 11.8 11.8 5.9 0.0 17
Psychology 57.1 12.9 11.4 11.4 4.3 2.9 70
Religious Studies 25.0 0.0 25.0 0.0 25.0 25.0 4
Sociology 75.0 5.0 5.0 10.0 5.0 0.0 20
Spanish 66.7 0.0 0.0 0.0 16.7 16.7 6
Women's Studies 50.0 50.0 0.0 0.0 0.0 0.0 2
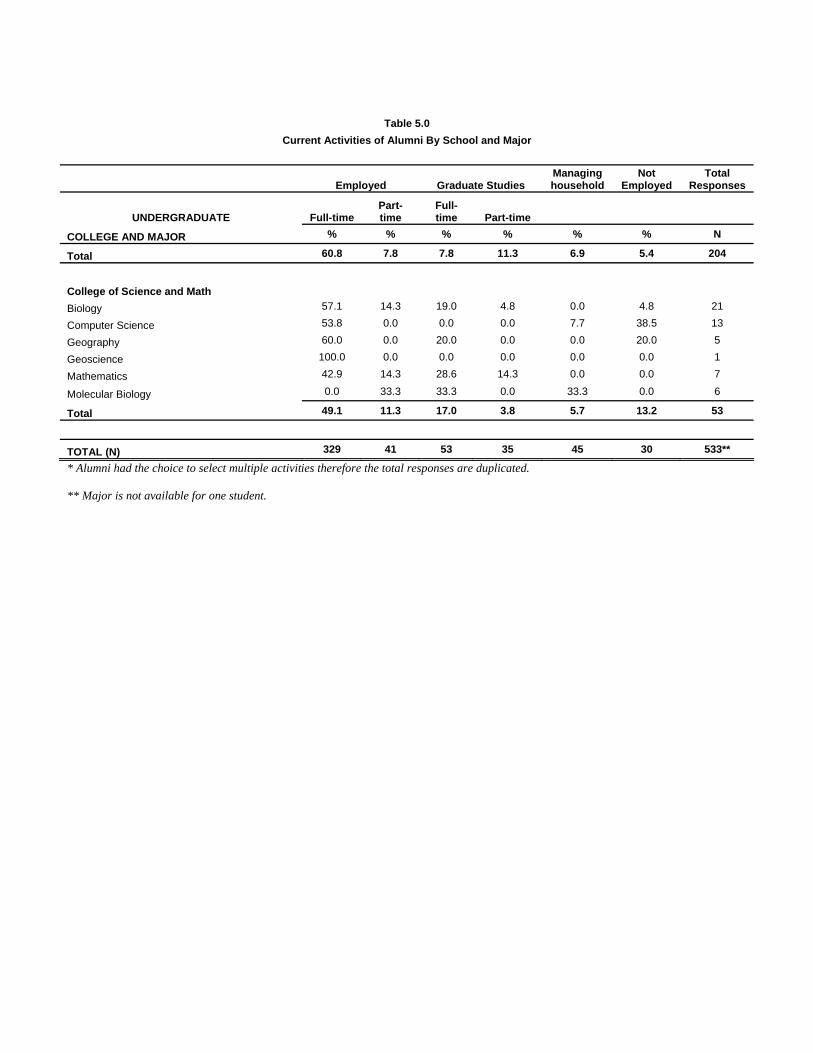
Table 5.0
Current Activities of Alumni By School and Major
Employed Graduate Studies Managing household
Not Employed
Total Responses
UNDERGRADUATE Full-time Part-time
Full-time Part-time
COLLEGE AND MAJOR % % % % % % N
Total 60.8 7.8 7.8 11.3 6.9 5.4 204
College of Science and Math
Biology 57.1 14.3 19.0 4.8 0.0 4.8 21
Computer Science 53.8 0.0 0.0 0.0 7.7 38.5 13
Geography 60.0 0.0 20.0 0.0 0.0 20.0 5
Geoscience 100.0 0.0 0.0 0.0 0.0 0.0 1
Mathematics 42.9 14.3 28.6 14.3 0.0 0.0 7
Molecular Biology 0.0 33.3 33.3 0.0 33.3 0.0 6
Total 49.1 11.3 17.0 3.8 5.7 13.2 53
TOTAL (N) 329 41 53 35 45 30 533**
* Alumni had the choice to select multiple activities therefore the total responses are duplicated. ** Major is not available for one student.

Table 6.0
States where MSU Graduates are Employed
Employed Total % Full-time Part-time N % N %
New Jersey 289 89.4 34 85.0 322 88.9 New York 27 8.4 5 12.5 32 8.8 Utah 2 0.6 2 0.6 Pennsylvania 1 0.3 1 0.3 Colorado 3 0.9 3 0.8 Tennessee 1 0.3 1 0.3 Arizona 1 2.5 1 0.3 TOTAL 323 100 40 100 362 100

Table 7.0
Job Market by School and Major
Excellent Good Fair Poor Bleak Don't Know Total COLLEGE AND MAJOR N % N % N % N % N % N % N Average School of the Arts Broadcasting 0 0.0 2 28.6 1 14.3 4 57.1 0 0.0 0 0.0 7 3.3 Dance 0 0.0 0 0.0 0 0.0 1 100.0 0 0.0 0 0.0 1 4.0 Fine Arts 0 0.0 8 44.4 7 38.9 3 16.7 0 0.0 0 0.0 18 2.7 Music 0 0.0 2 100.0 0 0.0 0 0.0 0 0.0 0 0.0 2 2.0 Speech Communication 0 0.0 3 60.0 1 20.0 1 20.0 0 0.0 0 0.0 5 2.6 Theatre Studies 0 0.0 1 25.0 1 25.0 1 25.0 1 25.0 0 0.0 4 3.5 Total 0 0.0 16 43.2 10 27.0 10 27.0 1 2.7 0 0.0 37 2.9 School of Business Business Administration 13 15.7 27 32.5 27 32.5 13 15.7 1 1.2 2 2.4 83 2.6 Economics 0 0.0 0 0.0 1 100.0 0 0.0 0 0.0 0 0.0 1 3.0 Total 13 15.5 27 32.1 28 33.3 13 15.5 1 1.2 2 2.4 84 2.6 College of Education and Human Services Allied Health 1 50.0 1 50.0 0 0.0 0 0.0 0 0.0 0 0.0 2 1.5 Health Education 0 0.0 0 0.0 1 100.0 0 0.0 0 0.0 0 0.0 1 3.0 Human Ecology 2 5.7 16 45.7 13 37.1 4 11.4 0 0.0 0 0.0 35 2.5 Physical Education 2 13.3 9 60.0 4 26.7 0 0.0 0 0.0 0 0.0 15 2.1 Recreation Profession 0 0.0 0 0.0 1 50.0 1 50.0 0 0.0 0 0.0 2 3.5 Technology Education 0 0.0 0 0.0 1 100.0 0 0.0 0 0.0 0 0.0 1 3.0 Total 5 8.9 26 46.4 20 35.7 5 8.9 0 0.0 0 0.0 56 2.4 College of Humanities and Social Science Anthropology 0 0.0 0 0.0 0 0.0 1 100.0 0 0.0 0 0.0 1 4.0 English 1 4.5 9 40.9 5 22.7 3 13.6 1 4.5 3 13.6 22 3.1 French 2 66.7 0 0.0 1 33.3 0 0.0 0 0.0 0 0.0 3 1.7 General Humanities 1 33.3 2 66.7 0 0.0 0 0.0 0 0.0 0 0.0 3 1.7 History 1 11.1 2 22.2 2 22.2 3 33.3 0 0.0 1 11.1 9 3.2 Italian 0 0.0 1 50.0 1 50.0 0 0.0 0 0.0 0 0.0 2 2.5

Table 7.0
Job Market by School and Major
Excellent Good Fair Poor Bleak Don't Know Total COLLEGE AND MAJOR N % N % N % N % N % N % N Average Justice Studies 0 0.0 5 50.0 2 20.0 1 10.0 2 20.0 0 0.0 10 3.0 Philosophy 0 0.0 0 0.0 1 100.0 0 0.0 0 0.0 0 0.0 1 3.0 Political Science 1 9.1 2 18.2 6 54.5 2 18.2 0 0.0 0 0.0 11 2.8 Psychology 1 2.5 12 30.0 18 45.0 6 15.0 1 2.5 2 5.0 40 3.0 Religious Studies 0 0.0 0 0.0 1 100.0 0 0.0 0 0.0 0 0.0 1 3.0 Sociology 2 13.3 7 46.7 4 26.7 2 13.3 0 0.0 0 0.0 15 2.4 Spanish 0 0.0 2 50.0 2 50.0 0 0.0 0 0.0 0 0.0 4 2.5 Women's Studies 0 0.0 0 0.0 1 100.0 0 0.0 0 0.0 0 0.0 1 3.0 Total 9 7.3 42 34.1 44 35.8 18 14.6 4 3.3 6 4.9 123 2.9 College of Science and Math Biology 4 33.3 4 33.3 3 25.0 1 8.3 0 0.0 0 0.0 12 2.1 Computer Science 0 0.0 0 0.0 5 71.4 2 28.6 0 0.0 0 0.0 7 3.3 Geography 0 0.0 1 33.3 1 33.3 0 0.0 1 33.3 0 0.0 3 3.3 Geoscience 0 0.0 1 100.0 0 0.0 0 0.0 0 0.0 0 0.0 1 2.0 Mathematics 2 66.7 1 33.3 0 0.0 0 0.0 0 0.0 0 0.0 3 1.3 Total 6 23.1 7 26.9 9 34.6 3 11.5 1 3.8 0 0.0 26 2.5 TOTAL 33 10.1 118 36.2 111 34.0 49 15.0 7 2.1 8 2.5 326 2.7 Scale: 1= Excellent, 2= Good, 3= Fair, 4= Poor, 5= Bleak, 6= Don’t know.
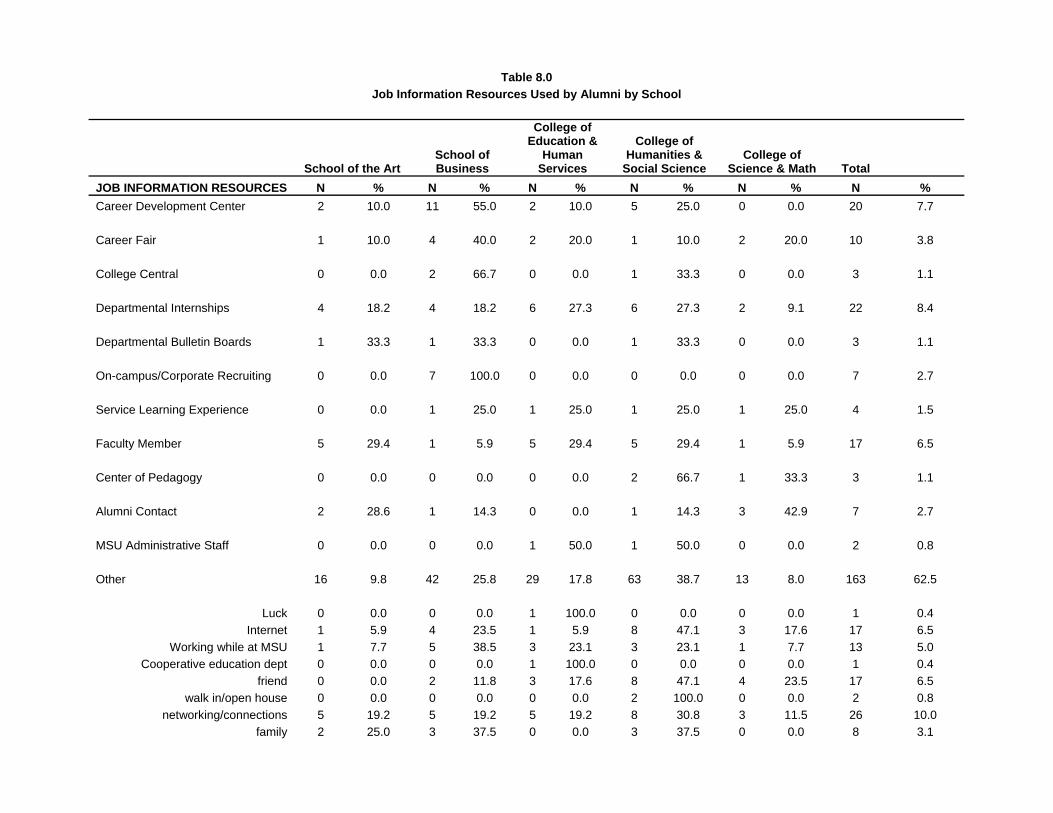
Table 8.0 Job Information Resources Used by Alumni by School
School of the Art School of Business
College of Education &
Human Services
College of Humanities &
Social Science College of
Science & Math Total JOB INFORMATION RESOURCES N % N % N % N % N % N % Career Development Center 2 10.0 11 55.0 2 10.0 5 25.0 0 0.0 20 7.7 Career Fair 1 10.0 4 40.0 2 20.0 1 10.0 2 20.0 10 3.8 College Central 0 0.0 2 66.7 0 0.0 1 33.3 0 0.0 3 1.1 Departmental Internships 4 18.2 4 18.2 6 27.3 6 27.3 2 9.1 22 8.4 Departmental Bulletin Boards 1 33.3 1 33.3 0 0.0 1 33.3 0 0.0 3 1.1 On-campus/Corporate Recruiting 0 0.0 7 100.0 0 0.0 0 0.0 0 0.0 7 2.7 Service Learning Experience 0 0.0 1 25.0 1 25.0 1 25.0 1 25.0 4 1.5 Faculty Member 5 29.4 1 5.9 5 29.4 5 29.4 1 5.9 17 6.5 Center of Pedagogy 0 0.0 0 0.0 0 0.0 2 66.7 1 33.3 3 1.1 Alumni Contact 2 28.6 1 14.3 0 0.0 1 14.3 3 42.9 7 2.7 MSU Administrative Staff 0 0.0 0 0.0 1 50.0 1 50.0 0 0.0 2 0.8 Other 16 9.8 42 25.8 29 17.8 63 38.7 13 8.0 163 62.5
Luck 0 0.0 0 0.0 1 100.0 0 0.0 0 0.0 1 0.4 Internet 1 5.9 4 23.5 1 5.9 8 47.1 3 17.6 17 6.5
Working while at MSU 1 7.7 5 38.5 3 23.1 3 23.1 1 7.7 13 5.0 Cooperative education dept 0 0.0 0 0.0 1 100.0 0 0.0 0 0.0 1 0.4
friend 0 0.0 2 11.8 3 17.6 8 47.1 4 23.5 17 6.5 walk in/open house 0 0.0 0 0.0 0 0.0 2 100.0 0 0.0 2 0.8
networking/connections 5 19.2 5 19.2 5 19.2 8 30.8 3 11.5 26 10.0 family 2 25.0 3 37.5 0 0.0 3 37.5 0 0.0 8 3.1

Table 8.0 Job Information Resources Used by Alumni by School
School of the Art School of Business
College of Education &
Human Services
College of Humanities &
Social Science College of
Science & Math Total JOB INFORMATION RESOURCES N % N % N % N % N % N %
workshop for substitutes 0 0.0 1 100.0 0 0.0 0 0.0 0 0.0 1 0.4 previous experience 1 16.7 3 50.0 0 0.0 2 33.3 0 0.0 6 2.3
civil service exam 0 0.0 1 33.3 0 0.0 2 66.7 0 0.0 3 1.1 staffing agency 0 0.0 0 0.0 1 50.0 1 50.0 0 0.0 2 0.8 newspaper ad 1 7.1 3 21.4 3 21.4 7 50.0 0 0.0 14 5.4
self/personal effort 1 6.3 5 31.3 5 31.3 5 31.3 0 0.0 16 6.1 substituting 0 0.0 0 0.0 1 25.0 3 75.0 0 0.0 4 1.5
alumnus 0 0.0 0 0.0 0 0.0 2 100.0 0 0.0 2 0.8 internship 1 14.3 3 42.9 1 14.3 1 14.3 1 14.3 7 2.7
diploma 0 0.0 0 0.0 0 0.0 1 100.0 0 0.0 1 0.4 recruiter 1 100.0 0 0.0 0 0.0 0 0.0 0 0.0 1 0.4
student teaching 0 0.0 0 0.0 0 0.0 1 100.0 0 0.0 1 0.4 externship 0 0.0 0 0.0 0 0.0 1 100.0 0 0.0 1 0.4
Nothing/None of the above 2 10.0 7 35.0 4 20.0 6 30.0 1 5.0 20 7.7 TOTAL 31 11.9 74 28.4 46 17.6 87 33.3 23 8.8 261 100

Table 9.0
Relationship of MSU Major to Current Job By School and Major MSU Major Related to Job
Very
Related Quite
Related Somewhat
Related Slightly Related
Not Related Total
COLLEGE AND MAJOR N % N % N % N % N % N Average School of the Arts Broadcasting 3 42.9 1 14.3 1 14.3 0 0.0 2 28.6 7 2.6 Dance 1 100.0 0 0.0 0 0.0 0 0.0 0 0.0 1 1.0 Fine Arts 10 55.6 2 11.1 2 11.1 0 0.0 4 22.2 18 2.2 Music 2 100.0 0 0.0 0 0.0 0 0.0 0 0.0 2 1.0 Speech Communication 1 20.0 0 0.0 3 60.0 1 20.0 0 0.0 5 2.8 Theatre Studies 0 0.0 1 25.0 1 25.0 0 0.0 2 50.0 4 3.8 Total 17 45.9 4 10.8 7 18.9 1 2.7 8 21.6 37 2.4 School of Business Business Administration 30 35.7 19 22.6 15 17.9 7 8.3 13 15.5 84 2.5 Economics 0 0.0 1 100.0 0 0.0 0 0.0 0 0.0 1 2.0 Total 30 35.3 20 23.5 15 17.6 7 8.2 13 15.3 85 2.4 College of Education and Human Services Allied Health 1 50.0 0 0.0 1 50.0 0 0.0 0 0.0 2 2.0 Health Education 0 0.0 1 100.0 0 0.0 0 0.0 0 0.0 1 2.0 Human Ecology 26 74.3 3 8.6 2 5.7 1 2.9 3 8.6 35 1.6 Physical Education 15 100.0 0 0.0 0 0.0 0 0.0 0 0.0 15 1.0 Recreation Profession 2 100.0 0 0.0 0 0.0 0 0.0 0 0.0 2 1.0 Technology Education 0 0.0 0 0.0 0 0.0 1 100.0 0 0.0 1 4.0 Total 44 78.6 4 7.1 3 5.4 2 3.6 3 5.4 56 1.5 College of Humanities and Social Science Anthropology 0 0.0 0 0.0 0 0.0 0 0.0 1 100.0 1 5.0 English 10 45.5 1 4.5 4 18.2 3 13.6 4 18.2 22 2.5 French 1 33.3 0 0.0 0 0.0 0 0.0 2 66.7 3 3.7 General Humanities 1 33.3 1 33.3 1 33.3 0 0.0 0 0.0 3 2.0 History 3 33.3 0 0.0 2 22.2 2 22.2 2 22.2 9 3.0 Italian 1 50.0 0 0.0 0 0.0 0 0.0 1 50.0 2 3.0 Justice Studies 2 22.2 3 33.3 2 22.2 0 0.0 2 22.2 9 2.7 Philosophy 0 0.0 0 0.0 0 0.0 0 0.0 1 100.0 1 5.0 Political Science 1 9.1 0 0.0 4 36.4 1 9.1 5 45.5 11 3.8 Psychology 8 20.5 7 17.9 8 20.5 3 7.7 13 33.3 39 3.2 Religious Studies 0 0.0 0 0.0 0 0.0 0 0.0 1 100.0 1 5.0 Sociology 1 6.7 1 6.7 6 40.0 1 6.7 6 40.0 15 3.7 Spanish 0 0.0 1 25.0 1 25.0 1 25.0 1 25.0 4 3.5 Women's Studies 0 0.0 0 0.0 0 0.0 0 0.0 1 100.0 1 5.0 Total 28 23.1 14 11.6 28 23.1 11 9.1 40 33.1 121 3.2
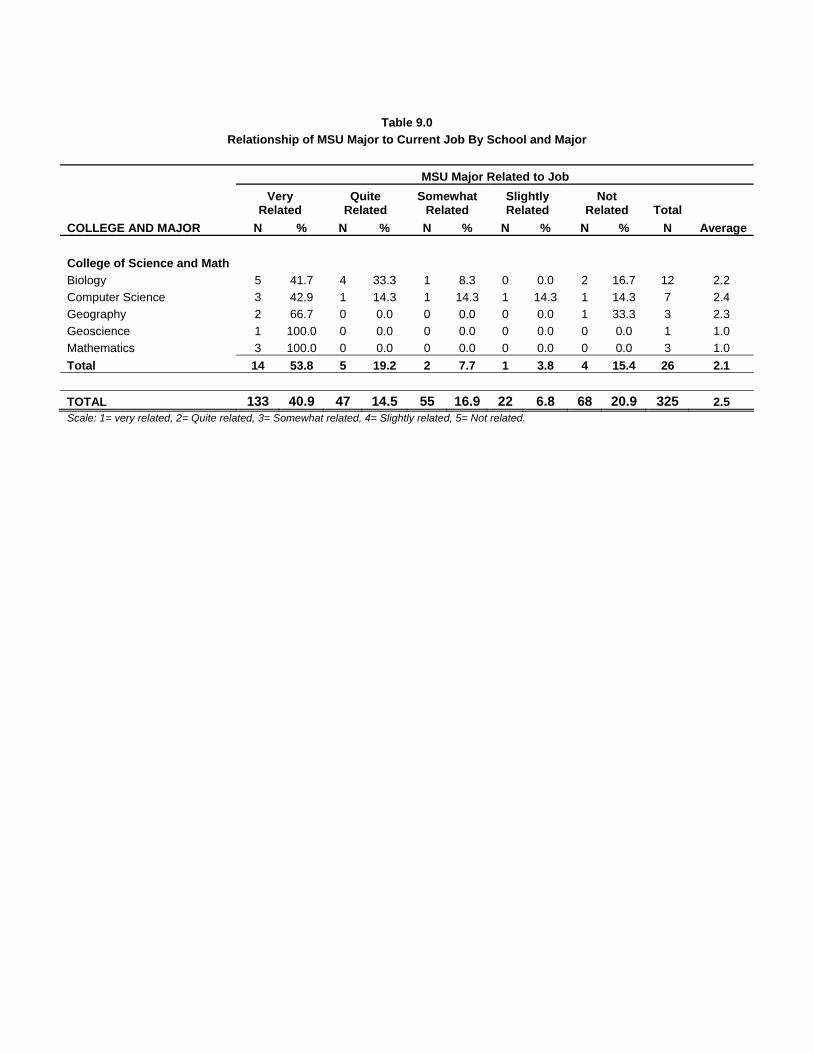
Table 9.0
Relationship of MSU Major to Current Job By School and Major MSU Major Related to Job
Very
Related Quite
Related Somewhat
Related Slightly Related
Not Related Total
COLLEGE AND MAJOR N % N % N % N % N % N Average College of Science and Math Biology 5 41.7 4 33.3 1 8.3 0 0.0 2 16.7 12 2.2 Computer Science 3 42.9 1 14.3 1 14.3 1 14.3 1 14.3 7 2.4 Geography 2 66.7 0 0.0 0 0.0 0 0.0 1 33.3 3 2.3 Geoscience 1 100.0 0 0.0 0 0.0 0 0.0 0 0.0 1 1.0 Mathematics 3 100.0 0 0.0 0 0.0 0 0.0 0 0.0 3 1.0 Total 14 53.8 5 19.2 2 7.7 1 3.8 4 15.4 26 2.1 TOTAL 133 40.9 47 14.5 55 16.9 22 6.8 68 20.9 325 2.5 Scale: 1= very related, 2= Quite related, 3= Somewhat related, 4= Slightly related, 5= Not related.

Table 10.0
Reasons for Job Unrelated to the major Reasons N % Developed other career interests 26 21.1 No suitable position in my field/discipline 33 26.8 Better job opportunities than in my field 30 24.4 Better salary in other field 9 7.3 My job does not need to be related 11 8.9 other 14 11.4
working on MA 3 2.4 related to minor 1 0.8
less/flexible hours 2 1.6 unsure of next step with English degree 1 0.8
difficult to find employment in field 2 1.6 did not receive enough development at MSU 1 0.8
employed prior to MSU 2 1.6 wanted well rounded humanities education 1 0.8
went into family business 1 0.8 TOTAL 123 100.0
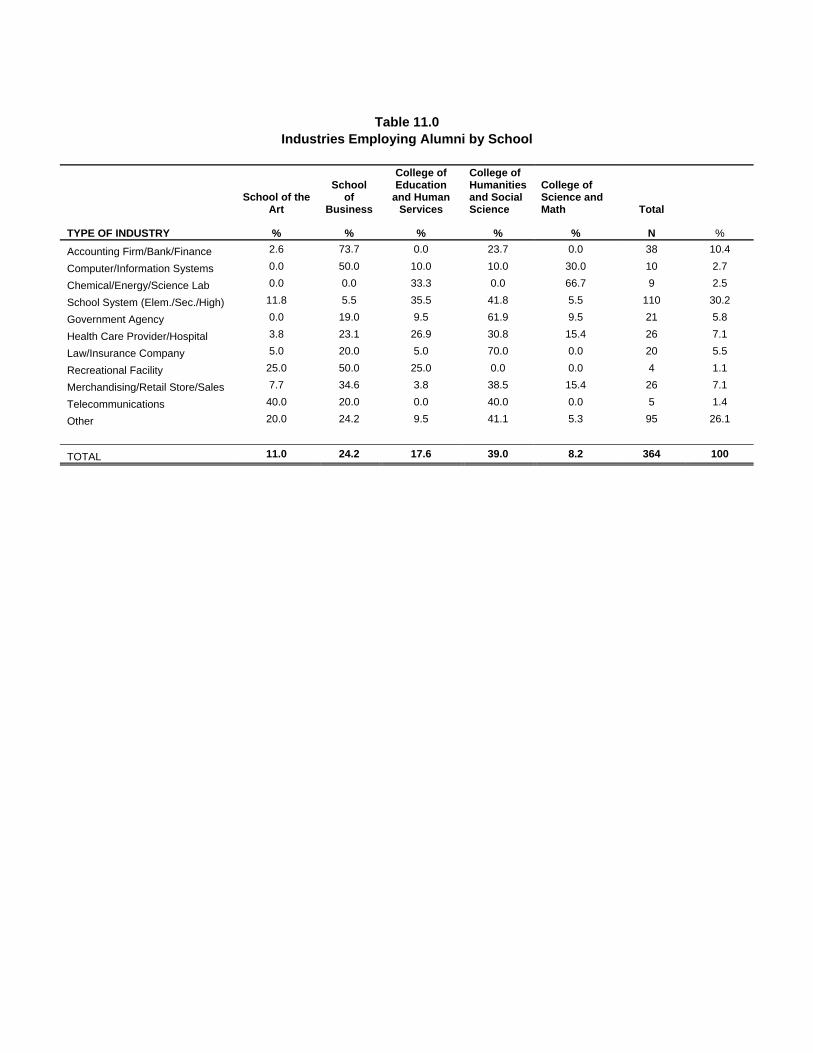
Table 11.0
Industries Employing Alumni by School
School of the
Art
School of
Business
College of Education
and Human Services
College of Humanities and Social Science
College of Science and Math Total
TYPE OF INDUSTRY % % % % % N %
Accounting Firm/Bank/Finance 2.6 73.7 0.0 23.7 0.0 38 10.4
Computer/Information Systems 0.0 50.0 10.0 10.0 30.0 10 2.7
Chemical/Energy/Science Lab 0.0 0.0 33.3 0.0 66.7 9 2.5
School System (Elem./Sec./High) 11.8 5.5 35.5 41.8 5.5 110 30.2
Government Agency 0.0 19.0 9.5 61.9 9.5 21 5.8
Health Care Provider/Hospital 3.8 23.1 26.9 30.8 15.4 26 7.1
Law/Insurance Company 5.0 20.0 5.0 70.0 0.0 20 5.5
Recreational Facility 25.0 50.0 25.0 0.0 0.0 4 1.1
Merchandising/Retail Store/Sales 7.7 34.6 3.8 38.5 15.4 26 7.1
Telecommunications 40.0 20.0 0.0 40.0 0.0 5 1.4
Other 20.0 24.2 9.5 41.1 5.3 95 26.1
TOTAL 11.0 24.2 17.6 39.0 8.2 364 100
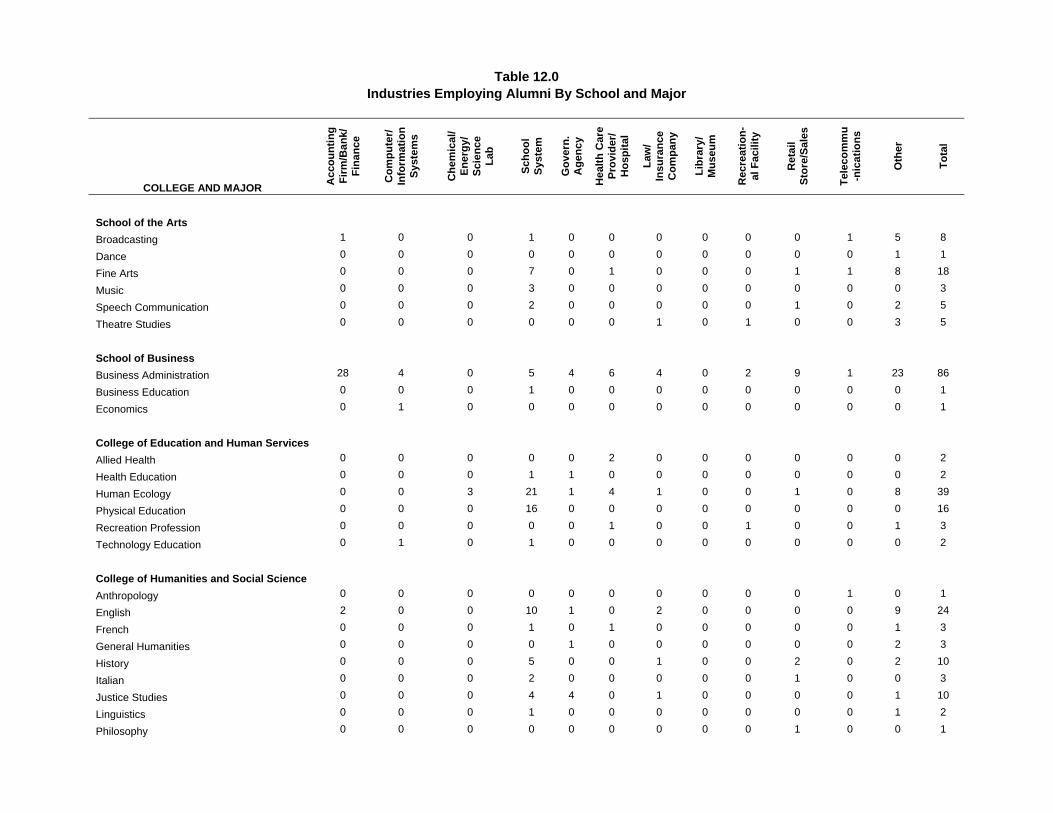
Table 12.0 Industries Employing Alumni By School and Major
COLLEGE AND MAJOR Acc
ount
ing
Firm
/Ban
k/Fi
nanc
e
Com
pute
r/ In
form
atio
n Sy
stem
s
Che
mic
al/
Ener
gy/
Scie
nce
Lab
Scho
ol
Syst
em
Gov
ern.
A
genc
y
Hea
lth C
are
Prov
ider
/ H
ospi
tal
Law
/ In
sura
nce
Com
pany
Libr
ary/
M
useu
m
Rec
reat
ion-
al F
acili
ty
Ret
ail
Stor
e/Sa
les
Tele
com
mu
-nic
atio
ns
Oth
er
Tota
l
School of the Arts Broadcasting 1 0 0 1 0 0 0 0 0 0 1 5 8
Dance 0 0 0 0 0 0 0 0 0 0 0 1 1
Fine Arts 0 0 0 7 0 1 0 0 0 1 1 8 18
Music 0 0 0 3 0 0 0 0 0 0 0 0 3
Speech Communication 0 0 0 2 0 0 0 0 0 1 0 2 5
Theatre Studies 0 0 0 0 0 0 1 0 1 0 0 3 5
School of Business
Business Administration 28 4 0 5 4 6 4 0 2 9 1 23 86
Business Education 0 0 0 1 0 0 0 0 0 0 0 0 1
Economics 0 1 0 0 0 0 0 0 0 0 0 0 1
College of Education and Human Services
Allied Health 0 0 0 0 0 2 0 0 0 0 0 0 2
Health Education 0 0 0 1 1 0 0 0 0 0 0 0 2
Human Ecology 0 0 3 21 1 4 1 0 0 1 0 8 39
Physical Education 0 0 0 16 0 0 0 0 0 0 0 0 16
Recreation Profession 0 0 0 0 0 1 0 0 1 0 0 1 3
Technology Education 0 1 0 1 0 0 0 0 0 0 0 0 2
College of Humanities and Social Science
Anthropology 0 0 0 0 0 0 0 0 0 0 1 0 1
English 2 0 0 10 1 0 2 0 0 0 0 9 24
French 0 0 0 1 0 1 0 0 0 0 0 1 3
General Humanities 0 0 0 0 1 0 0 0 0 0 0 2 3
History 0 0 0 5 0 0 1 0 0 2 0 2 10
Italian 0 0 0 2 0 0 0 0 0 1 0 0 3
Justice Studies 0 0 0 4 4 0 1 0 0 0 0 1 10
Linguistics 0 0 0 1 0 0 0 0 0 0 0 1 2
Philosophy 0 0 0 0 0 0 0 0 0 1 0 0 1

Table 12.0 Industries Employing Alumni By School and Major
COLLEGE AND MAJOR Acc
ount
ing
Firm
/Ban
k/Fi
nanc
e
Com
pute
r/ In
form
atio
n Sy
stem
s
Che
mic
al/
Ener
gy/
Scie
nce
Lab
Scho
ol
Syst
em
Gov
ern.
A
genc
y
Hea
lth C
are
Prov
ider
/ H
ospi
tal
Law
/ In
sura
nce
Com
pany
Libr
ary/
M
useu
m
Rec
reat
ion-
al F
acili
ty
Ret
ail
Stor
e/Sa
les
Tele
com
mu
-nic
atio
ns
Oth
er
Tota
l
Political Science 1 0 0 1 2 0 2 0 0 1 1 5 13
Psychology 3 1 0 16 3 7 5 0 0 4 0 12 51
Religious Studies 0 0 0 0 0 0 1 0 0 0 0 0 1
Sociology 2 0 0 4 1 0 2 0 0 1 0 5 15
Spanish 1 0 0 1 1 0 0 0 0 0 0 1 4
Women's Studies 0 0 0 1 0 0 0 0 0 0 0 0 1
College of Science and Math
Biology 0 0 6 2 0 2 0 0 0 1 0 2 13
Computer Science 0 3 0 0 0 1 0 0 0 2 0 1 7
Geography 0 0 0 0 1 0 0 0 0 1 0 1 3
Geoscience 0 0 0 0 1 0 0 0 0 0 0 0 1
Mathematics 0 0 0 3 0 0 0 0 0 0 0 1 4
Molecular Biology 0 0 0 1 0 1 0 0 0 0 0 0 2
INDUSTRY TOTAL 38 10 9 110 21 26 20 0 4 26 5 95 364

Table 13.0
Occupation of Graduates By School and Major
UNDERGRADUATE Occupation Employed
DEGREE AND MAJOR Full-time
Part-time
School of the Art Broadcasting Substitute Teacher 1 Production Assistant 1 Entertainer 1 Sales representative 1 Video editor 1 Data quality control administrator 1 Reporter 1 Mortgage consultant 1 Dance Dance Teacher 1 Fine Arts Substitute Teacher 1 1 Customer Service Representative 1 Elementary School Teacher 1 1 Art Teacher 3 Self-employed/Business Owner 2 Project Manager 2 Graphic designer 3 Makeup artist 1 Staff coordinator 1 Music Middle School Teacher 1 Music Teacher 2 Speech Communication Substitute Teacher 1 Special Education Teacher 1 Associate Editor 1 Assistant manager 1 Waitress/Waiter 1 Security detective 1 Theatre Studies Meeting Planner 1 Production Assistant 1 Dance Teacher 1 Bartender 1 Legal secretary 1 Office assistant 1 School of Business Business Administration Stock Option Specialist 1 Administrative Assistant 1 Substitute Teacher 2
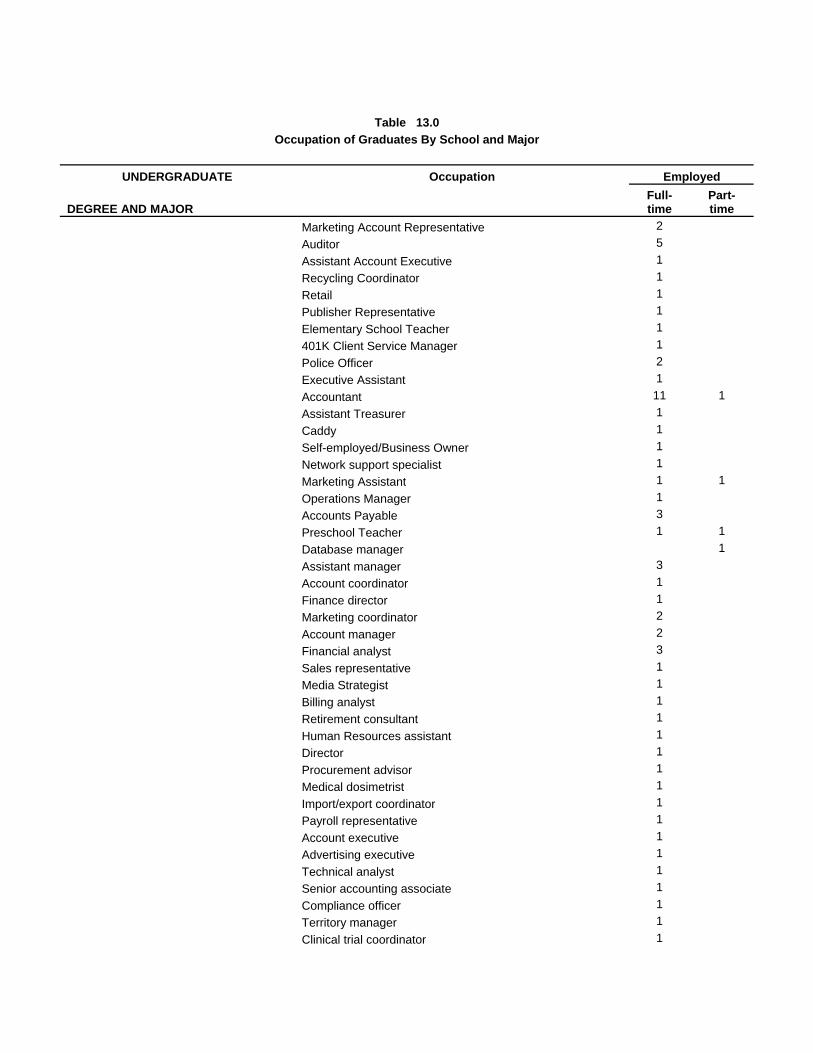
Table 13.0
Occupation of Graduates By School and Major
UNDERGRADUATE Occupation Employed
DEGREE AND MAJOR Full-time
Part-time
Marketing Account Representative 2 Auditor 5 Assistant Account Executive 1 Recycling Coordinator 1 Retail 1 Publisher Representative 1 Elementary School Teacher 1 401K Client Service Manager 1 Police Officer 2 Executive Assistant 1 Accountant 11 1 Assistant Treasurer 1 Caddy 1 Self-employed/Business Owner 1 Network support specialist 1 Marketing Assistant 1 1 Operations Manager 1 Accounts Payable 3 Preschool Teacher 1 1 Database manager 1 Assistant manager 3 Account coordinator 1 Finance director 1 Marketing coordinator 2 Account manager 2 Financial analyst 3 Sales representative 1 Media Strategist 1 Billing analyst 1 Retirement consultant 1 Human Resources assistant 1 Director 1 Procurement advisor 1 Medical dosimetrist 1 Import/export coordinator 1 Payroll representative 1 Account executive 1 Advertising executive 1 Technical analyst 1 Senior accounting associate 1 Compliance officer 1 Territory manager 1 Clinical trial coordinator 1

Table 13.0
Occupation of Graduates By School and Major
UNDERGRADUATE Occupation Employed
DEGREE AND MAJOR Full-time
Part-time
Recruiter 1 Warehouse attendant 1 Client relations manager 1 Dispatcher 1 Assistant administrator 1 Software support specialist 1 Business Education Substitute Teacher 1 Economics Financial analyst 1 College of Education and Human Services Allied Health Registered Nurse 1 Training coordinator 1 Health Education Registered Environmental Health Specialist 1 Dance Teacher 1 Human Ecology Social Service Specialist 1 Program Coordinator 1 Registered Dietician 1 Corporate Coordinator 1 Elementary School Teacher 15 Middle School Teacher 2 Executive Assistant 1 Dietician 1 2 Self-employed/Business Owner 1 Hairstylist 1 Research Technician 1 Educational Director 1 Preschool Teacher 1 Social Worker 1 Microbiologist 1 Human Resources assistant 1 Flavor technologist 1 Invoice coordinator 1 Foreign Language Teacher 1 Nutrition consultant 1 Physical Education Substitute Teacher 1 Middle School Teacher 2 Middle School Phys Ed Teacher 4 High School Phys Ed Teacher 5
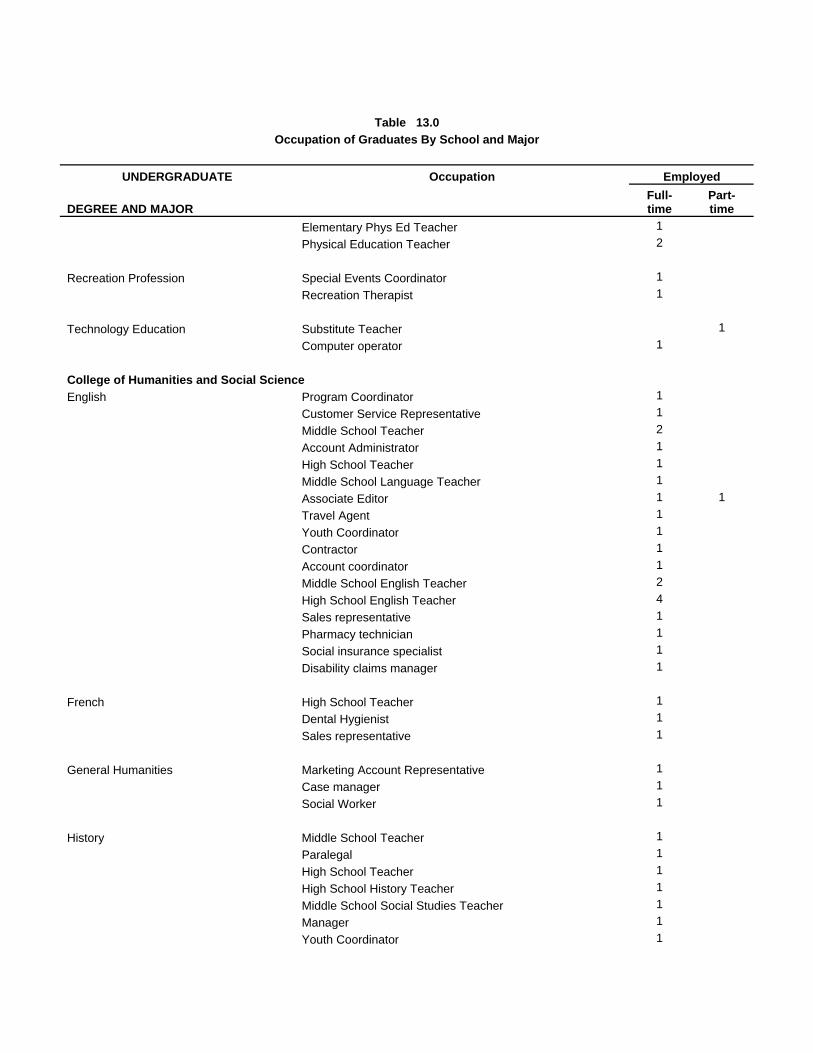
Table 13.0
Occupation of Graduates By School and Major
UNDERGRADUATE Occupation Employed
DEGREE AND MAJOR Full-time
Part-time
Elementary Phys Ed Teacher 1 Physical Education Teacher 2 Recreation Profession Special Events Coordinator 1 Recreation Therapist 1 Technology Education Substitute Teacher 1 Computer operator 1 College of Humanities and Social Science English Program Coordinator 1 Customer Service Representative 1 Middle School Teacher 2 Account Administrator 1 High School Teacher 1 Middle School Language Teacher 1 Associate Editor 1 1 Travel Agent 1 Youth Coordinator 1 Contractor 1 Account coordinator 1 Middle School English Teacher 2 High School English Teacher 4 Sales representative 1 Pharmacy technician 1 Social insurance specialist 1 Disability claims manager 1 French High School Teacher 1 Dental Hygienist 1 Sales representative 1 General Humanities Marketing Account Representative 1 Case manager 1 Social Worker 1 History Middle School Teacher 1 Paralegal 1 High School Teacher 1 High School History Teacher 1 Middle School Social Studies Teacher 1 Manager 1 Youth Coordinator 1
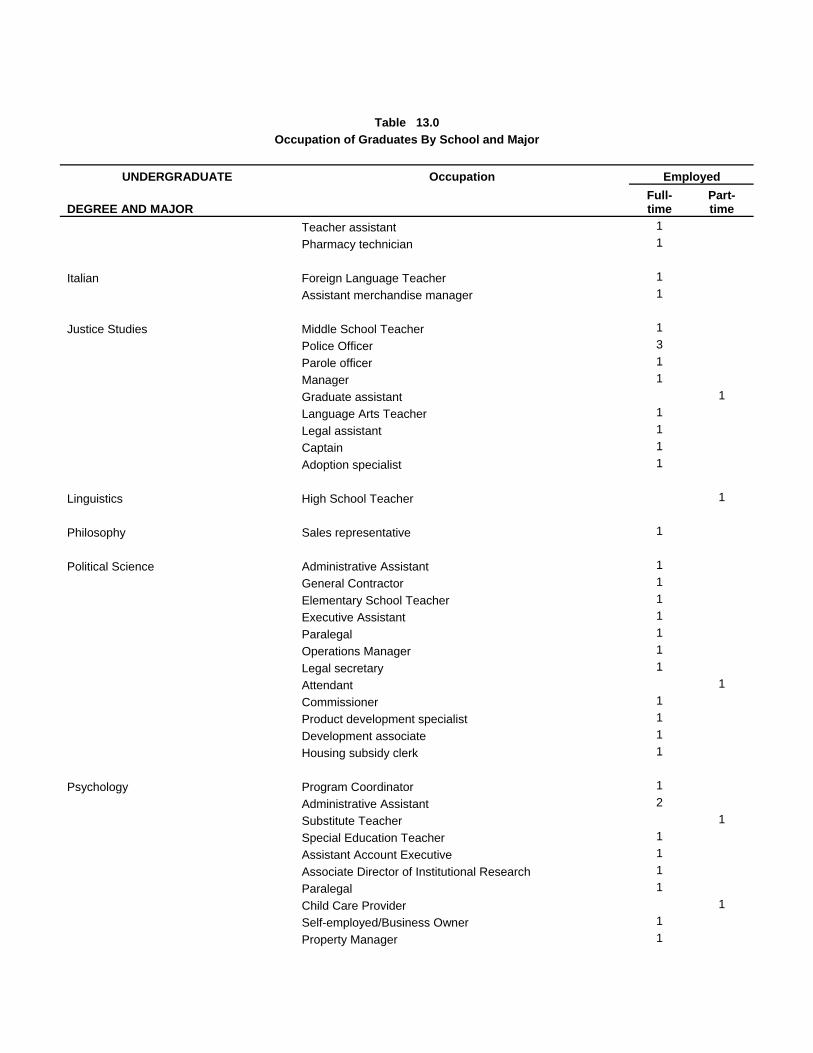
Table 13.0
Occupation of Graduates By School and Major
UNDERGRADUATE Occupation Employed
DEGREE AND MAJOR Full-time
Part-time
Teacher assistant 1 Pharmacy technician 1 Italian Foreign Language Teacher 1 Assistant merchandise manager 1 Justice Studies Middle School Teacher 1 Police Officer 3 Parole officer 1 Manager 1 Graduate assistant 1 Language Arts Teacher 1 Legal assistant 1 Captain 1 Adoption specialist 1 Linguistics High School Teacher 1 Philosophy Sales representative 1 Political Science Administrative Assistant 1 General Contractor 1 Elementary School Teacher 1 Executive Assistant 1 Paralegal 1 Operations Manager 1 Legal secretary 1 Attendant 1 Commissioner 1 Product development specialist 1 Development associate 1 Housing subsidy clerk 1 Psychology Program Coordinator 1 Administrative Assistant 2 Substitute Teacher 1 Special Education Teacher 1 Assistant Account Executive 1 Associate Director of Institutional Research 1 Paralegal 1 Child Care Provider 1 Self-employed/Business Owner 1 Property Manager 1
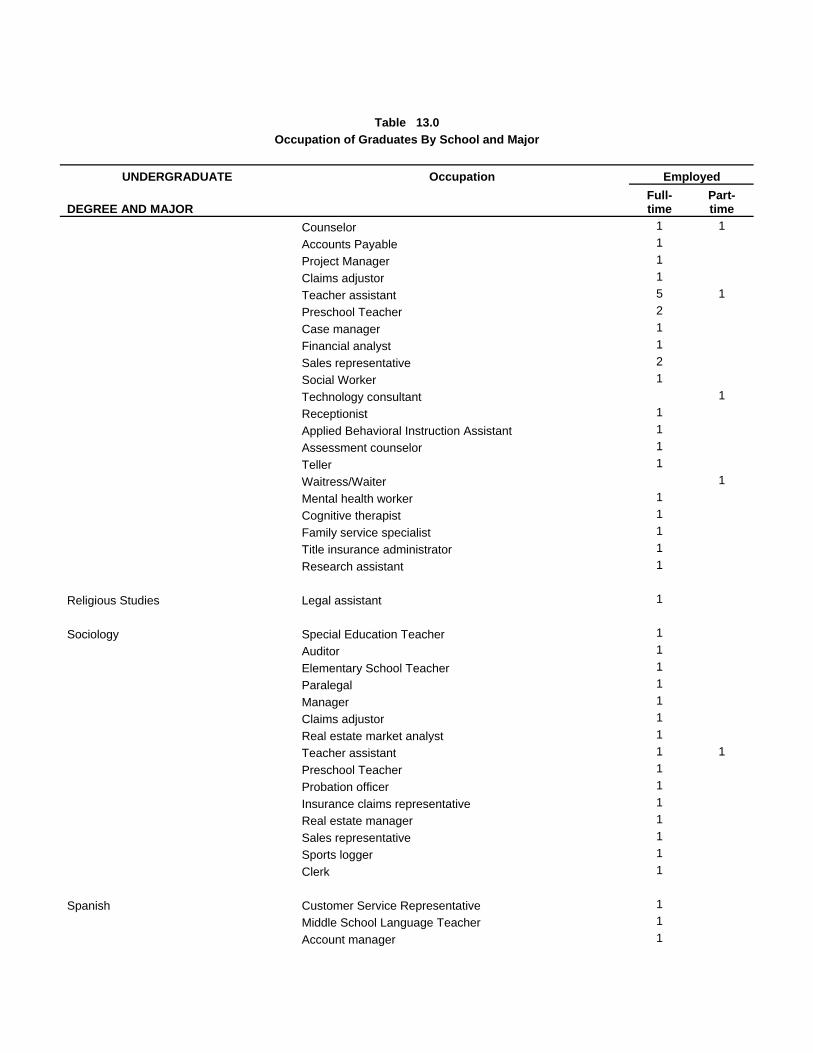
Table 13.0
Occupation of Graduates By School and Major
UNDERGRADUATE Occupation Employed
DEGREE AND MAJOR Full-time
Part-time
Counselor 1 1 Accounts Payable 1 Project Manager 1 Claims adjustor 1 Teacher assistant 5 1 Preschool Teacher 2 Case manager 1 Financial analyst 1 Sales representative 2 Social Worker 1 Technology consultant 1 Receptionist 1 Applied Behavioral Instruction Assistant 1 Assessment counselor 1 Teller 1 Waitress/Waiter 1 Mental health worker 1 Cognitive therapist 1 Family service specialist 1 Title insurance administrator 1 Research assistant 1 Religious Studies Legal assistant 1 Sociology Special Education Teacher 1 Auditor 1 Elementary School Teacher 1 Paralegal 1 Manager 1 Claims adjustor 1 Real estate market analyst 1 Teacher assistant 1 1 Preschool Teacher 1 Probation officer 1 Insurance claims representative 1 Real estate manager 1 Sales representative 1 Sports logger 1 Clerk 1 Spanish Customer Service Representative 1 Middle School Language Teacher 1 Account manager 1
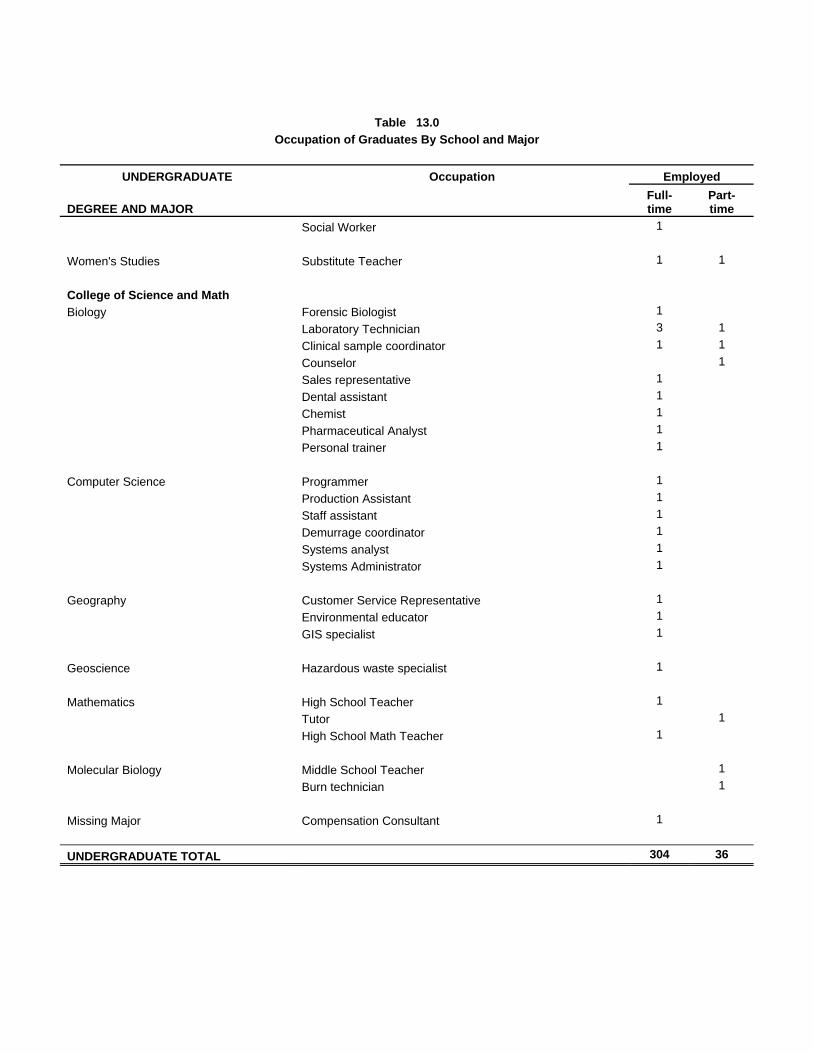
Table 13.0
Occupation of Graduates By School and Major
UNDERGRADUATE Occupation Employed
DEGREE AND MAJOR Full-time
Part-time
Social Worker 1 Women's Studies Substitute Teacher 1 1 College of Science and Math Biology Forensic Biologist 1 Laboratory Technician 3 1 Clinical sample coordinator 1 1 Counselor 1 Sales representative 1 Dental assistant 1 Chemist 1 Pharmaceutical Analyst 1 Personal trainer 1 Computer Science Programmer 1 Production Assistant 1 Staff assistant 1 Demurrage coordinator 1 Systems analyst 1 Systems Administrator 1 Geography Customer Service Representative 1 Environmental educator 1 GIS specialist 1 Geoscience Hazardous waste specialist 1 Mathematics High School Teacher 1 Tutor 1 High School Math Teacher 1 Molecular Biology Middle School Teacher 1 Burn technician 1 Missing Major Compensation Consultant 1
UNDERGRADUATE TOTAL 304 36

Table 14.0
Employers of Graduates By School and School and Major
UNDERGRADUATE Employer/Organization Status DEGREE AND MAJOR Full-time Part-time School of the Arts Broadcasting Bound Brook School District 1 Confield Scientific 1 KingWorld 1 National City Mortgage 1 Service Electric Cable TV 1 Univision Communications 1 Dance Turning Pointe Dance Center 1 Fine Arts Atlantis Prep School 1 Branchburg Board of Education 1 Cedar Grove Police 1 East Orange Board of Education 1 1 Elizabeth High School 1 Eurorscg Life 1 Home Instead Senior Care 1 Hopatcong Board of Education 1 Laird & Partners 1 Lucid Vagabond, Inc. 1 Paramus Catholic High 1 Ridgefield Board of Education 1 Saks Inc. 1 T-Fal Corp. 1 The Chambers Group 1 Tritonic, LLC 1 Music Bayonne Board of Education 1 Learning Dynamics Academy 1 Mount Olive Township 1 Speech Communication Enterprise Rent a Car 1 Leaders Magazine 1 Macy's East 1 Olive Garden 1 Roosevelt #10 1 Scotch Plains-Fanwood Board of Education 1 Theatre Studies Crossroads 1 Meeting Alliance 1 New York Sports Club 1 Sesame Workshop 1 Stagestruck Performing Arts Center 1
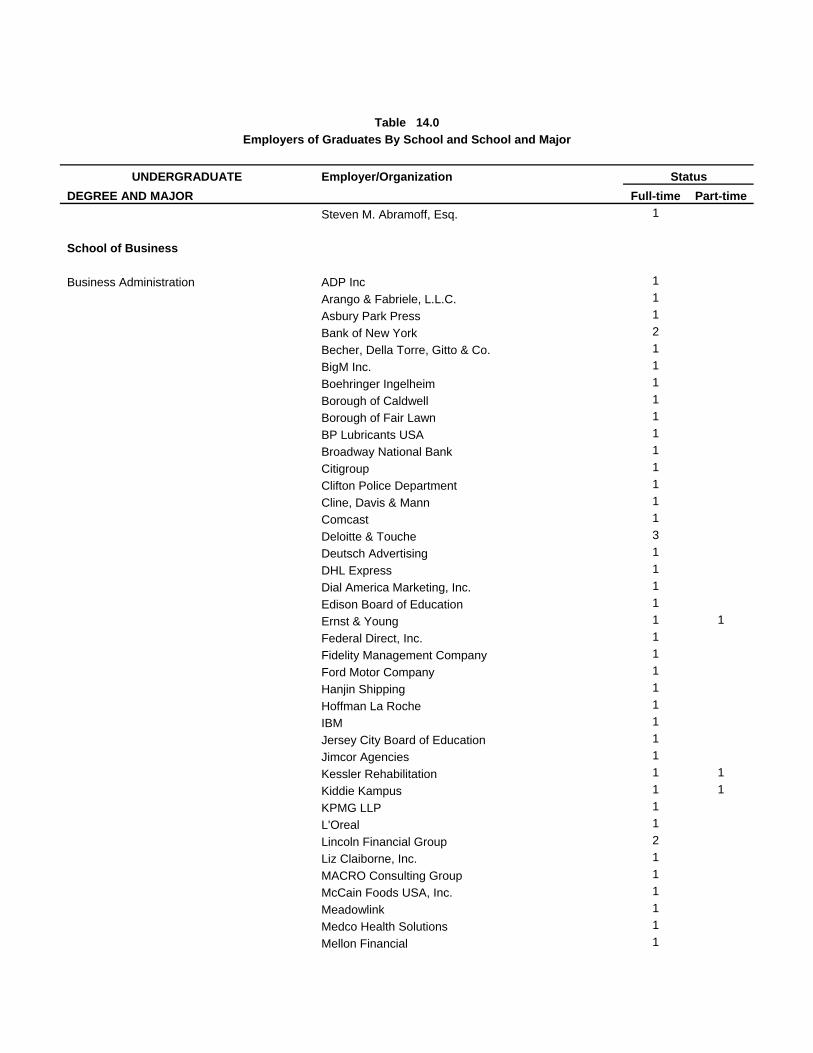
Table 14.0
Employers of Graduates By School and School and Major
UNDERGRADUATE Employer/Organization Status DEGREE AND MAJOR Full-time Part-time Steven M. Abramoff, Esq. 1 School of Business Business Administration ADP Inc 1 Arango & Fabriele, L.L.C. 1 Asbury Park Press 1 Bank of New York 2 Becher, Della Torre, Gitto & Co. 1 BigM Inc. 1 Boehringer Ingelheim 1 Borough of Caldwell 1 Borough of Fair Lawn 1 BP Lubricants USA 1 Broadway National Bank 1 Citigroup 1 Clifton Police Department 1 Cline, Davis & Mann 1 Comcast 1 Deloitte & Touche 3 Deutsch Advertising 1 DHL Express 1 Dial America Marketing, Inc. 1 Edison Board of Education 1 Ernst & Young 1 1 Federal Direct, Inc. 1 Fidelity Management Company 1 Ford Motor Company 1 Hanjin Shipping 1 Hoffman La Roche 1 IBM 1 Jersey City Board of Education 1 Jimcor Agencies 1 Kessler Rehabilitation 1 1 Kiddie Kampus 1 1 KPMG LLP 1 L'Oreal 1 Lincoln Financial Group 2 Liz Claiborne, Inc. 1 MACRO Consulting Group 1 McCain Foods USA, Inc. 1 Meadowlink 1 Medco Health Solutions 1 Mellon Financial 1

Table 14.0
Employers of Graduates By School and School and Major
UNDERGRADUATE Employer/Organization Status DEGREE AND MAJOR Full-time Part-time Mercer 1 Merrill Lynch 2 Montclair Golg Club 1 Morris Center YMCA 1 Morristown -Beard School 1 North East Online 1 North Fork Bank 1 Panasonic 1 Passaic Beth Israel Medical Center 1 Paterson Public School 1 Pearson Education 2 PricewaterhouseCoopers 1 Prudential 2 Rothstein, Kass & Co. 1 Saint Barnabas Management Services 1 Schering Plough Pharmaceuticals 1 Sobel & Co. 1 Solid Foundation Skate Park 1 Sportscare Institute 1 Target Corporation 1 The ARGroup of Search Companies 1 The Digital Edge 1 Town of Kearny 1 Toys R Us 1 Tuscan Dairy 1 UBS Financial Services 1 UCA Computer Systems 1 UFCW Local 1262 1 Urban Comm-Data, Inc. 1 US Food Service 1 Valley Home Care 1 Velocity Express 1 Vital Signs, Inc. 1 Wayne Auto Sales 1 Web MD Corporation 1 Business Education Fairview Board of Education 1 Economics IBM 1 College of Education and Human Services Allied Health Newark Beth Israel Medical Center 1 Valley Hospital 1
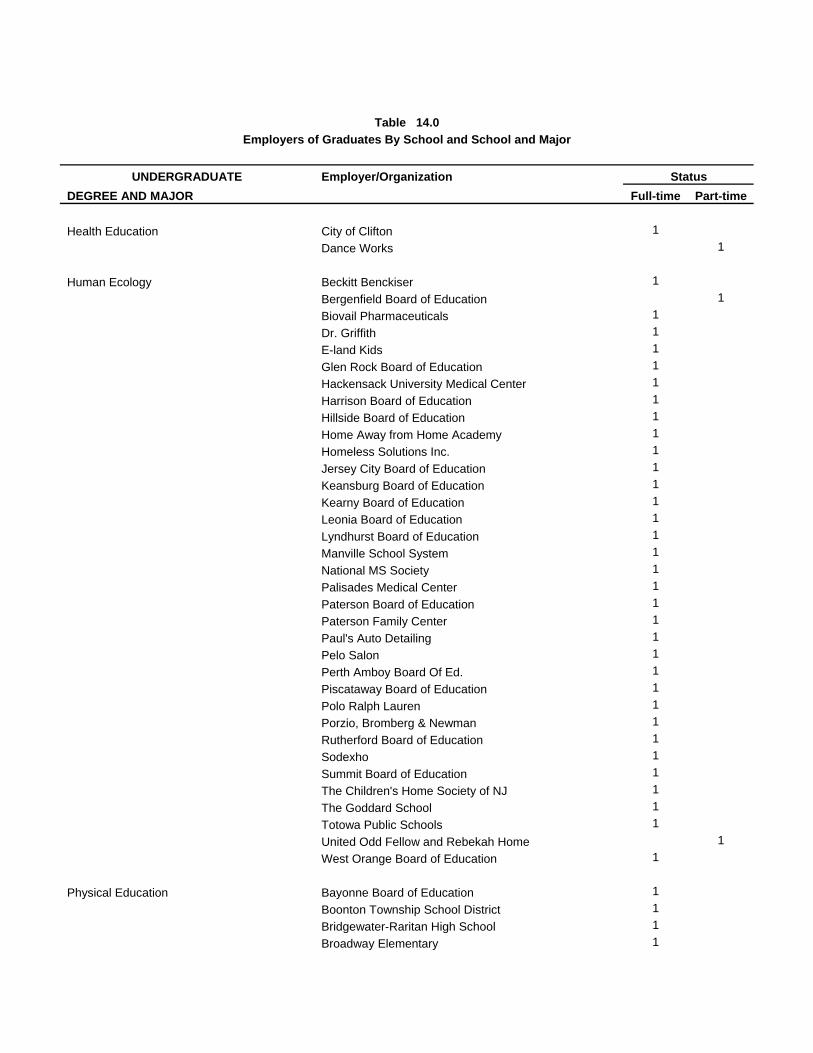
Table 14.0
Employers of Graduates By School and School and Major
UNDERGRADUATE Employer/Organization Status DEGREE AND MAJOR Full-time Part-time Health Education City of Clifton 1 Dance Works 1 Human Ecology Beckitt Benckiser 1 Bergenfield Board of Education 1 Biovail Pharmaceuticals 1 Dr. Griffith 1 E-land Kids 1 Glen Rock Board of Education 1 Hackensack University Medical Center 1 Harrison Board of Education 1 Hillside Board of Education 1 Home Away from Home Academy 1 Homeless Solutions Inc. 1 Jersey City Board of Education 1 Keansburg Board of Education 1 Kearny Board of Education 1 Leonia Board of Education 1 Lyndhurst Board of Education 1 Manville School System 1 National MS Society 1 Palisades Medical Center 1 Paterson Board of Education 1 Paterson Family Center 1 Paul's Auto Detailing 1 Pelo Salon 1 Perth Amboy Board Of Ed. 1 Piscataway Board of Education 1 Polo Ralph Lauren 1 Porzio, Bromberg & Newman 1 Rutherford Board of Education 1 Sodexho 1 Summit Board of Education 1 The Children's Home Society of NJ 1 The Goddard School 1 Totowa Public Schools 1 United Odd Fellow and Rebekah Home 1 West Orange Board of Education 1 Physical Education Bayonne Board of Education 1 Boonton Township School District 1 Bridgewater-Raritan High School 1 Broadway Elementary 1

Table 14.0
Employers of Graduates By School and School and Major
UNDERGRADUATE Employer/Organization Status DEGREE AND MAJOR Full-time Part-time Cedar Grove Board of Education 1 Clifton Board of Education 1 Hoboken Board of Education 1 Neptune Board of Education 1 Norwood Public School 1 Nutley Board of Education 1 Paterson Public Schools 1 Pompton Lakes Board of Education 1 South Brunswick Board of Education 1 Souther Regional High School 1 Springfield Board of Education 1 West Orange Board of Education 1 Recreation Profession Daughters of Israel Geriatric Center 1 VNU Inc. 1 Warwick Conference Center 1 Technology Education Newark Public Schools 1 Valley National Bank 1 College of Humanities and Social Science Anthropology ISG 1 English AAA Midatlantic 1 Affiliated FM 1 Bank of New York 1 Bernards Township Board of Education 1 Essex County Vocational Technical Schools 1 Franklin Township Board of Education 1 Marylawn of the Oranges Academy 1 Middletown Township Schools 1 Montclair State University 1 Nutley Board of Education 2 Paterson Public Schools 1 Prudential 1 Rockaway Board of Education 1 Social Security Administration 1 South Brunswick Board of Education 1 Stuart Sablosky 1 Wahlstrom Group 1 Women's Day Magazine 1
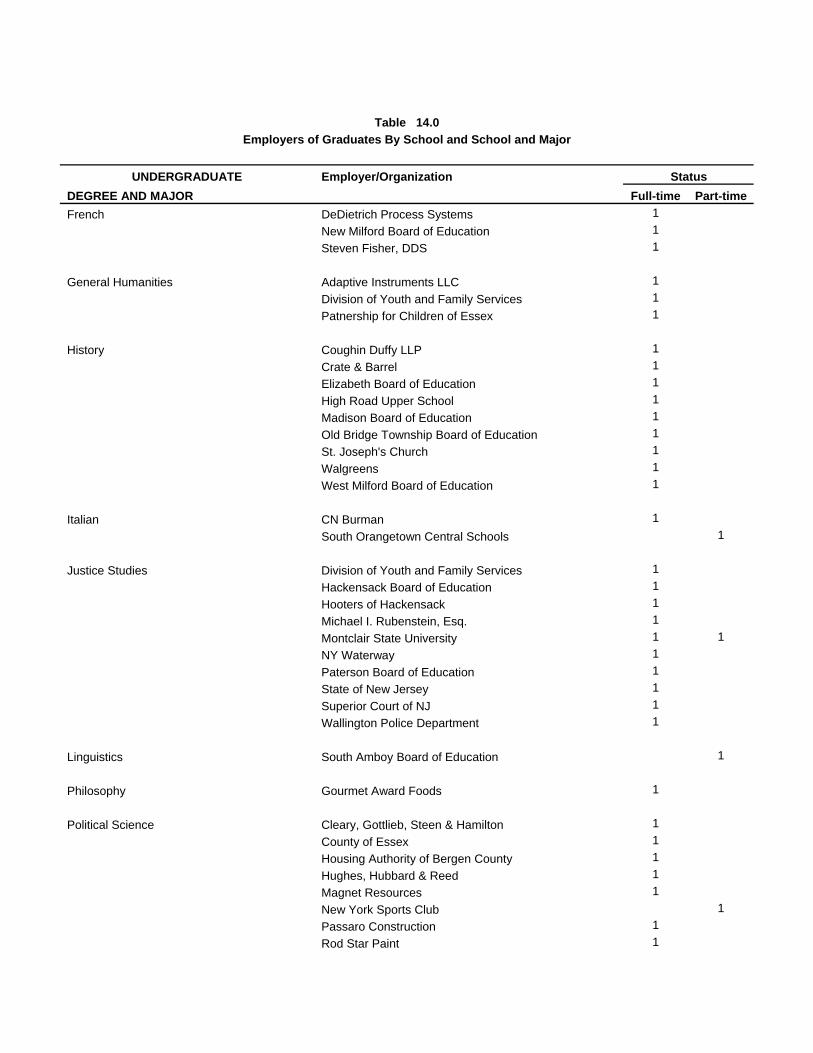
Table 14.0
Employers of Graduates By School and School and Major
UNDERGRADUATE Employer/Organization Status DEGREE AND MAJOR Full-time Part-time French DeDietrich Process Systems 1 New Milford Board of Education 1 Steven Fisher, DDS 1 General Humanities Adaptive Instruments LLC 1 Division of Youth and Family Services 1 Patnership for Children of Essex 1 History Coughin Duffy LLP 1 Crate & Barrel 1 Elizabeth Board of Education 1 High Road Upper School 1 Madison Board of Education 1 Old Bridge Township Board of Education 1 St. Joseph's Church 1 Walgreens 1 West Milford Board of Education 1 Italian CN Burman 1 South Orangetown Central Schools 1 Justice Studies Division of Youth and Family Services 1 Hackensack Board of Education 1 Hooters of Hackensack 1 Michael I. Rubenstein, Esq. 1 Montclair State University 1 1 NY Waterway 1 Paterson Board of Education 1 State of New Jersey 1 Superior Court of NJ 1 Wallington Police Department 1 Linguistics South Amboy Board of Education 1 Philosophy Gourmet Award Foods 1 Political Science Cleary, Gottlieb, Steen & Hamilton 1 County of Essex 1 Housing Authority of Bergen County 1 Hughes, Hubbard & Reed 1 Magnet Resources 1 New York Sports Club 1 Passaro Construction 1 Rod Star Paint 1
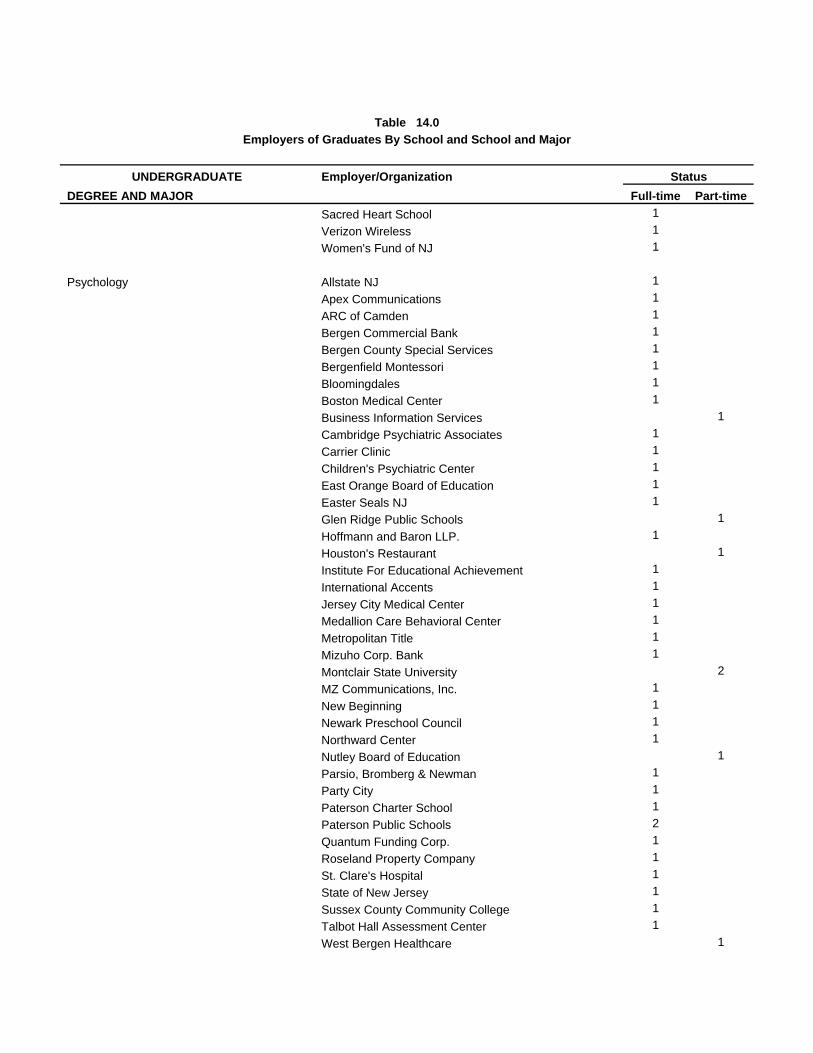
Table 14.0
Employers of Graduates By School and School and Major
UNDERGRADUATE Employer/Organization Status DEGREE AND MAJOR Full-time Part-time Sacred Heart School 1 Verizon Wireless 1 Women's Fund of NJ 1 Psychology Allstate NJ 1 Apex Communications 1 ARC of Camden 1 Bergen Commercial Bank 1 Bergen County Special Services 1 Bergenfield Montessori 1 Bloomingdales 1 Boston Medical Center 1 Business Information Services 1 Cambridge Psychiatric Associates 1 Carrier Clinic 1 Children's Psychiatric Center 1 East Orange Board of Education 1 Easter Seals NJ 1 Glen Ridge Public Schools 1 Hoffmann and Baron LLP. 1 Houston's Restaurant 1 Institute For Educational Achievement 1 International Accents 1 Jersey City Medical Center 1 Medallion Care Behavioral Center 1 Metropolitan Title 1 Mizuho Corp. Bank 1 Montclair State University 2 MZ Communications, Inc. 1 New Beginning 1 Newark Preschool Council 1 Northward Center 1 Nutley Board of Education 1 Parsio, Bromberg & Newman 1 Party City 1 Paterson Charter School 1 Paterson Public Schools 2 Quantum Funding Corp. 1 Roseland Property Company 1 St. Clare's Hospital 1 State of New Jersey 1 Sussex County Community College 1 Talbot Hall Assessment Center 1 West Bergen Healthcare 1
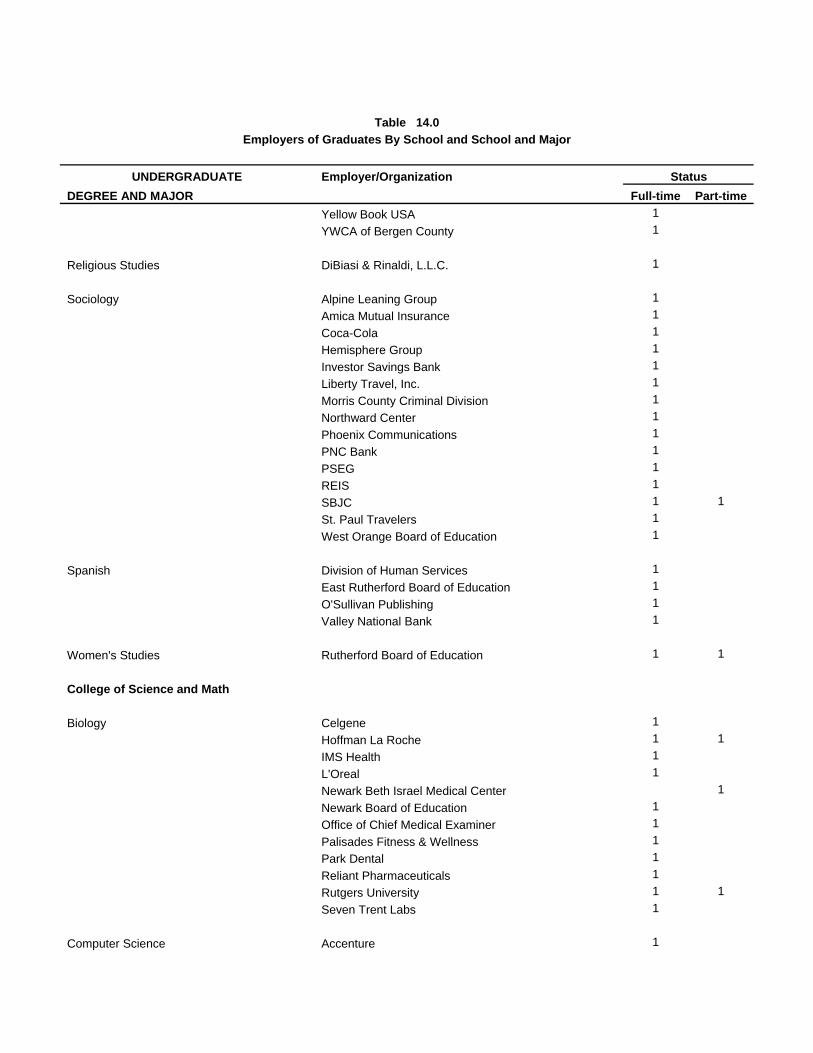
Table 14.0
Employers of Graduates By School and School and Major
UNDERGRADUATE Employer/Organization Status DEGREE AND MAJOR Full-time Part-time Yellow Book USA 1 YWCA of Bergen County 1 Religious Studies DiBiasi & Rinaldi, L.L.C. 1 Sociology Alpine Leaning Group 1 Amica Mutual Insurance 1 Coca-Cola 1 Hemisphere Group 1 Investor Savings Bank 1 Liberty Travel, Inc. 1 Morris County Criminal Division 1 Northward Center 1 Phoenix Communications 1 PNC Bank 1 PSEG 1 REIS 1 SBJC 1 1 St. Paul Travelers 1 West Orange Board of Education 1 Spanish Division of Human Services 1 East Rutherford Board of Education 1 O'Sullivan Publishing 1 Valley National Bank 1 Women's Studies Rutherford Board of Education 1 1 College of Science and Math Biology Celgene 1 Hoffman La Roche 1 1 IMS Health 1 L'Oreal 1 Newark Beth Israel Medical Center 1 Newark Board of Education 1 Office of Chief Medical Examiner 1 Palisades Fitness & Wellness 1 Park Dental 1 Reliant Pharmaceuticals 1 Rutgers University 1 1 Seven Trent Labs 1 Computer Science Accenture 1
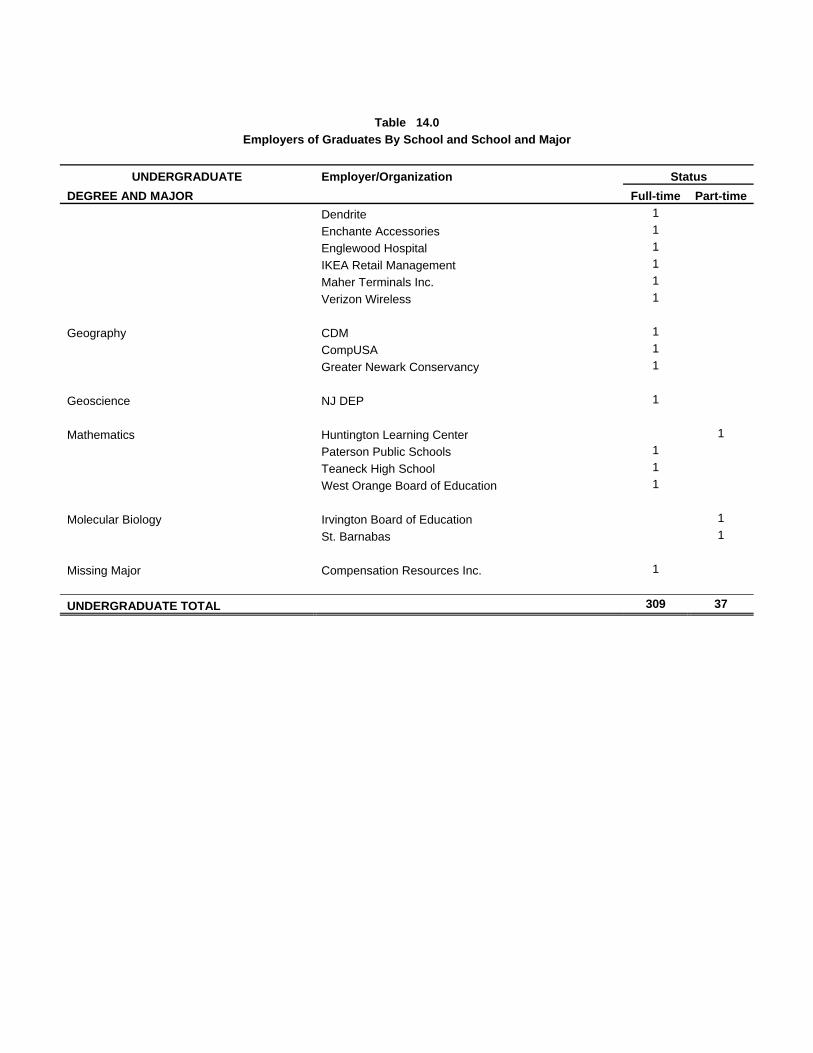
Table 14.0
Employers of Graduates By School and School and Major
UNDERGRADUATE Employer/Organization Status DEGREE AND MAJOR Full-time Part-time Dendrite 1 Enchante Accessories 1 Englewood Hospital 1 IKEA Retail Management 1 Maher Terminals Inc. 1 Verizon Wireless 1 Geography CDM 1 CompUSA 1 Greater Newark Conservancy 1 Geoscience NJ DEP 1 Mathematics Huntington Learning Center 1 Paterson Public Schools 1 Teaneck High School 1 West Orange Board of Education 1 Molecular Biology Irvington Board of Education 1 St. Barnabas 1 Missing Major Compensation Resources Inc. 1
UNDERGRADUATE TOTAL 309 37

Table 15.0
Size of Company that Employed MSU graduates By School and Major Number of Employees
COLLEGE AND MAJOR < than 50 51 - 100 101 - 250 251 - 500 501 - 1,000
> than 1,000 Total
% % % % % % N School of the Arts Broadcasting 14.3 28.6 28.6 14.3 0.0 14.3 7 Dance 100.0 0.0 0.0 0.0 0.0 0.0 1 Fine Arts 33.3 11.1 11.1 11.1 11.1 22.2 18 Music 0.0 0.0 0.0 0.0 100.0 0.0 2 Speech Communication 20.0 40.0 0.0 0.0 0.0 40.0 5 Theatre Studies 50.0 0.0 25.0 0.0 25.0 0.0 4 Total 29.7 16.2 13.5 8.1 13.5 18.9 37 School of Business Business Administration 10.8 14.5 9.6 1.2 7.2 56.6 83 Economics 0.0 0.0 0.0 0.0 0.0 100.0 1 Total 10.7 14.3 9.5 1.2 7.1 57.1 84 College of Education and Human Services Allied Health 0.0 0.0 0.0 0.0 0.0 100.0 2 Health Education 0.0 0.0 0.0 100.0 0.0 0.0 1 Human Ecology 17.1 8.6 37.1 5.7 8.6 22.9 35 Physical Education 0.0 30.8 38.5 15.4 7.7 7.7 13 Recreation Profession 0.0 0.0 0.0 50.0 0.0 50.0 2 Technology Education 0.0 0.0 0.0 0.0 0.0 100.0 1 Total 11.1 13.0 33.3 11.1 7.4 24.1 54 College of Humanities and Social Science Anthropology 100.0 0.0 0.0 0.0 0.0 0.0 1 English 17.4 8.7 8.7 21.7 4.3 39.1 23 French 66.7 0.0 0.0 33.3 0.0 0.0 3 General Humanities 33.3 33.3 0.0 0.0 0.0 33.3 3 History 0.0 33.3 33.3 11.1 11.1 11.1 9 Italian 50.0 0.0 50.0 0.0 0.0 0.0 2 Justice Studies 30.0 0.0 20.0 0.0 20.0 30.0 10 Philosophy 0.0 0.0 0.0 0.0 0.0 100.0 1 Political Science 45.5 9.1 0.0 9.1 0.0 36.4 11 Psychology 28.2 7.7 20.5 10.3 2.6 30.8 39 Religious Studies 100.0 0.0 0.0 0.0 0.0 0.0 1 Sociology 6.7 26.7 6.7 6.7 0.0 53.3 15 Spanish 25.0 25.0 25.0 0.0 0.0 25.0 4 Women's Studies 0.0 0.0 100.0 0.0 0.0 0.0 1 Total 25.2 12.2 15.4 10.6 4.1 32.5 123
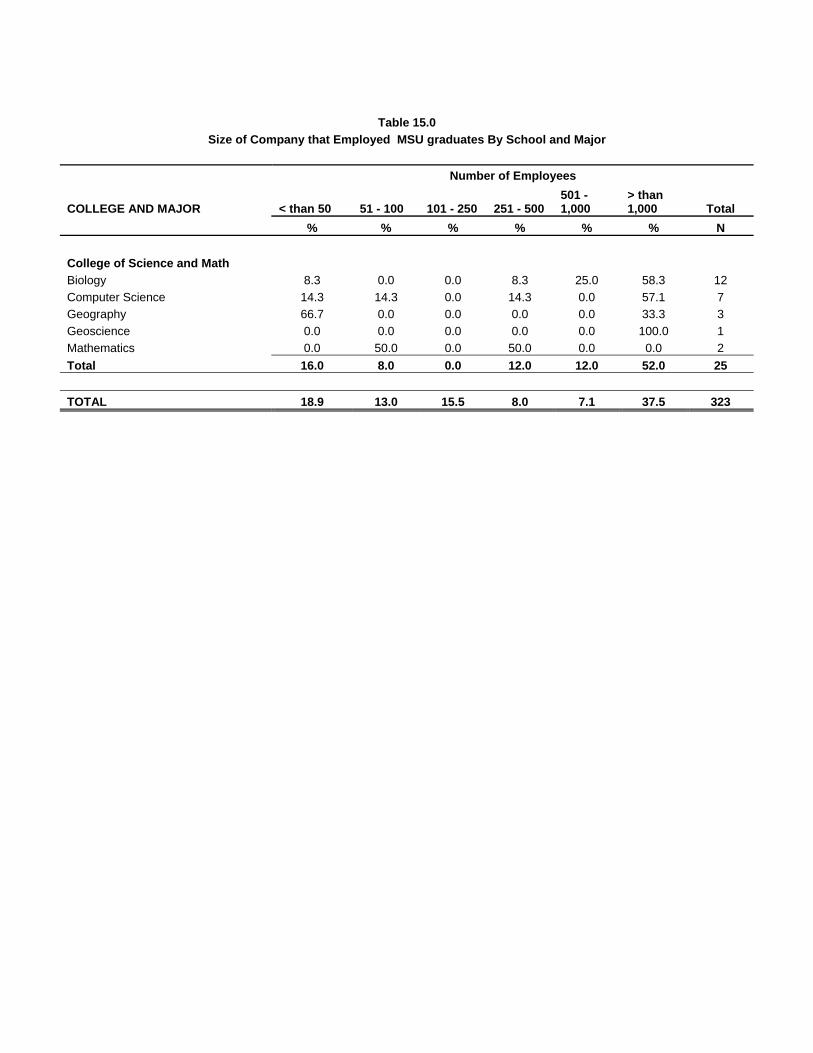
Table 15.0
Size of Company that Employed MSU graduates By School and Major Number of Employees
COLLEGE AND MAJOR < than 50 51 - 100 101 - 250 251 - 500 501 - 1,000
> than 1,000 Total
% % % % % % N College of Science and Math Biology 8.3 0.0 0.0 8.3 25.0 58.3 12 Computer Science 14.3 14.3 0.0 14.3 0.0 57.1 7 Geography 66.7 0.0 0.0 0.0 0.0 33.3 3 Geoscience 0.0 0.0 0.0 0.0 0.0 100.0 1 Mathematics 0.0 50.0 0.0 50.0 0.0 0.0 2 Total 16.0 8.0 0.0 12.0 12.0 52.0 25 TOTAL 18.9 13.0 15.5 8.0 7.1 37.5 323

Table 16.0 Starting and Current Salaries of Alumni
Starting Salary Salary Current Salary N % N %
27 8.6 Less than $19,999 6 2.0 32 10.2 $20,000 to $24,999 15 5.1 51 16.2 $25,000 to $29,999 37 12.6 74 23.6 $30,000 to $34,999 46 15.7
62 19.7 $35,000 to $39,999 60 20.5 46 14.6 $40,000 to $44,999 59 20.1 13 4.1 $45,000 to $49,999 25 8.5 5 1.6 $50,000 to $59,999 31 10.6 3 1.0 $60,000 to $69,999 8 2.7 1 0.3 $70,000 to $79,999 3 1.0 0 0.0 $80,000 and above 3 1.0
314 100 293 100

Table 17.0
Starting Salary Of Alumni By School and Major Starting Salary
DEGREE AND MAJOR Less than
19,999
20,000 to
24,999
25,000 to
29,999
30,000 to
34,999
35,000 to
39,999
40,000 to
44,999
45,000 to
49,999
50,000 to
59,999
60,000 to
69,999
70,000 to
79,999
80,000 &
above Total % % % % % % % % % % % N School of the Arts Broadcasting 28.6 14.3 28.6 28.6 0.0 0.0 0.0 0.0 0.0 0.0 0.0 7 Dance 0.0 100.0 0.0 0.0 0.0 0.0 0.0 0.0 0.0 0.0 0.0 1 Fine Arts 11.8 23.5 17.6 17.6 5.9 17.6 5.9 0.0 0.0 0.0 0.0 17 Music 0.0 0.0 0.0 50.0 50.0 0.0 0.0 0.0 0.0 0.0 0.0 2 Speech Communication 0.0 25.0 50.0 25.0 0.0 0.0 0.0 0.0 0.0 0.0 0.0 4 Theatre Studies 33.3 0.0 33.3 33.3 0.0 0.0 0.0 0.0 0.0 0.0 0.0 3 Total 14.7 20.6 23.5 23.5 5.9 8.8 2.9 0.0 0.0 0.0 0.0 34 School of Business Business Administration 3.8 7.6 11.4 31.6 16.5 13.9 6.3 5.1 2.5 1.3 0.0 79 Economics 0.0 0.0 0.0 0.0 0.0 0.0 100.0 0.0 0.0 0.0 0.0 1 Total 3.8 7.5 11.3 31.3 16.3 13.8 7.5 5.0 2.5 1.3 0.0 80 College of Education and Human Services Allied Health 0.0 0.0 0.0 0.0 0.0 0.0 0.0 100.0 0.0 0.0 0.0 1 Health Education 0.0 0.0 0.0 0.0 100.0 0.0 0.0 0.0 0.0 0.0 0.0 1 Human Ecology 11.4 2.9 14.3 17.1 34.3 17.1 2.9 0.0 0.0 0.0 0.0 35 Physical Education 0.0 0.0 0.0 6.7 46.7 40.0 6.7 0.0 0.0 0.0 0.0 15 Recreation Profession 0.0 0.0 50.0 0.0 50.0 0.0 0.0 0.0 0.0 0.0 0.0 2 Technology Education 0.0 0.0 100.0 0.0 0.0 0.0 0.0 0.0 0.0 0.0 0.0 1 Total 7.3 1.8 12.7 12.7 38.2 21.8 3.6 1.8 0.0 0.0 0.0 55 College of Humanities and Social Science Anthropology 0.0 0.0 100.0 0.0 0.0 0.0 0.0 0.0 0.0 0.0 0.0 1 English 4.3 13.0 21.7 21.7 17.4 21.7 0.0 0.0 0.0 0.0 0.0 23 French 0.0 33.3 0.0 33.3 0.0 33.3 0.0 0.0 0.0 0.0 0.0 3 General Humanities 0.0 33.3 0.0 0.0 66.7 0.0 0.0 0.0 0.0 0.0 0.0 3 History 25.0 0.0 12.5 25.0 37.5 0.0 0.0 0.0 0.0 0.0 0.0 8

Table 17.0
Starting Salary Of Alumni By School and Major Starting Salary
DEGREE AND MAJOR Less than
19,999
20,000 to
24,999
25,000 to
29,999
30,000 to
34,999
35,000 to
39,999
40,000 to
44,999
45,000 to
49,999
50,000 to
59,999
60,000 to
69,999
70,000 to
79,999
80,000 &
above Total % % % % % % % % % % % N Italian 0.0 0.0 0.0 50.0 0.0 50.0 0.0 0.0 0.0 0.0 0.0 2 Justice Studies 10.0 10.0 20.0 0.0 20.0 40.0 0.0 0.0 0.0 0.0 0.0 10 Philosophy 0.0 0.0 0.0 100.0 0.0 0.0 0.0 0.0 0.0 0.0 0.0 1 Political Science 12.5 12.5 25.0 50.0 0.0 0.0 0.0 0.0 0.0 0.0 0.0 8 Psychology 7.9 13.2 23.7 26.3 21.1 5.3 2.6 0.0 0.0 0.0 0.0 38 Religious Studies 0.0 0.0 0.0 100.0 0.0 0.0 0.0 0.0 0.0 0.0 0.0 1 Sociology 13.3 20.0 20.0 26.7 6.7 13.3 0.0 0.0 0.0 0.0 0.0 15 Spanish 25.0 25.0 0.0 0.0 25.0 25.0 0.0 0.0 0.0 0.0 0.0 4 Women's Studies 100.0 0.0 0.0 0.0 0.0 0.0 0.0 0.0 0.0 0.0 0.0 1 Total 10.2 13.6 19.5 24.6 17.8 13.6 0.8 0.0 0.0 0.0 0.0 118 College of Science and Math Biology 8.3 0.0 25.0 16.7 8.3 16.7 16.7 0.0 8.3 0.0 0.0 12 Computer Science 14.3 28.6 0.0 28.6 0.0 14.3 14.3 0.0 0.0 0.0 0.0 7 Geography 33.3 0.0 0.0 33.3 33.3 0.0 0.0 0.0 0.0 0.0 0.0 3 Geoscience 0.0 0.0 0.0 0.0 100.0 0.0 0.0 0.0 0.0 0.0 0.0 1 Mathematics 0.0 0.0 0.0 0.0 66.7 33.3 0.0 0.0 0.0 0.0 0.0 3 Total 11.5 7.7 11.5 19.2 19.2 15.4 11.5 0.0 3.8 0.0 0.0 26 TOTAL 8.6 10.2 16.0 23.6 19.8 14.7 4.2 1.6 1.0 0.3 0.0 313

Table 18.0
Current Salary Of Alumni By School and Major
Current Salary
DEGREE AND MAJOR Less than
19,999 20,000 to
24,999
25,000 to
29,999
30,000 to
34,999
35,000 to
39,999
40,000 to
44,999
45,000 to
49,999
50,000 to
59,999
60,000 to
69,999
70,000 to
79,999 80,000
& above Total
% % % % % % % % % % % N
School of the Arts Broadcasting 0.0 0.0 42.9 42.9 0.0 0.0 14.3 0.0 0.0 0.0 0.0 7 Dance 0.0 0.0 100.0 0.0 0.0 0.0 0.0 0.0 0.0 0.0 0.0 1 Fine Arts 5.9 0.0 11.8 17.6 23.5 17.6 11.8 11.8 0.0 0.0 0.0 17 Music 0.0 0.0 0.0 0.0 100.0 0.0 0.0 0.0 0.0 0.0 0.0 2 Speech Communication 0.0 40.0 20.0 0.0 40.0 0.0 0.0 0.0 0.0 0.0 0.0 5 Theatre Studies 50.0 0.0 0.0 50.0 0.0 0.0 0.0 0.0 0.0 0.0 0.0 2 Total 5.9 5.9 20.6 20.6 23.5 8.8 8.8 5.9 0.0 0.0 0.0 34 School of Business Business Administration 0.0 1.3 6.5 18.2 14.3 14.3 11.7 20.8 7.8 3.9 1.3 77 Economics 0.0 0.0 0.0 0.0 0.0 0.0 0.0 100.0 0.0 0.0 0.0 1 Total 0.0 1.3 6.4 17.9 14.1 14.1 11.5 21.8 7.7 3.8 1.3 78 College of Education and Human Services Allied Health 0.0 0.0 0.0 0.0 0.0 0.0 0.0 50.0 0.0 0.0 50.0 2 Health Education 0.0 0.0 0.0 0.0 0.0 100.0 0.0 0.0 0.0 0.0 0.0 1 Human Ecology 0.0 3.1 9.4 21.9 34.4 28.1 3.1 0.0 0.0 0.0 0.0 32 Physical Education 0.0 0.0 0.0 0.0 14.3 64.3 14.3 7.1 0.0 0.0 0.0 14 Recreation Profession 0.0 0.0 0.0 100.0 0.0 0.0 0.0 0.0 0.0 0.0 0.0 1 Technology Education 0.0 0.0 0.0 100.0 0.0 0.0 0.0 0.0 0.0 0.0 0.0 1 Total 0.0 2.0 5.9 17.6 25.5 37.3 5.9 3.9 0.0 0.0 2.0 51 College of Humanities and Social Science Anthropology 0.0 0.0 100.0 0.0 0.0 0.0 0.0 0.0 0.0 0.0 0.0 1 English 0.0 5.0 25.0 25.0 10.0 35.0 0.0 0.0 0.0 0.0 0.0 20 French 0.0 0.0 50.0 0.0 0.0 0.0 0.0 50.0 0.0 0.0 0.0 2 General Humanities 0.0 33.3 0.0 0.0 33.3 33.3 0.0 0.0 0.0 0.0 0.0 3 History 11.1 11.1 22.2 11.1 0.0 11.1 33.3 0.0 0.0 0.0 0.0 9 Italian 0.0 0.0 0.0 0.0 50.0 50.0 0.0 0.0 0.0 0.0 0.0 2
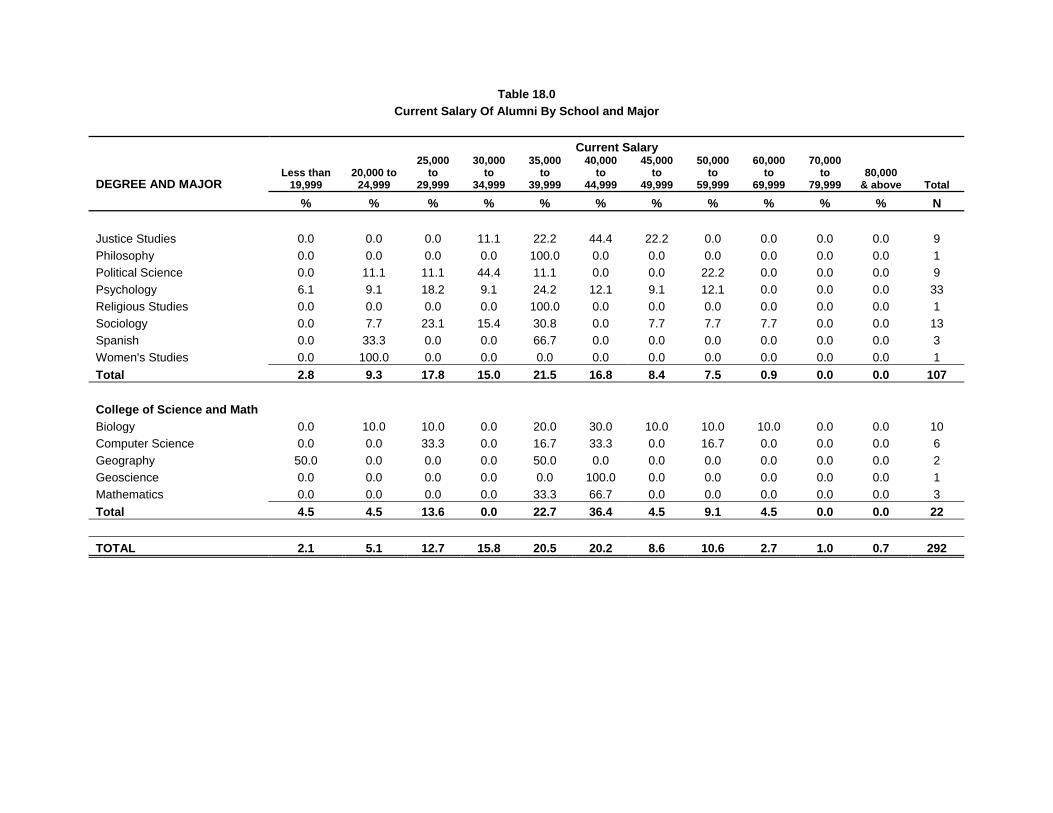
Table 18.0
Current Salary Of Alumni By School and Major
Current Salary
DEGREE AND MAJOR Less than
19,999 20,000 to
24,999
25,000 to
29,999
30,000 to
34,999
35,000 to
39,999
40,000 to
44,999
45,000 to
49,999
50,000 to
59,999
60,000 to
69,999
70,000 to
79,999 80,000
& above Total
% % % % % % % % % % % N
Justice Studies 0.0 0.0 0.0 11.1 22.2 44.4 22.2 0.0 0.0 0.0 0.0 9 Philosophy 0.0 0.0 0.0 0.0 100.0 0.0 0.0 0.0 0.0 0.0 0.0 1 Political Science 0.0 11.1 11.1 44.4 11.1 0.0 0.0 22.2 0.0 0.0 0.0 9 Psychology 6.1 9.1 18.2 9.1 24.2 12.1 9.1 12.1 0.0 0.0 0.0 33 Religious Studies 0.0 0.0 0.0 0.0 100.0 0.0 0.0 0.0 0.0 0.0 0.0 1 Sociology 0.0 7.7 23.1 15.4 30.8 0.0 7.7 7.7 7.7 0.0 0.0 13 Spanish 0.0 33.3 0.0 0.0 66.7 0.0 0.0 0.0 0.0 0.0 0.0 3 Women's Studies 0.0 100.0 0.0 0.0 0.0 0.0 0.0 0.0 0.0 0.0 0.0 1 Total 2.8 9.3 17.8 15.0 21.5 16.8 8.4 7.5 0.9 0.0 0.0 107 College of Science and Math Biology 0.0 10.0 10.0 0.0 20.0 30.0 10.0 10.0 10.0 0.0 0.0 10 Computer Science 0.0 0.0 33.3 0.0 16.7 33.3 0.0 16.7 0.0 0.0 0.0 6 Geography 50.0 0.0 0.0 0.0 50.0 0.0 0.0 0.0 0.0 0.0 0.0 2 Geoscience 0.0 0.0 0.0 0.0 0.0 100.0 0.0 0.0 0.0 0.0 0.0 1 Mathematics 0.0 0.0 0.0 0.0 33.3 66.7 0.0 0.0 0.0 0.0 0.0 3 Total 4.5 4.5 13.6 0.0 22.7 36.4 4.5 9.1 4.5 0.0 0.0 22 TOTAL 2.1 5.1 12.7 15.8 20.5 20.2 8.6 10.6 2.7 1.0 0.7 292
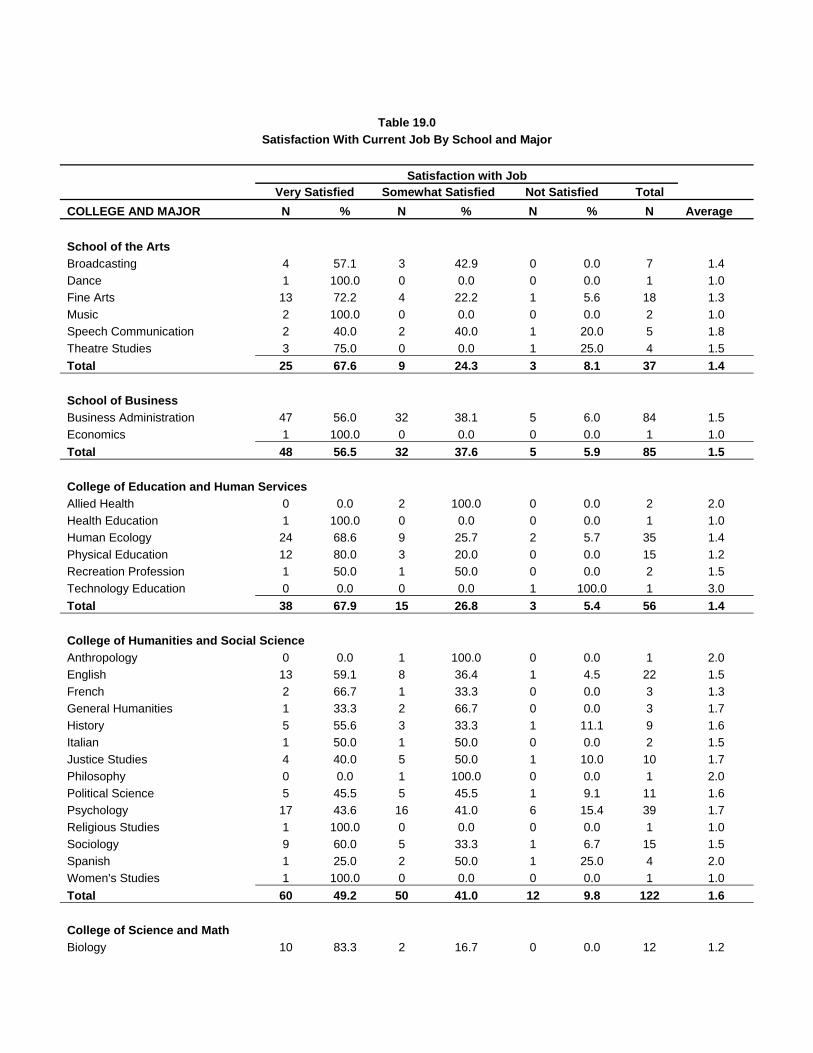
Table 19.0
Satisfaction With Current Job By School and Major Satisfaction with Job Very Satisfied Somewhat Satisfied Not Satisfied Total COLLEGE AND MAJOR N % N % N % N Average School of the Arts Broadcasting 4 57.1 3 42.9 0 0.0 7 1.4 Dance 1 100.0 0 0.0 0 0.0 1 1.0 Fine Arts 13 72.2 4 22.2 1 5.6 18 1.3 Music 2 100.0 0 0.0 0 0.0 2 1.0 Speech Communication 2 40.0 2 40.0 1 20.0 5 1.8 Theatre Studies 3 75.0 0 0.0 1 25.0 4 1.5 Total 25 67.6 9 24.3 3 8.1 37 1.4 School of Business Business Administration 47 56.0 32 38.1 5 6.0 84 1.5 Economics 1 100.0 0 0.0 0 0.0 1 1.0 Total 48 56.5 32 37.6 5 5.9 85 1.5 College of Education and Human Services Allied Health 0 0.0 2 100.0 0 0.0 2 2.0 Health Education 1 100.0 0 0.0 0 0.0 1 1.0 Human Ecology 24 68.6 9 25.7 2 5.7 35 1.4 Physical Education 12 80.0 3 20.0 0 0.0 15 1.2 Recreation Profession 1 50.0 1 50.0 0 0.0 2 1.5 Technology Education 0 0.0 0 0.0 1 100.0 1 3.0 Total 38 67.9 15 26.8 3 5.4 56 1.4 College of Humanities and Social Science Anthropology 0 0.0 1 100.0 0 0.0 1 2.0 English 13 59.1 8 36.4 1 4.5 22 1.5 French 2 66.7 1 33.3 0 0.0 3 1.3 General Humanities 1 33.3 2 66.7 0 0.0 3 1.7 History 5 55.6 3 33.3 1 11.1 9 1.6 Italian 1 50.0 1 50.0 0 0.0 2 1.5 Justice Studies 4 40.0 5 50.0 1 10.0 10 1.7 Philosophy 0 0.0 1 100.0 0 0.0 1 2.0 Political Science 5 45.5 5 45.5 1 9.1 11 1.6 Psychology 17 43.6 16 41.0 6 15.4 39 1.7 Religious Studies 1 100.0 0 0.0 0 0.0 1 1.0 Sociology 9 60.0 5 33.3 1 6.7 15 1.5 Spanish 1 25.0 2 50.0 1 25.0 4 2.0 Women's Studies 1 100.0 0 0.0 0 0.0 1 1.0 Total 60 49.2 50 41.0 12 9.8 122 1.6 College of Science and Math Biology 10 83.3 2 16.7 0 0.0 12 1.2

Table 19.0
Satisfaction With Current Job By School and Major Satisfaction with Job Very Satisfied Somewhat Satisfied Not Satisfied Total COLLEGE AND MAJOR N % N % N % N Average Computer Science 3 42.9 4 57.1 0 0.0 7 1.6 Geography 0 0.0 3 100.0 0 0.0 3 2.0 Geoscience 1 100.0 0 0.0 0 0.0 1 1.0 Mathematics 2 66.7 1 33.3 0 0.0 3 1.3 Total 16 61.5 10 38.5 0 0.0 26 1.4 TOTAL 187 57.4 116 35.6 23 7.1 326 1.5 Scale: 1= Very satisfied, 2= Somewhat satisfied, 3= Not satisfied.

Table 20.0 Post-Baccalaureate Institutions that MSU Graduates are Attending
GRADUATE SCHOOL NUMBER PERCENT In-State Institutions Seton Hall 4 3.0 William Paterson University 4 3.0 Montclair State University 41 30.8 Kean University 6 4.5 Rutgers University 6 4.5 Fairleigh Dickinson University 2 1.5 Caldwell College 4 3.0 Bergen Community College 4 3.0 NJ City University 5 3.8 Monmouth University 2 1.5 University of Medicine and Dentistry of NJ 4 3.0 Richard Stockton College of NJ 1 0.8 Felician College 1 0.8 Stevens Institute of Technology 2 1.5 St Peters College 1 0.8 Ramapo College 1 0.8 College of St Elizabeth 1 0.8 Institute of Therapeutic Massage 1 0.8 Rowan University 1 0.8 0.0 Total 91 68.4 Out-of-State Institutions Berkeley College 1 0.8 Hofstra University 1 0.8 Columbia University 3 2.3 New York University 4 3.0 Fordham University 2 1.5 CUNY City College 1 0.8 CUNY Graduate Center 1 0.8 New York College of Podiatric Medicine 1 0.8 Institute of Culinary Education 1 0.8 University of Buffalo Law School 1 0.8 Dominican College 1 0.8 SUNY University of Buffalo 1 0.8 NY College of Osteopathic Medicine 1 0.8 St Johns University 1 0.8 Iona College 1 0.8 Boston University 1 0.8 Marygrove College 4 3.0 Villanova University 2 1.5 Middlebury College 1 0.8 Florida State University 1 0.8
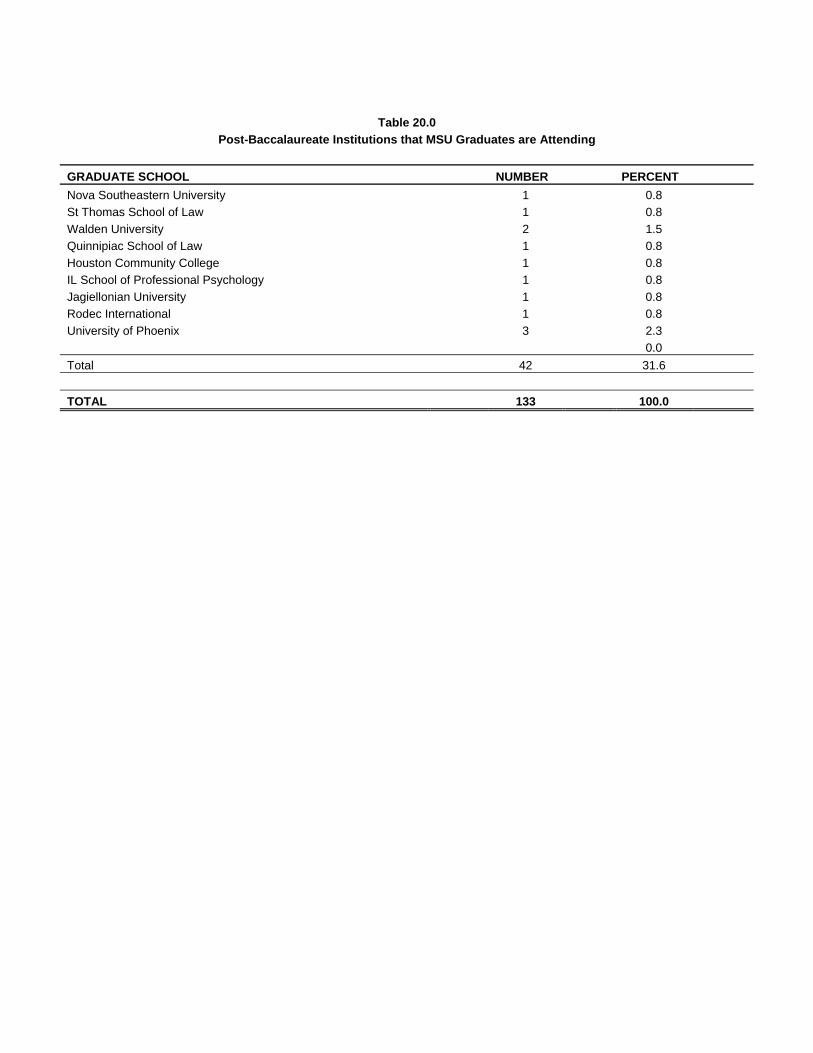
Table 20.0
Post-Baccalaureate Institutions that MSU Graduates are Attending GRADUATE SCHOOL NUMBER PERCENT Nova Southeastern University 1 0.8 St Thomas School of Law 1 0.8 Walden University 2 1.5 Quinnipiac School of Law 1 0.8 Houston Community College 1 0.8 IL School of Professional Psychology 1 0.8 Jagiellonian University 1 0.8 Rodec International 1 0.8 University of Phoenix 3 2.3 0.0 Total 42 31.6 TOTAL 133 100.0
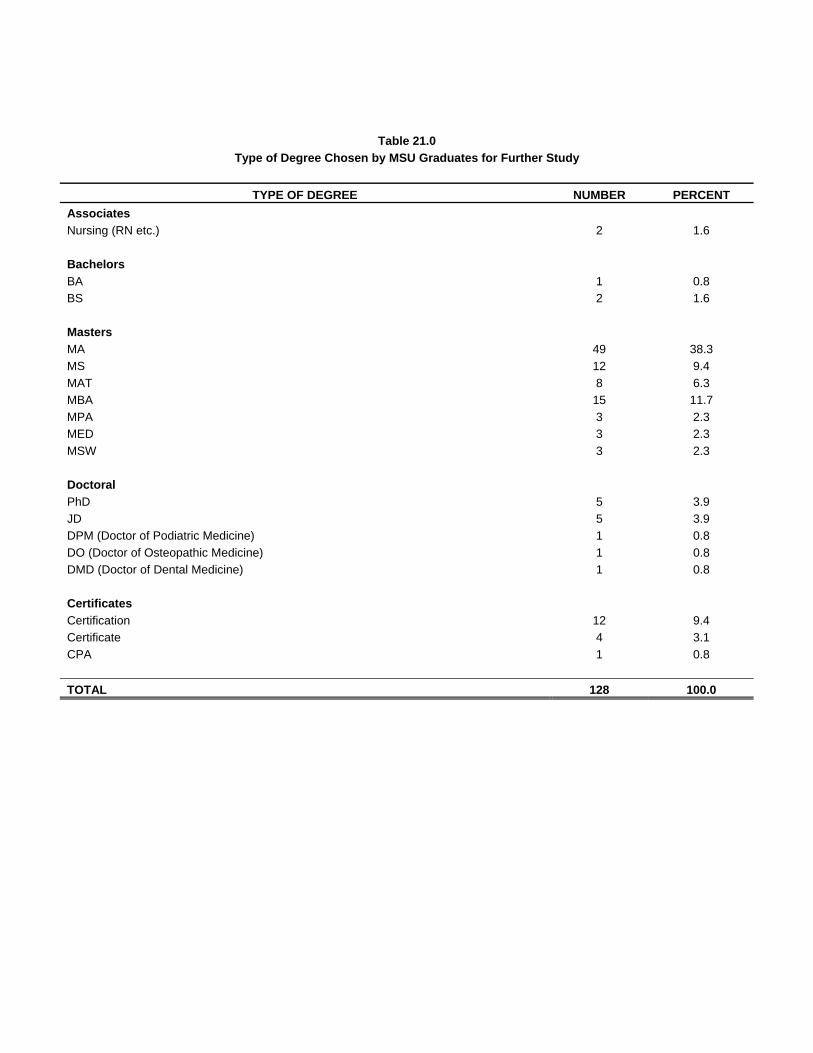
Table 21.0 Type of Degree Chosen by MSU Graduates for Further Study
TYPE OF DEGREE NUMBER PERCENT
Associates Nursing (RN etc.) 2 1.6 Bachelors BA 1 0.8 BS 2 1.6 Masters MA 49 38.3 MS 12 9.4 MAT 8 6.3 MBA 15 11.7 MPA 3 2.3 MED 3 2.3 MSW 3 2.3 Doctoral PhD 5 3.9 JD 5 3.9 DPM (Doctor of Podiatric Medicine) 1 0.8 DO (Doctor of Osteopathic Medicine) 1 0.8 DMD (Doctor of Dental Medicine) 1 0.8 Certificates Certification 12 9.4 Certificate 4 3.1 CPA 1 0.8 TOTAL 128 100.0
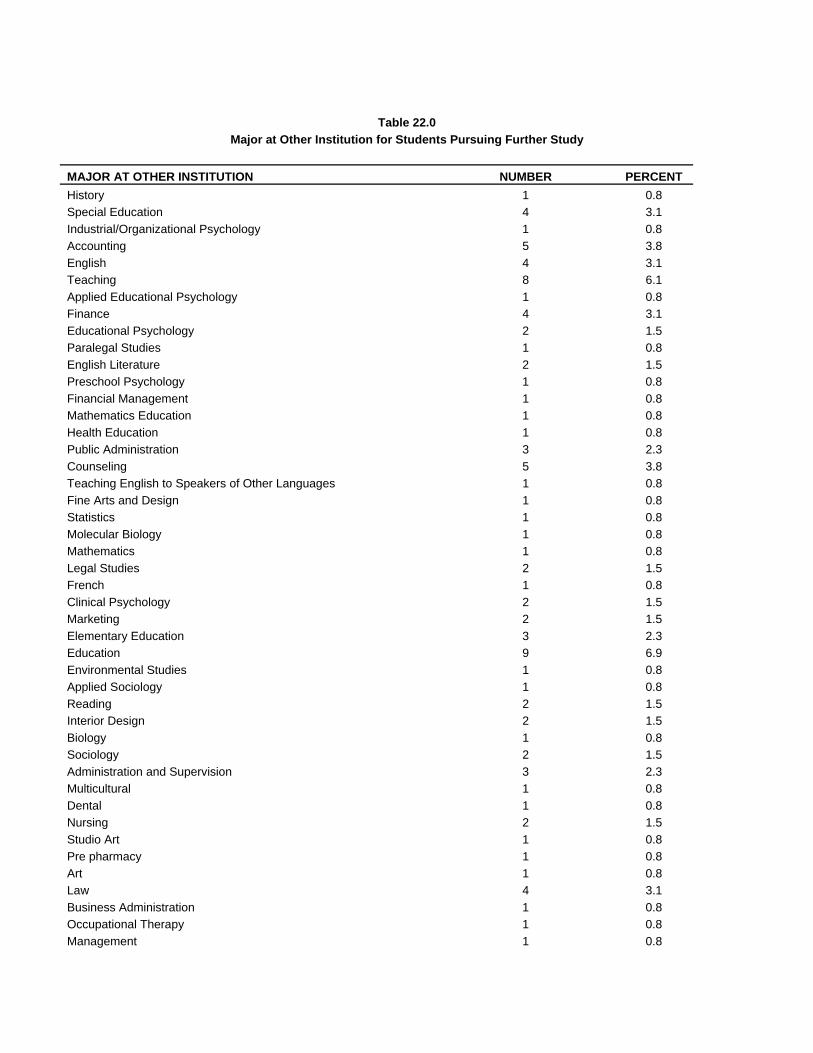
Table 22.0
Major at Other Institution for Students Pursuing Further Study MAJOR AT OTHER INSTITUTION NUMBER PERCENT History 1 0.8 Special Education 4 3.1 Industrial/Organizational Psychology 1 0.8 Accounting 5 3.8 English 4 3.1 Teaching 8 6.1 Applied Educational Psychology 1 0.8 Finance 4 3.1 Educational Psychology 2 1.5 Paralegal Studies 1 0.8 English Literature 2 1.5 Preschool Psychology 1 0.8 Financial Management 1 0.8 Mathematics Education 1 0.8 Health Education 1 0.8 Public Administration 3 2.3 Counseling 5 3.8 Teaching English to Speakers of Other Languages 1 0.8 Fine Arts and Design 1 0.8 Statistics 1 0.8 Molecular Biology 1 0.8 Mathematics 1 0.8 Legal Studies 2 1.5 French 1 0.8 Clinical Psychology 2 1.5 Marketing 2 1.5 Elementary Education 3 2.3 Education 9 6.9 Environmental Studies 1 0.8 Applied Sociology 1 0.8 Reading 2 1.5 Interior Design 2 1.5 Biology 1 0.8 Sociology 2 1.5 Administration and Supervision 3 2.3 Multicultural 1 0.8 Dental 1 0.8 Nursing 2 1.5 Studio Art 1 0.8 Pre pharmacy 1 0.8 Art 1 0.8 Law 4 3.1 Business Administration 1 0.8 Occupational Therapy 1 0.8 Management 1 0.8

Table 22.0
Major at Other Institution for Students Pursuing Further Study MAJOR AT OTHER INSTITUTION NUMBER PERCENT Cell and Developmental Biology 1 0.8 Purchasing Management 1 0.8 Social Work 4 3.1 Teaching Middle Grade Math 1 0.8 Medical Physics 1 0.8 Psychology 2 1.5 Education Curriculum 1 0.8 Early Childhood Education 1 0.8 Chemical Biology 1 0.8 Liberal Studies 1 0.8 Earth Science 1 0.8 Human Resources Training & Development 1 0.8 Educational Counseling 1 0.8 Microbiology 1 0.8 Financial Engineering 1 0.8 Osteopathic Medicine 1 0.8 Speech Pathology 1 0.8 Child & Adolescent Clinical Psychology 1 0.8 School Psychology 2 1.5 Urban Education 1 0.8 Educational Technology 1 0.8 Criminal Justice 1 0.8 Massage Therapy 1 0.8 Rehabilitation Counseling 1 0.8 Justice Studies 1 0.8 Computer Science 1 0.8 Social Psychology 1 0.8 Curriculum & Instruction 1 0.8 Teacher of the Handicapped 1 0.8 Information Technology 1 0.8 General Psychology 1 0.8 TOTAL 131 100.0

Table 23.0
Major at MSU and Major at Other Institution for Students Pursuing Further Study COLLEGE & MAJOR Transfer Institution MAJOR AT OTHER INSTITUTION N School of the Arts Fine Arts Montclair State University Fine Arts and Design 1 Montclair State University Education 1 New York University Studio Art 1 Caldwell College Art 1 University of Phoenix Special Education 1 Music Columbia University Applied Educational Psychology 1 Speech Communication Unknown Speech Pathology 1 St Thomas School of Law Law 1 School of Business Business Administration Unknown Purchasing Management 1 Seton Hall Accounting 1 Montclair State University Accounting 3 Montclair State University Finance 2 Montclair State University Legal Studies 1 Montclair State University Marketing 1 Montclair State University Management 1 Kean University English 1 Rutgers University Finance 1 Rutgers University Financial Management 1 Fairleigh Dickinson University Finance 1 Caldwell College Education 1 Bergen Community College Nursing 1 NJ City University Urban Education 1
University of Medicine and Dentistry of NJ Medical Physics 1
Stevens Institute of Technology Financial Engineering 1 Iona College Information Technology 1 IL School of Professional Psychology Clinical Psychology 1 College of Education and Human Services Allied Health Kean University Public Administration 1 Health Education Montclair State University Counseling 1 Human Ecology Unknown Elementary Education 1 Montclair State University Counseling 2 Montclair State University Elementary Education 1 Montclair State University Education 1 Montclair State University Reading 1 Marygrove College Teaching 2 New York University Counseling 1
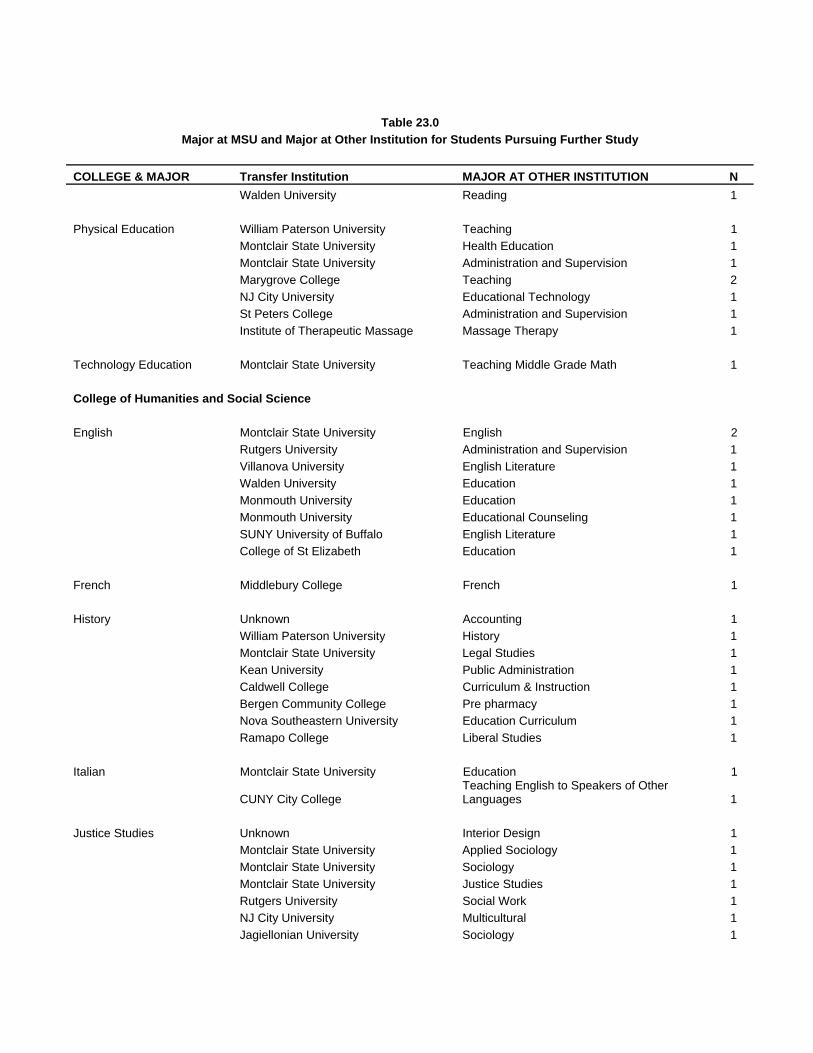
Table 23.0
Major at MSU and Major at Other Institution for Students Pursuing Further Study COLLEGE & MAJOR Transfer Institution MAJOR AT OTHER INSTITUTION N Walden University Reading 1 Physical Education William Paterson University Teaching 1 Montclair State University Health Education 1 Montclair State University Administration and Supervision 1 Marygrove College Teaching 2 NJ City University Educational Technology 1 St Peters College Administration and Supervision 1 Institute of Therapeutic Massage Massage Therapy 1 Technology Education Montclair State University Teaching Middle Grade Math 1 College of Humanities and Social Science English Montclair State University English 2 Rutgers University Administration and Supervision 1 Villanova University English Literature 1 Walden University Education 1 Monmouth University Education 1 Monmouth University Educational Counseling 1 SUNY University of Buffalo English Literature 1 College of St Elizabeth Education 1 French Middlebury College French 1 History Unknown Accounting 1 William Paterson University History 1 Montclair State University Legal Studies 1 Kean University Public Administration 1 Caldwell College Curriculum & Instruction 1 Bergen Community College Pre pharmacy 1 Nova Southeastern University Education Curriculum 1 Ramapo College Liberal Studies 1 Italian Montclair State University Education 1
CUNY City College Teaching English to Speakers of Other Languages 1
Justice Studies Unknown Interior Design 1 Montclair State University Applied Sociology 1 Montclair State University Sociology 1 Montclair State University Justice Studies 1 Rutgers University Social Work 1 NJ City University Multicultural 1 Jagiellonian University Sociology 1
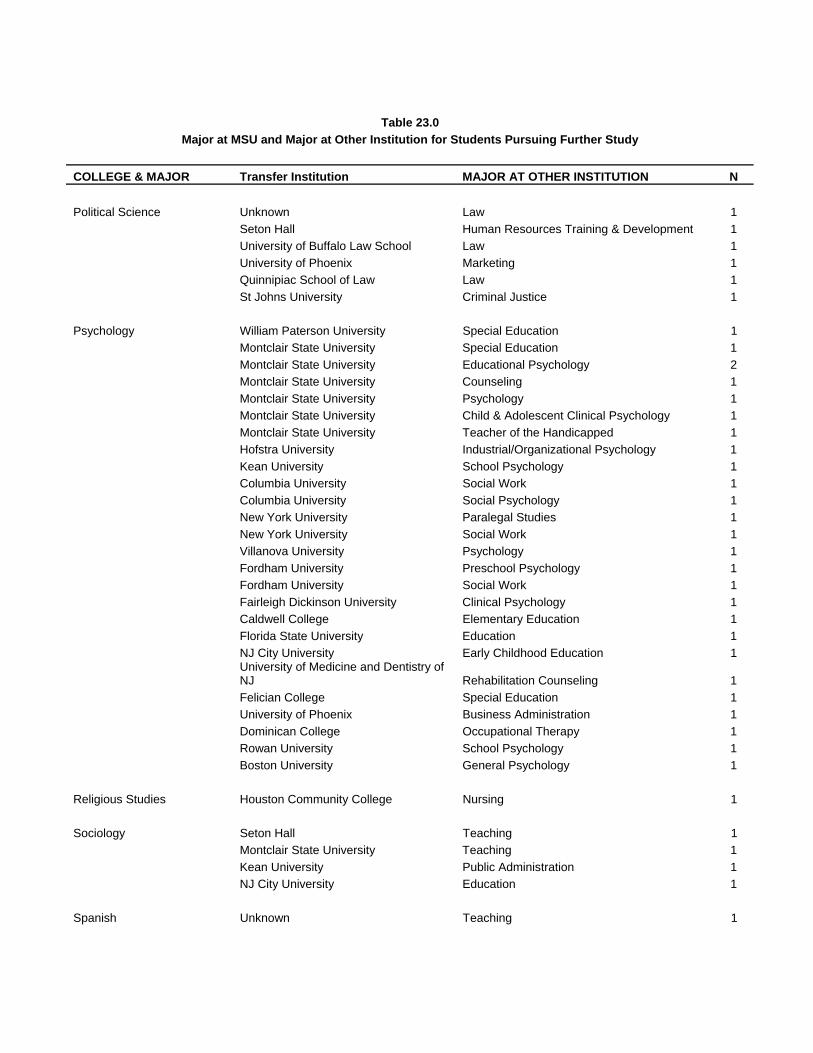
Table 23.0
Major at MSU and Major at Other Institution for Students Pursuing Further Study COLLEGE & MAJOR Transfer Institution MAJOR AT OTHER INSTITUTION N Political Science Unknown Law 1 Seton Hall Human Resources Training & Development 1 University of Buffalo Law School Law 1 University of Phoenix Marketing 1 Quinnipiac School of Law Law 1 St Johns University Criminal Justice 1 Psychology William Paterson University Special Education 1 Montclair State University Special Education 1 Montclair State University Educational Psychology 2 Montclair State University Counseling 1 Montclair State University Psychology 1 Montclair State University Child & Adolescent Clinical Psychology 1 Montclair State University Teacher of the Handicapped 1 Hofstra University Industrial/Organizational Psychology 1 Kean University School Psychology 1 Columbia University Social Work 1 Columbia University Social Psychology 1 New York University Paralegal Studies 1 New York University Social Work 1 Villanova University Psychology 1 Fordham University Preschool Psychology 1 Fordham University Social Work 1 Fairleigh Dickinson University Clinical Psychology 1 Caldwell College Elementary Education 1 Florida State University Education 1 NJ City University Early Childhood Education 1
University of Medicine and Dentistry of NJ Rehabilitation Counseling 1
Felician College Special Education 1 University of Phoenix Business Administration 1 Dominican College Occupational Therapy 1 Rowan University School Psychology 1 Boston University General Psychology 1 Religious Studies Houston Community College Nursing 1 Sociology Seton Hall Teaching 1 Montclair State University Teaching 1 Kean University Public Administration 1 NJ City University Education 1 Spanish Unknown Teaching 1

Table 23.0
Major at MSU and Major at Other Institution for Students Pursuing Further Study COLLEGE & MAJOR Transfer Institution MAJOR AT OTHER INSTITUTION N College of Science and Math Biology Montclair State University Biology 1 Rutgers University Cell and Developmental Biology 1 Stevens Institute of Technology Chemical Biology 1 NY College of Osteopathic Medicine Osteopathic Medicine 1 Computer Science Montclair State University Computer Science 1 Geography Kean University Earth Science 1 Geoscience Montclair State University Environmental Studies 1 Mathematics Montclair State University Mathematics Education 1 Montclair State University Statistics 1 CUNY Graduate Center Mathematics 1 Molecular Biology Montclair State University Molecular Biology 1 Rodec International Interior Design 1
University of Medicine and Dentistry of NJ Dental 1
University of Medicine and Dentistry of NJ Microbiology 1
UNDERGRADUATE TOTAL 131
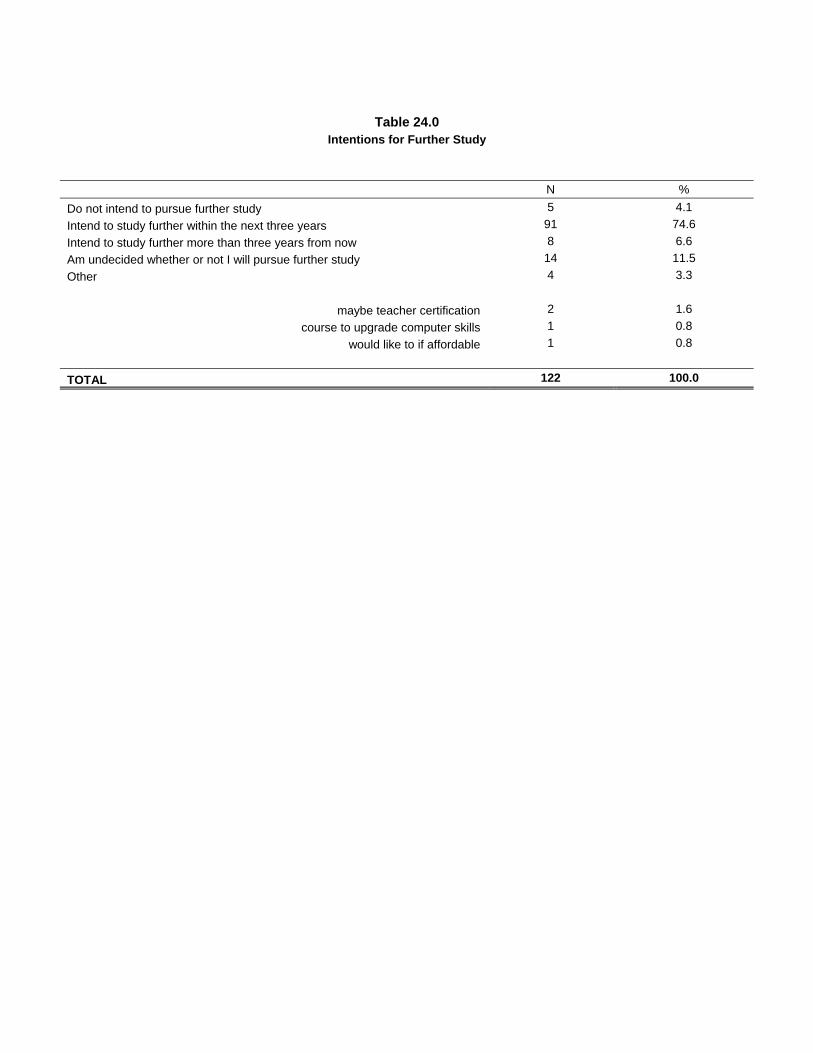
Table 24.0
Intentions for Further Study N % Do not intend to pursue further study 5 4.1 Intend to study further within the next three years 91 74.6 Intend to study further more than three years from now 8 6.6 Am undecided whether or not I will pursue further study 14 11.5 Other 4 3.3
maybe teacher certification 2 1.6 course to upgrade computer skills 1 0.8
would like to if affordable 1 0.8
TOTAL 122 100.0
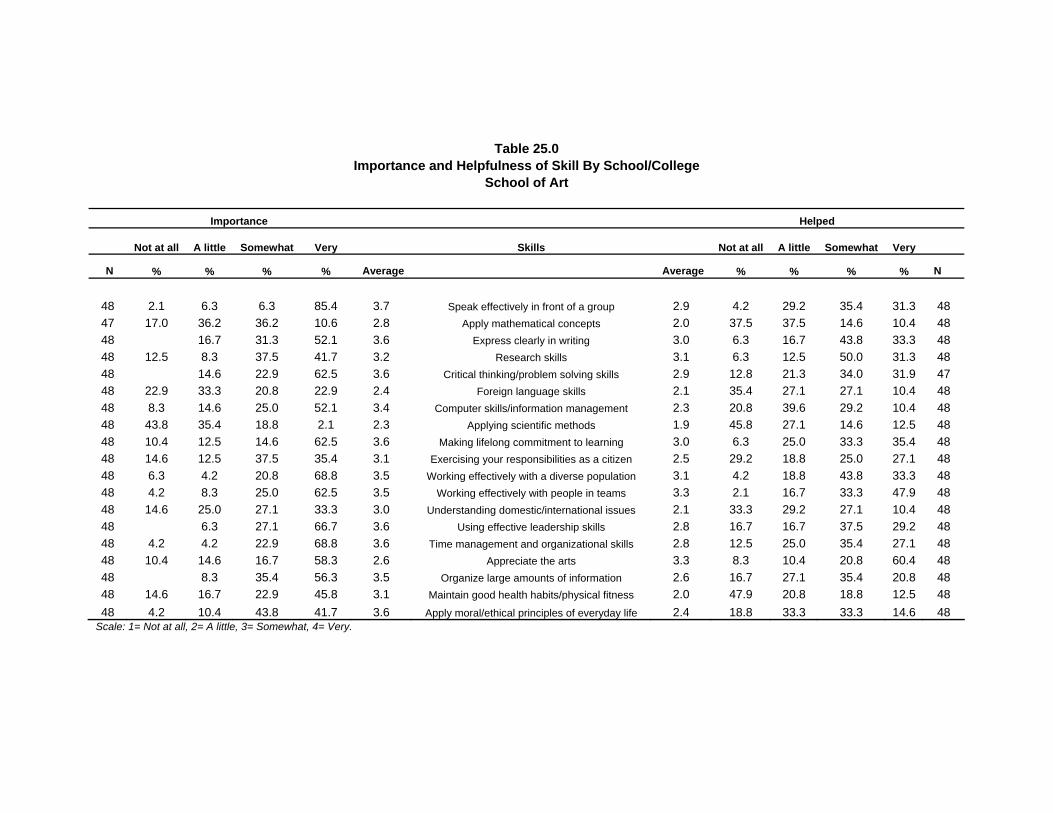
Table 25.0 Importance and Helpfulness of Skill By School/College
School of Art Importance Helped
Not at all A little Somewhat Very
Skills Not at all A little Somewhat Very
N % % % % Average Average % % % % N 48 2.1 6.3 6.3 85.4 3.7 Speak effectively in front of a group 2.9 4.2 29.2 35.4 31.3 48 47 17.0 36.2 36.2 10.6 2.8 Apply mathematical concepts 2.0 37.5 37.5 14.6 10.4 48 48 16.7 31.3 52.1 3.6 Express clearly in writing 3.0 6.3 16.7 43.8 33.3 48 48 12.5 8.3 37.5 41.7 3.2 Research skills 3.1 6.3 12.5 50.0 31.3 48 48 14.6 22.9 62.5 3.6 Critical thinking/problem solving skills 2.9 12.8 21.3 34.0 31.9 47 48 22.9 33.3 20.8 22.9 2.4 Foreign language skills 2.1 35.4 27.1 27.1 10.4 48 48 8.3 14.6 25.0 52.1 3.4 Computer skills/information management 2.3 20.8 39.6 29.2 10.4 48 48 43.8 35.4 18.8 2.1 2.3 Applying scientific methods 1.9 45.8 27.1 14.6 12.5 48 48 10.4 12.5 14.6 62.5 3.6 Making lifelong commitment to learning 3.0 6.3 25.0 33.3 35.4 48 48 14.6 12.5 37.5 35.4 3.1 Exercising your responsibilities as a citizen 2.5 29.2 18.8 25.0 27.1 48 48 6.3 4.2 20.8 68.8 3.5 Working effectively with a diverse population 3.1 4.2 18.8 43.8 33.3 48 48 4.2 8.3 25.0 62.5 3.5 Working effectively with people in teams 3.3 2.1 16.7 33.3 47.9 48 48 14.6 25.0 27.1 33.3 3.0 Understanding domestic/international issues 2.1 33.3 29.2 27.1 10.4 48 48 6.3 27.1 66.7 3.6 Using effective leadership skills 2.8 16.7 16.7 37.5 29.2 48 48 4.2 4.2 22.9 68.8 3.6 Time management and organizational skills 2.8 12.5 25.0 35.4 27.1 48 48 10.4 14.6 16.7 58.3 2.6 Appreciate the arts 3.3 8.3 10.4 20.8 60.4 48 48 8.3 35.4 56.3 3.5 Organize large amounts of information 2.6 16.7 27.1 35.4 20.8 48 48 14.6 16.7 22.9 45.8 3.1 Maintain good health habits/physical fitness 2.0 47.9 20.8 18.8 12.5 48 48 4.2 10.4 43.8 41.7 3.6 Apply moral/ethical principles of everyday life 2.4 18.8 33.3 33.3 14.6 48
Scale: 1= Not at all, 2= A little, 3= Somewhat, 4= Very.
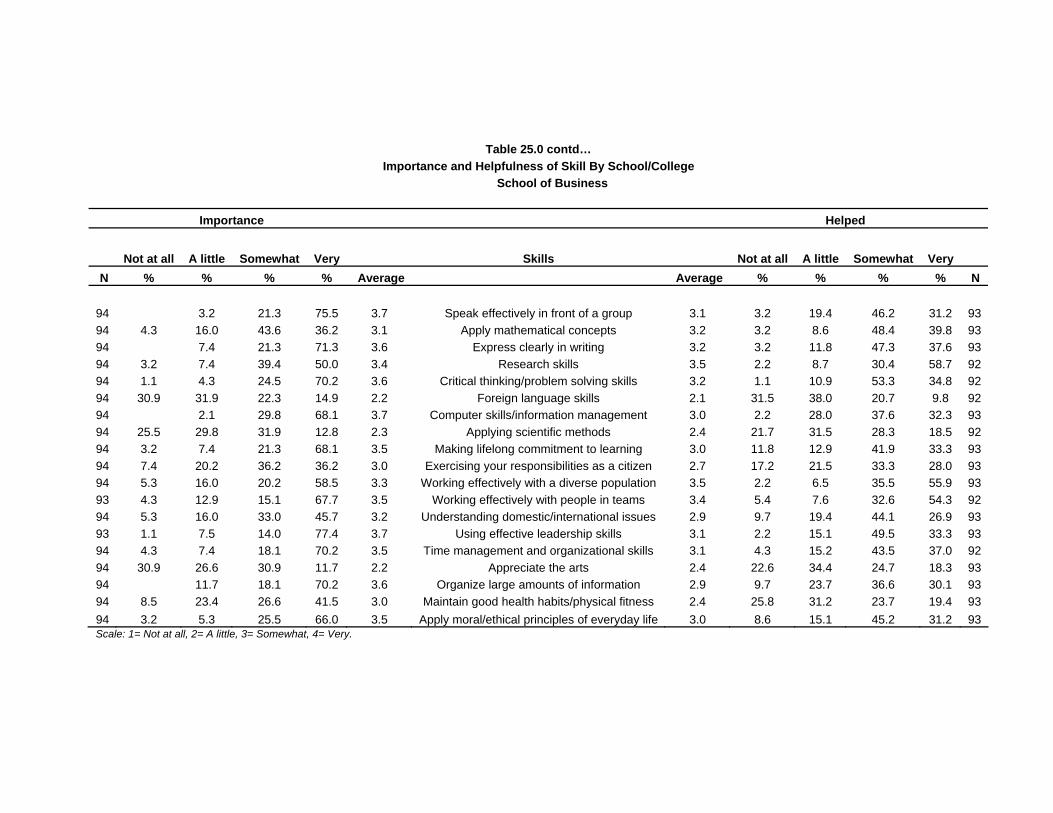
Table 25.0 contd… Importance and Helpfulness of Skill By School/College
School of Business Importance Helped
Not at all A little Somewhat Very Skills Not at all A little Somewhat Very N % % % % Average Average % % % % N 94 3.2 21.3 75.5 3.7 Speak effectively in front of a group 3.1 3.2 19.4 46.2 31.2 93 94 4.3 16.0 43.6 36.2 3.1 Apply mathematical concepts 3.2 3.2 8.6 48.4 39.8 93 94 7.4 21.3 71.3 3.6 Express clearly in writing 3.2 3.2 11.8 47.3 37.6 93 94 3.2 7.4 39.4 50.0 3.4 Research skills 3.5 2.2 8.7 30.4 58.7 92 94 1.1 4.3 24.5 70.2 3.6 Critical thinking/problem solving skills 3.2 1.1 10.9 53.3 34.8 92 94 30.9 31.9 22.3 14.9 2.2 Foreign language skills 2.1 31.5 38.0 20.7 9.8 92 94 2.1 29.8 68.1 3.7 Computer skills/information management 3.0 2.2 28.0 37.6 32.3 93 94 25.5 29.8 31.9 12.8 2.3 Applying scientific methods 2.4 21.7 31.5 28.3 18.5 92 94 3.2 7.4 21.3 68.1 3.5 Making lifelong commitment to learning 3.0 11.8 12.9 41.9 33.3 93 94 7.4 20.2 36.2 36.2 3.0 Exercising your responsibilities as a citizen 2.7 17.2 21.5 33.3 28.0 93 94 5.3 16.0 20.2 58.5 3.3 Working effectively with a diverse population 3.5 2.2 6.5 35.5 55.9 93 93 4.3 12.9 15.1 67.7 3.5 Working effectively with people in teams 3.4 5.4 7.6 32.6 54.3 92 94 5.3 16.0 33.0 45.7 3.2 Understanding domestic/international issues 2.9 9.7 19.4 44.1 26.9 93 93 1.1 7.5 14.0 77.4 3.7 Using effective leadership skills 3.1 2.2 15.1 49.5 33.3 93 94 4.3 7.4 18.1 70.2 3.5 Time management and organizational skills 3.1 4.3 15.2 43.5 37.0 92 94 30.9 26.6 30.9 11.7 2.2 Appreciate the arts 2.4 22.6 34.4 24.7 18.3 93 94 11.7 18.1 70.2 3.6 Organize large amounts of information 2.9 9.7 23.7 36.6 30.1 93 94 8.5 23.4 26.6 41.5 3.0 Maintain good health habits/physical fitness 2.4 25.8 31.2 23.7 19.4 93 94 3.2 5.3 25.5 66.0 3.5 Apply moral/ethical principles of everyday life 3.0 8.6 15.1 45.2 31.2 93 Scale: 1= Not at all, 2= A little, 3= Somewhat, 4= Very.

Table 25.0 contd… Importance and Helpfulness of Skill By School/College
College of Education and Human Services Importance Helped Not at all A little Somewhat Very Skills Not at all A little Somewhat Very
N % % % % Average Average % % % % N 70 2.9 20.0 77.1 3.7 Speak effectively in front of a group 3.1 7.1 14.3 42.9 35.7 70 70 10.0 27.1 41.4 21.4 2.7 Apply mathematical concepts 2.4 23.2 26.1 37.7 13.0 69 70 7.1 31.4 61.4 3.5 Express clearly in writing 3.1 2.9 18.6 42.9 35.7 70 69 2.9 23.2 29.0 44.9 3.2 Research skills 3.3 1.5 13.2 42.6 42.6 68 69 2.9 26.1 71.0 3.7 Critical thinking/problem solving skills 3.1 5.9 13.2 50.0 30.9 68 68 25.0 32.4 25.0 17.6 2.4 Foreign language skills 1.9 39.7 38.2 14.7 7.4 68 69 11.6 43.5 44.9 3.3 Computer skills/information management 2.5 20.3 24.6 39.1 15.9 69 69 24.6 42.0 20.3 13.0 2.2 Applying scientific methods 2.2 23.9 47.8 14.9 13.4 67 69 4.3 4.3 15.9 75.4 3.6 Making lifelong commitment to learning 3.1 8.7 11.6 37.7 42.0 69 68 5.9 16.2 30.9 47.1 3.2 Exercising your responsibilities as a citizen 2.7 15.9 26.1 27.5 30.4 69 70 4.3 2.9 18.6 74.3 3.6 Working effectively with a diverse population 3.3 0.0 20.0 28.6 51.4 70 70 2.9 5.7 17.1 74.3 3.6 Working effectively with people in teams 3.6 2.9 1.4 33.3 62.3 69 70 7.1 22.9 38.6 31.4 2.9 Understanding domestic/international issues 2.3 17.4 44.9 29.0 8.7 69 69 2.9 2.9 21.7 72.5 3.6 Using effective leadership skills 3.0 2.9 20.0 47.1 30.0 70 69 2.9 1.4 14.5 81.2 3.7 Time management and organizational skills 3.1 4.3 18.8 42.0 34.8 69 69 24.6 27.5 27.5 20.3 2.4 Appreciate the arts 2.4 19.1 36.8 29.4 14.7 68 69 1.4 1.4 40.6 56.5 3.5 Organize large amounts of information 2.8 7.2 24.6 47.8 20.3 69 69 2.9 14.5 26.1 56.5 3.4 Maintain good health habits/physical fitness 2.7 17.4 29.0 20.3 33.3 69 69 1.4 5.8 21.7 71.0 3.6 Apply moral/ethical principles of everyday life 2.8 11.6 24.6 37.7 26.1 69 Scale: 1= Not at all, 2= A little, 3= Somewhat, 4= Very.

Table 25.0 contd… Importance and Helpfulness of Skill By School/College
College of Humanities and Social Science Importance Helped
Not at all A little Somewhat Very Skills Not at all A little Somewhat Very N % % % % Average Average % % % % N
157 0.6 7.6 19.1 72.6 3.6 Speak effectively in front of a group 2.9 9.0 18.7 47.1 25.2 155 156 13.5 27.6 42.9 16.0 2.6 Apply mathematical concepts 2.3 27.7 27.1 31.6 13.5 155 157 1.9 9.6 11.5 77.1 3.6 Express clearly in writing 3.3 1.9 12.3 35.5 50.3 155 157 7.0 15.3 26.1 51.6 3.2 Research skills 3.4 2.0 9.9 31.8 56.3 151 157 0.0 5.1 15.9 79.0 3.7 Critical thinking/problem solving skills 3.1 3.4 14.8 45.6 36.2 149 157 27.4 22.9 21.7 28.0 2.5 Foreign language skills 2.3 32.7 25.5 22.2 19.6 153 157 1.9 11.5 29.3 57.3 3.4 Computer skills/information management 2.6 11.0 36.4 38.3 14.3 154 156 32.1 25.6 24.4 17.9 2.3 Applying scientific methods 2.4 27.5 27.5 23.5 21.6 153 156 0.6 7.7 17.9 73.7 3.6 Making lifelong commitment to learning 3.2 6.5 18.2 28.6 46.8 154 154 6.5 15.6 27.3 50.6 3.2 Exercising your responsibilities as a citizen 2.8 15.0 23.5 28.1 33.3 153 157 4.5 7.0 14.6 73.9 3.6 Working effectively with a diverse population 3.2 5.2 13.6 33.8 47.4 154 156 5.1 10.3 16.0 68.6 3.5 Working effectively with people in teams 3.2 4.5 13.6 35.7 46.1 154 156 4.5 15.4 38.5 41.7 3.2 Understanding domestic/international issues 2.7 13.3 27.3 32.0 27.3 150 157 3.2 6.4 29.9 60.5 3.5 Using effective leadership skills 2.9 5.8 22.1 48.1 24.0 154 157 3.2 5.7 14.6 76.4 3.6 Time management and organizational skills 2.9 8.4 23.4 37.7 30.5 154 157 14.6 30.6 21.7 33.1 2.7 Appreciate the arts 2.8 13.2 28.3 25.0 33.6 152 157 3.8 5.1 24.2 66.9 3.5 Organize large amounts of information 2.9 8.4 20.8 41.6 29.2 154 157 7.0 13.4 35.7 43.9 3.2 Maintain good health habits/physical fitness 2.4 25.5 34.0 18.3 22.2 153 157 2.5 3.2 19.7 74.5 3.7 Apply moral/ethical principles of everyday life 2.7 11.0 31.2 31.8 26.0 154 Scale: 1= Not at all, 2= A little, 3= Somewhat, 4= Very.

Table 25.0 contd… Importance and Helpfulness of Skill By School/College
College of Science and Math Importance Helped Not at all A little Somewhat Very Skills Not at all A little Somewhat Very
N % % % % Average Average % % % % N 41 2.4 2.4 22.0 73.2 3.7 Speak effectively in front of a group 2.9 2.5 30.0 40.0 27.5 40 41 4.9 22.0 36.6 36.6 3.0 Apply mathematical concepts 3.1 5.0 17.5 37.5 40.0 40 41 2.4 7.3 24.4 65.9 3.5 Express clearly in writing 3.1 25.0 45.0 30.0 40 41 7.3 17.1 22.0 53.7 3.2 Research skills 3.4 10.3 38.5 51.3 39 41 2.4 17.1 17.1 63.4 3.4 Critical thinking/problem solving skills 3.0 5.0 20.0 42.5 32.5 40 41 24.4 29.3 31.7 14.6 2.4 Foreign language skills 2.4 24.4 26.8 36.6 12.2 41 41 7.3 2.4 31.7 58.5 3.4 Computer skills/information management 2.9 7.5 25.0 37.5 30.0 40 41 12.2 17.1 26.8 43.9 3.0 Applying scientific methods 3.2 7.5 12.5 32.5 47.5 40 41 4.9 4.9 19.5 70.7 3.6 Making lifelong commitment to learning 2.9 12.2 14.6 46.3 26.8 41 41 12.2 19.5 41.5 26.8 2.8 Exercising your responsibilities as a citizen 2.4 32.5 20.0 25.0 22.5 40 41 7.3 12.2 14.6 65.9 3.4 Working effectively with a diverse population 3.1 5.0 22.5 27.5 45.0 40 41 4.9 4.9 26.8 63.4 3.5 Working effectively with people in teams 3.2 10.0 10.0 32.5 47.5 40 41 7.3 36.6 31.7 24.4 2.7 Understanding domestic/international issues 2.2 17.5 50.0 27.5 5.0 40 41 2.4 12.2 29.3 56.1 3.4 Using effective leadership skills 2.9 10.0 22.5 32.5 35.0 40 41 2.4 4.9 17.1 75.6 3.7 Time management and organizational skills 2.8 5.0 30.0 42.5 22.5 40 41 31.7 26.8 22.0 19.5 2.3 Appreciate the arts 2.5 20.0 35.0 20.0 25.0 40 41 7.3 7.3 29.3 56.1 3.3 Organize large amounts of information 3.0 7.5 17.5 47.5 27.5 40 41 12.2 12.2 36.6 39.0 3.0 Maintain good health habits/physical fitness 2.5 22.5 27.5 30.0 20.0 40 41 2.4 12.2 24.4 61.0 3.4 Apply moral/ethical principles of everyday life 2.6 17.5 27.5 35.0 20.0 40 Scale: 1= Not at all, 2= A little, 3= Somewhat, 4= Very.
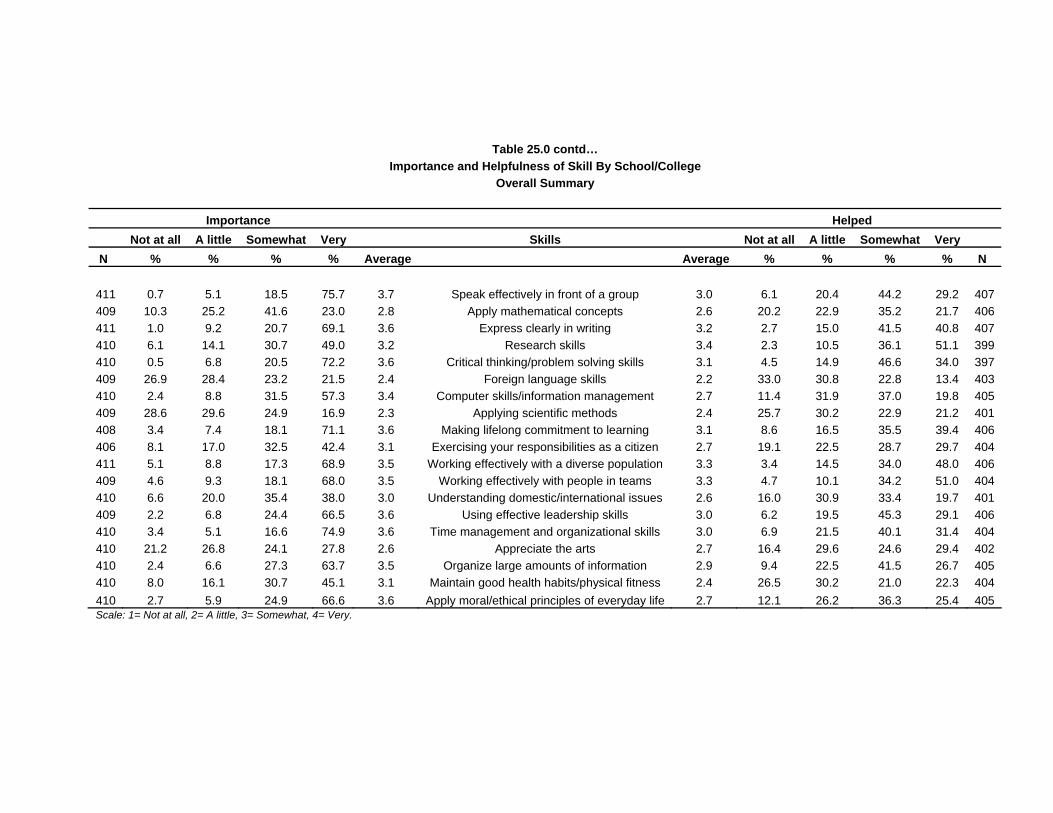
Table 25.0 contd… Importance and Helpfulness of Skill By School/College
Overall Summary Importance Helped
Not at all A little Somewhat Very Skills Not at all A little Somewhat Very N % % % % Average Average % % % % N 411 0.7 5.1 18.5 75.7 3.7 Speak effectively in front of a group 3.0 6.1 20.4 44.2 29.2 407 409 10.3 25.2 41.6 23.0 2.8 Apply mathematical concepts 2.6 20.2 22.9 35.2 21.7 406 411 1.0 9.2 20.7 69.1 3.6 Express clearly in writing 3.2 2.7 15.0 41.5 40.8 407 410 6.1 14.1 30.7 49.0 3.2 Research skills 3.4 2.3 10.5 36.1 51.1 399 410 0.5 6.8 20.5 72.2 3.6 Critical thinking/problem solving skills 3.1 4.5 14.9 46.6 34.0 397 409 26.9 28.4 23.2 21.5 2.4 Foreign language skills 2.2 33.0 30.8 22.8 13.4 403 410 2.4 8.8 31.5 57.3 3.4 Computer skills/information management 2.7 11.4 31.9 37.0 19.8 405 409 28.6 29.6 24.9 16.9 2.3 Applying scientific methods 2.4 25.7 30.2 22.9 21.2 401 408 3.4 7.4 18.1 71.1 3.6 Making lifelong commitment to learning 3.1 8.6 16.5 35.5 39.4 406 406 8.1 17.0 32.5 42.4 3.1 Exercising your responsibilities as a citizen 2.7 19.1 22.5 28.7 29.7 404 411 5.1 8.8 17.3 68.9 3.5 Working effectively with a diverse population 3.3 3.4 14.5 34.0 48.0 406 409 4.6 9.3 18.1 68.0 3.5 Working effectively with people in teams 3.3 4.7 10.1 34.2 51.0 404 410 6.6 20.0 35.4 38.0 3.0 Understanding domestic/international issues 2.6 16.0 30.9 33.4 19.7 401 409 2.2 6.8 24.4 66.5 3.6 Using effective leadership skills 3.0 6.2 19.5 45.3 29.1 406 410 3.4 5.1 16.6 74.9 3.6 Time management and organizational skills 3.0 6.9 21.5 40.1 31.4 404 410 21.2 26.8 24.1 27.8 2.6 Appreciate the arts 2.7 16.4 29.6 24.6 29.4 402 410 2.4 6.6 27.3 63.7 3.5 Organize large amounts of information 2.9 9.4 22.5 41.5 26.7 405 410 8.0 16.1 30.7 45.1 3.1 Maintain good health habits/physical fitness 2.4 26.5 30.2 21.0 22.3 404 410 2.7 5.9 24.9 66.6 3.6 Apply moral/ethical principles of everyday life 2.7 12.1 26.2 36.3 25.4 405 Scale: 1= Not at all, 2= A little, 3= Somewhat, 4= Very.
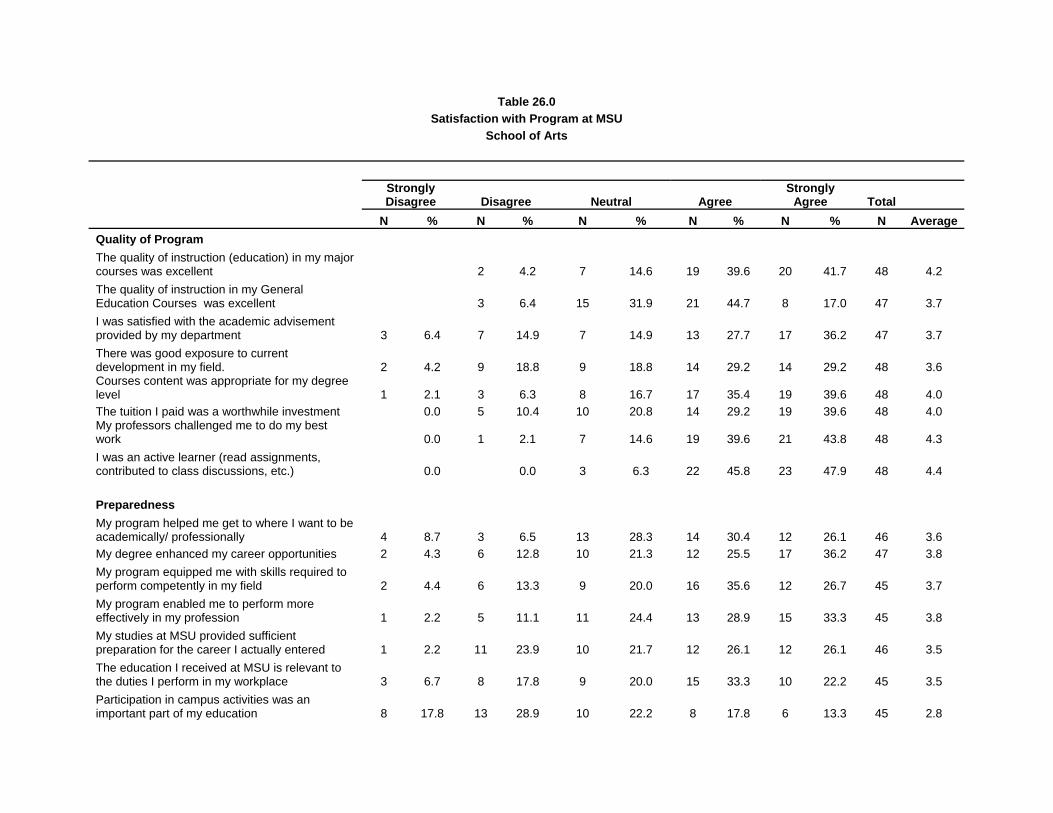
Table 26.0 Satisfaction with Program at MSU
School of Arts
Strongly Disagree Disagree Neutral Agree
Strongly Agree Total
N % N % N % N % N % N Average Quality of Program The quality of instruction (education) in my major courses was excellent 2 4.2 7 14.6 19 39.6 20 41.7 48 4.2 The quality of instruction in my General Education Courses was excellent 3 6.4 15 31.9 21 44.7 8 17.0 47 3.7 I was satisfied with the academic advisement provided by my department 3 6.4 7 14.9 7 14.9 13 27.7 17 36.2 47 3.7 There was good exposure to current development in my field. 2 4.2 9 18.8 9 18.8 14 29.2 14 29.2 48 3.6 Courses content was appropriate for my degree level 1 2.1 3 6.3 8 16.7 17 35.4 19 39.6 48 4.0 The tuition I paid was a worthwhile investment 0.0 5 10.4 10 20.8 14 29.2 19 39.6 48 4.0 My professors challenged me to do my best work 0.0 1 2.1 7 14.6 19 39.6 21 43.8 48 4.3 I was an active learner (read assignments, contributed to class discussions, etc.) 0.0 0.0 3 6.3 22 45.8 23 47.9 48 4.4 Preparedness My program helped me get to where I want to be academically/ professionally 4 8.7 3 6.5 13 28.3 14 30.4 12 26.1 46 3.6 My degree enhanced my career opportunities 2 4.3 6 12.8 10 21.3 12 25.5 17 36.2 47 3.8 My program equipped me with skills required to perform competently in my field 2 4.4 6 13.3 9 20.0 16 35.6 12 26.7 45 3.7 My program enabled me to perform more effectively in my profession 1 2.2 5 11.1 11 24.4 13 28.9 15 33.3 45 3.8 My studies at MSU provided sufficient preparation for the career I actually entered 1 2.2 11 23.9 10 21.7 12 26.1 12 26.1 46 3.5 The education I received at MSU is relevant to the duties I perform in my workplace 3 6.7 8 17.8 9 20.0 15 33.3 10 22.2 45 3.5 Participation in campus activities was an important part of my education 8 17.8 13 28.9 10 22.2 8 17.8 6 13.3 45 2.8

Table 26.0 Satisfaction with Program at MSU
School of Arts
Strongly Disagree Disagree Neutral Agree
Strongly Agree Total
N % N % N % N % N % N Average Overall I would recommend my program to students with similar academic and professional interests 5 10.6 4 8.5 3 6.4 16 34.0 19 40.4 47 3.9 If I had to do it all over again, I would enroll as a student in my program 4 8.5 10 21.3 5 10.6 9 19.1 19 40.4 47 3.6 Scale: 1= Strongly disagree, 2= Disagree, 3= Neutral, 4= Agree, 5= Strongly agree.
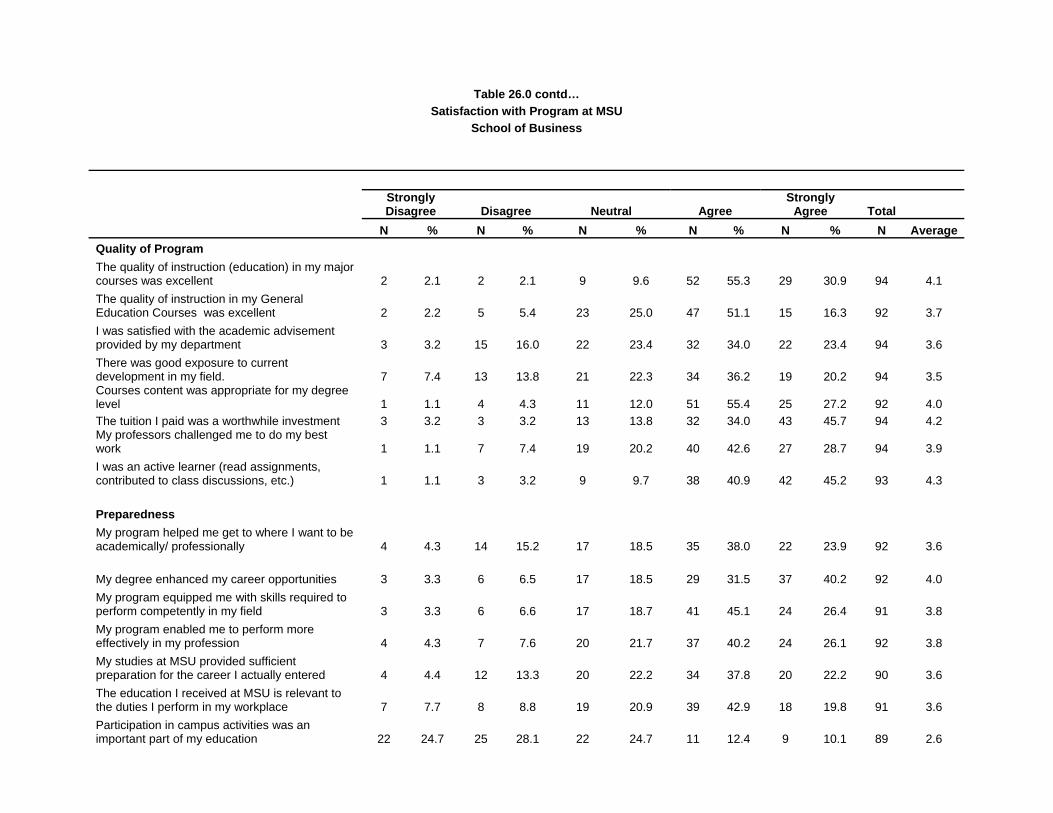
Table 26.0 contd…
Satisfaction with Program at MSU School of Business
Strongly Disagree Disagree Neutral Agree
Strongly Agree Total
N % N % N % N % N % N Average Quality of Program The quality of instruction (education) in my major courses was excellent 2 2.1 2 2.1 9 9.6 52 55.3 29 30.9 94 4.1 The quality of instruction in my General Education Courses was excellent 2 2.2 5 5.4 23 25.0 47 51.1 15 16.3 92 3.7 I was satisfied with the academic advisement provided by my department 3 3.2 15 16.0 22 23.4 32 34.0 22 23.4 94 3.6 There was good exposure to current development in my field. 7 7.4 13 13.8 21 22.3 34 36.2 19 20.2 94 3.5 Courses content was appropriate for my degree level 1 1.1 4 4.3 11 12.0 51 55.4 25 27.2 92 4.0 The tuition I paid was a worthwhile investment 3 3.2 3 3.2 13 13.8 32 34.0 43 45.7 94 4.2 My professors challenged me to do my best work 1 1.1 7 7.4 19 20.2 40 42.6 27 28.7 94 3.9 I was an active learner (read assignments, contributed to class discussions, etc.) 1 1.1 3 3.2 9 9.7 38 40.9 42 45.2 93 4.3 Preparedness My program helped me get to where I want to be academically/ professionally 4 4.3 14 15.2 17 18.5 35 38.0 22 23.9 92 3.6
My degree enhanced my career opportunities 3 3.3 6 6.5 17 18.5 29 31.5 37 40.2 92 4.0 My program equipped me with skills required to perform competently in my field 3 3.3 6 6.6 17 18.7 41 45.1 24 26.4 91 3.8 My program enabled me to perform more effectively in my profession 4 4.3 7 7.6 20 21.7 37 40.2 24 26.1 92 3.8 My studies at MSU provided sufficient preparation for the career I actually entered 4 4.4 12 13.3 20 22.2 34 37.8 20 22.2 90 3.6 The education I received at MSU is relevant to the duties I perform in my workplace 7 7.7 8 8.8 19 20.9 39 42.9 18 19.8 91 3.6 Participation in campus activities was an important part of my education 22 24.7 25 28.1 22 24.7 11 12.4 9 10.1 89 2.6
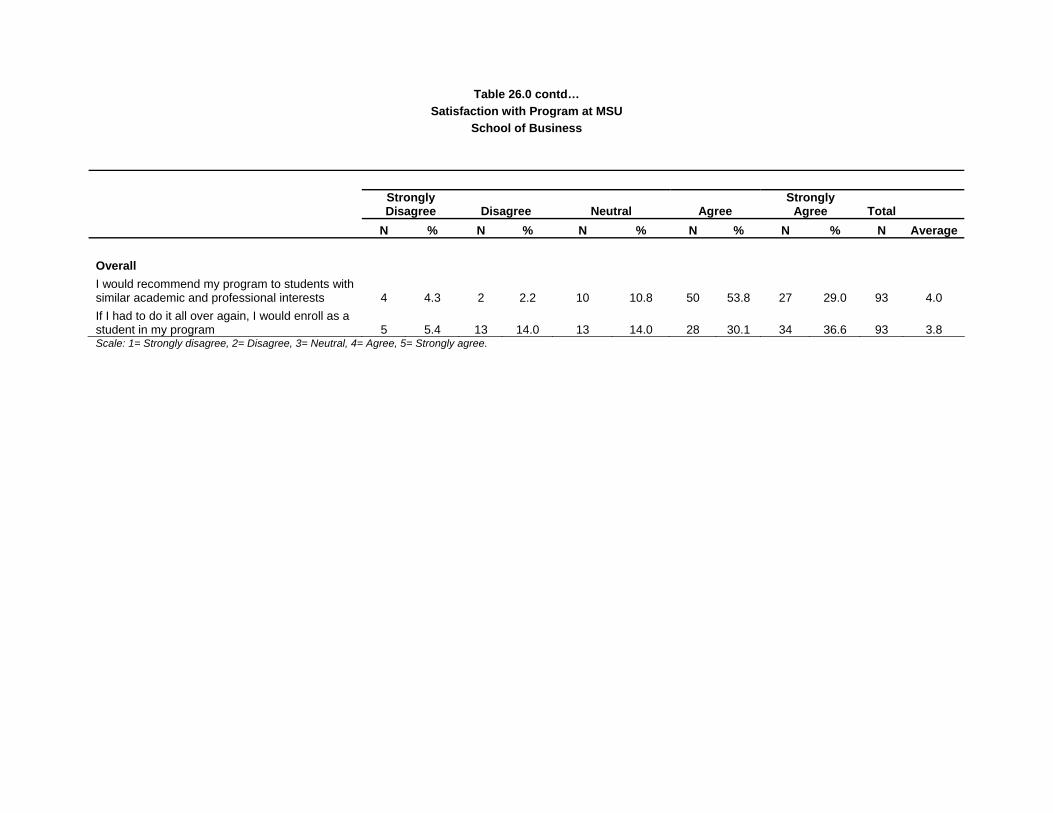
Table 26.0 contd…
Satisfaction with Program at MSU School of Business
Strongly Disagree Disagree Neutral Agree
Strongly Agree Total
N % N % N % N % N % N Average Overall I would recommend my program to students with similar academic and professional interests 4 4.3 2 2.2 10 10.8 50 53.8 27 29.0 93 4.0 If I had to do it all over again, I would enroll as a student in my program 5 5.4 13 14.0 13 14.0 28 30.1 34 36.6 93 3.8 Scale: 1= Strongly disagree, 2= Disagree, 3= Neutral, 4= Agree, 5= Strongly agree.

Table 26.0 contd…
Satisfaction with Program at MSU College of Education and Human Services
Strongly Disagree Disagree Neutral Agree
Strongly Agree Total
N % N % N % N % N % N Average Quality of Program The quality of instruction (education) in my major courses was excellent 1 1.5 4 5.9 9 13.2 27 39.7 27 39.7 68 4.1 The quality of instruction in my General Education Courses was excellent 1 1.5 11 16.9 18 27.7 29 44.6 6 9.2 65 3.4 I was satisfied with the academic advisement provided by my department 3 4.4 15 22.1 10 14.7 27 39.7 13 19.1 68 3.5 There was good exposure to current development in my field. 3 4.5 10 14.9 13 19.4 21 31.3 20 29.9 67 3.7 Courses content was appropriate for my degree level 0.0 2 3.0 11 16.4 32 47.8 22 32.8 67 4.1 The tuition I paid was a worthwhile investment 1 1.5 2 3.0 10 15.2 31 47.0 22 33.3 66 4.1 My professors challenged me to do my best work 1 1.5 7 10.6 6 9.1 33 50.0 19 28.8 66 3.9 I was an active learner (read assignments, contributed to class discussions, etc.) 1 1.5 0.0 7 10.6 22 33.3 36 54.5 66 4.4 Preparedness My program helped me get to where I want to be academically/ professionally 3 4.5 4 6.0 8 11.9 26 38.8 26 38.8 67 4.0 My degree enhanced my career opportunities 2 3.0 3 4.5 8 11.9 22 32.8 32 47.8 67 4.2 My program equipped me with skills required to perform competently in my field 2 3.0 4 6.0 9 13.4 31 46.3 21 31.3 67 4.0 My program enabled me to perform more effectively in my profession 1 1.5 4 6.1 9 13.6 29 43.9 23 34.8 66 4.0 My studies at MSU provided sufficient preparation for the career I actually entered 1 1.5 5 7.5 12 17.9 29 43.3 20 29.9 67 3.9 The education I received at MSU is relevant to the duties I perform in my workplace 0.0 6 9.2 12 18.5 25 38.5 22 33.8 65 4.0 Participation in campus activities was an important part of my education 8 13.6 16 27.1 15 25.4 11 18.6 9 15.3 59 2.9
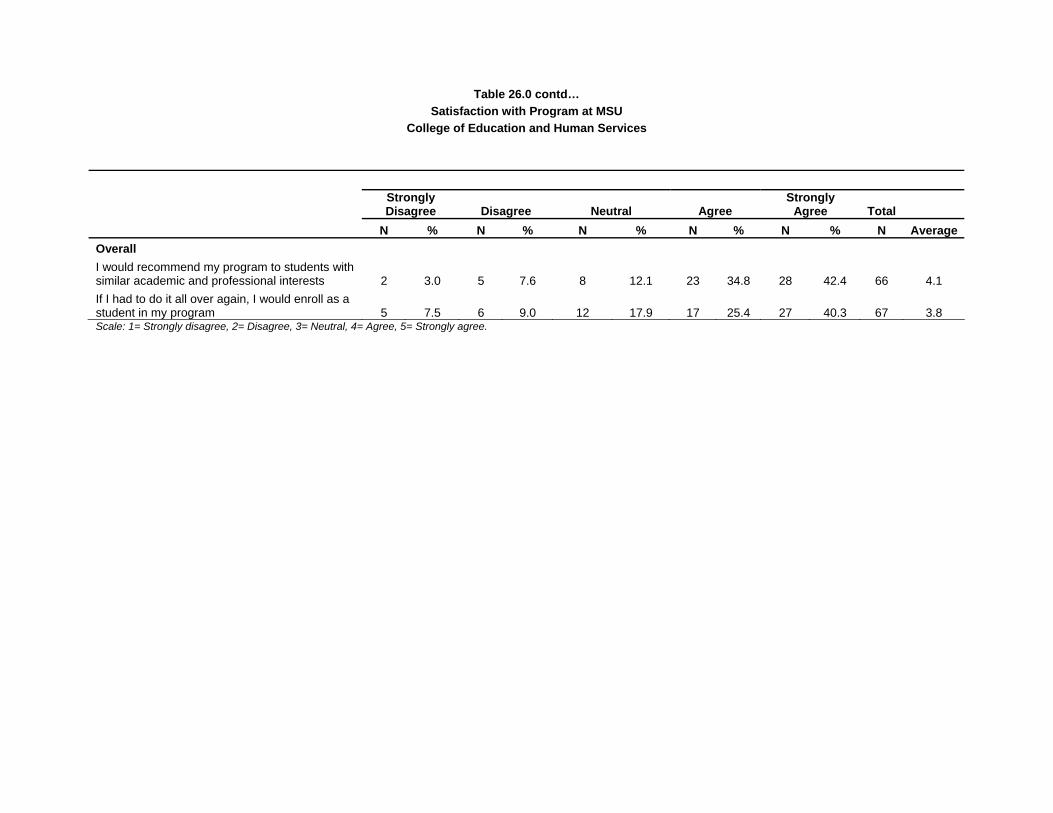
Table 26.0 contd…
Satisfaction with Program at MSU College of Education and Human Services
Strongly Disagree Disagree Neutral Agree
Strongly Agree Total
N % N % N % N % N % N Average Overall I would recommend my program to students with similar academic and professional interests 2 3.0 5 7.6 8 12.1 23 34.8 28 42.4 66 4.1 If I had to do it all over again, I would enroll as a student in my program 5 7.5 6 9.0 12 17.9 17 25.4 27 40.3 67 3.8 Scale: 1= Strongly disagree, 2= Disagree, 3= Neutral, 4= Agree, 5= Strongly agree.

Table 26.0 contd… Satisfaction with Program at MSU
College of Humanities and Social Science
Strongly Disagree Disagree Neutral Agree
Strongly Agree Total
N % N % N % N % N % N Average Quality of Program The quality of instruction (education) in my major courses was excellent 1 0.6 6 3.9 14 9.0 69 44.5 65 41.9 155 4.2 The quality of instruction in my General Education Courses was excellent 5 3.4 11 7.4 25 16.9 85 57.4 22 14.9 148 3.7 I was satisfied with the academic advisement provided by my department 19 12.3 21 13.5 31 20.0 48 31.0 36 23.2 155 3.4 There was good exposure to current development in my field. 11 7.4 18 12.1 32 21.5 60 40.3 28 18.8 149 3.5 Courses content was appropriate for my degree level 2 1.3 4 2.6 14 9.0 88 56.8 47 30.3 155 4.1 The tuition I paid was a worthwhile investment 7 4.5 3 1.9 27 17.5 63 40.9 54 35.1 154 4.0 My professors challenged me to do my best work 1 0.6 7 4.5 14 9.1 70 45.5 62 40.3 154 4.2 I was an active learner (read assignments, contributed to class discussions, etc.) 9 5.8 52 33.5 94 60.6 155 4.5 Preparedness My program helped me get to where I want to be academically/ professionally 5 3.3 16 10.6 42 27.8 56 37.1 32 21.2 151 3.6 My degree enhanced my career opportunities 8 5.3 14 9.2 34 22.4 57 37.5 39 25.7 152 3.7 My program equipped me with skills required to perform competently in my field 5 3.4 11 7.5 42 28.8 55 37.7 33 22.6 146 3.7 My program enabled me to perform more effectively in my profession 5 3.5 13 9.2 38 26.8 55 38.7 31 21.8 142 3.7 My studies at MSU provided sufficient preparation for the career I actually entered 10 7.2 20 14.5 39 28.3 46 33.3 23 16.7 138 3.4 The education I received at MSU is relevant to the duties I perform in my workplace 17 12.4 20 14.6 36 26.3 39 28.5 25 18.2 137 3.3 Participation in campus activities was an important part of my education 33 23.1 34 23.8 27 18.9 25 17.5 24 16.8 143 2.8 Overall

Table 26.0 contd… Satisfaction with Program at MSU
College of Humanities and Social Science
Strongly Disagree Disagree Neutral Agree
Strongly Agree Total
N % N % N % N % N % N Average I would recommend my program to students with similar academic and professional interests 7 4.5 4 2.6 33 21.4 67 43.5 43 27.9 154 3.9 If I had to do it all over again, I would enroll as a student in my program 9 5.9 21 13.7 26 17.0 45 29.4 52 34.0 153 3.7 Scale: 1= Strongly disagree, 2= Disagree, 3= Neutral, 4= Agree, 5= Strongly agree.
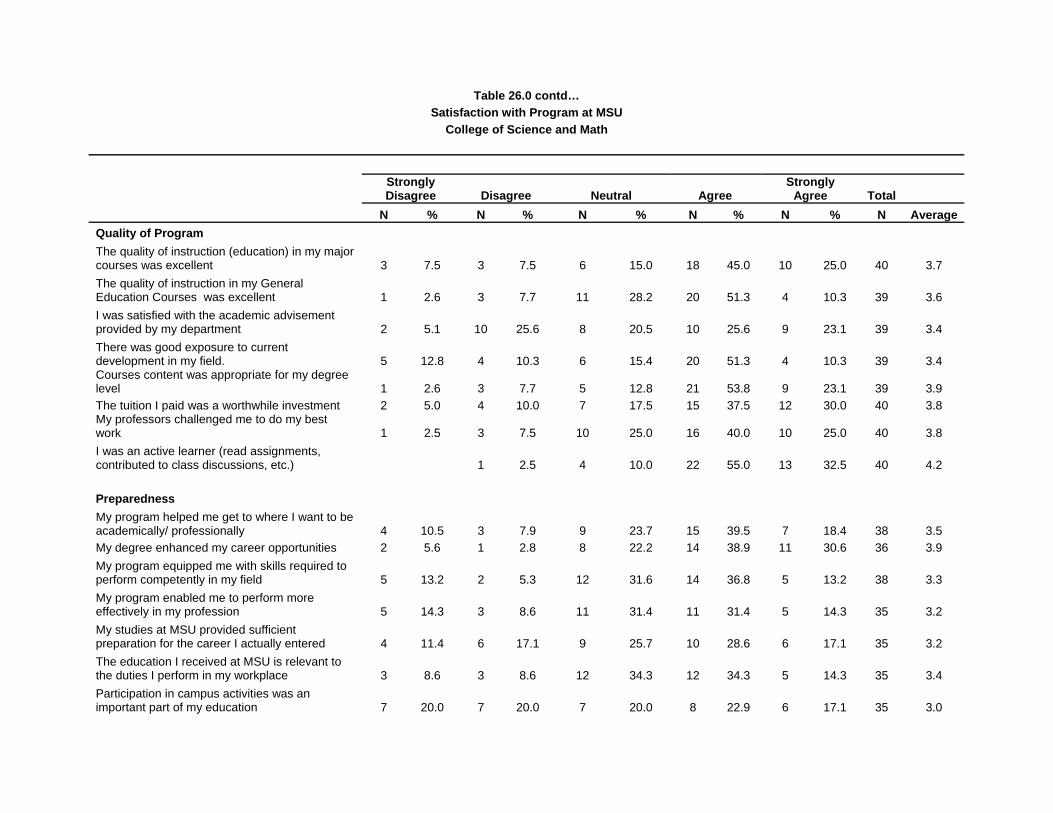
Table 26.0 contd…
Satisfaction with Program at MSU College of Science and Math
Strongly Disagree Disagree Neutral Agree
Strongly Agree Total
N % N % N % N % N % N Average Quality of Program The quality of instruction (education) in my major courses was excellent 3 7.5 3 7.5 6 15.0 18 45.0 10 25.0 40 3.7 The quality of instruction in my General Education Courses was excellent 1 2.6 3 7.7 11 28.2 20 51.3 4 10.3 39 3.6 I was satisfied with the academic advisement provided by my department 2 5.1 10 25.6 8 20.5 10 25.6 9 23.1 39 3.4 There was good exposure to current development in my field. 5 12.8 4 10.3 6 15.4 20 51.3 4 10.3 39 3.4 Courses content was appropriate for my degree level 1 2.6 3 7.7 5 12.8 21 53.8 9 23.1 39 3.9 The tuition I paid was a worthwhile investment 2 5.0 4 10.0 7 17.5 15 37.5 12 30.0 40 3.8 My professors challenged me to do my best work 1 2.5 3 7.5 10 25.0 16 40.0 10 25.0 40 3.8 I was an active learner (read assignments, contributed to class discussions, etc.) 1 2.5 4 10.0 22 55.0 13 32.5 40 4.2 Preparedness My program helped me get to where I want to be academically/ professionally 4 10.5 3 7.9 9 23.7 15 39.5 7 18.4 38 3.5 My degree enhanced my career opportunities 2 5.6 1 2.8 8 22.2 14 38.9 11 30.6 36 3.9 My program equipped me with skills required to perform competently in my field 5 13.2 2 5.3 12 31.6 14 36.8 5 13.2 38 3.3 My program enabled me to perform more effectively in my profession 5 14.3 3 8.6 11 31.4 11 31.4 5 14.3 35 3.2 My studies at MSU provided sufficient preparation for the career I actually entered 4 11.4 6 17.1 9 25.7 10 28.6 6 17.1 35 3.2 The education I received at MSU is relevant to the duties I perform in my workplace 3 8.6 3 8.6 12 34.3 12 34.3 5 14.3 35 3.4 Participation in campus activities was an important part of my education 7 20.0 7 20.0 7 20.0 8 22.9 6 17.1 35 3.0

Table 26.0 contd… Satisfaction with Program at MSU
College of Science and Math
Strongly Disagree Disagree Neutral Agree
Strongly Agree Total
N % N % N % N % N % N Average Overall I would recommend my program to students with similar academic and professional interests 7 17.5 2 5.0 4 10.0 17 42.5 10 25.0 40 3.5 If I had to do it all over again, I would enroll as a student in my program 6 15.0 4 10.0 5 12.5 15 37.5 10 25.0 40 3.5 Scale: 1= Strongly disagree, 2= Disagree, 3= Neutral, 4= Agree, 5= Strongly agree.
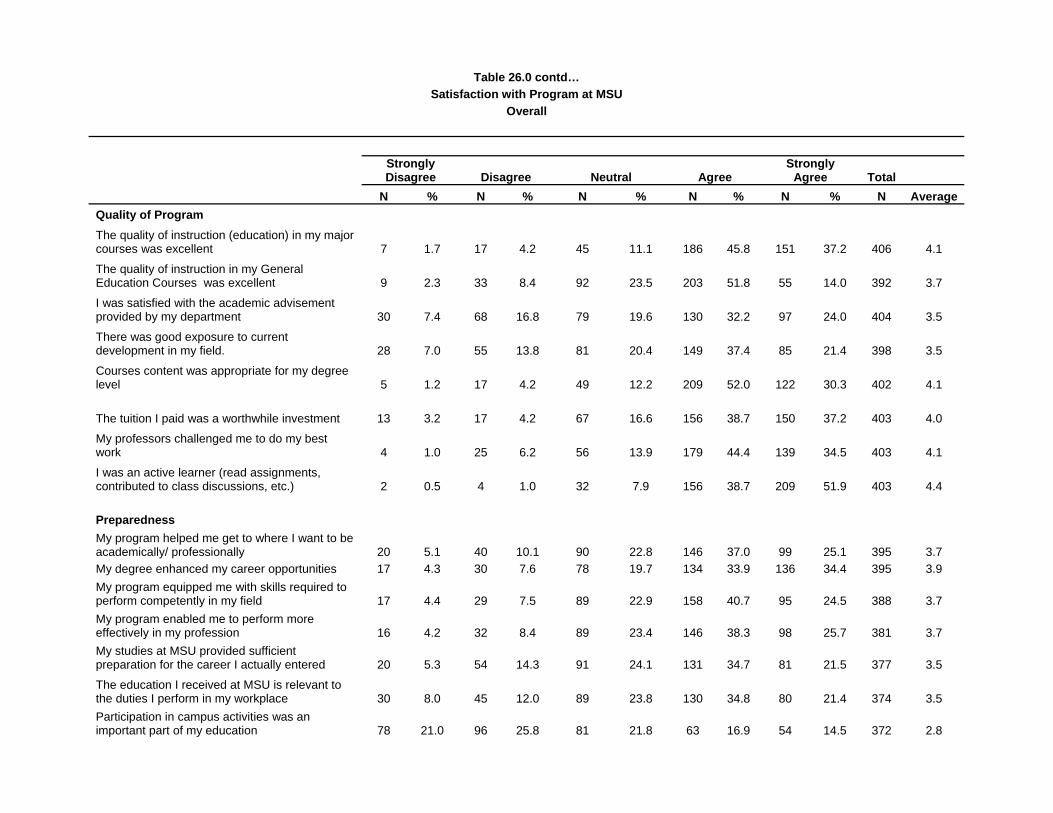
Table 26.0 contd… Satisfaction with Program at MSU
Overall
Strongly Disagree Disagree Neutral Agree
Strongly Agree Total
N % N % N % N % N % N Average Quality of Program
The quality of instruction (education) in my major courses was excellent 7 1.7 17 4.2 45 11.1 186 45.8 151 37.2 406 4.1
The quality of instruction in my General Education Courses was excellent 9 2.3 33 8.4 92 23.5 203 51.8 55 14.0 392 3.7
I was satisfied with the academic advisement provided by my department 30 7.4 68 16.8 79 19.6 130 32.2 97 24.0 404 3.5
There was good exposure to current development in my field. 28 7.0 55 13.8 81 20.4 149 37.4 85 21.4 398 3.5
Courses content was appropriate for my degree level 5 1.2 17 4.2 49 12.2 209 52.0 122 30.3 402 4.1
The tuition I paid was a worthwhile investment 13 3.2 17 4.2 67 16.6 156 38.7 150 37.2 403 4.0
My professors challenged me to do my best work 4 1.0 25 6.2 56 13.9 179 44.4 139 34.5 403 4.1
I was an active learner (read assignments, contributed to class discussions, etc.) 2 0.5 4 1.0 32 7.9 156 38.7 209 51.9 403 4.4 Preparedness My program helped me get to where I want to be academically/ professionally 20 5.1 40 10.1 90 22.8 146 37.0 99 25.1 395 3.7 My degree enhanced my career opportunities 17 4.3 30 7.6 78 19.7 134 33.9 136 34.4 395 3.9 My program equipped me with skills required to perform competently in my field 17 4.4 29 7.5 89 22.9 158 40.7 95 24.5 388 3.7 My program enabled me to perform more effectively in my profession 16 4.2 32 8.4 89 23.4 146 38.3 98 25.7 381 3.7 My studies at MSU provided sufficient preparation for the career I actually entered 20 5.3 54 14.3 91 24.1 131 34.7 81 21.5 377 3.5
The education I received at MSU is relevant to the duties I perform in my workplace 30 8.0 45 12.0 89 23.8 130 34.8 80 21.4 374 3.5 Participation in campus activities was an important part of my education 78 21.0 96 25.8 81 21.8 63 16.9 54 14.5 372 2.8
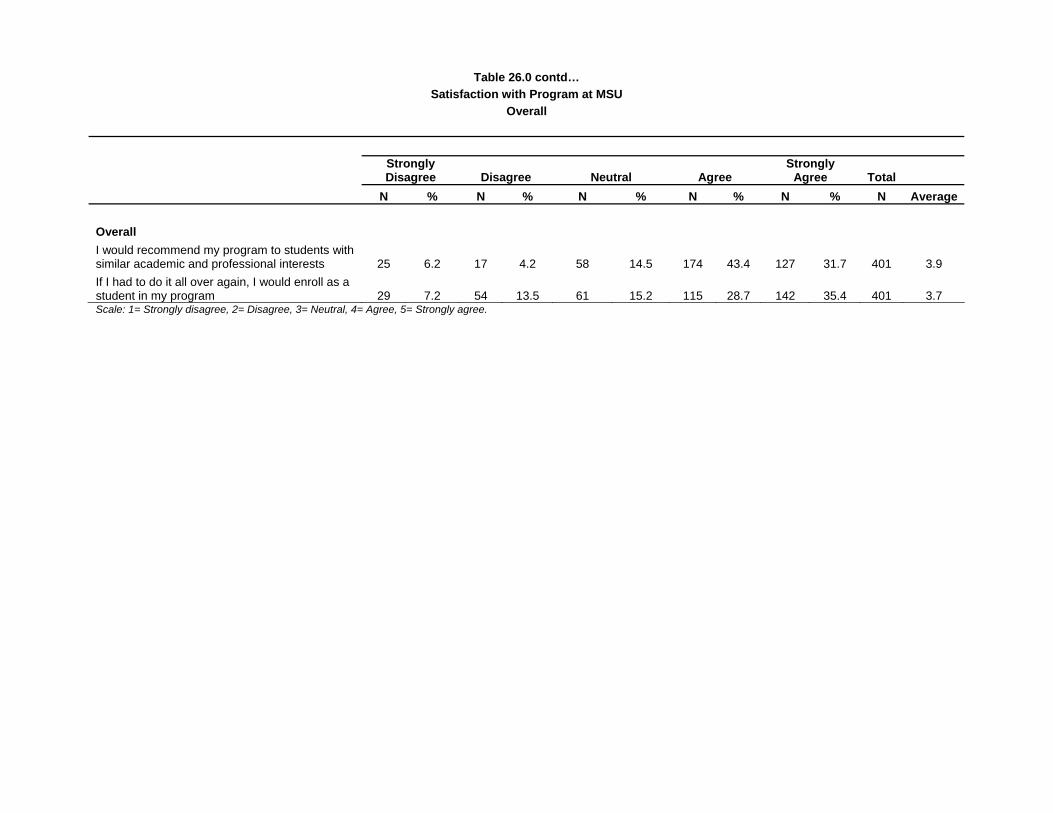
Table 26.0 contd… Satisfaction with Program at MSU
Overall
Strongly Disagree Disagree Neutral Agree
Strongly Agree Total
N % N % N % N % N % N Average Overall I would recommend my program to students with similar academic and professional interests 25 6.2 17 4.2 58 14.5 174 43.4 127 31.7 401 3.9 If I had to do it all over again, I would enroll as a student in my program 29 7.2 54 13.5 61 15.2 115 28.7 142 35.4 401 3.7 Scale: 1= Strongly disagree, 2= Disagree, 3= Neutral, 4= Agree, 5= Strongly agree.
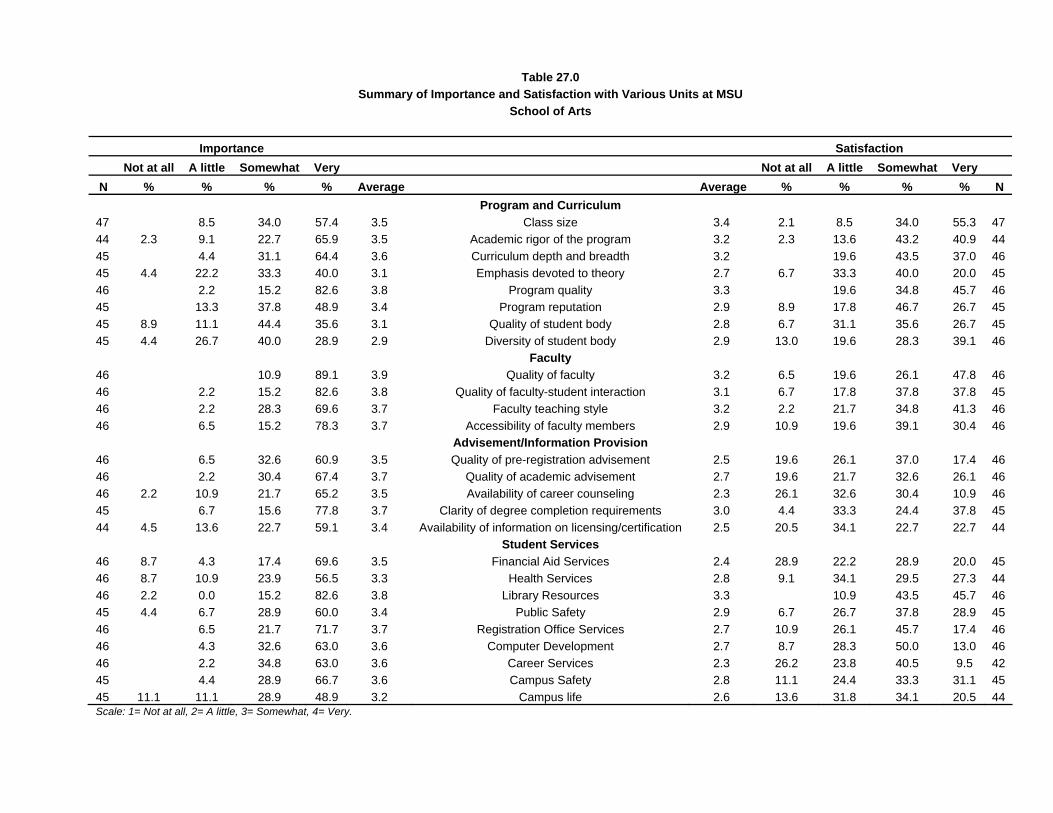
Table 27.0 Summary of Importance and Satisfaction with Various Units at MSU
School of Arts Importance Satisfaction Not at all A little Somewhat Very Not at all A little Somewhat Very
N % % % % Average Average % % % % N Program and Curriculum 47 8.5 34.0 57.4 3.5 Class size 3.4 2.1 8.5 34.0 55.3 47 44 2.3 9.1 22.7 65.9 3.5 Academic rigor of the program 3.2 2.3 13.6 43.2 40.9 44 45 4.4 31.1 64.4 3.6 Curriculum depth and breadth 3.2 19.6 43.5 37.0 46 45 4.4 22.2 33.3 40.0 3.1 Emphasis devoted to theory 2.7 6.7 33.3 40.0 20.0 45 46 2.2 15.2 82.6 3.8 Program quality 3.3 19.6 34.8 45.7 46 45 13.3 37.8 48.9 3.4 Program reputation 2.9 8.9 17.8 46.7 26.7 45 45 8.9 11.1 44.4 35.6 3.1 Quality of student body 2.8 6.7 31.1 35.6 26.7 45 45 4.4 26.7 40.0 28.9 2.9 Diversity of student body 2.9 13.0 19.6 28.3 39.1 46 Faculty
46 10.9 89.1 3.9 Quality of faculty 3.2 6.5 19.6 26.1 47.8 46 46 2.2 15.2 82.6 3.8 Quality of faculty-student interaction 3.1 6.7 17.8 37.8 37.8 45 46 2.2 28.3 69.6 3.7 Faculty teaching style 3.2 2.2 21.7 34.8 41.3 46 46 6.5 15.2 78.3 3.7 Accessibility of faculty members 2.9 10.9 19.6 39.1 30.4 46 Advisement/Information Provision
46 6.5 32.6 60.9 3.5 Quality of pre-registration advisement 2.5 19.6 26.1 37.0 17.4 46 46 2.2 30.4 67.4 3.7 Quality of academic advisement 2.7 19.6 21.7 32.6 26.1 46 46 2.2 10.9 21.7 65.2 3.5 Availability of career counseling 2.3 26.1 32.6 30.4 10.9 46 45 6.7 15.6 77.8 3.7 Clarity of degree completion requirements 3.0 4.4 33.3 24.4 37.8 45 44 4.5 13.6 22.7 59.1 3.4 Availability of information on licensing/certification 2.5 20.5 34.1 22.7 22.7 44 Student Services
46 8.7 4.3 17.4 69.6 3.5 Financial Aid Services 2.4 28.9 22.2 28.9 20.0 45 46 8.7 10.9 23.9 56.5 3.3 Health Services 2.8 9.1 34.1 29.5 27.3 44 46 2.2 0.0 15.2 82.6 3.8 Library Resources 3.3 10.9 43.5 45.7 46 45 4.4 6.7 28.9 60.0 3.4 Public Safety 2.9 6.7 26.7 37.8 28.9 45 46 6.5 21.7 71.7 3.7 Registration Office Services 2.7 10.9 26.1 45.7 17.4 46 46 4.3 32.6 63.0 3.6 Computer Development 2.7 8.7 28.3 50.0 13.0 46 46 2.2 34.8 63.0 3.6 Career Services 2.3 26.2 23.8 40.5 9.5 42 45 4.4 28.9 66.7 3.6 Campus Safety 2.8 11.1 24.4 33.3 31.1 45 45 11.1 11.1 28.9 48.9 3.2 Campus life 2.6 13.6 31.8 34.1 20.5 44 Scale: 1= Not at all, 2= A little, 3= Somewhat, 4= Very.
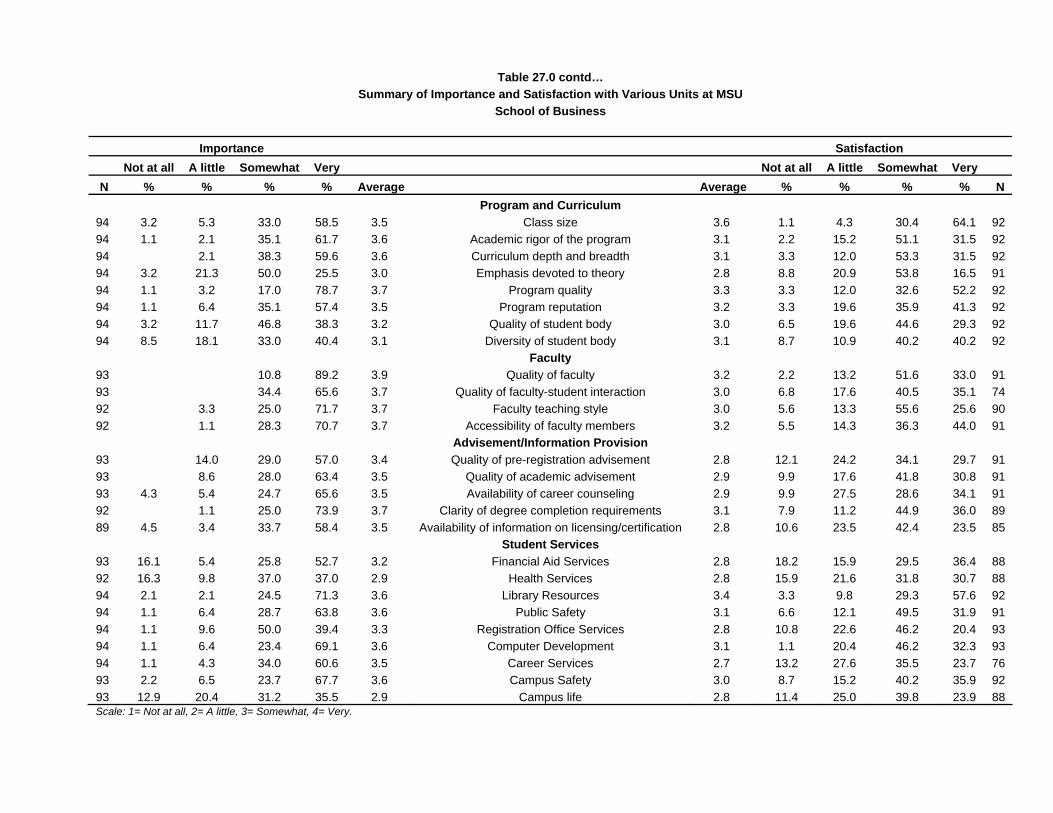
Table 27.0 contd… Summary of Importance and Satisfaction with Various Units at MSU
School of Business Importance Satisfaction Not at all A little Somewhat Very Not at all A little Somewhat Very
N % % % % Average Average % % % % N Program and Curriculum
94 3.2 5.3 33.0 58.5 3.5 Class size 3.6 1.1 4.3 30.4 64.1 92 94 1.1 2.1 35.1 61.7 3.6 Academic rigor of the program 3.1 2.2 15.2 51.1 31.5 92 94 2.1 38.3 59.6 3.6 Curriculum depth and breadth 3.1 3.3 12.0 53.3 31.5 92 94 3.2 21.3 50.0 25.5 3.0 Emphasis devoted to theory 2.8 8.8 20.9 53.8 16.5 91 94 1.1 3.2 17.0 78.7 3.7 Program quality 3.3 3.3 12.0 32.6 52.2 92 94 1.1 6.4 35.1 57.4 3.5 Program reputation 3.2 3.3 19.6 35.9 41.3 92 94 3.2 11.7 46.8 38.3 3.2 Quality of student body 3.0 6.5 19.6 44.6 29.3 92 94 8.5 18.1 33.0 40.4 3.1 Diversity of student body 3.1 8.7 10.9 40.2 40.2 92 Faculty
93 10.8 89.2 3.9 Quality of faculty 3.2 2.2 13.2 51.6 33.0 91 93 34.4 65.6 3.7 Quality of faculty-student interaction 3.0 6.8 17.6 40.5 35.1 74 92 3.3 25.0 71.7 3.7 Faculty teaching style 3.0 5.6 13.3 55.6 25.6 90 92 1.1 28.3 70.7 3.7 Accessibility of faculty members 3.2 5.5 14.3 36.3 44.0 91 Advisement/Information Provision
93 14.0 29.0 57.0 3.4 Quality of pre-registration advisement 2.8 12.1 24.2 34.1 29.7 91 93 8.6 28.0 63.4 3.5 Quality of academic advisement 2.9 9.9 17.6 41.8 30.8 91 93 4.3 5.4 24.7 65.6 3.5 Availability of career counseling 2.9 9.9 27.5 28.6 34.1 91 92 1.1 25.0 73.9 3.7 Clarity of degree completion requirements 3.1 7.9 11.2 44.9 36.0 89 89 4.5 3.4 33.7 58.4 3.5 Availability of information on licensing/certification 2.8 10.6 23.5 42.4 23.5 85 Student Services
93 16.1 5.4 25.8 52.7 3.2 Financial Aid Services 2.8 18.2 15.9 29.5 36.4 88 92 16.3 9.8 37.0 37.0 2.9 Health Services 2.8 15.9 21.6 31.8 30.7 88 94 2.1 2.1 24.5 71.3 3.6 Library Resources 3.4 3.3 9.8 29.3 57.6 92 94 1.1 6.4 28.7 63.8 3.6 Public Safety 3.1 6.6 12.1 49.5 31.9 91 94 1.1 9.6 50.0 39.4 3.3 Registration Office Services 2.8 10.8 22.6 46.2 20.4 93 94 1.1 6.4 23.4 69.1 3.6 Computer Development 3.1 1.1 20.4 46.2 32.3 93 94 1.1 4.3 34.0 60.6 3.5 Career Services 2.7 13.2 27.6 35.5 23.7 76 93 2.2 6.5 23.7 67.7 3.6 Campus Safety 3.0 8.7 15.2 40.2 35.9 92 93 12.9 20.4 31.2 35.5 2.9 Campus life 2.8 11.4 25.0 39.8 23.9 88 Scale: 1= Not at all, 2= A little, 3= Somewhat, 4= Very.

Table 27.0 contd… Summary of Importance and Satisfaction with Various Units at MSU
College of Education and Human Services Importance Satisfaction Not at all A little Somewhat Very Not at all A little Somewhat Very
N % % % % Average Average % % % % N Program and Curriculum
68 5.9 2.9 29.4 61.8 3.5 Class size 3.5 1.5 2.9 36.8 58.8 68 67 4.5 38.8 56.7 3.5 Academic rigor of the program 3.0 2.9 19.1 48.5 29.4 68 68 4.4 35.3 60.3 3.6 Curriculum depth and breadth 3.1 4.5 14.9 43.3 37.3 67 67 6.0 25.4 50.7 17.9 2.8 Emphasis devoted to theory 2.7 11.9 23.9 47.8 16.4 67 66 6.1 24.2 69.7 3.6 Program quality 3.3 1.5 14.7 32.4 51.5 68 66 1.5 9.1 34.8 54.5 3.4 Program reputation 3.2 6.0 14.9 34.3 44.8 67 67 3.0 11.9 40.3 44.8 3.3 Quality of student body 3.0 4.5 17.9 47.8 29.9 67 67 3.0 20.9 28.4 47.8 3.2 Diversity of student body 3.4 1.5 14.9 29.9 53.7 67 Faculty
67 0.0 14.9 85.1 3.9 Quality of faculty 3.1 2.9 16.2 50.0 30.9 68 67 7.5 19.4 73.1 3.7 Quality of faculty-student interaction 2.9 6.3 23.8 39.7 30.2 63 66 1.5 4.5 19.7 74.2 3.7 Faculty teaching style 3.1 1.5 14.7 52.9 30.9 68 65 7.7 21.5 70.8 3.6 Accessibility of faculty members 3.0 4.4 17.6 48.5 29.4 68 Advisement/Information Provision
67 1.5 3.0 23.9 71.6 3.7 Quality of pre-registration advisement 2.7 13.4 28.4 34.3 23.9 67 67 1.5 1.5 23.9 73.1 3.7 Quality of academic advisement 2.6 20.9 20.9 37.3 20.9 67 67 3.0 7.5 26.9 62.7 3.5 Availability of career counseling 2.6 20.9 22.4 29.9 26.9 67 68 2.9 23.5 73.5 3.7 Clarity of degree completion requirements 2.8 10.3 23.5 38.2 27.9 68 68 2.9 2.9 19.1 75.0 3.7 Availability of information on licensing/certification 2.8 11.8 19.1 42.6 26.5 68 Student Services
65 9.2 13.8 18.5 58.5 3.3 Financial Aid Services 2.6 13.1 27.9 41.0 18.0 61 67 10.4 11.9 23.9 53.7 3.2 Health Services 2.9 13.4 17.9 37.3 31.3 67 68 1.5 8.8 22.1 67.6 3.6 Library Resources 3.3 1.5 8.8 44.1 45.6 68 67 1.5 10.4 20.9 67.2 3.5 Public Safety 3.0 7.5 17.9 43.3 31.3 67 68 7.4 27.9 64.7 3.6 Registration Office Services 2.7 9.0 25.4 47.8 17.9 67 67 1.5 11.9 26.9 59.7 3.4 Computer Development 2.9 4.5 23.9 47.8 23.9 67 67 6.0 13.4 28.4 52.2 3.3 Career Services 2.5 14.8 29.5 44.3 11.5 61 67 0.0 7.5 20.9 71.6 3.6 Campus Safety 3.0 6.0 17.9 44.8 31.3 67 67 17.9 16.4 23.9 41.8 2.9 Campus life 2.6 20.0 20.0 41.5 18.5 65 Scale: 1= Not at all, 2= A little, 3= Somewhat, 4= Very.
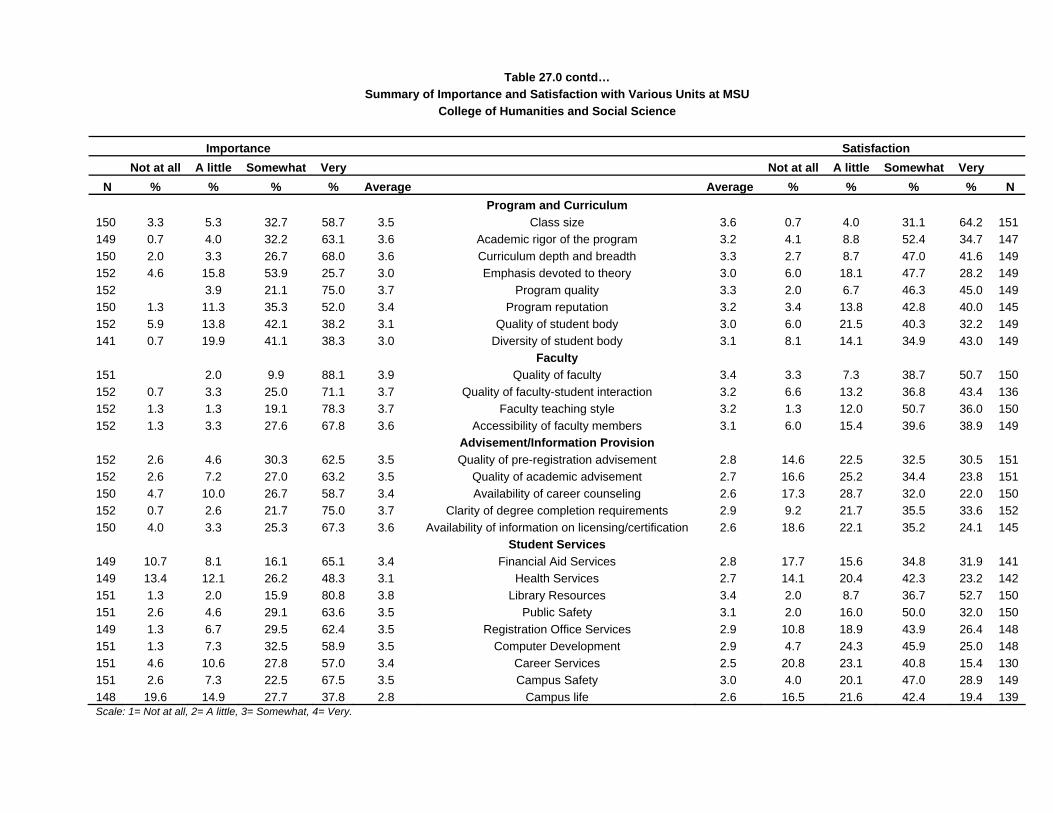
Table 27.0 contd… Summary of Importance and Satisfaction with Various Units at MSU
College of Humanities and Social Science Importance Satisfaction Not at all A little Somewhat Very Not at all A little Somewhat Very
N % % % % Average Average % % % % N Program and Curriculum
150 3.3 5.3 32.7 58.7 3.5 Class size 3.6 0.7 4.0 31.1 64.2 151 149 0.7 4.0 32.2 63.1 3.6 Academic rigor of the program 3.2 4.1 8.8 52.4 34.7 147 150 2.0 3.3 26.7 68.0 3.6 Curriculum depth and breadth 3.3 2.7 8.7 47.0 41.6 149 152 4.6 15.8 53.9 25.7 3.0 Emphasis devoted to theory 3.0 6.0 18.1 47.7 28.2 149 152 3.9 21.1 75.0 3.7 Program quality 3.3 2.0 6.7 46.3 45.0 149 150 1.3 11.3 35.3 52.0 3.4 Program reputation 3.2 3.4 13.8 42.8 40.0 145 152 5.9 13.8 42.1 38.2 3.1 Quality of student body 3.0 6.0 21.5 40.3 32.2 149 141 0.7 19.9 41.1 38.3 3.0 Diversity of student body 3.1 8.1 14.1 34.9 43.0 149
Faculty 151 2.0 9.9 88.1 3.9 Quality of faculty 3.4 3.3 7.3 38.7 50.7 150 152 0.7 3.3 25.0 71.1 3.7 Quality of faculty-student interaction 3.2 6.6 13.2 36.8 43.4 136 152 1.3 1.3 19.1 78.3 3.7 Faculty teaching style 3.2 1.3 12.0 50.7 36.0 150 152 1.3 3.3 27.6 67.8 3.6 Accessibility of faculty members 3.1 6.0 15.4 39.6 38.9 149
Advisement/Information Provision 152 2.6 4.6 30.3 62.5 3.5 Quality of pre-registration advisement 2.8 14.6 22.5 32.5 30.5 151 152 2.6 7.2 27.0 63.2 3.5 Quality of academic advisement 2.7 16.6 25.2 34.4 23.8 151 150 4.7 10.0 26.7 58.7 3.4 Availability of career counseling 2.6 17.3 28.7 32.0 22.0 150 152 0.7 2.6 21.7 75.0 3.7 Clarity of degree completion requirements 2.9 9.2 21.7 35.5 33.6 152 150 4.0 3.3 25.3 67.3 3.6 Availability of information on licensing/certification 2.6 18.6 22.1 35.2 24.1 145
Student Services 149 10.7 8.1 16.1 65.1 3.4 Financial Aid Services 2.8 17.7 15.6 34.8 31.9 141 149 13.4 12.1 26.2 48.3 3.1 Health Services 2.7 14.1 20.4 42.3 23.2 142 151 1.3 2.0 15.9 80.8 3.8 Library Resources 3.4 2.0 8.7 36.7 52.7 150 151 2.6 4.6 29.1 63.6 3.5 Public Safety 3.1 2.0 16.0 50.0 32.0 150 149 1.3 6.7 29.5 62.4 3.5 Registration Office Services 2.9 10.8 18.9 43.9 26.4 148 151 1.3 7.3 32.5 58.9 3.5 Computer Development 2.9 4.7 24.3 45.9 25.0 148 151 4.6 10.6 27.8 57.0 3.4 Career Services 2.5 20.8 23.1 40.8 15.4 130 151 2.6 7.3 22.5 67.5 3.5 Campus Safety 3.0 4.0 20.1 47.0 28.9 149 148 19.6 14.9 27.7 37.8 2.8 Campus life 2.6 16.5 21.6 42.4 19.4 139 Scale: 1= Not at all, 2= A little, 3= Somewhat, 4= Very.

Table 27.0 contd…
Summary of Importance and Satisfaction with Various Units at MSU College of Science and Math
Importance Satisfaction Not at all A little Somewhat Very Not at all A little Somewhat Very
N % % % % Average Average % % % % N Program and Curriculum
40 2.5 42.5 55.0 3.5 Class size 3.5 2.6 38.5 59.0 39 39 5.1 30.8 64.1 3.6 Academic rigor of the program 2.9 2.6 25.6 48.7 23.1 39 39 2.6 20.5 76.9 3.7 Curriculum depth and breadth 3.1 2.6 23.1 41.0 33.3 39 38 26.3 39.5 34.2 3.1 Emphasis devoted to theory 2.8 5.1 25.6 51.3 17.9 39 40 2.5 7.5 90.0 3.9 Program quality 3.0 5.0 20.0 45.0 30.0 40 40 7.5 25.0 67.5 3.6 Program reputation 3.0 2.6 25.6 43.6 28.2 39 39 2.6 15.4 38.5 43.6 3.2 Quality of student body 3.2 17.9 48.7 33.3 39 40 5.0 22.5 37.5 35.0 3.0 Diversity of student body 3.3 2.5 15.0 32.5 50.0 40 Faculty
40 2.5 7.5 90.0 3.9 Quality of faculty 3.1 7.5 12.5 40.0 40.0 40 39 2.6 5.1 20.5 71.8 3.6 Quality of faculty-student interaction 3.1 5.9 17.6 35.3 41.2 34 40 2.5 7.5 20.0 70.0 3.6 Faculty teaching style 2.9 5.1 23.1 48.7 23.1 39 40 2.5 5.0 32.5 60.0 3.5 Accessibility of faculty members 3.2 5.0 10.0 47.5 37.5 40 Advisement/Information Provision
40 2.5 2.5 45.0 50.0 3.4 Quality of pre-registration advisement 2.6 15.4 25.6 38.5 20.5 39 40 2.5 7.5 32.5 57.5 3.5 Quality of academic advisement 2.7 10.3 30.8 41.0 17.9 39 40 2.5 10.0 30.0 57.5 3.4 Availability of career counseling 2.5 15.8 31.6 36.8 15.8 38 40 2.5 2.5 27.5 67.5 3.6 Clarity of degree completion requirements 2.9 5.3 28.9 34.2 31.6 38 40 7.5 12.5 20.0 60.0 3.3 Availability of information on licensing/certification 2.6 17.9 30.8 28.2 23.1 39 Student Services
38 5.3 13.2 18.4 63.2 3.4 Financial Aid Services 2.8 10.5 31.6 28.9 28.9 38 39 7.7 12.8 33.3 46.2 3.2 Health Services 2.8 7.9 28.9 36.8 26.3 38 40 2.5 5.0 30.0 62.5 3.5 Library Resources 3.3 2.5 12.5 40.0 45.0 40 39 5.1 2.6 30.8 61.5 3.5 Public Safety 3.2 2.6 17.9 38.5 41.0 39 39 2.6 7.7 30.8 59.0 3.5 Registration Office Services 2.7 10.0 30.0 37.5 22.5 40 39 2.6 7.7 25.6 64.1 3.5 Computer Development 2.7 10.3 28.2 41.0 20.5 39 39 2.6 7.7 38.5 51.3 3.4 Career Services 2.5 11.8 38.2 41.2 8.8 34 40 2.5 2.5 27.5 67.5 3.6 Campus Safety 3.0 5.0 12.5 57.5 25.0 40 40 7.5 35.0 17.5 40.0 2.9 Campus life 2.8 7.5 27.5 42.5 22.5 40 Scale: 1= Not at all, 2= A little, 3= Somewhat, 4= Very.
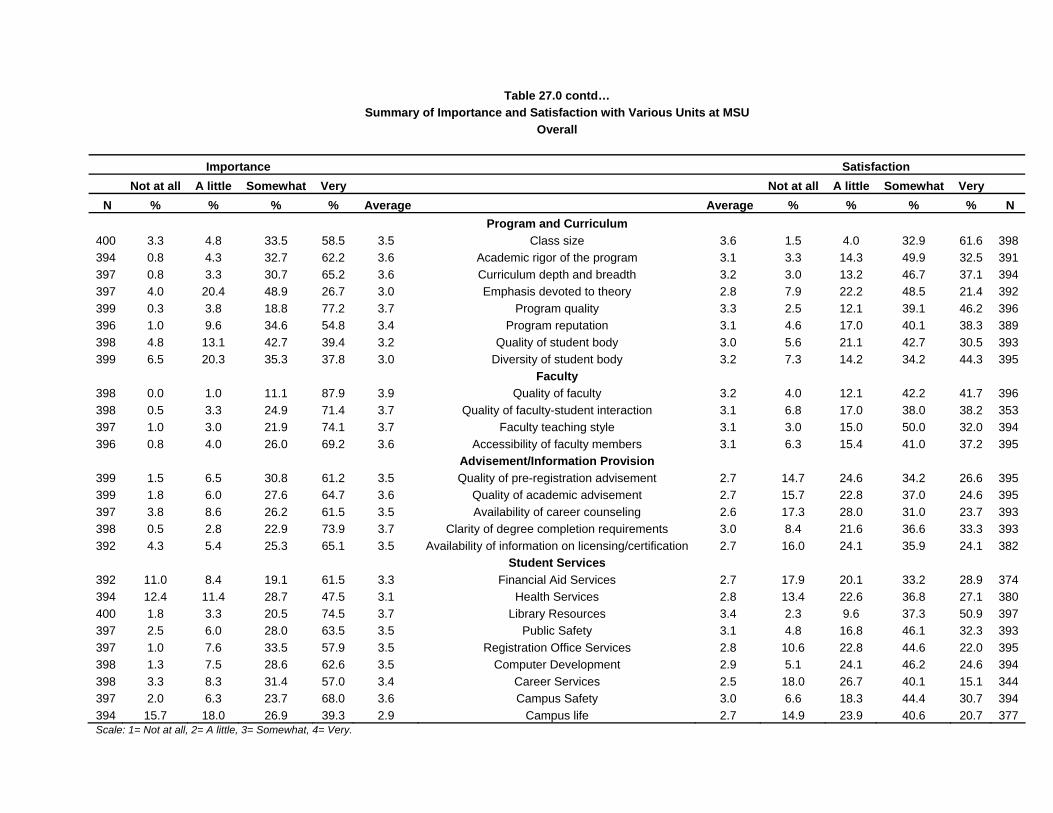
Table 27.0 contd…
Summary of Importance and Satisfaction with Various Units at MSU Overall
Importance Satisfaction Not at all A little Somewhat Very Not at all A little Somewhat Very
N % % % % Average Average % % % % N Program and Curriculum
400 3.3 4.8 33.5 58.5 3.5 Class size 3.6 1.5 4.0 32.9 61.6 398 394 0.8 4.3 32.7 62.2 3.6 Academic rigor of the program 3.1 3.3 14.3 49.9 32.5 391 397 0.8 3.3 30.7 65.2 3.6 Curriculum depth and breadth 3.2 3.0 13.2 46.7 37.1 394 397 4.0 20.4 48.9 26.7 3.0 Emphasis devoted to theory 2.8 7.9 22.2 48.5 21.4 392 399 0.3 3.8 18.8 77.2 3.7 Program quality 3.3 2.5 12.1 39.1 46.2 396 396 1.0 9.6 34.6 54.8 3.4 Program reputation 3.1 4.6 17.0 40.1 38.3 389 398 4.8 13.1 42.7 39.4 3.2 Quality of student body 3.0 5.6 21.1 42.7 30.5 393 399 6.5 20.3 35.3 37.8 3.0 Diversity of student body 3.2 7.3 14.2 34.2 44.3 395
Faculty 398 0.0 1.0 11.1 87.9 3.9 Quality of faculty 3.2 4.0 12.1 42.2 41.7 396 398 0.5 3.3 24.9 71.4 3.7 Quality of faculty-student interaction 3.1 6.8 17.0 38.0 38.2 353 397 1.0 3.0 21.9 74.1 3.7 Faculty teaching style 3.1 3.0 15.0 50.0 32.0 394 396 0.8 4.0 26.0 69.2 3.6 Accessibility of faculty members 3.1 6.3 15.4 41.0 37.2 395
Advisement/Information Provision 399 1.5 6.5 30.8 61.2 3.5 Quality of pre-registration advisement 2.7 14.7 24.6 34.2 26.6 395 399 1.8 6.0 27.6 64.7 3.6 Quality of academic advisement 2.7 15.7 22.8 37.0 24.6 395 397 3.8 8.6 26.2 61.5 3.5 Availability of career counseling 2.6 17.3 28.0 31.0 23.7 393 398 0.5 2.8 22.9 73.9 3.7 Clarity of degree completion requirements 3.0 8.4 21.6 36.6 33.3 393 392 4.3 5.4 25.3 65.1 3.5 Availability of information on licensing/certification 2.7 16.0 24.1 35.9 24.1 382
Student Services 392 11.0 8.4 19.1 61.5 3.3 Financial Aid Services 2.7 17.9 20.1 33.2 28.9 374 394 12.4 11.4 28.7 47.5 3.1 Health Services 2.8 13.4 22.6 36.8 27.1 380 400 1.8 3.3 20.5 74.5 3.7 Library Resources 3.4 2.3 9.6 37.3 50.9 397 397 2.5 6.0 28.0 63.5 3.5 Public Safety 3.1 4.8 16.8 46.1 32.3 393 397 1.0 7.6 33.5 57.9 3.5 Registration Office Services 2.8 10.6 22.8 44.6 22.0 395 398 1.3 7.5 28.6 62.6 3.5 Computer Development 2.9 5.1 24.1 46.2 24.6 394 398 3.3 8.3 31.4 57.0 3.4 Career Services 2.5 18.0 26.7 40.1 15.1 344 397 2.0 6.3 23.7 68.0 3.6 Campus Safety 3.0 6.6 18.3 44.4 30.7 394 394 15.7 18.0 26.9 39.3 2.9 Campus life 2.7 14.9 23.9 40.6 20.7 377 Scale: 1= Not at all, 2= A little, 3= Somewhat, 4= Very.
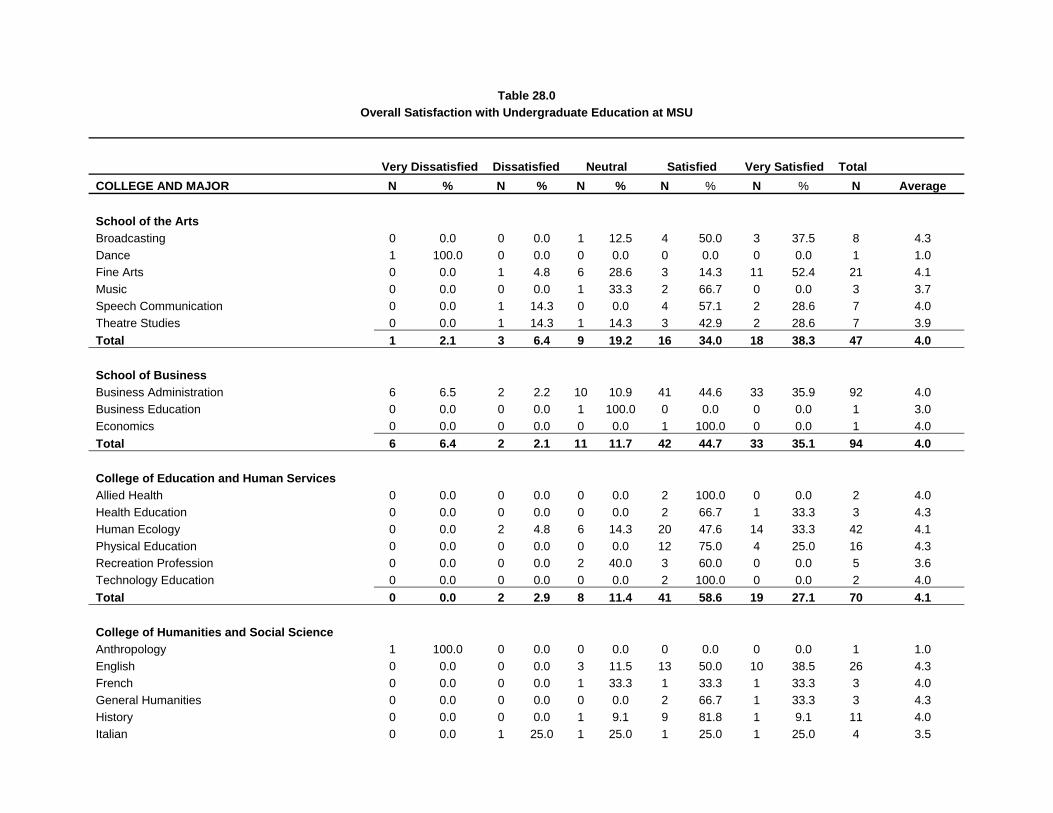
Table 28.0
Overall Satisfaction with Undergraduate Education at MSU Very Dissatisfied Dissatisfied Neutral Satisfied Very Satisfied Total COLLEGE AND MAJOR N % N % N % N % N % N Average School of the Arts Broadcasting 0 0.0 0 0.0 1 12.5 4 50.0 3 37.5 8 4.3 Dance 1 100.0 0 0.0 0 0.0 0 0.0 0 0.0 1 1.0 Fine Arts 0 0.0 1 4.8 6 28.6 3 14.3 11 52.4 21 4.1 Music 0 0.0 0 0.0 1 33.3 2 66.7 0 0.0 3 3.7 Speech Communication 0 0.0 1 14.3 0 0.0 4 57.1 2 28.6 7 4.0 Theatre Studies 0 0.0 1 14.3 1 14.3 3 42.9 2 28.6 7 3.9 Total 1 2.1 3 6.4 9 19.2 16 34.0 18 38.3 47 4.0 School of Business Business Administration 6 6.5 2 2.2 10 10.9 41 44.6 33 35.9 92 4.0 Business Education 0 0.0 0 0.0 1 100.0 0 0.0 0 0.0 1 3.0 Economics 0 0.0 0 0.0 0 0.0 1 100.0 0 0.0 1 4.0 Total 6 6.4 2 2.1 11 11.7 42 44.7 33 35.1 94 4.0 College of Education and Human Services Allied Health 0 0.0 0 0.0 0 0.0 2 100.0 0 0.0 2 4.0 Health Education 0 0.0 0 0.0 0 0.0 2 66.7 1 33.3 3 4.3 Human Ecology 0 0.0 2 4.8 6 14.3 20 47.6 14 33.3 42 4.1 Physical Education 0 0.0 0 0.0 0 0.0 12 75.0 4 25.0 16 4.3 Recreation Profession 0 0.0 0 0.0 2 40.0 3 60.0 0 0.0 5 3.6 Technology Education 0 0.0 0 0.0 0 0.0 2 100.0 0 0.0 2 4.0 Total 0 0.0 2 2.9 8 11.4 41 58.6 19 27.1 70 4.1 College of Humanities and Social Science Anthropology 1 100.0 0 0.0 0 0.0 0 0.0 0 0.0 1 1.0 English 0 0.0 0 0.0 3 11.5 13 50.0 10 38.5 26 4.3 French 0 0.0 0 0.0 1 33.3 1 33.3 1 33.3 3 4.0 General Humanities 0 0.0 0 0.0 0 0.0 2 66.7 1 33.3 3 4.3 History 0 0.0 0 0.0 1 9.1 9 81.8 1 9.1 11 4.0 Italian 0 0.0 1 25.0 1 25.0 1 25.0 1 25.0 4 3.5

Table 28.0 Overall Satisfaction with Undergraduate Education at MSU
Very Dissatisfied Dissatisfied Neutral Satisfied Very Satisfied Total COLLEGE AND MAJOR N % N % N % N % N % N Average Justice Studies 0 0.0 1 7.7 1 7.7 7 53.8 4 30.8 13 4.1 Linguistics 0 0.0 0 0.0 0 0.0 1 50.0 1 50.0 2 4.5 Philosophy 0 0.0 0 0.0 0 0.0 1 100.0 0 0.0 1 4.0 Political Science 1 7.1 1 7.1 0 0.0 7 50.0 5 35.7 14 4.0 Psychology 2 3.6 2 3.6 5 9.1 23 41.8 23 41.8 55 4.1 Religious Studies 0 0.0 0 0.0 0 0.0 0 0.0 2 100.0 2 5.0 Sociology 0 0.0 1 6.3 0 0.0 8 50.0 7 43.8 16 4.3 Spanish 0 0.0 0 0.0 0 0.0 3 60.0 2 40.0 5 4.4 Women's Studies 0 0.0 0 0.0 1 100.0 0 0.0 0 0.0 1 3.0 Total 4 2.5 6 3.8 13 8.3 76 48.4 58 36.9 157 4.1 College of Science and Math Biology 0 0.0 0 0.0 1 6.7 10 66.7 4 26.7 15 4.2 Computer Science 2 20.0 1 10.0 3 30.0 4 40.0 0 0.0 10 2.9 Geography 0 0.0 0 0.0 1 25.0 2 50.0 1 25.0 4 4.0 Geoscience 0 0.0 0 0.0 0 0.0 1 100.0 0 0.0 1 4.0 Mathematics 0 0.0 0 0.0 0 0.0 0 0.0 5 100.0 5 5.0 Molecular Biology 0 0.0 1 16.7 2 33.3 1 16.7 2 33.3 6 3.7 Total 2 4.9 2 4.9 7 17.1 18 43.9 12 29.3 41 3.9 TOTAL 13 3.2 15 3.7 48 11.7 193 47.2 140 34.2 409 4.1 Scale: 1= Very dissatisfied, 2= Dissatisfied, 3= Neutral, 4= Satisfied, 5= Very satisfied.

Table 29.0 Comments By Alumni
COMMENT NUMBER PERCENT Do an internship 27 9.9 Suggestion for revised/additional courses or programs 24 8.8 Dissatisfied with some aspect of college experience 21 7.7 Experience in field is important 19 7.0 Connections/networking are important 18 6.6 Very satisfied with MSU 14 5.1 Explore all options - look outside your major 12 4.4 Difficult to find job 12 4.4 Plan to further education beyond Bachelors 11 4.0 Look for job while still in school 9 3.3 Do not give up 9 3.3 Research your degree & job availability 6 2.2 Research the job & company 6 2.2 Use the Career Development Center 6 2.2 Maintain high GPA - study hard 6 2.2 Get teacher certification at MSU 5 1.8 Start at the bottom and work your way up 5 1.8 Need to improve Career Center 4 1.5 Double major or minor to be more marketable 4 1.5 Send out lots of resumes 4 1.5 Learn a second language 3 1.1 Develop a good resume/portfolio 3 1.1 Get involved on campus 3 1.1 Job satisfaction is more important than salary 3 1.1 Use all available resources 3 1.1 Good public speaking skills are important 2 0.7 Take leadership roles 2 0.7 Become a Registered Dietician 2 0.7 Be prepared for interviews 2 0.7 Do volunteer work 2 0.7 Seek career advice from professors 2 0.7 Check with government agencies HR dept 2 0.7 Use internet 2 0.7 Computer skills are important 1 0.4 Go through temp agency 1 0.4 Attend job fairs 1 0.4 Go on many interviews 1 0.4 Contact alumni 1 0.4 Substitute teach to gain experience 1 0.4 Know your subject matter 1 0.4 Take business classes 1 0.4 Follow up after interviews 1 0.4 Take civil service tests 1 0.4 Take Praxis exam ASAP 1 0.4 Respect others 1 0.4 Take CPA exam 1 0.4

Table 29.0 Comments By Alumni
COMMENT NUMBER PERCENT Major or minor in a language 1 0.4 Graduate with degree you enjoy 1 0.4 Look into accelerated nursing program 1 0.4 Look into provisional teaching certificate/Alt Route 1 0.4 Be active in school projects 1 0.4 Ask for advisement change if not happy 1 0.4 Enroll in direct social work program 1 0.4
Total Responses 273 100.0
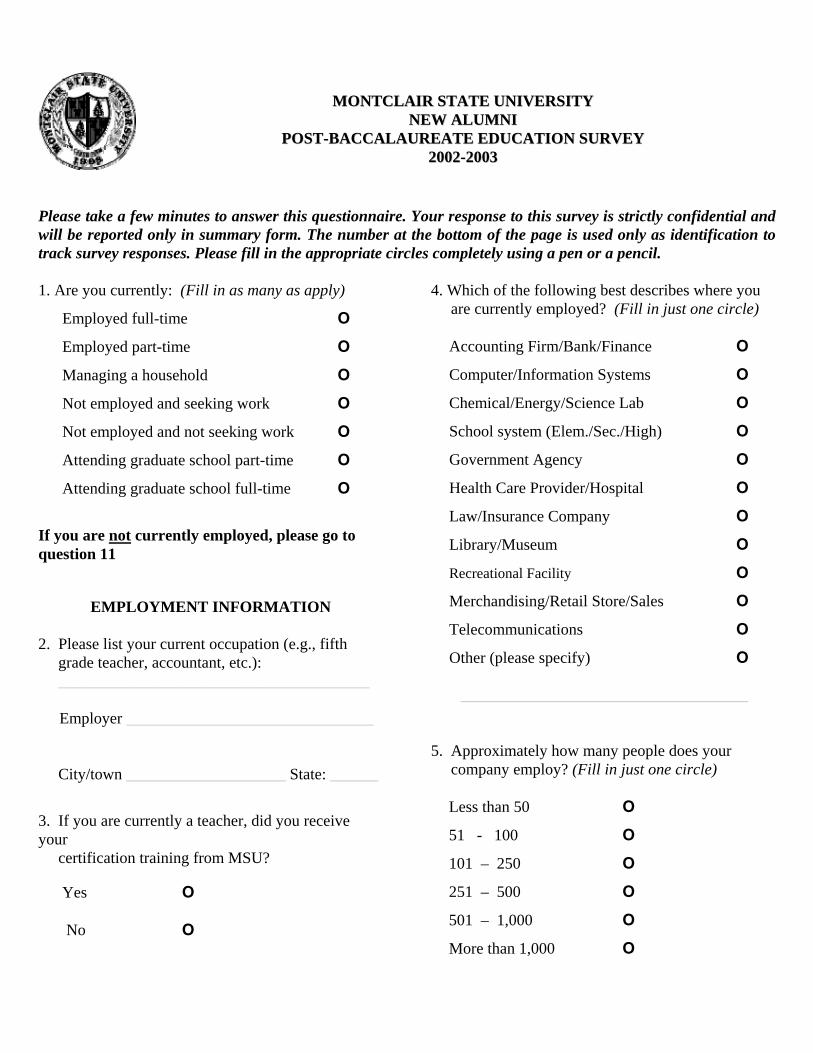
MMOONNTTCCLLAAIIRR SSTTAATTEE UUNNIIVVEERRSSIITTYY NNEEWW AALLUUMMNNII
PPOOSSTT--BBAACCCCAALLAAUURREEAATTEE EEDDUUCCAATTIIOONN SSUURRVVEEYY 22000022--22000033
Please take a few minutes to answer this questionnaire. Your response to this survey is strictly confidential and will be reported only in summary form. The number at the bottom of the page is used only as identification to track survey responses. Please fill in the appropriate circles completely using a pen or a pencil. 1. Are you currently: (Fill in as many as apply)
Employed full-time О
Employed part-time О
Managing a household О
Not employed and seeking work О
Not employed and not seeking work О
Attending graduate school part-time О
Attending graduate school full-time О
If you are not currently employed, please go to question 11
EMPLOYMENT INFORMATION
2. Please list your current occupation (e.g., fifth grade teacher, accountant, etc.): _______________________________________
Employer _______________________________
City/town ____________________ State: ______
3. If you are currently a teacher, did you receive your certification training from MSU? Yes О
No О
4. Which of the following best describes where you are currently employed? (Fill in just one circle)
Accounting Firm/Bank/Finance О
Computer/Information Systems О
Chemical/Energy/Science Lab О
School system (Elem./Sec./High) О
Government Agency О
Health Care Provider/Hospital О
Law/Insurance Company О
Library/Museum О
Recreational Facility О
Merchandising/Retail Store/Sales О
Telecommunications О
Other (please specify) О
____________________________________ 5. Approximately how many people does your company employ? (Fill in just one circle)
Less than 50 О
51 - 100 О
101 – 250 О
251 – 500 О
501 – 1,000 О
More than 1,000 О
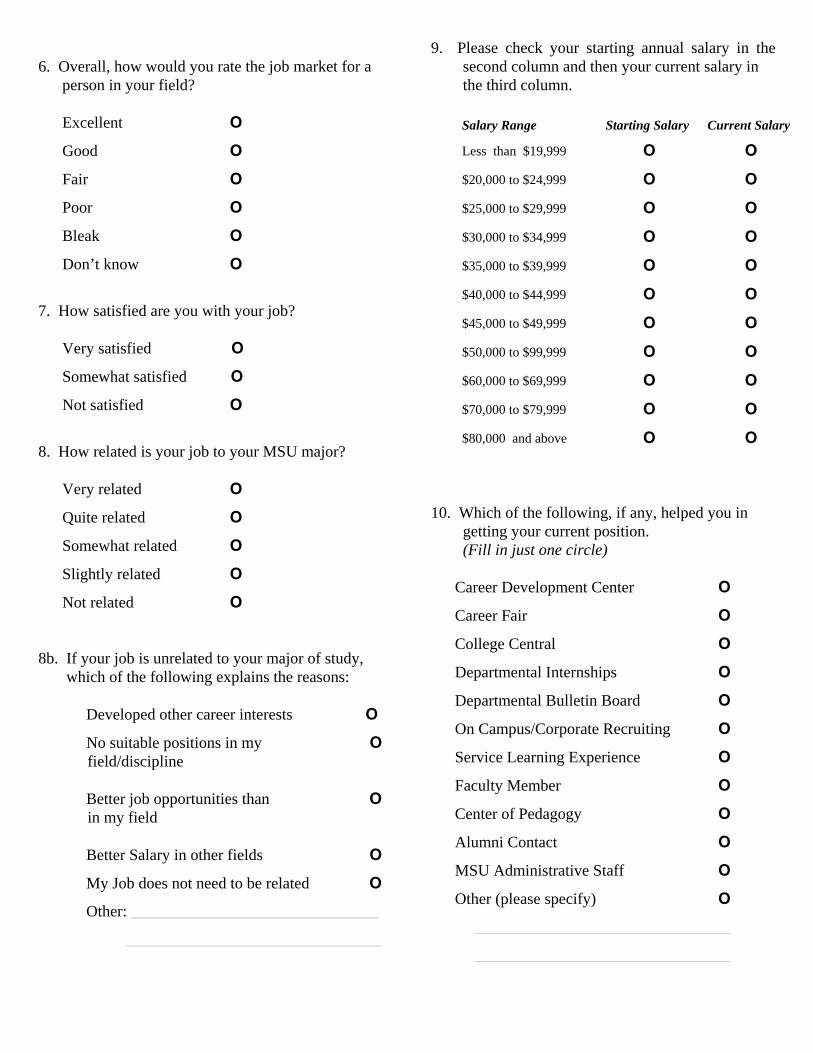
6. Overall, how would you rate the job market for a person in your field?
Excellent О
Good О
Fair О
Poor О
Bleak О
Don’t know О
7. How satisfied are you with your job?
Very satisfied О
Somewhat satisfied О
Not satisfied О
8. How related is your job to your MSU major?
Very related О
Quite related О
Somewhat related О
Slightly related О
Not related О
8b. If your job is unrelated to your major of study, which of the following explains the reasons: Developed other career interests О
No suitable positions in my О field/discipline Better job opportunities than О in my field Better Salary in other fields О
My Job does not need to be related О
Other: _______________________________
________________________________
9. Please check your starting annual salary in the second column and then your current salary in the third column.
Salary Range
Starting Salary
Current Salary Less than $19,999 О О
$20,000 to $24,999 О О
$25,000 to $29,999 О О
$30,000 to $34,999 О О
$35,000 to $39,999 О О
$40,000 to $44,999 О О
$45,000 to $49,999 О О
$50,000 to $99,999 О О
$60,000 to $69,999 О О
$70,000 to $79,999 О О
$80,000 and above О О
10. Which of the following, if any, helped you in getting your current position. (Fill in just one circle)
Career Development Center О
Career Fair О
College Central О
Departmental Internships О
Departmental Bulletin Board О
On Campus/Corporate Recruiting О
Service Learning Experience О
Faculty Member О
Center of Pedagogy О
Alumni Contact О
MSU Administrative Staff О
Other (please specify) О
________________________________
________________________________

YOUR TIME AT MONTCLAIR STATE UNIVERSITY
11. Below is a list of abilities or skills one might expect to develop while pursuing a college education. Please tell us how important you feel each skill or ability is to your personal/professional success (fill in the circles on the left) and how well you feel MSU helped you attain or enhance these skills/abilities (fill in the appropriate circle on the right side of each skill/ability).
Importance to Personal/ Professional Success
MSU helped me attain this skill/ability
Very
Somewhat
A little
Not at all
Skill or Ability
Not at all
A little
Some what
Very
О О О О Speak effectively in front of a group О О О О
О О О О Apply mathematical concepts О О О О
О О О О Express yourself clearly in writing О О О О
О О О О Research skills (accessing information, collecting data, etc. О О О О
О О О О Critical thinking/problem solving skills О О О О
О О О О Foreign language skills О О О О
О О О О Computer skills/ information management О О О О
О О О О Applying scientific methods О О О О
О О О О Making a lifelong commitment to learning О О О О
О О О О Exercising your responsibilities as a citizen О О О О
О
О
О
О Working effectively with people of various backgrounds
& cultures
О
О
О
О
О О О О Working with people in teams or groups О О О О
О О О О Understand how domestic & international issues affect you О О О О
О О О О Use effective leadership skills О О О О
О О О О Time management & organizational skills О О О О
О О О О Appreciate the arts (music, theatre, art, film) О О О О
О О О О Organize large amounts of information О О О О
О О О О Maintain good health habits and physical fitness О О О О
О О О О Apply moral/ethical principles to everyday life О О О О

12. Below are some statements about your experiences at MSU. Please tell us how strongly you agree or disagree with each statement. Strongly
Disagree Disagree Neutral Agree Strongly
Agree N/A
Quality of Program The quality of instruction (education) in my major courses was excellent О О О О О О
The quality of instruction in my General Education Courses was excellent О О О О О О I was satisfied with the academic advisement provided by my department О О О О О О There was good exposure to current development in my field О О О О О О
Course content was appropriate for my degree level О О О О О О
The tuition I paid was a worthwhile investment О О О О О О
My professors challenged me to do my best work О О О О О О
I was an active learner (read assignments, contributed to class discussions, etc.) О О О О О О
Preparedness My program helped me get to where I want to be academically/ professionally О О О О О О My degree enhanced my career opportunities О О О О О О
My program equipped me with skills required to perform competently in my field О О О О О О My program enabled me to perform more effectively in my profession О О О О О О My studies at MSU provided sufficient preparation for the career I actually entered О О О О О О
The education I received at MSU is relevant to the duties I perform in my workplace
О О О О О О Participation in campus activities was an important part of my education О О О О О О
Overall I would recommend my program to students with similar academic and professional interests О О О О О О
If I had to do it all over again, I would enroll as a student in my program. О О О О О О

13. In the left hand column, please rate the importance of each of the following program characteristics in contribution to the overall quality of your educational experience. In the right hand column, rate your level of satisfaction with the program along each of these dimensions.
Level of Importance Level of Satisfaction
Very Somewhat
A little
Not at all
Not at all
A little
Some what
Very
Program and Curriculum
О О О О Class size О О О О
О О О О Academic rigor of the program О О О О
О О О О Curriculum depth and breadth О О О О
О О О О Emphasis devoted to theory О О О О
О О О О Program Quality О О О О
О О О О Program reputation О О О О
О О О О Quality of student body О О О О
О О О О Diversity of student body О О О О
Faculty
О О О О Quality of Faculty О О О О
О О О О Quality of faculty-student Interaction О О О О
О О О О Faculty Teaching Style О О О О
О О О О Accessibility of Faculty members О О О О
Advisement/Information Provision
О О О О Quality of pre-registration advisement О О О О
О О О О Quality of academic advisement О О О О
О О О О Availability of Career Counseling О О О О
О О О О Clarity of degree completion requirements О О О О
О О О О Availability of information on licensing/certification О О О О
Student Services
О О О О Financial Aid Services О О О О
О О О О Health Services О О О О
О О О О Library Resources О О О О
О О О О Public Safety О О О О
О О О О Registration Office Services О О О О
О О О О Computer Development О О О О
О О О О Career Services О О О О
О О О О Campus Safety О О О О
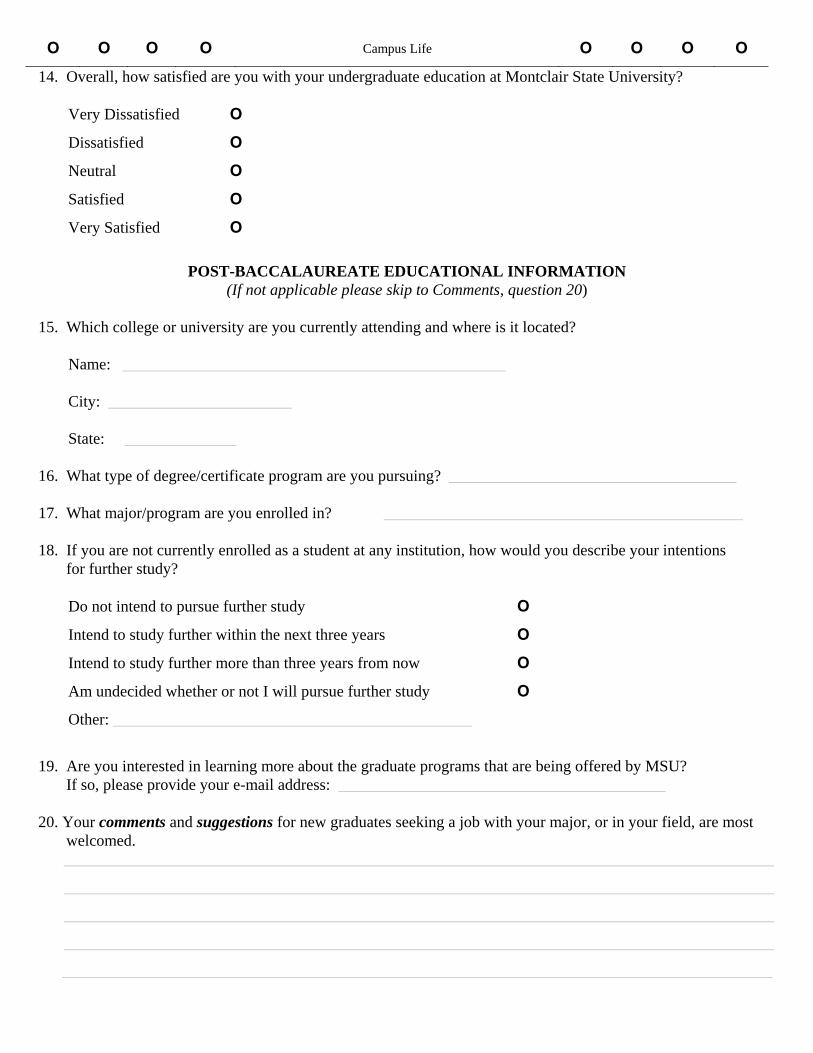
О О О О Campus Life О О О О
14. Overall, how satisfied are you with your undergraduate education at Montclair State University?
Very Dissatisfied О
Dissatisfied О
Neutral О
Satisfied О
Very Satisfied О
POST-BACCALAUREATE EDUCATIONAL INFORMATION (If not applicable please skip to Comments, question 20)
15. Which college or university are you currently attending and where is it located?
Name: ________________________________________________
City: _______________________
State: ______________
16. What type of degree/certificate program are you pursuing? ____________________________________ 17. What major/program are you enrolled in? _____________________________________________ 18. If you are not currently enrolled as a student at any institution, how would you describe your intentions for further study? Do not intend to pursue further study О
Intend to study further within the next three years О
Intend to study further more than three years from now О
Am undecided whether or not I will pursue further study О
Other: _____________________________________________
19. Are you interested in learning more about the graduate programs that are being offered by MSU? If so, please provide your e-mail address: _________________________________________ 20. Your comments and suggestions for new graduates seeking a job with your major, or in your field, are most welcomed.
_________________________________________________________________________________________
_________________________________________________________________________________________
_________________________________________________________________________________________
_________________________________________________________________________________________
_________________________________________________________________________________________

Thank you very much for your assistance! I.D.: