cover image. violent methane venting at håkon mosby mud...
TRANSCRIPT


Cover image. Violent methane venting at Håkon Mosby Mud Volcano (Barents Sea, 1250 metre water depth). The lower part of the jet consists of methane gas, whereas the upper section (~1 metre above sea floor) comprises methane gas-hydrate flakes. Image source: IFREMER, Brest and Alfred Wegener Institute for Polar and Marine Research, Bremerhaven cruise ARK IXX3b.

Rates and signatures of methane turnover
in sediments of continental margins
Dissertation
zur Erlangung des Doktorgrades der Naturwissenschaften
- Dr. rer. nat. -
dem Fachbereich Biologie/Chemie der Universität Bremen vorgelegt von
Helge Niemann
Bremen
Juni 2005

Die vorliegende Doktorarbeit wurde in der Zeit vom Januar 2002 bis Juni 2005 an der Universität Bremen durchgeführt. Die Untersuchungen fanden am Max Planck Institut für Marine Mikrobiologie in Bremen statt.
1. Gutachter: Prof. Dr. Dieter Wolf-Gladrow 2. Gutachterin: Prof. Dr. Antje Boetius
weitere Prüfer:
Prof. Dr. Wilhelm Hagen Dr. Marcus Elvert
Tag des Promotionskolloquiums: 8. Juli 2005


What we know is a drop. What we don't know is an ocean.
- Isaac Newton


This work is dedicated to Silke

Summary
Methane is an aggressive greenhouse gas and an important component of the global carbon
cycle. High amounts of methane are temporarily stored in sediments of the continental
margins as free gas, dissolved or frozen as clathrate. At cold seeps, focused flow transports
high amounts of methane from deep reservoirs into shallow surface sediments. Locally,
methane emission into the water column from seeps can be observed in the form of gas
ebullition. Furthermore, large expanses of continental margin sediments contain high amounts
of methane. However, the contribution of the oceans to atmospheric methane sources is
globally estimated as <3 %. This is because the anaerobic oxidation of methane (AOM) with
sulphate as the terminal electron acceptor removes ~80 % of methane in the sediment. AOM
is mediated by archaea related to methanogens in consortium with sulphate reducing bacteria.
This process produces large amounts of sulphide in marine sediments, and supports
thiotrophic communities such as filamentous bacteria, and symbiotic worms and clams. AOM
often co-occurs with the precipitation of authigenic carbonates which may build up reef like
structures. Another sink for methane in the ocean is the aerobic oxidation of methane (MOx).
This process is mediated by bacteria, which may occur as free-living cells or in symbiosis
with megafauna organisms. However, marine sediments are barely penetrated by oxygen and
will mostly not provide suitable conditions for free living MOx communities. In contrast,
motility, sediment dwelling and ventilation activities of the animal hosts to MOx bacteria
enlarges the range for the distribution of MOx. Previous work has shown that the process of
AOM dominates methane turnover at seeps and consumes 60-100 % of the methane flux.
In this thesis, a variety of different cold seep systems (mud volcanoes and a gas seep) were
investigated using a multidisciplinary approach to gain a more systematic understanding of
these, methane-driven “biogeosystems”. The main goals were the detection and quantification
of hot spots of methane oxidation as well as an assessment of environmental factors
determining the activity and the distribution of methanotrophic communities. Furthermore,
key microbial players were identified and the impact of AOM and MOx activity on the
surrounding, marine environment was studied. The investigations revealed the following:
1. Submarine mud volcanoes are colonized by specialized microbial communities utilizing the
fluxes of reduced substrates such as methane and sulphide as energy source. At the actively
methane-seeping Håkon Mosby mud volcano (HMMV, Barents Sea), a distinct spatial
zonation of several novel clades of free-living and symbiotic aerobic and anaerobic
methanotrophs was found. The main selection mechanism determining vertical and horizontal
distribution and dominance of the methanotrophic communities were fluid flow rates
controlling access to electron acceptors for methane oxidation.
2. The analysis of archaeal and bacterial specific lipid concentrations and their associated
13C-values from three seepage areas at HMMV (thermal centre, grey mats and Beggiatoa
site) showed a distinct distribution of methanotrophic biomass. At the centre, MOx was the
primary biomass-generating process in surface sediments as shown by the predominance of
bacterial lipids belonging to a type I methanotroph. In patches of reduced sediment, covered
by greyish, thiotrophic, microbial mats at the boundary of the centre, a four-fold increase in
archaeal lipids specific for anaerobic methanotrophs was found. It was accompanied by a
strong depletion in 13C, giving evidence of active microbial communities, which mediate
AOM in the upper 20 cm of sediment. Further away from the centre, in the zone covered by
Beggiatoa mats, anaerobic methanotrophy appeared to be the predominant biomass
generating process. Here, sharp, vertical gradients of 13C-depleted archaeal and bacterial
lipids indicate that AOM communities were restricted to a narrow surface horizon of no more
than 4 cm. A combination of molecular techniques (DAPI, FISH, gene libraries) and
biomarker fingerprints provided evidence that the AOM community was dominated by a
novel strain of archaea (termed ANME-3) and SRB of the Desulfobulbus cluster.
3. Biogeochemical investigations at HMMV revealed a high upward flow of sulphate-free
subsurface fluids in the centre, strongly limiting the penetration of sulphate and oxygen from
seawater. Here, MOx was restricted to the top sediment layer with rates of 0.9 mol m-2 yr-1
and AOM was absent. In the patches of reduced sediments covered with grey mats, a deeper
penetration of sulphate was observed, fueling AOM activity down to >12 cm with rates of
12.4 mol m-2 yr-1. Adjacent to the centre at the Beggiatoa site, decreased upward fluid flow
allowed for an AOM zone of ca 4 cm at the sediment surface with rates of 4.5 mol m-2 yr-1. At
the outer rim of the HMMV, bioventilation of the pogonophoran worms irrigated a much
deeper zone with oxygen- and sulphate-rich seawater. MOx activity in the oxygenated surface
sediments was comparably low with 0.2 mol m-2 yr-1. AOM activity in sulphate-rich
sediments just beneath the roots of the worms was high with 7.1 mol m-2 yr-1. With respect to
the area size of the different habitats at HMMV, microbial consumption reduces the methane
efflux of HMMV by ca 7* 10-5 Tg yr-1, i.e. 22 to 55 %.
4. The abundant mud volcanoes of the Gulf of Cadiz are currently much less active than the
HMMV. Here, thermogenic methane and associated higher hydrocarbons were completely
consumed anaerobically in subsurface sediments. AOM and SR rates showed maxima in
distinct subsurface sediment horizons between 20 to 200 cm below sea floor. In comparison
to other methane dominated environments of the world oceans, AOM activity and diffusive
methane fluxes (<0.4 mol m-2 yr-1, respectively) were low to mid range. AOM was generally
exceeded by SRR, most likely because other hydrocarbons were oxidised anaerobically by SR
microbes. Lipid biomarker and 16S rDNA clone library analyses gave evidence that AOM
was mediated by a mixed community of previously described anaerobic methanotrophic
archaea (ANME-2 and ANME-1) and associated SRB (Seep-SRB1 group).
5. The Tommeliten gas seep is located in the central North Sea. Here, cracks in a buried marl
horizon allow thermogenic methane to migrate into overlying clay-silt sediments.
Hydroacoustic sediment echosounding showed several gas flares coinciding with the apex of
the marl domes. Here, methane is released into the water column and potentially to the
atmosphere during deep mixing situations. Carbonates in the vicinity of the gas seep
contained 13C-depleted, archaeal lipids indicating long-term AOM activity. In the sediment,
the zone of active methane consumption was restricted to a distinct horizon of no more than
20 cm. Diagnostic, 13C-depleted archaeal and bacterial lipids as well as 16S rDNA clone
libraries provided evidence that AOM was mediated by ANME-1b archaea and SRB most
likely belonging to the Seep-SRB1 cluster.
The investigations presented in this thesis confirm that AOM is an ubiquitous process in
methane bearing, marine sediments. For the first time, the microbial ecology and
biogeochemistry of mud volcanoes and a coastal gas seep was investigated systematically.
The magnitude of AOM vs. MOx was mainly controlled by gas and fluid transport processes
and by the presence of symbiotic fauna. The process of AOM was found to be spatially
restricted to hotspots controlled by (1) fluid flow rates, (2) bioirrigation activities, (3)
diffusion and thermodynamic limitations and by (4) the sedimentological layering. Despite
the horizontal and vertical restriction, AOM represents a major sink for methane at mud
volcanoes and coastal gas seeps. AOM and MOx biomass, activity, diagnostic lipid
concentrations and their associated 13C-values showed matching vertical distributions
allowing to use a particular profile as a proxy for the other. Furthermore, lipid biomarker

analysis matched very well 16S rDNA-based estimates of the diversity of microbial
communities mediating AOM and MOx.


Zusammenfassung
Methan ist ein potentes Treibhausgas. Große Mengen sind hiervon in Sedimenten der
Kontinentalränder als freies oder gelöstes Gas, aber auch gefroren in Form von Gashydraten
eingelagert. An den sogenannten „Cold Seeps“ werden große Mengen dieses Gases aus
tieferliegenden Lagerstätten in oberflächennahe Sedimenthorizonte transportiert. Lokal
begrenzt kann an den Cold Seeps auch ein Austritt von Methan aus dem Ozeanboden in die
Wassersäule beobachtet werden. Obwohl Methan zusätzlich in weiten Flächen des
Meeresbodens an den Kontinentalränden enthalten ist, gehen globale Schätzungen davon aus,
dass weniger als 3 % des atmosphärischen Methangehaltes aus den Ozeanen stammt. Dies
liegt daran, dass die anaerobe Methanoxidation (engl.: anaerobic oxidation of methane; AOM)
mit Sulfat als terminalen Elektronenakzeptor ca. 80 % des aufsteigenden Methans schon im
Sediment aufzehrt. Verantwortlich für diesen Prozess sind Archaeen, die in einem
Konsortium mit sulfatreduzierenden Bakterien (engl.: sulphate reducing bacteria; SRB) leben.
Phylogenetisch sind diese Archaeen mit den Methanogenen verwand. Während der AOM
wird Sulfid produziert, das wiederum von thitrophen Lebensgemeinschaften wie filamentösen
Bakterien und symbiotischen Würmern und Muscheln aufgenommen wird. Außerdem gibt es
wahrscheinlich eine kausale Verbindung zwischen der AOM und der Ausfällung authigener
Karbonate. An den oft durch schlammige Sedimente gekennzeichneten Cold Seeps, stellen
exponierte Karbonate einen harten Untergrund für die Besiedlung sessiler Organismen dar.
Abgesehen von der AOM ist die aerobe Methanoxidation (MOx) eine weitere Senke für
Methan im Ozean. Für den Prozess der MOx sind Bakterien verantwortlich, die entweder
freilebend oder in Symbiose mit Megafaunaorganismen vorkommen. Die Lebensbedingungen
für freilebende MOx Bakterien im Ozeanboden sind eher schlecht, da die Eindringtiefe von
Sauerstoff in den Meeresboden sehr begrenzt ist. Im Gegensatz dazu eröffnen Beweglichkeit
und/oder Ventilation und Bioturbation der Megafaunawirte den symbiotischen MOx

Bakterien ein größeres Potential an Lebensräumen. Bisherige Publikationen haben allerdings
gezeigt, dass die AOM der dominante Modus der Methanoxidation an den Cold Seeps ist. 60
bis 100 % des Methanflusses werden hier durch die AOM gezehrt.
In dieser Doktorarbeit wurden eine Reihe verschiedener Cold Seeps (Schlammvulkane und
Gasseeps) mit einem multidisziplinären Ansatz untersucht, um ein systematisches Verständnis
dieser „Bio-Geo-Systeme“ zu erlangen. Hauptziele waren die Detektion und Quantifikation
der sogenannten „Hot Spots“, an denen Methanoxidation stattfindet, sowie eine Einschätzung
der Umweltfaktoren, die potenziell die Aktivität und Verteilung der methanotrophen
Lebensgemeinschaften bestimmen. Zudem wurden die mikrobiellen Schlüsselorganismen
identifiziert und der Einfluss von AOM- und MOx-Aktivität auf das umgebende, marine
Ökosystem eingeschätzt. Die Untersuchungen haben folgendes ergeben:
1. Unterseeische Schlammvulkane werden von spezialisierten, mikrobiellen
Lebensgemeinschaften besiedelt, welche den Fluss von reduzierten Substraten, wie Methan
und Sulfid als Energieressource nutzen können. Eine räumlich abgegrenzte Zonierung
verschiedener neuentdeckter, freilebender und symbiotischer aerober und anaerober
methanotropher Organismen wurde am aktiven Schlammvulkan Håkon Mosby (HMMV)
gefunden. Die Fliessgeschwindigkeit des Porenwassers bestimmt hier, wie hoch die
Verfügbarkeit von Elektronenakzeptoren ist, und selektiert somit die vertikale und horizontale
Verteilung sowie die Dominanz verschiedener methanotropher Organismen.
2. An drei verschiedenen Arealen des HMMVs (Zentrum, graue Matten und Beggiatoa
Habitat) zeigte die Analyse spezifischer archaealer und bakterieller Lipidkonzentrationen und
deren assoziierte 13C-Werte eine stark abgegrenzte Verteilung methanotropher Biomassen.
Am Zentrum des Schlammvulkans ist die MOx der dominante, biomassegenerierende

Prozess. Dies zeigte sich durch eine Dominanz von bakteriellen Lipiden, die Typ I
methanotrophen Bakterien zugeordnet werden konnten. In reduzierten Sedimenten der grauen
Matten, die am äußeren Rand des Zentrums und in der Nähe von Fluid- und
Gasaustrittsstellen kleinere Flecken bedecken, wurde, im Vergleich zum Zentrum, eine
vierfach höhere Konzentration von AOM assoziierten Lipiden gefunden. Diese Lipide waren
durch eine starke Abreicherung des Isotops 13C gekennzeichnet. Die Konzentrationen und die
leichten 13C-Werte wiesen darauf hin, dass die mikrobielle Gemeinschaft in den oberen 20
cm des Sedimentes das Methan anaerob umsetzt. Das Zentrum ist von einer Zone reduzierter
Sedimente umgeben, die mit dichten Matten von Beggiatoa sp. bedeckt sind. Hier wurde die
AOM als der primäre, biomasseproduzierende Prozess identifiziert. Steile, vertikale
Gradienten von 13C-abgereicherten archaealen und bakteriellen Lipiden deuteten darauf hin,
dass die AOM Gemeinschaft auf einen schmalen, oberflächennahen Horizont von ca. 4 cm
begrenzt ist. Eine Kombination molekularer Analysetechniken (DAPI, FISH und Genbanken)
sowie die Biomarkerverteilungen zeigten eine neuartige, dominante AOM-Gemeinschaft.
Diese besteht aus Archaeen, welche ANME-3 genannt wurden, und sulfatreduzierenden
Bakterien der Desulfobulbus-Gruppe.
3. Biogeochemische Untersuchungen am HMMV zeigten eine hohe Flussrate sulfatfreier
Fluide. Diese Fluide stammen aus großer Tiefe des Schlammvulkans und werden durch einen
Kanal an die Oberfläche des Zentrums transportiert. Im Zentrum beschränkt der Fluss dieser
Fluide die Eindringtiefe von Sauerstoff und Sulfat aus dem Bodenwasser auf einen dünnen
Oberflächenhorizont des Sedimentes. In diesem Horizont ist die MOx mit 0.9 mol m-2 a-1
dominant. AOM konnte hingegen nicht nachgewiesen werden. In Sedimenten, die mit grauen
Matten bedeckt sind, wurde eine große Eindringtiefe von Sulfat in das Sediment beobachtet,
was eine hohe AOM-Aktivität in einem ausgedehnten Horizont (>12 cm) mit
Methanumsatzraten von 12.4 mol m-2 a-1 zur Folge hat. Im Vergleich zum Zentrum, hat in

den von Beggiatoa sp. bedeckten Sedimenten eine Reduktion im Fluidfluss eine größere
Eindringtiefe von Sulfat zur Folge. Die vergleichsweise hohe Verfügbarkeit von Sulfat
resultiert in AOM Raten von 4.5 mol m-2 a-1 in den oberen 4 cm des Sedimentes. Der äußere
Rand des Vulkans ist von dichten Pogonophora sp. Beständen besiedelt. Die Bioventilation
dieser Würmer führt zum Eintrag von sauerstoff- und sulfatreichem Bodenwasser in tiefere
Sedimentschichten. In den sauerstoffreichen Oberflächensedimenten ist die MOx Aktivität
mit 0.2 mol m-2 a-1 vergleichsweise gering. Jedoch konnte eine hohe AOM-Aktivität von 7.1
mol m-2 a-1 in einem Sedimenthorizont direkt unterhalb der Würmer (60 bis 80 cm
Sedimenttiefe) gemessen werden. Dies ist ein extrem hoher Methanumsatz für diese
Sedimenttiefe. Am HMMV werden insgesamt ca. 7*10-5 Tg Methan a-1 durch mikrobielle
Zehrung umgesetzt. Dies ist äquivalent zu einer Reduktion der Methanemissionen um 22 bis
55 %.
4. Der Golf von Cadiz ist durch eine hohe Anzahl von Schlammvulkanen gekennzeichnet, die
allerdings weit weniger aktiv als z.B. der HMMV sind. An den Schlammvulkanen im Golf
von Cadiz werden Methan und assoziierte, höhere Kohlenwasserstoffe in tieferen
Sedimentschichten (20 – 200 cm Sedimenttiefe) aufgezehrt. Dort konnten maximale AOM-
und SR-Raten in abgegrenzten Horizonten gemessen werden. Im Vergleich zu anderen,
methandominierten, marinen Systemen sind sowohl AOM-Raten wie auch diffuse
Methanflüsse (jeweils <0.4 mol m-2 a-1) gering bis mittel-hoch. Generell wurden höhere SR-
als AOM-Raten gemessen, weil auch die höheren Kohlenwasserstoffe, wahrscheinlich
anaerob mit Sulfat, in dem gleichen Horizont wie Methan oxidiert werden. Lipidbiomarker
und 16S rDNA-Klonbanken zeigten, dass eine gemischte Gemeinschaft, bestehend aus
ANME-1 und ANME-2 Archaeen, assoziiert zu Sulfatreduzierern der Seep-SRB1 Gruppe,
Methan anaerob oxidieren.
5. An den Tommeliten Gasseeps in der zentralen Nord See steigt thermogenes Methan durch
Risse eines verschütteten Mergelhorizontes in aufliegende Silt-Ton-Sedimente.
Hydroakustische Messungen zeigten, dass tiefere Horizonte (wahrscheinlich Mergel) an
verschiedenen Stellen kuppelförmige Schwellungen aufweisen. Mehrere Stellen, an denen
Methan aus dem Meeresboden in die Wassersäule und damit potenziell in die Atmosphäre
entweicht, fallen räumlich mit den Scheitelpunkten dieser Kuppeln zusammen. In der Nähe
der Gasaustrittsstellen wurden Karbonate gefunden. Biomarkeranalysen zeigten, dass diese
Karbonate 13C-abgereicherte, archaeale und bakterielle Lipide enthalten. Dies deutet auf lange
Zeitperioden hin, die durch AOM- und damit Seep-Aktivität gekennzeichnet waren. Die
Zone, in der Methan im Sediment gezehrt wird, ist begrenzt auf einen Horizont von <20 cm.
Diagnostische archaeale und bakterielle Lipide und 16S rDNA-Genbanken legen nahe, dass
Methan von ANME-1b Archaeen und Sulfatreduzierern der Seep-SRB1 Gruppe anaerob
oxidiert wird.
Die Untersuchungen im Rahmen dieser Doktorarbeit bestätigen, dass AOM ein ubiquitärer
Prozess in methanreichen, marinen Sedimenten ist. Zum ersten Mal ist es gelungen, die
mikrobielle Ökologie und Biogeochemie an Schlammvulkanen und küstennahen Cold Seeps,
systematisch zu untersuchen. Die AOM- und MOx-Aktivität wird hauptsächlich von Fluid-
Transportprozessen sowie durch das Vorhandensein symbiotischer Fauna kontrolliert. Es
wurde nachgewiesen, dass der Prozess der AOM räumlich auf einen Hot Spot begrenzt ist,
dessen vertikale Position und Ausdehnung von (1) Fluid Flüssen, (2) Bioirrigation, (3)
Diffusion und thermodynamischen Limitierungen sowie (4) der Sedimentabfolge bestimmt
wird. Obwohl die Ausdehnung des AOM Horizontes begrenzt ist, repräsentiert die AOM die
Hauptsenke für Methan an Schlammvulkanen und küstennahen Gasseeps. Die Biomasse der
AOM- und MOx- Gemeinschaften, deren Aktivität sowie diagnostische Lipide und deren
assoziierte 13C-Werte zeigten eine sich deckende vertikale Verteilung. Dadurch kann in

zukünftigen Studien einer dieser Parameter als qualitatives Maß für die anderen genutzt
werden. Zusätzlich konnte gezeigt werden, dass 16S rDNA und Lipiddaten übereinstimmen
und für eine Einschätzung der mikrobiellen Diversität von AOM- und MOx-Organismen
geeignet sind.


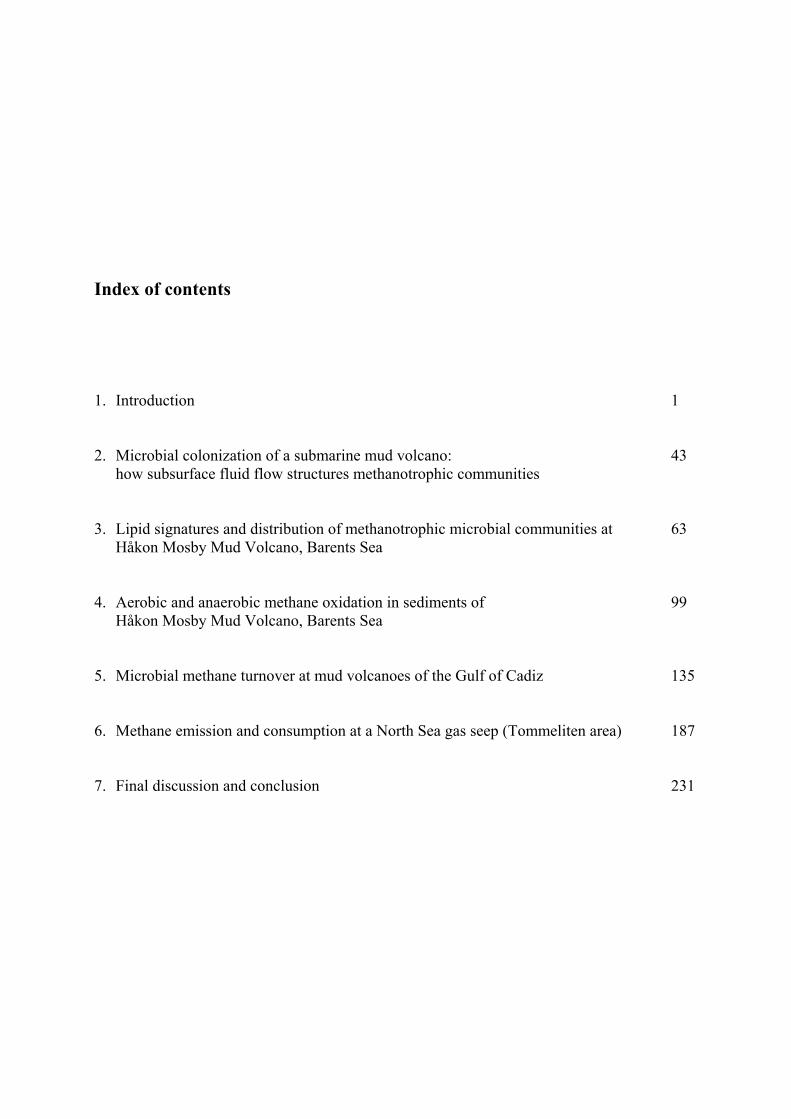
Index of contents
1. Introduction 1
2. Microbial colonization of a submarine mud volcano: how subsurface fluid flow structures methanotrophic communities
43
3. Lipid signatures and distribution of methanotrophic microbial communities at Håkon Mosby Mud Volcano, Barents Sea
63
4. Aerobic and anaerobic methane oxidation in sediments of Håkon Mosby Mud Volcano, Barents Sea
99
5. Microbial methane turnover at mud volcanoes of the Gulf of Cadiz 135
6. Methane emission and consumption at a North Sea gas seep (Tommeliten area) 187
7. Final discussion and conclusion 231

Chapter 1 Introduction
1
Introduction
The following sections outline the nature and global significance of methane turnover and
thus the relevance of this dissertation in the field of biogeochemistry and geomicrobiology.
The first two parts will give an overview about the current knowledge on the chemical and
physical characteristics of methane as well as the processes forming and consuming methane.
Also, budgets for- and fluxes between the major compartments of the global methane cycle
are presented. In the third part of the introduction, methane-rich habitats of the oceans are
presented and current analytical tools for determining microbial key players and metabolic
activities in methane turnover are provided. The fourth part outlines the main objectives of
this work. The final part of the introduction gives an overview on the chapters containing the
five manuscripts prepared in the framework of the thesis, and specifies my contributions to
each of them.
1. CHEMICAL AND PHYSICAL PROPERTIES OF METHANE
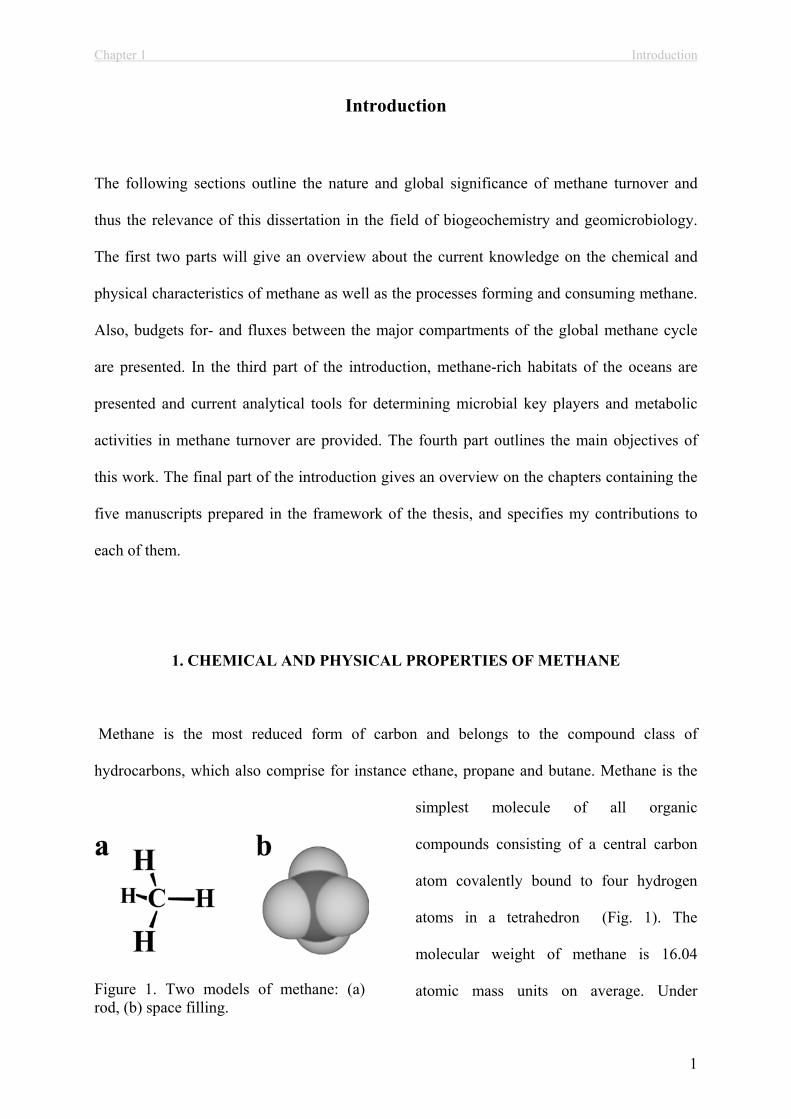
Methane is the most reduced form of carbon and belongs to the compound class of
hydrocarbons, which also comprise for instance ethane, propane and butane. Methane is the
simplest molecule of all organic
compounds consisting of a central carbon
atom covalently bound to four hydrogen
atoms in a tetrahedron (Fig. 1). The
molecular weight of methane is 16.04
atomic mass units on average. Under Figure 1. Two models of methane: (a) rod, (b) space filling.
Chapter 1 Introduction
2
standard conditions (273 K, 0.1 MPa), methane is a colourless, odourless gas and its melting
and boiling points are –183 and –164°C, respectively. Three isotopes of methane are
commonly encountered in nature: the stable isotopes 12C and 13C and the radioactive -
radiator 14C, which has a half life of 5730 yrs. 12C is the most abundant isotope in nature,
however, certain chemical and biological processes discriminate against the heavy isotope 13C
leading to a significant enrichment of 12C in the reaction products. The stable isotope
composition of carbon is usually reported in the standard -notation ( 13C) expressed as per
mill (‰) deviation from the Pee Dee Belemnite standard (PDB):
By definition, PDB has a 13C -value of 0‰. Thus, negative 13C-values indicate depletion in
13C (or an enrichment in 12C) relative to PDB.
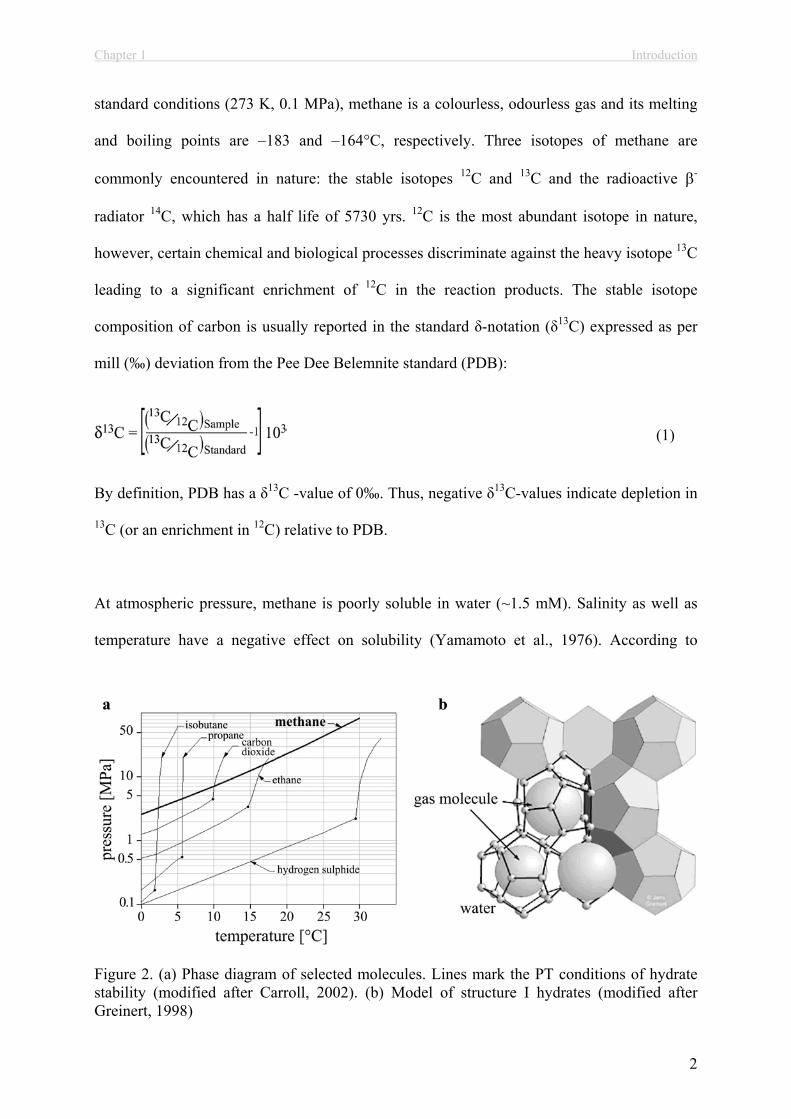
At atmospheric pressure, methane is poorly soluble in water (~1.5 mM). Salinity as well as
temperature have a negative effect on solubility (Yamamoto et al., 1976). According to
Figure 2. (a) Phase diagram of selected molecules. Lines mark the PT conditions of hydrate stability (modified after Carroll, 2002). (b) Model of structure I hydrates (modified after Greinert, 1998)
(1)
Chapter 1 Introduction
3
Henry’s Law, solubility increases with
increasing hydrostatic pressure,
however, this changes at about 400 m
depth in waters of temperate and
tropical (non-polar) latitudes. At these
PT-conditions (4°C, 4 MPa), methane
and water form a hydrate structure,
which is a crystalline, ice-like, non-
stoichiometric compound of methane
molecules encaged by water
(Kvenvolden 1993, Fig. 2b). In a two-
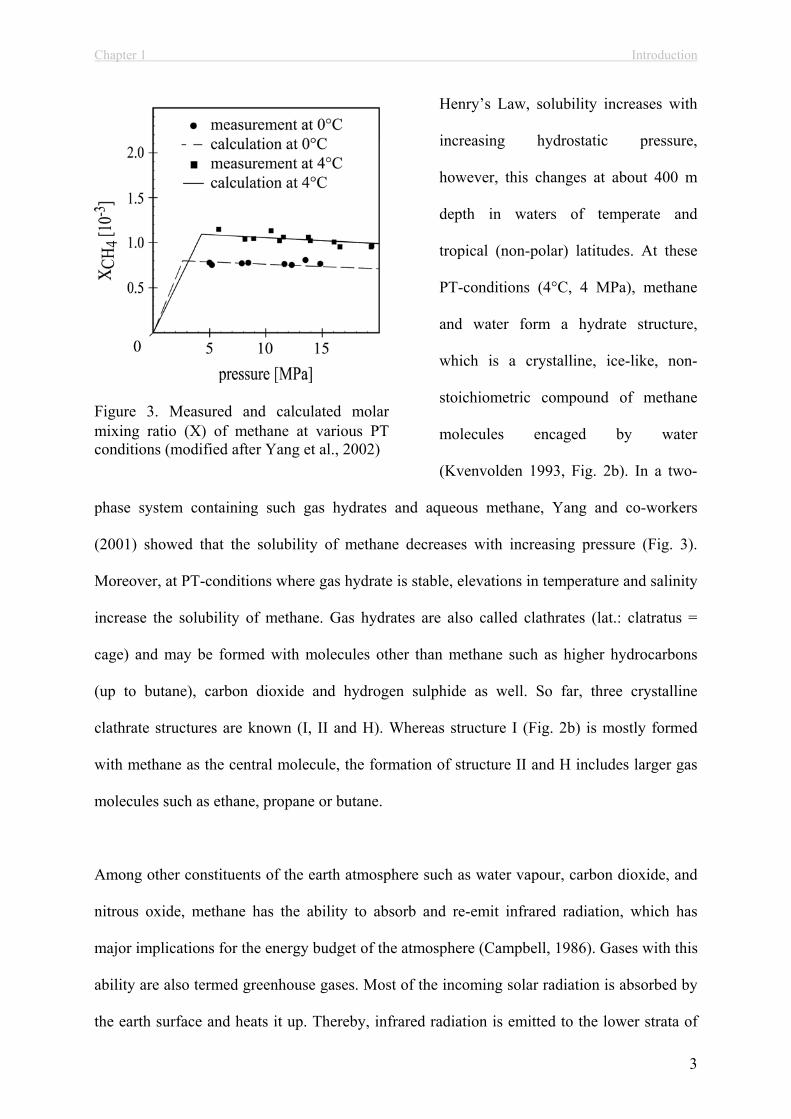
phase system containing such gas hydrates and aqueous methane, Yang and co-workers
(2001) showed that the solubility of methane decreases with increasing pressure (Fig. 3).
Moreover, at PT-conditions where gas hydrate is stable, elevations in temperature and salinity
increase the solubility of methane. Gas hydrates are also called clathrates (lat.: clatratus =
cage) and may be formed with molecules other than methane such as higher hydrocarbons
(up to butane), carbon dioxide and hydrogen sulphide as well. So far, three crystalline
clathrate structures are known (I, II and H). Whereas structure I (Fig. 2b) is mostly formed
with methane as the central molecule, the formation of structure II and H includes larger gas
molecules such as ethane, propane or butane.
Among other constituents of the earth atmosphere such as water vapour, carbon dioxide, and
nitrous oxide, methane has the ability to absorb and re-emit infrared radiation, which has
major implications for the energy budget of the atmosphere (Campbell, 1986). Gases with this
ability are also termed greenhouse gases. Most of the incoming solar radiation is absorbed by
the earth surface and heats it up. Thereby, infrared radiation is emitted to the lower strata of
Figure 3. Measured and calculated molar mixing ratio ( ) of methane at various PT conditions (modified after Yang et al., 2002)
Chapter 1 Introduction
4
the atmosphere where the greenhouse gases absorb most of it. Such absorption heats the
atmosphere, stimulating it to emit more infrared radiation, which is again absorbed by the
greenhouse gases. This phenomenon is also known as the greenhouse effect and the balance
between the absorbed solar radiation and the infrared radiation re-emitted to space determines
the net radiative forcing on the climate. A positive radiative forcing is beneficial to some
extend as it keeps the earth surface in its present habitual temperature conditions. However,
an increase in the concentrations of greenhouse gases increases the radiative forcing and most
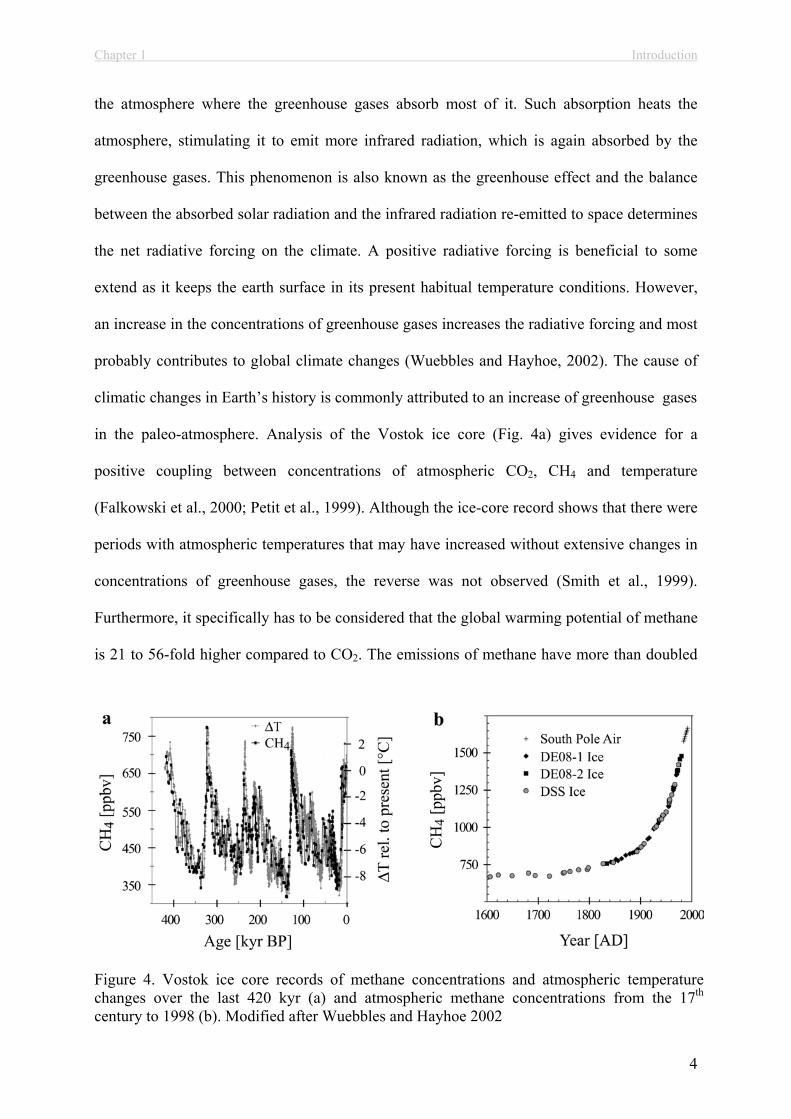
probably contributes to global climate changes (Wuebbles and Hayhoe, 2002). The cause of
climatic changes in Earth’s history is commonly attributed to an increase of greenhouse gases
in the paleo-atmosphere. Analysis of the Vostok ice core (Fig. 4a) gives evidence for a
positive coupling between concentrations of atmospheric CO2, CH4 and temperature
(Falkowski et al., 2000; Petit et al., 1999). Although the ice-core record shows that there were
periods with atmospheric temperatures that may have increased without extensive changes in
concentrations of greenhouse gases, the reverse was not observed (Smith et al., 1999).
Furthermore, it specifically has to be considered that the global warming potential of methane
is 21 to 56-fold higher compared to CO2. The emissions of methane have more than doubled
Figure 4. Vostok ice core records of methane concentrations and atmospheric temperature changes over the last 420 kyr (a) and atmospheric methane concentrations from the 17th
century to 1998 (b). Modified after Wuebbles and Hayhoe 2002

Chapter 1 Introduction
5
since the industrialisation leading to an increase in the atmosphere by 2- to 3-fold (Fig. 4b).
The increasing methane concentrations might have contributed to about 20% to the total
change in radiative forcing since the mid 1700’s which makes methane a very important
greenhouse gas (Manne and Richels, 2001; Wuebbles and Hayhoe, 2002). Increasing research
effort has therefore been dedicated to elucidate sources and sinks of methane, especially with
regard to the ocean and its methane reservoirs.
2. ORIGINS, SOURCES AND SINKS OF METHANE
2.1 Methane Production
Methane originates from three
different processes in nature:
abiogenic, thermogenic, and
microbial. Methane of either
source is characterised by a
specific range of 13C and D-
values as well as by the
proportion of co-occurring
higher hydrocarbons (C2+) and
their stable carbon isotope
composition (Fig. 5, Lollar et
al., 2002; Whiticar, 1999). Both,
Figure 5. CD-diagram of methane (modified after Whiticar et al., 1999)
Chapter 1 Introduction
6
abiogenic and thermogenic methane are produced under high temperature and pressure
conditions. Abiogenic methane is produced from carbonate reduction during magma cooling
and serpentinisation of exposed peridotite rocks whereas thermogenic methane is formed
during the thermal degradation of buried organic matter (Charlou and Donval, 1993; Horita
and Berndt, 1999; Kelley, 1996; Lollar et al., 2002; Whiticar, 1999). Accordingly,
thermogenic methane is also termed fossil methane. Abiogenic methane is most enriched in
13C with values ranging between 0 to -42‰ and D-values of –100‰ to -450‰ (Horita and
Berndt, 1999; Kelley and Fruh-Green, 1999; Lollar et al., 2002; Whiticar, 1999). The
formation of abiogenic methane can be catalysed by a nickel-iron alloy leading to the lower
range of the observed 13C-values (Horita and Berndt, 1999). Thermogenic methane is usually
more depleted in 13C with values between –15 to -55‰ (Whiticar, 1999). Besides temperature
conditions during formation and the state of maturity, the isotope variations of thermogenic
methane depend on the precursor molecules which are ultimately originated from
photosynthesis and thus already depleted in 13C (Whiticar, 1999). Abiogenic and thermogenic
methane formation are accompanied by the formation of C2+-compounds. While thermogenic
C2+-molecules show a progressive enrichment in 13C with higher carbon numbers, 13C-values
of abiogenic C2+-molecules were not found to show this trend (Lollar et al., 2002).
Anaerobic, microbial degradation of organic matter ultimately leads to methane formation,
mediated by methanogenic archaea at redox levels <-200 mV (Madigan et al., 2000). The
mode of methanogenesis can be classified with respect to the carbon precursor: (1)
hydrogenotrophic (2) acetotrophic and (3) methylotrophic (Whiticar, 1999 and references
therein). Furthermore, methanogenesis is associated with a significant kinetic isotope effect
(KIE) leading to a 13C-depletion of produced methane relative to the residual carbon precursor
(Fig. 5, Whiticar, 1999). That is, the carbon substrate molecules with the lower isotopic mass
(i.e, containing 12C) diffuse and react faster than the heavier species (i.e., containing 13C).

Chapter 1 Introduction
7
KIEs decrease with higher amounts of carbon atoms of the reactants, thus leading to lower
13C-values of methane originated from C1-precoursors compared to that of C2 or C3-
precursors (Whiticar, 1999). Depending on the environmental conditions, i.e. fresh water vs.
marine, other microbial metabolisms compete with methanogenesis for the same substrates. In
marine environments, aerobic respiration is predominant in the top horizon of the sedimentary
sequence followed by nitrate, iron and manganese reduction. Below these sediment layers
sulphate reduction (SR) is predominant. Sulphate reducing bacteria (SRB) out-compete
methanogens for labile carbon compounds (e.g. acetate) and hydrogen. However, once
sulphate is exhausted, methanogenesis becomes a dominant microbial process (Whiticar,
1999). Because volatile carbon substrates like acetate are often already depleted by the SRB
in marine environments, carbonate reduction, i.e. hydrogenotrophy, prevails:
HCO3- (aq) + 9H+
(aq) + 8e- (aq) CH4 (aq) + 3H2O (l), G0 = -159 kJ mol-1 (2)
In fresh water systems, in contrast, methanogenesis proceeds uninhibited once oxygen is
depleted because sulphate concentrations are low and sulphate reduction is thus of minor
importance. In these environments, acetoclastic methanogenesis (acetotrophy) is the
dominating methane-generating process (up to 70%; Whiticar et al., 1999 and references
therein):
CH3COO- (aq) + H+
(aq) + OH-(aq) CH4 (aq) + HCO3
- (aq), G0 = -95 kJ mol-1 (3)
The utilisation of bicarbonate and methylated substrates was suggested to account for the
remaining 30% of methane production.
Chapter 1 Introduction
8
The different origins of methane observed on Earth fuel scientific discussion about the nature
of methane on other planets, and whether methane can be used as a biomarker gas for
extraterrestrial life (Schindler and Kasting, 2000). It is believed that methane on the gas giants
Jupiter, Saturn, Uranus and Neptune as well as on smaller objects such as Titan, one of
Saturn’s moons, is abiogenic. However, the discovery of methane in the Martian atmosphere
by ESAs space probe “Mars Express” is discussed controversially (Formisano et al., 2004;
Krashnopolsky et al., 2004). Methane has a lifetime <400 yr in the Martian atmosphere
compelling a relatively constant formation of methane. Because tectonic activities on Mars
are believed to have ceased 10 million years ago, Krashnapolsky and co-workers (2004)
proposed the possibility of a subsurface, microbial source of the methane.
2.2 Methane Consumption
On Earth, methane is consumed by microbial and chemical pathways. The latter include the
combustion of methane with oxygen. An even more important chemical sink is the reaction
with hydroxyl radicals in the tropo- and stratosphere. Here, hydroxyl radicals are formed as a
result of the photochemical degradation of ozone and a subsequent reaction with water prior
to the reaction with methane (Lelieveld et al., 1998; Levy, 1971):
O3 + h O2 + O* (4)
O* + H2O 2HO* (5)
HO* + CH4 H2O + CH3* (6)
Chapter 1 Introduction
9
Through a reaction cascade involving oxygen and nitrogen monooxide, the CH3 radicals are
then transformed into formaldehyde (Grosjean, 1995).
In the biosphere, bacteria and archaea mediate the biological consumption of methane under
aerobic and anaerobic conditions, respectively. The reaction of aerobic methanotrophy (MOx)
is according to the following equation:
CH4 (aq) + 2O2 (aq) CO2 (aq) + 2H2O (l), G0 = -842 kJ mol-1 (7)
The first MOx bacterium was isolated in 1906 by Söhngen. The basis for the present
phylogenetic classification into biochemically distinct groups was established in the early
70’s (Whittenbury et al., 1970). Organisms involved in aerobic methanotrophy were found
among the , and subdivision of the Proteobacteria and have been reported as free-living
cells from a variety of terrestrial, limnic and marine environments (Hanson and Hanson,
1996). Methanotrophs are also found as intracellular symbionts in invertebrates (Fisher, 1990;
Hanson et al., 1993; Larock et al., 1994; Le Mer and Roger, 2001). The catalyst of MOx is a
group of enzymes termed methane monooxygenases, which is the defining characteristic of
all aerobic methanotrophs. MOx bacteria can be further classified into type I, II and X
according to the enzymatic pathway of formaldehyde assimilation during methane
metabolism. Type I methanotrophs utilise the ribulose monophosphate (RuMP) pathway,
whereas type II utilise the serine pathway (Hanson and Hanson, 1996). Type X
methanotrophs utilise both, the RuMP and the serine pathway. Furthermore, a variety of MOx
bacteria can also use carbon substrates other than methane such as chlorinated hydrocarbons,
especially trichloroethylene, which raised biotechnical interest in these microbes (Hanson and
Hanson, 1996; Wilson and Wilson, 1985).

Chapter 1 Introduction
10
Evidence for the anaerobic oxidation of methane
(AOM) has been first found in organic rich,
anoxic marine sediments. Martens and Berner
(1974) detected that methane was not
accumulating before sulphate was consumed
(Fig. 6). To explain the methane decrease in the
sulphate reducing zone, it was proposed that
methane is oxidised with sulphate as an electron
acceptor (Barnes and Goldberg, 1976; Iversen
and Jørgensen, 1985; Martens and Berner, 1974):
CH4 (aq) + SO42-
(aq) HCO3- (aq) + HS-
(aq) + H2O (l), G0 = -33 kJ mol-1 (8)
The necessity of sulphate as an electron acceptor limits AOM to marine and probably
-although not yet found - to a few sulphate rich, limnic environments. So far, attempts to
isolate anaerobic methanotrophs have failed.
However, combinations of DNA and lipid
biomarker analyses (section 3.2) of
environmental samples provided evidence that
two distinct lineages of archaea mediate AOM,
both of which are closely related to the
methanogenic Methanosarcinales. They are
commonly found in consortium with SRB of the
Desulfosarcina/Desulfococcus cluster which
were termed Seep-SRB1 (Boetius et al., 2000;
Figure 6. Pore water sulphate and methane profiles in anoxic marine sediments.
Figure 7. Microbial consortium of methane oxidising archaea (ANME II, stained red) and sulphate reducing bacteria (Seep SRB 1, stained green (Boetius et al., 2000)
Chapter 1 Introduction
11
Hinrichs et al., 1999; Knittel et al., 2003; Michaelis et al., 2002; Orphan et al., 2001). With
respect to the ability to mediate AOM, the two phylogenetic groups of anaerobic methane
oxidisers were termed ANME-1 and ANME-2. For the first time, these consortia could be
visualised by fluorescence in situ hybridisation (section 1.3.2) in sediments above gas
hydrates at Hydrate Ridge, Oregon (Boetius et al., 2000; Fig. 7). The biochemical functioning
of AOM has not been elucidated yet, but increasing evidence suggest that the process is a
reversal of methanogenesis (Hallam et al., 2004; Hoehler et al., 1994; Krüger et al., 2003;
Valentine and Reeburgh, 2000). The role of the SRB involved in AOM is probably the
removal of an up to now unknown intermediate via SR, maintaining favourable
thermodynamic conditions for AOM according to reaction (8). The stoichiometry of this
reaction has been validated by means of ex situ and in vitro rate measurements for
environments where ANME-1 and/or ANME-2 prevail (Nauhaus et al., 2002; Nauhaus et al.,
2005; Treude et al., 2003).
2.3 Global Budget
An assessment of production and consumption of methane on a global scale is difficult,
because the spatial dimensions and fluxes from several types of methane producing and
consuming environments have not been well constrained. Especially the estimates for polar
environments and the ocean are preliminary and will most likely be adjusted in the future.
However, the identification of major sources and sinks and agreeable estimates of methane
production and consumption allowed for tentative, global budget calculations (Judd et al.,
2002; Lelieveld et al., 1998; Reeburgh 1996). The largest sink of atmospheric methane is
Chapter 1 Introduction
12
within the atmosphere itself where methane is oxidised by hydroxyl radicals according to
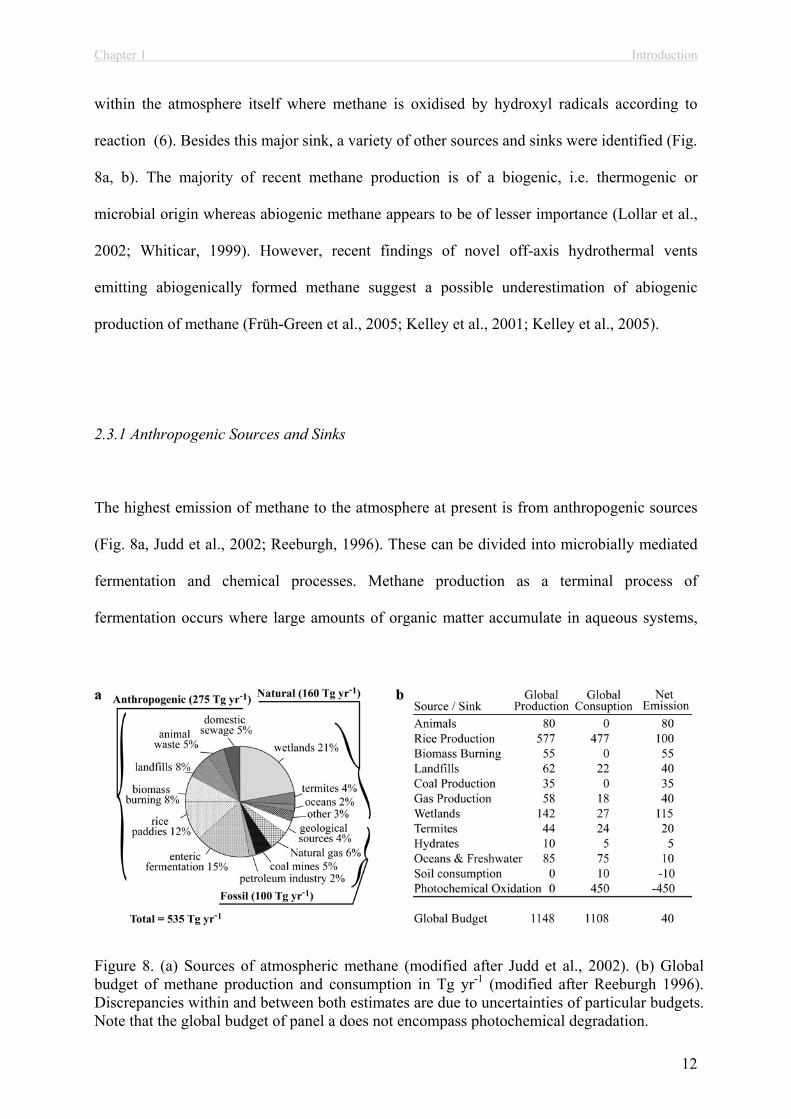
reaction (6). Besides this major sink, a variety of other sources and sinks were identified (Fig.
8a, b). The majority of recent methane production is of a biogenic, i.e. thermogenic or
microbial origin whereas abiogenic methane appears to be of lesser importance (Lollar et al.,
2002; Whiticar, 1999). However, recent findings of novel off-axis hydrothermal vents
emitting abiogenically formed methane suggest a possible underestimation of abiogenic
production of methane (Früh-Green et al., 2005; Kelley et al., 2001; Kelley et al., 2005).
2.3.1 Anthropogenic Sources and Sinks
The highest emission of methane to the atmosphere at present is from anthropogenic sources
(Fig. 8a, Judd et al., 2002; Reeburgh, 1996). These can be divided into microbially mediated
fermentation and chemical processes. Methane production as a terminal process of
fermentation occurs where large amounts of organic matter accumulate in aqueous systems,
Figure 8. (a) Sources of atmospheric methane (modified after Judd et al., 2002). (b) Global budget of methane production and consumption in Tg yr-1 (modified after Reeburgh 1996). Discrepancies within and between both estimates are due to uncertainties of particular budgets. Note that the global budget of panel a does not encompass photochemical degradation.
Chapter 1 Introduction
13
i.e. in flooded rice paddies, waste dumps (landfills) as well as manure and sewage storages.
However, methane is not only produced but also consumed in those systems. For instance, the
rice plants pump oxygen into the soil via their roots (arenchyma) fostering high rates of MOx
(Conrad, 1993; Krüger et al., 2001; Wang et al., 1997). At the same time, the ventilation also
amplifies methane emissions because the major fraction of methane leaves the soil via the
arenchyma (e.g. Wang et al., 1997 and references therein). Furthermore, MOx was found to
consume a substantial fraction of methane which is produced in biofilms covering sewage
outlets (Damgaard et al., 2001).
Another major contribution of anthropogenic methane to the atmosphere is due to the enteric
fermentation in the intestines of ruminants. Ruminants lack enzymes for the break down of
polymeric substances such as cellulose, pectin and other ß-linked carbohydrates. They
therefore host a diverse microbial community, which decomposes these polymers, transforms
the hydrolytic products into volatile fatty acids and builds up microbial protein, which can be
resorbed by the host. The role of the methanogens in this community is to scavenge hydrogen
in order to maintain energetically favourable conditions for the carbohydrate decomposing,
bacterial symbionts resulting in a production of ~83 kg methane cow-1 yr-1 (Benchaar et al.,
1998). Methane oxidizers do not occur in the cow intestines and the methane is directly
released via the esophagus into the atmosphere.
Biomass burning represents a chemical formation pathway of methane. In this process,
methane is produced when organic matter is combusted incompletely. Besides other gases and
smoke, methane is directly released into the atmosphere. Deforestation and fuel-wood use in
tropical areas account for 85% of this methane source (Hao and Ward, 1993).
Chapter 1 Introduction
14
40% of fossil methane emissions to the atmosphere are caused by human explorations of
fossil energy resources (Judd et al., 2002). Methane co-occurs with oil and coal and in the
process of coal mining, gas and oil production methane may escape to the atmosphere as a
result of outgassing and leakage. The co-occurrence of methane and coal is known since the
first underground coal mines. Accordingly, the methane in mines was a termed “mine gas” or
“firedamp” and caused numerous explosions and fatalities in the history of mining.
2.3.2 Natural Sources and Sinks
60% of the fossil methane emissions to the atmosphere comprise natural leakages of both,
marine and terrestrial oil and gas reservoirs (Fig. 8a). A prominent example of a natural
system releasing fossil methane to the atmosphere is the terrestrial mud volcano Lokbatan,
Azerbaijan (Aliyev et al., 2002; Kholodov, 2002). About 900 mud volcanoes occur
terrestrially. Their abundance as well as that of other seep types in the ocean is unknown.
Hence, the estimate for natural sources of fossil methane is poorly constrained.
The highest fraction of natural emissions of recent methane to the atmosphere is contributed
by wetlands. These encompass the tundra, bogs, moors, swamps, alluvial and marshes. For
centuries, methane from wetlands is known as “marsh” or “swamp gas”. These systems are
similar to rice paddies accumulating high contents of organic matter, which is fermented
leading to methanogenesis. By diffusion and advective transport, methane enters the upper,
oxic horizons of wetlands where it is partly oxidised by MOx bacteria.
Termites contribute another significant, natural source of methane to the atmosphere. The
process of methane formation in these animals is similar to that in ruminants. Termites also
Chapter 1 Introduction
15
lack an enzymatic system for the breakdown of polymers, which are their main diet (i.e.,
wood). This type of methane emission is also unregulated.
Soils are a significant sink of atmospheric methane. However, the regulation of methane
consumption in soils by aerobic methanotrophs is a poorly understood process. Its magnitude
may vary with respect to oxygen ventilation, water content and land usage (King, 1992;
Mosier et al., 1997). Recent finding describe methanotrophs which can utilize atmospheric
methane and hence must have extremely efficient enzymes (Bull et al., 2000; Henckel et al.,
2000; Holmes et al., 1999)
70% of the Earth is covered by oceans. Here, anoxic conditions prevail in deeper sediment
strata providing good conditions for microbial methanogenesis. Indeed, stable carbon isotope
ratios confirmed that methane in marine sediments is to a large extend of a microbial origin
(Claypool and Kvenvolden, 1983). Furthermore, the majority of gas hydrate, the largest
methane reservoir on earth, is located in the marine environment (Kvenvolden, 1988).
Calculations of reservoir sizes are highly speculative, however, estimates of gas hydrate
deposits range between 500 and 24000 Gt carbon, which strongly exceed the reservoir size of
conventional gas deposits (140 Gt; Falkowski et al., 2000). It is thus surprising that the marine
methane production and the emission to the atmosphere appear to be comparably small (Fig.
8a, b). There are three major reasons for this phenomenon: (1) the sequestration of methane in
the seabed, (2) localised maxima of organic matter fluxes and (3) most important, the high
capacity for AOM in marine systems.
(1) An oversaturation of methane reaching PT conditions of hydrate stability lead to gas
hydrate formation. The majority of gas hydrates within the hydrate stability zone is
relatively “safely” locked within the sediments and will remain there unless temperature
Chapter 1 Introduction
16
and pressure conditions will change (Judd et al., 2002). Submarine earthquakes and local
gas hydrate dissociation can trigger sub marine landslides which can lead to a subsequent,
large-scale release of seabed gas hydrates into the water column and consequently to the
dissociation of the upward floating hydrates. This scenario, also known as the “clathrate
smoking gun” hypothesis, might have altered Earth climate 55 million years ago leading
to a rise of atmospheric temperatures which allowed modern mammals to propagate
globally (Kennett et al., 2000; Kerr, 1999).
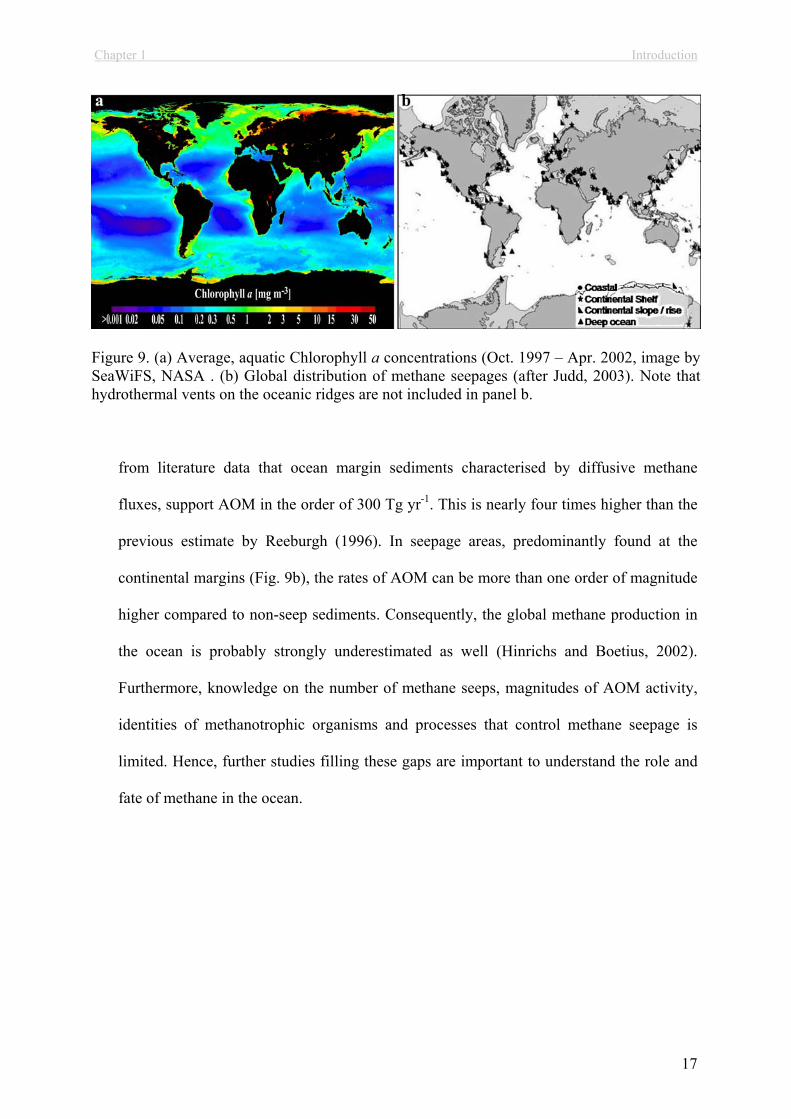
(2) The bulk of methane is produced in continental shelf areas which comprise only ~3.5% of
the total area covered by the oceans (Reeburgh, 1996). High rates of primary production
in the largely euphotic water column of the shelf seas is fostered by nutrient inputs from
rivers, upwelling and a fast recycling of organic matter in the seabed that releases
nutrients back into the water column (Fig. 9a; Lohrenz et. al, 1997; Graf et al., 1992; Graf
et al., 1983; Field et al., 1998; Johnson et al., 1999). In contrast, only 1-5% of surface
primary production reaches the sea floor of the abyssal and bathyal ocean as a result of
biodegradation of detritus particles during sedimentation.
(3) The bulk of methane oxidation in marine sediments is mediated anaerobically consuming
>80% of uprising methane in the sediments (Reeburgh, 1996). The high capacity for
AOM in the oceans is supported by the high availability of the electron acceptor sulphate
exceeding oxygen concentrations by 100-fold in sea water. This makes sulphate an ample
electron acceptor in marine sediments. In contrast, the penetration depth of oxygen into
the sediment is very limited as a result of oxygen consuming process other than MOx.
One may assume that AOM rates in the sediment reflect the flux of organic matter,
however, according to the limited amount of currently available data, this link appears to
be relatively weak (Hinrichs and Boetius, 2002). Hinrichs and Boetius (2002) extrapolated
Chapter 1 Introduction
17
Figure 9. (a) Average, aquatic Chlorophyll a concentrations (Oct. 1997 – Apr. 2002, image by SeaWiFS, NASA . (b) Global distribution of methane seepages (after Judd, 2003). Note that hydrothermal vents on the oceanic ridges are not included in panel b.
from literature data that ocean margin sediments characterised by diffusive methane
fluxes, support AOM in the order of 300 Tg yr-1. This is nearly four times higher than the
previous estimate by Reeburgh (1996). In seepage areas, predominantly found at the
continental margins (Fig. 9b), the rates of AOM can be more than one order of magnitude
higher compared to non-seep sediments. Consequently, the global methane production in
the ocean is probably strongly underestimated as well (Hinrichs and Boetius, 2002).
Furthermore, knowledge on the number of methane seeps, magnitudes of AOM activity,
identities of methanotrophic organisms and processes that control methane seepage is
limited. Hence, further studies filling these gaps are important to understand the role and
fate of methane in the ocean.
Chapter 1 Introduction
18
3. METHANE-RICH HABITATS
Various types of methane-rich sedimentary habitats were discovered in marine environments.
These habitats might be fuelled with microbial methane from in situ methanogenesis or with
fossil methane from deeper reservoirs. Nothing is known on sediments hosting abiogenic
methane. In general, methane-rich habitats can be ranked according to the amount of methane
transported into near-surface sediment horizons and/or methane discharge into the
hydrosphere. Among the most active systems are the so-called cold seeps, which can be
defined as an environment where gas and/or fluids are transported by advective processes
from ocean sediments into the hydrosphere, often in the form of ebullition of free gas. Apart
from their potential role in the global methane cycle, these systems are spectacular oases of
life formed by chemosynthetic communities. Similar to the hot vents, various cold seep
environments were found to support enormous amounts of microbial and invertebrate biomass
either directly fuelled by methane or indirectly by the AOM end product sulphide (Boetius
and Suess, 2004 and references therein). Furthermore, cold seeps are often associated with
authigenic carbonates forming crusts, chimneys or reef-like structures (Hovland and Judd,
1988). Besides the cold seeps, a variety of less active and less spectacular but with respect to
the global budget more important methane-rich sediments are wide spread on the continental
shelf (Hinrichs and Boetius, 2002; Judd et al., 2002).
With an emphasis to the habitats studied in this thesis, the following section (3.1.) describes
common properties of methane-rich habitats in the marine environment. The differentiation
between methane-rich geo-bio-systems is based on more or less long-lived features such as
size, shape and venting activity. Hence, some definitions overlap. At the end of this section
Chapter 1 Introduction
19
(3.2), an overview of analytical tools for the determination of microbial key players and
metabolic turnover rates of methane is provided.
3.1 Habitats
Mud volcanoes – These structures were previously identified as an important escape pathway
of methane and higher hydrocarbons and were reported from terrestrial and oceanic settings
(Dimitrov, 2002; Dimitrov, 2003; Judd et al., 2002; Kopf et al., 2001). Mud volcanism is
caused by various geological processes such as tectonic accretion and faulting, rapid burial of
sediments, slope failures or fluid emissions from mineral dehydration. These processes can
lead to an abnormally high pore fluid pressure and the extrusion of mud and fluids through a
central conduit to the sea floor which is often accompanied by the expulsion of methane and
higher hydrocarbons (Charlou et al., 2003; Kopf, 2002; Milkov, 2000; Somoza et al., 2003).
Methane from mud volcanoes can be of thermogenic and/or microbial origin, depending on
the oceanographic and tectonic setting. The shape of these structures is diverse, ranging from
amorphous mud pies to conical structures from a few meters to kilometres in size. While there
is a reliable number of ~900 known terrestrial mud volcanoes, estimates for deep water mud
volcanoes, mainly situated along the continental margins, range between 800 and 100000
(Dimitrov, 2002; Dimitrov, 2003; Milkov, 2000; Milkov et al., 2003). This makes budget
calculations very preliminary. However, global estimates suggest that terrestrial and shallow
water mud volcanoes contribute between 2.2 and 6.0 Tg yr-1 of methane to the atmosphere and
that 27 Tg yr-1 of methane may escape from deep water mud volcanoes (Dimitrov, 2003;
Milkov et al., 2003). Mud volcanism is therefore a key process in the global methane cycle.

Chapter 1 Introduction
20
Mud volcanoes may erupt violently in regular or irregular time intervals or emit mud, fluid
and gases continuously. Three types of mud volcanoes are distinguished (Dimitrov, 2003 and
references therein):
(1) Lokbatan-type: This type of mud volcanisms was named after the Lokbatan mud
volcano, Azerbaijan. Lokbatan type mud volcanoes are characterised by violent
outbreaks and long phases of dormancy.
(2) Chikishlyar-type: Calm, relatively weak and continuous venting of gas, water and mud
are typical for this type of mud volcano.
(3) Shugin-type: This type of mud volcanism is transitional between the other types,
characterised by long periods of weak activity interrupted by eruptive events.
Dimitrov (2003) suggests that this type of mud volcanism is the most common.
Mud volcanoes can become inactive when the source of gas expansion and fluid flow stops
(Planke et al., 2003). Most oceanic mud volcanoes were discovered and investigated in the
last decade, when the appropriate high-resolution geophysical tools and submersibles became
available to science. In many cases it is therefore unknown what activity-type a particular
mud volcano may represent as eruptive events could be separated by extremely long periods
(>100 yr) of dormancy.
Mud volcanoes were found to support a wide range of seep-related biomass. Authigenic
carbonates and other seepage features maybe present or absent, depending on the history and
activity of the mud volcano. The Håkon Mosby Mud Volcano, which is the focus of the
chapters 2 to 4 of this thesis, might be a comparably active Chikishlyar- or Shugin-type,

Chapter 1 Introduction
21
whereas those mud volcanoes studied in the Gulf of Cadiz (chapter 5) appear to be either
weak Chikishlyar- or Lokbatan-types.
Gas seeps – Gas seep systems are generally characterized by high rates of AOM and
associated biomass (Boetius et al., 2000; Boetius and Suess, 2004; Elvert et al., 1999; Joye et
al., 2004; Michaelis et al., 2002; Orphan et al., 2004; Treude et al., 2003). Gas seeps are
associated with gas leakages from ancient gas reservoirs, gas hydrate dissociation and gas
escape from shallow gas accumulations. Gas seepage may co-occur with fluid seepage. Gas
seeps provide a permanently high supply of methane to surface sediment and methane is
discharged via gas ebullition into the hydrosphere. Prominent examples of hydrate driven gas
seeps are Hydrate Ridge, Oregon (Boetius and Suess, 2004; Suess et al., 1999) and cold seeps
in the Gulf of Mexico (Joye et al., 2004). High amounts of seep related biota and carbonates
were reported from these systems (Sibuet and Olu, 1998). The gas seep studied in this work
(Tommeliten, North Sea, chapter 6) is fed by thermogenic methane escaping from a deep
reservoir through a central conduit. The Tommeliten seep area also comprises small
pockmark-like depressions of a few meters in size which were probably formed due to gas
escape (Hovland and Judd, 1988).
Pockmarks - Pockmarks are an ubiquitous phenomenon which have been reported from
various oceanographic and geological settings and can be formed by multiple processes
(Hovland and Judd, 1988; Judd, 2003; Whiticar and Werner, 1981; Zuhlsdorff and Spiess,
2004). These may or may not be associated to recent gas venting.
(1) One type of pockmarks forms when gases and/or fluids are trapped in shallow
reservoirs below impermeable sediments. Here, increasing pressure leads to a dome-
like swelling of subsurface- and subsequently of surface sediments. Once an escape

Chapter 1 Introduction
22
path to the sea floor is established, the pressure drop results in an outburst of gas/fluids
and mobilised sediments (Judd et al., 1994; Woolsey et al., 1975). After the initial
outburst, these pockmarks may either become inactive if the sub surface reservoir of
gas/fluid is depleted or undergo cycles of activity that are interrupted by phases of
dormancy where the shallow reservoir is recharged and no or little seepage occurs
(Çifçi et al., 2003; Hovland and Judd, 1988). This type of pockmarks is therefore
similar to mud volcanoes as described above with the exception that pockmarks do not
emit large amounts of solid matter (mud) over longer time scales.
(2) A second process of pockmark formation is suggested to occur when sub-surface gas
hydrates destabilise. This mode of formation might have been common on continental
shelves covered by seabed ice during the last glacial maximum. Melting of this ice
would have caused a catastrophic release of potential sub-surface gas hydrate (Judd et
al., 2002).
(3) Pockmarks may also be formed by processes which are not related to gas emissions
but to focused fluid flow leading to failures in the sediments and thus to the observed
pockmark structure. This type of pockmark was for instance found in Eckernförde Bay
(Whiticar, 2002).
Similar to mud volcanoes, the contribution to atmospheric methane from pockmarks is
difficult to estimate. With respect to vent activity, pockmarks may be encrusted with
authigenic carbonates and support seep related biomass.
Chapter 1 Introduction
23
Hydrothermal vents - Along the mid-ocean spreading zones, the interaction between hot
basaltic material and cold seawater drives hydrothermal flow. Reduced chemical compounds
are formed by rock-water interactions and ions dissolve in the heated seawater. Once the
water is ejected and mixed with the cold surrounding seawater, the solutes precipitate and
form large chimneys (e.g., black smokers). These systems support enormous amounts of
biomass based on free-living and endosymbiotic, thiotrophic bacteria which utilise sulphur
compounds that are expelled (Canganella, 2001; Corliss et al., 1979). Not much is known on
the occurrence of AOM in hydrothermal systems, but some evidence points to the existence
of thermophilic ANME groups (Kelley et al., 2005; Teske et al., 2002).
Permanently anoxic waters – The lower part of the Black Sea is the most prominent anoxic,
marine water body covering numerous mud volcanoes, pockmarks, gas seepage, gassy
sediments and diffusive systems. Here, the anoxic conditions allow AOM communities to
form reef structures purely consisting of microbial biomass and methane related carbonates
(Michaelis et al., 2002; Pimenov et al., 1997). Furthermore, biomarker evidence suggest that
AOM also occurs within the euxenic water column (Schouten et al., 2001).
Gassy coastal sediments – In situ methanogenesis is usually the source of methane in these
systems. High production rates lead to supersaturation and consequently to the formation of
methane gas bubbles (Martens et al., 1986; Whiticar, 2002). The sulphate methane transition
zone (SMT) is usually found within the upper few metres of the sediment, however,
occurrences of gas ebullition from these sediments were also reported (Garcia-Gil et al.,
2002). Gassy sediments are likely to occur in estuaries, rias (drowned valleys) and bays
characterised by high deposition rates of organic matter.
Chapter 1 Introduction
24
Diffusive systems – Molecular diffusion is the sole transport mechanism in these sediments
whereas advective processes accelerating fluids and gas transport are absent (Judd et al.,
2002). Similar to gassy sediments, microbial in situ production is commonly the source of
methane which is then consumed by AOM in overlying, sulphate rich sediment horizons
(Hensen et al., 2003; Iversen and Jørgensen, 1985; Niewöhner et al., 1998). As a general rule,
the SMT is located some meters below sea floor. Consequently, methane does not escape to
the hydrosphere. Although gassy sediments and diffusive systems are characterised by
comparably low methane production and consumption rates, their areal extension make them
highly important with respect to the global methane budget (Hinrichs and Boetius, 2002).
3.2 Detection of methanotrophic organisms and assessment of metabolic rates
3.2.1 Lipid biomarker
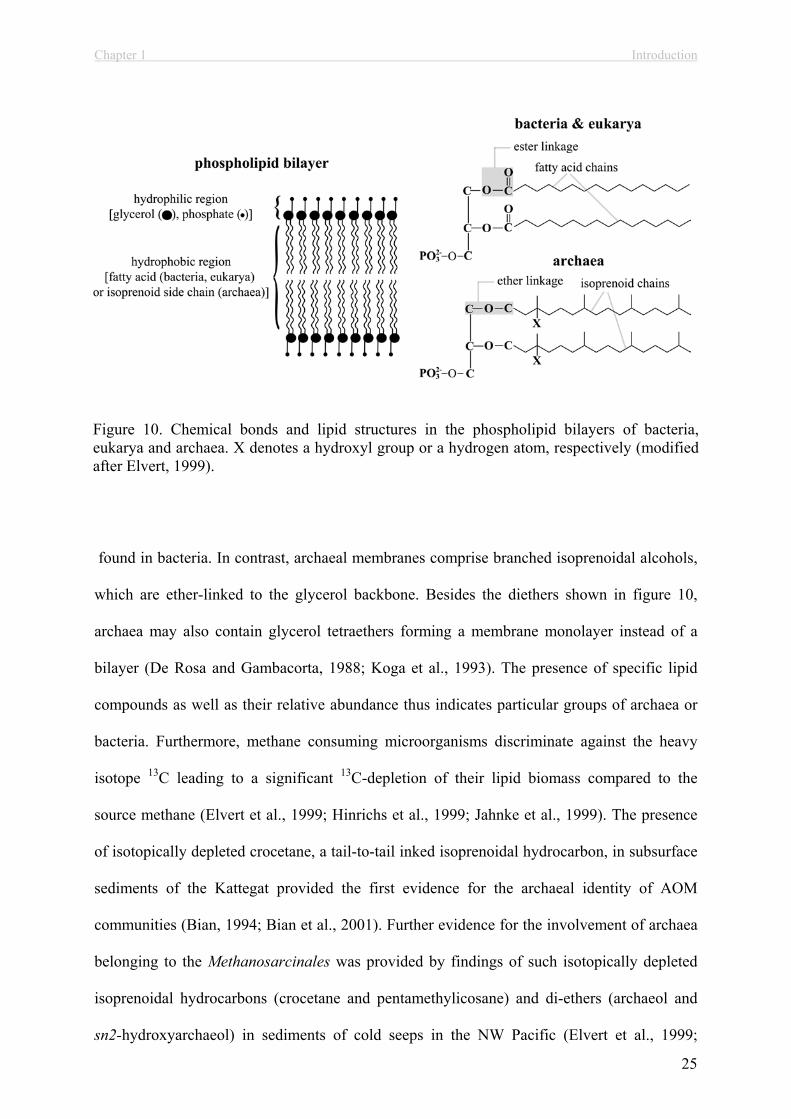
As described in section 2.2, MOx is mediated by methanotrophic bacteria, and AOM by
archaea in consortium with SRB. The analyses of lipid membrane structures is a useful
criteria for differentiating archaea from bacteria (or eukaryotes) and to determine the
community structure of microbial assemblages as well as to link these to dominant
biogeochemical processes (Boschker et al., 1998; Madigan et al., 2000). In general, bacterial
membranes consist of phospholipid bilayers built from fatty acids which are bound via an
ester bond to the glycerol backbone (Fig. 10). The fatty acids may contain double bonds,
methyl branching or C3 ring structures. Higher organisms (eukaryotes) also synthesise fatty
acids, however, the suite of fatty acids commonly found in eukaryotes differs from those
Chapter 1 Introduction
25
Figure 10. Chemical bonds and lipid structures in the phospholipid bilayers of bacteria, eukarya and archaea. X denotes a hydroxyl group or a hydrogen atom, respectively (modified after Elvert, 1999).
found in bacteria. In contrast, archaeal membranes comprise branched isoprenoidal alcohols,
which are ether-linked to the glycerol backbone. Besides the diethers shown in figure 10,
archaea may also contain glycerol tetraethers forming a membrane monolayer instead of a
bilayer (De Rosa and Gambacorta, 1988; Koga et al., 1993). The presence of specific lipid
compounds as well as their relative abundance thus indicates particular groups of archaea or
bacteria. Furthermore, methane consuming microorganisms discriminate against the heavy
isotope 13C leading to a significant 13C-depletion of their lipid biomass compared to the
source methane (Elvert et al., 1999; Hinrichs et al., 1999; Jahnke et al., 1999). The presence
of isotopically depleted crocetane, a tail-to-tail inked isoprenoidal hydrocarbon, in subsurface
sediments of the Kattegat provided the first evidence for the archaeal identity of AOM
communities (Bian, 1994; Bian et al., 2001). Further evidence for the involvement of archaea
belonging to the Methanosarcinales was provided by findings of such isotopically depleted
isoprenoidal hydrocarbons (crocetane and pentamethylicosane) and di-ethers (archaeol and
sn2-hydroxyarchaeol) in sediments of cold seeps in the NW Pacific (Elvert et al., 1999;
Chapter 1 Introduction
26
Hinrichs et al., 1999). Similarly, 13C-depleted fatty acids with 16 or 18 carbon atoms and
double bonds at the -8 position (C16:1 8, C18:1 8, respectively) are a diagnostic marker for
MOx-bacteria (Hanson and Hanson, 1996).
16S rDNA - A second way to detect methanotrophic communities is the analysis of 16S rDNA
sequences. This method dates back on the pioneer work of Woese and Fox (1977) on
ribosomal DNA as an appropriate molecular marker for phylogenetic relationships. It takes
advantage of the very low mutation rate of the genes encoding the nucleotide sequence of the
ribosomes. Furthermore, it is thought that lateral gene transfer does not affect these genes.
Hence, the nucleotide sequences encoding these genes slowly change with time and the
degree of similarity constantly increases at lower taxonomical levels. The rapidly increasing
size of the global nucleotide data bases (e.g. Entrez Nucleotides database,
www.ncbi.nlm.nih.gov), that contains roughly 40 billion bases (status 2004), and
developments of software tools for phylogentic tree calculations (e.g., ARB, Ludwig et al.,
2004) allow to match unknown environmental sequences against sequences of cultured and
uncultured relatives for taxonomical identification. Using this method, the current phylogentic
classification of methanotrophic bacteria and archaea as well as sulphate reducing bacteria
that are putatively involved in AOM has been established (e.g., Hanson and Hanson, 1996;
Knittel et al., 2003; Knittel et al., 2005; Orphan et al., 2001).
FISH - Direct visualisation and quantification of microbes in environmental samples became
possible by means of fluorescence in situ hybridisation (FISH; Amann et al., 1990). Similar to
16S rDNA analysis, this method takes advantage of the conserved structure of ribosomes.
Here, a fluorescence dye is conjugated to a short oligonucleotide sequence (probe)
complementary designed to unique regions of the ribosomal RNA. Consequently, intact cells
carrying fluorescently labelled probes, positively bound by base pairing to the ribosomes,
Chapter 1 Introduction
27
light up at specific wavelengths and can be quantified by fluorescence microscopy. With this
method, spherical ANME-2/DSS consortia from Hydrate Ridge were the first AOM
communities that could be visualised (Boetius et al., 2000). Subsequent discoveries found
ANME-2 and/or ANME-1 in consortium with SRB at many cold seep systems (Michaelis et
al., 2002; Orphan et al., 2002; Treude, 2003).
AOM and SR rates – Anaerobic oxidation of methane coupled to sulphate reduction is the key
process consuming methane in the world oceans (see section 2.3). Estimates for AOM and SR
rates can be gained by measuring metabolic activities directly after sediment retrieval (ex situ)
under simulated in situ conditions (usually temperature). This technique is based on the work
of Iversen and Jørgensen (1985). Here, sediment is incubated with trace amounts of 14CH4 and
35SO42-, which is metabolised with almost the same velocity as the non-radioactive substrate.
The concentrations of methane and sulphate as well as the ratios of the radioactive products
relative to the radioactive reactants determine the magnitude of the ex situ rates. This
technique revealed that a substantial fraction of uprising methane is consumed within the
sediment and that the metabolic activity of AOM communities can be very high (>4 mol m2
yr-1) at cold seep systems (Boetius et al., 2000; Joye et al., 2004; Nauhaus et al., 2002; Treude
et al., 2003). Aerobic oxidation of methane can be measured with the same technique. Besides
this technique, concentration gradients of methane and sulphate dissolved in porewater can be
used as a proxy for rates of AOM and SR. This method is limited to diffusive systems without
further model fits. According to Fick’s first law of diffusion, the fluxes can be calculated by
determining the concentration gradients and the diffusion coefficients of methane and
sulphate. This approach has been used successfully to infer AOM rates at non-seep
environments (Hensen et al., 2003; Niewöhner et al., 1998) where rates are often at the
detection limit of tracer-incubation techniques (i.e., <55 mmol m-2 yr-1 on average)
Chapter 1 Introduction
28
4. OBJECTIVES OF THIS PHD THESIS
In this thesis I used a combination of different analytical tools to acquire an understanding of
the spatial distribution of methane turnover and the responsible microorganisms in different
geo-bio-systems. Several systems with various degrees of activity in methane turnover were
explored during this thesis. These systems were barely known with respect to biogeochemical
and microbiological processes. The Håkon Mosby Mud Volcano has been discovered during
geophysical surveys, and the concentric distribution of different biocoenoses has been
described, but the biogeochemical and microbiological causes for this zonation were not
known. The Gulf of Cadiz mud volcanoes and the Tommeliten gas seeps have not been
investigated before in terms of biogeochemistry and microbial ecology. For each habitat
studied, the following questions were of particular interest:
What microbial key players are present?
How abundant are they?
What are the dominant pathways of methane consumption?
What is the magnitude of methane consumption?
What is the relation between lipid signatures, DNA profiles, cell counts and activities?
What are the dominant factors controlling the environment?
Is there a contribution of methane to the hydrosphere?
The central aim of this thesis was a systematic study of the microbial ecology and
biogeochemistry of these novel systems. Collaborations with scientists from other scientific
disciplines allowed comparing biological, biogeochemical and physical data sets and to
determine the mechanisms controlling vent activity and the distribution of seep related biota.

Chapter 1 Introduction
29
In combination with biogeochemical data, direct sea floor observations, facilitated by sledge
cameras or remotely operated vehicles (ROV), allowed to estimate if methane escapes to the
hydrosphere.
5. CHAPTERS AND PUBLICATIONS OUTLINE
This work includes the first version of five manuscripts (chapters 2-6). All manuscripts will
be submitted within the next months, depending on the comments by the co-authors. The final
discussion is a synthesis of the work presented in the articles (chapters 2-6), which appear in
the order as described in the following. All articles were written by myself, with the exception
of the manuscript presented in chapter 2 which was jointly written with Antje Boetius. Both
Antje Boetius and Marcus Elvert advised me in the writing process of each article.
Chapter 2. Microbial colonization of a submarine mud volcano: how subsurface fluid
flow structures methanotrophic communities
(to be submitted to Nature)
Helge Niemann, Tina Lösekann, Dirk de Beer, Marcus Elvert, Katrin Knittel, Rudolph I.
Amann, Eberhard Sauter, Michael Schlüter, Michael Klages, Jean P. Foucher, Antje Boetius
Geological features such as turbidity flows, slope failures and mud volcanoes are known to
deposit large amounts of sub-surface mud to the sea floor. These newly formed habitats are

Chapter 1 Introduction
30
colonised by microbial communities shaping the benthic environment. This article describes a
multidisciplinary approach to study the identities and environmental factors determining the
development and selection of microbial communities in such newly created habitats at the
arctic Håkon Mosby Mud Volcano (HMMV, 72° N, 14°.44’ E, 1250 m water depth). HMMV
was visited twice during joint international research cruises with R/V Atalante and R/V
Polarstern. Most of the sampling was facilitated with ROV Victor 6000. A combination of
lipid biomarker, 16S rDNA and FISH analyses identified multiple groups of methanotrophs
and provided evidence that the high methane flow at HMMV supports all known
methanotrophic guilds, i.e. MOx bacteria (type I methanotroph, Methylococcus sp.), a novel
AOM community (ANME-III / Desulfobulbus sp. aggregate) and symbiotic MOx bacteria
(associated with the pogonophoran worm Oligobrachia haakonmosbiensis). The
methanotrophic communities were respectively found to prevail in distinct, concentrically
arranged habitats. Decisive factors determining about the success of the methanotrophic
guilds were identified as a combination of pore water flow, bio ventilation and growth rate.
Field work organisation and sampling for lipid biomarker, 16S rDNA FISH analysis as well
as for methane, sulphate, porosity AOM and SR rate measurements were performed by
myself. Parts of the sulphate data were acquired by Eberhard Sauter and Michael Schlüter.
Dirk deBeer performed microsensor measurements. Lipid biomarker analysis was
accomplished by myself. Methane, sulphate, AOM and SR rate measurements were
accomplished by myself with help by project technicians of Antje Boetius. Tina Lösekann
carried out FISH and DNA analysis.
Chapter 1 Introduction
31
Chapter 3. Lipid signatures and distribution of methanotrophic microbial communities
at Håkon Mosby Mud Volcano, Barents Sea
(to be submitted to Geobiology)
Helge Niemann, Marcus Elvert, Tina Lösekann, Jakob Jakob, Thierry Nadalig, Antje Boetius
This study provides a detailed analysis of lipid biomarkers in sediments of HMMV. The lipid
analysis shown here provides evidence that methane oxidation is the base of the food web at
HMMV. Diagnostic molecules of the newly discovered ANME-3 / Desulfobulbus sp.
community and the type I methanotroph are presented. Furthermore, a phylogentic tree of the
ANME-3 archaea and a correlation between concentrations of specific lipids and aggregate
counts is provided.
Sampling for lipid, 16S rDNA and FISH analysis were accomplished by Antje Boetius, Tina
Lösekann, Thierry Nadalig and myself. Lipid analysis was carried out by myself under the
supervision of Marcus Elvert. During that time I instructed Jakob Jakob for a lab rotation
analysing a fraction of the biomarker samples. Tina Lösekann performed DNA analysis
whereas Thierry Nadalig carried out the FISH analysis.

Chapter 1 Introduction
32
Chapter 4. Aerobic and anaerobic oxidation of methane in sediments of Håkon Mosby
Mud Volcano, Barents Sea
(to be submitted to Limnology and Oceanography)
Helge Niemann, Eberhard Sauter, Martin Krüger, Friederike Heinrich, Tina Lösekann,
Marcus Elvert, Antje Boetius
This article provides a detailed analysis of methane oxidation and SR rates in sediments of
HMMV. The predominant modes of methane oxidation, i.e. MOx and AOM, as well as their
magnitudes are shown and an overview of the variability of methane oxidation and SR within
this habitat is provided. With the aid of chloride and bromide concentration profiles, fluid
flow is pointed out as one factor determining the mode of methane oxidation. Moreover,
physiological parameters of ANME-3 such as temperature optimum, response to substrate
concentration and the stoichiometry of AOM were analysed.
Together with Friederike Heinrich, Antje Boetius and myself carried out sediment sampling
for the in vitro experiments, AOM and SR rate, methane and sulphate concentration and
porosity measurements. Subsampling for sulphate concentrations as well as sulphate
concentration measurements were carried out by Eberhard Sauter and myself. Eberhard Sauter
also acquired the sediment samples for bromide and chloride and measured these
concentrations. AOM and SR rate, methane and sulphate concentration as well as porosity
measurements were carried out by myself with help by project technicians of Antje Boetius.
Friederike Heinrich and Martin Krüger performed the in vitro experiments.
Chapter 1 Introduction
33
Chapter 5. Microbial methane turnover at mud volcanoes of the Gulf of Cadiz
(to be submitted to Geochimica et Cosmochimica Acta)
Helge Niemann, Joana Duarte, Christian Hensen, Enoma Omoregie, Vito. H. Magalhães,
Marcus Elvert, Luis Pinheiro, Achim Kopf, Antje Boetius.
The Gulf of Cadiz (GoC) is an area characterised by numerous mud volcanoes, diapirs and
pockmarks. However, the activity of mud volcanism as well as the identity of potential
methane oxidisers is unknown from this region. This article provides an overview of vent
activity and associated microorganisms of several mud volcanoes in the Gulf of Cadiz, which
were sampled during the GAP (Gibraltar Arc Processes) cruise with R/V Sonne. Prior to
sampling, most mud volcanoes were investigated with a video sledge to identify potential
locations of increased vent activity. However, these observations could not reveal any sign of
recent fluid or gas venting. Using a multidisciplinary approach, sediment samples were
analysed for pore water constituents, AOM and SR rates, lipid biomarker contents and 16S
rDNA signatures. This revealed a complete reduction of thermogenic methane and associated
higher hydrocarbons mediated by multiple AOM communities in defined sub-surface
horizons of the studied mud volcanoes.
This study was carried out by myself and is part of a Portuguese-German collaboration
between the University of Aveiro, the University of Bremen and the Max Planck Institute for
Marine Microbiology. All of the sampling as well as the laboratory analyses were performed
by myself with the exception of sulphate and sulphide concentration measurements and
diffusive flux calculations, which were carried out by Christian Hensen. During that time I
introduced lipid analyses as well as AOM and SR rate measurements to Joana Duarte, who I
instructed in her master thesis. She analysed parts of the lipids, AOM, SR rate and porosity of
Chapter 1 Introduction
34
the samples. Vito. H. Magalhães and L. Pinheiro provided seismic sections and areal maps.
Enoma Omoregie performed the 16S rDNA analyses.
Chapter 6. Methane emission and consumption at a North Sea gas seep
(Tommeliten area)
(to be submitted to Biogeosciences)
H. Niemann, M. Elvert, M. Hovland, B. Orcutt, A. Judd, I. Suck, J. Gutt, S. Joye, E. Damm,
K. Finster, A. Boetius
Most studies on methane rich habitats were conducted in highly active seep environments at
the continental slopes. This article deals with a seep system located in the Tommeliten area,
central North Sea, at 75 m water depth. During two cruises with R/V Heinke, video imaging
and hydroacoustic profiling showed recent seepage from small point sources. Similar to
highly active seeps, the methane at Tommeliten is consumed in a defined sediment horizon
where methane related, authigenic carbonates were found. The identities of methane oxidising
communities as well as the community size was analysed by lipid biomarker, 16S rDNA and
FISH analyses. Slabs of methane related carbonates outcropping the sea floor were found to
provide a hard substrate, on the sandy seafloor. These carbonates were densely colonised by
sessile invertebrates showing that methane seepage and related processes effectively shape the
environment.
Chapter 1 Introduction
35
Sampling and onboard work was organised by Antje Boetius and myself. Lipid biomarker,
16S rDNA and FISH analysis as well as AOM and SR rate, sulphate and sulphide
concentration and the in vitro experiment were accomplished by myself. Beth Orcutt
performed the methane concentration measurements, Inken Suck and Julian Gutt carried out
video imaging and Jens Wunderlich and Gerd Wendt performed the hydroacoustic
measurements.
Chapter 7. Final Discussion and conclusion
Helge Niemann
In this chapter, the data acquired during this PhD work are summarised and discussed in a
global context. Environmental factors determining the magnitude of AOM as well as the hot
spots of methane oxidation in the environment are presented. An overview on the key
microbial players as well as diagnostic lipid patterns typifying methanotrophic communities is
provided as well. Also, the impacts of methane turnover on the adjacent marine environments
at cold seeps are highlighted. Finally, an outlook on potential future research on methane
turnover in marine sediments is given.
Chapter 1 Introduction
36
References
Aliyev A. A., Guliyev I. S., and Belov I. S. (2002) Catalogue of recorded eruption of mud volcanoes of Azerbaijan (for period of years 1810-2001). Nafta Press, Baker.
Amann R. I., Krumholz L., and Stahl D. A. (1990) Fluorescent-oligonucleotide probing of whole cells for determinative, phylogenetic, and evironmental studies in microbiology. Journal of Bacteriology 172, 762-770.
Barnes R. O. and Goldberg E. D. (1976) Methane Production and Consumption in Anoxic Marine-Sediments. Geology 4(5), 297-300.
Benchaar C., Rivest J., Pomar C., and Chiquette J. (1998) Prediction of methane production from dairy cows using existing mechanistic models and regression equations. Journalof Animal Science 76(2), 617-627.
Bian L. Q. (1994) Isotopic biogeochemistry of individual compounds in a modern coastal marine sediment (Kattegat, Denmark and Sweden). Master thesis, Indiana University.
Bian L. Q., Hinrichs K. U., Xie T. M., Brassell S. C., Iversen H., Fossing H., Jorgensen B. B., and Hayes J. M. (2001) Algal and archaeal polyisoprenoids in a recent marine sediment: Molecular isotopic evidence for anaerobic oxidation of methane. Geochemistry Geophysics Geosystems 2, U1-U22.
Boetius A., Ravenschlag K., Schubert C., Rickert D., Widdel F., Gieseke A., Amann R., Jørgensen B. B., Witte U., and Pfannkuche O. (2000) A marine microbial consortium apparently mediating anaerobic methane of oxidation. Nature 407, 623-626.
Boetius A. and Suess E. (2004) Hydrate Ridge: a natural laboratory for the study of microbial life fueled by methane from near-surface gas hydrates. Chemical Geology 205(3-4),291-310.
Boschker H. T. S., Nold S. C., Wellsbury P., Bos D., de Graaf W., Pel R., Parkes R. J., and Cappenberg T. E. (1998) Direct linking of microbial populations to specific biogeochemical processes by 13C-labelling of biomarkers. Nature 392, 801-805.
Bull I. D., Parekh N. R., Hall G. H., Ineson P., and Evershed R. P. (2000) Detection and classification of atmospheric methane oxidizing bacteria in soil. Nature 405, 175-178.
Campbell I. M. (1986) Energy and the atmosphere: A physical-chemical approach. John Wiley & Son Ltd.
Canganella F. (2001) Hydrothermal vent ecosystems and representative hyperthermophilic microorganisms. Annals of Microbiology 51(1), 11-27.
Carroll J. J. (2002) Natural Gas Hydrates: A Guide for Engineers. Gulf Professional Publishers.
Charlou J.-L. and Donval J.-P. (1993) Hydrothermal methane venting between 12 N and 26 N along the Mid-Atlantic Ridge. Journal of Geophysical Research 98, 9625-9642.
Charlou J. L., Donval J. P., Zitter T., Roy N., Jean-Baptiste P., Foucher J. P., and Woodside J. (2003) Evidence of methane venting and geochemistry of brines on mud volcanoes of the eastern Mediterranean Sea. Deep-Sea Research Part I-Oceanographic Research Papers 50(8), 941-958.
Çifçi G., Dondurur D., and Ergün M. (2003) Deep and shallow structures of large pockmarks in the Turkish shelf, Eastern Black Sea. Geo-Marine Letters 23(3-4), 311-322.
Claypool G. E. and Kvenvolden K. A. (1983) Methane and Other Hydrocarbon Gases in Marine Sediment. Annual Review of Earth and Planetary Sciences 11, 299-327.
Conrad R. (1993) Mechanisms controlling methane emissions from rice fields. In Thebiogeochemistry of global change: radiative trace gases (ed. R. S. Oremland), pp. 317-335. Chapman & Hall.
Chapter 1 Introduction
37
Corliss J. B., Dymond J., Gordon L. I., Edmond J. M., Herzen R. P. V., Ballard R. D., Green K., Williams D., Bainbridge A., Crane K., and Vanandel T. H. (1979) Submarine Thermal Springs on the Galapagos Rift. Science 203(4385), 1073-1083.
Damgaard L. R., Nielsen L. P., and Revsbech N. P. (2001) Methane microprofiles in a sewage biofilm determined with a microscale biosensor. Water Research 35(6), 1379-1386.
De Rosa M. and Gambacorta A. (1988) The lipids of archaebacteria. Progress in Lipid Research 27, 153-175.
Dimitrov L. I. (2002) Mud volcanoes - the most important pathway for degassing deeply buried sediments. Earth-Science Reviews 59(1-4), 49-76.
Dimitrov L. I. (2003) Mud volcanoes - a significant source of atmospheric methane. Geo-Marine Letters 23(3-4), 155-161.
Elvert M. (1999) Microbial biomarkers in anaerobic marine environments dominated by methane. Ph.D. thesis, Chrsitian-Albrechts-University of Kiel, Germany.
Elvert M., Suess E., and Whiticar M. J. (1999) Anaerobic methane oxidation associated with marine gas hydrates: superlight C-isotopes from saturated and unsaturated C20 and C25
irregular isoprenoids. Naturwissenschaften 86(6), 295-300. Falkowski P., Scholes R. J., Boyle E., Canadell J., Canfield D., Elser J., Gruber N., Hibbard
K., Hogberg P., Linder S., Mackenzie F. T., Moore B., Pedersen T., Rosenthal Y., Seitzinger S., Smetacek V., and Steffen W. (2000) The global carbon cycle: A test of our knowledge of earth as a system. Science 290(5490), 291-296.
Fisher C. R. (1990) Chemoautotrophic and Methanotrophic Symbioses in Marine-Invertebrates. Reviews in Aquatic Sciences 2(3-4), 399-436.
Formisano V., Atreya S., Encrenaz T., Ignatiev N., and Giuranna M. (2004) Detection of methane in the atmosphere of Mars. Science 306(5702), 1758-1761.
Früh-Green G., Kelley D. S., Bernasconi S. M., Karson J. A., Ludwig K. A., Butterfield D. A., Boshi C., and Proskurowski G. (2005) 30,000 Years of Hydrothermal Activity at the Lost City Vent Field. Science 301, 495-498.
Garcia-Gil S., Vilas F., and Garcia-Garcia A. (2002) Shallow gas features in incised-valley fills (Ria de Vigo, NW Spain): a case study. Continental Shelf Research 22(16), 2303-2315.
Grosjean D. (1995) Atmospheric Chemistry of Biogenic Hydrocarbons - Relevance to the Amazon. Quimica Nova 18(2), 184-201.
Hallam S. J., Putnam N., Preston C. M., Detter J. C., Rokhsar D., Richardson P. M., and DeLong E. F. (2004) Reverse methanogenesis: Testing the hypothesis with environmental genomics. Science 305(5689), 1457-1462.
Hanson R. S., Bratina B. J., and Brusseau G. A. (1993) Phylogeny and ecology of methylotrophic bacteria. In Microbial Growth on C1 Compounds (ed. J. C. Murrell and D. P. Kelly), pp. 285-302. Intercept Limited.
Hanson R. S. and Hanson T. E. (1996) Methanotrophic bacteria. Microbiological Reviews60(2), 439-&.
Hao W. M. and Ward D. E. (1993) Methane Production from Global Biomass Burning. Journal of Geophysical Research-Atmospheres 98(D11), 20657-20661.
Henckel T., Jackel U., Schnell S., and Conrad R. (2000) Molecular Analyses of Novel Methanotrophic Communities in Forest Soil That Oxidize Atmospheric Methane. Appl. Environ. Microbiol. 66(5), 1801-1808.
Hensen C., Zabel M., Pfeifer K., Schwenk T., Kasten S., Riedinger N., Schulz H. D., and Boettius A. (2003) Control of sulfate pore-water profiles by sedimentary events and the significance of anaerobic oxidation of methane for the burial of sulfur in marine sediments. Geochimica Et Cosmochimica Acta 67(14), 2631-2647.

Chapter 1 Introduction
38
Hinrichs K.-U. and Boetius A. (2002) The anaerobic oxidation of methane: New insights in microbial ecology and biogeochemistry. In Ocean Margin Systems (ed. G. Wefer, D. Billett, and D. Hebbeln), pp. 457-477. Springer-Verlag, Berlin.
Hinrichs K.-U., Hayes J. M., Sylva S. P., Brewer P. G., and DeLong E. F. (1999) Methane-consuming archaebacteria in marine sediments. Nature 398, 802-805.
Hoehler T. M., Alperin M. J., Albert D. B., and Martens C. S. (1994) Field and laboratory studies of methane oxidation in an anoxic marine sediment: Evidence for a methanogenic-sulfate reducer consortium. Global Biogeochemical Cycles 8(4), 451-463.
Holmes A. J., Roslev P., McDonald I. R., Iversen N., Henriksen K., and Murrell J. C. (1999) Characterization of methanotrophic bacterial populations in soils showing atmospheric methane uptake. Applied and Environmental Microbiology 65(8), 3312-3318.
Horita J. and Berndt M. E. (1999) Abiogenic methane formation and isotopic fractionation under hydrothermal conditions. Science 285(5430), 1055-1057.
Hovland M. and Judd A. G. (1988) Seabed Pockmarks and Seepages: Impact on Geology, Biology and the Marine Environment. Graham & Trotman.
Iversen N. and Jørgensen B. B. (1985) Anaerobic methane oxidation rates at the sulfate-methane transition in marine sediments from Kattegat and Skagerrak (Denmark). Limnology and Oceanography 30(5), 944-955.
Jahnke L. L., Summons R. E., Hope J. M., and Des Marais D. J. (1999) Carbon isotopic fractionation in lipids from methanotrophic bacteria II: The effects of physiology and environmental parameters on the biosynthesis and isotopic signatures of biomarkers. Geochimica et Cosmochimica Acta 63(1), 79-93.
Joye S. B., Boetius A., Orcutt B. N., Montoya J. P., Schulz H. N., Erickson M. J., and Lugo S. K. (2004) The anaerobic oxidation of methane and sulfate reduction in sediments from Gulf of Mexico cold seeps. Chemical Geology 205(3-4), 219-238.
Judd A. G. (2003) The global importance and context of methane escape from the seabed. Geo-Marine Letters 23(3-4), 147-154.
Judd A. G., Hovland M., Dimitrov L. I., Gil S. G., and Jukes V. (2002) The geological methane budget at Continental Margins and its influence on climate change. Geofluids2(2), 109-126.
Judd A. G., Long D., and M. S. (1994) Pockmark formation and activity, U.K. Block 15/25, North Sea. Bulletin Geological Society of Denmark 14, 34-49.
Kelley D. S. (1996) Methane-rich fluids in the oceanic crust. Journal of Geophysical Research-Solid Earth 101(B2), 2943-2962.
Kelley D. S. and Fruh-Green G. L. (1999) Abiogenic methane in deep-seated mid-ocean ridge environments: Insights from stable isotope analyses. Journal of Geophysical Research-Solid Earth 104(B5), 10439-10460.
Kelley D. S., Karson J. A., Blackman D. K., Fruh-Green G. L., Butterfield D. A., Lilley M. D., Olson E. J., Schrenk M. O., Roe K. K., Lebon G. T., Rivizzigno P., and the AT3-60 Shipboard Party. (2001) An off-axis hydrothermal vent field near the Mid-Atlantic Ridge at 30[deg] N. Nature 412(6843), 145-149.
Kelley D. S., Karson J. A., Früh-Green G., and Yoerger D. R. (2005) A Serpentinite-Hosted Ecosystem: The Lost City Hydrothermal Field. Science 307, 1428-1434.
Kennett J. P., Cannariato K. G., Hendy I. L., and Behl R. J. (2000) Carbon isotopic evidence for methane hydrate instability during quaternary interstadials. Science 288(5463),128-133.
Kerr R. A. (1999) CLIMATE CHANGE:A Smoking Gun for an Ancient Methane Discharge. Science 286(5444), 1465-.
Chapter 1 Introduction
39
Kholodov V. N. (2002) Mud Volcanoes: Distribution Regularities and Genesis (Communication 2. Geological–Geochemical Peculiarities and Formation Model). Lithology and Mineral Resources 37(4), 293-310.
King G. M. (1992) Ecological aspects of methane oxidation, a key determinant of global methane dynamics. In Advances in Microbial Ecology, Vol. 12 (ed. K. C. Marshall), pp. 431-468. Plenum Press.
Knittel K., Boetius A., Lemke A., Eilers H., Lochte K., Pfannkuche O., Linke P., and Amann R. (2003) Activity, distribution, and diversity of sulfate reducers and other bacteria in sediments above gas hydrate (Cascadia margin, Oregon). Geomicrobiology Journal20(4), 269-294.
Koga Y., Nishihara M., Morii H., and Akagawa-Matsushita M. (1993) Ether polar lipids of methanogenic bacteria: Structures, comparative aspects, and biosyntheses. Microbiological Reviews 57(1), 164-182.
Kopf A., Klaeschen D., and Mascle J. (2001) Extreme efficiency of mud volcanism in dewatering accretionary prisms. Earth and Planetary Science Letters 189(3-4), 295-313.
Kopf A. J. (2002) Significance of mud volcanism. Reviews of Geophysics 40(2).Krashnopolsky V. A., Maillard J. P., and Owen T. C. (2004) Detection of methane in the
martian atmosphere: evidence for life? Icarus 172(2), 537-547. Krüger M., Frenzel P., and Conrad R. (2001) Microbial processes influencing methane
emission from rice fields. Global Change Biology 7(1), 49-63. Krüger M., Meyerdierks A., Glockner F. O., Amann R., Widdel F., Kube M., Reinhardt R.,
Kahnt R., Bocher R., Thauer R. K., and Shima S. (2003) A conspicuous nickel protein in microbial mats that oxidize methane anaerobically. Nature 426(6968), 878-881.
Kvenvolden K. A. (1988) Methane hydrate - a major reservoir of carbon in the shallow geosphere? Chemical Geology 71, 41-51.
Kvenvolden K. A. (1993) A primer on gas hydrates. U.S. Geological Survey Professional Paper 1570, 279-291.
Larock P. A., Hyun J. H., and Bennison B. W. (1994) Bacterioplankton Growth and Production at the Louisiana Hydrocarbon Seeps. Geo-Marine Letters 14(2-3), 104-109.
Le Mer J. and Roger P. (2001) Production, oxidation, emission and consumption of methane by soils: A review. European Journal of Soil Biology 37(1), 25-50.
Lelieveld J., Crutzen P. J., and Dentener F. J. (1998) Changing concentration, lifetime and climate forcing of atmospheric methane. Tellus Series B-Chemical and Physical Meteorology 50(2), 128-150.
Levy H. (1971) Normal Atmosphere - Large Radical and Formaldehyde Concentrations Predicted. Science 173(3992), 141-&.
Lollar B. S., Westgate T. D., Ward J. A., Slater G. F., and Lacrampe-Couloume G. (2002) Abiogenic formation of alkanes in the Earth's crust as a minor source for global hydrocarbon reservoirs. Nature 416(6880), 522-524.
Ludwig W., Strunk O., Westram R., Richter L., Meier H., Yadhukumar, Buchner A., Lai T., Steppi S., Jobb G., Forster W., Brettske I., Gerber S., Ginhart A. W., Gross O., Grumann S., Hermann S., Jost R., Konig A., Liss T., Lussmann R., May M., Nonhoff B., Reichel B., Strehlow R., Stamatakis A., Stuckmann N., Vilbig A., Lenke M., Ludwig T., Bode A., and Schleifer K.-H. (2004) ARB: a software environment for sequence data. Nucl. Acids Res. 32(4), 1363-1371.
Madigan M. T., Martinko J. M., and Parker J. (2000) Brock Biology of Microorganisms.Prentice-Hall, Inc.
Manne A. S. and Richels R. G. (2001) An alternative approach to establishing trade-offs among greenhouse gases. Nature 410(6829), 675-677.
Chapter 1 Introduction
40
Martens C. S. and Berner R. A. (1974) Methane Production in Interstitial Waters of Sulfate-Depleted Marine Sediments. Science 185(4157), 1167-1169.
Martens C. S., Blair N. E., Green C. D., and Des Marais D. J. (1986) Seasonal variations in the stable carbon isotopic signature of biogenic methane in a coastal sediment. Science233, 1300-1303.
Michaelis W., Seifert R., Nauhaus K., Treude T., Thiel V., Blumenberg M., Knittel K., Gieseke A., Peterknecht K., Pape T., Boetius A., Amann R., Jorgensen B. B., Widdel F., Peckmann J. R., Pimenov N. V., and Gulin M. B. (2002) Microbial reefs in the Black Sea fueled by anaerobic oxidation of methane. Science 297(5583), 1013-1015.
Milkov A. V. (2000) Worldwide distribution of submarine mud volcanoes and associated gas hydrates. Marine Geology 167(1-2), 29-42.
Milkov A. V., Sassen R., Apanasovich T. V., and Dadashev F. G. (2003) Global gas flux from mud volcanoes: A significant source of fossil methane in the atmosphere and the ocean. Geophysical Research Letters 30(2).
Mosier A. R., Delgado J. A., Cochran V. L., Valentine D. W., and Parton W. J. (1997) Impact of agriculture on soil consumption of atmospheric CH4 and a comparison of CH4 and N2O flux in subarctic, temperate and tropical grasslands. Nutrient Cycling in Agroecosystems 49(1-3), 71-83.
Nauhaus K., Boetius A., Kruger M., and Widdel F. (2002) In vitro demonstration of anaerobic oxidation of methane coupled to sulphate reduction in sediment from a marine gas hydrate area. Environmental Microbiology 4(5), 296-305.
Nauhaus K., Treude T., Boetius A., and Kruger M. (2005) Environmental regulation of the anaerobic oxidation of methane: a comparison of ANME-I and ANME-II communities. Environmental Microbiology 7(1), 98-106.
Niewöhner C., Hensen C., Kasten S., Zabel M., and Schulz H. D. (1998) Deep sulfate reduction completely mediated by anaerobic methane oxidation in sediments of the upwelling area off Namibia. Geochimica et Cosmochimica Acta 62(3), 455-464.
Orphan V. J., House C. H., Hinrichs K. U., McKeegan K. D., and DeLong E. F. (2001) Methane-consuming archaea revealed by directly coupled isotopic and phylogenetic analysis. Science 293(5529), 484-487.
Orphan V. J., House C. H., Hinrichs K. U., McKeegan K. D., and DeLong E. F. (2002) Multiple archaeal groups mediate methane oxidation in anoxic cold seep sediments. Proceedings of the National Academy of Sciences of the United States of America99(11), 7663-7668.
Orphan V. J., Ussler W., Naehr T. H., House C. H., Hinrichs K. U., and Paull C. K. (2004) Geological, geochemical, and microbiological heterogeneity of the seafloor around methane vents in the Eel River Basin, offshore California. Chemical Geology 205(3-4), 265-289.
Petit J. R., Jouzel J., Raynaud D., Barkov N. I., Barnola J. M., Basile I., Bender M., Chappellaz J., Davis M., Delaygue G., Delmotte M., Kotlyakov V. M., Legrand M., Lipenkov V. Y., Lorius C., Pepin L., Ritz C., Saltzman E., and Stievenard M. (1999) Climate and atmospheric history of the past 420,000 years from the Vostok ice core, Antarctica. Nature 399(6735), 429-436.
Pimenov N. V., Rusanov I. I., Poglazova M. N., Mityushina L. L., Sorokin D. Y., Khmelenina V. N., and Trotsenko Y. A. (1997) Bacterial mats on coral-like structures at methane seeps in the Black Sea. Microbiology 66(3), 354-360.
Planke S., Svensen H., Hovland M., Banks D. A., and Jamtveit B. (2003) Mud and fluid migration in active mud volcanoes in Azerbaijan. Geo-Marine Letters 23(3-4), 258-268.
Chapter 1 Introduction
41
Reeburgh W. S. (1996) "Soft spots" in the global methane budget. In Microbial Growth on C1
Compounds (ed. M. E. Lidstrom and F. R. Tabita), pp. 334-342. Kluwer Academic Publishers.
Schindler T. L. and Kasting J. F. (2000) Synthetic spectra of simulated terrestrial atmospheres containing possible biomarker gases. Icarus 145(1), 262-271.
Schouten S., Wakeham S. G., and Damste J. S. S. (2001) Evidence for anaerobic methane oxidation by archaea in euxinic waters of the Black Sea. Organic Geochemistry32(10), 1277-1281.
Sibuet M. and Olu K. (1998) Biogeography, biodiversity and fluid dependence of deep-sea cold-seep communities at active and passive margins. Deep-Sea Research II 45(1-3),517-567.
Smith H. J., Fischer H., Wahlen M., Mastroianni D., and Deck B. (1999) Dual modes of the carbon cycle since the Last Glacial Maximum. Nature 400(6741), 248-250.
Somoza L., Diaz-del-Rio V., Leon R., Ivanov M., Fernandez-Puga M. C., Gardner J. M., Hernandez-Molina F. J., Pinheiro L. M., Rodero J., Lobato A., Maestro A., Vazquez J. T., Medialdea T., and Fernandez-Salas L. M. (2003) Seabed morphology and hydrocarbon seepage in the Gulf of Cadiz mud volcano area: Acoustic imagery, multibeam and ultra-high resolution seismic data. Marine Geology 195(1-4), 153-176.
Suess E., Torres M. E., Bohrmann G., Collier R. W., Greinert J., Linke P., Rehder G., Trehu A., Wallmann K., Winckler G., and Zuleger E. (1999) Gas hydrate destabilization: enhanced dewatering, benthic material turnover and large methane plumes at the Cascadia convergent margin. Earth and Planetary Science Letters 170(1-2), 1-15.
Teske A., Hinrichs K. U., Edgcomb V., Gomez A. D., Kysela D., Sylva S. P., Sogin M. L., and Jannasch H. W. (2002) Microbial diversity of hydrothermal sediments in the Guaymas Basin: Evidence for anaerobic methanotrophic communities. Applied and Environmental Microbiology 68(4), 1994-2007.
Treude T. (2003) The anaerobic oxidation of methane in marine sediments, Unversity of Bremen.
Treude T., Boetius A., Knittel K., Wallmann K., and Jorgensen B. B. (2003) Anaerobic oxidation of methane above gas hydrates at Hydrate Ridge, NE Pacific Ocean. MarineEcology-Progress Series 264, 1-14.
Valentine D. L. and Reeburgh W. S. (2000) New perspectives on anaerobic methane oxidation. Environmental Microbiology 2(5), 477-484.
Wang Z. P., Zeng D., and Patrick W. H. (1997) Characteristics of methane oxidation in a flooded rice soil profile. Nutrient Cycling in Agroecosystems 49(1-3), 97-103.
Whiticar M. J. (1999) Carbon and hydrogen isotope systematics of bacterial formation and oxidation of methane. Chemical Geology 161(1-3), 291-314.
Whiticar M. J. (2002) Diagenetic relationships of methanogenesis, nutrients, acoustic turbidity, pockmarks and freshwater seepages in Eckernforde Bay. Marine Geology182(1-2), 29-53.
Whiticar M. J. and Werner F. (1981) Pockmarks: Submarine vents of natural gas or freshwater seeps? Geo-Marine Letters 1(3-4), 193-199.
Whittenbury R., Phillips K. C., and Wilkinso.Jf. (1970) Enrichment, Isolation and Some Properties of Methane-Utilizing Bacteria. Journal of General Microbiology 61, 205-&.
Wilson J. T. and Wilson B. H. (1985) Biotransformation of Trichloroethylene in Soil. Appliedand Environmental Microbiology 49(1), 242-243.
Woolsey T. S., McCallum M. e., and Schumm S. A. (1975) Modelling of diatreme emplacement by fluidization. Physics and Chemistry of the Earth 9, 24-42.
Wuebbles D. J. and Hayhoe K. (2002) Atmospheric methane and global change. Earth-Science Reviews 57(3-4), 177-210.

Chapter 1 Introduction
42
Yamamoto S., Alcauskas J. B., and Crozier T. E. (1976) Solubility of Methane in Distilled Water and Seawater. Journal of Chemical and Engineering Data 21(1), 78-80.
Yang S. O., Cho S. H., Lee H., and Lee C. S. (2001) Measurement and prediction of phase equilibria for water plus methane in hydrate forming conditions. Fluid Phase Equilibria 185(1-2), 53-63.
Zuhlsdorff L. and Spiess V. (2004) Three-dimensional seismic characterization of a venting site reveals compelling indications of natural hydraulic fracturing. Geology 32(2),101-104.
Chapter 2 Microbial colonisation of a submarine mud volcano: how subsurface fluid flow structures methanotrophic communities
43
Microbial colonisation of a submarine mud volcano: how subsurface fluid
flow structures methanotrophic communities
Niemann H.1,2, Lösekann T.1, deBeer D.1, Elvert M.1,*, Knittel K.1, Amann R.1, Sauter E.2,
Schlüter M.2, Klages M.2, Foucher JP.3, Boetius A.1,4
1Max Planck Institute for Marine Microbiology Bremen, Celsiusstr.1, 28359 Bremen,
Germany
2Alfred Wegener Institute for Polar and Marine Research, Am Handelshafen 12, 27515
Bremerhaven, Germany
3IFREMER Centre de Brest, BP 70, 29280 Plouzane, France
4International University Bremen, Campusring, 28759 Bremen, Germany
*Present address: Research Center Ocean Margins, University of Bremen, Leobener Str.,
28359 Bremen
Author to whom correspondence should be addressed:
Helge Niemann Max Planck Institute for Marine Microbiology, Celsiusstr. 1, 28359 Bremen, Germany email: [email protected], phone +49-421-2028653
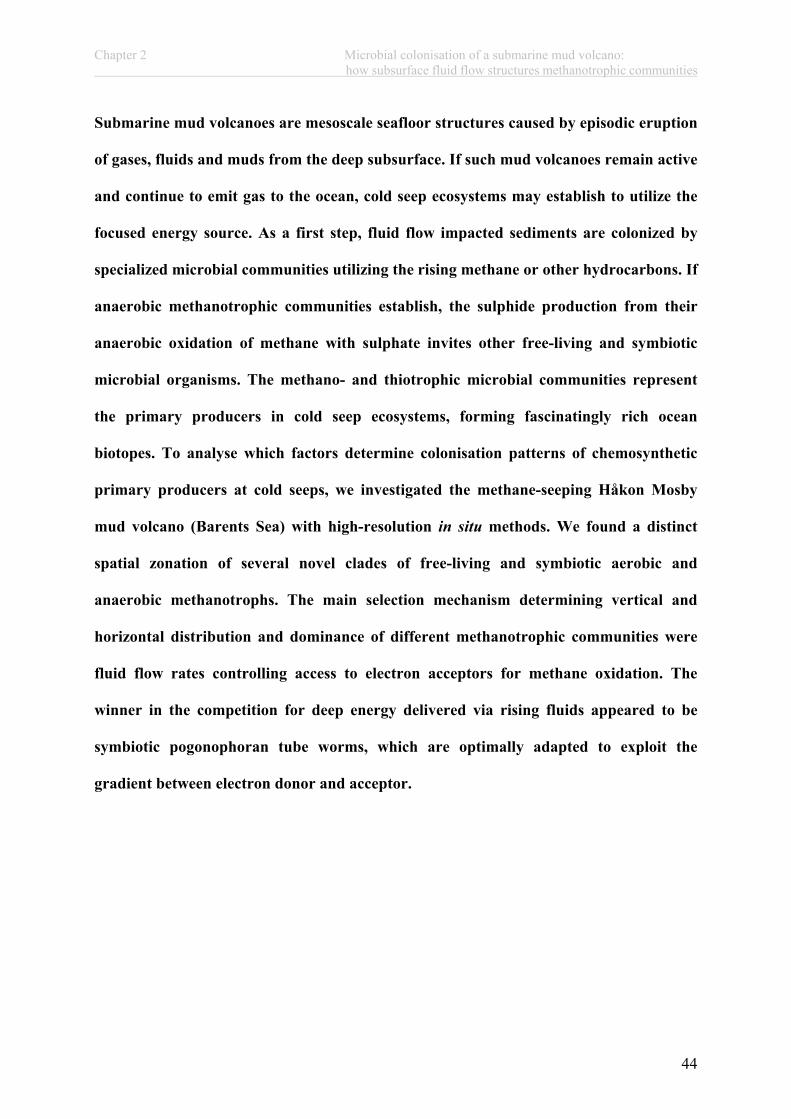
Chapter 2 Microbial colonisation of a submarine mud volcano: how subsurface fluid flow structures methanotrophic communities
44
Submarine mud volcanoes are mesoscale seafloor structures caused by episodic eruption
of gases, fluids and muds from the deep subsurface. If such mud volcanoes remain active
and continue to emit gas to the ocean, cold seep ecosystems may establish to utilize the
focused energy source. As a first step, fluid flow impacted sediments are colonized by
specialized microbial communities utilizing the rising methane or other hydrocarbons. If
anaerobic methanotrophic communities establish, the sulphide production from their
anaerobic oxidation of methane with sulphate invites other free-living and symbiotic
microbial organisms. The methano- and thiotrophic microbial communities represent
the primary producers in cold seep ecosystems, forming fascinatingly rich ocean
biotopes. To analyse which factors determine colonisation patterns of chemosynthetic
primary producers at cold seeps, we investigated the methane-seeping Håkon Mosby
mud volcano (Barents Sea) with high-resolution in situ methods. We found a distinct
spatial zonation of several novel clades of free-living and symbiotic aerobic and
anaerobic methanotrophs. The main selection mechanism determining vertical and
horizontal distribution and dominance of different methanotrophic communities were
fluid flow rates controlling access to electron acceptors for methane oxidation. The
winner in the competition for deep energy delivered via rising fluids appeared to be
symbiotic pogonophoran tube worms, which are optimally adapted to exploit the
gradient between electron donor and acceptor.
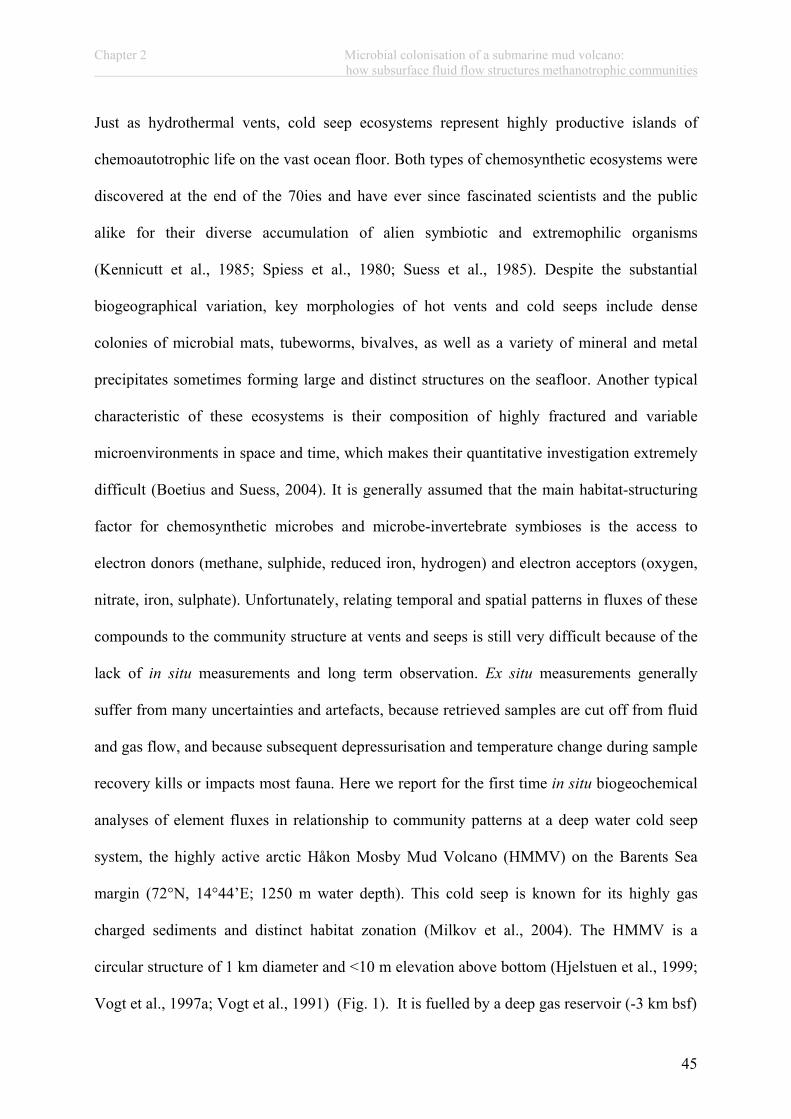
Chapter 2 Microbial colonisation of a submarine mud volcano: how subsurface fluid flow structures methanotrophic communities
45
Just as hydrothermal vents, cold seep ecosystems represent highly productive islands of
chemoautotrophic life on the vast ocean floor. Both types of chemosynthetic ecosystems were
discovered at the end of the 70ies and have ever since fascinated scientists and the public
alike for their diverse accumulation of alien symbiotic and extremophilic organisms
(Kennicutt et al., 1985; Spiess et al., 1980; Suess et al., 1985). Despite the substantial
biogeographical variation, key morphologies of hot vents and cold seeps include dense
colonies of microbial mats, tubeworms, bivalves, as well as a variety of mineral and metal
precipitates sometimes forming large and distinct structures on the seafloor. Another typical
characteristic of these ecosystems is their composition of highly fractured and variable
microenvironments in space and time, which makes their quantitative investigation extremely
difficult (Boetius and Suess, 2004). It is generally assumed that the main habitat-structuring
factor for chemosynthetic microbes and microbe-invertebrate symbioses is the access to
electron donors (methane, sulphide, reduced iron, hydrogen) and electron acceptors (oxygen,
nitrate, iron, sulphate). Unfortunately, relating temporal and spatial patterns in fluxes of these
compounds to the community structure at vents and seeps is still very difficult because of the
lack of in situ measurements and long term observation. Ex situ measurements generally
suffer from many uncertainties and artefacts, because retrieved samples are cut off from fluid
and gas flow, and because subsequent depressurisation and temperature change during sample
recovery kills or impacts most fauna. Here we report for the first time in situ biogeochemical
analyses of element fluxes in relationship to community patterns at a deep water cold seep
system, the highly active arctic Håkon Mosby Mud Volcano (HMMV) on the Barents Sea
margin (72°N, 14°44’E; 1250 m water depth). This cold seep is known for its highly gas
charged sediments and distinct habitat zonation (Milkov et al., 2004). The HMMV is a
circular structure of 1 km diameter and <10 m elevation above bottom (Hjelstuen et al., 1999;
Vogt et al., 1997a; Vogt et al., 1991) (Fig. 1). It is fuelled by a deep gas reservoir (-3 km bsf)
Chapter 2 Microbial colonisation of a submarine mud volcano: how subsurface fluid flow structures methanotrophic communities
46
expelling fluids, gases and muds to the ocean floor (Fig. 2-1). The fluid upwelling can be
detected as rather steep temperature anomaly reaching >20°C at 10 meter sediment depth
below the ice-cold bottom waters (-1°C) (Damm and Budeus, 2003; Ginsburg et al., 1999). At
single spots in the centre of the mud volcano, the warm fluids reached the seafloor.
Furthermore, in the Northern part of the centre emission of free and frozen gas from holes in
the seafloor were observed visually, forming a large gas flare above the HMMV (Fig. 2-
2)(Damm and Budeus, 2003; Klages et al., 2004; Sauter et al., submitted). A transition from
very recent mud-flows to stabilized sediment deposits can be identified visually along radial
transects across the circular structure. The apparently barren centre (Fig. 2-3) is enclosed by
thiotrophic bacterial mats (Fig. 2-4, -5) followed by large fields of pogonophoran tubeworm
Figure 1. The Håkon Mosby Mud Volcano. The left panel is a PARASOUND sediment echosounder image of a transect through the mud volcano. It displays a 2.5 km long profile crossing the Mud Volcano from south to north. In the centre, almost no signal penetration is due to the high gas content of the sediments leading to a blanking of the signal. North and south of the central part, the signal penetration rises to around 30 m and a stack of sedimentary layers is displayed which is partially formed by sediments emerging as mud flows from the volcano. The right panel is a high resolution bathymetric map of the HMMV showing all sampling stations during the POLARSTERN expedition ARK XIX3b with ROV VICTOR 6000 (Reson SeaBat 8125 and EM2000 with Posidonia positioning). The IFREMER software CARAIBES was used to process the microbathymetry data acquired by the multibeam echosounder mounted on ROV VICTOR.
Chapter 2 Microbial colonisation of a submarine mud volcano: how subsurface fluid flow structures methanotrophic communities
47
colonies (Fig. 2-6). The morphology and geology of the HMMV and the composition of its
benthic communities were described in detail recently (Milkov et al., 1999; Milkov et al.,
2004; Pimenov et al., 1999; Shilov et al., 1999; Vogt et al., 1997a; Vogt et al., 1997b).
Observation and sampling took place during two cruises with R/V Atalante/ROV VICTOR
6000 (2001) and R/V Polarstern/ROV VICTOR 6000 (2003) as part of a French/German
research initiative (Klages et al., 2002; Klages et al., 2004). Subsurface and surface sediments
were collected with gravity corers and ROV pushcores, respectively, along a radial transect
from the centre to the east of the mud volcano (Fig. 1). In situ microsensor profiles of
temperature, oxygen, pH and sulphide were obtained at the same sites via positioning of the
instruments with the ROV (Fig. 3).
The central area of the HMMV showed signs of recent mud depositions and gas eruptions like
chaotic sediment mounds, furrows, trenches and holes. The most recent mud flow is directed
down-slope, towards the South-East. Gravity core samples of the upper 4 m of centre mud
consisted of uniformly mixed, greyish highly gassy clays. These contained very low amounts
of lipid biomarker (< 0.1 micro gram per gram dry weight, µg g-dw-1) and extremely low cell
numbers (<107 cells cm-3) typical for deep biosphere sediments from >100 m sediment depth
according to the global correlation established by Parkes et al. (2000). Archaeal 16S rDNA
clone sequences indicate a dominance of Crenarchaeota (67 of 67 clones) which were
previously detected in deep biosphere sediments(Knittel et al., 2005). No euryarchaeotal or
-proteobacterial (sulphate reducer) sequences were retrieved from the central muds, and rates
of anaerobic oxidation of methane (AOM) and sulphate reduction (SR) were at detection
limit. Sediments from the surface of the seafloor were retrieved by push coring with the ROV
and were dominated by sequences of aerobic methanotrophic bacteria. Fluorescence in situ
hybridisation (FISH) of these samples revealed that a population of Methylobacter sp., a
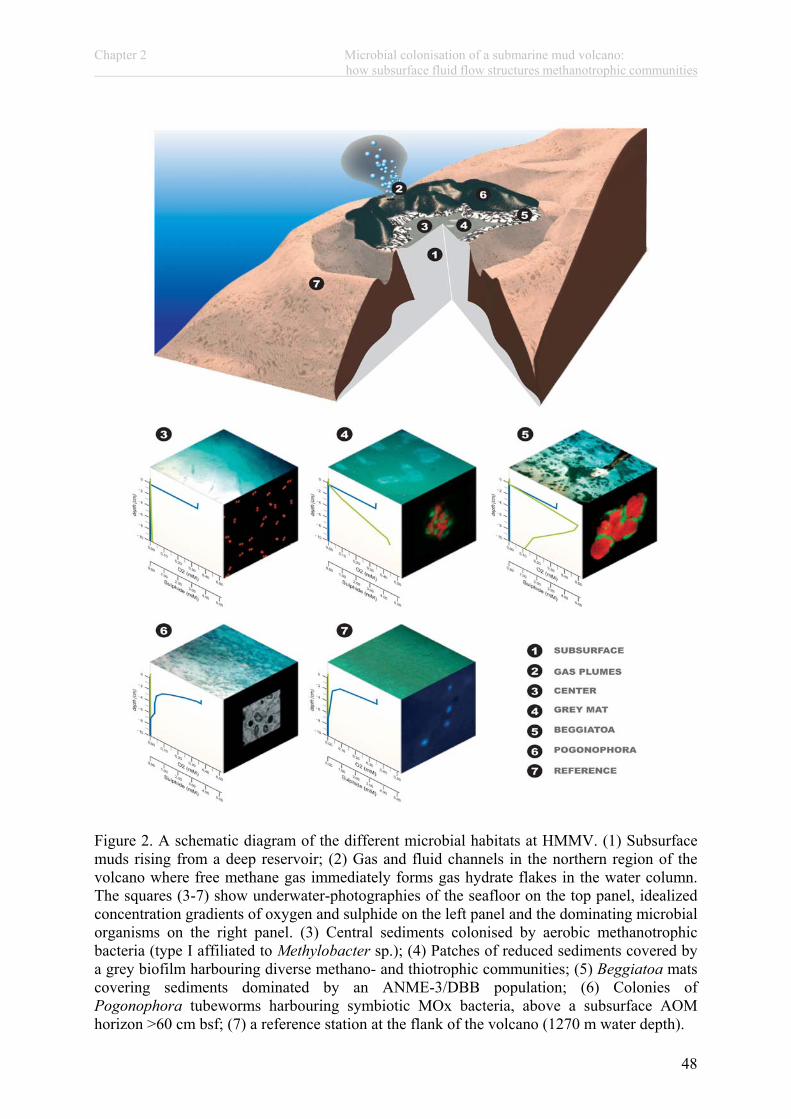
Chapter 2 Microbial colonisation of a submarine mud volcano: how subsurface fluid flow structures methanotrophic communities
48
Figure 2. A schematic diagram of the different microbial habitats at HMMV. (1) Subsurface muds rising from a deep reservoir; (2) Gas and fluid channels in the northern region of the volcano where free methane gas immediately forms gas hydrate flakes in the water column. The squares (3-7) show underwater-photographies of the seafloor on the top panel, idealized concentration gradients of oxygen and sulphide on the left panel and the dominating microbial organisms on the right panel. (3) Central sediments colonised by aerobic methanotrophic bacteria (type I affiliated to Methylobacter sp.); (4) Patches of reduced sediments covered by a grey biofilm harbouring diverse methano- and thiotrophic communities; (5) Beggiatoa mats covering sediments dominated by an ANME-3/DBB population; (6) Colonies of Pogonophora tubeworms harbouring symbiotic MOx bacteria, above a subsurface AOM horizon >60 cm bsf; (7) a reference station at the flank of the volcano (1270 m water depth).
Chapter 2 Microbial colonisation of a submarine mud volcano: how subsurface fluid flow structures methanotrophic communities
49
type I methanotroph, accounted for 46% of all DAPI stained cells in the top 5 mm (26*108
cells cm-3, Fig. 3a3). The second most abundant bacterial group populating the surface of the
centre is affiliated with methylotrophic Methylophaga species. Accordingly, 13C-depleted FA
were the most abundant biomarker fraction with a dominance of the type I methanotroph
specific FA C16:1 8c in the top surface cm (Fig. 2a4). Aerobic oxidation of methane (MOx)
measured ex situ (at ca 1.5 mM methane concentration) was 0.1 µmol cm-3 d-1 (Fig. 3a2), i.e.
0.9 mol m-2 yr-1. The diffusive O2 influx in this area was 3.8 mol m-2 yr-1 as calculated from in
situ microsensor profiles (Fig. 3a1) (de Beer et al., submitted). The microsensor profiles
showed a depletion of oxygen within the first few millimetres of the gassy centre muds. The
limited penetration of oxygen explains why MOx as well as the methane-oxidizing bacteria
are restricted to the top surface sediment. In situ oxygen penetration at a nearby reference site
outside of the mud volcano (Fig. 2-7, 50 km East of the centre) was >3 cm, indicating that
processes connected to fluid flow are responsible for oxygen limitation. First, methane
consumption reduces oxygen rapidly. Secondly, the relatively high velocity of upward flow of
oxygen-free fluids hinder oxygen diffusion from the bottom water into the sediments (de Beer
et al., submitted). The difference between in- and ex situ O2 profiles at the same sampling site
indicate a flow velocity of approximately 0.4 µm s-1, equivalent to 13 m yr-1 which is among
the high end of fluid flow velocities measured in cold seep settings (Wallmann et al., 1997).
At this flow velocity, neither oxygen, nor other electron acceptors such as nitrate and sulphate
(Fig. 3a2) can penetrate into the sediment via diffusion according to an integrated local mass
balance.
The chemistry of the porewater in the centre indicates a depletion of sulphate (<0.5 mM) in
the rising fluids as well as an anomaly in the chloride concentration (415 mM at 18 cm
sediment depth compared to the seawater concentration of 610 mM). The lack of sulphate
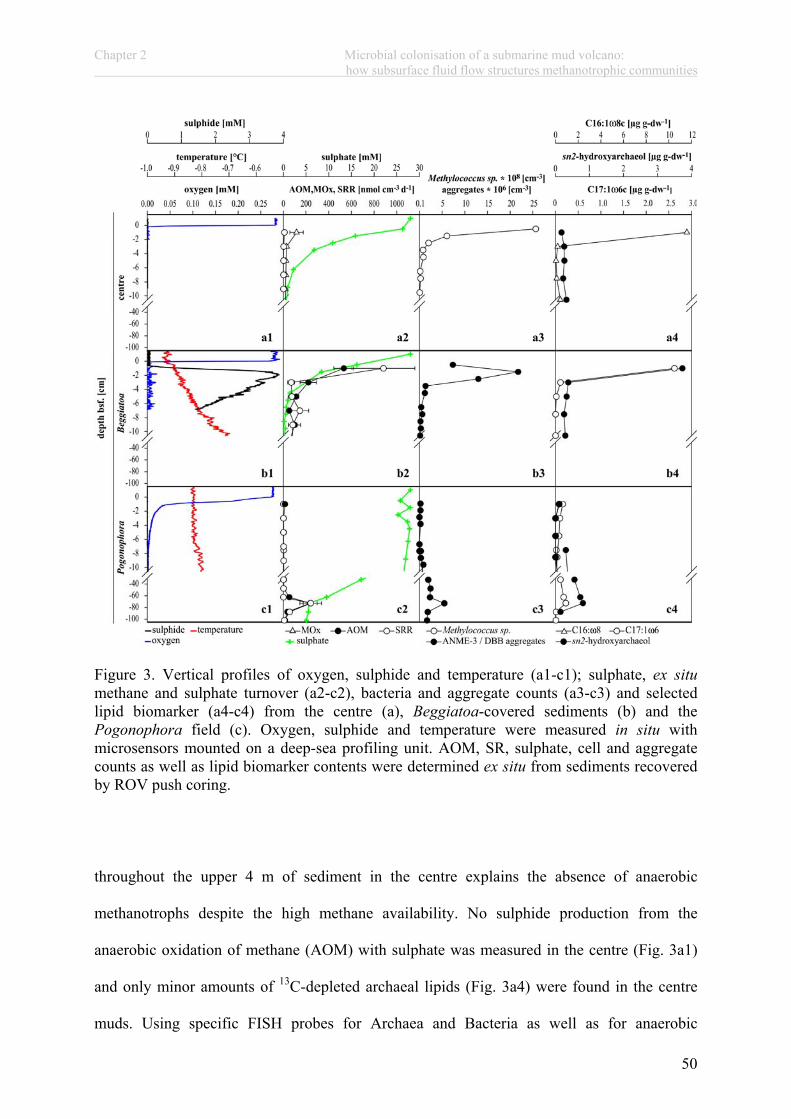
Chapter 2 Microbial colonisation of a submarine mud volcano: how subsurface fluid flow structures methanotrophic communities
50
Figure 3. Vertical profiles of oxygen, sulphide and temperature (a1-c1); sulphate, ex situmethane and sulphate turnover (a2-c2), bacteria and aggregate counts (a3-c3) and selected lipid biomarker (a4-c4) from the centre (a), Beggiatoa-covered sediments (b) and the Pogonophora field (c). Oxygen, sulphide and temperature were measured in situ with microsensors mounted on a deep-sea profiling unit. AOM, SR, sulphate, cell and aggregate counts as well as lipid biomarker contents were determined ex situ from sediments recovered by ROV push coring.
throughout the upper 4 m of sediment in the centre explains the absence of anaerobic
methanotrophs despite the high methane availability. No sulphide production from the
anaerobic oxidation of methane (AOM) with sulphate was measured in the centre (Fig. 3a1)
and only minor amounts of 13C-depleted archaeal lipids (Fig. 3a4) were found in the centre
muds. Using specific FISH probes for Archaea and Bacteria as well as for anaerobic
Chapter 2 Microbial colonisation of a submarine mud volcano: how subsurface fluid flow structures methanotrophic communities
51
methanotrophs (AMNE) (Knittel et al., 2005), we did not find any positive signals of ANME-
related archaea or archaeal-bacterial consortia in the centre muds (0-25 cm sediment depth).
Close to gas ebullition sites (Fig. 2-2) and in the transition from the inner center to the
periphery of the mud flows (Fig. 2-3), circular patches of reduced, gassy sediments of 10-100
cm diameter were found, covered by a greyish-whitish biofilm (Fig 2-4,). In situ microsensor
profiles showed a sulphide production zone below 2 cm sediment depth and an overlap of
oxygen and sulphide in the surface sediments. Modelling of the ex situ sulphide profiles
indicated diffusive sulphide fluxes of up to 2.4 mol m-2 yr-1 (data points of in situ profiles
were too scattered to allow for modelling). AOM rates were rather variable between replicate
push core samples, ranging from 0,1 to 0,55 µmol cm-3 d-1 (12.4 mol m-2 yr-1 on average)
accounting for 85% of sulphate reduction. Archaeal lipids typical for ANME communities
were retrieved reaching concentrations of 1.2 µg cm-3. These were strongly depleted in 13C
(-99 ‰ for sn2-hydroxyarchaeol, -117‰ for pentamethylicosene with four double bonds
(PMI:4), -97‰ for crocetene with two double bonds). Microscopy of FISH-targeted cells
showed the presence of members of two distinct phylogenetic clusters of ANME, namely
ANME-2 and a novel phylogenetic group. The greyish-whitish biofilm covering the
sediments harbour a considerable diversity of giant sulphide oxidizing bacteria, including
various types of filamentous bacteria and globular giant cells, which morphologically
resemble Thiomargarita (de Beer et al., submitted). The high rate of AOM-based sulphide
production within these patches supports the growth of thiotrophic bacterial mats at the
sediment surface (Fig. 1-4). It remains unknown which geological processes cause the
formation of these fragmented habitats for AOM communities in the centre of the HMMV.
Taking the slow growth rate of the AOM populations into account (Girguis et al., 2003;

Chapter 2 Microbial colonisation of a submarine mud volcano: how subsurface fluid flow structures methanotrophic communities
52
Nauhaus et al., 2002; Nauhaus et al., 2005), a relatively stable supply of methane and sulphate
is available at these sites.
The most striking transition in microbial habitats occurs from the central mudflows to the
more stabilized seabed about 250 m away from the geographical centre of HMMV. An area of
highly sulphidic sediments covered to 40-80 % by white bacterial mats, encloses the mud
volcano (Fig. 2-5). The white mats consist of a population of filamentous Beggiatoa with a
cell diameter of 10 µm. In situ microsensor profiles indicate a high sulphide production,
reaching its maximum directly beneath the seafloor (Fig. 2b1). Total sulphide production was
calculated from the in situ microsensor profiles with 8 mol m-2 y-1. Integrated AOM and SRR
rates (Fig. 2b2) were equivalent to 5.5 mol m-2 yr-1of methane consumption and sulphide
production, respectively, at ca 1.5 mM methane and 5 mM sulphate concentration. The active
methanotrophic zone in the Beggiatoa covered sediments was restricted to a distinct zone of
ca. 3 cm below the seafloor. Within this horizon, the high-resolution profiles of sulphide
concentration (Fig. 3b1) and aggregate counts (Fig. 3b3) showed a distinct peak at 1.5 cm
sediment depth, coinciding with the maximum in AOM and SR rates (Fig. 3b2) as well as
archaeal and bacterial lipid concentrations (Fig. 3b4). The concentration of the AOM biomass
and activity within this narrow zone is likely a consequence of the optimal positioning
between the maximal upward flux in methane and the maximal downward flux in sulphate, by
diffusion and possibly also by transport with the gliding Beggiatoa filaments. 16S rDNA,
FISH, and lipid biomarker analysis revealed that AOM is mediated in this zone by a novel
cluster of archaea, most closely related to Methanosarcinaceae, but forming a distinct
phylogenetic branch (ANME-3). Similar sequences were previously retrieved from other cold
seeps like the Eel River Basin and Hydrate Ridge (Knittel et al., 2005; Orphan et al., 2001).
However, this is the first finding of a habitat dominated by this phylogenetic group. The

Chapter 2 Microbial colonisation of a submarine mud volcano: how subsurface fluid flow structures methanotrophic communities
53
average number of ANME-3 aggregates at 1.5 cm was 22*106 aggregates cm-3 (Fig. 3b3). The
lipid pattern of ANME-3 is dominated by the diethers sn2-hydroxyarchaeol and archaeol
followed by PMI:5 and PMI:4 all of which are strongly depleted in 13C with values <-98‰ in
the surface horizon. No PMIs with higher degrees of saturation or crocetane could be detected
which is in contrast to biomarker patterns of ANME-1 and ANME-2 communities
(Blumenberg et al., 2004; Elvert et al., 1999; Hinrichs et al., 1999; Michaelis et al., 2002).
The ANME-3 population at HMMV forms dense shell-type aggregates with a novel type of
SRB partner, phylogenetically different from those usually associated with AOM (Fig. 2-5)
(Knittel et al., 2005). 16S rDNA sequence analyses and FISH with targeted probes showed
that the SRB partner in the HMMV ANME-3 consortia is closely related to Desulfobulbus sp.
(DBB). Accordingly, the most depleted bacterial FAs (-70‰) found below Beggiatoa mats
are C16:1 5c and C17:1 6c both of which have been described from isolates of this
bacterium. The ANME-3/DBB population clearly dominated microbial biomass in the
sediments around the centre of HMMV. However, similar to the MOx populations dominating
the centre surface sediments, they were limited in their downward extension in the seafloor,
despite the high availability of methane. This can be explained with the lack of the AOM
electron acceptor sulphate in subsurface sediments. Compared to the centre, the penetration of
sulphate via diffusion from bottom water reaches a few cm deeper, due to the reduced
velocity of upward fluid flow of ca. 0.1 µm s-1 (4 m yr-1) according to de Beer et al.
(submitted). The authors used in situ oxygen and sulphide gradients to calculate fluid flow
and diffusion depth, showing that the maximum availability of sulphate is found between 0-3
cm sediment depth at this site, matching exactly the peak in AOM and ANME-3 biomass.
The next major transition in HMMV habitats occurs about 400m from its geographical centre,
where the sulphide oxidizer mats are completely replaced by dense tubeworm colonies
Chapter 2 Microbial colonisation of a submarine mud volcano: how subsurface fluid flow structures methanotrophic communities
54
stretching over hundreds of square meters around the HMMV (Fig. 2-6). Gravity cores from
Pogonophora fields showed the presence of cm-thick layers of gas hydrate below 100 cm
sediment depth. As a prerequisite for gas hydrate formation in these sediments, this indicates
the absence of a strong geothermal gradient, i.e. low fluid flow rates. Two Pogonophoran
species, Oligobrachia haakonmosbiensis and Sclerolinum contortum (Smirnov, 2000)
populate this area of the HMMV with biomasses of ca 2 kg m-2 wet weight. Oligobrachia, an
extremely long, thin tubeworm (ca 60 cm body length, 3 mm diameter) harbours MOx
bacteria in its trophosome, which provide the worm’s main carbon source as indicated by
similar 13C values (-70 ‰) of worm- and bacteria-derived lipids. A comparison of in situ
microsensor profiles in the tubeworm field and a nearby reference site shows that the
tubeworms actively pump oxygen and sulphate into the sediments (Fig. 2-6, -7; 3c1, 3c2).
Likely, the presence of oxygen in surface sediments displaces the anaerobic AOM
communities to deeper anoxic layers. Elevated AOM rates (Fig. 3c2) were found just at the
base of the worm tubes (-70 cm bsf) and match a subsurface peak of ANME-3 aggregates and
specific archaeal lipid concentrations (Fig. 3c3-4). Here, sulphate concentrations reach 5 mM
(Fig. 3c2), whereas both the centre and the Beggiatoa mat habitats are almost sulphate-free at
these sediment depths. Unfortunately we were not able to measure methane oxidation by the
tubeworm colonies, as the worms were not retrieved alive. The areal AOM and SR of free-
living methanotrophs was 0.2 mol m-2 yr-1 in the upper 20 cm sediment depth and 7.1 mol m-2
yr-1 including the deep AOM zone. In situ oxygen consumption calculated from microsensor
profiles (excluding worm respiration) in this zone was estimated with 0.7 mol m-2 yr-1. In
comparison, at the reference site, which was not impacted by fluid flow and did not contain
methane in the top meter of sediments, oxygen consumption driven by marine organic matter
diagenesis was ca. 0.3 mol m-2 yr-1.

Chapter 2 Microbial colonisation of a submarine mud volcano: how subsurface fluid flow structures methanotrophic communities
55
In conclusion, methane is the main energy source in all different habitat zones of HMMV and
its availability clearly selects for methanotrophic organisms. Depending on the fluid flow
velocity and hence access to electron acceptors, populations of free-living aerobic or
anaerobic methanotrophs or methanotrophic bacteria-worm symbioses dominated the total
microbial biomass in the habitat (reaching >60% of total microbial biomass in all zones). At
the centre of the mud volcano, the high fluid flow rates formed a barrier against the diffusion
of electron acceptors into the gassy sediments, selecting for aerobic methanotrophs in the top
surface layer (<5 mm). In this zone of active mud volcanism, the repeated mixing of
sediments may also favour the faster growing aerobic methanotrophs over the slow growing
anaerobic methanotrophs (doubling time >>3 month; Nauhaus et al., 2005). Sulphate
concentrations in seawater are two orders of magnitude higher than oxygen. Nevertheless, the
replenishment of sulphate via diffusion from the bottom water is a very slow process. The
vertical expansion of anaerobic methanotrophs in the Beggiatoa covered sediments was
limited to the top 3-5 cm of surface sediments at the relatively high flow rates still present in
this area of the HMMV. Regarding vertical (60 cm) and lateral (area of 0.4 km2 compared to
0.2 km2 in Beggiatoa and centre sediments, respectively) expansion as well as total biomass,
the symbiotic association of methanotrophs with Pogonophoran tubeworms appears to be the
winner at HMMV. The advantage of methanotrophic microbe-invertebrate symbioses of cold
seep ecosystems is the increased access to both electron donor as well as acceptor provided by
adaptations in the internal circulatory system as well as by motility (bivalves such as Acharax,
Calyptogena and Bathymodiolus) (Cordes et al., 2005; Sahling et al., 2002; Treude et al.,
2003) or body shape (tube worms). This first in situ investigation of an active mud volcano
shows that the efficiency of the microbial filter against the greenhouse gas methane is
controlled by fluid flow, which may inhibit the complete breakdown of the gas at high
velocities, hence exerting a negative feedback mechanism. Quantitative in situ measurements
Chapter 2 Microbial colonisation of a submarine mud volcano: how subsurface fluid flow structures methanotrophic communities
56
of gas fluxes and fluid flow are necessary to constrain the relevance of greenhouse gas
emission from these and other fluid-flow impacted geosystems.
Chapter 2 Microbial colonisation of a submarine mud volcano: how subsurface fluid flow structures methanotrophic communities
57
METHODS
Sulphate Reduction and Methane Oxidation Rates
Microbial rates of methane oxidation and sulphate reduction in sediments were determined ex
situ from the turnover of radio labelled 14CH4 and 35SO42- tracers as described
previously(Treude et al., 2003). Directly after retrieval, gravity cores were sliced open and
sediment subsamples were transferred into 6 ml glass tubes, sealed with butyl rubber stoppers
and transferred to a cold room (2 °C) where 35SO42- and 14CH4 was injected. ROV push cores
were processed as described previously (Treude et al., 2003). Glass tubes and cores were
incubated for 24h at in situ temperature before the reaction was stopped by mixing the
sediment with respectively 20% ZnCl2 and 5% NaOH solution. Separation of radioactive
species and rate calculations were performed as described previously (Boetius et al., 2000;
Michaelis et al., 2002; Treude et al., 2003). Aerobic and anaerobic methane oxidation was
distinguished according to the presence or absence of oxygen during the tracer incubations.
Lipid Analysis
Lipid biomarker were extracted from frozen sediment samples and Pogonophora sp. tissue by
successive sonication in solvent mixtures of decreasing polarity and derivated as described
previously (Elvert et al., 2003; Michaelis et al., 2002) before injection onto a 50 m HP5 fused
silica capillary column (0.32 mm i.d., 0.17 µm film thickness). Chromatographic conditions
Chapter 2 Microbial colonisation of a submarine mud volcano: how subsurface fluid flow structures methanotrophic communities
58
for lipid analysis were the same as described previously (Elvert et al., 2003) with slight
modifications of the temperature gradient for the analysis of the neutral fraction. Column
temperature was programmed from 60 to 150 °C at a rate of 10 °C min-1 and then at a rate of
4 °C min-1 to 310 °C (45 min isothermal). Compounds were identified on a Finnigan Trace
MS. Stable carbon isotope composition of single compounds were determined with a
Finnigan Delta Plus isotope mass spectrometer. Reported 13C-values are corrected for the
introduction of additional carbon atoms during derivatisation. 13C-values have an analytical
error of 1‰
Fluorescence In Situ Hybridisation
Cells of Methylobacter sp. and ANME-3/DBB aggregates were quantified by fluorescence in
situ hybridization with horseradish peroxidase (HRP)-labelled oligonucleotide probes and
tyramide signal amplification (CARD-FISH) according to previously described methods
(Pernthaler et al., 2002). New oligonucleotide probes used in this study were MetI-444
(Methylobacter sp.; 5’-CCTGCCTGTTTTCCTCCC-3’), probe 660 (Desulfobulbus sp.;
5’-GAATTCCACTTTCCCCTCTG-3’) and ANME3-1249 (ANME-3 archaea;
5’-TCGGAGTAGGGACCCATT-3’), purchased from biomers.net GmbH, Ulm, Germany.
Sediments were treated prior to FISH staining as described previously (Boetius et al., 2000;
Snaidr et al., 1997).

Chapter 2 Microbial colonisation of a submarine mud volcano: how subsurface fluid flow structures methanotrophic communities
59
Sulphate and Sulphide Concentrations
Sulphate concentrations were determined from 5ml sediment fixed in 50 ml corning vials with
25 ml zinc acetate solution (20%, w/v). An aliquot of the supernatant was injected into a
Waters HPLC system (Waters 512 HPLC pump, I.C.-Pak anion-column (Waters;
WAT007355) 4.6 x 50 mm, Waters 730 conductivity detector). Isophtalic acid (1mM) was
used as a solvent at a constant flow rate of 1ml min-1. Sulphate concentrations were corrected
for porosity which was determined according to a previously described method (Treude et al.,
2003). Total sulphide concentrations were determined in situ using microsensors for H2S and
pH measurements mounted to a free falling lander system or directly deployed by the ROV.
Microsensor Measurements
Microsensors for Oxygen, H2S and pH were manufactured and used as described previously
(de Beer et al., 2005). Tip diameters were ca. 20 µm and the response time (t90) <3 sec. The
temperature sensor (Pt100, UST Umweltsensortechnik GmbH, Thüringen, Germany) had a tip
diameter of 3 mm and a response time of ca. 5 sec. The sensors were calibrated after
mounting on a deep sea profiling unit as described previously (Wenzhofer and Glud, 2002).
Total sulphide concentrations were calculated from H2S and pH. The profiler was pre-
programmed to measure profiles with a spatial resolution of 0.025 cm. The effect of pore
water upflow on the sulphate concentration profile was estimated from the local mass balance
v*C=D*dC/dx. Integrated over depth Dv
0x eCC where Cx is the sulphate concentration at
depth x, C0 the surface sulphate concentration, D the diffusion coefficient for sulphate in the
sediment (Dsed,sulfate= 0.18e-9 m2s-1).
Chapter 2 Microbial colonisation of a submarine mud volcano: how subsurface fluid flow structures methanotrophic communities
60
References
Blumenberg M., Seifert R., Reitner J., Pape T., and Michaelis W. (2004) Membrane lipid patterns typify distinct anaerobic methanotrophic consortia. Proceedings of the National Academy of Sciences of the United States of America 101(30).
Boetius A., Ravenschlag K., Schubert C., Rickert D., Widdel F., Gieseke A., Amann R., Jørgensen B. B., Witte U., and Pfannkuche O. (2000) A marine microbial consortium apparently mediating anaerobic methane of oxidation. Nature 407, 623-626.
Boetius A. and Suess E. (2004) Hydrate Ridge: a natural laboratory for the study of microbial life fueled by methane from near-surface gas hydrates. Chemical Geology 205(3-4),291-310.
Cordes E. E., Arthur M. A., Shea K., Arvidson R. S., and Fisher C. R. (2005) Modeling the mutualistic interactions between tubeworms and microbial consortia. Plos Biology3(3), 497-506.
Damm E. and Budeus G. (2003) Fate of vent-derived methane in seawater above the Hakon Mosby mud volcano (Norwegian Sea). Marine Chemistry 82(1-2), 1-11.
de Beer D., Sauter E., Niemann H., Witte U., and Boetius A. (submitted) In situ fluxes and zonation of microbial activity in surface sediments of the Håkon Mosby Mud Volcano. Limnology and Oceanography.
de Beer D., Wenzhofer F., Ferdelman T. G., Boehme S. E., Huettel M., van Beusekom J. E. E., Bottcher M. E., Musat N., and Dubilier N. (2005) Transport and mineralization rates in North Sea sandy intertidal sediments, Sylt-Romo Basin, Wadden Sea. Limnology and Oceanography 50(1), 113-127.
Elvert M., Boetius A., Knittel K., and Jorgensen B. B. (2003) Characterization of specific membrane fatty acids as chemotaxonomic markers for sulfate-reducing bacteria involved in anaerobic oxidation of methane. Geomicrobiology Journal 20(4), 403-419.
Elvert M., Suess E., and Whiticar M. J. (1999) Anaerobic methane oxidation associated with marine gas hydrates: superlight C-isotopes from saturated and unsaturated C20 and C25
irregular isoprenoids. Naturwissenschaften 86(6), 295-300. Ginsburg G. D., Milkov A. V., Soloviev V. A., Egorov A. V., Cherkashev G. A., Vogt P. R.,
Crane K., Lorenson T. D., and Khutorskoy M. D. (1999) Gas hydrate accumulation at the Hakon Mosby Mud Volcano. Geo-Marine Letters 19(1-2), 57-67.
Girguis P. R., Orphan V. J., Hallam S. J., and DeLong E. F. (2003) Growth and methane oxidation rates of anaerobic methanotrophic archaea in a continuous-flow bioreactor. Applied and Environmental Microbiology 69(9), 5472-5482.
Hinrichs K.-U., Hayes J. M., Sylva S. P., Brewer P. G., and DeLong E. F. (1999) Methane-consuming archaebacteria in marine sediments. Nature 398, 802-805.
Hjelstuen B. O., Eldholm O., Faleide J. I., and Vogt P. R. (1999) Regional setting of Hakon Mosby Mud Volcano, SW Barents Sea margin. Geo-Marine Letters 19(1-2), 22-28.
Kennicutt M. C., Brooks J. M., Bidigare R. R., Fay R. R., Wade T. L., and MacDonald T. J. (1985) Vent-type taxa in a hydrocarbon seep region on the Louisiana slope. Nature317, 351-353.
Klages M., Mesnil B., Soldtwedel T., and Christophe A. (2002) L' expédition "AWI" sur NO L'Atalante en 2001. [The Expedition "AWI" on RV L'Atalante in 2001]. Alfred-Wegener-Institute for Polar and Marine Research.
Klages M., Thiede J., and Foucher J. P. (2004) The Expedition ARKTIS XIX/3 of the Research Vessel POLARSTERN in 2003 Reports of legs 3a, 3b and 3c, pp. 355. Alfred-Wegener-Institute for Polar and Marine Research.
Chapter 2 Microbial colonisation of a submarine mud volcano: how subsurface fluid flow structures methanotrophic communities
61
Knittel K., Losekann T., Boetius A., Kort R., and Amann R. (2005) Diversity and distribution of methanotrophic archaea at cold seeps. Applied and Environmental Microbiology71(1), 467-479.
Michaelis W., Seifert R., Nauhaus K., Treude T., Thiel V., Blumenberg M., Knittel K., Gieseke A., Peterknecht K., Pape T., Boetius A., Amann R., Jorgensen B. B., Widdel F., Peckmann J. R., Pimenov N. V., and Gulin M. B. (2002) Microbial reefs in the Black Sea fueled by anaerobic oxidation of methane. Science 297(5583), 1013-1015.
Milkov A., Vogt P., Cherkashev G., Ginsburg G., Chernova N., and Andriashev A. (1999) Sea-floor terrains of Hakon Mosby Mud Volcano as surveyed by deep-tow video and still photography. Geo-Marine Letters 19(1-2), 38-47.
Milkov A. V., Vogt P. R., Crane K., Lein A. Y., Sassen R., and Cherkashev G. A. (2004) Geological, geochemical, and microbial processes at the hydrate-bearing Hakon Mosby mud volcano: a review. Chemical Geology 205(3-4), 347-366.
Nauhaus K., Boetius A., Kruger M., and Widdel F. (2002) In vitro demonstration of anaerobic oxidation of methane coupled to sulphate reduction in sediment from a marine gas hydrate area. Environmental Microbiology 4(5), 296-305.
Nauhaus K., Treude T., Boetius A., and Kruger M. (2005) Environmental regulation of the anaerobic oxidation of methane: a comparison of ANME-I and ANME-II communities. Environmental Microbiology 7(1), 98-106.
Orphan V. J., Hinrichs K. U., Ussler W., Paull C. K., Taylor L. T., Sylva S. P., Hayes J. M., and Delong E. F. (2001) Comparative analysis of methane-oxidizing archaea and sulfate- reducing bacteria in anoxic marine sediments. Applied and Environmental Microbiology 67(4), 1922-1934.
Parkes R. J., Cragg B. A., and Wellsbury P. (2000) Recent studies on bacterial populations and processes in subseafloor sediments: A review. Hydrogeology Journal 8(1), 11-28.
Pernthaler A., Preston C. M., Pernthaler J., DeLong E. F., and Amann R. (2002) Comparison of fluorescently labeled oligonucleotide and polynucleotide probes for the detection of pelagic marine bacteria and archaea. Applied and Environmental Microbiology 68(2),661-667.
Pimenov N., Savvichev A., Rusanov I., Lein A., Egorov A., Gebruk A., Moskalev L., and Vogt P. (1999) Microbial processes of carbon cycle as the base of food chain of Håkon Mosby mud volcano benthic community. Geo-Marine Letters 19, 89-96.
Sahling H., Rickert D., Lee R. W., Linke P., and Suess E. (2002) Macrofaunal community structure and sulfide flux at gas hydrate deposits from the Cascadia convergent margin, NE Pacific. Marine Ecology-Progress Series 231, 121-138.
Sauter E., Muyakshin J., Charlou J., Schlüter M., Boetius A., Jerosch K., Damm E., Foucher J. P., and Klages M. (submitted) Methane discharge from a deep-sea submarine mud volcano into the upper water column by gas hydrate-coated methane bubbles. Earthand Planetary Science Letters.
Shilov V. V., Druzhinina N. I., Vasilenko L. V., and Krupskaya V. V. (1999) Stratigraphy of sediments from the Hakon Mosby Mud Volcano Area. Geo-Marine Letters 19(1-2),48-56.
Smirnov R. V. (2000) Two new species of Pogonophora from the arctic mud volcano off northwestern Norway. Sarsia 85(2), 141-150.
Snaidr J., Amann R., Huber I., Ludwig W., and Schleifer K. H. (1997) Phylogenetic analysis and in situ identification of bacteria in activated sludge. Applied and Environmental Microbiology 63(7), 2884-2896.
Spiess F. N., Macdonald K. C., Atwater T., Ballard R., Carranza A., Cordoba D., Cox C., Diazgarcia V. M., Francheteau J., Guerrero J., Hawkins J., Haymon R., Hessler R., Juteau T., Kastner M., Larson R., Luyendyk B., Macdougall J. D., Miller S., Normark

Chapter 2 Microbial colonisation of a submarine mud volcano: how subsurface fluid flow structures methanotrophic communities
62
W., Orcutt J., and Rangin C. (1980) East Pacific Rise - Hot Springs and Geophysical Experiments. Science 207(4438), 1421-1433.
Suess E., Carson B., Ritger S. D., Moore J. C., Jones M. L., Kulm L. D., and Cochrane G. R. (1985) Biological communities at vent sites along the subduction zone off Oregon. Biological Society of the Washington Bulletin 6, 475-484.
Treude T., Boetius A., Knittel K., Wallmann K., and Jorgensen B. B. (2003) Anaerobic oxidation of methane above gas hydrates at Hydrate Ridge, NE Pacific Ocean. MarineEcology-Progress Series 264, 1-14.
Vogt P. R., Cherkashev A., Ginsburg G. D., Ivanov G. I., Crane K., Lein A. Y., Sundvor E., Pimenov N. V., and Egorov A. (1997a) Haakon Mosby mud volcano: A warm methane seep with seafloor hydrates and chemosynthesis-based Ecosystem in late Quantemary Slide Valley, Bear Island Fan, Barents Sea passive margin. EOSTransactions of the American Geophysical Union Supplement 78(17), 187-189.
Vogt P. R., Cherkashev G., Ginsburg G., Ivanov G. I., Milkov A., Crane K., Lein A., Sundvor E., Pimenov N. V., and Egorov A. (1997b) Haakon Mosby Mud Volcano Provides Unusual Example of Venting. EOS Transactions of the American Geophysical Union Supplement 78(48), 549, 556-557.
Vogt P. R., Crane K., Pfirman S., Sundvor E., Cherkis N., Fleming H., Nishimura C., and Shor A. (1991) SeaMARC II sidescan sonar imagery and swath bathymetry in the Nordic Basin. EOS 72(486).
Wallmann K., Linke P., Suess E., Bohrmann G., Sahling H., Schlüter M., Dählmann A., Lammers S., Greinert J., and von Mirbach N. (1997) Quantifying fluid flow, solute mixing, and biogeochemical turnover at cold vents of the eastern Aleutian subduction zone. Geochimica et Cosmochimica Acta 61(24), 5209-5219.
Wenzhofer F. and Glud R. N. (2002) Benthic carbon mineralization in the Atlantic: a synthesis based on in situ data from the last decade. Deep-Sea Research Part I-Oceanographic Research Papers 49(7), 1255-1279.

Chapter 3 Lipid signatures and distribution of methanotrophic microbial communities at HMMV, Barents Sea
63
Lipid signatures and distribution of methanotrophic microbial communities
at Håkon Mosby Mud Volcano, Barents Sea
Helge Niemann1,2, Marcus Elvert1,*, Tina Lösekann1, Jakob Jakob1, Thierry Nadalig3,#, Antje
Boetius1,2
1Max Planck Institute for Marine Microbiology Bremen, Celsiusstr.1, 28359 Bremen,
Germany
2Alfred Wegener Institute for Polar and Marine Research, Am Handelshafen 12, 27515
Bremerhaven, Germany
3IFREMER Centre de Brest, BP 70, 29280 Plouzane, France
*Present address: Research Center Ocean Margins, University of Bremen, Loebener Str.,
28359 Bremen
#Present address: Dynamique, Evolution, et Expression des Genomes de Microorganismes,
FRE 2326 Université Louis Pasteur, 67083 Strasbourg, France
Author to whom correspondence should be addressed:
Helge Niemann Max Planck Institute for Marine Microbiology, Celsiusstr. 1, 28359 Bremen, Germany email: [email protected], phone +49-421-2028653
Chapter 3 Lipid signatures and distribution of methanotrophic microbial communities at HMMV, Barents Sea
64
ABSTRACT
The Håkon Mosby Mud Volcano (HMMV) is an active methane seeping mud volcano at 1250
m water depth on the Norwegian margin of the Barents Sea. Sediment samples from three
distinct zones of the mud volcano (central crater, grey microbial mats and Beggiatoa fields)
were investigated for archaeal and bacterial lipid signatures and their associated 13C-values.
Measurements obtained in 2 cm sections over a vertical profile down to 20 cm sediment depth
revealed a distinct horizontal and vertical distribution of aerobic and anaerobic
methanotrophic guilds. In the central area, aerobic methanotrophy (MOx) is the primary
biomass-generating process. Here, the predominant bacterial fatty acids C16:1 8 and C16:2 with
13C values <-80‰ belong to a type I methanotroph. This MOx horizon is restricted to the
sediment surface. Below, only traces of anaerobic methanotrophs are present, indicated by
low amounts of the 13C-depleted, archaeal lipids archaeol and sn2-hydroxyarchaeol. In
patches of reduced sediment, covered by greyish, thiotrophic microbial mats at the boundary
of the centre, a four-fold increase in archaeal lipids specific for anaerobic methanotrophs was
observed. It was accompanied by a strong depletion in 13C with values down to -118‰,
giving evidence of active microbial communities, which mediate anaerobic oxidation of
methane (AOM) in the upper 20 cm of the sediment. Further away from the centre, in the
zone covered by Beggiatoa mats, anaerobic methanotrophy appeared to be the predominant
biomass generating process in the surface sediments. Consortia of methanotrophic archaea
and sulphate reducing bacteria were most abundant down to 4 cm sediment depth as indicated
by sharp, vertical gradients of archaeal and bacterial lipids with 13C-values down to -109‰.
These gradients correlated with a surface peak of 22*106 microbial aggregates cm-3.
Diagnostic, archaeal lipids found in the uppermost sediment horizon were dominated by sn2-
hydroxyarchaeol and pentamethylicosane (PMI) with 5 double bounds followed by archaeol
and PMI:4. Diagnostic bacterial fatty acids were dominated by C16:1 5 followed by ai-C15:0, i-
Chapter 3 Lipid signatures and distribution of methanotrophic microbial communities at HMMV, Barents Sea
65
C15:0 and C17:1 6. A combination of molecular techniques (DAPI, FISH, 16S rDNA clone
libraries) and biomarker fingerprints of 13C-depleted archaeal and bacterial lipids provide
evidence that the AOM community was dominated by a novel cluster of methanotrophic
archaea (termed ANME-3) and sulphate reducing bacteria (SRB) of the Desulfobulbus cluster.
HMMV can be considered as a natural laboratory where different types of methanotrophic
communities are selected by the geological and hydrodynamical structure of the mud volcano.
Chapter 3 Lipid signatures and distribution of methanotrophic microbial communities at HMMV, Barents Sea
66
1. INTRODUCTION
Methane is an aggressive greenhouse gas with a 21 to 56 fold higher global warming potential
than carbon dioxide (Manne and Richels, 2001). The atmospheric concentration of methane
has reached 1740 ppb and is further increasing, most probably contributing to global climate
change (Wuebbles and Hayhoe, 2002). High amounts of methane are temporarily stored at
continental margins as free gas, dissolved or as solid clathrate. Increasing research effort has
therefore been dedicated to elucidate sources and sinks of methane. Actively gas-emitting
mud volcanoes have been recognized as an important natural source of methane and were
reported from terrestrial and oceanic settings (Dimitrov, 2002; Dimitrov, 2003; Judd et al.,
2002; Kopf et al., 2001). Mud volcanism is caused by various geological processes, such as
tectonic accretion and faulting, rapid burial of sediments, slope failures or fluid emissions
from mineral dehydration. These processes can lead to an abnormally high pore fluid pressure
and the extrusion of mud and fluids through a central conduit to the sea floor, which is often
accompanied by the expulsion of methane and higher hydrocarbons (Charlou et al., 2003;
Kopf, 2002; Milkov, 2000; Somoza et al., 2003). Methane from mud volcanoes can be of
thermogenic and/or microbial origin, depending on the oceanographic and tectonic setting.
The shape of these structures is diverse, ranging from amorphous mud pies to conical
structures and from a few meters to kilometres in size. While there is a reliable number of
~900 known terrestrial mud volcanoes, estimates for deep water mud volcanoes, mainly
situated along the continental margins, range between 800 and 100000 (Dimitrov, 2002;
Dimitrov, 2003; Milkov, 2000; Milkov et al., 2003). This makes budget calculations very
preliminary. However, global estimates suggest that terrestrial and shallow water mud
volcanoes contribute between 2.2 and 6 Tg yr-1 of methane to the atmosphere and that 27 Tg
Chapter 3 Lipid signatures and distribution of methanotrophic microbial communities at HMMV, Barents Sea
67
yr-1 of methane may escape from deep water mud volcanoes (Dimitrov, 2003; Milkov et al.,
2003). Mud volcanism is therefore a key process in the global methane cycle.
At sites of active gas emission, communities of microbial organisms develop that can utilise
methane as en energy source (Hanson et al., 1993; Sibuet and Olu, 1998). The microbial
oxidation of methane is a significant sink term in the global methane budget (Reeburgh, 1996;
Whiticar, 1999). Methane oxidation can be mediated aerobically by bacteria using oxygen as
electron acceptor, or anaerobically by archaea and SRB, using sulphate as the terminal
electron acceptor. Organisms involved in MOx belong to the , and subdivision of the
Proteobacteria and have been reported from oxygenated wetlands, soils and the marine water
column (Hanson et al., 1993; Le Mer and Roger, 2001). However, marine sediments have a
very limited oxygen penetration depth and will mostly not provide suitable conditions for
MOx communities. Due to the higher availability of sulphate in seawater, AOM is the main
sink for methane in marine sediments (Hinrichs and Boetius, 2002). AOM is mediated by
archaea phylogenetically related to the methanogens. So far, the known anaerobic methane
oxidisers (ANME-1 and ANME-2) have been detected in consortium with SRB of one cluster
in the Desulfosarcina/Desulfococcus branch (Seep-SRB1; Knittel et al. 2003). This was
determined using combinations of lipid analyses and 16S rDNA methods in various methane
seep environments (Aloisi et al., 2002; Boetius et al., 2000; Elvert et al., 1999; Hinrichs et al.,
1999; Knittel et al., 2003; Knittel et al., 2005; Michaelis et al., 2002; Orphan et al., 2001a;
Orphan et al., 2001b).
Generally, both aerobic and anaerobic methanotrophy are accompanied by a discrimination
against the heavy stable carbon isotope 13C, leading to a substantial 12C-enrichment of
metabolites and microbial biomass (Elvert et al., 1999; Hinrichs et al., 1999; Orphan et al.,
2001b; Summons et al., 1994; Thiel et al., 1999; Whiticar, 1999). Moreover, AOM and MOx
Chapter 3 Lipid signatures and distribution of methanotrophic microbial communities at HMMV, Barents Sea
68
derived carbon can fuel higher trophic levels in the benthic food web (Levin and Michener,
2002; Werne et al., 2002), and provide energy to symbiotic invertebrates hosting
methanotrophic or thiotrophic symbionts (Fisher and Childress, 1992). Although increasing
knowledge is available on the structure and distribution of cold seep communities at
continental margins, the factors selecting for free-living versus invertebrate-associated
methanotrophs, or aerobic versus anaerobic microbial communities at submarine methane
seeps remain so far unknown.
To study the composition and distribution of methanotrophic communities at an active
submarine mud volcano, we investigated HMMV with the research vessel R/V Atalante and
the ROV VICTOR 6000 in 2001 and with R/V Polarstern and ROV VICTOR 6000 in 2003
(Klages et al., 2002; Klages et al., 2004). The HMMV is a glacial deposit of 3 km thickness
(Shilov et al., 1999) located at 72° 00,25’N and 14° 43.50’E in 1250 m water depth in the SW
Barents Sea (Shilov et al., 1999; Vogt et al., 1997a; Vogt et al., 1997b). It has a circular shape
and is 1 km in diameter with a relief of 10 m (Hjelstuen et al., 1999). Thermal gradients in the
centre are high with values >1000 mK m-1 where methane-rich sediments are expelled through
a central conduit (Eldholm et al., 1999; Vogt et al., 1997b). Source methane at HMMV is of a
mixed microbial-thermogenic origin with 13C values of –60 ±5 ‰ (Lein et al., 1999).
Previous studies revealed three main habitats: (1) bare greyish sediments in the central crater;
(2) a concentric zone of strongly reduced sediments that are densely covered by white,
microbial mats consisting of the filamentous, sulphide oxidising bacteria Beggiatoa sp.
adjacent to the centre; (3) an outer rim which is densely colonised by two species of
pogonophoran worms, Oligobrachia haakonmosbiensis and Sclerolinum contortum (Milkov
et al., 1999; Milkov et al., 2004; Smirnov, 2000). During our ROV dives we discovered
another type of habitat, i.e. patches of reduced sediments, which were covered with greyish,
putatively thiotrophic, microbial mats in the transition zones between the central area and
Chapter 3 Lipid signatures and distribution of methanotrophic microbial communities at HMMV, Barents Sea
69
Beggiatoa covered sediments. The main focus of this study was the quantitative investigation
of the diversity and distribution of methanotrophic organisms in sediments of the central area,
grey mat and Beggiatoa habitat of HMMV, applying cultivation-independent molecular
techniques (biomarker and 16S rDNA-based).
Chapter 3 Lipid signatures and distribution of methanotrophic microbial communities at HMMV, Barents Sea
70
2. MATERIALS AND METHODS
2.1 Sample Collection and Storage
Sediment samples were recovered with the remotely operated vehicle (ROV) Victor 6000 by
push coring during two cruise with R/V L’Atalante (IFREMER) in 2001 and R/V Polarstern
in 2003 from four different stations (thermal centre, core 25a; grey mat, core 377-13;
Beggiatoa-covered, core 19; reference station, core 28). Upon recovery, sediment cores were
sliced in 1 cm and 2 cm sections for microbiological and lipid analysis, respectively.
Sediment sections for lipid and DNA analysis were transferred into pre-cleaned glass vials
and stored at –25°C until extraction. Sediments for microbiological analysis were stored at in
situ temperature until cell fixation.
2.2 Biomarker Analysis
2.2.1 Extraction of Sediment Samples and Preparation of Derivates
Extraction procedure and the preparation of fatty acid methyl esters (FAMES) was carried out
according to Elvert and co-workers (2003). Briefly, total lipid extracts (TLE) were obtained
from 10-12 g of wet sediment. The TLE was extracted with the aid of ultrasonication in
solvents of decreasing polarity. Internal standards of known concentration and carbon isotopic
compositions were added prior to extraction. Ester bonded fatty acids (FAs) in glyco- and
phospholipids were cleaved by a saponification reaction with KOH-solution. After extraction
Chapter 3 Lipid signatures and distribution of methanotrophic microbial communities at HMMV, Barents Sea
71
of the neutral lipid fraction from this mixture, FAs were extracted subsequently to
acidification, and methylated for analysis using BF3 in methanol yielding FAMES.
Neutral lipids were further separated into hydrocarbons, ketones and alcohols over a SPE
silica glass cartridge (0.5 g). Prior to separation, the column was cleaned three times with 5
ml n-hexane/dichloromethane (95:5, v/v). After the neutral fraction was applied to the
column, solvent mixtures of increasing polarity were subsequently added: (I) 5 ml n-
hexane/dichloromethane (95:5, v/v), (II) 5 ml n-hexane/dichloromethane (2:1, v/v) and (III) 5
ml dichloromethane/acetone (9:1, v/v). Neutral lipid fractions (hydrocarbons (I), ketones (II)
and alcohols (III), respectively) were collected in tipped flasks and excess solvent was
evaporated down to 100 µl and stored at –20°C until further processing and analysis. Alcohols
were analysed as their trimethylsilyl (TMS) ethers. Shortly before analysis (<1 week), excess
solvent of selected alcohol fractions was evaporated close to dryness. 100 µl pyridine and 50
µl bis(trimethylsilyl)triflouracetamid were added and the reaction was carried out at 70°C for
1 h. After cooling, excess solvent was evaporated and the remaining TMS adducts were re-
suspended in 50 µl of n-hexane. TMS-adducts were stored at –20°C until GC, GC-MS and
GC-IRMS analysis.
2.2.2 Preparation of Dimethyl Disulphide (DMDS) Adducts
Double bond position of monoenoic FAs were determined by analysis as their DMDS adducts
according to previous publications (Moss and Lambert-Fair, 1989; Nichols et al., 1986).
Briefly, an aliquot of a selected sample (dissolved in 50µl n-hexane) was treated with DMDS
(100µl) and iodine-diethyl ether solution (20 µl, 6% w/v). Formation of DMDS adducts was
carried out at 50°C for 48 h. After cooling, 0.5 ml n-hexane were added and excess iodine was
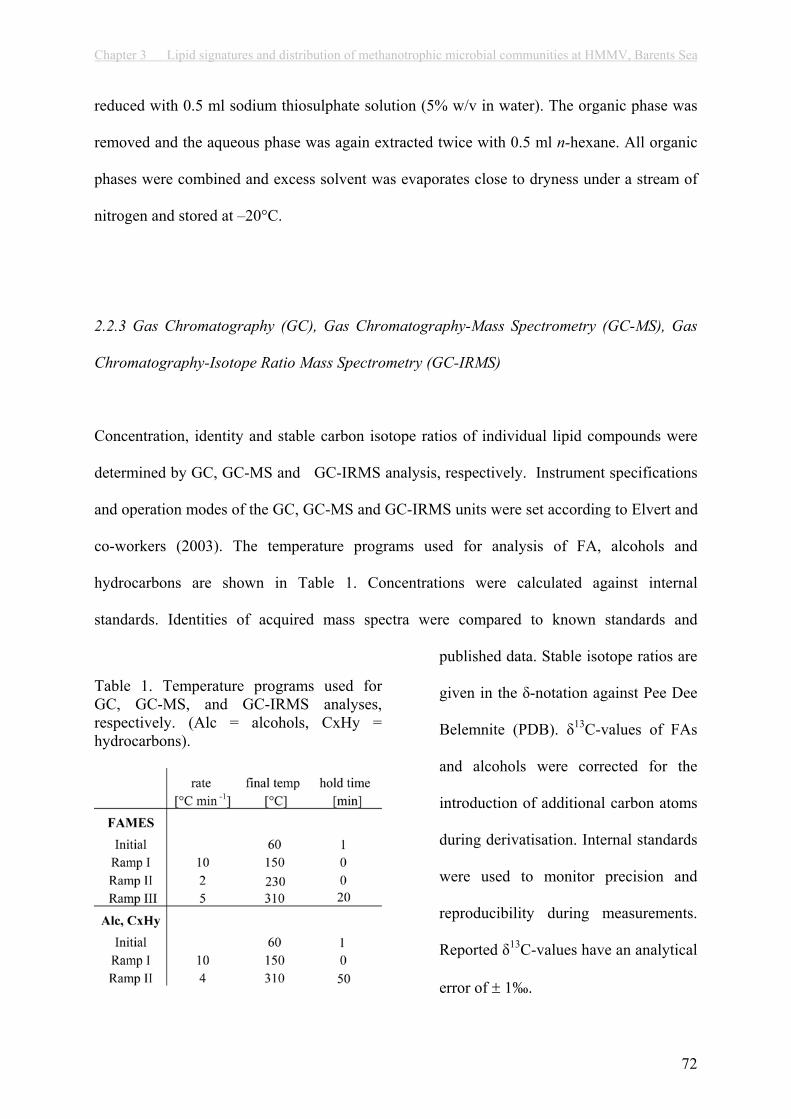
Chapter 3 Lipid signatures and distribution of methanotrophic microbial communities at HMMV, Barents Sea
72
reduced with 0.5 ml sodium thiosulphate solution (5% w/v in water). The organic phase was
removed and the aqueous phase was again extracted twice with 0.5 ml n-hexane. All organic
phases were combined and excess solvent was evaporates close to dryness under a stream of
nitrogen and stored at –20°C.
2.2.3 Gas Chromatography (GC), Gas Chromatography-Mass Spectrometry (GC-MS), Gas
Chromatography-Isotope Ratio Mass Spectrometry (GC-IRMS)
Concentration, identity and stable carbon isotope ratios of individual lipid compounds were
determined by GC, GC-MS and GC-IRMS analysis, respectively. Instrument specifications
and operation modes of the GC, GC-MS and GC-IRMS units were set according to Elvert and
co-workers (2003). The temperature programs used for analysis of FA, alcohols and
hydrocarbons are shown in Table 1. Concentrations were calculated against internal
standards. Identities of acquired mass spectra were compared to known standards and
published data. Stable isotope ratios are
given in the -notation against Pee Dee
Belemnite (PDB). 13C-values of FAs
and alcohols were corrected for the
introduction of additional carbon atoms
during derivatisation. Internal standards
were used to monitor precision and
reproducibility during measurements.
Reported 13C-values have an analytical
error of 1‰.
Table 1. Temperature programs used for GC, GC-MS, and GC-IRMS analyses, respectively. (Alc = alcohols, CxHy = hydrocarbons).
Chapter 3 Lipid signatures and distribution of methanotrophic microbial communities at HMMV, Barents Sea
73
2.3 Analysis of Microbial Consortia
2.3.1 Fluorescence In Situ Hybridisation
Aggregates of archaeal cells were quantified by fluorescence in situ hybridisation (FISH)
according to the method and instrument specifications of Knittel and co-workers (2003,
2005). Briefly, sediments of the centre and below Beggiatoa mats were fixed with
2% formaldehyde (final concentration), washed twice with 1xPBS (10 mM sodium
phosphate, 130 mM NaCl) and finally stored in 1xPBS/EtOH (1:1) at –20°C. Fixed samples
were diluted 1:10, treated by mild sonication and filtered on 0.2 µm GTTP polycarbonate
filters. Hybridisation with Cy3-labeled Arch915 and staining of cells with 4´,6´-diamidino-2-
phenylindole (DAPI) was performed as described previously (Amann et al., 1990; Snaidr et
al., 1997). Samples were examined with an epifluorescence microscope (Axiophot II
microscope; Carl Zeiss, Jena, Germany).
2.3.2 DNA Extraction and Clone Library Construction
Total community DNA in sediments below Beggiatoa mats was directly extracted from 2 g of
wet surface sediments (0-2 cm) according to Zhou et al. (1996). Crude DNA was purified
with the Wizard DNA Clean-Up Kit (Promega, Madison, WI). Almost full-length archaeal
16S rRNA genes from the extracted chromosomal DNAs were amplified using primers 20f
(Massana et al., 1997) and Uni1392R (Lane et al., 1985). PCRs were performed with a
Mastercycler Gradient (Eppendorf, Hamburg, Germany) as described previously
(Ravenschlag et al., 1999), except that the annealing temperature was 58°C. PCR products of
Chapter 3 Lipid signatures and distribution of methanotrophic microbial communities at HMMV, Barents Sea
74
several reactions were combined and purified with the QiaQuick PCR Purification Kit
(Qiagen, Hilden, Germany). DNA was ligated in the pGEM T-Easy vector (Promega,
Madison, WI) or the pCR4 TOPO vector (Invitrogen, Carlsbad, CA) and transformed into
E. coli TOP10 cells (Invitrogen, Carlsbad, CA) according to the manufacturer’s
recommendations. Sequencing was performed by Taq cycle sequencing with a model
ABI1377 sequencer (Applied Biosystems) with insert-specific and vector primers. The
absence of chimeric sequences in the clone library was verified with the CHIMERA_CHECK
program of the Ribosomal Database Project II (http://rdp.cme.msu.edu/html/analyses.html).
Sequence data were analysed with the ARB software package (Strunk et al., 1998).
Phylogenetic trees were calculated by parsimony, neighbour-joining, and maximum-
likelihood analysis with different sets of filters that consider only 50% conserved regions of
the 16S rDNA of Archaea. For tree calculation, only full-length sequences (>1315 bp) were
considered. Partial sequences were inserted into the reconstructed tree by parsimony criteria
with global/local optimisation without allowing changes in the overall tree topology. The
sequence data reported here will appear in the EMBL, GenBank, and DDBJ nucleotide
sequence databases under the accession no. AJ704631, AJ704650-AJ704653.
Chapter 3 Lipid signatures and distribution of methanotrophic microbial communities at HMMV, Barents Sea
75
3. RESULTS
3.1 Lipid Biomarker
3.1.1 Centre
Fatty acids were found to be the dominant membrane lipids in sediments of the centre (Fig.
1b, Tab. 2a). FAs at the centre of HMMV were concentrated in a narrow subsurface horizon
(0-2 cm bsf) and sharply decreased with increasing sediment depth (Fig. 1b). Specific FAs
include i-C15:0, ai-C15:0, C16:1 c, C16:1 8c, C16:1 c and C16:2. These FAs were strongly depleted
in 13C and of higher abundance than other bacterial FAs. 13C-values of FAs showed highest
13C-depletions in the top horizon with very low values ranging between –67‰ (i-C15:0) to –
89‰ (C16:1 c). High amounts and a strong 13C-depletion of FA C16:1 8c directly indicates the
presence of methanotrophic bacteria in the surface sediments (Hanson and Hanson, 1996). At
7.5 cm bsf, 13C-values of C16:1 8c and C16:1 7c showed a second minimum with –47‰ and –
69‰, respectively, but increased to –32‰ in the bottom horizon. Hence, the isotopic
signature of specific FAs showed the strongest depletion in the zone with the highest
concentration of the lipids. Below this zone, only minor amounts of archaeol and sn2-
hydroxyarchaeol were found in the centre sediments. Both compounds were moderately
depleted in 13C but showed an offset in 13C of about 25‰ with a heavier signature of
archaeol compared to sn2-hydroxyarchaeol (Fig. 1a). Other specific biomarkers of archaeal
origin include trace amounts of PMI:4 and PMI:5 for which carbon isotopic values could not
be measured due to their low abundance.
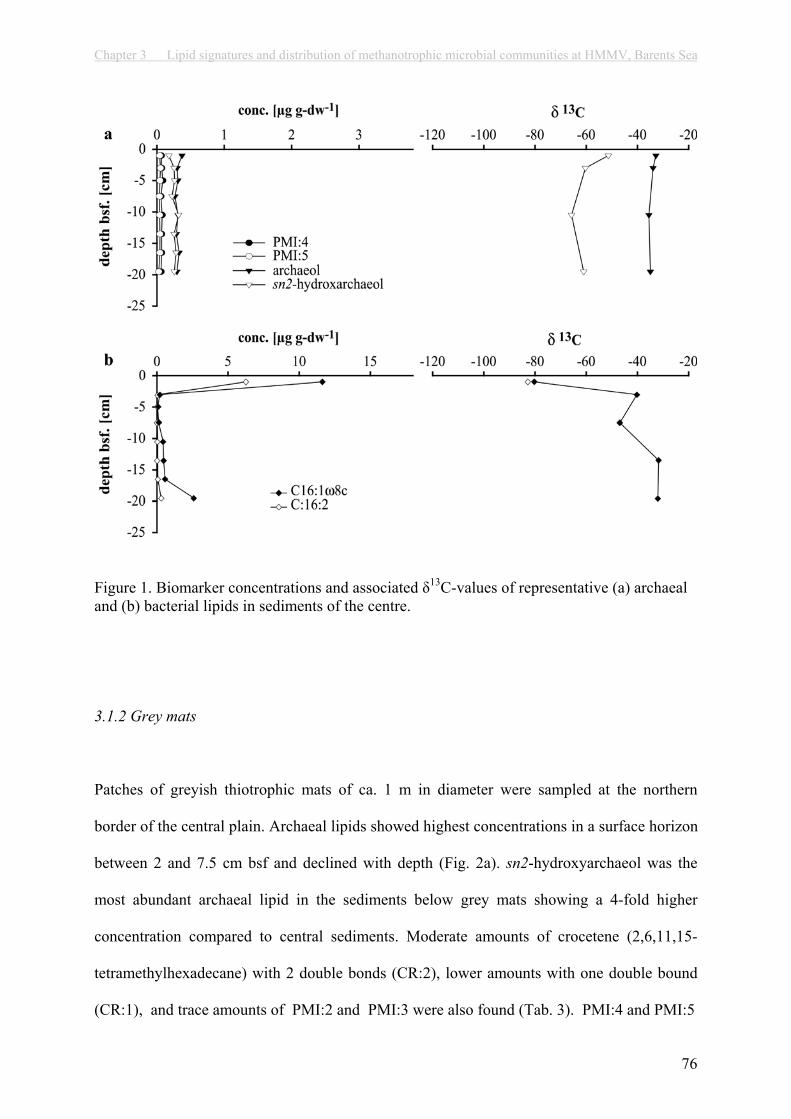
Chapter 3 Lipid signatures and distribution of methanotrophic microbial communities at HMMV, Barents Sea
76
Figure 1. Biomarker concentrations and associated 13C-values of representative (a) archaeal and (b) bacterial lipids in sediments of the centre.
3.1.2 Grey mats
Patches of greyish thiotrophic mats of ca. 1 m in diameter were sampled at the northern
border of the central plain. Archaeal lipids showed highest concentrations in a surface horizon
between 2 and 7.5 cm bsf and declined with depth (Fig. 2a). sn2-hydroxyarchaeol was the
most abundant archaeal lipid in the sediments below grey mats showing a 4-fold higher
concentration compared to central sediments. Moderate amounts of crocetene (2,6,11,15-
tetramethylhexadecane) with 2 double bonds (CR:2), lower amounts with one double bound
(CR:1), and trace amounts of PMI:2 and PMI:3 were also found (Tab. 3). PMI:4 and PMI:5

Chapter 3 Lipid signatures and distribution of methanotrophic microbial communities at HMMV, Barents Sea
77
showed a subsurface maximum at about 3 cm (Fig. 2a) and concentrations of crocetenes,
PMI:2 and PMI:3 were similarly distributed (data not shown). All archaeal biomarkers were
strongly depleted in 13C in surface sediments with 13C values ranging between –71‰
(archaeol) to –118‰ (PMI:4) and showed an increase in 13C-values with decreasing
concentration and with sediment depth (Fig. 2a). Concentrations of bacterial FAs were highest
in the uppermost horizon also declining with depth (Fig. 2b, Tab. 2b). The most dominant
FAs in the top horizons included C16:1 7c and C16:1 5c. In contrast to central sediments, the
concentration of C16:1 8c in surface sediments of the grey mat site was very low. Other specific
FAs such as cyC17:0 5,6, a marker for Desulfosarcina/Desulfococcus species detected in
Figure 2. Biomarker concentrations and associated 13C-values of diagnostic archaeal (a) and bacterial lipids (b) in sediments covered by grey mats.
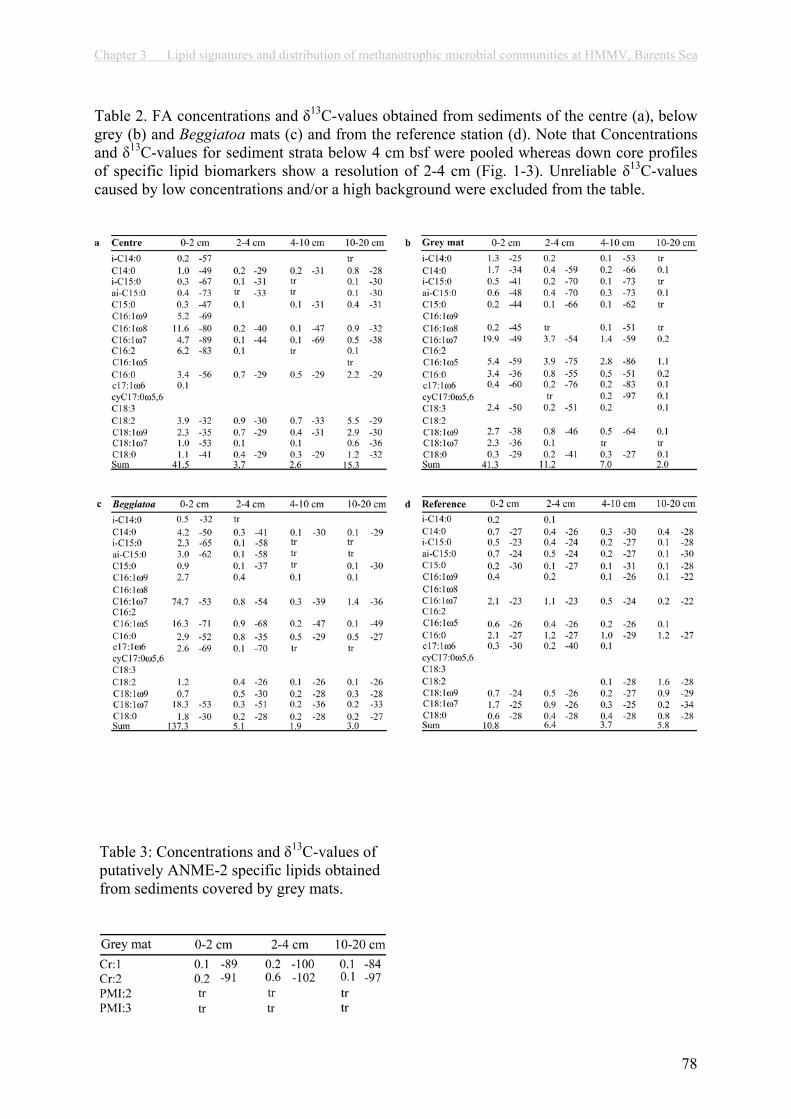
Chapter 3 Lipid signatures and distribution of methanotrophic microbial communities at HMMV, Barents Sea
78
Table 2. FA concentrations and 13C-values obtained from sediments of the centre (a), below grey (b) and Beggiatoa mats (c) and from the reference station (d). Note that Concentrations and 13C-values for sediment strata below 4 cm bsf were pooled whereas down core profiles of specific lipid biomarkers show a resolution of 2-4 cm (Fig. 1-3). Unreliable 13C-valuescaused by low concentrations and/or a high background were excluded from the table.
Table 3: Concentrations and 13C-values of putatively ANME-2 specific lipids obtained from sediments covered by grey mats.
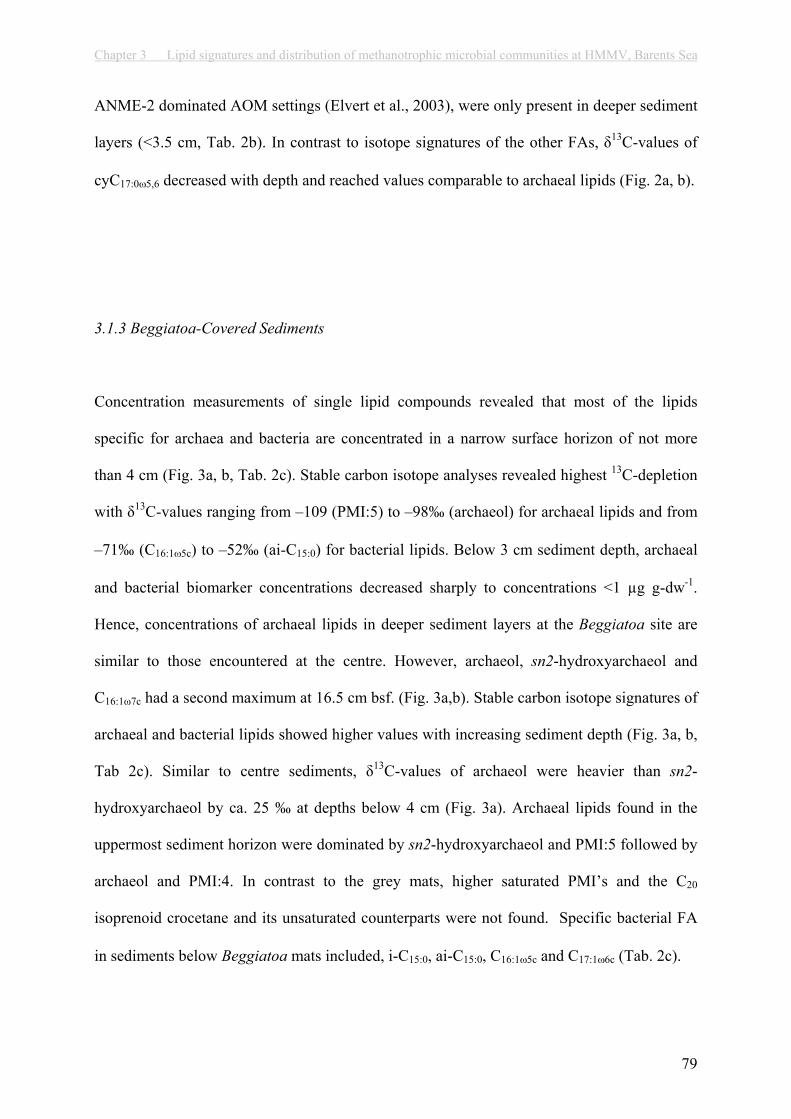
Chapter 3 Lipid signatures and distribution of methanotrophic microbial communities at HMMV, Barents Sea
79
ANME-2 dominated AOM settings (Elvert et al., 2003), were only present in deeper sediment
layers (<3.5 cm, Tab. 2b). In contrast to isotope signatures of the other FAs, 13C-values of
cyC17:0 5,6 decreased with depth and reached values comparable to archaeal lipids (Fig. 2a, b).
3.1.3 Beggiatoa-Covered Sediments
Concentration measurements of single lipid compounds revealed that most of the lipids
specific for archaea and bacteria are concentrated in a narrow surface horizon of not more
than 4 cm (Fig. 3a, b, Tab. 2c). Stable carbon isotope analyses revealed highest 13C-depletion
with 13C-values ranging from –109 (PMI:5) to –98‰ (archaeol) for archaeal lipids and from
–71‰ (C16:1 5c) to –52‰ (ai-C15:0) for bacterial lipids. Below 3 cm sediment depth, archaeal
and bacterial biomarker concentrations decreased sharply to concentrations <1 µg g-dw-1.
Hence, concentrations of archaeal lipids in deeper sediment layers at the Beggiatoa site are
similar to those encountered at the centre. However, archaeol, sn2-hydroxyarchaeol and
C16:1 7c had a second maximum at 16.5 cm bsf. (Fig. 3a,b). Stable carbon isotope signatures of
archaeal and bacterial lipids showed higher values with increasing sediment depth (Fig. 3a, b,
Tab 2c). Similar to centre sediments, 13C-values of archaeol were heavier than sn2-
hydroxyarchaeol by ca. 25 ‰ at depths below 4 cm (Fig. 3a). Archaeal lipids found in the
uppermost sediment horizon were dominated by sn2-hydroxyarchaeol and PMI:5 followed by
archaeol and PMI:4. In contrast to the grey mats, higher saturated PMI’s and the C20
isoprenoid crocetane and its unsaturated counterparts were not found. Specific bacterial FA
in sediments below Beggiatoa mats included, i-C15:0, ai-C15:0, C16:1 5c and C17:1 6c (Tab. 2c).

Chapter 3 Lipid signatures and distribution of methanotrophic microbial communities at HMMV, Barents Sea
80
3.1.3 Reference
A reference site outside of the fluid-flow impacted area of the HMMV was sampled at ca. 1
km east to the crater. Archaeal biomarkers were below detection limit at the reference station
and FA concentrations were lower than those at all stations of the HMMV (Tab. 2d). Total FA
concentrations at the surface were roughly 13-fold and 4-fold lower compared to Beggiatoa-
Figure 3. Biomarker concentrations and associated 13C-values of representative (a) archaeal and (b) bacterial lipids and microbial aggregate counts in Beggiatoa covered sediments.
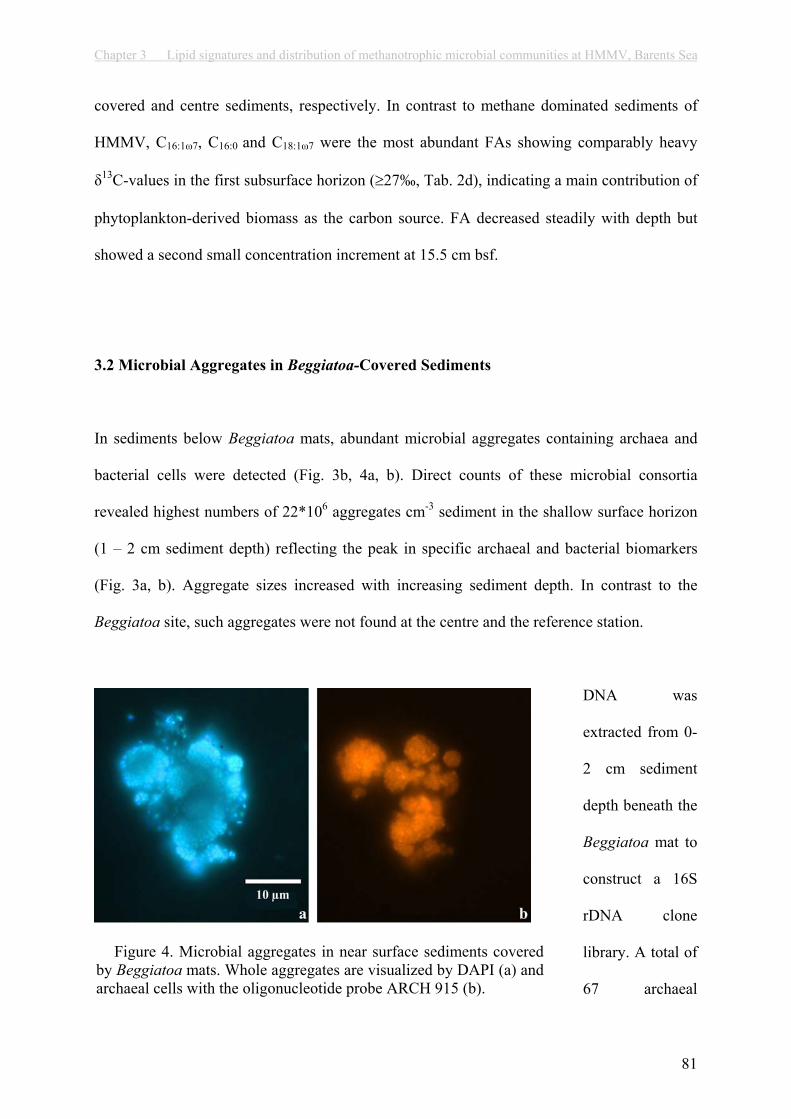
Chapter 3 Lipid signatures and distribution of methanotrophic microbial communities at HMMV, Barents Sea
81
covered and centre sediments, respectively. In contrast to methane dominated sediments of
HMMV, C16:1 7, C16:0 and C18:1 7 were the most abundant FAs showing comparably heavy
13C-values in the first subsurface horizon ( 27‰, Tab. 2d), indicating a main contribution of
phytoplankton-derived biomass as the carbon source. FA decreased steadily with depth but
showed a second small concentration increment at 15.5 cm bsf.
3.2 Microbial Aggregates in Beggiatoa-Covered Sediments
In sediments below Beggiatoa mats, abundant microbial aggregates containing archaea and
bacterial cells were detected (Fig. 3b, 4a, b). Direct counts of these microbial consortia
revealed highest numbers of 22*106 aggregates cm-3 sediment in the shallow surface horizon
(1 – 2 cm sediment depth) reflecting the peak in specific archaeal and bacterial biomarkers
(Fig. 3a, b). Aggregate sizes increased with increasing sediment depth. In contrast to the
Beggiatoa site, such aggregates were not found at the centre and the reference station.
DNA was
extracted from 0-
2 cm sediment
depth beneath the
Beggiatoa mat to
construct a 16S
rDNA clone
library. A total of
67 archaeal
Figure 4. Microbial aggregates in near surface sediments covered by Beggiatoa mats. Whole aggregates are visualized by DAPI (a) and archaeal cells with the oligonucleotide probe ARCH 915 (b).
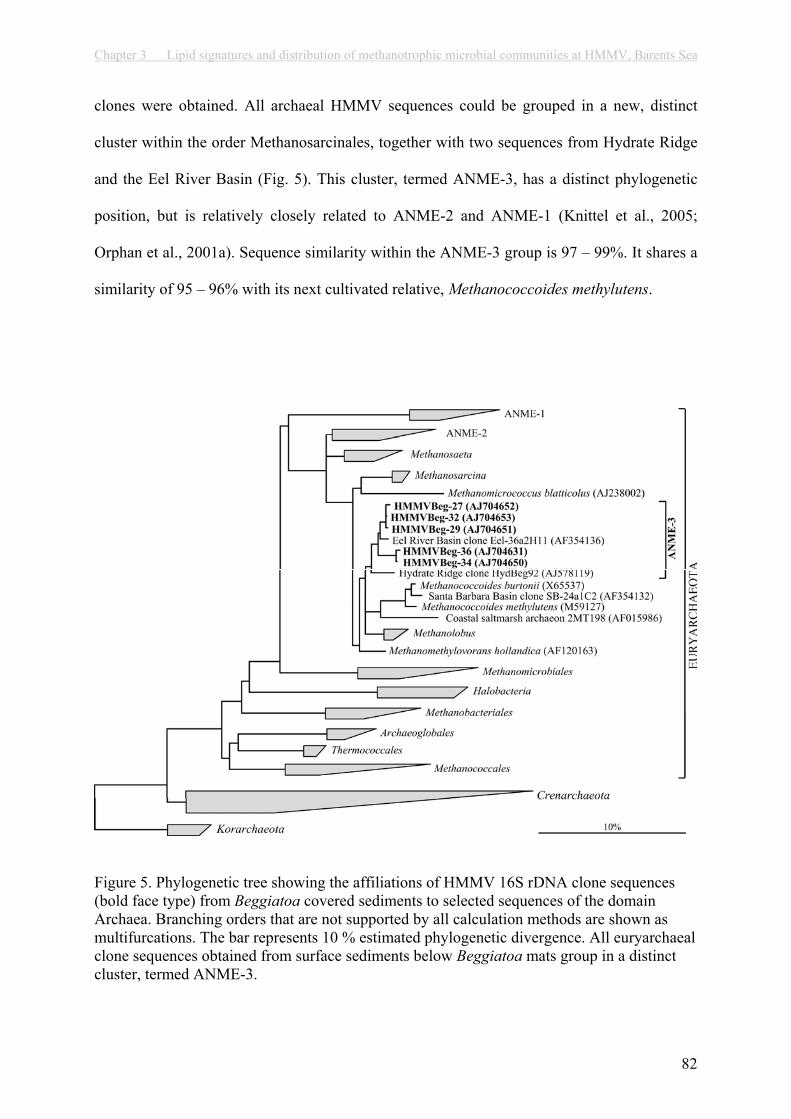
Chapter 3 Lipid signatures and distribution of methanotrophic microbial communities at HMMV, Barents Sea
82
clones were obtained. All archaeal HMMV sequences could be grouped in a new, distinct
cluster within the order Methanosarcinales, together with two sequences from Hydrate Ridge
and the Eel River Basin (Fig. 5). This cluster, termed ANME-3, has a distinct phylogenetic
position, but is relatively closely related to ANME-2 and ANME-1 (Knittel et al., 2005;
Orphan et al., 2001a). Sequence similarity within the ANME-3 group is 97 – 99%. It shares a
similarity of 95 – 96% with its next cultivated relative, Methanococcoides methylutens.
Figure 5. Phylogenetic tree showing the affiliations of HMMV 16S rDNA clone sequences (bold face type) from Beggiatoa covered sediments to selected sequences of the domain Archaea. Branching orders that are not supported by all calculation methods are shown as multifurcations. The bar represents 10 % estimated phylogenetic divergence. All euryarchaeal clone sequences obtained from surface sediments below Beggiatoa mats group in a distinct cluster, termed ANME-3.

Chapter 3 Lipid signatures and distribution of methanotrophic microbial communities at HMMV, Barents Sea
83
4. DISCUSSION
4.1 Identity of Methanotrophic Communities in Beggiatoa-Covered Sediments
Elevated concentrations of specific archaeal and bacterial biomarkers and their highly
depleted 13C-values indicate the presence of anaerobic methanotrophic microorganisms in
Beggiatoa-covered sediments. Our data show a 13C-fractionation in diagnostic archaeal lipids
and bacterial FAs as high as -55‰ and -15‰, respectively, compared to the source methane
(-60 ±5‰, Lein et al., 1999). These values are in good agreement with AOM settings
described elsewhere (Elvert et al., 2000; Elvert et al., 1999; Orphan et al., 2001a).
Nevertheless, the composition of archaeal isoprenoid hydrocarbons differ substantially from
the pattern of known archaeal strains capable of AOM, i.e. ANME-1 and ANME-2. Microbial
mats dominated by ANME-1 contain PMI:0 and abundant concentrations of its unsaturated
analogues with one to five double-bonds as well as predominant amounts of archaeol
compared to sn2-hydroxyarchaeol (Blumenberg et al., 2004; Michaelis et al., 2002; Thiel et
al., 2001). In contrast, sediments and microbial mats with high abundances of ANME-2
comprise saturated and unsaturated PMI’s, crocetane and its unsaturated analogues as well as
a high sn2-hydroxyarchaeol to archaeol ratio (Blumenberg et al., 2004; Boetius et al., 2000;
Elvert et al., 2001; Elvert et al., 1999; Teske et al., 2002). To our knowledge, no AOM setting
has been found with methanotrophic archaea lacking crocetane and possessing only PMI’s
with 4 and 5 double bonds while all other higher saturated PMI homologues are completely
missing. Hence, the exclusive presence of 13C-depleted PMI:5 and PMI:4 together with
dominant amounts of sn2-hydroxyarchaeol relative to archaeol indicates the presence of a
novel community of archaea involved in AOM. This line of evidence is well corroborated by
the retrieval of novel archaeal 16S rDNA sequences forming a deeply branching cluster with
Chapter 3 Lipid signatures and distribution of methanotrophic microbial communities at HMMV, Barents Sea
84
other sequences, called the ANME-3 group (Fig. 5). Taking into account that no other
euryarchaeal sequences were found in the top sediment horizon, it appears likely that ANME-
3 is the predominant archaeal group in sediments below Beggiatoa mats.
A striking finding is the fractionation offset by ca. 25‰ between sn2-hydroxyarchaeol and
archaeol throughout the 20 cm of sediment below the Beggiatoa mat. An offset in 13C could
point to the presence of two different organisms, but the parallel concentration profiles
suggest a single organism (Freeman et al., 1994). A possible source for the observed archaeal
biomarker pattern could be the presence of methanogenic archaea in subsurface sediments of
HMMV. Previous studies demonstrated that methanogenesis occurs at HMMV (Pimenov et
al., 1999). Furthermore, the archaeol carries an isotope signature typical for methanogens
(Hayes et al., 1987; Hinrichs et al., 2003). However, no DNA sequences of methanogenic
archaea were detected in the clone library. Possibly, one organism is producing archaeol and
sn2-hydroxyarchaeol via different metabolic pathways. However, this seems unlikely for such
structurally similar biomolecules. Therefore, it might also be possible that the archaeal guilds
in the deeper sediment strata of HMMV operate in a mixed AOM – methanogenic mode
probably due to temporal or spatial differences in energy availability.
The unique presence and elevated concentrations of specific FAs in methane-dominated
sediments below Beggiatoa mats (Fig. 6, Tab. 2a, c) give evidence for a bacterial community
that is distinct from a typical, deep-sea community of the Barents Sea as present in the
sediments of the reference site. Non-seep sediments in Arctic oceans would be fueled by a
planktonic carbon source, dominated by high amounts of C16:1 7 and C18:1 7 with 13C-values
ranging from –20 to –30‰ (Birgel et al., 2004; Rau et al., 1989). This is similar to the lipid
pattern of the reference station (Tab. 2d). In contrast, the sediments below Beggiatoa mats
contain high amounts of the significantly 13C-depleted, unusual FAs C16:1 5 and C17:1 6 (Tab.
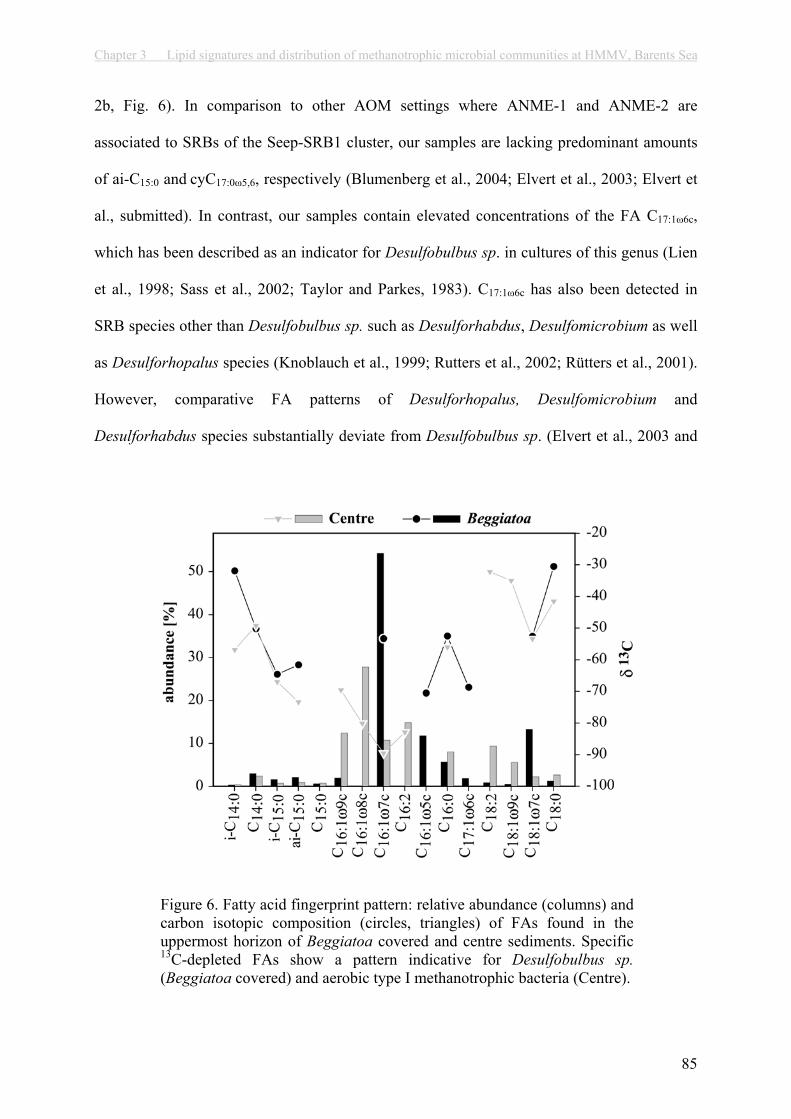
Chapter 3 Lipid signatures and distribution of methanotrophic microbial communities at HMMV, Barents Sea
85
2b, Fig. 6). In comparison to other AOM settings where ANME-1 and ANME-2 are
associated to SRBs of the Seep-SRB1 cluster, our samples are lacking predominant amounts
of ai-C15:0 and cyC17:0 5,6, respectively (Blumenberg et al., 2004; Elvert et al., 2003; Elvert et
al., submitted). In contrast, our samples contain elevated concentrations of the FA C17:1 6c,
which has been described as an indicator for Desulfobulbus sp. in cultures of this genus (Lien
et al., 1998; Sass et al., 2002; Taylor and Parkes, 1983). C17:1 6c has also been detected in
SRB species other than Desulfobulbus sp. such as Desulforhabdus, Desulfomicrobium as well
as Desulforhopalus species (Knoblauch et al., 1999; Rutters et al., 2002; Rütters et al., 2001).
However, comparative FA patterns of Desulforhopalus, Desulfomicrobium and
Desulforhabdus species substantially deviate from Desulfobulbus sp. (Elvert et al., 2003 and
Figure 6. Fatty acid fingerprint pattern: relative abundance (columns) and carbon isotopic composition (circles, triangles) of FAs found in the uppermost horizon of Beggiatoa covered and centre sediments. Specific 13C-depleted FAs show a pattern indicative for Desulfobulbus sp. (Beggiatoa covered) and aerobic type I methanotrophic bacteria (Centre).

Chapter 3 Lipid signatures and distribution of methanotrophic microbial communities at HMMV, Barents Sea
86
references therein) and the FA fingerprint presented in this work. This suggests that the
microbial consortia at HMMV are composed of ANME-3 and a SRB most likely affiliated to
Desulfobulbus sp. which is different from other known AOM settings (Boetius et al., 2000;
Michaelis et al., 2002; Orphan et al., 2001a).
This community is restricted to a narrow, subsurface horizon of not more than 4 cm where
AOM appears to be the dominant, biomass generating process. In contrast, deeper sediment
strata below the Beggiatoa mats are characterised by diminished microbial biomass as
indicated by strongly reduced contents of biomarkers and AOM-aggregates (Fig. 3a, b). Here,
heavier 13C values of archaeal and bacterial biomarkers have been detected.
4.2 Identity of Aerobic Methanotrophs in Sediments of the Centre
In contrast to the Beggiatoa site, the centre is dominated by aerobic methanotrophy, however,
restricted to an even narrower surface horizon. In the surface sediments of the centre, specific
FAs carrying depleted 13C-signatures are predominant, concentrations of archaeal
biomarkers are low and microbial consortia were not observed microscopically. Type I and II
methanotrophic bacteria are known to synthesise either C16:1 or C18:1 fatty acids, respectively,
with double bond positions dominating the 8-position (Bowman et al., 1991; Bowman et al.,
1993; Fang et al., 2000; Roslev et al., 1998). Hence, the predominance of 13C-depleted C16:1
FA, especially C16:1 8c (Fig. 6) points to a microbial community dominated by a type I
methanotroph. Isotope fractionations with 13C-values as high as -35‰ compared to the
source methane are in the upper range of the RuMP pathway, which is used by type I
methanotrophs for methane oxidation (Jahnke et al., 1999). Such high carbon isotope
fractionations are quite possible considering the cold growth temperatures at HMMV
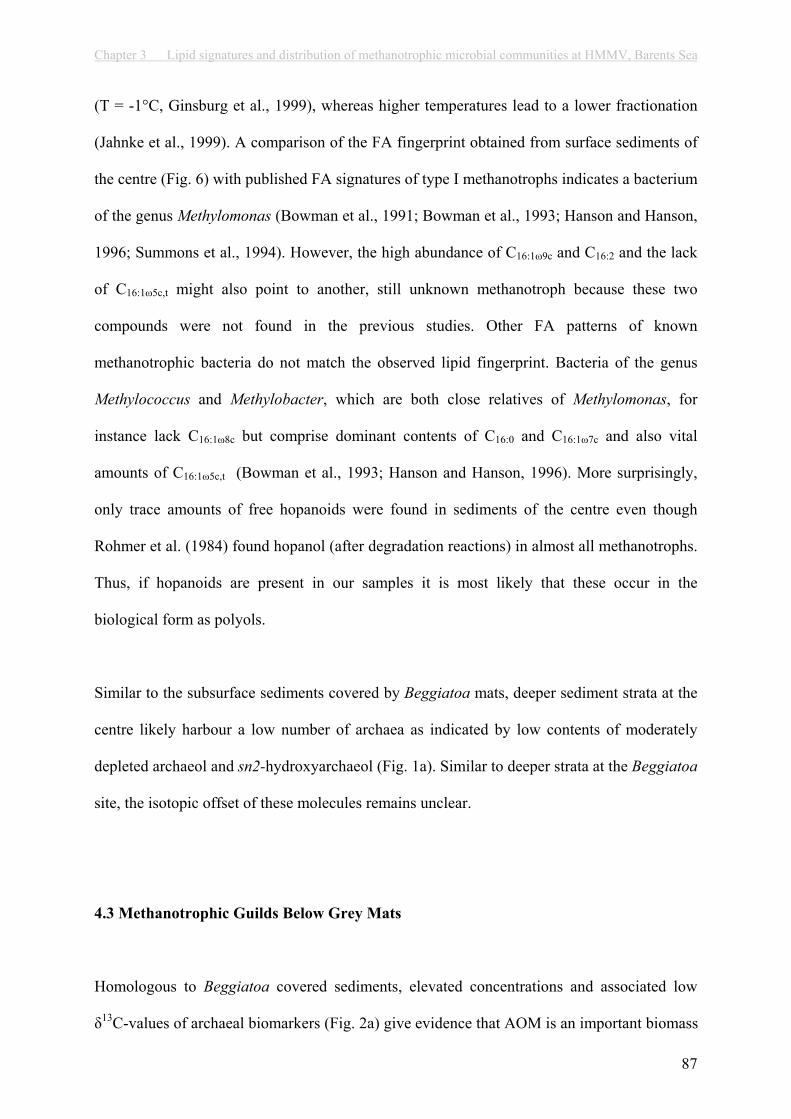
Chapter 3 Lipid signatures and distribution of methanotrophic microbial communities at HMMV, Barents Sea
87
(T = -1°C, Ginsburg et al., 1999), whereas higher temperatures lead to a lower fractionation
(Jahnke et al., 1999). A comparison of the FA fingerprint obtained from surface sediments of
the centre (Fig. 6) with published FA signatures of type I methanotrophs indicates a bacterium
of the genus Methylomonas (Bowman et al., 1991; Bowman et al., 1993; Hanson and Hanson,
1996; Summons et al., 1994). However, the high abundance of C16:1 9c and C16:2 and the lack
of C16:1 5c,t might also point to another, still unknown methanotroph because these two
compounds were not found in the previous studies. Other FA patterns of known
methanotrophic bacteria do not match the observed lipid fingerprint. Bacteria of the genus
Methylococcus and Methylobacter, which are both close relatives of Methylomonas, for
instance lack C16:1 8c but comprise dominant contents of C16:0 and C16:1 7c and also vital
amounts of C16:1 5c,t (Bowman et al., 1993; Hanson and Hanson, 1996). More surprisingly,
only trace amounts of free hopanoids were found in sediments of the centre even though
Rohmer et al. (1984) found hopanol (after degradation reactions) in almost all methanotrophs.
Thus, if hopanoids are present in our samples it is most likely that these occur in the
biological form as polyols.
Similar to the subsurface sediments covered by Beggiatoa mats, deeper sediment strata at the
centre likely harbour a low number of archaea as indicated by low contents of moderately
depleted archaeol and sn2-hydroxyarchaeol (Fig. 1a). Similar to deeper strata at the Beggiatoa
site, the isotopic offset of these molecules remains unclear.
4.3 Methanotrophic Guilds Below Grey Mats
Homologous to Beggiatoa covered sediments, elevated concentrations and associated low
13C-values of archaeal biomarkers (Fig. 2a) give evidence that AOM is an important biomass
Chapter 3 Lipid signatures and distribution of methanotrophic microbial communities at HMMV, Barents Sea
88
generating process in sediments below the greyish thiotrophic, microbial mats. Compared to
Beggiatoa covered sediments, concentrations of archaeal lipids are lower (Fig. 2a). Small but
detectable amounts of FA C16:1 8, give evidence that the sediment surface still harbours minor
biomass of aerobic type I methanotrophs. In contrast, MOx-specific FAs have not been
detected in AOM-dominated Beggiatoa covered sediments. Most of the patchy grey mats
occur in the transition between centre and Beggiatoa mats and around gas vents. It is hence
possible that they represent an early stage in the development of AOM communities.
The vertical distribution of archaeal lipid concentrations (Fig. 2a) gives evidence that the
AOM community is dispersed over a greater sediment interval as observed at the Beggiatoa
mat. Furthermore, the composition of specific archaeal lipids deviates from Beggiatoa
covered sediments by the presence of comparably high amounts 13C-depleted CR:1, CR:2 and
trace amounts of PMI:2 and PMI:3 (Tab. 3) all of which were previously identified in ANME-
2 bearing sediments and microbial mats (Blumenberg et al., 2004; Elvert et al., 2001; Orphan
et al., 2001a). None of these compounds were detected in the ANME-3 dominated sediments
below the Beggiatoa mats, hence ANME-3 can be excluded as a source of these compounds.
We suggest that ANME-3 as well as ANME-2 co-occur in sediments below grey mats, both
contributing to the lipid biomass content. Moreover, elevated concentrations of several 13C-
depleted FAs give evidence that a higher diversity of SRB are involved in AOM in this
habitat compared to the Beggiatoa mats. The presence of the 13C-depleted FA C17:1 6 indicates
that SRB related to Desulfobulbus sp. could be the main partner in AOM in near surface
sediments of the grey mat habitats. At depth below 3.5 cm, increasing concentrations of 13C-
depleted cyC17:0 5.6 (Tab. 2b), indicate that SRB related to the Seep-SRB1 cluster
(Desulfosarcina/Desulfococcus, Elvert et al., 2003; Knittel et al., 2003) are also involved in
AOM. This higher diversity of methanotrophic bacteria and archaea could also be an

Chapter 3 Lipid signatures and distribution of methanotrophic microbial communities at HMMV, Barents Sea
89
indication that the grey mats are a transient community, and that the much more abundant
Beggiatoa mats at HMMV represent the climax stage in AOM-community development.
4.4 Correlation Between Biomarker Concentrations and Biomass
The predominance of unsaturated archaeal and bacterial lipids over their saturated
counterparts in sediments of HMMV indicates that these membrane components very likely
originate from living biomass. Unsaturated FAs have been shown to be very labile in marine
sediments (Parker et al., 65). Incubation experiments with radioactive labelled palmitic (C16:0)
and oleic (C18:1) acid provided evidence that more than 90% of the label was lost within the
first 20 days of incubation (Sun et al., 1997). Moreover, the decay of the unsaturated FA was
two fold faster under anoxic conditions. Archaea from living mat system-cultures and
enrichments contain only little or no saturated PMIs (Michaelis et al., 2002; Schouten et al.,
1997). The diagenetically stable and saturated form PMI:0 that is prevailing in carbonates of
methanotrophic origin could be a result of the hydrogenation of PMI’s from decaying biomass
under reduced conditions (Peckmann et al., 2002; Peckmann et al., 1999; Thiel et al., 2001).
At the surface (0-4 cm) where the aggregate abundance was highest, the average aggregate
size was 60 µm3 and each aggregate contained ca. 80 archaeal cells. In deeper sediment
horizons, the number of aggregates decreased substantially, but the average size increased to
145 µm3 and each aggregate contained ca. 200 archaeal cells (Lösekann et al. unpubl.).
Concentrations of the diagnostic archaeal biomarkers archaeol, sn2-hydroxyarchaeol, PMI:4
and PMI:5 were positively correlated with the abundance of archaeal cells (data not shown).
The linear correlation of sn2-hydroxyarchaeol, PMI:4 and PMI:5 with the archaeal cell
number showed high R2-values (>0.7) but was lower for archaeol (0.62). With respect to the
Chapter 3 Lipid signatures and distribution of methanotrophic microbial communities at HMMV, Barents Sea
90
abundance of archaeal cells, the cell specific lipid contents of the diagnostic archaeal
biomarkers archaeol, sn2-hydroxyarchaeol, PMI:4 and PMI:5 where 3.6 ( 1.9 SE) , 2.6 ( 1.1
SE), 0.6 ( 0.2 SE)and 0.4 ( 0.4 SE) fg cell-1 on average. In contrast, ANME-2 at Hydrate
Ridge was found to contain 0.23 and 0.9 fg cell-1 of archaeol and sn2-hydroxyarchaeol,
respectively (Elvert et al., submitted)
4.5 Distribution of Habitats and Methanotrophic Guilds at HMMV
The investigated mud volcano is an active methane seep at 1250 m water depth of about 0.8
km2 (Milkov et al. 2004). We found that it hosts a variety of methanotrophic communities,
which inhabit distinct areas structured concentrically around the active centre. Fluid and
methane migration through the volcanoes central conduit leads to mud diapirism that fuels the
central area with fresh, methane rich mud (Eldholm et al., 1999; Vogt et al., 1997b). Here,
overlapping gradients of methane and oxygen provide suitable conditions for aerobic
microbes. Compared to sulphate concentrations in seawater, 100-fold lower oxygen
concentration and the slow diffusive oxygen transport into deeper sediment layers are
probably the cause for the observed restriction of the MOx community to a narrow surface
horizon. AOM communities develop probably later than MOx communities in oxygen-
depleted sediments in the presence of methane and sulphate. The slow growth rates with
doubling times of several months (Nauhaus et al., 2005) are possibly one reason for this
phenomenon. Sea floor observations and the biomarker patterns found in the transition zone
from centre to Beggiatoa mats indicate that the AOM zone could spread from small patches
of reduced sediments. Here, both MOx and AOM communities were detected, and the AOM
communities comprised both ANME-2 / Seep-SRB1 and ANME-3 / Desulfobulbus. Previous
work showed that methane oxidation rates are highest in sediments below Beggiatoa mats
Chapter 3 Lipid signatures and distribution of methanotrophic microbial communities at HMMV, Barents Sea
91
(Milkov et al., 2004; Pimenov et al., 1999), controlling methane emission very efficiently.
Efflux of methane was found to be very low in this area of the HMMV with an up to 100-fold
lower bottom water concentrations of methane compared to the thinly colonized mud volcano
centre (Damm and Budeus, 2003; Sauter et al., submitted; Sauter et al., 2002). This provides
evidence that AOM at the Beggiatoa site is an efficient filter for uprising methane.
CONCLUSION
Methane oxidation is the predominant, microbial biomass generating process in sediments of
Håkon Mosby Mud Volcano. Biomarker analysis give evidence for a dominant, aerobic type I
methanotrophic community prevailing in sediments of the central area, restricted to a thin
surface layer of <1 cm in vertical extension. In the transition zone between the centre and the
surrounding Beggiatoa habitat, small patches of reduced sediments are colonized by different
methanotrophic guilds. Finally, a novel type of anaerobic methanotroph colonizes a <5 cm
thick zone of the surface sediments, fuelling extensive Beggiatoa mats. Biomarker analyses,
isotopic patterns and 16S rDNA identification were highly correlated. Maxima in microbial
biomass were reflected in most depleted isotope signatures, indicating a strong selection of
individual methanotrophic populations by the different habitats.

Chapter 3 Lipid signatures and distribution of methanotrophic microbial communities at HMMV, Barents Sea
92
Acknowledgements
We thank the officers, crew and shipboard scientific party for support during the R/V Atalante
and R/V Polarstern cruise in 2001 and 2003, respectively. We are especially indebted to the
ROV Victor 6000 team for excellent technical operation and sample retrieval. Imke Busse,
Viola Beyer and Friderike Heinrich are thanked for their support during sampling. Gabriele
Klockether is acknowledged for support in the biomarker laboratory. This study was part of
the MUMM (Mikrobielle Umsatzraten von Methan in Gashydrathaltigen Sedimenten, FN
03G0554A) supported by the Bundesministerium für Bildung und Forschung (BMBF,
Germany). Further support was provided by the Max Planck Gesellschaft (Germany).

Chapter 3 Lipid signatures and distribution of methanotrophic microbial communities at HMMV, Barents Sea
93
References
Aloisi G., Bouloubassi I., Heijs S. K., Pancost R. D., Pierre C., Damste J. S. S., Gottschal J. C., Forney L. J., and Rouchy J. M. (2002) CH4-consuming microorganisms and the formation of carbonate crusts at cold seeps. Earth and Planetary Science Letters203(1), 195-203.
Amann R. I., Krumholz L., and Stahl D. A. (1990) Fluorescent-oligonucleotide probing of whole cells for determinative, phylogenetic, and evironmental studies in microbiology. Journal of Bacteriology 172, 762-770.
Birgel D., Stein R., and Hefter J. (2004) Aliphatic lipids in recent sediments of the Fram Strait/Yermak Plateau (Arctic Ocean): composition, sources and transport processes (revised version February 19th, 2004). Marine Chemistry 88(3-4), 127-160.
Blumenberg M., Seifert R., Reitner J., Pape T., and Michaelis W. (2004) Membrane lipid patterns typify distinct anaerobic methanotrophic consortia. Proceedings of the National Academy of Sciences of the United States of America 101(30).
Boetius A., Ravenschlag K., Schubert C., Rickert D., Widdel F., Gieseke A., Amann R., Jørgensen B. B., Witte U., and Pfannkuche O. (2000) A marine microbial consortium apparently mediating anaerobic methane of oxidation. Nature 407, 623-626.
Bowman J. P., Skerratt J. H., Nichols P. D., and Sly L. I. (1991) Phospholipid Fatty-Acid and Lipopolysaccharide Fatty-Acid Signature Lipids in Methane-Utilizing Bacteria. FemsMicrobiology Ecology 85(1), 15-22.
Bowman J. P., Sly L. I., Nichols P. D., and Hayward A. C. (1993) Revised taxonomy of the methanotrophs: Description of Methylobacter gen. nov., emendation of Methylococcus, validation of Methylosinus and Methylocystis species, and a proposal that the family Methylococcaceae includes only the group I methanotrophs. International Journal of Systematic Bacteriology 43(4), 735-753.
Charlou J. L., Donval J. P., Zitter T., Roy N., Jean-Baptiste P., Foucher J. P., and Woodside J. (2003) Evidence of methane venting and geochemistry of brines on mud volcanoes of the eastern Mediterranean Sea. Deep-Sea Research Part I-Oceanographic Research Papers 50(8), 941-958.
Damm E. and Budeus G. (2003) Fate of vent-derived methane in seawater above the Hakon Mosby mud volcano (Norwegian Sea). Marine Chemistry 82(1-2), 1-11.
Dimitrov L. I. (2002) Mud volcanoes - the most important pathway for degassing deeply buried sediments. Earth-Science Reviews 59(1-4), 49-76.
Dimitrov L. I. (2003) Mud volcanoes - a significant source of atmospheric methane. Geo-Marine Letters 23(3-4), 155-161.
Eldholm O., Sundvor E., Vogt P. R., Hjelstuen B. O., Crane K., Nilsen A. K., and Gladczenko T. P. (1999) SW Barents Sea continental margin heat flow and Hakon Mosby Mud Volcano. Geo-Marine Letters 19(1-2), 29-37.
Elvert M., Boetius A., Knittel K., and Jorgensen B. B. (2003) Characterization of specific membrane fatty acids as chemotaxonomic markers for sulfate-reducing bacteria involved in anaerobic oxidation of methane. Geomicrobiology Journal 20(4), 403-419.
Elvert M., Greinert J., Suess E., and Whiticar M. J. (2000) Archaea mediating anaerobic methane oxidation in deep-sea sediments at cold seeps of the eastern Aleutian subduction zone. Organic Geochemistry 31(11), 1175-1187.
Elvert M., Greinert J., Suess E., and Whiticar M. J. (2001) Carbon isotopes of biomarkers derived from methane-oxidizing microbes at Hydrate Ridge, Cascadia convergent margin. In Natural gas hydrates: Occurrence, distribution, and dynamics, Vol. 124 (ed. C. K. Paull and W. P. Dillon), pp. 115-129. American Geophysical Union.

Chapter 3 Lipid signatures and distribution of methanotrophic microbial communities at HMMV, Barents Sea
94
Elvert M., Hopmans E. C., Boetius A., and Hinrichs K.-U. (submitted) Spatial variatons of archaeal-bacterial assambladges in gas hydrate bearing sediments at a cold seep: Implications from a high resolution molecular and isotopic approach.
Elvert M., Suess E., and Whiticar M. J. (1999) Anaerobic methane oxidation associated with marine gas hydrates: superlight C-isotopes from saturated and unsaturated C20 and C25
irregular isoprenoids. Naturwissenschaften 86(6), 295-300. Fang J. S., Barcelona M. J., and Semrau J. D. (2000) Characterization of methanotrophic
bacteria on the basis of intact phospholipid profiles. Fems Microbiology Letters189(1), 67-72.
Fisher C. R. and Childress J. J. (1992) Organic-Carbon Transfer from Methanotrophic Symbionts to the Host Hydrocarbon-Seep Mussel. Symbiosis 12(3), 221-235.
Freeman K. H., Wakeham S. G., and Hayes J. M. (1994) Predictive isotopic biogeochemistry: Hydrocarbons from anoxic marine basins. Organic Geochemistry 21(6/7), 629-644.
Hanson R. S., Bratina B. J., and Brusseau G. A. (1993) Phylogeny and ecology of methylotrophic bacteria. In Microbial Growth on C1 Compounds (ed. J. C. Murrell and D. P. Kelly), pp. 285-302. Intercept Limited.
Hanson R. S. and Hanson T. E. (1996) Methanotrophic bacteria. Microbiological Reviews60(2), 439-&.
Hayes J. M., Takigiku R., Ocampo R., Callot H. J., and Albrecht P. (1987) Isotopic compositions and probable origins of organic molecules in the Eocene Messel shale. Nature 329, 48-51.
Hinrichs K.-U. and Boetius A. (2002) The anaerobic oxidation of methane: New insights in microbial ecology and biogeochemistry. In Ocean Margin Systems (ed. G. Wefer, D. Billett, and D. Hebbeln), pp. 457-477. Springer-Verlag, Berlin.
Hinrichs K.-U., Hayes J. M., Sylva S. P., Brewer P. G., and DeLong E. F. (1999) Methane-consuming archaebacteria in marine sediments. Nature 398, 802-805.
Hinrichs K.-U., Hmelo L. R., and Sylva S. P. (2003) Molecular Fossil Record of Elevated Methane Levels in Late Pleistocene Coastal Waters. Science 299(5610), 1214-1217.
Hjelstuen B. O., Eldholm O., Faleide J. I., and Vogt P. R. (1999) Regional setting of Hakon Mosby Mud Volcano, SW Barents Sea margin. Geo-Marine Letters 19(1-2), 22-28.
Jahnke L. L., Summons R. E., Hope J. M., and Des Marais D. J. (1999) Carbon isotopic fractionation in lipids from methanotrophic bacteria II: The effects of physiology and environmental parameters on the biosynthesis and isotopic signatures of biomarkers. Geochimica et Cosmochimica Acta 63(1), 79-93.
Judd A. G., Hovland M., Dimitrov L. I., Gil S. G., and Jukes V. (2002) The geological methane budget at Continental Margins and its influence on climate change. Geofluids2(2), 109-126.
Klages M., Mesnil B., Soldtwedel T., and Christophe A. (2002) L' expédition "AWI" sur NO L'Atalante en 2001. [The Expedition "AWI" on RV L'Atalante in 2001]. Alfred-Wegener-Institute for Polar and Marine Research.
Klages M., Thiede J., and Foucher J. P. (2004) The Expedition ARKTIS XIX/3 of the Research Vessel POLARSTERN in 2003 Reports of legs 3a, 3b and 3c, pp. 355. Alfred-Wegener-Institute for Polar and Marine Research.
Knittel K., Boetius A., Lemke A., Eilers H., Lochte K., Pfannkuche O., Linke P., and Amann R. (2003) Activity, distribution, and diversity of sulfate reducers and other bacteria in sediments above gas hydrate (Cascadia margin, Oregon). Geomicrobiology Journal20(4), 269-294.
Knittel K., Losekann T., Boetius A., Kort R., and Amann R. (2005) Diversity and distribution of methanotrophic archaea at cold seeps. Applied and Environmental Microbiology71(1), 467-479.
Chapter 3 Lipid signatures and distribution of methanotrophic microbial communities at HMMV, Barents Sea
95
Knoblauch C., Sahm K., and Jørgensen B. B. (1999) Psychrophilic sulfate-reducing bacteria isolated from permanently cold arctic marine sediments: description of Desulfofrigusoceanense gen. nov., sp. nov., Desulfofrigus fragile sp. nov., Desulfofaba gelida gen. nov., sp. nov., Desulfotalea psychrophila gen. nov., sp. nov. and Desulfotalea arcticasp. nov. International Journal of Systematic Bacteriology 49, 1631-1643.
Kopf A., Klaeschen D., and Mascle J. (2001) Extreme efficiency of mud volcanism in dewatering accretionary prisms. Earth and Planetary Science Letters 189(3-4), 295-313.
Kopf A. J. (2002) Significance of mud volcanism. Reviews of Geophysics 40(2).Lane D. J., Pace B., Olsen G. J., Stahl D. A., Sogin M. L., and Pace N. R. (1985) Rapid-
Determination of 16s Ribosomal-Rna Sequences for Phylogenetic Analyses. Proceedings of the National Academy of Sciences of the United States of America82(20), 6955-6959.
Le Mer J. and Roger P. (2001) Production, oxidation, emission and consumption of methane by soils: A review. European Journal of Soil Biology 37(1), 25-50.
Lein A., Vogt P., Crane K., Egorov A., and Ivanov M. (1999) Chemical and isotopic evidence for the nature of the fluid in CH4-containing sediments of the Hakon Mosby Mud Volcano. Geo-Marine Letters 19(1-2), 76-83.
Levin L. A. and Michener R. H. (2002) Isotopic evidence for chemosynthesis-based nutrition of macrobenthos: The lightness of being at Pacific methane seeps. Limnology and Oceanography 47(5), 1336-1345.
Lien T., Madsen M., Steen I. H., and Gjerdevik K. (1998) Desulfobulbus rhabdoformis sp. nov., a sulfate reducer from a water-oil separation system. International Journal of Systematic Bacteriology 48, 469-474.
Manne A. S. and Richels R. G. (2001) An alternative approach to establishing trade-offs among greenhouse gases. Nature 410(6829), 675-677.
Massana R., Murray A. E., Preston C. M., and DeLong E. F. (1997) Vertical distribution and phylogenetic characterization of marine planktonic Archaea in the Santa Barbara Channel. Applied and Environmental Microbiology 63(1), 50-56.
Michaelis W., Seifert R., Nauhaus K., Treude T., Thiel V., Blumenberg M., Knittel K., Gieseke A., Peterknecht K., Pape T., Boetius A., Amann R., Jorgensen B. B., Widdel F., Peckmann J. R., Pimenov N. V., and Gulin M. B. (2002) Microbial reefs in the Black Sea fueled by anaerobic oxidation of methane. Science 297(5583), 1013-1015.
Milkov A., Vogt P., Cherkashev G., Ginsburg G., Chernova N., and Andriashev A. (1999) Sea-floor terrains of Hakon Mosby Mud Volcano as surveyed by deep-tow video and still photography. Geo-Marine Letters 19(1-2), 38-47.
Milkov A. V. (2000) Worldwide distribution of submarine mud volcanoes and associated gas hydrates. Marine Geology 167(1-2), 29-42.
Milkov A. V., Sassen R., Apanasovich T. V., and Dadashev F. G. (2003) Global gas flux from mud volcanoes: A significant source of fossil methane in the atmosphere and the ocean. Geophysical Research Letters 30(2).
Milkov A. V., Vogt P. R., Crane K., Lein A. Y., Sassen R., and Cherkashev G. A. (2004) Geological, geochemical, and microbial processes at the hydrate-bearing Hakon Mosby mud volcano: a review. Chemical Geology 205(3-4), 347-366.
Moss C. W. and Lambert-Fair M. A. (1989) Location of Double Bonds in Monounsaturated Fatty Acids of Campylobacter cryaerophila with Dimethyl Disulfide Derivatives and Combined Gas Chromatography-Mass Spectrometry. JOURNAL OF CLINICAL MICROBIOLOGY 27(7), 1467-1470.
Nauhaus K., Treude T., Boetius A., and Kruger M. (2005) Environmental regulation of the anaerobic oxidation of methane: a comparison of ANME-I and ANME-II communities. Environmental Microbiology 7(1), 98-106.

Chapter 3 Lipid signatures and distribution of methanotrophic microbial communities at HMMV, Barents Sea
96
Nichols P. D., Guckert J. B., and White D. C. (1986) Determination of monounsaturated fatty acid double-bond position and geometry for microbial monocultures and complex consortia by capillary GC-MS of their dimethyl disulphide adducts. Journal of Microbiological Methods 5, 49-55.
Orphan V. J., Hinrichs K. U., Ussler W., Paull C. K., Taylor L. T., Sylva S. P., Hayes J. M., and Delong E. F. (2001a) Comparative analysis of methane-oxidizing archaea and sulfate- reducing bacteria in anoxic marine sediments. Applied and Environmental Microbiology 67(4), 1922-1934.
Orphan V. J., House C. H., Hinrichs K. U., McKeegan K. D., and DeLong E. F. (2001b) Methane-consuming archaea revealed by directly coupled isotopic and phylogenetic analysis. Science 293(5529), 484-487.
Peckmann J., Goedert J. L., Thiel V., Michaelis W., and Reitner J. (2002) A comprehensive approach to the study of methane-seep deposits from the Lincoln Creek Formation, western Washington State, USA. Sedimentology 49(4), 855-873.
Peckmann J., Thiel V., Michaelis W., Clari P., Gaillard C., Martire L., and Reitner J. (1999) Cold seep deposits of Beauvoisin (Oxfordian; southeastern France) and Marmorito (Miocene; northern Italy): microbially induced authigenic carbonates. InternationalJournal of Earth Sciences 88(1), 60-75.
Pimenov N., Savvichev A., Rusanov I., Lein A., Egorov A., Gebruk A., Moskalev L., and Vogt P. (1999) Microbial processes of carbon cycle as the base of food chain of Håkon Mosby mud volcano benthic community. Geo-Marine Letters 19, 89-96.
Rau G. H., Takahashi T., and Marais D. J. D. (1989) Latitudinal Variations in Plankton Delta-C-13 - Implications for Co2 and Productivity in Past Oceans. Nature 341(6242), 516-518.
Ravenschlag K., Sahm K., Pernthaler J., and Amann R. (1999) High bacterial diversity in permanently cold marine sediments. Applied and Environmental Microbiology 65(9),3982-3989.
Reeburgh W. S. (1996) "Soft spots" in the global methane budget. In Microbial Growth on C1
Compounds (ed. M. E. Lidstrom and F. R. Tabita), pp. 334-342. Kluwer Academic Publishers.
Rohmer M., Bouvier-Nave P., and Ourisson G. (1984) Distribution of hopanoid triterpenes in prokaryotes. Journal of General Microbiology 130, 1137-1150.
Roslev P., Iversen N., and Henriksen K. (1998) Direct fingerprinting of metabolically active bacteria in environmental samples by substrate specific radiolabelling and lipid analysis. Journal of Microbiological Methods 31(3), 99-111.
Rutters H., Sass H., Cypionka H., and Rullkotter J. (2002) Phospholipid analysis as a tool to study complex microbial communities in marine sediments. Journal of Microbiological Methods 48(2-3), 149-160.
Rütters H., Sass H., Cypionka H., and Rullkötter J. (2001) Monoalkylether phospholipids in the sulfate-reducing bacteria Desulfosarcina variabilis and Desulforhabdusamnigenus. Archives of Microbiology 176(6), 435-442.
Sass A., Rutters H., Cypionka H., and Sass H. (2002) Desulfobulbus mediterraneus sp nov., a sulfate-reducing bacterium growing on mono- and disaccharides. Archives of Microbiology 177(6), 468-474.
Sauter E., Muyakshin J., Charlou J., Schlüter M., Boetius A., Jerosch K., Damm E., Foucher J. P., and Klages M. (submitted) Methane discharge from a deep-sea submarine mud volcano into the upper water column by gas hydrate-coated methane bubbles. Earthand Planetary Science Letters.
Sauter E., Schlüter M., Boetius A., and Baumann L. (2002) Geochemistry of Hakon Mosby Mud Vulcano (HMMV) bottom water and sediments, Report on Polar and Marine Research, pp. 47-53. Alfred-Wegener-Institut für Polar- und Meeresforschung (AWI).
Chapter 3 Lipid signatures and distribution of methanotrophic microbial communities at HMMV, Barents Sea
97
Schouten S., van der Maarel M. J. E. C., Huber R., and Sinninghe Damsté J. S. (1997) 2,6,10,15,19-pentamethylicosenes in Methanolobus bombayensis, a marine methanogenic archaeon, and in Methanosarcina mazei. Organic Geochemistry26(5/6), 409-414.
Shilov V. V., Druzhinina N. I., Vasilenko L. V., and Krupskaya V. V. (1999) Stratigraphy of sediments from the Hakon Mosby Mud Volcano Area. Geo-Marine Letters 19(1-2),48-56.
Sibuet M. and Olu K. (1998) Biogeography, biodiversity and fluid dependence of deep-sea cold-seep communities at active and passive margins. Deep-Sea Research Part Ii-Topical Studies in Oceanography 45(1-3), 517-+.
Smirnov R. V. (2000) Two new species of Pogonophora from the arctic mud volcano off northwestern Norway. Sarsia 85(2), 141-150.
Snaidr J., Amann R., Huber I., Ludwig W., and Schleifer K. H. (1997) Phylogenetic analysis and in situ identification of bacteria in activated sludge. Applied and Environmental Microbiology 63(7), 2884-2896.
Somoza L., Diaz-del-Rio V., Leon R., Ivanov M., Fernandez-Puga M. C., Gardner J. M., Hernandez-Molina F. J., Pinheiro L. M., Rodero J., Lobato A., Maestro A., Vazquez J. T., Medialdea T., and Fernandez-Salas L. M. (2003) Seabed morphology and hydrocarbon seepage in the Gulf of Cadiz mud volcano area: Acoustic imagery, multibeam and ultra-high resolution seismic data. Marine Geology 195(1-4), 153-176.
Strunk O., Gross O., Reichel B., May M., Hermann S., Stuckman N., Nonhoff B., Lenke M., Ginhart A., Vilbig A., Ludwig T., Bode A., Schleifer K.-H., and Ludwig W. (1998) ARB: a software environment for sequence data. www.mikro.biologie.tu-muenchen.de. Department of Microbiology Technische Universität München, Munich, Germany.
Summons R. E., Jahnke L. L., and Roksandic Z. (1994) Carbon isotopic fractionation in lipids from methanotrophic bacteria: Relevance for interpretation of the geochemical record of biomarkers. Geochimica Et Cosmochimica Acta 58(13), 2853-2863.
Sun M. Y., Wakeham S. G., and Lee C. (1997) Rates and mechanisms of fatty acid degradation in oxic and anoxic coastal marine sediments of Long Island Sound, New York, USA. Geochimica Et Cosmochimica Acta 61(2), 341-355.
Taylor J. and Parkes R. J. (1983) The cellular fatty acids of the sulphate-reducing bacteria, Desulfobacter sp., Desulfobulbus sp. and Desulfovibrio desulfuricans. Journal of General Microbiology 129, 3303-3309.
Teske A., Hinrichs K. U., Edgcomb V., Gomez A. D., Kysela D., Sylva S. P., Sogin M. L., and Jannasch H. W. (2002) Microbial diversity of hydrothermal sediments in the Guaymas Basin: Evidence for anaerobic methanotrophic communities. Applied and Environmental Microbiology 68(4), 1994-2007.
Thiel V., Peckmann J., Richnow H. H., Luth U., Reitner J., and Michaelis W. (2001) Molecular signals for anaerobic methane oxidation in Black Sea seep carbonates and a microbial mat. Marine Chemistry 73(2), 97-112.
Thiel V., Peckmann J., Seifert R., Wehrung P., Reitner J., and Michaelis W. (1999) Highly isotopically depleted isoprenoids: molecular markers for ancient methane venting. Geochimica et Cosmochimica Acta 63(23/24), 3959-3966.
Vogt P. R., Cherkashev A., Ginsburg G. D., Ivanov G. I., Crane K., Lein A. Y., Sundvor E., Pimenov N. V., and Egorov A. (1997a) Haakon Mosby mud volcano: A warm methane seep with seafloor hydrates and chemosynthesis-based Ecosystem in late Quantemary Slide Valley, Bear Island Fan, Barents Sea passive margin. EOSTransactions of the American Geophysical Union Supplement 78(17), 187-189.
Vogt P. R., Cherkashev G., Ginsburg G., Ivanov G. I., Milkov A., Crane K., Lein A., Sundvor E., Pimenov N. V., and Egorov A. (1997b) Haakon Mosby Mud Volcano Provides
Chapter 3 Lipid signatures and distribution of methanotrophic microbial communities at HMMV, Barents Sea
98
Unusual Example of Venting. EOS Transactions of the American Geophysical Union Supplement 78(48), 549, 556-557.
Werne J. P., Baas M., and Damste J. S. S. (2002) Molecular isotopic tracing of carbon flow and trophic relationships in a methane-supported benthic microbial community. Limnology and Oceanography 47(6), 1694-1701.
Whiticar M. J. (1999) Carbon and hydrogen isotope systematics of bacterial formation and oxidation of methane. Chemical Geology 161(1-3), 291-314.
Wuebbles D. J. and Hayhoe K. (2002) Atmospheric methane and global change. Earth-Science Reviews 57(3-4), 177-210.
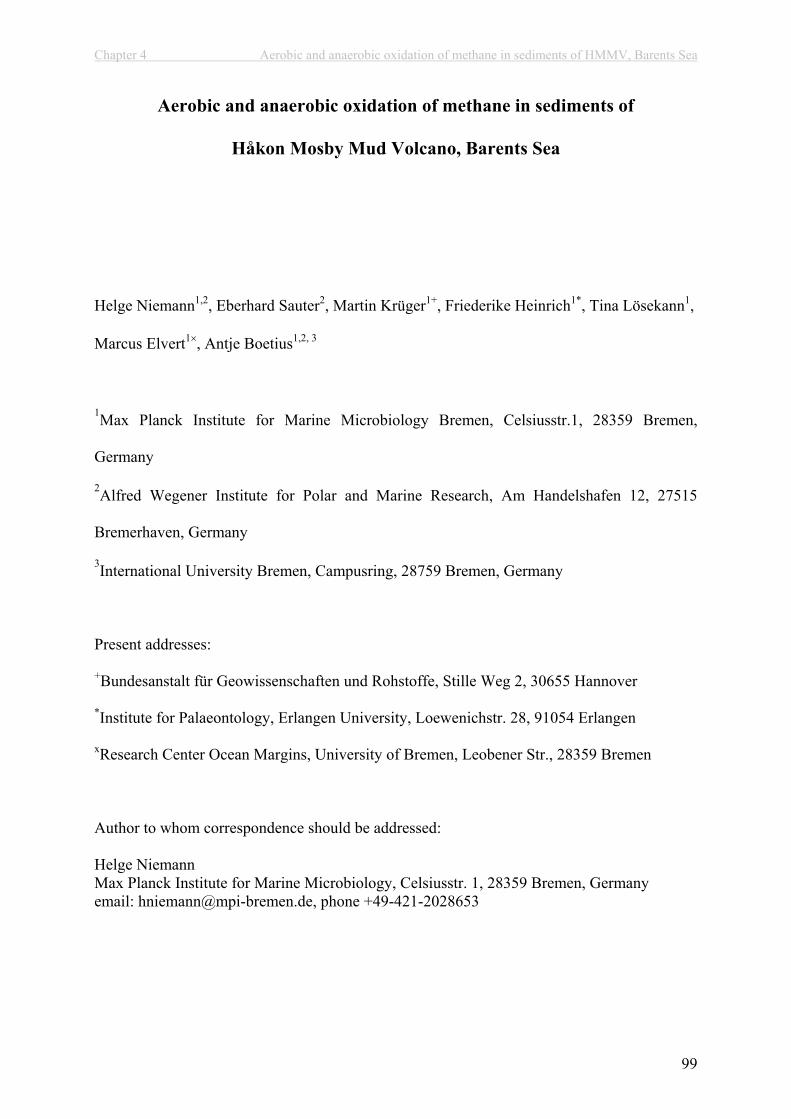
Chapter 4 Aerobic and anaerobic oxidation of methane in sediments of HMMV, Barents Sea
99
Aerobic and anaerobic oxidation of methane in sediments of
Håkon Mosby Mud Volcano, Barents Sea
Helge Niemann1,2, Eberhard Sauter2, Martin Krüger1+, Friederike Heinrich1*, Tina Lösekann1,
Marcus Elvert1 , Antje Boetius1,2, 3
1Max Planck Institute for Marine Microbiology Bremen, Celsiusstr.1, 28359 Bremen,
Germany
2Alfred Wegener Institute for Polar and Marine Research, Am Handelshafen 12, 27515
Bremerhaven, Germany
3International University Bremen, Campusring, 28759 Bremen, Germany
Present addresses:
+Bundesanstalt für Geowissenschaften und Rohstoffe, Stille Weg 2, 30655 Hannover
*Institute for Palaeontology, Erlangen University, Loewenichstr. 28, 91054 Erlangen
xResearch Center Ocean Margins, University of Bremen, Leobener Str., 28359 Bremen
Author to whom correspondence should be addressed:
Helge Niemann Max Planck Institute for Marine Microbiology, Celsiusstr. 1, 28359 Bremen, Germany email: [email protected], phone +49-421-2028653
Chapter 4 Aerobic and anaerobic oxidation of methane in sediments of HMMV, Barents Sea
100
ABSTRACT
The Håkon Mosby Mud Volcano (HMMV) is an active methane seeping mud volcano of ca.
1 km in diameter at 1250 m water depth on the Norwegian margin of the Barents Sea
(72°00’N, 14°45’ E). Previous (Milkov et al., 2004) and recent videographic mapping of the
seafloor indicates three distinct habitats: (1) a central area covered by greyish muds;
concentrically enclosed by (2) a belt of blackish, highly reduced sediments covered with
white mats of the thiotrophic bacterium Beggiatoa sp.; (3) and an outer rim of brownish
sediments, which are densely populated by pogonophoran worms. During dives with the
remotely operated vehicle (ROV) Victor 6000 of IFREMER in 2003, another more fractured
type of habitat was discovered at the boundary of the centre. Here, and in the vicinity of gas
ebullition sites, patches of reduced sediments covered with greyish microbial mats were
found. These four habitats were sampled with ROV push cores, a video-guided multiple corer
and gravity cores for ex situ measurements of aerobic and anaerobic methane oxidation as
well as sulphate reduction rates. Aerobic or anaerobic oxidation of methane dominates
biogeochemical processes in the HMMV sediments and is carried out by different microbial
communities in distinct zones of the mud volcano. Chloride and bromide concentration
profiles provide evidence that differences in advective flow of pore water is a main factor
determining this zonation. In the centre, a high upward flow of sulphate-free subsurface fluids
strongly limits the penetration depth of sulphate and oxygen. Here, aerobic oxidation of
methane (MOx) is restricted to the top cm sediment layer with rates of 0.9 mol m-2 yr-1 and
anaerobic oxidation of methane (AOM) is absent. In the patches of reduced sediments
covered with grey mats, a deeper penetration of sulphate from seawater was observed, fueling
AOM activity down to >12 cm with rates of 12.4 mol m-2 yr-1. Adjacent to the centre at the
Beggiatoa site, decreased upward fluid flow and the activity of the Beggiatoa filaments allows
for an AOM zone of ca 5 cm at the sediment surface with rates of 4.5 mol m-2 yr-1. The

Chapter 4 Aerobic and anaerobic oxidation of methane in sediments of HMMV, Barents Sea
101
stoichiometry of anaerobic oxidation of methane with sulphate was 1:1. Furthermore, in vitro
incubations of surface sediments from the centre and the Beggiatoa site revealed the
adaptation of aerobic and anaerobic oxidation of methane to the ice-cold temperatures of -1°C
at the seafloor. At the outer rim of the HMMV, bioventilation of the pogonophoran worms
irrigates a much deeper zone with oxygen- and sulphate-rich seawater. MOx activity of the
free-living methanotrophic community in the oxygenated surface sediments was comparably
low with 0.2 mol m-2 yr-1. A defined methane-sulphate transition zone was found just beneath
the roots of the tubeworms at 67 to 77 cm sediment depth. Here, AOM activity was high with
7.1 mol m-2 yr-1. With respect to the area size of the different habitats at HMMV, microbial
consumption reduces the methane efflux of HMMV by ca 7* 10-5 Tg yr-1, i.e. 22 to 55%.
Chapter 4 Aerobic and anaerobic oxidation of methane in sediments of HMMV, Barents Sea
102
1. INTRODUCTION
Methane is an aggressive greenhouse gas with a high global warming potential (Manne and
Richels, 2001). Variation in methane fluxes to the atmosphere have contributed significantly
to global climate changes throughout the history of the earth (Kasting and Siefert, 2002; Petit
et al., 1999; Wuebbles and Hayhoe, 2002). Increasing research effort has therefore been
dedicated to elucidate sources and sinks of methane on earth. One important source of
atmospheric methane are mud volcanoes occurring in terrestrial and marine environments
(Dimitrov, 2003; Kopf, 2002; Milkov et al., 2003). Marine mud volcanoes represent a special
type of cold seep ecosystems expelling deep subsurface muds together with fluids and gases
to the sea floor (Charlou et al., 2003; Kopf, 2002; Somoza et al., 2003). Estimates of marine
mud volcanoes range between 800 and 100000 worldwide. (Dimitrov and Woodside, 2003;
Dimitrov, 2002; Dimitrov, 2003; Kopf, 2002; Milkov, 2000; Milkov et al., 2003). However, it
is currently not known how many of these structures are actively emitting gases to the
hydrosphere.
Microbial consumption mediated aerobically by bacteria or anaerobically by archaea are the
main biological sinks of methane (Hinrichs and Boetius, 2002; Lelieveld et al., 1998;
Reeburgh, 1996; Whiticar, 1999). Bacteria involved in MOx have been reported from
oxygenated wetlands, soils, freshwater, marine waters and as symbionts in invertebrates
(Fisher, 1990; Hanson et al., 1993; Larock et al., 1994; Le Mer and Roger, 2001). Not much is
known about the relevance of MOx in marine sediments. However, due to the very limited
oxygen penetration depth in aquatic sediments, MOx communities are most likely restricted
to very narrow zones of surface sediments whereas methane rich sediments are mostly found
deeper in anoxic sediments. Hence, the main sink for methane in the ocean is AOM coupled
to sulphate reduction (SR) according to the following net equation:
Chapter 4 Aerobic and anaerobic oxidation of methane in sediments of HMMV, Barents Sea
103
CH4 + SO42- = HCO3
- + HS- + H2O (1)
(Hinrichs and Boetius, 2002; Iversen and Jørgensen, 1985). This stoichiometry has been
validated by ex situ and in vitro rate measurements with environmental sediment samples
hosting AOM communities (Nauhaus et al., 2002; Nauhaus et al., 2005; Treude et al., 2003).
Two distinct lineages of archaea, ANME-1 and ANME-2 are known to mediate AOM in
consortium with sulphate reducing bacteria (SRB) of the Desulfosarcina/Desulfococcus
cluster (Seep-SRB1; Boetius et al., 2000 ; Hinrichs et al., 1999; Knittel et al. 2003; Knittel et
al., 2005 ; Michaelis et al., 2002 ; Orphan et al., 2001). The biochemical functioning of AOM
has not been elucidated yet, but increasing evidence suggests that the process is a reversal of
methanogenesis (Hallam et al., 2004; Krüger et al., 2003; Valentine and Reeburgh, 2000).
The role of SRB could be the rapid removal of an unknown intermediate via SR, thus
maintaining thermodynamic conditions favouring AOM.
AOM is of particular importance at deep-water cold seeps where advective fluid flow supplies
surface sediments with high amounts of methane (Boetius and Suess, 2004). To date, methane
seeps at the Cascadia convergent margin (Hydrate Ridge), in the Gulf of Mexico and on the
Crimean Shelf were extensively studied with respect to AOM processes and the responsible
microbial communities (Joye et al., 2004; Nauhaus et al., 2002; Nauhaus et al., 2005; Treude
et al., 2003). Only very few investigations of methane turnover processes at mud volcanoes
have been carried out (Haese et al., 2003; Pimenov et al., 1999). One aim of this study was to
quantify methane oxidation rates in different zones of the HMMV, and to compare the
relevance of aerobic and anaerobic processes. A second goal was to validate the stoichiometry
of AOM at HMMV and to investigate the effect of temperature and methane concentrations in
vitro. Finally, a preliminary budget for methane consumption versus methane emission at the

Chapter 4 Aerobic and anaerobic oxidation of methane in sediments of HMMV, Barents Sea
104
HMMV is presented to highlight the relevance of focused methane sources on continental
margins.

Chapter 4 Aerobic and anaerobic oxidation of methane in sediments of HMMV, Barents Sea
105
2. MATERIAL AND METHODS
2.1 Sampling Location
The HMMV is a glacial deposit of 3 km thickness (Shilov et al., 1999) located at 72° 00,25’N
and 14° 43.50’E in 1250 m water depth in the SW Barents Sea (Vogt et al., 1997a; Vogt et al.,
1997b). A review of previous geological and biological research at HMMV is given by
Milkov et al. (2004). Briefly, the HMMV has a circular shape with 1 km in diameter (0.8
km2), a relief of up to 10 m above sea floor and it is surrounded by a circular, ca. 200 m wide
depression (Hjelstuen et al., 1999; Vogt et al., 1997a). Thermal gradients in the centre are
high with values of 10°C m-1 where methane-rich sediments are expelled through a central
conduit (Eldholm et al., 1999; Ginsburg et al., 1999; Vogt et al., 1997b). Source methane at
HMMV is of a mixed microbial-thermogenic origin (Lein et al., 1999).
HMMV was visited during two cruises with R/V L’Atalante together with ROV “Victor
6000” (IFREMER, Brest) in 2001 and R/V Polarstern (Alfred Wegener Institut for Polar and
Marine Research; ARK XIX 3b) together with ROV Victor 6000 (IFREMER, Brest) in 2003
(Klages et al., 2002; Klages et al., 2004).
2.2 Sample Collection and Storage
Sediment samples were obtained from distinct habitats (“central area”, “grey mat”,
“Beggiatoa mats”, “Pogonophora zones”, “reference site”) by ROV push coring, video
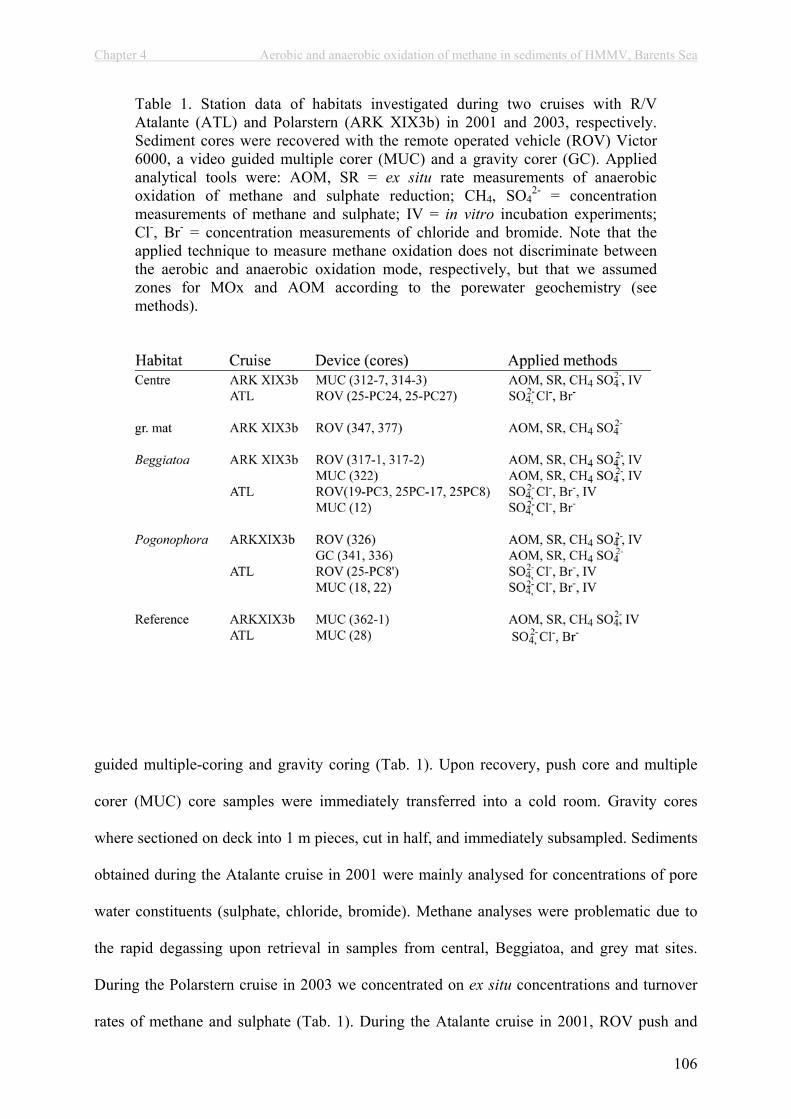
Chapter 4 Aerobic and anaerobic oxidation of methane in sediments of HMMV, Barents Sea
106
guided multiple-coring and gravity coring (Tab. 1). Upon recovery, push core and multiple
corer (MUC) core samples were immediately transferred into a cold room. Gravity cores
where sectioned on deck into 1 m pieces, cut in half, and immediately subsampled. Sediments
obtained during the Atalante cruise in 2001 were mainly analysed for concentrations of pore
water constituents (sulphate, chloride, bromide). Methane analyses were problematic due to
the rapid degassing upon retrieval in samples from central, Beggiatoa, and grey mat sites.
During the Polarstern cruise in 2003 we concentrated on ex situ concentrations and turnover
rates of methane and sulphate (Tab. 1). During the Atalante cruise in 2001, ROV push and
Table 1. Station data of habitats investigated during two cruises with R/V Atalante (ATL) and Polarstern (ARK XIX3b) in 2001 and 2003, respectively. Sediment cores were recovered with the remote operated vehicle (ROV) Victor 6000, a video guided multiple corer (MUC) and a gravity corer (GC). Applied analytical tools were: AOM, SR = ex situ rate measurements of anaerobic oxidation of methane and sulphate reduction; CH4, SO4
2- = concentration measurements of methane and sulphate; IV = in vitro incubation experiments; Cl-, Br- = concentration measurements of chloride and bromide. Note that the applied technique to measure methane oxidation does not discriminate between the aerobic and anaerobic oxidation mode, respectively, but that we assumed zones for MOx and AOM according to the porewater geochemistry (see methods).

Chapter 4 Aerobic and anaerobic oxidation of methane in sediments of HMMV, Barents Sea
107
MUC cores were sliced into 1 cm sections and pore water was extracted by pressure filtration
(5 bars) through Teflon squeezers provided with 0.2 µm cellulose acetate filters. Aliquots of
pore water for sulphate concentration measurements were fixed in aqueous zinc-acetate
solution (20%, w/v) whereas samples for chloride and bromide concentration measurements
were stored at –20°C until chromatography analysis. ROV push and MUC cores obtained
during the Polarstern cruise in 2003 were subsampled vertically with small push cores (acrylic
core liners, 26 mm diameter) according to a previous publication (Treude et al., 2003). The
gravity cores were subsampled horizontally with glass tubes (60 mm length, 10 mm
diameter). The small push cores and the glass tubes were sealed immediately after
subsampling with butyl rubber stoppers to prevent gas exchange. Sediments for in vitro
incubation experiments were pooled from replicate ROV push and MUC cores and stored
aerobically or anaerobically at in situ temperature until further treatment (Tab. 1).
2.3 Field Measurements
2.3.1 Ex-situ AOM, MOx and SR Rate Measurements
Sediment for turnover rate measurements were incubated on board according to previously
described methods (Treude et al., 2003). Briefly, 25µl 14CH4 (dissolved in water, 2.5 kBq) and
5 µl 35SO42- tracer (dissolved in water, 50 kBq) were injected in 2 cm intervals into the small
push cores (whole core injection) or into the butyl rubber sealed glass tubes. Incubations were
carried out for 24 h (pushcores) or for 36 h (gravity cores) at in situ temperature in the dark.
Subsequently, incubated AOM and SR rate samples were fixed in 25 ml NaOH (2.5%, w/v)
and 25 ml zinc acetate solution (20%, w/v), respectively. Further processing of AOM and SR
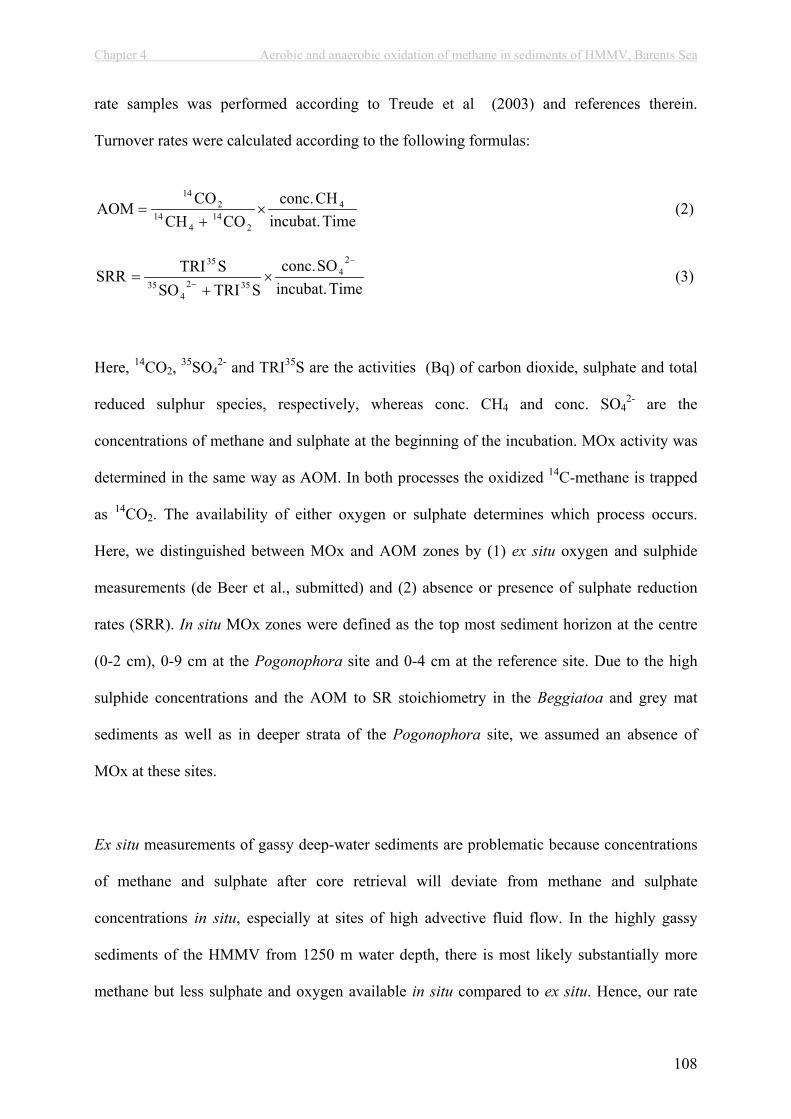
Chapter 4 Aerobic and anaerobic oxidation of methane in sediments of HMMV, Barents Sea
108
rate samples was performed according to Treude et al (2003) and references therein.
Turnover rates were calculated according to the following formulas:
Timeincubat.CHconc.
COCHCOAOM 4
214
414
214
(2)
Timeincubat.SOconc.
STRISOSTRISRR
24
3524
35
35
(3)
Here, 14CO2, 35SO42- and TRI35S are the activities (Bq) of carbon dioxide, sulphate and total
reduced sulphur species, respectively, whereas conc. CH4 and conc. SO42- are the
concentrations of methane and sulphate at the beginning of the incubation. MOx activity was
determined in the same way as AOM. In both processes the oxidized 14C-methane is trapped
as 14CO2. The availability of either oxygen or sulphate determines which process occurs.
Here, we distinguished between MOx and AOM zones by (1) ex situ oxygen and sulphide
measurements (de Beer et al., submitted) and (2) absence or presence of sulphate reduction
rates (SRR). In situ MOx zones were defined as the top most sediment horizon at the centre
(0-2 cm), 0-9 cm at the Pogonophora site and 0-4 cm at the reference site. Due to the high
sulphide concentrations and the AOM to SR stoichiometry in the Beggiatoa and grey mat
sediments as well as in deeper strata of the Pogonophora site, we assumed an absence of
MOx at these sites.
Ex situ measurements of gassy deep-water sediments are problematic because concentrations
of methane and sulphate after core retrieval will deviate from methane and sulphate
concentrations in situ, especially at sites of high advective fluid flow. In the highly gassy
sediments of the HMMV from 1250 m water depth, there is most likely substantially more
methane but less sulphate and oxygen available in situ compared to ex situ. Hence, our rate
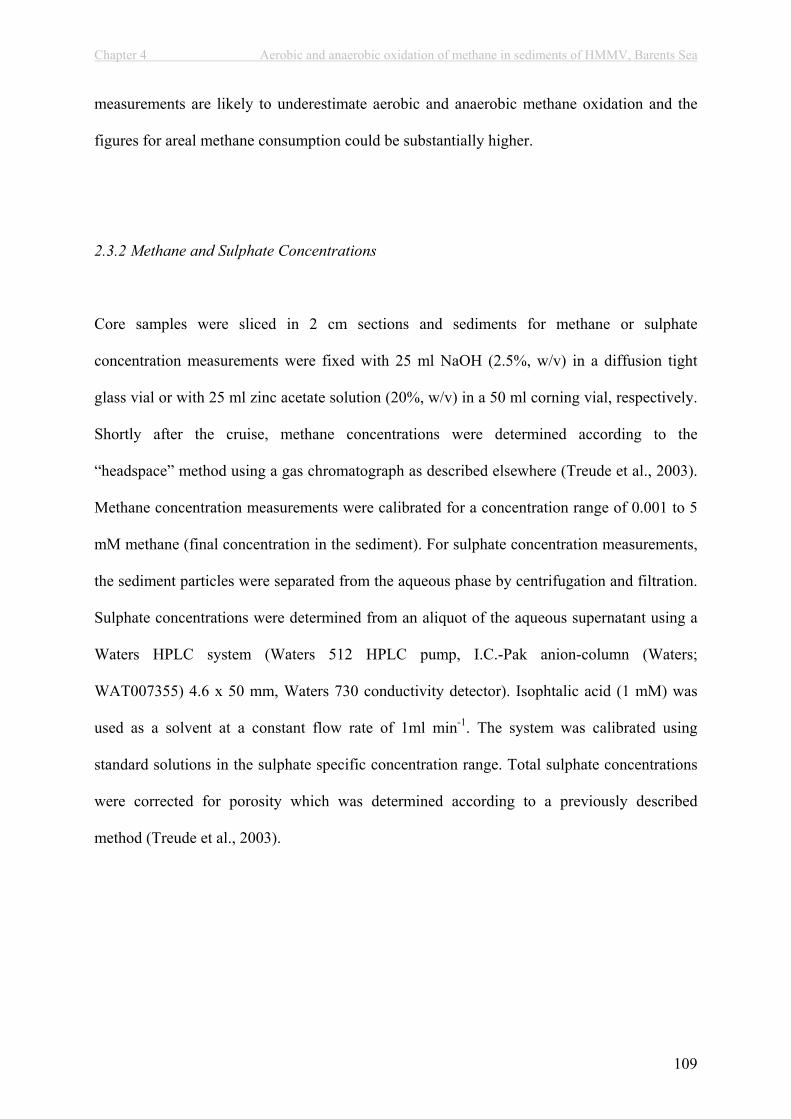
Chapter 4 Aerobic and anaerobic oxidation of methane in sediments of HMMV, Barents Sea
109
measurements are likely to underestimate aerobic and anaerobic methane oxidation and the
figures for areal methane consumption could be substantially higher.
2.3.2 Methane and Sulphate Concentrations
Core samples were sliced in 2 cm sections and sediments for methane or sulphate
concentration measurements were fixed with 25 ml NaOH (2.5%, w/v) in a diffusion tight
glass vial or with 25 ml zinc acetate solution (20%, w/v) in a 50 ml corning vial, respectively.
Shortly after the cruise, methane concentrations were determined according to the
“headspace” method using a gas chromatograph as described elsewhere (Treude et al., 2003).
Methane concentration measurements were calibrated for a concentration range of 0.001 to 5
mM methane (final concentration in the sediment). For sulphate concentration measurements,
the sediment particles were separated from the aqueous phase by centrifugation and filtration.
Sulphate concentrations were determined from an aliquot of the aqueous supernatant using a
Waters HPLC system (Waters 512 HPLC pump, I.C.-Pak anion-column (Waters;
WAT007355) 4.6 x 50 mm, Waters 730 conductivity detector). Isophtalic acid (1 mM) was
used as a solvent at a constant flow rate of 1ml min-1. The system was calibrated using
standard solutions in the sulphate specific concentration range. Total sulphate concentrations
were corrected for porosity which was determined according to a previously described
method (Treude et al., 2003).
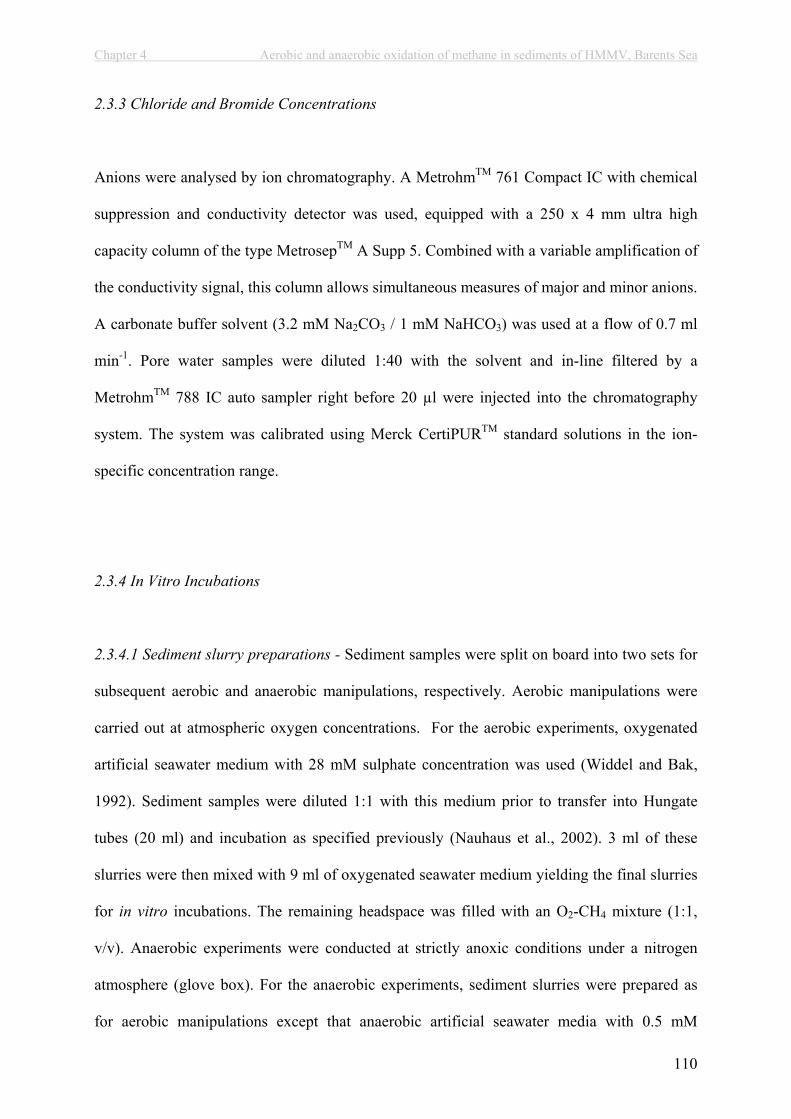
Chapter 4 Aerobic and anaerobic oxidation of methane in sediments of HMMV, Barents Sea
110
2.3.3 Chloride and Bromide Concentrations
Anions were analysed by ion chromatography. A MetrohmTM 761 Compact IC with chemical
suppression and conductivity detector was used, equipped with a 250 x 4 mm ultra high
capacity column of the type MetrosepTM A Supp 5. Combined with a variable amplification of
the conductivity signal, this column allows simultaneous measures of major and minor anions.
A carbonate buffer solvent (3.2 mM Na2CO3 / 1 mM NaHCO3) was used at a flow of 0.7 ml
min-1. Pore water samples were diluted 1:40 with the solvent and in-line filtered by a
MetrohmTM 788 IC auto sampler right before 20 µl were injected into the chromatography
system. The system was calibrated using Merck CertiPURTM standard solutions in the ion-
specific concentration range.
2.3.4 In Vitro Incubations
2.3.4.1 Sediment slurry preparations - Sediment samples were split on board into two sets for
subsequent aerobic and anaerobic manipulations, respectively. Aerobic manipulations were
carried out at atmospheric oxygen concentrations. For the aerobic experiments, oxygenated
artificial seawater medium with 28 mM sulphate concentration was used (Widdel and Bak,
1992). Sediment samples were diluted 1:1 with this medium prior to transfer into Hungate
tubes (20 ml) and incubation as specified previously (Nauhaus et al., 2002). 3 ml of these
slurries were then mixed with 9 ml of oxygenated seawater medium yielding the final slurries
for in vitro incubations. The remaining headspace was filled with an O2-CH4 mixture (1:1,
v/v). Anaerobic experiments were conducted at strictly anoxic conditions under a nitrogen
atmosphere (glove box). For the anaerobic experiments, sediment slurries were prepared as
for aerobic manipulations except that anaerobic artificial seawater media with 0.5 mM
Chapter 4 Aerobic and anaerobic oxidation of methane in sediments of HMMV, Barents Sea
111
sulphide concentration was used (Widdel and Bak, 1992). Furthermore, the headspace was
filled with pure methane yielding a concentration of ca. 1.5 mM methane in the aqueous
medium (Yamamoto et al., 1976),.
2.3.4.2 In vitro MOx, AOM and SR rate measurements – In contrast to ex situ rates, in vitro
rates represent conditions where the microbial community in the sediment is supplied with
known concentrations of substrate (oxygen, methane at atmospheric saturation). In the present
experiment, we used sediments which were pre-incubated for ~0.5 yr under methane which
might have lead to higher numbers of methane oxidising and sulphate reducing microbes. To
measure the potentials of MOx, AOM and SR at the four major habitats at HMMV (centre,
grey mat, Beggiatoa, Pogonophora) and a reference site, sediment slurries from the surface
(0-3 cm) and a deeper horizon (3-10 cm) were incubated in a vertical position to facilitate gas
diffusion at 4°C for 1 wk. As a control, the same slurries were incubated with pure N2 instead
of CH4 in the headspace. Aliquots of the headspace and the medium were extracted in balance
with nitrogen daily and analysed for concentrations of methane and sulphide, respectively,
according to Nauhaus et al. (2002). Turnover rates were determined from the change in
methane and sulphide concentrations, respectively.
The temperature optimum and the stoichiometry of AOM and SR as well as the response of
AOM activity to changing methane concentrations were determined from sediment slurries of
the Beggiatoa site (0-3 cm). The response of MOx activity to temperature and changing
methane concentrations was determined from sediment slurries of the centre site (0-3 cm).
The temperature optimum for AOM at HMMV was determined from slurry incubations at
temperatures of 1, 4, 8, 16 and 20°C, respectively. For MOx, 4 different temperatures (4, 12,
20 and 28°C) were chosen to investigate the response to temperature. These incubations were

Chapter 4 Aerobic and anaerobic oxidation of methane in sediments of HMMV, Barents Sea
112
carried out for 1 wk. To investigate the stoichiometry of AOM, methane utilisation and
sulphide production were investigated at 4°C over a time period of 144 days. Furthermore, the
effect of increasing methane concentrations on AOM activity was examined in incubations (1
wk) of sediment slurries with methane concentrations of 1.75, 15.4 and 40 mM by applying
methane partial pressures of 0.1, 1.1 and 2.9 MPa, respectively. The response of MOx activity
to changing methane concentrations was investigated at methane concentrations of 3.3 mM
(0.24 MPa) and 8.3 mM (0.6 MPa). Pressure incubations were carried out according to the
specifications provided by Nauhaus et al. (2002).
Chapter 4 Aerobic and anaerobic oxidation of methane in sediments of HMMV, Barents Sea
113
3. RESULTS
3.1 Field Measurements
3.1.1 Centre
As a result of the strong pressure change during recovery (1250 m water depth), sediment
cores from the centre were subjected to gas ebullition. Methane concentrations were thus
close to the saturation level of 1.5 mM at the ambient pressure on board (1 bar) over the entire
vertical profile (data not shown). Sulphate concentrations showed a substantial decline with
depth in all cores (n = 3, Fig. 1a). The ex situ sulphate penetration depth varied from 8 to 22
cm bsf between replicate cores. Similarly, chloride concentrations declined with depth from
concentrations typical for sea water (610 mM) at the sediment surface to values as low as 415
mM at the bottom of the core (Fig. 1b). Bromide showed an increase from seawater values
(0.84 mM) to values ~1.8 mM at 17.5 cm bsf (Fig. 1c). MOx rates were between 0.04 and
0.29 µmol cm-3 d-1 in the uppermost (0-2 cm) sediment horizon in all replicates (Fig.1a).
Integrated over this horizon, methane oxidation (n = 4) was 0.9 ( 0.4 standard error, SE) mol
m-2 yr-1 (Fig. 3). Despite the sharp sulphate gradients, SR was low in all replicates over the
entire vertical profile down to 19 cm (on average 0.002 µmol cm-3 d-1) (Fig. 2b). Integrated
over depth (0-12 cm) SR (n = 4) was 0.11 ( 0.05 SE) mol m-2 yr-1 on average (Fig. 3). SR and
methane oxidation rates were insignificant (<0.001 µmol cm-3 d-1) in deeper sediment layers
sampled by gravity coring (data not shown).
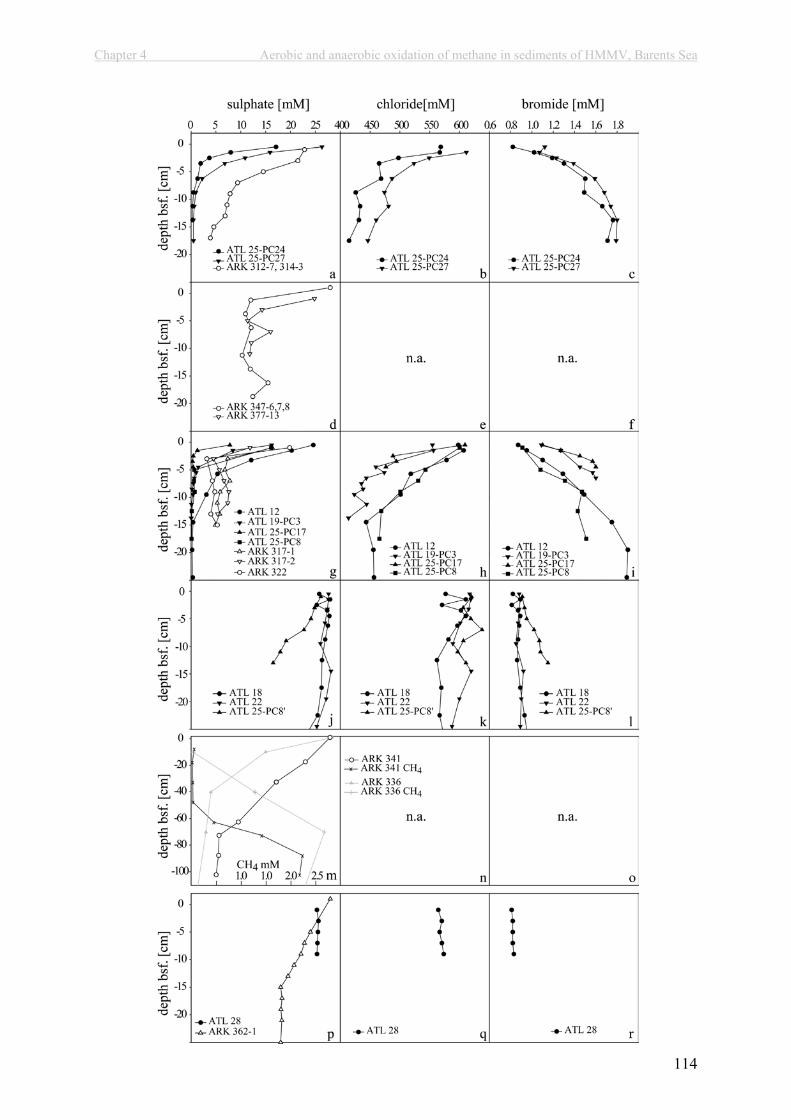
Chapter 4 Aerobic and anaerobic oxidation of methane in sediments of HMMV, Barents Sea
114
Chapter 4 Aerobic and anaerobic oxidation of methane in sediments of HMMV, Barents Sea
115
Figure 1. Pore water concentrations of sulphate (left panels), chloride (central panels) and bromide (right panels) at the centre (a,-c), grey mat (d), Beggiatoa (g-i), Pogonophora (j-m) and reference site (p-r). Methane concentrations are presented for the Pogonophora site (m). Note that the figure legend of panel (m) is in panel (n). Methane concentrations were at saturation level (~1.5 mM) for the on board conditions in retrieved cores of the centre, grey mat and Beggiatoa site and <0.01 mM at the reference site. n.a. = not available. ARK and ATL indicate samples taken during the R/V Polarstern and R/V Atalante cruise, respectively.
3.1.2 Grey Mats
Similar to the centre site, sediments recovered from the grey mats were subjected to gas
ebullition. Consequently, methane concentrations were at ca. 1.5 mM over the entire vertical
profile (data not shown). Sulphate concentrations showed an initial decline with depth but
remained relatively constant at approximately 11 mM below 5 cm bsf (Fig. 1d). Chloride and
Bromide were not measured in sediments below grey mats. AOM and SR rates showed a high
variability between stations (different patches of grey mats) and replicates (Fig. 2c,d). At
station ARK XIX3b 377, AOM and SR rates were comparably low with values ranging from
0.01 to 0.1 (n = 2) and from 0.01to 0.12 µmol cm-3 d-1 (n = 3), respectively, without showing
any specific trend with sediment depth. AOM and SR rates at station ARK XIX3b 347 were
higher with values ranging from 0.04 to 0.76 (n = 3) and from 0.01 to 2.24 µmol cm-3 d-1 (n =
3), respectively. Despite the high variability between replicates, AOM and SR rates were
generally highest in the upper 5 cm of the sediment core. Notably, one replicate of SRR
measurements was one order of magnitude higher than the other replicates of station ARK
XIX3b 347. At the grey mat site, AOM (n = 5) and SR (n = 6), integrated over 0-12 cm
sediment depth, showed comparable mean values of 12.4 ( 3.1 SE) and 14.6 ( 11.7 SE) mol
m-2 yr-1, respectively (Fig. 3).
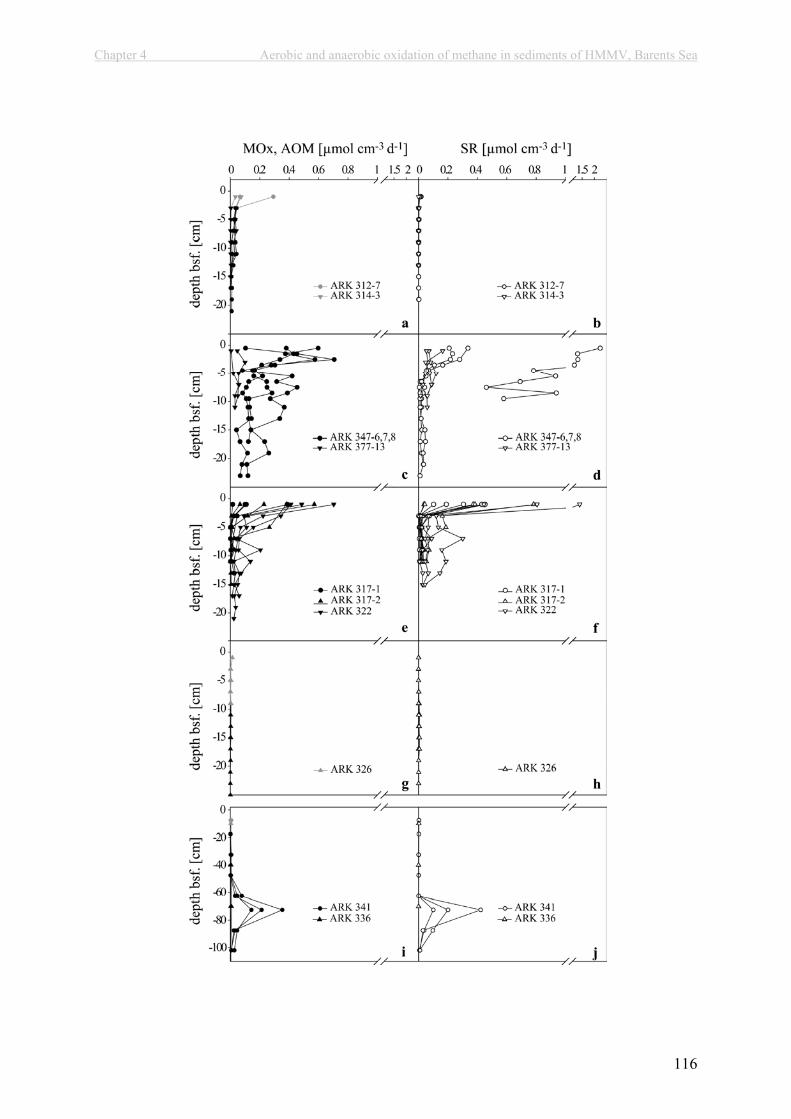
Chapter 4 Aerobic and anaerobic oxidation of methane in sediments of HMMV, Barents Sea
116
Chapter 4 Aerobic and anaerobic oxidation of methane in sediments of HMMV, Barents Sea
117
Figure 2. Aerobic (highlighted in grey) and anaerobic oxidation of methane (highlighted in black) (left panels) and sulphate reduction rates (highlighted in white, right panels) at the centre (a,b), grey mat (c,d), Beggiatoa (e,f) and Pogonophora site (g-j). Note that methane turnover in sediment sections below 2 cm bsf of the centre could not be attributed to either MOx or AOM activity (see method section). Note the difference in depth scale in panels (i) and (j). Replicates of one station are represented with the same symbol. ARK indicates samples taken during the R/V Polarstern cruise.
3.1.3 Beggiatoa
Similar to the centre and grey mat site, sediments recovered from Beggiatoa mats were
subjected to gas ebullition. Hence, methane concentrations were at ca. 1.5 mM over the entire
vertical profile (data not shown). Sulphate concentrations decreased substantially with depth
at all stations (n = 7, Fig. 1g). At 3 stations sulphate declined to trace amounts within the
upper 5 cm of the sediment. 4 stations had relatively constant sulphate concentrations between
3 and 7 mM below 3 cm sediment depth. Compared to the centre, the decrease of chloride and
increase of bromide with depth was less steep in all replicates (n = 4) (Fig. 1h,i). In sediments
below Beggiatoa mats, AOM and SR rates were highest in the uppermost sediment horizon
but also varied considerably in magnitude between replicates and stations with values ranging
from 0.02 to 0.70 and from 0.04 to 1.40 µmol cm-3 d-1, respectively (Fig. 2e,f). All replicates
showed a sharp decline of AOM and SR rates to values <0.20 and <0.30 µmol cm-3 d-1,
respectively, with depth below 5 cm. AOM and SR rates were insignificant (<0.001 µmol cm-
3 d-1) in deeper sediment layers sampled by gravity coring (data not shown). Integrated over
depth (0-12 cm), AOM (n = 11) and SR (n = 13) showed mean values of 4.5 ( 1.5 SE) and 5.5
( 2.0 SE) mol m-2 yr-1, respectively (Fig. 3).
Chapter 4 Aerobic and anaerobic oxidation of methane in sediments of HMMV, Barents Sea
118
3.1.4 Pogonophora
A distinct methane sulphate transition zone (SMT) was observed in subsurface sediments at
the Pogonophora site (Fig. 1m). In core 336, the SMT was between 20-40 cm and in core 341
between 60-80 cm bsf, (Fig. 1m). Methane concentrations in surface sediments were
comparably low with values <0.05 mM whereas a strong increase was observed at depth of 20
and 60 cm bsf in cores 336 and 341, respectively. Gas hydrates were observed at 110 cm bsf
in core 341 and at 350 cm bsf in core 336. The decrease of sulphate in near surface sediments
was moderate in comparison to Beggiatoa covered sediments but variable between stations (n
= 4, Fig. 1j). At depths below 70 cm bsf, sulphate declined to concentrations of approximately
3 mM in core 336 and 5
mM in core 341. Just as
sulphate, chloride and
bromide concentrations (n
= 3) also showed a less
steep decrease in
comparison to the centre
and Beggiatoa site (Fig.
1k,l). At the sediment
surface, MOx rates were
slightly elevated with
values around 0.01 µmol
cm-3 d-1 (n = 3) (Fig. 2g).
Between 9 and 47.5 cm
bsf, methane turnover was
Figure 3. Methane oxidation and sulphate reduction rates integrated over depth at the centre, grey mat, Beggiatoa,Pogonophora (Pogo. surface) and reference site. Methane turnover at the centre was integrated over the top most horizon (0-2 cm). Sulphate reduction rates at the centre as well as sulphate reduction and methane oxidation rates at the other sites were integrated over 0-12 cm. For the Pogonophora site, methane oxidation and sulphate reduction rates were also integrated over 9 to 105 cm (Pogo. subsurface). Error bars are standard errors.
Chapter 4 Aerobic and anaerobic oxidation of methane in sediments of HMMV, Barents Sea
119
<0.005 µmol cm-3 d-1. SRR was very low with values <0.005 µmol cm-3 d-1 (n = 3) from the
sea floor down to 47.5 cm bsf. Box core and gravity core samples showed that tubes of the
pogonophoran worm O. haakonmosbiensis extend to a depth of approximately 60 cm bsf.
Below this depth at the SMT (60-80 cm bsf, core 341), AOM and SR rates peaked in with
values ranging from 0.14 to 0.35 (n = 3) and from 0.10 to 0.42 (n = 3) µmol cm-3 d-1,
respectively (Fig. 2j). However, AOM and SR rates remained generally low (<0.005 µmol
cm-3 d-1) in core 336 (Fig. 2j). On average, AOM and SR rates were 7.1 ( 1.8 SE) and 6.7
( 2.6 SE) mol m-2 yr-1 over a depth interval of 9-105 cm. In contrast, MOx at the surface was
0.22 ( 0.04 SE) and SR was 0.07 ( 0.03 SE) mol m-2 yr-1 over 0-12 cm (Fig. 3).
3.1.5 Reference
As a reference site we chose two stations ca. 1 km to the east of the centre of the HMMV.
Methane concentrations were very low in the upper 10 cm with values of about 0.002 mM
increasing to about 0.01 mM below this depth (data not shown). At one station (core 362-1),
sulphate (n = 2) showed a very weak decrease with depth (Fig. 1p). The concentrations of
chloride and bromide (n = 1, core 28) were constant over depth (Fig. 1q-r). Methane oxidation
and SR rates were comparably low at the reference station (core 362-1). At the sediment
surface, MOx rates were 0.006 ( 0.006 SE, n = 3) µmol cm-3 d-1 decreasing with depth to
detection limit (<0.001 µmol cm-3 d-1, data not shown). SRR were elevated at 11 cm bsf with
values of 0.008 ( 0.008 SE, n = 3) µmol cm-3 d-1 but low above and below this depth with
values <0.002 µmol cm-3 d-1 (data not shown). Integrated over depth (0-12 cm), mean
methane oxidation and SR were 0.06 ( 0.04 SE) and 0.19 ( 0.17 SE) mol m-2 yr-1, respectively
(Fig. 3).
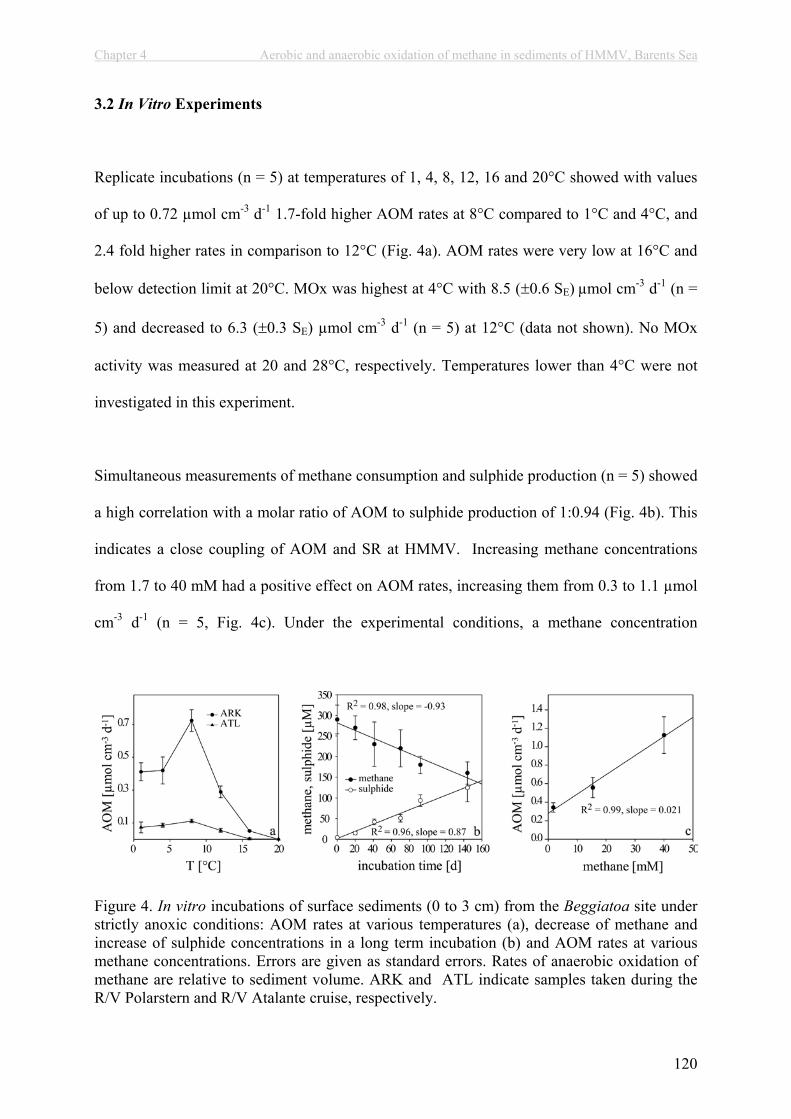
Chapter 4 Aerobic and anaerobic oxidation of methane in sediments of HMMV, Barents Sea
120
3.2 In Vitro Experiments
Replicate incubations (n = 5) at temperatures of 1, 4, 8, 12, 16 and 20°C showed with values
of up to 0.72 µmol cm-3 d-1 1.7-fold higher AOM rates at 8°C compared to 1°C and 4°C, and
2.4 fold higher rates in comparison to 12°C (Fig. 4a). AOM rates were very low at 16°C and
below detection limit at 20°C. MOx was highest at 4°C with 8.5 ( 0.6 SE) µmol cm-3 d-1 (n =
5) and decreased to 6.3 ( 0.3 SE) µmol cm-3 d-1 (n = 5) at 12°C (data not shown). No MOx
activity was measured at 20 and 28°C, respectively. Temperatures lower than 4°C were not
investigated in this experiment.
Simultaneous measurements of methane consumption and sulphide production (n = 5) showed
a high correlation with a molar ratio of AOM to sulphide production of 1:0.94 (Fig. 4b). This
indicates a close coupling of AOM and SR at HMMV. Increasing methane concentrations
from 1.7 to 40 mM had a positive effect on AOM rates, increasing them from 0.3 to 1.1 µmol
cm-3 d-1 (n = 5, Fig. 4c). Under the experimental conditions, a methane concentration
Figure 4. In vitro incubations of surface sediments (0 to 3 cm) from the Beggiatoa site under strictly anoxic conditions: AOM rates at various temperatures (a), decrease of methane and increase of sulphide concentrations in a long term incubation (b) and AOM rates at various methane concentrations. Errors are given as standard errors. Rates of anaerobic oxidation of methane are relative to sediment volume. ARK and ATL indicate samples taken during the R/V Polarstern and R/V Atalante cruise, respectively.
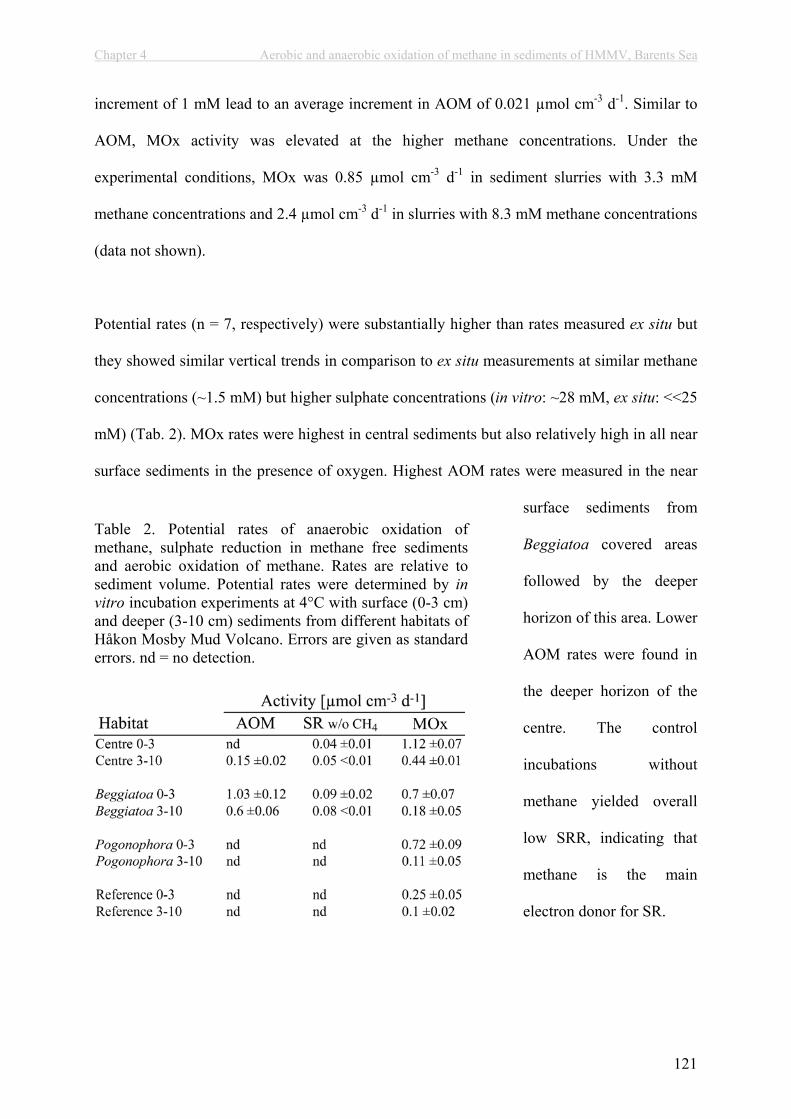
Chapter 4 Aerobic and anaerobic oxidation of methane in sediments of HMMV, Barents Sea
121
increment of 1 mM lead to an average increment in AOM of 0.021 µmol cm-3 d-1. Similar to
AOM, MOx activity was elevated at the higher methane concentrations. Under the
experimental conditions, MOx was 0.85 µmol cm-3 d-1 in sediment slurries with 3.3 mM
methane concentrations and 2.4 µmol cm-3 d-1 in slurries with 8.3 mM methane concentrations
(data not shown).
Potential rates (n = 7, respectively) were substantially higher than rates measured ex situ but
they showed similar vertical trends in comparison to ex situ measurements at similar methane
concentrations (~1.5 mM) but higher sulphate concentrations (in vitro: ~28 mM, ex situ: <<25
mM) (Tab. 2). MOx rates were highest in central sediments but also relatively high in all near
surface sediments in the presence of oxygen. Highest AOM rates were measured in the near
surface sediments from
Beggiatoa covered areas
followed by the deeper
horizon of this area. Lower
AOM rates were found in
the deeper horizon of the
centre. The control
incubations without
methane yielded overall
low SRR, indicating that
methane is the main
electron donor for SR.
Table 2. Potential rates of anaerobic oxidation of methane, sulphate reduction in methane free sediments and aerobic oxidation of methane. Rates are relative to sediment volume. Potential rates were determined by invitro incubation experiments at 4°C with surface (0-3 cm) and deeper (3-10 cm) sediments from different habitats of Håkon Mosby Mud Volcano. Errors are given as standard errors. nd = no detection.
Chapter 4 Aerobic and anaerobic oxidation of methane in sediments of HMMV, Barents Sea
122
4. DISCUSSION
4.1 Geochemical Zonation of HMMV
The HMMV is an active, methane and fluid seeping, deep-water mud volcano at the
Norwegian margin of the Barents Sea. Its roughly circular shape is 1 km in diameter covering
an area of about 0.8 km2 and the relief is <10 m (Hjelstuen et al., 1999; Klages et al., 2004;
Milkov et al., 2004; Vogt et al., 1997a; Vogt et al., 1997b). The habitats can be divided into
approximately concentric areas enclosing the central crater. (1) The central plain is covered
by greyish muds and has a diameter of ca. 500 m (0.2 km2). The centre is surrounded by a ca.
100 m wide belt (0.2 km2) of reduced sediments, covered with thiotrophic, filamentous
bacteria (Beggiatoa sp.). The hummocky rim is ca. 150 m wide (0.4 km2) and colonised by
pogonophoran worms. Furthermore, during the dives with the ROV Victor 6000, we observed
violent gas and fluid emissions at the northern edge of the centre. Small patches (<1m2) of
reduced sediments covered with whitish-greyish filamentous bacteria were observed in close
proximity to fluid escape and at the boundary of the centre. Quantification of the area covered
by grey mats was not possible due to their patchiness. However, we assume that they cover a
total area of less than 0.001 km2 at HMMV.
A deep origin of methane-rich fluids transported upwards by advective flow is indicated by
the anomalies of chloride and bromide concentrations, which are most prominent in the
centre. Our observations are in good agreement with previous findings showing high bromide
and low chloride concentrations in surface sediments of the centre (Lein et al., 1999). Several
different causes are known to affect bromide and chloride concentrations in marine sediments.
Amongst them are salt diapirism, degradation of organic matter, release of fresh water from
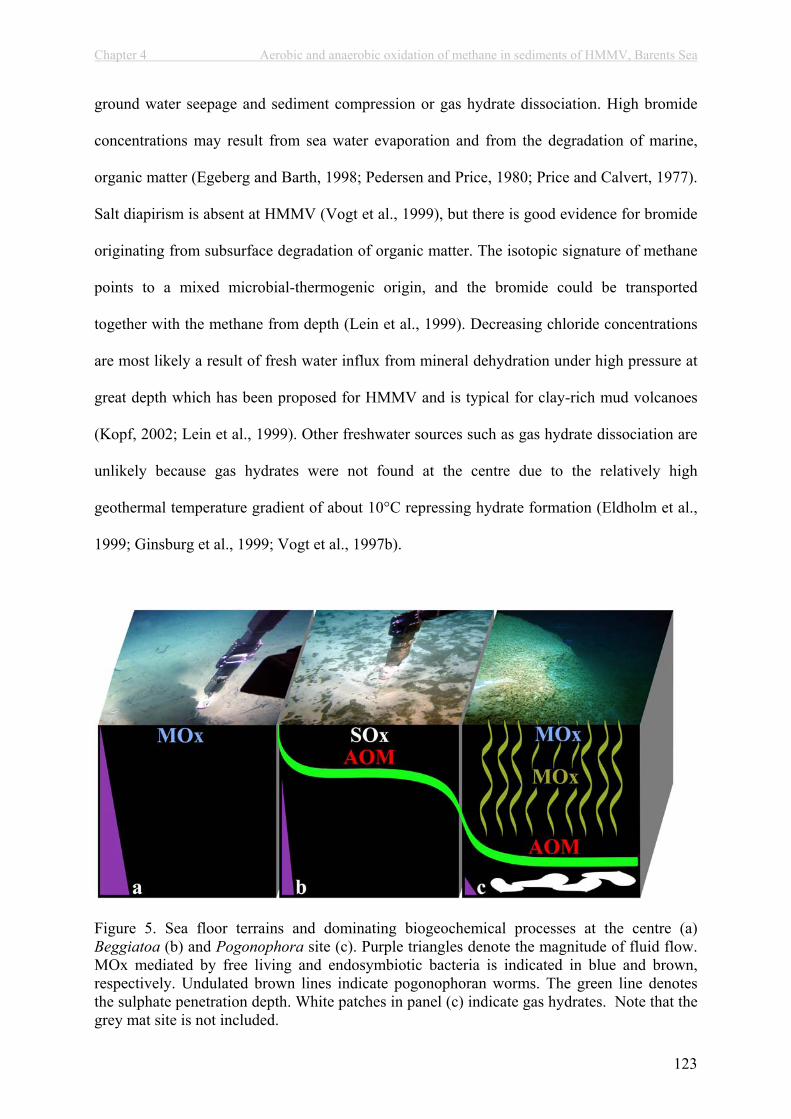
Chapter 4 Aerobic and anaerobic oxidation of methane in sediments of HMMV, Barents Sea
123
ground water seepage and sediment compression or gas hydrate dissociation. High bromide
concentrations may result from sea water evaporation and from the degradation of marine,
organic matter (Egeberg and Barth, 1998; Pedersen and Price, 1980; Price and Calvert, 1977).
Salt diapirism is absent at HMMV (Vogt et al., 1999), but there is good evidence for bromide
originating from subsurface degradation of organic matter. The isotopic signature of methane
points to a mixed microbial-thermogenic origin, and the bromide could be transported
together with the methane from depth (Lein et al., 1999). Decreasing chloride concentrations
are most likely a result of fresh water influx from mineral dehydration under high pressure at
great depth which has been proposed for HMMV and is typical for clay-rich mud volcanoes
(Kopf, 2002; Lein et al., 1999). Other freshwater sources such as gas hydrate dissociation are
unlikely because gas hydrates were not found at the centre due to the relatively high
geothermal temperature gradient of about 10°C repressing hydrate formation (Eldholm et al.,
1999; Ginsburg et al., 1999; Vogt et al., 1997b).
Figure 5. Sea floor terrains and dominating biogeochemical processes at the centre (a) Beggiatoa (b) and Pogonophora site (c). Purple triangles denote the magnitude of fluid flow. MOx mediated by free living and endosymbiotic bacteria is indicated in blue and brown, respectively. Undulated brown lines indicate pogonophoran worms. The green line denotes the sulphate penetration depth. White patches in panel (c) indicate gas hydrates. Note that the grey mat site is not included.
Chapter 4 Aerobic and anaerobic oxidation of methane in sediments of HMMV, Barents Sea
124
The decrease of the chloride and bromide gradients with distance to the centre give evidence
for a decreasing velocity of fluid seepage away from the central conduit at HMMV (Fig. 5,
Eldholm et al., 1999). Unfortunately, an estimate of the magnitude of pore water flow based
on the chloride and bromide gradients is not possible. These gradients were altered due to gas
ebullition and consequent seawater inflow during sediment retrieval. Based on microsensor
measurements, de Beer et al. (submitted) estimated a flow velocity of 0.4 µm s-1 at the centre
and a reduced velocity of 0.1 µm s-1 in the surrounding Beggiatoa-covered sediments. As a
consequence, the penetration depth of sulphate and probably other seawater solutes such as
oxygen is very limited at the centre in comparison to Beggiatoa covered sediments (Fig. 5a,
b). This also explains the steep sulphate gradients in spite of an insignificant SR at the centre
(Fig. 1a, 2b). Such effects of high advective flow of sulphate-depleted subsurface fluids have
previously been observed at cold seeps off Costa Rica (Hensen et al., 2004).
Accordingly, MOx and AOM at HMMV were horizontally and vertically restricted at the
different sites. Gas ebullition during sediment retrieval provides evidence that in situ methane
concentrations are high in surface sediments of the centre, Beggiatoa and grey mat site.
Hence, the availability of the electron acceptor could be the limiting factor in methane
oxidation. In situ measurements show that diffusion of oxygen and sulphate from bottom
waters into the sediments of the centre are restricted to the top few millimetres (de Beer et al.,
submitted). Here, the presence of oxygen most likely represses the development of AOM
communities in this narrow horizon. At slightly lower fluid flow rates at the Beggiatoa site, a
deeper penetration of sulphate of down to 5 cm into the sediment supports an active AOM
zone. The high rates of sulphide production by this process and rapid re-oxidation by
thiotrophic bacteria could exclude MOx communities. Sediments below grey mats represent a
special situation as sulphate concentrations were elevated over a larger depth interval despite
the proximity to central and Beggiatoa covered sediments. The reasons for the deeper

Chapter 4 Aerobic and anaerobic oxidation of methane in sediments of HMMV, Barents Sea
125
sulphate penetration in these sediment patches are currently unknown. The Pogonophora-
populated outer rim of the volcano is less influenced by advective flow as indicated by weak
chloride and bromide concentration gradients, and much lower geothermal gradients (Klages
et al. 2004). Previous work and our data show that the environmental conditions allow for gas
hydrate formation below ca. 50 cm in this region (Ginsburg et al., 1999). The pogonophoran
worms appear perfectly adapted to such a situation of deep methane and sulphide maxima
with their body length of >50 cm and their ability to transport oxygen, methane and
potentially also sulphide to their symbionts by blood circulation.
4.2 Anaerobic Oxidation of Methane
AOM is the predominant mode of methane oxidation in near surface sediments at the
Beggiatoa and grey mat site as well as in subsurface sediments at the Pogonophora site (Fig.
5b, c). Our AOM measurements at the Beggiatoa site (on average 0.314 µmol cm-3 d-1, 0-2
cm bsf) strongly exceed previous estimates of methane oxidation rates provided by Pimenov
et al. (1999). Below Beggiatoa mats, these authors detected highest rates of 9.94 µg carbon
dm-3 d-1, (0.83*10-3 µmol methane cm-3 d-1) at 20 – 30 cm bsf but did not find an AOM peak
at the surface. With respect to fluid flow, which limits the sulphate penetration to the top few
cm of the sediment, an active AOM community in subsurface sediments (>>5 cm bsf) appears
unlikely. One reason for the findings of Pimenov et al. (1999) might be that these authors
used a box corer for sediment sampling, which most probably lead to a loss of the surface
sediments during core recovery.
AOM was almost in a 1:1 ratio with SR at all sites both in ex situ as well as in vitro
experiments (Fig. 3, 4), indicating that methane is the main electron donor for SR.
Chapter 4 Aerobic and anaerobic oxidation of methane in sediments of HMMV, Barents Sea
126
Accordingly, SR at the reference site was negligible with only 0.19 mol m-2 yr-1, i.e. <5% of
the SR at the Beggiatoa site. Similarly, SRR in methane-free in vitro incubations of surface
sediments from the Beggiatoa site were 0.09 µmol cm-3 d-1 which accounts for <10% of the
SRR in methane saturated incubations of the same sediment type (1.03 µmol cm-3 d-1, Tab. 2).
The optimal temperature for AOM was with 8°C somewhat higher than the ambient
temperatures of -1°C, but lower than the optimal temperature of AOM communities retrieved
from temperate continental margins of the NW Pacific and the Black Sea (Nauhaus et al.
2004).
The areal rates of AOM were 4.5 mol m2 yr-1 at the Beggiatoa and 12.4 mol m2 yr-1 at the grey
mat site. At least for the Beggiatoa site, ex situ rates appear to be a conservative estimate of
the in situ rates. In situ miocrosensor measurements at the this site showed that sulphide is
completely oxidized within the sediment (Fig. 5b) resulting in a flux of 11 mol m-2 yr-1 (de
Beer et al., submitted). This is about 2-fold higher than the ex situ measurements of SR and
AOM at this site. The AOM activity in sediments of HMMV is comparable to highly active
methane seeps such as Hydrate Ridge and the Gulf of Mexico where areal AOM rates were
determined with a maximum of 36 and 4 mol m-2 yr-1, respectively (Joye et al., 2004; Treude
et al., 2003).
The exceptionally high AOM and SR rates below the roots of pogonophoran tubeworms are
most likely related to enhanced sulphate supply due to the bioirrigation activities of the
worms (Fig. 5c). Diffusive processes cannot explain the measured AOM and SR in core 341.
Assuming that the methane and sulphate gradients (ca. 0.1, ca. -0.4 µmol cm-4, respectively)
were a result of diffusive transport, the flux of methane and sulphate would account for <5%
of the measured ex situ AOM and SR, respectively, according to Fick’s law of diffusion
(porosity = ~50%). The AOM activity at the Pogonophora site (7.1 mol m2 yr-1) is to our
Chapter 4 Aerobic and anaerobic oxidation of methane in sediments of HMMV, Barents Sea
127
knowledge the ever highest measured in subsurface sediments, pointing to the relevance of
bioirrigation by chemosynthetic symbiosis at seeps (Cordes et al., 2005). AOM rates at non-
irrigated methane-sulphate transition zones in subsurface sediments are usually <0.06 µmol
m-2 yr-1 (Hensen et al., 2003; Jørgensen et al., 2001; Niewöhner et al., 1998; Whiticar, 2002).
Nevertheless, the estimated areal methane turnover at the Pogonophora site is most likely a
low estimate. The pogonophoran worms live in a symbiosis with aerobic methanotrophs
(Gebruk et al., 2003; Smirnov, 2000) and contribute themselves to methane oxidation.
Unfortunately, ex situ incubation methods cannot account for this, and the filter capacity of
Pogonophora at cold seeps is so far unknown.
An extrapolation of the areal AOM rates allows for a conservative estimate of the total
amount of methane consumed in the grey mat, Beggiatoa and Pogonophora habitats. With
respect to the areal extensions of these habitats, AOM consumes a total of 0.1*05, 8.5*105,
and 28.4*105 mol methane yr-1, respectively. Previous findings showed a 100-fold decrease in
bottom water methane concentrations from the centre to Beggiatoa covered areas and almost
background values above the outer rim of HMMV (Bogdanov et al., 1999; Damm and
Budeus, 2003; Milkov et al., 2004; Sauter and Schlüter, 2004). Hence, AOM appears to be an
efficient filter system against methane emission at HMMV.
4.3 Aerobic Methane Oxidation
MOx is the predominant mode of methane oxidation in surface sediments at the centre, the
Pogonophora and the reference site (Fig. 5a, c). This is confirmed by in vitro incubations
showing elevated MOx rates in these sediments whereas AOM could not be detected. In
surface sediments of the centre, the ex situ MOx rates were 0.9 mol m-2 yr-1. These rates are to

Chapter 4 Aerobic and anaerobic oxidation of methane in sediments of HMMV, Barents Sea
128
our knowledge among the highest ever measured in marine sediments and are just 5-fold
lower than the AOM rates at the Beggiatoa site. In oxygenated surface sediments of a
methane seep in the Baltic Sea (Jensen et al., 1992) and in low-flux seep sediments at Hydrate
Ridge which are populated by the ventilating bivalve Acharax (Treude et al., 2003), MOx was
1.5-fold lower in comparison to HMMV’s centre, although the penetration depth of oxygen
into the sediment was limited to a few millimetres at HMMV’s centre (de Beer et al.,
submitted).
The aerobic methanotrophs appear well adapted to the ice-cold in situ temperatures at
HMMV. In vitro incubations provide evidence that the optimum temperature for methane
oxidation at the centre is <<12°C. Most isolated strains of psychrophilic methanotrophs show
highest methane oxidation rates at temperatures 10°C and were found to grow at
temperatures between 3.5 and 20°C (Hanson and Hanson, 1996; Trotsenko and Khmelenina,
2002).
Similar to AOM, ex situ MOx rates are problematic because the oxygen penetration depth was
higher during ex situ incubations leading to an overestimation of the aerobic methane
turnover, whereas lower ex situ methane concentrations would underestimate in situ MOx as
shown by in vitro incubations at different methane concentrations. However, the diffusive
influx of oxygen at the centre site was estimated with 3.7 (in situ) and 0.5 mol m-2 and yr-1 (ex
situ) (de Beer et al., submitted). The measured ex situ MOx rates (0.9 mol m-2 d-1) are within
this range, indicating that MOx consumes most of the available oxygen in the top surface
layer. With respect to the areal extension of the centre site, a total of 3.3*105 mol methane yr-1
is oxidised in this environment. However, comparably high bottom water concentrations of
methane above the centre with values as high as 0.27 mM (Bogdanov et al., 1999; Milkov et
al., 2004) provide evidence that a substantial fraction of uprising methane escapes the benthic

Chapter 4 Aerobic and anaerobic oxidation of methane in sediments of HMMV, Barents Sea
129
microbial filter system. This is most probably a result of the high upward flow of methane-
rich fluids and the limited availability of electron acceptors. The relevance of MOx is thus
comparably small at HMMV. MOx at the centre and in surface sediments of the Pogonophora
site amounts to 3.4*105 mol yr-1 which is about 10-fold lower in comparison to AOM at the
grey mat, Beggiatoa and Pogonophora site.
In conclusion, aerobic and anaerobic methane turnover are very important processes reducing
a substantial fraction of methane efflux at HMMV. Several point sources of mud, fluid, gas
and gas hydrate escape have been detected in the centre of the HMMV (Damm and Budeus,
2003; Sauter et al., submitted). Furthermore, emission of methane via diffusive methane
fluxes from the centre make the HMMV a substantial source of methane (Sauter et al.,
submitted). The total amount of methane emitted from HMMV to the hydrosphere was
preliminarily estimated with ~68*105 mol yr-1 (1.5*105 m3 yr-1, Milkov et al., 2004) and
35*105 to 148*105 mol yr-1 (Sauter et al., submitted). These are in the same order of
magnitude of methane turnover in the sediment (40*105 mol yr-1, 7*10-5 Tg yr-1). Hence, at
least 22 to 55% of the total methane efflux at HMMV is reduced by methanotrophic
organisms. However, this figure is a conservative estimate and potentially higher due to a
most likely elevated in situ methane turnover. Previous estimates of methane turnover at other
active seeps also found that the methanotrophic communities are representing efficient filters
for the greenhouse gas methane, consuming 60-100% of this gas transported with uprising
fluids (Treude et al., 2003). At HMMV, we observed that the chemical composition and
velocity of the fluid flow probably control microbial activity by limiting access to electron
acceptors.
Chapter 4 Aerobic and anaerobic oxidation of methane in sediments of HMMV, Barents Sea
130
Acknowledgements
We thank the officers, crew and shipboard scientific party for support during the R/V Atalante
and R/V Polarstern cruise in 2001 and 2003, respectively. We are especially indebted to the
ROV Victor 6000 team for excellent technical operation and sample retrieval. Viola Beyer,
Imke Busse, and Friderike Heinrich are thanked for their support during sampling. This study
was part of the MUMM (Mikrobielle Umsatzraten von Methan in Gashydrathaltigen
Sedimenten, FN 03G0554A) supported by the Bundesministerium für Bildung und Forschung
(BMBF, Germany). Further Support was provided by the Max Planck Gesellschaft
(Germany).

Chapter 4 Aerobic and anaerobic oxidation of methane in sediments of HMMV, Barents Sea
131
References
Boetius A., Ravenschlag K., Schubert C., Rickert D., Widdel F., Gieseke A., Amann R., Jørgensen B. B., Witte U., and Pfannkuche O. (2000) A marine microbial consortium apparently mediating anaerobic methane of oxidation. Nature 407, 623-626.
Boetius A. and Suess E. (2004) Hydrate Ridge: a natural laboratory for the study of microbial life fueled by methane from near-surface gas hydrates. Chemical Geology 205(3-4),291-310.
Bogdanov Y. A., Sagalevitch A. M., Vogt P. R., Mienert Y., Sundvor E., Krane K., Lein A. Y., Egorov A. V., Pepesypkin V. I., Cherkashev G. A., Gebruk A. V., Ginsburg G. D., and Voitov D. T. (1999) The Haakon Mosby mud volcano in the Norwegian Sea: Results of comprehensive investigations with submersibles. Okeanologiya 39(3), 412-419.
Charlou J. L., Donval J. P., Zitter T., Roy N., Jean-Baptiste P., Foucher J. P., and Woodside J. (2003) Evidence of methane venting and geochemistry of brines on mud volcanoes of the eastern Mediterranean Sea. Deep-Sea Research Part I-Oceanographic Research Papers 50(8), 941-958.
Cordes E. E., Arthur M. A., Shea K., Arvidson R. S., and Fisher C. R. (2005) Modeling the mutualistic interactions between tubeworms and microbial consortia. Plos Biology3(3), 497-506.
Damm E. and Budeus G. (2003) Fate of vent-derived methane in seawater above the Hakon Mosby mud volcano (Norwegian Sea). Marine Chemistry 82(1-2), 1-11.
de Beer D., Sauter E., Niemann H., Witte U., and Boetius A. (submitted) In situ fluxes and zonation of microbial activity in surface sediments of the Håkon Mosby Mud Volcano. Limnology and Oceanography.
Dimitrov L. and Woodside J. (2003) Deep sea pockmark environments in the eastern Mediterranean. Marine Geology 195(1-4), 263-276.
Dimitrov L. I. (2002) Mud volcanoes - the most important pathway for degassing deeply buried sediments. Earth-Science Reviews 59(1-4), 49-76.
Dimitrov L. I. (2003) Mud volcanoes - a significant source of atmospheric methane. Geo-Marine Letters 23(3-4), 155-161.
Egeberg P. K. and Barth T. (1998) Contribution of dissolved organic species to the carbon and energy budgets of hydrate bearing deep sea sediments (Ocean Drilling Program Site 997 Blake Ridge). Chemical Geology 149(1-2), 25-35.
Eldholm O., Sundvor E., Vogt P. R., Hjelstuen B. O., Crane K., Nilsen A. K., and Gladczenko T. P. (1999) SW Barents Sea continental margin heat flow and Hakon Mosby Mud Volcano. Geo-Marine Letters 19(1-2), 29-37.
Fisher C. R. (1990) Chemoautotrophic and Methanotrophic Symbioses in Marine-Invertebrates. Reviews in Aquatic Sciences 2(3-4), 399-436.
Gebruk A. V., Krylova E. M., Lein A. Y., Vinogradov G. M., Anderson E., Pimenov N. V., Cherkashev G. A., and Crane K. (2003) Methane seep community of the Hakon Mosby mud volcano (the Norwegian Sea): composition and trophic aspects. Sarsia88(6), 394-403.
Ginsburg G. D., Milkov A. V., Soloviev V. A., Egorov A. V., Cherkashev G. A., Vogt P. R., Crane K., Lorenson T. D., and Khutorskoy M. D. (1999) Gas hydrate accumulation at the Hakon Mosby Mud Volcano. Geo-Marine Letters 19(1-2), 57-67.
Haese R. R., Meile C., Van Cappellen P., and De Lange G. J. (2003) Carbon geochemistry of cold seeps: Methane fluxes and transformation in sediments from Kazan mud volcano, eastern Mediterranean Sea. Earth and Planetary Science Letters 212(3-4), 361-375.

Chapter 4 Aerobic and anaerobic oxidation of methane in sediments of HMMV, Barents Sea
132
Hallam S. J., Putnam N., Preston C. M., Detter J. C., Rokhsar D., Richardson P. M., and DeLong E. F. (2004) Reverse methanogenesis: Testing the hypothesis with environmental genomics. Science 305(5689), 1457-1462.
Hanson R. S., Bratina B. J., and Brusseau G. A. (1993) Phylogeny and ecology of methylotrophic bacteria. In Microbial Growth on C1 Compounds (ed. J. C. Murrell and D. P. Kelly), pp. 285-302. Intercept Limited.
Hanson R. S. and Hanson T. E. (1996) Methanotrophic bacteria. Microbiological Reviews60(2), 439-&.
Hensen C., Wallmann K., Schmidt M., Ranero C. R., and Suess E. (2004) Fluid expulsion related to mud extrusion off Costa Rica - A window to the subducting slab. Geology32(3), 201-204.
Hensen C., Zabel M., Pfeifer K., Schwenk T., Kasten S., Riedinger N., Schulz H. D., and Boettius A. (2003) Control of sulfate pore-water profiles by sedimentary events and the significance of anaerobic oxidation of methane for the burial of sulfur in marine sediments. Geochimica Et Cosmochimica Acta 67(14), 2631-2647.
Hinrichs K.-U. and Boetius A. (2002) The anaerobic oxidation of methane: New insights in microbial ecology and biogeochemistry. In Ocean Margin Systems (ed. G. Wefer, D. Billett, and D. Hebbeln), pp. 457-477. Springer-Verlag, Berlin.
Hjelstuen B. O., Eldholm O., Faleide J. I., and Vogt P. R. (1999) Regional setting of Hakon Mosby Mud Volcano, SW Barents Sea margin. Geo-Marine Letters 19(1-2), 22-28.
Iversen N. and Jørgensen B. B. (1985) Anaerobic methane oxidation rates at the sulfate-methane transition in marine sediments from Kattegat and Skagerrak (Denmark). Limnology and Oceanography 30(5), 944-955.
Jensen P., Aagaard I., Burke R. A., Dando P. R., Jorgensen N. O., Kuijpers A., Laier T., Ohara S. C. M., and Schmaljohann R. (1992) Bubbling Reefs in the Kattegat - Submarine Landscapes of Carbonate-Cemented Rocks Support a Diverse Ecosystem at Methane Seeps. Marine Ecology-Progress Series 83(2-3), 103-112.
Jørgensen B. B., Weber A., and Zopfi J. (2001) Sulfate reduction and anaerobic methane oxidation in Black Sea sediments. Deep-Sea Research Part I-Oceanographic Research Papers 48(9), 2097-2120.
Joye S. B., Boetius A., Orcutt B. N., Montoya J. P., Schulz H. N., Erickson M. J., and Lugo S. K. (2004) The anaerobic oxidation of methane and sulfate reduction in sediments from Gulf of Mexico cold seeps. Chemical Geology 205(3-4), 219-238.
Kasting J. F. and Siefert J. L. (2002) Life and the evolution of Earth's atmosphere. Science296(5570), 1066-1068.
Klages M., Mesnil B., Soldtwedel T., and Christophe A. (2002) L' expédition "AWI" sur NO L'Atalante en 2001. [The Expedition "AWI" on RV L'Atalante in 2001]. Alfred-Wegener-Institute for Polar and Marine Research.
Klages M., Thiede J., and Foucher J. P. (2004) The Expedition ARKTIS XIX/3 of the Research Vessel POLARSTERN in 2003 Reports of legs 3a, 3b and 3c, pp. 355. Alfred-Wegener-Institute for Polar and Marine Research.
Knittel K., Boetius A., Lemke A., Eilers H., Lochte K., Pfannkuche O., Linke P., and Amann R. (2003) Activity, distribution, and diversity of sulfate reducers and other bacteria in sediments above gas hydrate (Cascadia margin, Oregon). Geomicrobiology Journal20(4), 269-294.
Knittel K., Losekann T., Boetius A., Kort R., and Amann R. (2005) Diversity and distribution of methanotrophic archaea at cold seeps. Applied and Environmental Microbiology71(1), 467-479.
Kopf A. J. (2002) Significance of mud volcanism. Reviews of Geophysics 40(2).

Chapter 4 Aerobic and anaerobic oxidation of methane in sediments of HMMV, Barents Sea
133
Krüger M., Meyerdierks A., Glockner F. O., Amann R., Widdel F., Kube M., Reinhardt R., Kahnt R., Bocher R., Thauer R. K., and Shima S. (2003) A conspicuous nickel protein in microbial mats that oxidize methane anaerobically. Nature 426(6968), 878-881.
Larock P. A., Hyun J. H., and Bennison B. W. (1994) Bacterioplankton Growth and Production at the Louisiana Hydrocarbon Seeps. Geo-Marine Letters 14(2-3), 104-109.
Le Mer J. and Roger P. (2001) Production, oxidation, emission and consumption of methane by soils: A review. European Journal of Soil Biology 37(1), 25-50.
Lein A., Vogt P., Crane K., Egorov A., and Ivanov M. (1999) Chemical and isotopic evidence for the nature of the fluid in CH4-containing sediments of the Hakon Mosby Mud Volcano. Geo-Marine Letters 19(1-2), 76-83.
Lelieveld J., Crutzen P. J., and Dentener F. J. (1998) Changing concentration, lifetime and climate forcing of atmospheric methane. Tellus Series B-Chemical and Physical Meteorology 50(2), 128-150.
Manne A. S. and Richels R. G. (2001) An alternative approach to establishing trade-offs among greenhouse gases. Nature 410(6829), 675-677.
Milkov A. V. (2000) Worldwide distribution of submarine mud volcanoes and associated gas hydrates. Marine Geology 167(1-2), 29-42.
Milkov A. V., Sassen R., Apanasovich T. V., and Dadashev F. G. (2003) Global gas flux from mud volcanoes: A significant source of fossil methane in the atmosphere and the ocean. Geophysical Research Letters 30(2).
Milkov A. V., Vogt P. R., Crane K., Lein A. Y., Sassen R., and Cherkashev G. A. (2004) Geological, geochemical, and microbial processes at the hydrate-bearing Hakon Mosby mud volcano: a review. Chemical Geology 205(3-4), 347-366.
Nauhaus K., Boetius A., Kruger M., and Widdel F. (2002) In vitro demonstration of anaerobic oxidation of methane coupled to sulphate reduction in sediment from a marine gas hydrate area. Environmental Microbiology 4(5), 296-305.
Nauhaus K., Treude T., Boetius A., and Kruger M. (2005) Environmental regulation of the anaerobic oxidation of methane: a comparison of ANME-I and ANME-II communities. Environmental Microbiology 7(1), 98-106.
Niewöhner C., Hensen C., Kasten S., Zabel M., and Schulz H. D. (1998) Deep sulfate reduction completely mediated by anaerobic methane oxidation in sediments of the upwelling area off Namibia. Geochimica et Cosmochimica Acta 62(3), 455-464.
Pedersen T. F. and Price N. B. (1980) The Geochemistry of Iodine and Bromine in Sediments of the Panama Basin. Journal of Marine Research 38(3), 397-411.
Petit J. R., Jouzel J., Raynaud D., Barkov N. I., Barnola J. M., Basile I., Bender M., Chappellaz J., Davis M., Delaygue G., Delmotte M., Kotlyakov V. M., Legrand M., Lipenkov V. Y., Lorius C., Pepin L., Ritz C., Saltzman E., and Stievenard M. (1999) Climate and atmospheric history of the past 420,000 years from the Vostok ice core, Antarctica. Nature 399(6735), 429-436.
Pimenov N., Savvichev A., Rusanov I., Lein A., Egorov A., Gebruk A., Moskalev L., and Vogt P. (1999) Microbial processes of carbon cycle as the base of food chain of Håkon Mosby mud volcano benthic community. Geo-Marine Letters 19, 89-96.
Price N. B. and Calvert S. E. (1977) Contrasting Geochemical Behaviors of Iodine and Bromine in Recent Sediments from Namibian Shelf. Geochimica Et Cosmochimica Acta 41(12), 1769-1775.
Reeburgh W. S. (1996) "Soft spots" in the global methane budget. In Microbial Growth on C1
Compounds (ed. M. E. Lidstrom and F. R. Tabita), pp. 334-342. Kluwer Academic Publishers.
Sauter E., Muyakshin J., Charlou J., Schlüter M., Boetius A., Jerosch K., Damm E., Foucher J. P., and Klages M. (submitted) Methane discharge from a deep-sea submarine mud
Chapter 4 Aerobic and anaerobic oxidation of methane in sediments of HMMV, Barents Sea
134
volcano into the upper water column by gas hydrate-coated methane bubbles. Earthand Planetary Science Letters.
Sauter E. J. and Schlüter M. (2004) GEOCHEMICAL INVESTIGATIONS AT HAAKON MOSBY MUD VOLCANO, WESTERN BARENTS SEA. European Geosciences Union (EGU) General Assembly.
Shilov V. V., Druzhinina N. I., Vasilenko L. V., and Krupskaya V. V. (1999) Stratigraphy of sediments from the Hakon Mosby Mud Volcano Area. Geo-Marine Letters 19(1-2),48-56.
Smirnov R. V. (2000) Two new species of Pogonophora from the arctic mud volcano off northwestern Norway. Sarsia 85(2), 141-150.
Somoza L., Diaz-del-Rio V., Leon R., Ivanov M., Fernandez-Puga M. C., Gardner J. M., Hernandez-Molina F. J., Pinheiro L. M., Rodero J., Lobato A., Maestro A., Vazquez J. T., Medialdea T., and Fernandez-Salas L. M. (2003) Seabed morphology and hydrocarbon seepage in the Gulf of Cadiz mud volcano area: Acoustic imagery, multibeam and ultra-high resolution seismic data. Marine Geology 195(1-4), 153-176.
Treude T., Boetius A., Knittel K., Wallmann K., and Jorgensen B. B. (2003) Anaerobic oxidation of methane above gas hydrates at Hydrate Ridge, NE Pacific Ocean. MarineEcology-Progress Series 264, 1-14.
Trotsenko Y. A. and Khmelenina V. N. (2002) Biology of extremophilic and extremotolerant methanotrophs. Archives of Microbiology 177(2), 123-131.
Valentine D. L. and Reeburgh W. S. (2000) New perspectives on anaerobic methane oxidation. Environmental Microbiology 2(5), 477-484.
Vogt P. R., Cherkashev A., Ginsburg G. D., Ivanov G. I., Crane K., Lein A. Y., Sundvor E., Pimenov N. V., and Egorov A. (1997a) Haakon Mosby mud volcano: A warm methane seep with seafloor hydrates and chemosynthesis-based Ecosystem in late Quantemary Slide Valley, Bear Island Fan, Barents Sea passive margin. EOSTransactions of the American Geophysical Union Supplement 78(17), 187-189.
Vogt P. R., Cherkashev G., Ginsburg G., Ivanov G. I., Milkov A., Crane K., Lein A., Sundvor E., Pimenov N. V., and Egorov A. (1997b) Haakon Mosby Mud Volcano Provides Unusual Example of Venting. EOS Transactions of the American Geophysical Union Supplement 78(48), 549, 556-557.
Vogt P. R., Gardner J., and Crane K. (1999) The Norwegian-Barents-Svalbard (NBS) continental margin: Introducing a natural laboratory of mass wasting, hydrates, and ascent of sediment, pore water, and methane. Geo-Marine Letters 19(1-2), 2-21.
Whiticar M. J. (1999) Carbon and hydrogen isotope systematics of bacterial formation and oxidation of methane. Chemical Geology 161(1-3), 291-314.
Whiticar M. J. (2002) Diagenetic relationships of methanogenesis, nutrients, acoustic turbidity, pockmarks and freshwater seepages in Eckernforde Bay. Marine Geology182(1-2), 29-53.
Widdel F. and Bak F. (1992) The gram negative mesophilic sulfate reducing bacteria. In Theprokaryotes (ed. M. Dworkin). Springer.
Wuebbles D. J. and Hayhoe K. (2002) Atmospheric methane and global change. Earth-Science Reviews 57(3-4), 177-210.
Yamamoto S., Alcauskas J. B., and Crozier T. E. (1976) Solubility of Methane in Distilled Water and Seawater. Journal of Chemical and Engineering Data 21(1), 78-80.

Chapter 5 Microbial methane turnover at mud volcanoes of the Gulf of Cadiz
135
Microbial methane turnover at mud volcanoes of the Gulf of Cadiz
Niemann, H.1,2; Duarte, J.3; Hensen, C.4; Omoregie, E.1,7; Magalhães, V.H.3,5; Elvert, M.6;Pinheiro, L, M.3; Kopf, A. 6; Boetius, A.1,7
1 Max Planck Institute for Marine Microbiology Bremen, Celsiusstr.1, 28359 Bremen, Germany 2 Alfred Wegener Institute for Polar and Marine Research, 27515 Bremerhaven, Germany 3 Geosciences Department, University of Aveiro, Campus de Santiago, 3810-193 Aveiro, Portugal4 Leibniz Institute of Marine Sciences, IfM-GEOMAR, 24148 Kiel, Germany 5 Department National Institute of Engineering, Technology and Innovation, Alfragide, 2720-866 Amadora, Portugal 6 Research Center Ocean Margins, University of Bremen, 28359 Bremen, Germany 7 International University Bremen, 28759 Bremen, Germany
Author to whom correspondence should be addressed:
Helge Niemann email: [email protected], phone +49-421-2028653

Chapter 5 Microbial methane turnover at mud volcanoes of the Gulf of Cadiz
136
ABSTRACT
The Gulf of Cadiz is a tectonically active area of the European continental margin and
characterised by a high abundance of mud volcanoes, diapirs, pockmarks and carbonate
chimneys. During the R/V SONNE expedition “GAP- Gibraltar Arc Processes (SO175)” in
December 2003, several mud volcanoes were explored for gas seepage and associated
microbial methane turnover. Pore water analyses and methane oxidation measurements in
sediment cores recovered from the centres of the mud volcanoes Captain Arutyunov,
Bonjardim, Ginsburg, Gemini and a newly discovered mud volcano like structure called “No
Name” show that thermogenic methane and associated higher hydrocarbons rising from
deeper sediment strata are completely consumed within the seabed. The presence of a distinct
methane-sulphate transition zone (SMT) overlapping with high sulphide concentrations reveal
that methane oxidation is mediated under anaerobic conditions with sulphate as the electron
acceptor. Anaerobic oxidation of methane (AOM) and sulphate reduction (SR) rates show
maxima in distinct subsurface sediment horizons at the SMT. The position of the SMT varied
between mud volcanoes at depths from 20 to 200 cm below sea floor. In comparison to other
fluid flow impacted environments of the world oceans, AOM activity (<383 mmol m-2 yr-1)
and diffusive methane fluxes (<321 mmol m-2 yr-1) in mud volcano sediments of the Gulf of
Cadiz are low to mid range. AOM was generally exceeded by SR, most likely because other
hydrocarbons were oxidized anaerobically by sulphate reducing microbes. Corresponding
lipid biomarker and 16S rDNA clone library analysis give evidence that AOM is mediated by
a mixed community of anaerobic methanotrophic archaea and associated sulphate reducing
bacteria (SRB) in the studied mud volcanoes. Little is known about the variability of methane
fluxes in this environment but the 13C-depleted lipid imprint in carbonate crusts that litter the
sea floor of mud volcanoes in the northern part of the Gulf of Cadiz shows that extensive,
methane-related carbonate precipitation once took place. However, actual sea floor video
Chapter 5 Microbial methane turnover at mud volcanoes of the Gulf of Cadiz
137
observations showed only scarce traces of methane emission and associated biological
processes at the seafloor. No active fluid or free gas escape was observed visually. In
combination wit the observed depletion of methane in subsurface sediments, this indicates
that the contribution of methane to the hydrosphere and potentially to the atmosphere is
insignificant at present.
Chapter 5 Microbial methane turnover at mud volcanoes of the Gulf of Cadiz
138
1. INTRODUCTION
Methane is an aggressive greenhouse gas with a global warming potential that is 21 to 56-fold
higher compared to CO2 (Manne and Richels, 2001; Wuebbles and Hayhoe, 2002). In recent
years, increasing research effort has therefore been dedicated to elucidate sources and sinks of
methane. Anthropogenic sources as well as natural emission from wetlands contribute to the
global flux of methane to the atmosphere by 74% (396 Tg yr-1) (Judd et al., 2002). Recently,
mud volcanism has been identified as an important escape pathway of methane and higher
hydrocarbons (Dimitrov, 2002; Dimitrov, 2003; Judd et al., 2002). Mud volcanism is caused
by various geological processes at continental margins such as tectonic accretion and faulting,
rapid burial of sediments and fluid emissions from mineral dehydration. These processes can
lead to an abnormally high pore fluid pressure and the extrusion of mud and fluids to the
surface which is often accompanied by the expulsion of methane and higher hydrocarbons
(Charlou et al., 2003; Kopf, 2002; Milkov, 2000; Somoza et al., 2003). Mud volcanoes (MVs)
are structurally diverse ranging in shape from amorphous mud pies to conical structures and
in size from a few meters to kilometres in diameter and height, respectively (Dimitrov, 2002).
Global estimates suggest that terrestrial and shallow water mud volcanoes contribute between
2.2 and 6 Tg yr-1 of methane to the atmosphere and that 27 Tg yr-1 of methane may escape
from deep water mud volcanoes (Dimitrov, 2003; Milkov et al., 2003). While there is a
reliable number of ~900 known terrestrial mud volcanoes, estimates for marine mud
volcanoes range between 800 and 100000, which makes any budget calculations very
preliminary (Dimitrov, 2002; Dimitrov, 2003; Milkov, 2000; Milkov et al., 2003). Previous
estimates suggested that the contribution of the worlds oceans to atmospheric methane is
small with 2-3% at present (Houghton et al., 1996; Judd et al., 2002; Kvenvolden, 2002;
Reeburgh, 1996). However, such estimates do not account for locally focused gas seepage
from structures like mud volcanoes and other types of cold seeps.

Chapter 5 Microbial methane turnover at mud volcanoes of the Gulf of Cadiz
139
The main sink for methane in the ocean is the anaerobic oxidation of methane with sulphate
as electron acceptor (Hinrichs and Boetius, 2002; Iversen and Jørgensen, 1985; Nauhaus et
al., 2002; Treude et al., 2003). This process is mediated by archaea, operating most likely in
cooperation with sulphate reducing bacteria. So far, two groups of anaerobic methanotrophic
archaea (ANME-1, ANME-2) have been identified (Boetius et al., 2000; Elvert et al., 1999;
Hinrichs et al., 1999; Michaelis et al., 2002; Orphan et al., 2001b; Pancost et al., 2000; Thiel
et al., 1999). They usually occur together with SRB from a distinct, yet uncultivated cluster
within the Desulfosarcina/Desulfococcus group (Seep-SRB1) (Boetius et al., 2000; Elvert et
al., 1999; Hinrichs et al., 1999; Knittel et al., 2003; Knittel et al., 2005; Michaelis et al., 2002;
Orphan et al., 2001; Pancost et al., 2000; Thiel et al., 1999). Generally, microbial methane
oxidation is characterized by a strong discrimination against the heavy, stable carbon isotope
13C, leading to a significant depletion in the 13C-content of metabolites and biomass (Elvert et
al., 1999; Orphan et al., 2001b; Summons et al., 1994; Thiel et al., 1999; Whiticar, 1999;
Whiticar et al., 1986). Such conspicuous isotope signatures of specific lipid biomarker for the
archaeal and bacterial partners in AOM mediating communities has been a main tool in
studying the diversity and functioning of cold seep ecosystems (Blumenberg et al., 2004;
Elvert et al., 2003; Elvert et al., 2001; Hinrichs et al., 1999; Michaelis et al., 2002; Orphan et
al., 2001b).
During the UNESCO program “Training through Research (TTR)”, numerous mud volcanoes
hosting methane-hydrate were discovered in the Gulf of Cadiz (Gardner, 2001; Kenyon et al.,
2001; Kenyon et al., 2000; Mazurenko et al., 2002; Somoza et al., 2002). However, the
occurrence of methane emission to the hydrosphere and the geochemical and microbiological
activity of these potential seep structures remained unknown. During the SO-175 expedition
“GAP”, we studied several mud volcanoes with the aid of sea-floor video imaging as well as
video-guided sampling of sediments and carbonate crusts. The main focus of this

Chapter 5 Microbial methane turnover at mud volcanoes of the Gulf of Cadiz
140
investigation was to find the hot spots of methane turnover, to estimate the magnitude of
methane consumption in the sediments of several mud volcanoes using ex situ rate
measurements and diffusive flux calculations, as well as to identify the key methanotrophs
using lipid biomarker and 16S rDNA methods.
Chapter 5 Microbial methane turnover at mud volcanoes of the Gulf of Cadiz
141
2. MATERIALS AND METHODS
2.1 Geological Setting
The Gulf of Cadiz is located west of the Gibraltar Arc, between Iberia and the African plate
(Fig. 1). This area has experienced a complex tectonic history with several episodes of
extension, strike-slip and compression related to the closure of the Tethys Ocean, the opening
of the N-Atlantic, and the African-Eurasian convergence since the Cenozoic (Maldonado et
al., 1999). During the Tortonian, a large olistrostome body made of eroded material from the
Betic Cordillera (Spain) and Rif Massif (Morocco) was emplaced west of the Straits of
Gibraltar (Maldonado and Comas, 1992; Somoza et al., 2003). Due to the ongoing
compression, these rapidly deposited sediments dewater intensely and form MVs and fluid
escape structures (Diaz-del-Rio et al., 2003). The Gulf of Cadiz has been intensely surveyed
with geophysical tools, leading to the discovery of the first MVs, mud diapirs and pockmarks
in 1999 (Gardner, 2001; Kenyon et al., 2000; Pinheiro et al., 2003). In addition, an extensive
field of mud volcanoes and diapiric structures covered with carbonate chimneys and crusts
was discovered along or in close proximity of the main channels of the Mediterranean outflow
water (Diaz-del-Rio et al., 2003; Kenyon et al., 2001; Kenyon et al., 2000; Kopf et al., 2004;
Somoza et al., 2003).
In the present study, Captain Arutyunov (Capt. Arutyunov), Bonjardim, Ginsburg, Gemini,
Hesperides and Faro MV and a newly discovered structure termed “No Name”, were
investigated (Fig. 1, Tab. 1). Prior to biogeochemical sampling, the sea floor of selected MVs
was monitored with the video-sled OFOS or with a video-guided multiple-corer (MUC, Tab.
1).
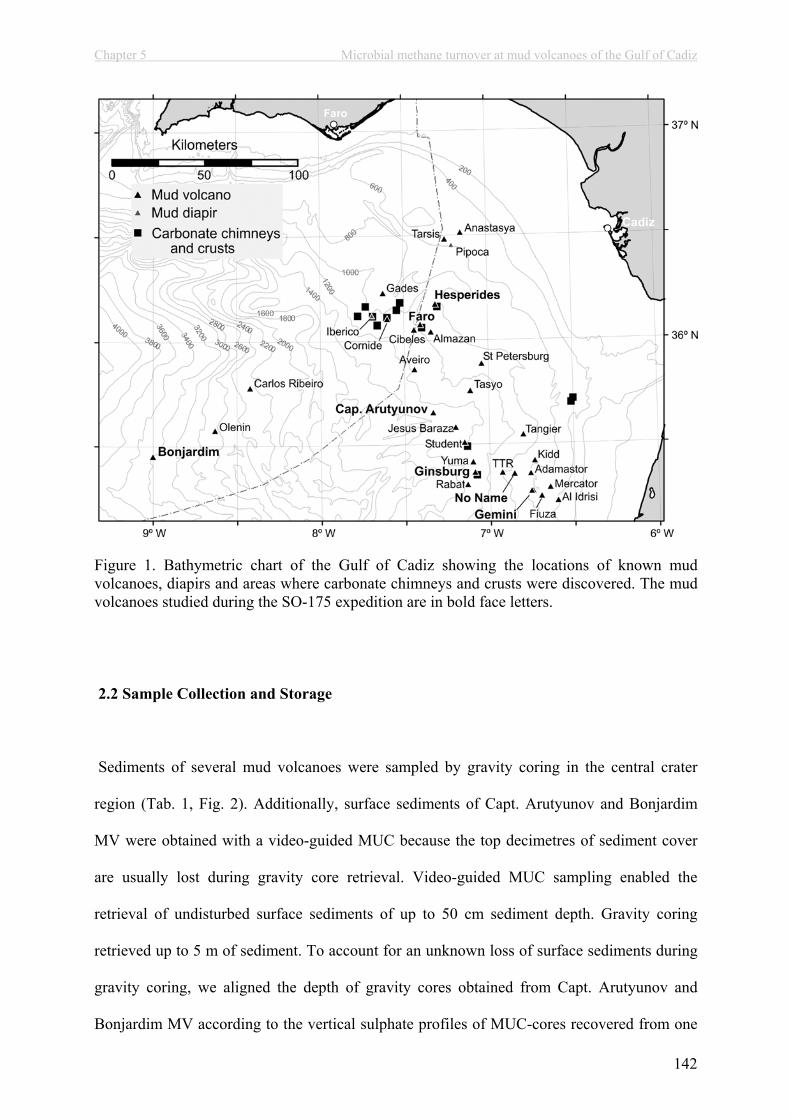
Chapter 5 Microbial methane turnover at mud volcanoes of the Gulf of Cadiz
142
Figure 1. Bathymetric chart of the Gulf of Cadiz showing the locations of known mud volcanoes, diapirs and areas where carbonate chimneys and crusts were discovered. The mud volcanoes studied during the SO-175 expedition are in bold face letters.
2.2 Sample Collection and Storage
Sediments of several mud volcanoes were sampled by gravity coring in the central crater
region (Tab. 1, Fig. 2). Additionally, surface sediments of Capt. Arutyunov and Bonjardim
MV were obtained with a video-guided MUC because the top decimetres of sediment cover
are usually lost during gravity core retrieval. Video-guided MUC sampling enabled the
retrieval of undisturbed surface sediments of up to 50 cm sediment depth. Gravity coring
retrieved up to 5 m of sediment. To account for an unknown loss of surface sediments during
gravity coring, we aligned the depth of gravity cores obtained from Capt. Arutyunov and
Bonjardim MV according to the vertical sulphate profiles of MUC-cores recovered from one

Chapter 5 Microbial methane turnover at mud volcanoes of the Gulf of Cadiz
143
site, assuming that sulphate concentrations are mainly a function of depth in proximate cores.
According to this procedure, the top sediment horizons of the recovered gravity cores were 40
and 12.5 cm below seafloor at Capt. Arutyunov and Bonjardim MV, respectively. Aligning
proximate core sections is an approach to account for a loss of an unknown quantity of
surface sediments during gravity coring. However, this approach can be problematic if spatial
variability of geochemical gradients is high.
Table 1. Mud volcanoes investigated during the cruise SO-175. The water depth refers to the highest elevation of the mud volcanoes. V = video observations, CH4 = methane concentration measurements, SO4
2- = sulphate concentration measurements, C2+ = concentration measurements of higher hydrocarbons, F = diffusive methane and sulphate flux calculation, R, AOM and SR rate measurements, L = Lipid analyses, D = DNA analysis.
Upon recovery, gravity cores were sectioned into 1 m pieces and vertically cut in halves, prior
to sub sampling. All cores were immediately transferred into a cold room and subsampled for
concentration measurements of volatile pore water constituents (methane, sulphate, sulphide),
AOM and SR rate measurements according to Treude et al (2003, 2005), as well as for lipid
biomarker and 16S rDNA analyses (Tab. 1). Sediments for measurements of methane and
sulphate concentrations and turnover rate measurements were subsampled vertically with
push cores (acrylic core liners, 26 mm diameter, n = 3) from MUC-cores. Gravity cores were
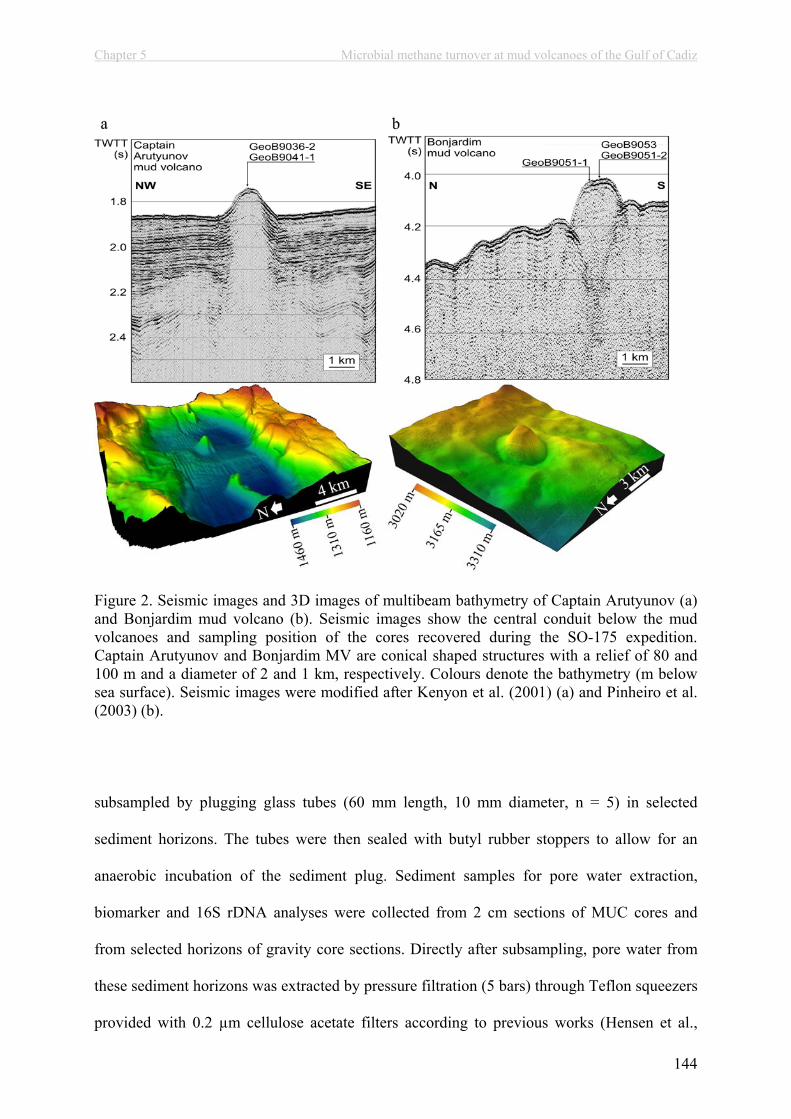
Chapter 5 Microbial methane turnover at mud volcanoes of the Gulf of Cadiz
144
Figure 2. Seismic images and 3D images of multibeam bathymetry of Captain Arutyunov (a) and Bonjardim mud volcano (b). Seismic images show the central conduit below the mud volcanoes and sampling position of the cores recovered during the SO-175 expedition. Captain Arutyunov and Bonjardim MV are conical shaped structures with a relief of 80 and 100 m and a diameter of 2 and 1 km, respectively. Colours denote the bathymetry (m below sea surface). Seismic images were modified after Kenyon et al. (2001) (a) and Pinheiro et al. (2003) (b).
subsampled by plugging glass tubes (60 mm length, 10 mm diameter, n = 5) in selected
sediment horizons. The tubes were then sealed with butyl rubber stoppers to allow for an
anaerobic incubation of the sediment plug. Sediment samples for pore water extraction,
biomarker and 16S rDNA analyses were collected from 2 cm sections of MUC cores and
from selected horizons of gravity core sections. Directly after subsampling, pore water from
these sediment horizons was extracted by pressure filtration (5 bars) through Teflon squeezers
provided with 0.2 µm cellulose acetate filters according to previous works (Hensen et al.,

Chapter 5 Microbial methane turnover at mud volcanoes of the Gulf of Cadiz
145
2003; Niewöhner et al., 1998). Subsequently, the pore water was immediately fixed (see next
section). Lipid and DNA samples were stored in cleaned glass vials at –20°C until extraction
in the home laboratory. Carbonate crusts from Hesperides and Faro MV were collected with a
video guided grab-sampler (Tab.1). Upon recovery, carbonate crusts for lipid biomarker
analyses were transferred into plastic bags and stored at –20°C until extraction.
2.3 Methane Concentrations
Methane concentrations in sediments were determined according to the “head space” method
from 5 ml sediment fixed with 25 ml NaOH (2.5%, w/v) in a diffusion-tight glass vial as
described previously by Treude and co-workers (2003). A vertical resolution of 2 cm was
chosen for MUC cores whereas for gravity cores, a vertical resolution of 20-30 cm was
chosen. Methane concentrations were determined shortly after the cruise (<2 month) using a
gas chromatograph as described elsewhere (Treude et al., 2003). The chromatography system
was calibrated for a concentration range of 0.001 to 5 mM methane (final concentration in the
sediment). Sediment samples from Capt. Arutyunov and Bonjardim MV were additionally
analysed for the concentrations of the higher hydrocarbons (C2+) ethane, propane, isobutene
and butane ( butane) using the above-described chromatography setting with a temperature
gradient. Subsequent to injection at 40°C, the temperature was increased at a rate of 2°C min-1
to 200°C and held for 20 min. Identity and concentrations of methane and C2+-compounds
were determined with standards of known hydrocarbon compositions.
Chapter 5 Microbial methane turnover at mud volcanoes of the Gulf of Cadiz
146
2.4 Sulphate and Sulphide Concentrations
Standard methods were applied for sulphate and sulphide analyses. Sulphide concentrations
were determined immediately after sampling by adding 1 ml of pore water to 50 µl of a zinc
acetate gelatine solution. Sulphide was quantitatively removed as ZnS and kept in colloidal
solution. After adding a colour reagent the concentration was determined photometrically by
measuring the absorbance after 1 hour at 670 nm (see more detailed descriptions at
http://www.geomar.de/zd/labs/labore_umwelt/Analytik.html). Sulphate concentrations were
determined on 2 ml sub-samples of filtered pore water using a Sykom-S ion chromatography
system. Samples were diluted by 1:54 with the eluent (7.5 mM Na2CO3-solution).
2.5 Diffusive Flux Calculations
Local fluxes (J) were calculated from the vertical profiles of pore water constituents
(methane, sulphate, sulphide) according to Fick’s first law of diffusion assuming steady state
conditions (e.g. Niewöhner et al., 1998 and references therein),
xCD-J s (1)
where Ds is the diffusion coefficient in the sediments, the porosity and xC the local
concentration gradient (in cm-4). Ds was determined from the molecular diffusion coefficient
after Boudreau (1997).
20
s )ln(-1D
D (2)
For each mud volcano, D0 values were corrected for temperature (3 to 12°C, depending on the
actual bottom water temperature), resulting in values ranging between 291 to 392, 178 to 244
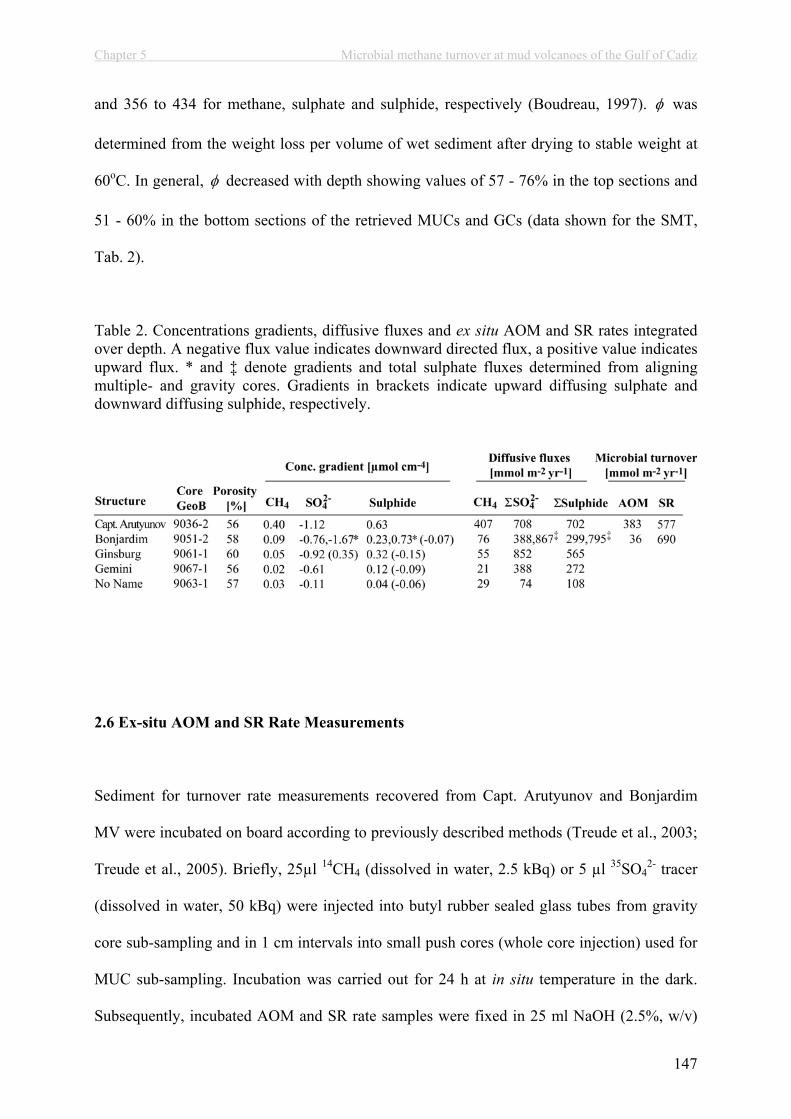
Chapter 5 Microbial methane turnover at mud volcanoes of the Gulf of Cadiz
147
and 356 to 434 for methane, sulphate and sulphide, respectively (Boudreau, 1997). was
determined from the weight loss per volume of wet sediment after drying to stable weight at
60oC. In general, decreased with depth showing values of 57 - 76% in the top sections and
51 - 60% in the bottom sections of the retrieved MUCs and GCs (data shown for the SMT,
Tab. 2).
Table 2. Concentrations gradients, diffusive fluxes and ex situ AOM and SR rates integrated over depth. A negative flux value indicates downward directed flux, a positive value indicates upward flux. * and ‡ denote gradients and total sulphate fluxes determined from aligning multiple- and gravity cores. Gradients in brackets indicate upward diffusing sulphate and downward diffusing sulphide, respectively.
2.6 Ex-situ AOM and SR Rate Measurements
Sediment for turnover rate measurements recovered from Capt. Arutyunov and Bonjardim
MV were incubated on board according to previously described methods (Treude et al., 2003;
Treude et al., 2005). Briefly, 25µl 14CH4 (dissolved in water, 2.5 kBq) or 5 µl 35SO42- tracer
(dissolved in water, 50 kBq) were injected into butyl rubber sealed glass tubes from gravity
core sub-sampling and in 1 cm intervals into small push cores (whole core injection) used for
MUC sub-sampling. Incubation was carried out for 24 h at in situ temperature in the dark.
Subsequently, incubated AOM and SR rate samples were fixed in 25 ml NaOH (2.5%, w/v)

Chapter 5 Microbial methane turnover at mud volcanoes of the Gulf of Cadiz
148
and 25 ml zinc acetate solution (20%, w/v), respectively. Further processing of AOM and SR
rate samples was performed according to Treude et al (2003) and references therein.
Turnover rates were calculated according to the following formulas:
Timeincubat.CHconc.
COCHCOAOM 4
214
414
214
(3)
Timeincubat.SOconc.
STRISOSTRISRR
24
3524
35
35
(4)
Here, 14CO2, 35SO42- and TRI35S are the activities (Bq) of carbon dioxide, sulphate and total
reduced sulphur species, respectively, whereas conc. CH4 and conc. SO42- are the
concentrations of methane and sulphate at the beginning of the incubation. To compare ex situ
microbial rates with the diffusive fluxes of methane and sulphate, AOM and SR rates were
integrated over depth in cores 9036-2 and 9051-2, respectively.
2.7 Extraction of Sediment and Carbonate Samples and Preparation of Derivates
Sediments from Capt. Arutyunov and Bonjardim MV as well as carbonate crusts from
Hesperides and Faro MV were analysed for lipid biomarker signatures. The extraction
procedure and preparation of fatty acid methyl esters (FAMES) was carried out according to
Elvert et al. (2003). Briefly, total lipid extracts (TLE) were obtained from ca. 20 g of wet
sediment and from authigenic carbonates disintegrated with HCL (2M) prior to extraction.
The TLE was extracted by subsequent ultrasonication using organic solvents of decreasing
polarity. Internal standards of known concentration and carbon isotopic compositions were
added prior to extraction. Fatty acid moieties present in glyco and phospholipids were cleaved
by saponification with methanolic KOH-solution. After extraction of the neutral lipid fraction
from this mixture, fatty acids (FAs) were methylated with BF3 in methanol yielding FAMES.
Chapter 5 Microbial methane turnover at mud volcanoes of the Gulf of Cadiz
149
Double bond positions of monoenoic FAs were determined by analysis of dimethyl disulphide
adducts according to methods described elsewhere (Moss and Lambert-Fair, 1989; Nichols et
al., 1986).
Neutral lipids were further separated into hydrocarbons, ketones and alcohols on a SPE silica
glass cartridge (0.5 g packing) with solvents (5 ml each) of increasing polarity (n-
hexane/dichloromethane (95:5, v/v), n-hexane/dichloromethane (2:1, v/v),
dichloromethane/acetone (9:1, v/v)). Alcohols were derivatised with
bis(trimethylsilyl)triflouracetamid (BSTFA) forming trimethylsilyl (TMS) ethers prior to
analyses.
2.8 Gas Chromatography
Concentrations of single lipid compounds were determined by gas chromatography analysis
using a Varian 30 m apolar CP-Sil 8 CB fused silica capillary (0.25 mm internal diameter
[ID], film thickness 0.25 µm) in a Hewlett Packard 6890 Series gas chromatograph equipped
with an on column injector and a flame ionisation detector. Initial Oven temperature was
80°C. Subsequently to injection, the initial temperature was increased to 130°C at a rate of
20°C min-1, then raised to 320°C at a rate of 4°C min and held at 320°C for 30 min. The
carrier was helium at a constant flow of 2 ml min-1 and the detector temperature was set to
310 °C. Concentrations were calculated relative to internal standards present within the
respective lipid fraction.
Chapter 5 Microbial methane turnover at mud volcanoes of the Gulf of Cadiz
150
2.9 Gas Chromatography-Mass Spectrometry (GC-MS), Gas Chromatography-Isotope
Ratio Mass Spectrometry (GC-IRMS)
Identity and stable carbon isotope ratios of individual compounds were determined by GC-
MS and GC-IRMS analysis, respectively. Instrument specifications and operation modes of
the GC-MS and GC-IRMS units were set according to Elvert et al. (2003). Identities of
acquired mass spectra were compared to known standards and published data. Stable isotope
ratios are given in the -notation against Pee Dee Belemite. 13C-values of FAs and alcohols
were corrected for the introduction of additional carbon atoms during derivatisation. Internal
standards were used to monitor precision and reproducibility during measurements. Reported
13C-values have an analytical error of 1‰.
2.10 DNA Extraction and Clone Library Construction
Total community DNA was extracted from sediments (ca. 1 g) collected from the SMT of
Capt. Arutyunov MV (30-40 cm) using the FastDNA spin kit for soil (Q-Biogene, Irvine,
California, USA). Samples were bead-beat in a Fastprep machine (Q-Biogene, Irvine,
California, USA) at speed 4.5 for 30 seconds. All other steps in the DNA extraction procedure
were preformed according to the manufacturer’s recommendations. Almost full-length
archaeal and bacterial 16S rRNA genes were amplified from sediments samples using the
primers 20f (Massana et al., 1997) and Uni1392R (Lane et al., 1985) for archaea and GM3F
(Muyzer et al., 1995) and GM4R (Kane et al., 1993) for bacteria. Polymerase chain reactions
(PCRs) were performed with TaKaRa Ex Taq (TaKaRa, Otsu Japan), using 2.5 U of enzyme,
1X Buffer, 4 mM of MgCl2, 4 mM of each dNTP, 1 µM of each primer and 2 µl of template
in a 50 µl reaction. PCR reactions were preformed in a Mastercycler machine (Eppendorf,

Chapter 5 Microbial methane turnover at mud volcanoes of the Gulf of Cadiz
151
Hamburg, Germany), with the following cycling conditions: 95°C for two minutes, then 30
cycles of 95°C for 30 seconds, 60°C (archaea) or 50°C (bacteria) for 30 seconds and 72°C for
3 minutes, followed by a final incubation step at 72°C for 10 minutes. PCR products were
visualized on an agarose gel, and the 16S band excised. PCR products were purified using the
QIAquick Gel Extraction Kit (Qiagen, Hilden, Germany). Two microliters of purified DNA
were ligated in the pGEM T-Easy vector (Promega, Madison, WI) and transformed into
competent E. coli TOP10 cells (Invitrogen, Carlsbad, CA) according to the manufacturer’s
recommendations. Transformation reactions were plated on LB-agarose plates. Overnight
cultures were prepared from individual colonies picked from these plates using the Montage
Plasmid Miniprep 96 kit (Millipore, Billerica, USA). Purified plasmids were sequenced in one
direction, with either the 958R (archea) or GM1F (bacteria) primers using the BigDye
Terminator v3.0 Cycle Sequencing kit (Applied Biosystems, Foster City, USA). Samples
were sequenced on an Applied Biosystems 3100 Genetic Analyser (Foster City, USA). A total
of 39 archaeal and 47 bacterial clones were partially sequenced (~ 0.5 kb). Using the ARB
software package, the sequences were calculated into existing phylogentic trees by parsimony
without allowing a change in the tree topology. Representative sequences of each cluster were
then fully sequenced (~1.3 kb) and matched against the NCBI data base
(http://www.ncbi.nlm.nih.gov/BLAST). Sequences were submitted to the Genbank database
(http://www.ncbi.nlm.nih.gov/) and are accessible under the following accession numbers:
DQ004661 to DQ004676 and DQ004678 to DQ004680.
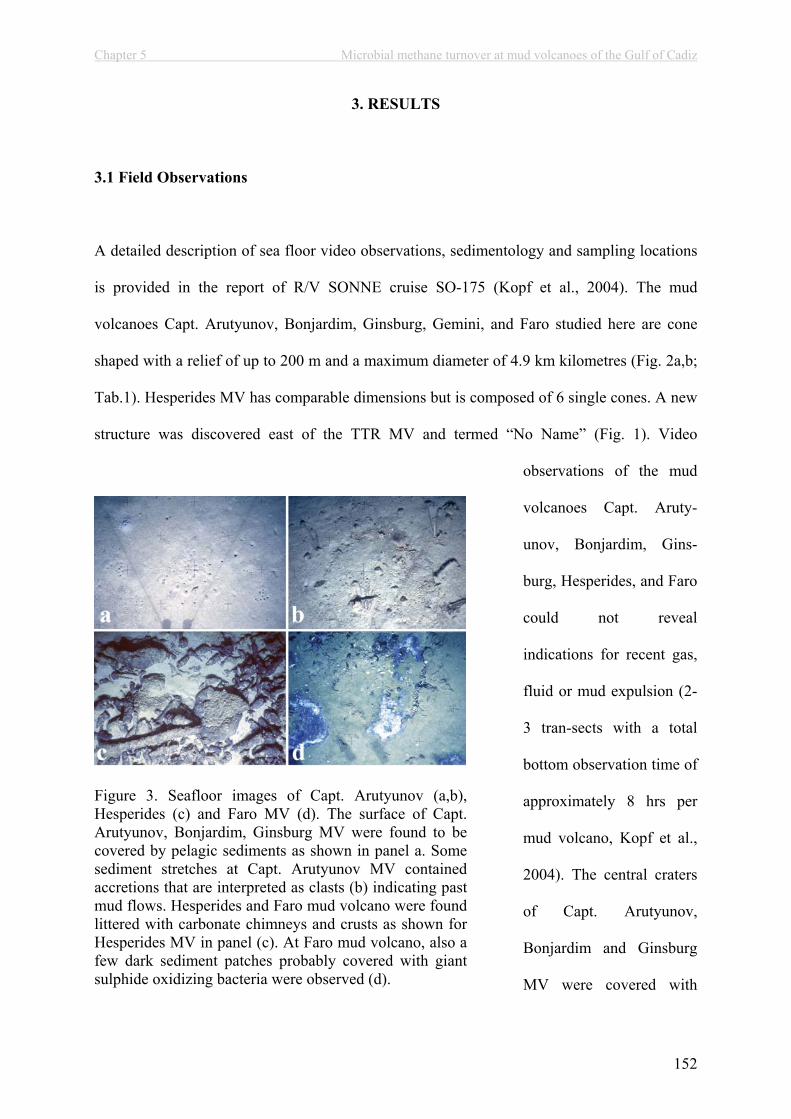
Chapter 5 Microbial methane turnover at mud volcanoes of the Gulf of Cadiz
152
3. RESULTS
3.1 Field Observations
A detailed description of sea floor video observations, sedimentology and sampling locations
is provided in the report of R/V SONNE cruise SO-175 (Kopf et al., 2004). The mud
volcanoes Capt. Arutyunov, Bonjardim, Ginsburg, Gemini, and Faro studied here are cone
shaped with a relief of up to 200 m and a maximum diameter of 4.9 km kilometres (Fig. 2a,b;
Tab.1). Hesperides MV has comparable dimensions but is composed of 6 single cones. A new
structure was discovered east of the TTR MV and termed “No Name” (Fig. 1). Video
observations of the mud
volcanoes Capt. Aruty-
unov, Bonjardim, Gins-
burg, Hesperides, and Faro
could not reveal
indications for recent gas,
fluid or mud expulsion (2-
3 tran-sects with a total
bottom observation time of
approximately 8 hrs per
mud volcano, Kopf et al.,
2004). The central craters
of Capt. Arutyunov,
Bonjardim and Ginsburg
MV were covered with
Figure 3. Seafloor images of Capt. Arutyunov (a,b), Hesperides (c) and Faro MV (d). The surface of Capt. Arutyunov, Bonjardim, Ginsburg MV were found to be covered by pelagic sediments as shown in panel a. Some sediment stretches at Capt. Arutyunov MV contained accretions that are interpreted as clasts (b) indicating past mud flows. Hesperides and Faro mud volcano were found littered with carbonate chimneys and crusts as shown for Hesperides MV in panel (c). At Faro mud volcano, also a few dark sediment patches probably covered with giant sulphide oxidizing bacteria were observed (d).

Chapter 5 Microbial methane turnover at mud volcanoes of the Gulf of Cadiz
153
light beige sediments (shown for Capt. Arutyunov MV, Fig. 3a). At Capt. Arutyunov MV,
some sediment stretches were scattered with accretions, interpreted as clasts, which may
indicate past mud flows (Fig. 3b). At Ginsburg MV, a few small carbonate crusts (<0.5 m)
were observed on the seafloor. Beside these observations, no other distinctive
sedimentological or biological features indicating gas or fluid seepage were visible on video
images at Ginsburg. Surface sediments recovered from Capt. Arutyunov MV contained small
tubeworms (diameter <<1 mm), which extended down to 20 cm into the sediment. Tube
worms usually harbour methane- or sulphide oxidising symbionts, indicating sulphide and/or
methane availability in the sediments (Kimura et al., 2003; Schmaljohann and Flugel, 1987;
Sibuet and Olu, 1998; Southward et al., 1986; Southward et al., 1981). The central areas of
Hesperides and Faro MV were littered with fragments of carbonate chimneys and carbonate
crusts (shown for Hesperides MV, Fig. 3c). Both, chimneys and crusts were ranging in size
from several centimetres to meters in length and diameter. At Faro MV, a few, small patches
covered with microbial mats possibly consisting of filamentous sulphide oxidising bacteria
were observed (Fig. 3d). Moreover, grab samples recovered from this MV also contained a
few specimens of the chemosynthetic clam Acharax sp. usually harbouring sulphide oxidising
bacteria in their gills (Felbeck, 1983; Krueger and Cavanaugh, 1997; Peek et al., 1998; Sibuet
and Olu, 1998). Video observations were not carried out at Gemini MV and the “No Name”
structure. The MUC-cores retrieved from Capt. Arutyunov and Bonjardim MV contained
yellowish, muddy sediments in the top sections at 0-20 and 0-40 cm below sea floor (bsf),
respectively. The bottom sections of the MUC-cores contained mud breccia. The gravity cores
retrieved from these MVs as well as those retrieved from Ginsburg and Gemini also contained
mud breccia. In contrast to the MUC-cores recovered from Capt. Arutyunov and Bonjardim
MV, the mud breccia in all of the retrieved gravity cores was only covered by a thin layer
(max. 10 cm) of yellowish mud. This directly indicates a loss of the beige surface sediments
during sediment sampling and core retrieval. The gravity core recovered from the “No Name”
Chapter 5 Microbial methane turnover at mud volcanoes of the Gulf of Cadiz
154
structure contained a matrix of cold water coral fragments and greyish mud. It has to be
further investigated if this structure is a mud volcano or a mud diapir. Grab samples from
Hesperides and Faro MV contained carbonate fragments and mud breccia. After recovery, the
temperature in the top sediment section (~1 m) at Bonjardim MV was ca. 3°C. In contrast, the
temperature was considerably higher at Capt. Arutyunov (12°C), Ginsburg MV, Gemini MV
and the “No Name” structure (10°C, respectively) most probably as a result of the warm
Mediterranean outflow water, which contributes to the bottom water at these MVs.
3.2 Captain Arutyunov Mud Volcano
3.2.1 Methane, C2+, Sulphate and Sulphide
Methane concentrations in surface sediments (0-20 cm, Fig. 4a) were <0.001 mM indicating a
complete consumption of methane rising from deeper sediment strata. A distinct SMT was
observed in the lower half of the MUC-core section (25 - 40 cm bsf.). The steepest gradients
of methane and sulphate amounted to 0.4 and –1.12 µmol cm-4, respectively (Fig. 4a, Tab. 2).
Small gas hydrate chips were found throughout the whole gravity core section from 44 to 235
cm bsf (1941-1). Probably, gas hydrates were also present in the lower section of the MUC-
core (9036-2) but dissociated upon core recovery and sediment subsampling. Similar to
methane, concentrations of C2+-compounds decreased across the SMT (Fig. 4b).
Hydrocarbons in the sediment porewaters comprised methane (> 99%), ethane (<0.4%),
propane (<0.07%) with trace amounts of butane and isobutene present. Sulphide
concentrations peaked in the SMT with 4.8 mM at 39 cm bsf (Fig. 4d). The steepest sulphide
gradient was 0.63 µmol cm-4 (Fig. 4d, Tab. 2). A downward sulphide gradient could not be

Chapter 5 Microbial methane turnover at mud volcanoes of the Gulf of Cadiz
155
Figu
re 4
. Cap
tain
Aru
tyun
ov m
ud v
olca
no. A
dis
tinct
SM
T, h
ighl
ight
ed i
n gr
ey, w
as f
ound
bet
wee
n 25
and
40
cm b
sf (
a). A
t th
is h
oriz
on,
conc
entra
tions
of
high
er h
ydro
carb
ons
also
dec
line
(b).
Not
e th
at A
OM
and
SR
rat
es (
c), s
ulph
ide
conc
entra
tions
(d)
, con
cent
ratio
ns (
e) a
nd
stab
le c
arbo
n is
otop
e va
lues
of d
iagn
ostic
, bac
teria
l fat
ty a
cids
(f) a
nd c
once
ntra
tions
of i
sopr
enoi
dal d
ieth
ers
(g) a
ll pe
ak a
t the
SM
T. P
anel
(a)
and
(d)
illus
trate
ste
epes
t gra
dien
ts d
eter
min
ed f
or m
etha
ne, s
ulph
ate
and
sulp
hide
(bo
ld li
nes)
. Circ
les
repr
esen
t mul
tiple
cor
er a
nd tr
iang
les
grav
ity c
orer
sam
ples
. Err
ors a
re g
iven
as s
tand
ard
erro
rs.
Chapter 5 Microbial methane turnover at mud volcanoes of the Gulf of Cadiz
156
determined because highest sulphide concentrations were observed in the lowest sediment
horizon of the MUC-core at Capt. Arutyunov MV. Unfortunately, the sulphide profile could
not be aligned continuously with the gravity core section.
3.2.2 AOM, SR Rates and Diffusive Fluxes
AOM and SR rates at Capt. Arutyunov MV were highest in the SMT at 39 cm bsf with
maximum values of 11 and 25 nmol cm-3 d-1, respectively (Fig. 4c). AOM and SR rates
sharply decreased above and below this horizon. A 1.8-fold higher areal SR compared to
AOM indicates an additional electron donor fuelling sulphate reduction (Tab. 2). The areal
AOM and SR rate were in good agreement with diffusive fluxes showing a 1.7-fold higher
sulphate flux compared to the methane flux. The sulphide flux to the surface (upward flux)
was comparable to the total downward flux of sulphate (Tab. 2).
3.2.3 Lipid Biomarker
Diagnostic archaeal and bacterial lipid concentrations were strongly increased in sediments at
the SMT (Fig. 4c,e). At this horizon (-31 cm), stable carbon isotope analysis revealed highest
depletion in 13C with minimum values of –92‰ (sn2-hydroxyarchaeol) in archaeal specific
diether lipids and –82‰ (cyC17:0 5,6) in bacterial specific FAs (Tab. 3, Fig. 4d,e). The
concentration of both archaeal and bacterial lipids decreased just above and below this
sediment horizon. At the SMT, the ratio of sn2-hydroxyarchaeol relative to archaeol was 1.6:1
(Tab. 3). Other diagnostic, archaeal isoprenoidal hydrocarbons such as 2,6,11,15-
tetramethylhexadecane (crocetane) could not be measured due to an unresolved complex
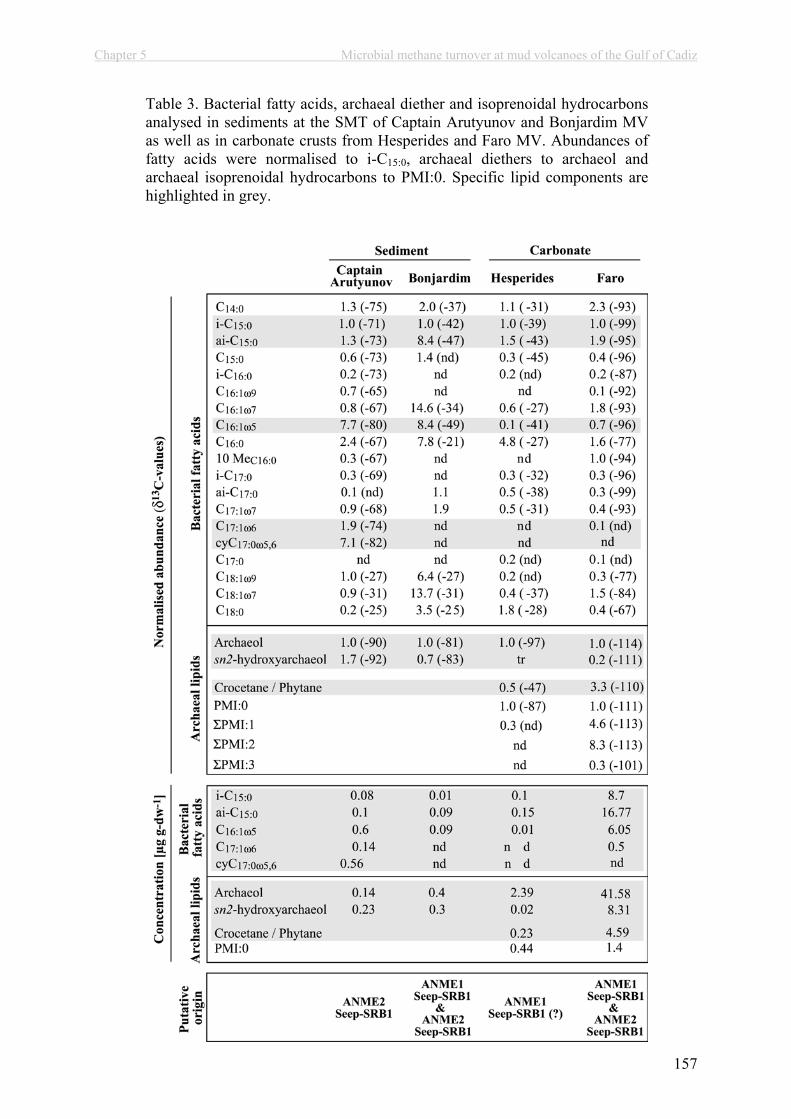
Chapter 5 Microbial methane turnover at mud volcanoes of the Gulf of Cadiz
157
Table 3. Bacterial fatty acids, archaeal diether and isoprenoidal hydrocarbons analysed in sediments at the SMT of Captain Arutyunov and Bonjardim MV as well as in carbonate crusts from Hesperides and Faro MV. Abundances of fatty acids were normalised to i-C15:0, archaeal diethers to archaeol and archaeal isoprenoidal hydrocarbons to PMI:0. Specific lipid components are highlighted in grey.

Chapter 5 Microbial methane turnover at mud volcanoes of the Gulf of Cadiz
158
mixture in all of the hydrocarbon fractions. Similarly, specific archaeal diethers and bacterial
FAs could not be resolved from this background below 40 cm sediment depth. The
concentrations of diagnostic archaeal lipids were roughly one order of magnitude lower in
comparison to specific bacterial FAs.
The FA fraction in sediments at the SMT was dominated by C16:1 5 and cyC17:0 5,6 and
contained comparably high amounts of FA C17:1 6 (Tab. 3). Both, C16:1 5 and cyC17:0 5,6 were
the most 13C-depleted FAs. However, all other FAs in the C14 to C17 range carried
significantly 13C-depleted isotope signatures as well with values ranging between -65‰
(C16:1 9) to –75‰ (C14:0). C18-FAs were comparably enriched in 13C as shown by 13C -
values ranging between -25‰ (C18:0) to -31‰ (C18:1 7) most likely indicating a planktonic
origin of these compounds. Concentrations of mono- and di-alkyl glycerol ethers (MAGEs
and DAGEs, respectively) presumably of bacterial origin were low in all samples recovered
during cruise SO-175. Thus, a detailed analysis of these compounds was not carried out.
However, sediments at the SMT of Capt. Arutyunov Mud Volcano comprised comparably
high contents of MAGEs relative to DAGES with 13C values ranging from –65‰ to -85‰
(data not shown). The MAGEs comprised a suite of alkyl moieties, which is comparable to
those of the fatty acids found at Capt. Arutyunov MV. The suite of fatty acids extracted from
the tube worms comprised dominant amounts of the FAs C16:1 7 and C18:1 7 and to a lesser
degree C16:0 and C18:0 with uniform 13C-values of about -40‰, indicating chemoautotrophic
carbon fixation (data not shown). The alcohol and hydrocarbon fractions were not analysed.

Chapter 5 Microbial methane turnover at mud volcanoes of the Gulf of Cadiz
159
3.2.4 Phylogenetic Diversity
Two clone libraries, one archaeal and one bacterial, were constructed to study the 16S rDNA-
based microbial diversity in sediments at the SMT of Capt. Arutyunov MV (30-40 cm bsf).
The 16S rDNA archaeal clone library consisted of 9 phylogenetic groups (Tab. 4). Closest
relatives of these groups were found among seep-endemic, uncultured archaea and bacteria.
The majority of sequences obtained were related to the ANME-2 group (59% ANME-2a, 3%
ANME-2c of all archaeal sequences) which is known to mediate AOM (Boetius et al., 2000;
Knittel et al., 2005; Orphan et al., 2002). The second most abundant group (18% of all
archaeal sequences) was found to belong to the ANME-1 cluster which is also known to
mediate AOM (Hinrichs et al., 1999; Michaelis et al., 2002; Orphan et al., 2002). The
bacterial clone library consisted of 10 uncultivated bacterial lineages. Similar to the archaeal
Table 4. Archaeal and bacterial 16S rDNA clone libraries obtained from sediments of the SMT of Captain Arutyunov MV. The Archaeal clone library is dominated by sequences belonging to the ANME-2 cluster and the bacterial library by sequences belonging to the Seep-SRB1 cluster.
Chapter 5 Microbial methane turnover at mud volcanoes of the Gulf of Cadiz
160
sequences, the next relatives of all bacterial 16S rDNA sequences belonged to uncultivated
organisms that are commonly found at methane seeps (Knittel et al., 2003, Tab. 4). The
closest relatives of the most abundant cluster of sequences (81%) belonged to the Seep-SRB1
group which comprises the bacterial partners of ANME-1 and ANME-2 (Knittel et al., 2003).
Other phylogenetic groups of bacteria were represented by single clone sequences (<2%).
3.3 Bonjardim MV
3.3.1 Methane, C2+, Sulphate and Sulphide
A distinct SMT was observed in the top meter of the gravity core section. After alignment
with the MUC-core section, the actual depth of the SMT was determined between 45 and 70
cm bsf (Fig. 5a). As the two core sections overlap, the concentration gradients can be
determined from the gravity core section alone or from aligned profiles in the overlapping
zone (Fig. 5a,d). Here, we used both approaches in order to investigate the potential range for
the diffusive fluxes. The steepest methane and sulphate gradients in the gravity core section
were determined with 0.09 and –0.76 µmol cm-4, respectively (Fig. 5a, Tab. 2). Aligning the
gravity core and MUC-core sections, the steepest sulphate gradient was –1.67 µmol cm-4.
Methane concentrations declined below the depth at which the two core sections overlap.
Hence, no concentration gradient from core alignments was possible. Methane concentrations
in surface sediments (0 – 52 cm sediment depth) were <0.001 mM indicating a complete
consumption of methane in the SMT. C2+-concentrations were comparably high with values
of >0.25 mM at a sediment depth below 1 m (Fig. 5b). Similar to methane, concentrations of
C2+-compounds decreased across the SMT (Fig. 5b) indicating a consumption of these
compounds. Gaseous hydrocarbons comprised methane (>81%), ethane (<14%), propane
Chapter 5 Microbial methane turnover at mud volcanoes of the Gulf of Cadiz
161
(<4.5%) and butane (<0.4%). Sulphide concentrations peaked in the SMT with 5.3 mM at
52.5 cm bsf (Fig. 5d). In the gravity core section, the steepest sulphide gradients were
determined with 0.23 (upward) and –0.07 (downward) µmol cm-4, respectively (Tab. 2).
Aligning the two core sections, the steepest (upward) sulphide gradient was determined with
0.73 µmol cm-4.
3.3.2 AOM, SR Rates and Diffusive Fluxes
AOM and SR rates were highest in the SMT at 58 cm bsf with maximum values of 2.6 and
15.4 nmol cm-3 d-1, respectively. Comparably low values of AOM and SR rates were
measured in over- and underlying sediment horizons. A 19.3-fold higher areal SR compared
to AOM indicates a decoupling of these two processes (Tab. 2). Considering both
concentration gradients (determined from unaligned and aligned profiles), the diffusive
downward flux of sulphate was 5.1- to 11-fold higher compared to the upward methane flux.
Similarly, the cumulative sulphide flux (upward and downward) accounted for 77% to 92% of
the sulphate flux.
3.3.3 Lipid Biomarker
A moderate increase of diagnostic archaeal and bacterial lipid concentrations was observed at
the SMT in sediments of Bonjardim MV (Fig. 5c,e). At this horizon (-57 cm), stable carbon
isotope analysis revealed highest depletions in 13C with minimum values of –83‰ (sn2-
hydroxyarchaeol) in archaeal diether lipids and –49‰ (C16:1 5) in bacterial FAs (Tab. 3, Fig.
5d,e). At the SMT, the ratio of sn2-hydroxyarchaeol relative to archaeol was 0.7:1 and
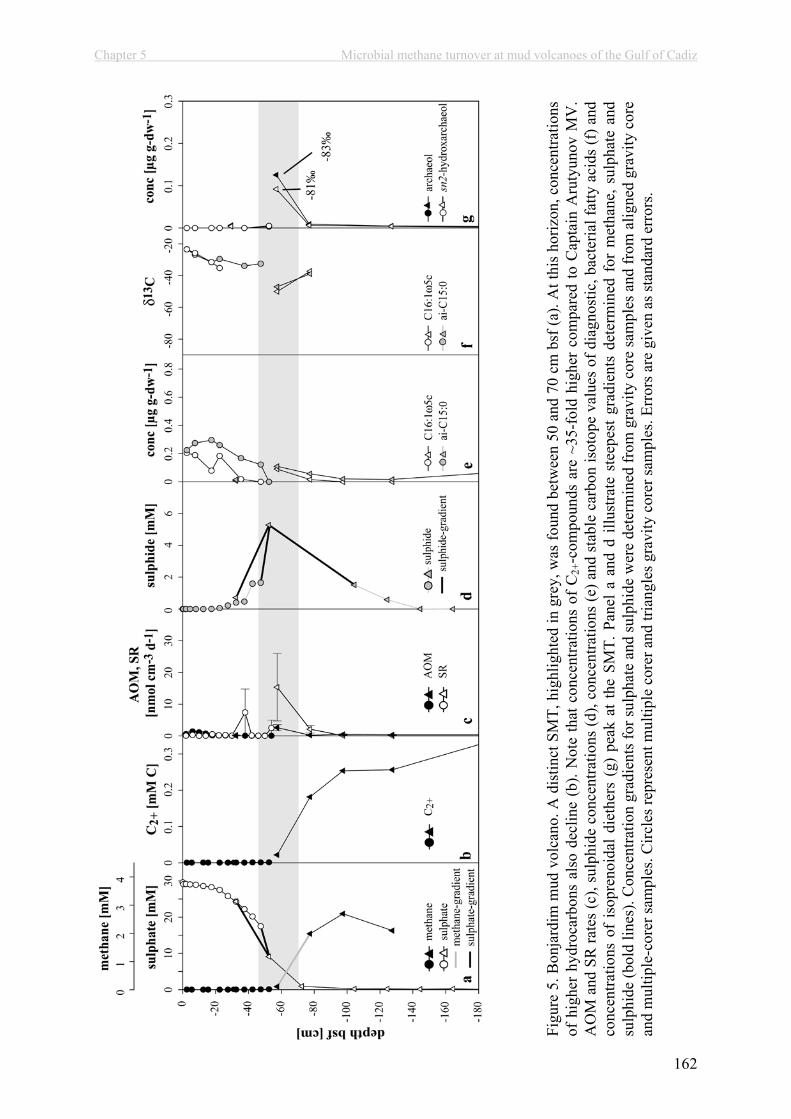
Chapter 5 Microbial methane turnover at mud volcanoes of the Gulf of Cadiz
162
Figu
re 5
. Bon
jard
im m
ud v
olca
no. A
dis
tinct
SM
T, h
ighl
ight
ed in
gre
y, w
as fo
und
betw
een
50 a
nd 7
0 cm
bsf
(a).
At t
his
horiz
on, c
once
ntra
tions
of h
ighe
r hy
droc
arbo
ns a
lso
decl
ine
(b).
Not
e th
at c
once
ntra
tions
of
C2+
-com
poun
ds a
re ~
35-f
old
high
er c
ompa
red
to C
apta
in A
ruty
unov
MV
. A
OM
and
SR
rate
s (c
), su
lphi
de c
once
ntra
tions
(d),
conc
entra
tions
(e) a
nd s
tabl
e ca
rbon
isot
ope
valu
es o
f dia
gnos
tic, b
acte
rial f
atty
aci
ds (f
) and
co
ncen
tratio
ns o
f is
opre
noid
al d
ieth
ers
(g)
peak
at t
he S
MT.
Pan
el a
and
d il
lust
rate
ste
epes
t gra
dien
ts d
eter
min
ed f
or m
etha
ne, s
ulph
ate
and
sulp
hide
(bol
d lin
es).
Con
cent
ratio
n gr
adie
nts f
or su
lpha
te a
nd su
lphi
de w
ere
dete
rmin
ed fr
om g
ravi
ty c
ore
sam
ples
and
from
alig
ned
grav
ity c
ore
and
mul
tiple
-cor
er sa
mpl
es. C
ircle
s rep
rese
nt m
ultip
le c
orer
and
tria
ngle
s gra
vity
cor
er sa
mpl
es. E
rror
s are
giv
en a
s sta
ndar
d er
rors
.
Chapter 5 Microbial methane turnover at mud volcanoes of the Gulf of Cadiz
163
therefore lower in comparison to Capt. Arutyunov MV (Tab. 3). Similar to Capt. Arutyunov
MV, other diagnostic archaeal isoprenoidal hydrocarbons could not be measured due to a high
background from an unresolved complex mixture of hydrocarbons. Equally high amounts of
the FAs C16:1 5 and ai-C15:0, both of which were the most 13C-depleted FAs (Tab. 3), were
detected in sediments at the SMT. The FA cyC17:0 5,6, which was abundant at Capt.
Arutyunov MV could not be detected in sediments of Bonjardim MV. Furthermore, dominant
FAs such as C16:1 7, C16:0, C18:1 9 and C18:1 7 carried 13C-signatures -34‰, indicating that
these compounds are derived from processes other than AOM. In contrast to Capt.
Arutyunov MV, the concentrations of diagnostic archaeal lipids were roughly 4-fold higher
compared to specific bacterial FAs (Tab. 3). A further analysis of the diversity of microbial
organism using 16S rDNA methods was not carried out at Bonjardim MV.
3.4 Ginsburg MV, Gemini MV and “No Name”
3.4.1 Methane, Sulphate and Sulphide
The SMT was located in the upper metre of the sediment cores retrieved from Ginsburg and
Gemini MV and at 2-3 m bsf at the “No Name” structure, respectively (Fig. 6a, c, e). Methane
concentrations in sediments overlying the SMT at these structures were <0.001 mM.
Sediments retrieved from Ginsburg MV had a distinct smell of petroleum with depth below
40 cm. No depth corrections were made as only gravity cores were taken from these MVs.
Chapter 5 Microbial methane turnover at mud volcanoes of the Gulf of Cadiz
164
The actual depth of the SMTs was therefore most likely 10 to 40 cm below the sediment
depth indicated in figure 6. In contrast to the observed depletion of sulphate below the SMT at
Gemini MV and the “No Name” structure, sulphate concentrations showed a minimum
between 30 to 70 cm and an increase to values 17 mM with depth below 90 cm at Ginsburg
MV. The total, diffusive sulphate flux was therefore calculated from both, the upward and the
downward gradients at Ginsburg MV. At Ginsburg MV, Gemini MV and the “No Name”
structure, methane and downward sulphate gradients ranged from 0.02 to 0.05 and –0.11 to -
0.92 µmol cm-4, respectively (Tab. 2). The upward sulphate gradient at Ginsburg MV was
0.35 µmol cm-4. Sulphide concentrations peaked in the SMT with values between 4.7 to 7.6
mM and steepest gradients were determined with values between 0.04 to 0.32 (upward) and –
0.06 to –0.15 (downward) µmol cm-4, respectively (Tab. 2).
3.4.2 Diffusive Fluxes
The diffusive sulphate flux at Ginsburg MV, Gemini MV and the “No Name” structure
exceeded the methane fluxes with 15.5-, 18.5- and 2.5-fold, respectively. This gives
evidence for a decoupling of AOM and SR at these structures similar to the observations
made at Bonjardim MV (Tab. 2). The cumulative (upward + downward) sulphide flux
accounted for 66, 70 and 146% of the sulphate fluxes at Ginsburg MV, Gemini MV and the
“No Name” structure, respectively. The composition of the microbial community was not
investigated here.
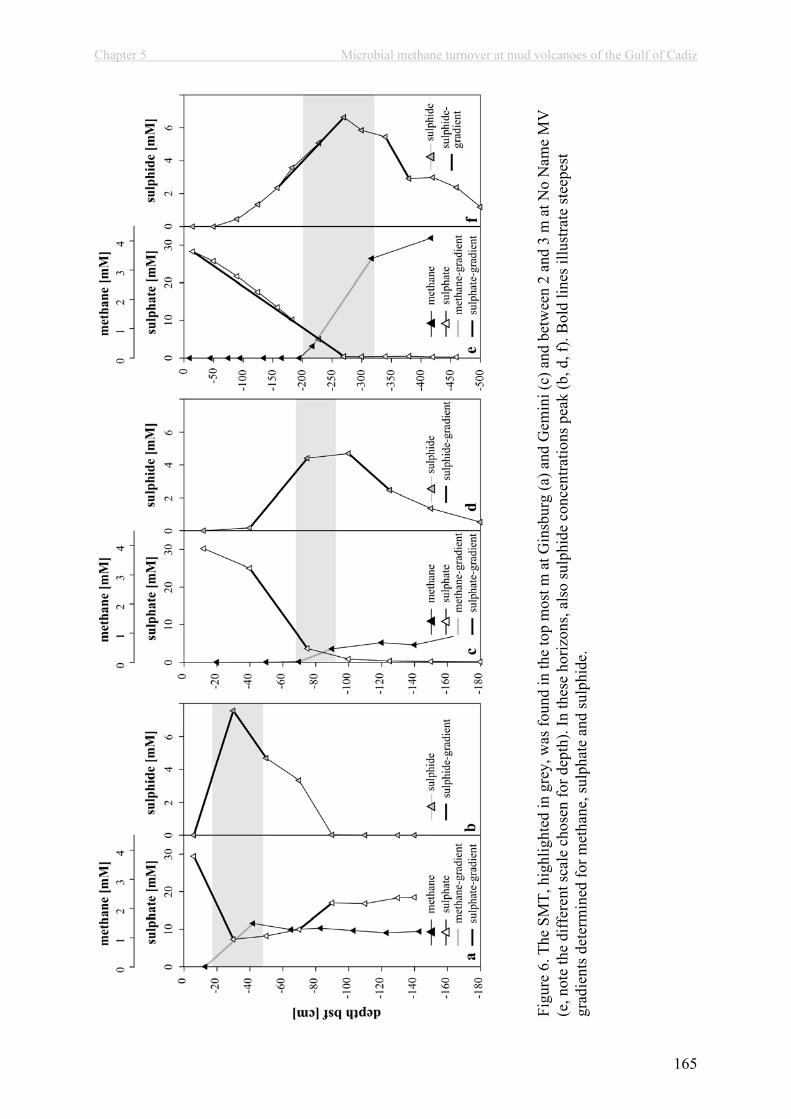
Chapter 5 Microbial methane turnover at mud volcanoes of the Gulf of Cadiz
165
Figu
re 6
. The
SM
T, h
ighl
ight
ed in
gre
y, w
as fo
und
in th
e to
p m
ost m
at G
insb
urg
(a) a
nd G
emin
i (c)
and
bet
wee
n 2
and
3 m
at N
o N
ame
MV
(e
, not
e th
e di
ffer
ent s
cale
cho
sen
for d
epth
). In
thes
e ho
rizon
s, al
so su
lphi
de c
once
ntra
tions
pea
k (b
, d, f
). B
old
lines
illu
stra
te st
eepe
st
grad
ient
s det
erm
ined
for m
etha
ne, s
ulph
ate
and
sulp
hide
.
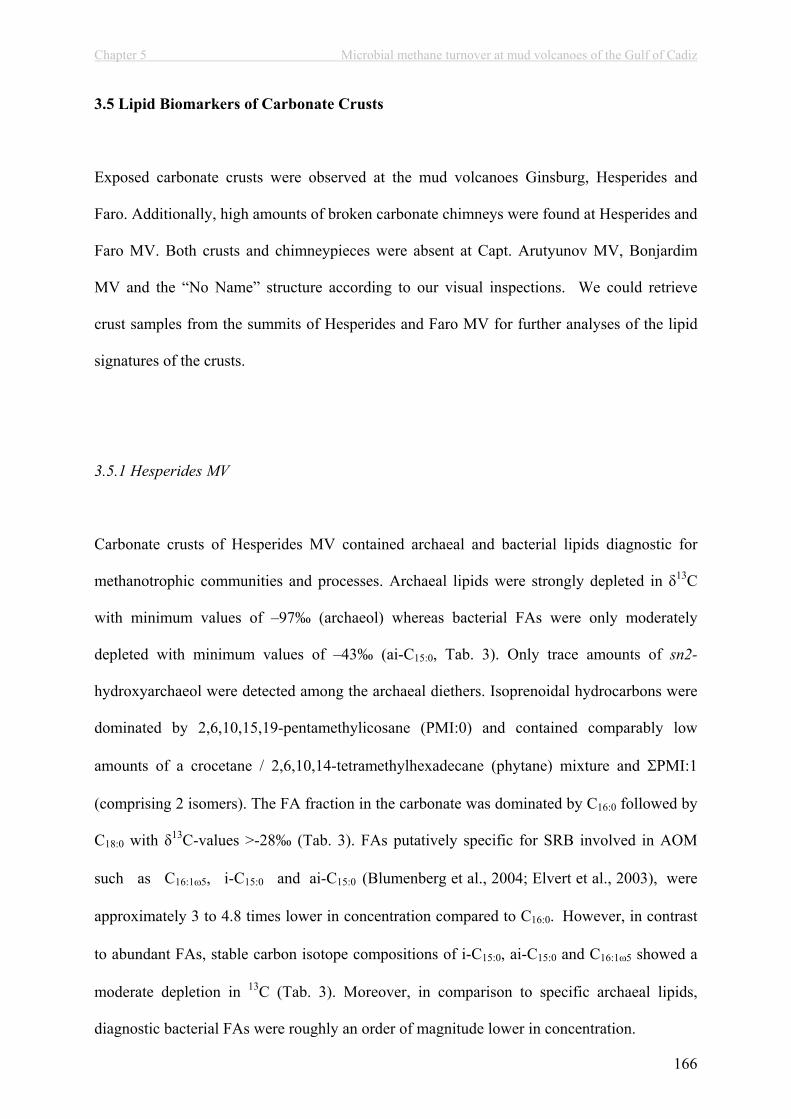
Chapter 5 Microbial methane turnover at mud volcanoes of the Gulf of Cadiz
166
3.5 Lipid Biomarkers of Carbonate Crusts
Exposed carbonate crusts were observed at the mud volcanoes Ginsburg, Hesperides and
Faro. Additionally, high amounts of broken carbonate chimneys were found at Hesperides and
Faro MV. Both crusts and chimneypieces were absent at Capt. Arutyunov MV, Bonjardim
MV and the “No Name” structure according to our visual inspections. We could retrieve
crust samples from the summits of Hesperides and Faro MV for further analyses of the lipid
signatures of the crusts.
3.5.1 Hesperides MV
Carbonate crusts of Hesperides MV contained archaeal and bacterial lipids diagnostic for
methanotrophic communities and processes. Archaeal lipids were strongly depleted in 13C
with minimum values of –97‰ (archaeol) whereas bacterial FAs were only moderately
depleted with minimum values of –43‰ (ai-C15:0, Tab. 3). Only trace amounts of sn2-
hydroxyarchaeol were detected among the archaeal diethers. Isoprenoidal hydrocarbons were
dominated by 2,6,10,15,19-pentamethylicosane (PMI:0) and contained comparably low
amounts of a crocetane / 2,6,10,14-tetramethylhexadecane (phytane) mixture and PMI:1
(comprising 2 isomers). The FA fraction in the carbonate was dominated by C16:0 followed by
C18:0 with 13C-values >-28‰ (Tab. 3). FAs putatively specific for SRB involved in AOM
such as C16:1 5, i-C15:0 and ai-C15:0 (Blumenberg et al., 2004; Elvert et al., 2003), were
approximately 3 to 4.8 times lower in concentration compared to C16:0. However, in contrast
to abundant FAs, stable carbon isotope compositions of i-C15:0, ai-C15:0 and C16:1 5 showed a
moderate depletion in 13C (Tab. 3). Moreover, in comparison to specific archaeal lipids,
diagnostic bacterial FAs were roughly an order of magnitude lower in concentration.
Chapter 5 Microbial methane turnover at mud volcanoes of the Gulf of Cadiz
167
3.5.2 Faro MV
All archaeal and bacterial lipids found in carbonate crusts of Faro MV were strongly depleted
in 13C (Tab. 3). Stable carbon isotope analysis revealed minimum 13C values of –114‰
(archaeol) in diagnostic archaeal diether lipids and –99‰ (i-C15:0) in specific bacterial FAs
(Tab. 3). Archaeal diether lipids were dominated by archaeol and contained comparably low
amounts of sn2-hydroxyarchaeol. Isoprenoidal hydrocarbons were dominated by PMI:2 (9
isomers) followed by PMI:1 (2 isomers) and relatively high amounts of crocetane/phytane.
Specific FAs showed comparably small differences in abundance and 13C-values (Tab. 3).
However, ai-C15:0 was the most dominant FA with a roughly 2-fold higher concentration
compared to i-C15:0 and C16:1 5. The FA cyC17:0 5,6 was not detected. Concentrations of
specific FAs were comparable to specific archaeal lipids.
Chapter 5 Microbial methane turnover at mud volcanoes of the Gulf of Cadiz
168
4. DISCUSSION
4.1 Methane-Driven Geochemical and Biological Activity at the Mud Volcanoes of the
Gulf of Cadiz
Marine mud volcanoes have been identified as an important escape pathway of reduced
hydrocarbon gases and may therefore contribute significantly to atmospheric green house
gases (Dimitrov, 2002; Dimitrov, 2003; Judd et al., 2002; Kopf, 2002). Methane venting at
such cold seeps provides an energy source for methanotrophic microbes which in turn may
support enormous biomasses of seep-related macrofauna and thiotrophic, giant bacteria
(Boetius and Suess, 2004; Cordes et al., 2005; Milkov et al., 2004; Olu et al., 1997; Sahling et
al., 2002; Werne et al., 2002). Furthermore, methane venting is often associated with
authigenic carbonates (Aloisi et al., 2000; Hensen et al., 2004; Kopf, 2002). The Gulf of
Cadiz is characterised by numerous mud volcanoes which have been intensely surveyed since
their discovery in 1999 (Kenyon et al., 2001; Kenyon et al., 2000; Pinheiro et al., 2003;
Somoza et al., 2002). Among the findings indicative of past and present methane venting at
several mud volcanoes are the occurrence of hydrate-bearing sediments, authigenic carbonates
and seep related biota (Diaz-del-Rio et al., 2003; Gardner, 2001; Pinheiro et al., 2003;
Somoza et al., 2003). Yet, the present activity of these structures in methane emission to the
atmosphere remained unknown. Direct sea floor observations during cruise SO-175 revealed
only few traces of methane seepage at the centres of the mud volcanoes Capt. Arutyunov,
Bonjardim, Ginsburg and Hesperides, and the “No Name” structure. No visible fluid or gas
escape was detected with video observations, indicating that the mud volcanoes may be
relatively inactive and that methane is completely consumed within subsurface sediment
horizons. In contrast, highly active seep systems such as Hydrate Ridge, the Gulf of Mexico
Chapter 5 Microbial methane turnover at mud volcanoes of the Gulf of Cadiz
169
or Håkon Mosby Mud Volcano discharge methane into the hydrosphere through focused gas
and fluid escape pathways, despite the high methane and sulphate turnover rates controlling
substantial fractions of the methane flux (Boetius et al., 2000; Damm and Budeus, 2003; Joye
et al., 2004; Treude et al., 2003).
The high anaerobic methane turnover at active seeps produces high sulphide fluxes, which are
utilized by thiotrophic communities, e.g. mats of giant bacteria like Beggiatoa sp., various
chemosynthetic bivalves like Calyptogena sp., Acharax sp., Bathymodiolus sp. and by several
tubeworm species (Sibuet and Olu, 1998). These organisms are adapted to different
geochemical settings and can be used as indicators for high methane fluxes and turnover in
subsurface or near surface sediments. Three types of indicator communities were so far
observed at low abundances at the investigated mud volcanoes. Some small (ca. 20 cm
diameter) blackish sediment patches covered with bacterial mats were found at Faro MV
indicating locally elevated fluxes of methane and sulphide, which reach the surface of the
seafloor (Fig. 6d). Few specimen of the deep dwelling thiotrophic bivalve Acharax sp. were
recovered from Faro MV and previously from Ginsburg MV (Gardner, 2001). Members of
the family Solemyidae are mostly deep burrowing and occur in seep habitats with low or
moderate methane and sulphide fluxes where they can take up sulphide through their foot
from subsurface accumulations (Sahling et al., 2002; Sibuet and Olu, 1998; Treude et al.,
2003). At Hydrate Ridge for instance, Acharax sp. mines subsurface sediments for sulphide
pockets below 15 cm sediment depth (Sahling et al., 2002). As a third indicator species, tube
worms were recovered from Capt. Arutyunov and previously observed at Bonjardim MV
(Pinheiro et al., 2003). Tube worms can extend their roots very deep into sediments to profit
from subsurface methane and/or sulphide accumulations (Dando et al., 1994; Gebruk et al.,
2003; Southward et al., 1981). At Capt. Arutyunov MV, the moderate depletion of worm-
Chapter 5 Microbial methane turnover at mud volcanoes of the Gulf of Cadiz
170
derived membrane lipids indicates a thiotrophic feeding mode fuelled by AOM-derived
sulphide rather than an aerobic methanotrophic mode.
4.2 Hotspots of Hydrocarbon Turnover at the Mud Volcanoes of the Gulf of Cadiz
The observed patterns of seep related biota is in good agreement with the observed
geochemical gradients. All mud volcanoes investigated here showed a complete depletion of
methane within the SMT. Elevated and corresponding AOM and SR rates within this zone
give evidence that uprising methane is consumed anaerobically with sulphate by
methanotrophic, microbial communities leading to a depletion of the two compounds in
sediments of Capt. Arutyunov MV and Bonjardim MV at 25 to 40 cm and 45 to 70 cm bsf,
respectively (Fig. 4a, 5a). Accordingly, concentration measurements of methane and sulphate
and the resulting estimates of diffusive methane and sulphate fluxes at Ginsburg MV, Gemini
MV and the “No Name” structure indicate that sulphate-dependent AOM is a wide spread
microbial process in the centres of the mud volcanoes of the Gulf of Cadiz. With respect to
methane fluxes and microbial turnover rates at the time of our investigation, Capt. Arutyunov
MV is the most active of the investigated structures followed by Bonjardim, Ginsburg and
Gemini MV, while “No Name” is the least active structure (Tab. 2). Furthermore, highest
turnover rates and fluxes coincided with the shallowest SMT comparing all investigated MVs.
Hence, compared to other marine gas seeps and methane-rich environments, the Gulf of Cadiz
MVs investigated here showed a low or medium range in methane turnover rates, reflecting
the relatively low methane fluxes. At the Namibian Shelf, the north western Black Sea Shelf
and the western Argentinean Basin for instance, the SMT is located several meters bsf and
methane fluxes are low with values usually <55 mmol m-2 yr-1 (Hensen et al., 2003; Jørgensen
et al., 2001; Niewöhner et al., 1998). These values are comparable to Ginsburg and Gemini
Chapter 5 Microbial methane turnover at mud volcanoes of the Gulf of Cadiz
171
MV as well as to the “No Name” sructure. The AOM activity and diffusive methane fluxes at
Capt. Arutyunov and Bonjardim MV were substantially higher than those at Ginsburg MV,
Gemini MV and the “No Name” structure. However, areal rates and diffusive fluxes at Capt.
Arutyunov and Bonjardim MV are still two orders of magnitude lower in comparison to other
cold seeps, which bear gas hydrates at their stability limit such as Hydrate Ridge and the Gulf
of Mexico. In such environments with active fluid flow (>100 cm yr-1) and gas emission via
ebullition, methane fluxes were estimated with values >8.7 mol m-2 yr-1 (Luff and Wallmann,
2003; Torres et al., 2002) and AOM reached values >4 mol m-2 yr-1, i.e. >0.5 µmol cm-3 d-1
(Joye et al., 2004; Treude et al., 2003).
At Bonjardim MV, integrated SR rates agreed best with the sulphate flux calculated from the
aligned sulphate profile. Additionally, the deviation of integrated rates from diffusive fluxes
calculated from the gravity core alone could be caused by the much lower resolution of
subsamples taken from these cores. Integrated rate measurements were comparable to
diffusive fluxes at Capt. Arutyunov and Bonjardim MV (Tab. 3). However, further modelling
is required to assess a potential advective transport component in order to estimate total
fluxes. Also, the roughly s-shaped sulphate concentration profile from Ginsburg MV can not
be explained by a steady state, diffusive transport as this would require an additional sulphate
source at about 80 cm bsf.
In vitro experiments with sediment slurries and ex situ tracer injection assays showed that
AOM and SR are in a 1:1 molar stoichiometry if methane is the sole carbon source (Nauhaus
et al., 2002; Treude et al., 2003). In spite of the disproportionate loss of methane and sulphate
caused by degassing during sampling, the deviation from the 1:1 stoichiometry between AOM
and SR as well as between the sulphate and methane fluxes (Tab. 2) indicates the presence of
electron donors other than methane for SR at the investigated MVs. SRB can use a variety of
Chapter 5 Microbial methane turnover at mud volcanoes of the Gulf of Cadiz
172
short and long chain alkanes and complex aliphatic and aromatic compounds (Rueter et al.,
1994; Widdel and Rabus, 2001). The energy yield from the degradation of e.g. ethane coupled
to sulphate reduction (reaction 4) is higher than syntrophic AOM (reaction 5) (refer to
Hanselmann et al., (1991) for Gf 0-values of the reactants).
4C2H6 (aq) + 7SO42-
(aq) 8HCO3-(aq) + 7HS-
(aq) + 4H2O (l) + H+(aq), G0 = -279 kJ mol-1 (4)
CH4 (aq) + SO42-
(aq) HCO3- (aq) + HS-
(aq) + H2O (l), G0 = -33 kJ mol-1 (5)
Hence, it is possible that a substantial fraction of SR is fuelled by the anaerobic oxidation of
C2+-compounds in sediments where methane and higher hydrocarbons co-occur. Besides the
present observations on C2+ compounds at Capt. Arutyunov and Bonjardim MV, Mazurenko
et al. (2003) observed a composition of hydrocarbon gases at Ginsburg MV, which is very
similar to Bonjardim MV. The presence of substantial amounts of higher hydrocarbons in
these MVs, as well as the likely presence of petroleum in sediments of Ginsburg MV indicate
that methane is of a thermogenic origin in the Gulf of Cadiz, and that hydrocarbon-fuelled
sulphate reduction could be an important microbial process in the sediments. Accordingly,
AOM explained a smaller fraction of SR at Bonjardim MV, which had a higher C2+
concentration than Capt. Arutyunov MV (Fig. 4b-c, 5b-c, Tab. 2). This is comparable to
previous findings from the Gulf of Mexico where SR rates exceeds AOM rates up to 10-fold,
most likely due to the presence of a variety of hydrocarbons and petroleum in the sediments
(Joye et al., 2004). The microbial hydrocarbon degraders at natural petroleum seeps have not
been identified yet.
Another interesting, potentially microbial process is the oxidation of sulphide in anaerobic
sediments just above and below the depth of the SMT (Fig. 4d-6d). At least at Capt.
Arutyunov MV, a biological control of the upward sulphide flux seems likely. At many seep
Chapter 5 Microbial methane turnover at mud volcanoes of the Gulf of Cadiz
173
systems, the upward sulphide flux is utilized by thiotrophic organisms such as endosymbiotic
bacteria living in invertebrate organisms such as clams and tube worms (Felbeck, 1983;
Fisher, 1990; Sahling et al., 2002; Sibuet and Olu, 1998; Southward et al., 1986) and by
various giant sulphide-oxidizing bacteria like Beggiatoa sp. and Thioploca sp. which can use
oxygen or nitrate as electron acceptors (Fossing et al., 1995; Huettel et al., 1996; Mussmann
et al., 2003; Nelson et al., 1982). At Capt. Arutyunov MV, the tubes of the worms extend to
20 cm. The upper horizon where sulphide consumption takes place is at 20 to 40 cm bsf,
hence it seems likely that the worms and/or gliding bacteria can be responsible for this
process. In contrast, it appears very unlikely that organisms depending on oxygen or nitrate
utilise sulphide below the horizon where sulphide is produced. Here, a reaction of downward
diffusing sulphide with iron as proposed previously is a more likely explanation (Hensen et
al., 2003; Jørgensen et al., 2004).
In conclusion, our biogeochemical measurements as well as biological and geological
observations indicate that the MVs studied during cruise SO-175 are currently not emitting
methane and other hydrocarbon gases to the hydrosphere. However, there is evidence for
extensive fluid and/or gas escape in the past, as indicated by the widespread occurrence of
massive carbonate chimneys and crusts along or in close proximity to the main channels of
the Mediterranean outflow water in the northern part of the Gulf of Cadiz (Diaz-del-Rio et al.,
2003; Somoza et al., 2003). Another geological evidence for temporally varying activities of
mud volcanism in the Gulf of Cadiz are the typical “Christmas tree” structures observed on
high-resolution seismic profiles (Somoza et al., 2003; Somoza et al., 2002). Such patterns are
probably caused by eruptive events followed by phases of dormancy. This so-called
multiphase activity is a common behaviour in many terrestrial mud volcanoes (e.g. Lokbatan
MV; Aliyev et al., 2002; Dimitrov, 2003; Kholodov, 2002). It is therefore possible that mud
volcanism in the Gulf of Cadiz is in a transient state of low activity at present.
Chapter 5 Microbial methane turnover at mud volcanoes of the Gulf of Cadiz
174
4.4 Identity of Methane Oxidising Communities in Sediments and Carbonate Crusts
Fingerprinting of diagnostic lipids is a common tool for the chemotaxonomic identification of
micro organisms (Boschker and Middelburg, 2002; Madigan et al., 2000). This approach has
been used extensively to examine anaerobic methanotrophic organisms, because the carbon
isotope fractionation associated with AOM leads to specific, very depleted 13C-signatures of
lipid biomarkers (Blumenberg et al., 2004; Elvert et al., 2001; Hinrichs et al., 1999). The
dominance of bacterial and archaeal lipids with low 13C-values in sediments and carbonates
indicate that AOM is a dominant biomass-generating process at the explored MVs.
Differences in the abundances of specific archaeal isoprenoidal diethers and hydrocarbons and
varying contents of bacterial FAs, as well as varying 13C values of these lipids (compared
to source methane) give evidence that several phylogenetic groups of methanotrophic
communities mediate AOM in the Gulf of Cadiz. Elevated concentrations and associated low
13C-signatures of specific archaeal and bacterial membrane lipids corresponded with elevated
AOM and SR rates in sediments of the SMT at Capt. Arutyunov and Bonjardim MV (Fig. 4e-
g, 5e-g, Tab. 3). The molecular analyses give evidence that AOM is mediated by a microbial
community consisting of methanotrophic archaea and SRB phylogenetically related to those
which were previously found at other methane seeps (Boetius et al., 2000; Michaelis et al.,
2002; Orphan et al., 2002; Teske et al., 2002). Furthermore, the presence of a similar suite of
13C-depleted lipids in abundant authigenic carbonates recovered from Hesperides and Faro
MV (Tab.3) indicates higher activities and a more wide spread methane turnover in the past.
Chapter 5 Microbial methane turnover at mud volcanoes of the Gulf of Cadiz
175
4.4.1 Methanotrophic Archaea
Previous publications revealed dominant amounts sn2-hydroxarchaeol relative to archaeol in
ANME-2 dominated habitats, whereas the reverse was observed in ANME-1 dominated
systems (Blumenberg et al., 2004; Boetius et al., 2000; Orphan et al., 2001a; Teske et al.,
2002). Moreover, ANME-2 communities were found to comprise high contents of crocetane
which is only present at low concentrations in ANME-1 (Blumenberg et al., 2004; Boetius et
al., 2000; Elvert et al., 1999). Moreover, stable carbon isotope fractionations were found to be
higher in ANME-2 compared to ANME-1 dominated habitats with 13C-values (archaeol
relative to source methane) ranging between 34 to 53‰ and 11 to 37‰, respectively
(Blumenberg et al., 2004; Boetius et al., 2000; Elvert et al., 2001; Hinrichs et al., 1999;
Orphan et al., 2002; Teske et al., 2002).
The high ratio of sn2-archaeol relative to archaeol and a 13C-value of 42‰ of archaeol
compared to source methane (-48‰, Nuzzo et al., 2005) at Capt. Arutyunov MV is in good
agreement with the published lipid signatures of ANME-2 dominated habitats. Furthermore,
the dominant abundance of ANME-2 compared to ANME-1 clone sequences, together with
the lipid biomarker fingerprint suggest a dominance of ANME-2 in sediments of Capt.
Arutyunov MV.
The comparably high ratio of archaeol relative to sn2-hydroxyarchaeol as well as a 13C-
value of -31.5‰ of archaeol compared to source methane at Bonjardim MV (-49.5 ‰, Nuzzo
et al., 2005) lies between published values from systems dominated by ANME-1 and ANME-
2. This suggests a mixed ANME community in these sediments.
Chapter 5 Microbial methane turnover at mud volcanoes of the Gulf of Cadiz
176
The low ratio of sn2-hydroxyarchaeol relative to archaeol in carbonate crusts obtained from
Hesperides MV is in very good agreement with the published values for ANME-1
communities. Our chromatography settings for hydrocarbon separation did not resolve
crocetane from its isomer phytane, which is a known breakdown product of chlorophyll.
However, the comparably heavy 13C-value of this compound mixture provides evidence for a
low crocetane content, which furthermore agrees with a dominant ANME-1 origin of archaeal
lipid biomass in these carbonates. Similar to Bonjardim MV, the lipid imprint in carbonate
crusts recovered from Faro MV shows characteristics of both, ANME-1 and ANME-2
systems. Comparably low amounts of sn2-hydroxyarchaeol relative to archaeol would be
indicative for ANME-1. However, high amounts of crocetane also point to a substantial
contribution of ANME-2 to the archaeal biomass preserved in the crusts.
4.4.2 Sulphate Reducing Bacteria
At many different cold seep settings, ANME-1 and ANME-2 archaea have been found in
consortium with SRB of the Seep-SRB1 cluster belonging to the
Desulfosarcina/Desulfococcus group (Seep-SRB1, Knittel et al., 2003). However, this cluster
apparently comprises physiologically different ecotypes that are distinguished by very
specific FA patterns according to their association to either ANME-1 or to ANME-2
(Blumenberg et al., 2004; Elvert et al., 2003; Knittel et al., 2003). FA signatures in
environmental systems dominated by ANME-1 / Seep-SRB1 communities comprise high
contents of ai-C15:0 relative to i-C15:0, whereas systems dominated by ANME-2 / Seep-SRB1
communities comprise the unusual FA cyC17:1 5,6 and dominant contents of C16:1 5 but almost
balanced ratios of ai-C15:0 relative to i-C15:0 (Blumenberg et al., 2004; Elvert et al., 2003).
Chapter 5 Microbial methane turnover at mud volcanoes of the Gulf of Cadiz
177
The dominance of the unusual FAs C16:1 5 and cyC17:1 5,6 and an almost equal ratio of the iso
and anteiso branched C15:0 FAs at Capt. Arutyunov MV are in very good agreement with the
published lipid signatures of the Seep SRB 1 ecotype associated with ANME-2. This finding
is in agreement with the predominance of Seep-SRB1 sequences in the bacterial clone library.
As expected from the detection of potentially diverse ANME communities at Bonjardim MV,
the FA signature shows characteristics of various SRB previously identified as bacterial
partners in AOM. The high ratio of ai-C15:0 compared to i-C15:0 would be indicative for the
Seep-SRB1 ecotype associated with ANME-1 while the high abundance of C16:1 5 would
indicate the ecotype associated with ANME-2. However, a further assignment of FAs to
particular SRBs remains speculative as the FA cyC17:0w5,6 specific for the Seep-SRB1 type
associated with ANME-2 was not detected, which might be a result of the overall low
concentrations of lipids in sediments at Bonjardim MV (Fig. 5e, f, Tab. 3). At Bonjardim MV,
several FAs carry 13C-signatures that are comparable to the source methane and do not show
any fractionation. This indicates a contribution to carbon biomass from processes other than
methane consumption, possibly related to the anaerobic oxidation of higher hydrocarbons. A
similar mixture of carbon sources could also explain the unspecific signature of FAs in
carbonates of Hesperides MV. Similar to Bonjardim MV, FA signatures of Seep-SRB1 cluster
associated with ANME-1 and ANME-2 were found in carbonates recovered from Faro MV.
The comparably high content of ai-C15:0 relative to i-C15:0 and the lack of cyC17:0 5,6 is
indicative for Seep-SRB1 associated to ANME-1 while relatively high amounts of C16:1 5 are
indicative for Seep-SRB1 associated to ANME-2. In contrast to Hesperides MV, the low
13C-values of all lipid components analysed at Faro MV give evidence that AOM dominated
biomass production.
Another striking difference is the comparably high lipid concentration in carbonates recovered
from Faro compared to those recovered from Hesperides MV. A rather recent formation of the
Chapter 5 Microbial methane turnover at mud volcanoes of the Gulf of Cadiz
178
sampled carbonates from Faro MV appears likely, as these were stained black from sulphide
and recovered together with some living specimens of the chemosynthetic bivalve Acharax
sp. A possible explanation for the difference in AOM-derived lipid content could be that the
sampled carbonate crusts from Hesperides are older than those recovered from Faro MV and
have been exposed to oxic sea water and lipid diagenesis for a longer time.
CONCLUSIONS
At the centres of the mud volcanoes Captain Arutyunov, Bonjardim, Ginsburg, Gemini and
Faro as well as at the “No Name” structure, several indications for a slow fluid and gas
transport were found. Our data suggest a complete consumption of methane and higher
hydrocarbons in the sediments of the studied mud volcanoes at depths of 30-300 cm below
seafloor. We found no indication of hydrocarbons reaching the hydrosphere, except from the
visual observation of small patches of reduced sediments covered by giant sulphide-oxidizing
bacteria. The overlap of methane and sulphate depletion with sulphide production shows that
methane and higher hydrocarbon oxidation processes are mediated microbially under
anaerobic conditions. Correspondingly, anaerobic oxidation of methane and sulphate
reduction rates show a peak in a distinct, narrow methane-sulphate transition zone in the
subsurface sediments of the mud volcano centres. Highest turnover rates and fluxes coincided
with the shallowest SMT depths with Capt. Arutyunov MV as the most active system in the
study area, followed by the mud volcanoes Bonjardim, Ginsburg, and Gemini and finally the
“No Name” structure. In comparison to other gas seeps, methane fluxes and turnover rates are
low to mid range in the Gulf of Cadiz. In addition to AOM, a substantial fraction of the SR is
fuelled by the anaerobic oxidation of higher hydrocarbons, which rise from deep reservoirs

Chapter 5 Microbial methane turnover at mud volcanoes of the Gulf of Cadiz
179
together with methane. Lipid biomarker and 16S rDNA clone library from the sediments and
carbonates of the AOM hotspots provide evidence that both of the previously described
ANME-1 / Seep-SRB1 and ANME-2 / Seep-SRB1 communities mediate AOM at mud
volcanoes in the Gulf of Cadiz. The finding of their signatures in carbonate crusts at the
centres of the investigated mud volcanoes indicates that at least some of the vast amounts of
carbonates littering mud volcanoes and diapirs in the northern part of the Gulf of Cadiz are
linked to methane seepage.
Chapter 5 Microbial methane turnover at mud volcanoes of the Gulf of Cadiz
180
Acknowledgements
The authors thank the captain and crew as well as the shipboard scientific community of the
R/V SONNE for their help at sea. We also thank Thomas Willkop, Imke Müller and Viola
Beier for technical assistance with laboratory analyses. Scientific exchange and collaboration
were supported by the CRUP-ICCTI/DAAD Portuguese/German Joint Action
Geophere/Biosphere Coupling Processes in the Gulf of Cadiz (A-15/04; Boetius, Pinheiro).
This work was also supported by the ESF Eurocores/Euromargins MVSEIS project (01-
LEC_EMA24F; PDCTM72003/DIV/40018-MVSEIS), as well as by the IRCCM
(International Research Consortium on Continental Margins at International University
Bremen, Germany) and the Max Planck Society.

Chapter 5 Microbial methane turnover at mud volcanoes of the Gulf of Cadiz
181
References
Aloisi G., Pierre C., Rouchy J.-M., Foucher J.-P., Woodside J., and Party t. M. S. (2000) Methane-related authigenic carbonates of eastern Mediterranean Sea mud volcanoes and their possible relation to gas hydrate destabilisation. Earth and Planetary Science Letters 184(1), 321-338.
Blumenberg M., Seifert R., Reitner J., Pape T., and Michaelis W. (2004) Membrane lipid patterns typify distinct anaerobic methanotrophic consortia. Proceedings of the National Academy of Sciences of the United States of America 101(30).
Boetius A., Ravenschlag K., Schubert C., Rickert D., Widdel F., Gieseke A., Amann R., Jørgensen B. B., Witte U., and Pfannkuche O. (2000) A marine microbial consortium apparently mediating anaerobic methane of oxidation. Nature 407, 623-626.
Boetius A. and Suess E. (2004) Hydrate Ridge: a natural laboratory for the study of microbial life fueled by methane from near-surface gas hydrates. Chemical Geology 205(3-4),291-310.
Boschker H. T. S. and Middelburg J. J. (2002) Stable isotopes and biomarkers in microbial ecology. Fems Microbiology Ecology 40(2), 85-95.
Boudreau B. P. (1997) Diagenetic models and their implementation: modelling transport and reactions in aquatic sediments. Springer.
Charlou J. L., Donval J. P., Zitter T., Roy N., Jean-Baptiste P., Foucher J. P., and Woodside J. (2003) Evidence of methane venting and geochemistry of brines on mud volcanoes of the eastern Mediterranean Sea. Deep-Sea Research Part I-Oceanographic Research Papers 50(8), 941-958.
Cordes E. E., Arthur M. A., Shea K., Arvidson R. S., and Fisher C. R. (2005) Modeling the mutualistic interactions between tubeworms and microbial consortia. Plos Biology3(3), 497-506.
Damm E. and Budeus G. (2003) Fate of vent-derived methane in seawater above the Hakon Mosby mud volcano (Norwegian Sea). Marine Chemistry 82(1-2), 1-11.
Dando P. R., Bussmann I., Niven S. J., O'Hara S. C. M., Schmaljohann R., and Taylor L. J. (1994) A methane seep area in the Skagerrak, the habitat of the pogonophore Siboglinum poseidoni and the bivalve mollusc Thyasira sarsi. Marine Ecology Progress Series 107, 157-167.
Diaz-del-Rio V., Somoza L., Martinez-Frias J., Mata M. P., Delgado A., Hernandez-Molina F. J., Lunar R., Martin-Rubi J. A., Maestro A., Fernandez-Puga M. C., Leon R., Llave E., Medialdea T., and Vazquez J. T. (2003) Vast fields of hydrocarbon-derived carbonate chimneys related to the accretionary wedge/olistostrome of the Gulf of Cadiz. Marine Geology 195(1-4), 177-200.
Dimitrov L. I. (2002) Mud volcanoes - the most important pathway for degassing deeply buried sediments. Earth-Science Reviews 59(1-4), 49-76.
Dimitrov L. I. (2003) Mud volcanoes - a significant source of atmospheric methane. Geo-Marine Letters 23(3-4), 155-161.
Elvert M., Boetius A., Knittel K., and Jorgensen B. B. (2003) Characterization of specific membrane fatty acids as chemotaxonomic markers for sulfate-reducing bacteria involved in anaerobic oxidation of methane. Geomicrobiology Journal 20(4), 403-419.
Elvert M., Greinert J., Suess E., and Whiticar M. J. (2001) Carbon isotopes of biomarkers derived from methane-oxidizing microbes at Hydrate Ridge, Cascadia convergent margin. In Natural gas hydrates: Occurrence, distribution, and dynamics, Vol. 124 (ed. C. K. Paull and W. P. Dillon), pp. 115-129. American Geophysical Union.
Chapter 5 Microbial methane turnover at mud volcanoes of the Gulf of Cadiz
182
Elvert M., Suess E., and Whiticar M. J. (1999) Anaerobic methane oxidation associated with marine gas hydrates: superlight C-isotopes from saturated and unsaturated C20 and C25
irregular isoprenoids. Naturwissenschaften 86(6), 295-300. Felbeck H. (1983) Sulfide Oxidation and Carbon Fixation by the Gutless Clam Solemya-
Reidi - an Animal-Bacteria Symbiosis. Journal of Comparative Physiology 152(1), 3-11.
Fisher C. R. (1990) Chemoautotrophic and Methanotrophic Symbioses in Marine-Invertebrates. Reviews in Aquatic Sciences 2(3-4), 399-436.
Fossing H., Gallardo V. A., Jorgensen B. B., Huttel M., Nielsen L. P., Schulz H., Canfield D. E., Forster S., Glud R. N., Gundersen J. K., Kuver J., Ramsing N. B., Teske A., Thamdrup B., and Ulloa O. (1995) Concentration and Transport of Nitrate by the Mat-Forming Sulfur Bacterium Thioploca. Nature 374(6524), 713-715.
Gardner J. M. (2001) Mud volcanoes revealed and sampled on the Western Moroccan continental margin. Geophysical Research Letters 28(2), 339-342.
Gebruk A. V., Krylova E. M., Lein A. Y., Vinogradov G. M., Anderson E., Pimenov N. V., Cherkashev G. A., and Crane K. (2003) Methane seep community of the Hakon Mosby mud volcano (the Norwegian Sea): composition and trophic aspects. Sarsia88(6), 394-403.
Hanselmann K. W. (1991) Microbial Energetics Applied to Waste Repositories. Experientia47(7), 645-687.
Hensen C., Wallmann K., Schmidt M., Ranero C. R., and Suess E. (2004) Fluid expulsion related to mud extrusion off Costa Rica - A window to the subducting slab. Geology32(3), 201-204.
Hensen C., Zabel M., Pfeifer K., Schwenk T., Kasten S., Riedinger N., Schulz H. D., and Boettius A. (2003) Control of sulfate pore-water profiles by sedimentary events and the significance of anaerobic oxidation of methane for the burial of sulfur in marine sediments. Geochimica Et Cosmochimica Acta 67(14), 2631-2647.
Hinrichs K.-U. and Boetius A. (2002) The anaerobic oxidation of methane: New insights in microbial ecology and biogeochemistry. In Ocean Margin Systems (ed. G. Wefer, D. Billett, and D. Hebbeln), pp. 457-477. Springer-Verlag, Berlin.
Hinrichs K.-U., Hayes J. M., Sylva S. P., Brewer P. G., and DeLong E. F. (1999) Methane-consuming archaebacteria in marine sediments. Nature 398, 802-805.
Houghton J. T., Meira Filho L. G., Callander B. A., Harris N., Kattenberg A., and Maskell K. (1996) Climate Change 1995: The Science of Climat Change. Cambrige University Press for the Inter-governmental Panel on Climate Change, Cambridge.
Huettel M., Forster S., Kloser S., and Fossing H. (1996) Vertical migration in the sediment-dwelling sulfur bacteria Thioploca spp in overcoming diffusion limitations. Appliedand Environmental Microbiology 62(6), 1863-1872.
Iversen N. and Jørgensen B. B. (1985) Anaerobic methane oxidation rates at the sulfate-methane transition in marine sediments from Kattegat and Skagerrak (Denmark). Limnology and Oceanography 30(5), 944-955.
Jørgensen B. B., Bottcher M. E., Luschen H., Neretin L. N., and Volkov, II. (2004) Anaerobic methane oxidation and a deep H2S sink generate isotopically heavy sulfides in Black Sea sediments. Geochimica Et Cosmochimica Acta 68(9), 2095-2118.
Jørgensen B. B., Weber A., and Zopfi J. (2001) Sulfate reduction and anaerobic methane oxidation in Black Sea sediments. Deep-Sea Research Part I-Oceanographic Research Papers 48(9), 2097-2120.
Joye S. B., Boetius A., Orcutt B. N., Montoya J. P., Schulz H. N., Erickson M. J., and Lugo S. K. (2004) The anaerobic oxidation of methane and sulfate reduction in sediments from Gulf of Mexico cold seeps. Chemical Geology 205(3-4), 219-238.

Chapter 5 Microbial methane turnover at mud volcanoes of the Gulf of Cadiz
183
Judd A. G., Hovland M., Dimitrov L. I., Gil S. G., and Jukes V. (2002) The geological methane budget at Continental Margins and its influence on climate change. Geofluids2(2), 109-126.
Kane M. D., Poulsen L. K., and Stahl D. A. (1993) Monitoring the Enrichment and Isolation of Sulfate-Reducing Bacteria by Using Oligonucleotide Hybridization Probes Designed from Environmentally Derived 16s Ribosomal-Rna Sequences. Applied and Environmental Microbiology 59(3), 682-686.
Kenyon N. H., Ivanov M. K., Akhmetzhanov A. M., and Akhmanov G. (2001) Interdisciplinary Approaches to Geoscience on the North East Atlantic Margin and Mid-Atlantic Ridge. IOC Technical Series no. 60.
Kenyon N. H., Ivanov M. K., Akhmetzhanov A. M., and Akhmanov G. G. (2000) Multidisciplinary Study of Geological Processes on the North East Atlantic and Western Mediterranean Margins, pp. 102. IOC Technical Series no. 56.
Kholodov V. N. (2002) Mud Volcanoes: Distribution Regularities and Genesis (Communication 2. Geological–Geochemical Peculiarities and Formation Model). Lithology and Mineral Resources 37(4), 293-310.
Kimura H., Sato M., Sasayama Y., and Naganuma T. (2003) Molecular characterization and in situ localization of endosymbiotic 16S ribosomal RNA and RuBisCO genes in the pogonophoran tissue. Marine Biotechnology 5(3), 261-269.
Knittel K., Boetius A., Lemke A., Eilers H., Lochte K., Pfannkuche O., Linke P., and Amann R. (2003) Activity, distribution, and diversity of sulfate reducers and other bacteria in sediments above gas hydrate (Cascadia margin, Oregon). Geomicrobiology Journal20(4), 269-294.
Knittel K., Losekann T., Boetius A., Kort R., and Amann R. (2005) Diversity and distribution of methanotrophic archaea at cold seeps. Applied and Environmental Microbiology71(1), 467-479.
Kopf A., Bannert B., Brückmann W., Dorschel B., Foubert A. T. G., Grevemeyer I., Gutscher M. A., Hebbeln D., Heesemann B., Hensen C., Kaul N. E., Lutz M., Magalhaes V. H., Marquardt M. J., Marti A. V., Nass K. S., Neubert N., Niemann H., Nuzzo M., Poort J. P. D., Rosiak U. D., Sahling H., Schneider von Deimling J., Somoza L., Thiebot E., and Wilkop T. P. (2004) Report and preliminary results of Sonne Cruise SO175, Miami - Bremerhaven, 12.11 - 30.12.2003, pp. 218. Fachbereich Geowissenschaften der Universität Bremen.
Kopf A. J. (2002) Significance of mud volcanism. Reviews of Geophysics 40(2).Krueger D. M. and Cavanaugh C. M. (1997) Phylogenetic diversity of bacterial symbionts of
Solemya hosts based on comparative sequence analysis of 16S rRNA genes. Appliedand Environmental Microbiology 63(1), 91-98.
Kvenvolden K. A. (2002) Methane hydrate in the global organic carbon cycle. Terra Nova14(5), 302-306.
Lane D. J., Pace B., Olsen G. J., Stahl D. A., Sogin M. L., and Pace N. R. (1985) Rapid-Determination of 16s Ribosomal-Rna Sequences for Phylogenetic Analyses. Proceedings of the National Academy of Sciences of the United States of America82(20), 6955-6959.
Luff R. and Wallmann K. (2003) Fluid flow, methane fluxes, carbonate precipitation and biogeochemical turnover in gas hydrate-bearing sediments at Hydrate Ridge, Cascadia Margin: Numerical modeling and mass balances. Geochimica Et Cosmochimica Acta67(18), 3403-3421.
Madigan M. T., Martinko J. M., and Parker J. (2000) Brock Biology of Microorganisms.Prentice-Hall, Inc.
Maldonado A. and Comas M. C. (1992) Geology and Geophysics of the Alboran Sea - an Introduction. Geo-Marine Letters 12(2-3), 61-65.
Chapter 5 Microbial methane turnover at mud volcanoes of the Gulf of Cadiz
184
Maldonado A., Somoza L., and Pallares L. (1999) The Betic orogen and the Iberian-African boundary in the Gulf of Cadiz: geological evolution (central North Atlantic). MarineGeology 155(1-2), 9-43.
Manne A. S. and Richels R. G. (2001) An alternative approach to establishing trade-offs among greenhouse gases. Nature 410(6829), 675-677.
Massana R., Murray A. E., Preston C. M., and DeLong E. F. (1997) Vertical distribution and phylogenetic characterization of marine planktonic Archaea in the Santa Barbara Channel. Applied and Environmental Microbiology 63(1), 50-56.
Mazurenko L. L., Soloviev V. A., Belenkaya I., Ivanov M. K., and Pinheiro L. M. (2002) Mud volcano gas hydrates in the Gulf of Cadiz. Terra Nova 14(5), 321-329.
Michaelis W., Seifert R., Nauhaus K., Treude T., Thiel V., Blumenberg M., Knittel K., Gieseke A., Peterknecht K., Pape T., Boetius A., Amann R., Jorgensen B. B., Widdel F., Peckmann J. R., Pimenov N. V., and Gulin M. B. (2002) Microbial reefs in the Black Sea fueled by anaerobic oxidation of methane. Science 297(5583), 1013-1015.
Milkov A. V. (2000) Worldwide distribution of submarine mud volcanoes and associated gas hydrates. Marine Geology 167(1-2), 29-42.
Milkov A. V., Sassen R., Apanasovich T. V., and Dadashev F. G. (2003) Global gas flux from mud volcanoes: A significant source of fossil methane in the atmosphere and the ocean. Geophysical Research Letters 30(2).
Milkov A. V., Vogt P. R., Crane K., Lein A. Y., Sassen R., and Cherkashev G. A. (2004) Geological, geochemical, and microbial processes at the hydrate-bearing Hakon Mosby mud volcano: a review. Chemical Geology 205(3-4), 347-366.
Moss C. W. and Lambert-Fair M. A. (1989) Location of Double Bonds in Monounsaturated Fatty Acids of Campylobacter cryaerophila with Dimethyl Disulfide Derivatives and Combined Gas Chromatography-Mass Spectrometry. JOURNAL OF CLINICAL MICROBIOLOGY 27(7), 1467-1470.
Mussmann M., Schulz H. N., Strotmann B., Kjaer T., Nielsen L. P., Rossello-Mora R. A., Amann R. I., and Jorgensen B. B. (2003) Phylogeny and distribution of nitrate-storing Beggiatoa spp. in coastal marine sediments. Environmental Microbiology 5(6), 523-533.
Muyzer G., Teske A., Wirsen C. O., and Jannasch H. W. (1995) Phylogenetic-Relationships of Thiomicrospira Species and Their Identification in Deep-Sea Hydrothermal Vent Samples by Denaturing Gradient Gel-Electrophoresis of 16s Rdna Fragments. Archives of Microbiology 164(3), 165-172.
Nauhaus K., Boetius A., Kruger M., and Widdel F. (2002) In vitro demonstration of anaerobic oxidation of methane coupled to sulphate reduction in sediment from a marine gas hydrate area. Environmental Microbiology 4(5), 296-305.
Nelson D. C., Waterbury J. B., and Jannasch H. W. (1982) Nitrogen-Fixation and Nitrate Utilization by Marine and Fresh-Water Beggiatoa. Archives of Microbiology 133(3),172-177.
Nichols P. D., Guckert J. B., and White D. C. (1986) Determination of monounsaturated fatty acid double-bond position and geometry for microbial monocultures and complex consortia by capillary GC-MS of their dimethyl disulphide adducts. Journal of Microbiological Methods 5, 49-55.
Niewöhner C., Hensen C., Kasten S., Zabel M., and Schulz H. D. (1998) Deep sulfate reduction completely mediated by anaerobic methane oxidation in sediments of the upwelling area off Namibia. Geochimica et Cosmochimica Acta 62(3), 455-464.
Nuzzo M., Hensen C., Hornibrook E., Brueckmann W., Magalhaes V. H., Parkes R. J., and Pinheiro L. M. (2005) Origin of Mud Volcano Fluids in the Gulf of Cadiz (E-Atlantic). EGU General Assembly.
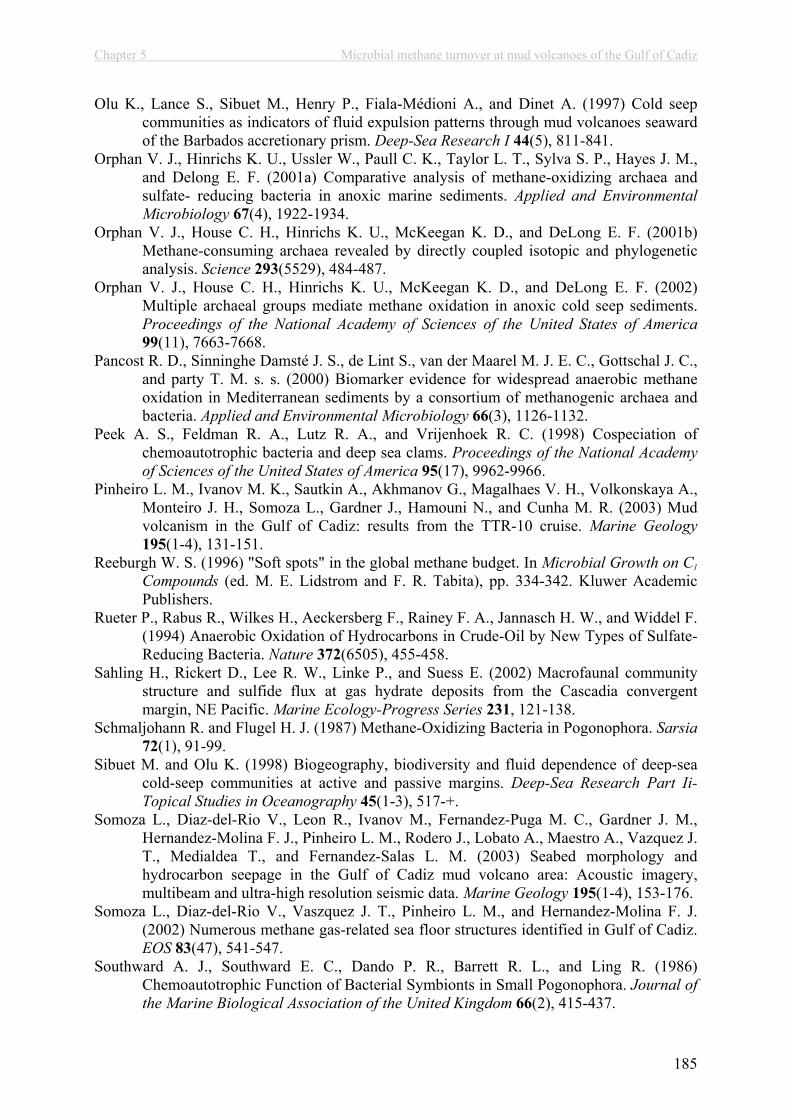
Chapter 5 Microbial methane turnover at mud volcanoes of the Gulf of Cadiz
185
Olu K., Lance S., Sibuet M., Henry P., Fiala-Médioni A., and Dinet A. (1997) Cold seep communities as indicators of fluid expulsion patterns through mud volcanoes seaward of the Barbados accretionary prism. Deep-Sea Research I 44(5), 811-841.
Orphan V. J., Hinrichs K. U., Ussler W., Paull C. K., Taylor L. T., Sylva S. P., Hayes J. M., and Delong E. F. (2001a) Comparative analysis of methane-oxidizing archaea and sulfate- reducing bacteria in anoxic marine sediments. Applied and Environmental Microbiology 67(4), 1922-1934.
Orphan V. J., House C. H., Hinrichs K. U., McKeegan K. D., and DeLong E. F. (2001b) Methane-consuming archaea revealed by directly coupled isotopic and phylogenetic analysis. Science 293(5529), 484-487.
Orphan V. J., House C. H., Hinrichs K. U., McKeegan K. D., and DeLong E. F. (2002) Multiple archaeal groups mediate methane oxidation in anoxic cold seep sediments. Proceedings of the National Academy of Sciences of the United States of America99(11), 7663-7668.
Pancost R. D., Sinninghe Damsté J. S., de Lint S., van der Maarel M. J. E. C., Gottschal J. C., and party T. M. s. s. (2000) Biomarker evidence for widespread anaerobic methane oxidation in Mediterranean sediments by a consortium of methanogenic archaea and bacteria. Applied and Environmental Microbiology 66(3), 1126-1132.
Peek A. S., Feldman R. A., Lutz R. A., and Vrijenhoek R. C. (1998) Cospeciation of chemoautotrophic bacteria and deep sea clams. Proceedings of the National Academy of Sciences of the United States of America 95(17), 9962-9966.
Pinheiro L. M., Ivanov M. K., Sautkin A., Akhmanov G., Magalhaes V. H., Volkonskaya A., Monteiro J. H., Somoza L., Gardner J., Hamouni N., and Cunha M. R. (2003) Mud volcanism in the Gulf of Cadiz: results from the TTR-10 cruise. Marine Geology195(1-4), 131-151.
Reeburgh W. S. (1996) "Soft spots" in the global methane budget. In Microbial Growth on C1
Compounds (ed. M. E. Lidstrom and F. R. Tabita), pp. 334-342. Kluwer Academic Publishers.
Rueter P., Rabus R., Wilkes H., Aeckersberg F., Rainey F. A., Jannasch H. W., and Widdel F. (1994) Anaerobic Oxidation of Hydrocarbons in Crude-Oil by New Types of Sulfate-Reducing Bacteria. Nature 372(6505), 455-458.
Sahling H., Rickert D., Lee R. W., Linke P., and Suess E. (2002) Macrofaunal community structure and sulfide flux at gas hydrate deposits from the Cascadia convergent margin, NE Pacific. Marine Ecology-Progress Series 231, 121-138.
Schmaljohann R. and Flugel H. J. (1987) Methane-Oxidizing Bacteria in Pogonophora. Sarsia72(1), 91-99.
Sibuet M. and Olu K. (1998) Biogeography, biodiversity and fluid dependence of deep-sea cold-seep communities at active and passive margins. Deep-Sea Research Part Ii-Topical Studies in Oceanography 45(1-3), 517-+.
Somoza L., Diaz-del-Rio V., Leon R., Ivanov M., Fernandez-Puga M. C., Gardner J. M., Hernandez-Molina F. J., Pinheiro L. M., Rodero J., Lobato A., Maestro A., Vazquez J. T., Medialdea T., and Fernandez-Salas L. M. (2003) Seabed morphology and hydrocarbon seepage in the Gulf of Cadiz mud volcano area: Acoustic imagery, multibeam and ultra-high resolution seismic data. Marine Geology 195(1-4), 153-176.
Somoza L., Diaz-del-Rio V., Vaszquez J. T., Pinheiro L. M., and Hernandez-Molina F. J. (2002) Numerous methane gas-related sea floor structures identified in Gulf of Cadiz. EOS 83(47), 541-547.
Southward A. J., Southward E. C., Dando P. R., Barrett R. L., and Ling R. (1986) Chemoautotrophic Function of Bacterial Symbionts in Small Pogonophora. Journal of the Marine Biological Association of the United Kingdom 66(2), 415-437.
Chapter 5 Microbial methane turnover at mud volcanoes of the Gulf of Cadiz
186
Southward A. J., Southward E. C., Dando P. R., Rau G. H., Felbeck H., and Fluegel H. (1981) Bacterial symbionts and low 13C/12C ratios in tissues of Pogonophora indicate unusual nutrition and metabolism. Nature 293, 616-620.
Summons R. E., Jahnke L. L., and Roksandic Z. (1994) Carbon isotopic fractionation in lipids from methanotrophic bacteria: Relevance for interpretation of the geochemical record of biomarkers. Geochimica Et Cosmochimica Acta 58(13), 2853-2863.
Teske A., Hinrichs K. U., Edgcomb V., Gomez A. D., Kysela D., Sylva S. P., Sogin M. L., and Jannasch H. W. (2002) Microbial diversity of hydrothermal sediments in the Guaymas Basin: Evidence for anaerobic methanotrophic communities. Applied and Environmental Microbiology 68(4), 1994-2007.
Thiel V., Peckmann J., Seifert R., Wehrung P., Reitner J., and Michaelis W. (1999) Highly isotopically depleted isoprenoids: molecular markers for ancient methane venting. Geochimica et Cosmochimica Acta 63(23/24), 3959-3966.
Torres M. E., McManus J., Hammond D. E., de Angelis M. A., Heeschen K. U., Colbert S. L., Tryon M. D., Brown K. M., and Suess E. (2002) Fluid and chemical fluxes in and out of sediments hosting methane hydrate deposits on Hydrate Ridge, OR, I: Hydrological provinces. Earth and Planetary Science Letters 201(3-4), 525-540.
Treude T., Boetius A., Knittel K., Wallmann K., and Jorgensen B. B. (2003) Anaerobic oxidation of methane above gas hydrates at Hydrate Ridge, NE Pacific Ocean. MarineEcology-Progress Series 264, 1-14.
Treude T., Niggemann J., Kallmeyer J., Wintersteller P., Schubert C. J., Boetius A., and Jorgensen B. B. (2005) Anaerobic oxidation of methane and sulfate reduction along the Chilean continental margin. Geochimica et Cosmochimica Acta 69(11), 2767-2779.
Werne J. P., Baas M., and Damste J. S. S. (2002) Molecular isotopic tracing of carbon flow and trophic relationships in a methane-supported benthic microbial community. Limnology and Oceanography 47(6), 1694-1701.
Whiticar M. J. (1999) Carbon and hydrogen isotope systematics of bacterial formation and oxidation of methane. Chemical Geology 161(1-3), 291-314.
Whiticar M. J., Faber E., and Schoell M. (1986) Biogenic methane formation in marine and freshwater environments: CO2 reduction vs. acetate fermentation - Isotope evidence. Geochimica et Cosmochimica Acta 50, 693-709.
Widdel F. and Rabus R. (2001) Anaerobic biodegradation of saturated and aromatic hydrocarbons. Current Opinion in Biotechnology 12(3), 259-276.
Wuebbles D. J. and Hayhoe K. (2002) Atmospheric methane and global change. Earth-Science Reviews 57(3-4), 177-210.
Chapter 6 Methane emission and consumption at a North Sea gas seep (Tommeliten area)
187
Methane emission and consumption at a
North Sea gas seep (Tommeliten area)
H. Niemann1,2, M. Elvert3, M. Hovland4, B. Orcutt5, A. Judd6, I. Suck2, J. Gutt2, S. Joye5, E.
Damm2, K. Finster7, A. Boetius1,8
1 Max Planck Institute for Marine Microbiology, 28359 Bremen, Germany,
2Alfred Wegener Institute for Polar and Marine Research, 27515 Bremerhaven, Germany
3Research Center Ocean Margins, University of Bremen, 28334 Bremen, Germany
4Statoil, 4001 Stavanger, Norway
5University of Georgia, Athens, Georgia 30602-3636, USA
6Wilderspool House, High Mickley, Stocksfield, Northumberland, NE43 7LU, UK
7University of Aarhus, 8000 Aarhus, Denmark
8International University Bremen, 28759 Bremen, Germany
Author to whom correspondence should be addressed:
Helge Niemann Max Planck Institute for Marine Microbiology, Celsiusstr. 1, 28359 Bremen, Germany email: [email protected], phone +49-421-2028653

Chapter 6 Methane emission and consumption at a North Sea gas seep (Tommeliten area)
188
ABSTRACT
The North Sea hosts large coal, oil and gas reservoirs of commercial value. Natural leakage
pathways of subsurface gas to the hydrosphere have been recognized during geological
surveys (Hovland and Judd, 1988). The Tommeliten seepage area is part of the Greater
Ekofisk area, which is situated above the Tommeliten Delta salt diapir in the central North
Sea. In this study, we report of an active seep site (56° 29.90’ N, 2° 59.80’ E) located in the
Tommeliten area, Norwegian Block 1/9, at 75 m water depth. Here, cracks in a buried marl
horizon allow methane to migrate into overlying clay-silt and sandy sediments. Hydroacoustic
sediment echosounding showed several venting spots coinciding with the apex of marl domes
where methane is released into the water column and potentially to the atmosphere during
deep mixing situations. In the vicinity of the gas seeps, sea floor observations showed small
mats of giant sulphide-oxidizing bacteria above patches of black sediments and carbonate
crusts, which are exposed 10 to 50 cm above seafloor forming small reefs. These methane-
derived authigenic carbonates (MDACs) contain 13C-depleted, archaeal lipids indicating
previous gas seepage and AOM activity. High amounts of sn2-hydroxyarchaeol relative to
archaeol and low abundances of biphytanes in the crusts give evidence that anaerobic
methane-oxidising archaea (ANME) of the phylogenetic cluster ANME-2 were the potential
mediators of anaerobic oxidation of methane (AOM) at the time of carbonate formation.
Small pieces of MDACs were also found subsurface at about 1.7 m sediment depth,
associated with the sulphate-methane transition zone (SMTZ). The SMTZ of Tommeliten is
characterized by elevated AOM and sulphate reduction (SR) rates, increased concentrations of
13C-depleted tetraether derived biphytanes, and specific bacterial fatty acids (FA). Further
biomarker and 16S rDNA based analyses give evidence that AOM at the Tommeliten SMTZ
is mediated by archaea belonging to the ANME-1b group and sulphate reducing bacteria
(SRB) most likely belonging to the Seep-SRB1 cluster. The zone of active methane
Chapter 6 Methane emission and consumption at a North Sea gas seep (Tommeliten area)
189
consumption was restricted to a distinct horizon of about 20 cm. Concentrations of 13C-
depleted lipid biomarkers (e.g. 500 ng g-dw-1 biphythanes, 140 ng g-dw-1 fatty acid ai-C15:0),
cell numbers (1.5 * 108 cells cm-3), AOM and SR rates (3 nmol cm-3 d-1) in the SMTZ are 2-3
orders of magnitude lower compared to AOM zones of highly active cold seeps such as
Hydrate Ridge or the Gulf of Mexico.
Chapter 6 Methane emission and consumption at a North Sea gas seep (Tommeliten area)
190
1. INTRODUCTION
Hydrocarbon seepage in the ocean has been known for more than thirty years, but the
contribution of this process to the global methane budget and the carbon cycle are not well
constrained. Upwelling of hydrocarbon-rich geofluids from subsurface reservoirs to the
hydro- and atmosphere could be a relevant process in the global carbon cycle, especially with
regard to emissions of the greenhouse gas methane. Gas seepage from temperate shallow shelf
seas is likely to contribute to methane emissions to the atmosphere, because of the seasonal
deep mixing of the water column reaching the gas plumes above active seeps. The main
challenge in constraining methane emission from the ocean is the need for quantitative
estimates of the abundance and activity of cold seeps of ocean margins. As part of the
OMARC cluster (Ocean Margin Deep-Water Research Consortium) of the 5th framework
program of the European Commission, the project METROL (Methane flux control in ocean
margin sediments) has been investigating methane fluxes from seep systems of the central and
northern North Sea. Here we present results from biogeochemical and microbiological
investigations of the Tommeliten seep area (56° 29.90’ N, 2° 59.80’ E) in the central North
Sea. This and other active cold seeps have been detected during pipeline route and site
surveys by oil companies (Hovland and Sommerville, 1985). Cold seeps have been reported
from various geographic and geological settings (Judd, 2003). Once initiated, cold seeps may
continuously emit gas, but they become inactive if subsurface gas and fluids are depleted, or
undergo phases of dormancy where the shallow reservoir is recharged and none or little
seepage occurs (Çifçi et al., 2003; Hovland and Judd, 1988). In the particular case of the
central North Sea, thermogenic methane is produced in Jurassic sediments (Hovland and
Judd, 1988). In the Tommeliten area, the enclosing sedimentary rocks have been pierced by a
buried salt diapir, the so called Delta Structure, at about 1 km depth below sea floor (bsf). As
a result, the methane reservoir lacks a proper seal and disturbances on seismic profiles
Chapter 6 Methane emission and consumption at a North Sea gas seep (Tommeliten area)
191
indicate that free gas migrates in sediments above the diapir to the sea floor (Hovland, 2002;
Hovland and Judd, 1988). Previous expeditions to the Tommeliten seepage area with remotely
operated vehicles (ROVs) documented streams of single methane bubbles of a thermogenic
origin (–45.6‰ vs. Pee Dee Belemnite), small patches of filamentous, microbial mats and
MDACs that outcrop on the sea floor (Hovland and Judd, 1988; Hovland and Sommerville,
1985; Thrasher et al., 1996). Such observations are typical for active seep systems, which
have been found at passive and active continental margins.
High fluxes of methane usually lead to the development of methanotrophic microbial
communities. Anaerobic methanotrophic archaea dominate submarine seep communities,
because they profit from the abundance of sulphate utilised as an electron acceptor for AOM
(Hinrichs and Boetius, 2002; Reeburgh, 1996). High AOM activities lead to high fluxes of
sulphide and the development of microbial mats of giant sulphide-oxidizing bacteria (e.g.
Beggiatoa sp.) and other thiotrophic organisms (Boetius and Suess, 2004; and literature
therein). Furthermore, methane venting at various cold seeps is associated with the
precipitation of MDACs which often contain lipid biomarkers of AOM communities
(Bohrmann et al., 1998; Diaz-del-Rio et al., 2003; Hovland et al., 1985; Hovland et al., 1987;
Michaelis et al., 2002; Peckmann et al., 1999; Roberts and Aharon, 1994; Thiel et al., 2001).
The phylogenetic origin of methanotrophic communities has been determined using
combinations of lipid analysis and 16S rDNA methods in several methane seep environments
(Boetius et al., 2000; Elvert et al., 1999; Hinrichs et al., 1999; Hoehler and Alperin, 1996;
Knittel et al., 2003; Knittel et al., 2005; Michaelis et al., 2002; Orphan et al., 2001b). Previous
works identified two groups of anaerobic methane oxidising (ANME) archaea, which are
phylogenetically related to methanogens (Methanosarcina sp.). Both ANME-1 and ANME-2
occur in consortia with relatives of a SRB cluster (Seep-SRB1) within the
Desulfosarcina/Desulfococcus branch (Knittel et al. 2003). Although the geology and biology
Chapter 6 Methane emission and consumption at a North Sea gas seep (Tommeliten area)
192
of a variety of shallow water cold seeps have been well investigated, there is still very little
known on the biogeochemistry and relevance of microbial methane consumption (Barry et al.,
1996; Barry et al., 1997; Bian et al., 2001; Bussmann et al., 1999; Dando and Hovland, 1992;
Garcia-Garcia et al., 2003; Thomsen et al., 2001). The aim of this investigation was to study
microbial processes related to methane seepage in shelf sediments. The main tasks were to
reveal the distribution and identity of methanotrophic microorganisms, the zonation and
magnitude of methane oxidation and to analyse the impact of methane venting on a sandy
benthic habitat of the North Sea.

Chapter 6 Methane emission and consumption at a North Sea gas seep (Tommeliten area)
193
2. MATERIALS AND METHODS
2.1 Field Observations
Visual observations of the Tommeliten sea floor were carried out with a remotely operated
vehicle (ROV “Sprint 103” of the Alfred Wegener Institute of Polar and Marine Research)
during a cruise with R/V Heincke in June 2002 (HE-169) and with a towed video camera in
October 2002 (HE-180). Gas flares in the water column were detected with a SES-2000
echosounder operated at different frequencies in the range of 10 to 100 kHz. The same
parametric echosounder was used for high-resolution sub-bottom profiling at frequencies
between 8 and 15 kHz. Video and echosounder images were used to select positions for
sediment sampling.
Figure 1. A chart of the survey area at Tommeliten showing sampling positions of vibrocoring, sea floor and hydroacoustic observations.
Chapter 6 Methane emission and consumption at a North Sea gas seep (Tommeliten area)
194
2.2 Sample Collection and Storage
Sediment samples were collected by vibrocoring (Institute of Baltic Sea Research) during the
cruise HE180 in October 2002. Three cores were recovered from seep areas (core 1860, 1866,
1904, Fig. 1) and one from a reference station (core 1867). Upon recovery, cores were
sectioned in 1 m pieces and kept in their plastic bags during subsampling of porewater
constituents (methane, sulphate, sulphide) and turnover rate measurements of methane and
sulphate. Replicate subsamples were obtained from a 10 cm section every 10 (cores 1866 and
1904) or 20 cm (core 1860). Samples for lipid biomarkers, cell counts and DNA were
collected from the same 10 cm sections of core 1904. Sediment samples for lipid analysis
were transferred into pre-cleaned glass vials and stored at –25 °C until extraction. Sediments
for microbiological analysis were fixed for fluorescent in situ hybridisation (FISH) or frozen
for DNA extraction. Pieces of MDACs were collected from the SMTZ at station 1904 and
stored at –25°C until extraction. MDACs from the surface of the sea floor were collected
earlier during a ROV expedition in 1998 (Hovland, 2002). Detailed protocols for the
following methods can be obtained from www.metrol.org.
2.3 Methane Concentrations
Methane concentrations from selected sediment horizons were determined according to the
“head space” method from 5 ml sediment fixed with 25 ml NaOH (2.5%, w/v) in gas-tight
glass vials as described previously (Treude et al., 2003). Immediately after sub-sampling,
methane concentrations were determined on board using a gas chromatograph as described
elsewhere (Treude et al., 2003).
Chapter 6 Methane emission and consumption at a North Sea gas seep (Tommeliten area)
195
2.4 Sulphate Concentrations
5ml of wet sediment were fixed in 50 ml corning vials with 25 ml zinc acetate solution (20%,
w/v). After vigorous shaking, sediment particles were separated by centrifugation and
filtration. Sulphate concentrations were determined from an aliquot of the supernatant using a
Waters HPLC system (Waters 512 HPLC pump, I.C.-Pak anion-column (Waters;
WAT007355) 4.6 x 50 mm, Waters 730 conductivity detector). Isophtalic acid (1mM) was
used as a solvent at a constant flow rate of 1ml min-1. Sulphate concentrations were corrected
for porosity, which was determined according to Treude et al. (2003).
2.5 Sulphide Concentrations
Total sulphide concentrations were determined using a combination of a WTW Multiline P4
multi meter equipped with a WTW pH/ION 340i ion meter with two coupled electrodes
(WTW Ag 500 / WTW Ag/S 5001) for S2- concentration measurements and a WTW SenTix
41-3 electrode for pH measurements. The S2- measuring section was calibrated against
standards of H2S/HS-/S2- at pHs of 6, 7, 8 and 9.
2.6 Ex situ AOM and SR Measurements
Subsamples for turnover rate measurements were collected from core 1904 by plugging glass
tubes (1 x 6 cm) into a defined sediment horizon of ca 10 cm (n = 5 for AOM and SR,
respectively) as described previously (Treude et al. 2005 and references therein). To prevent
gas exchange, the tubes were sealed with butyl rubber stoppers and only briefly opened for
radiotracer injection, i.e., 50 µl 14C-labelled methane and 5 µl 35S-labelled sulphate (tracer
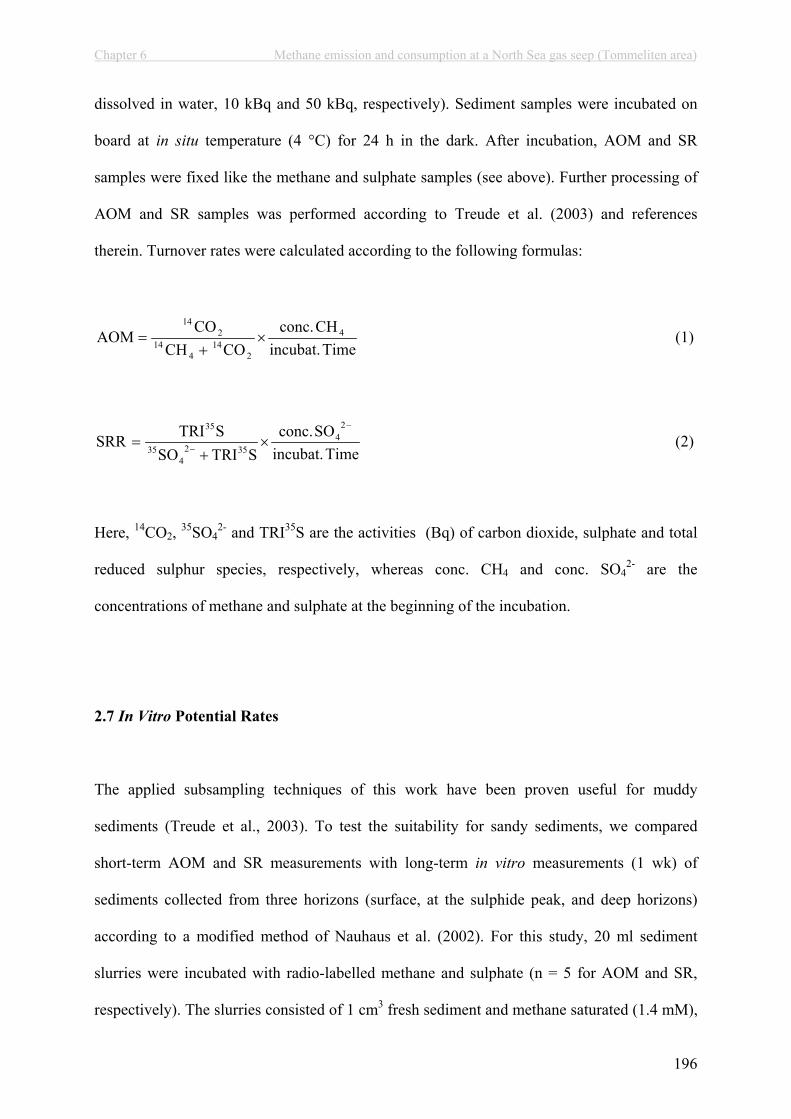
Chapter 6 Methane emission and consumption at a North Sea gas seep (Tommeliten area)
196
dissolved in water, 10 kBq and 50 kBq, respectively). Sediment samples were incubated on
board at in situ temperature (4 °C) for 24 h in the dark. After incubation, AOM and SR
samples were fixed like the methane and sulphate samples (see above). Further processing of
AOM and SR samples was performed according to Treude et al. (2003) and references
therein. Turnover rates were calculated according to the following formulas:
Timeincubat.CHconc.
COCHCOAOM 4
214
414
214
(1)
Timeincubat.SOconc.
STRISOSTRISRR
24
3524
35
35
(2)
Here, 14CO2, 35SO42- and TRI35S are the activities (Bq) of carbon dioxide, sulphate and total
reduced sulphur species, respectively, whereas conc. CH4 and conc. SO42- are the
concentrations of methane and sulphate at the beginning of the incubation.
2.7 In Vitro Potential Rates
The applied subsampling techniques of this work have been proven useful for muddy
sediments (Treude et al., 2003). To test the suitability for sandy sediments, we compared
short-term AOM and SR measurements with long-term in vitro measurements (1 wk) of
sediments collected from three horizons (surface, at the sulphide peak, and deep horizons)
according to a modified method of Nauhaus et al. (2002). For this study, 20 ml sediment
slurries were incubated with radio-labelled methane and sulphate (n = 5 for AOM and SR,
respectively). The slurries consisted of 1 cm3 fresh sediment and methane saturated (1.4 mM),
Chapter 6 Methane emission and consumption at a North Sea gas seep (Tommeliten area)
197
artificial sea water media with 28 mM sulphate (Widdel and Bak, 1992). As a control, slurries
from one horizon (100-150 cm, core 1904) were incubated without methane. After incubation,
sediment slurries were processed like those from short-term incubations.
2.8 Extraction of Sediment and MDAC Samples and Preparation of Derivatives
The extraction procedure and preparation of fatty acid methyl esters was carried out according
to Elvert and co-workers (2003). Briefly, total lipid extracts (TLE) were obtained from ca.
25g of wet sediment collected from core 1904 and from two MDAC pieces (one collected
from the surface of the sea floor and one from the SMTZ in core 1904). Prior to extraction,
the MDAC pieces were disintegrated with HCL (2M). The TLE was extracted by subsequent
ultrasonification using organic solvents of decreasing polarity. Internal standards of known
concentration and carbon isotopic compositions were added prior to extraction. Esterified
fatty acids (FAs) present in glyco- and phospholipids were cleaved by saponification with
methanolic KOH-solution. After extraction of the neutral lipid fraction from this mixture, FAs
were methylated for analysis with BF3 in methanol yielding fatty acid methyl esters
(FAMES).
Neutral lipids were further separated into hydrocarbons, ketones and alcohols on a SPE silica
glass cartridge (0.5 g packing). Prior to separation, the column was rinsed with 15 ml n-
hexane/dichloromethane (95:5, v/v). After application of the neutral fraction, solvent mixtures
of increasing polarity were subsequently added: (I) 5 ml n-hexane/dichloromethane (95:5,
v/v), (II) 5 ml n-hexane/dichloromethane (2:1, v/v) and (III) 5 ml dichloromethane/acetone
(9:1, v/v). Neutral lipid fractions (hydrocarbons (I), ketones (II) and alcohols (III),
respectively) were collected and concentrated to 100 µl using rotary evaporation. Finally,
Chapter 6 Methane emission and consumption at a North Sea gas seep (Tommeliten area)
198
neutral lipid fractions were stored at –20 °C until further processing and/or analysis. Alcohols
were analysed as trimethylsilyl (TMS) ethers. Shortly before analysis (<1 wk), aliquots from
selected alcohol fractions were dried under a stream of nitrogen. 100 µl pyridine and 50 µl
bis(trimethylsilyl)triflouracetamid were added and the reaction was carried out for 1 h at 70
°C. After cooling, excess solvent was evaporated and the remaining TMS adducts were re-
suspended in 50 µl of n-hexane. TMS adducts were stored at –20 °C until GC and GC-MS
analysis.
Sediments and the two MDAC pieces were additionally analysed for the content of tetraether
lipids. Tetraether lipids, which are contained in the alcohol fractions, were subjected to ether
cleavage through HI treatment as reported previously yielding phytanes and biphytanes which
can be analysed by GC (-MS and IRMS) analysis (Blumenberg et al., 2004; Kohnen et al.,
1992). Briefly, 500 µl HI (57%) and 500 µl acetic acid (100%) were added to a dried alcohol
fraction and iodisation of ether bonds was promoted at 110 °C for 4 h. After cooling, alkyl
iodides were extracted with n-hexane. Excess iodine was removed by adding sodium
thiosulphate solution (5%, w/v in water). Subsequently, the hexane phase was removed and
dried. Alkyl iodides were reduced to alkanes in 0.5 ml of tetrahydrofurane (THF) by adding
lithium-aluminium hydride (2 spatula tips). Reduction of iodides was carried out at 110 °C for
3 h. After cooling, excess lithium-aluminium hydride was deactivated by the addition of
deionised water. The supernatant solvent phase was removed, dried and stored at -20 °C.
2.9 Preparation of Dimethyl Disulphide (DMDS) Adducts
Double bond positions of monoenoic FAs were determined by analysis as DMDS adducts
according to previously reported methods (Moss and Lambert-Fair, 1989; Nichols et al.,
Chapter 6 Methane emission and consumption at a North Sea gas seep (Tommeliten area)
199
1986). Briefly, an aliquot of a selected sample (dissolved in 50µl n-hexane) was treated with
DMDS (100 µl) and iodine-diethyl ether solution (20 µl, 6% w/v). Formation of DMDS
adducts was carried out at 50 °C for 48 h. After cooling, excess iodine was reduced with
sodium thiosulphate (5% w/v in water). The organic phase was removed, dried and stored at –
20 °C.
2.10 Gas Chromatography (GC), Gas Chromatography-Mass Spectrometry (GC-MS),
Gas Chromatography-Isotope Ratio Mass Spectrometry (GC-IRMS)
Concentrations, identities and stable carbon isotope ratios of individual compounds were
determined by GC, GC-MS and GC-IRMS analyses, respectively. Instrument specifications
and operation modes of the GC, GC-MS and GC-IRMS were set according to Elvert and co-
workers (2003). Concentrations were calculated against internal standards. Identities of
acquired mass spectra were compared to known standards and published data. The chemical
structure of biphytanes are reviewed in Schouten et al. (1998): monocyclic biphytane reported
here equals compound IV and bicyclic biphytane compound V. Stable isotope ratios are given
in the -notation against PDB. 13C-values of FAs and alcohols were corrected for the
introduction of additional carbon atoms during derivatisation. Internal standards were used to
monitor precision and reproducibility during measurements. Reported 13C-values have an
analytical error of 1-2 ‰.
Chapter 6 Methane emission and consumption at a North Sea gas seep (Tommeliten area)
200
2.11 Cell Counts and Fluorescence In Situ Hybridisation
Selected sediment samples from core 1904 were fixed with 2 % formaldehyde and stored at
4°C until further analysis. Total cell numbers were quantified with the aid of epifluorescence
microscopy after staining the cells with Acridine Orange according to Knittel et al. (2003).
Sediments from above, below and within the SMTZ were analysed for the presence of
archaea and bacteria by fluorescence in situ hybridization with horseradish peroxidase (HRP)-
labelled oligonucleotide probes and tyramide signal amplification (CARD-FISH) according to
the method of Pernthaler et al. (2002). The CARD-FISH probes used in this study were
EUB338, ARCH915 and ANME1-350, purchased from biomers.net GmbH, Ulm, Germany.
Oligonucleotide probes and instrument specification are presented in Knittel et al. (2005).
Briefly, after 2 hours fixation at 4°C, formaldehyde fixed sediments were washed with 1xPBS
(10 mM sodium phosphate, 130 mM NaCl) and stored in 1xPBS/EtOH (1:1) at -20°C. These
samples were diluted 1:10, treated by sonification and filtered on 0.2 µm GTTP polycarbonate
filters. Prior to filtration, filters were coated with agarose to prevent cell loss. In addition to
ultrasonification, cells were permeabilised with lysozyme solution for 1 h at 37° C and
subsequently hybridised with HRP labelled probe for 2 h at 35 °C. Finally, filters were
incubated for 15 min in tyramide solution labelled with the fluorochrome Cy-3.
2.12 DNA Extraction and Clone Library Construction
Total community DNA was directly extracted from ca. 5 g of wet sediment from the SMTZ of
core 1904 according to Zhou et al. (1996). Crude DNA was purified with the Wizard DNA
Clean-Up Kit (Promega, Madison, WI). Almost full-length archaeal and bacterial 16S rRNA
genes from the extracted chromosomal DNAs were amplified using primers 20f (Massana et

Chapter 6 Methane emission and consumption at a North Sea gas seep (Tommeliten area)
201
al., 1997) and Uni1392R (Lane et al., 1985) for archaea and GM3F (Muyzer et al., 1995) and
GM4R (Kane et al., 1993) for bacteria. Polymerase chain reactions (PCRs) were performed
with a Mastercycler Gradient (Eppendorf, Hamburg, Germany) as described previously
(Ravenschlag et al., 1999), except that the annealing temperature was 58°C and 42°C for
archaea and bacteria, respectively. PCR products of several reactions were combined and
purified with the QiaQuick PCR Purification Kit (Qiagen, Hilden, Germany). DNA was
ligated in the pGEM T-Easy vector (Promega, Madison, WI) and transformed into E. coli
TOP10 cells (Invitrogen, Carlsbad, CA) according to the manufacturer’s recommendations.
Sequencing was performed by Taq cycle sequencing with a model ABI1377 sequencer
(Applied Biosystems) with insert-specific and vector primers. The absence of chimeric
sequences in the clone libraries was verified with the CHIMERA_CHECK program of the
Ribosomal Database Project II (http://rdp.cme.msu.edu/html/analyses.html). A total of 57
archaeal and 54 bacterial clones were partially sequenced (~ 0.5 kb). Using the ARB software
package, these sequences were calculated into existing phylogenetic trees by parsimony
without allowing changes in the tree topology. Representative sequences of each cluster were
then fully sequenced (~1.3 kb) and matched against the NCBI data base
(http://www.ncbi.nlm.nih.gov/BLAST). The sequence data reported here will appear in the
EMBL, GenBank, and DDBJ nucleotide sequence databases under the accession numbers
DQ007532 to DQ007540.
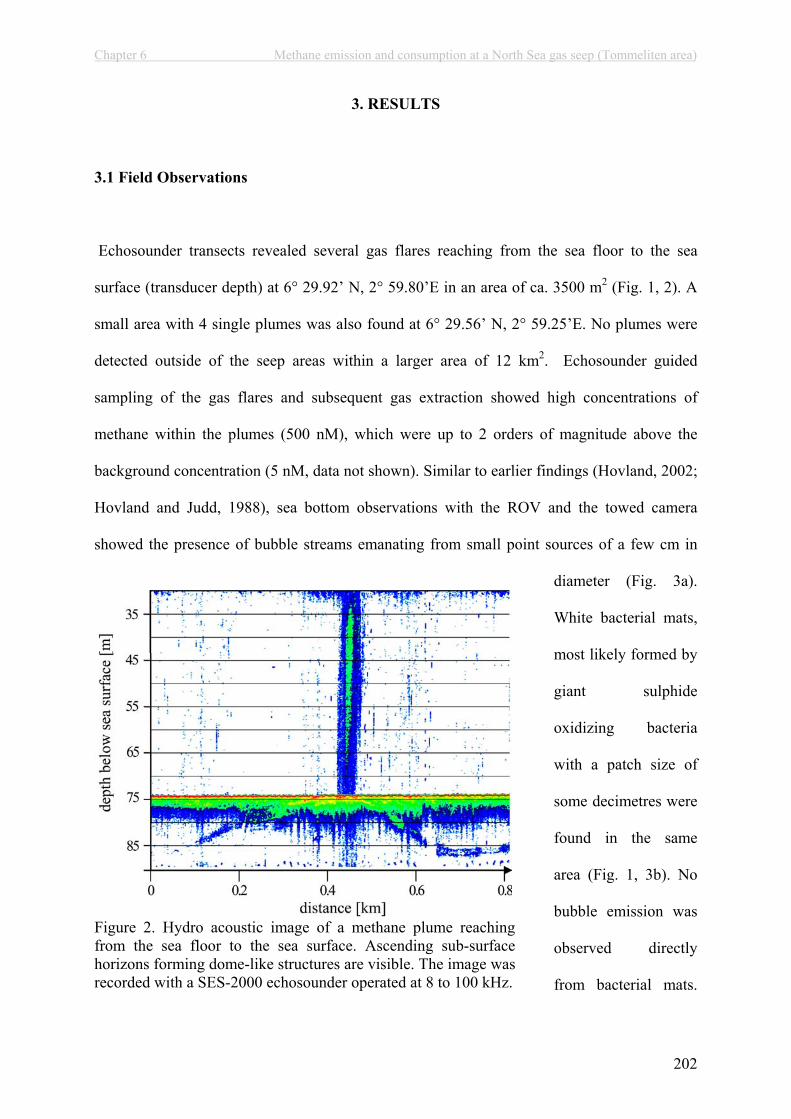
Chapter 6 Methane emission and consumption at a North Sea gas seep (Tommeliten area)
202
3. RESULTS
3.1 Field Observations
Echosounder transects revealed several gas flares reaching from the sea floor to the sea
surface (transducer depth) at 6° 29.92’ N, 2° 59.80’E in an area of ca. 3500 m2 (Fig. 1, 2). A
small area with 4 single plumes was also found at 6° 29.56’ N, 2° 59.25’E. No plumes were
detected outside of the seep areas within a larger area of 12 km2. Echosounder guided
sampling of the gas flares and subsequent gas extraction showed high concentrations of
methane within the plumes (500 nM), which were up to 2 orders of magnitude above the
background concentration (5 nM, data not shown). Similar to earlier findings (Hovland, 2002;
Hovland and Judd, 1988), sea bottom observations with the ROV and the towed camera
showed the presence of bubble streams emanating from small point sources of a few cm in
diameter (Fig. 3a).
White bacterial mats,
most likely formed by
giant sulphide
oxidizing bacteria
with a patch size of
some decimetres were
found in the same
area (Fig. 1, 3b). No
bubble emission was
observed directly
from bacterial mats.
Figure 2. Hydro acoustic image of a methane plume reaching from the sea floor to the sea surface. Ascending sub-surface horizons forming dome-like structures are visible. The image was recorded with a SES-2000 echosounder operated at 8 to 100 kHz.
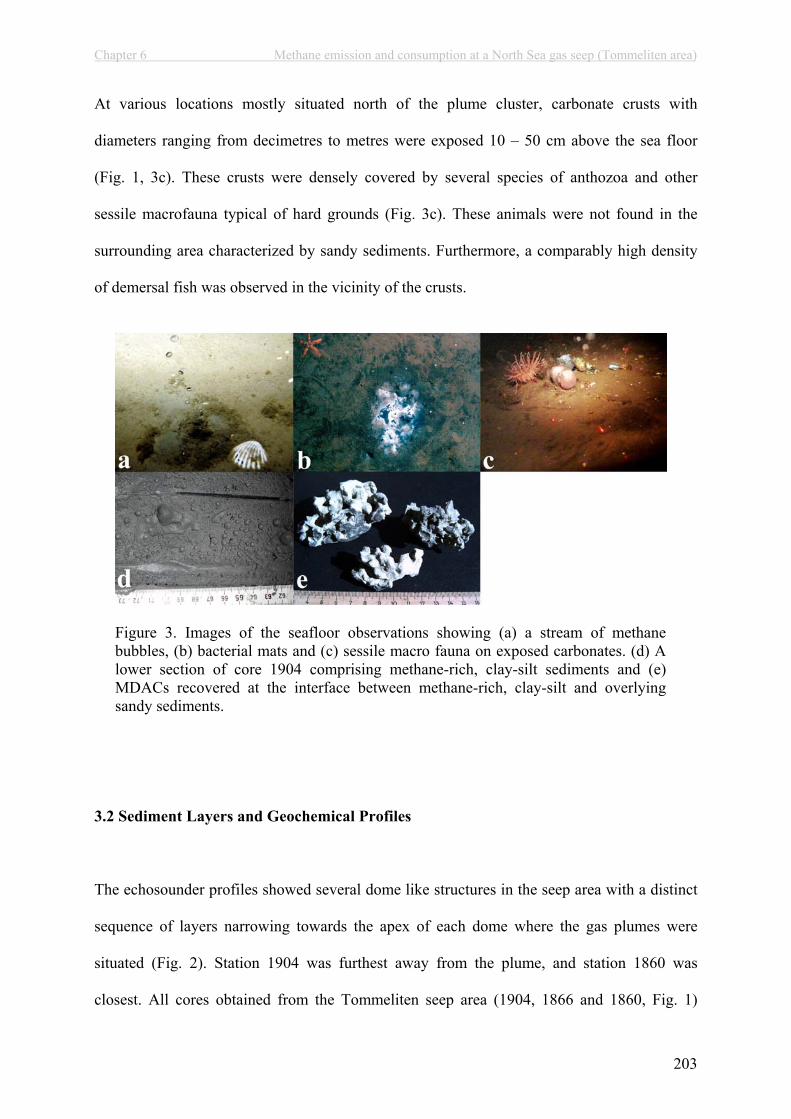
Chapter 6 Methane emission and consumption at a North Sea gas seep (Tommeliten area)
203
At various locations mostly situated north of the plume cluster, carbonate crusts with
diameters ranging from decimetres to metres were exposed 10 – 50 cm above the sea floor
(Fig. 1, 3c). These crusts were densely covered by several species of anthozoa and other
sessile macrofauna typical of hard grounds (Fig. 3c). These animals were not found in the
surrounding area characterized by sandy sediments. Furthermore, a comparably high density
of demersal fish was observed in the vicinity of the crusts.
Figure 3. Images of the seafloor observations showing (a) a stream of methane bubbles, (b) bacterial mats and (c) sessile macro fauna on exposed carbonates. (d) A lower section of core 1904 comprising methane-rich, clay-silt sediments and (e) MDACs recovered at the interface between methane-rich, clay-silt and overlying sandy sediments.
3.2 Sediment Layers and Geochemical Profiles
The echosounder profiles showed several dome like structures in the seep area with a distinct
sequence of layers narrowing towards the apex of each dome where the gas plumes were
situated (Fig. 2). Station 1904 was furthest away from the plume, and station 1860 was
closest. All cores obtained from the Tommeliten seep area (1904, 1866 and 1860, Fig. 1)
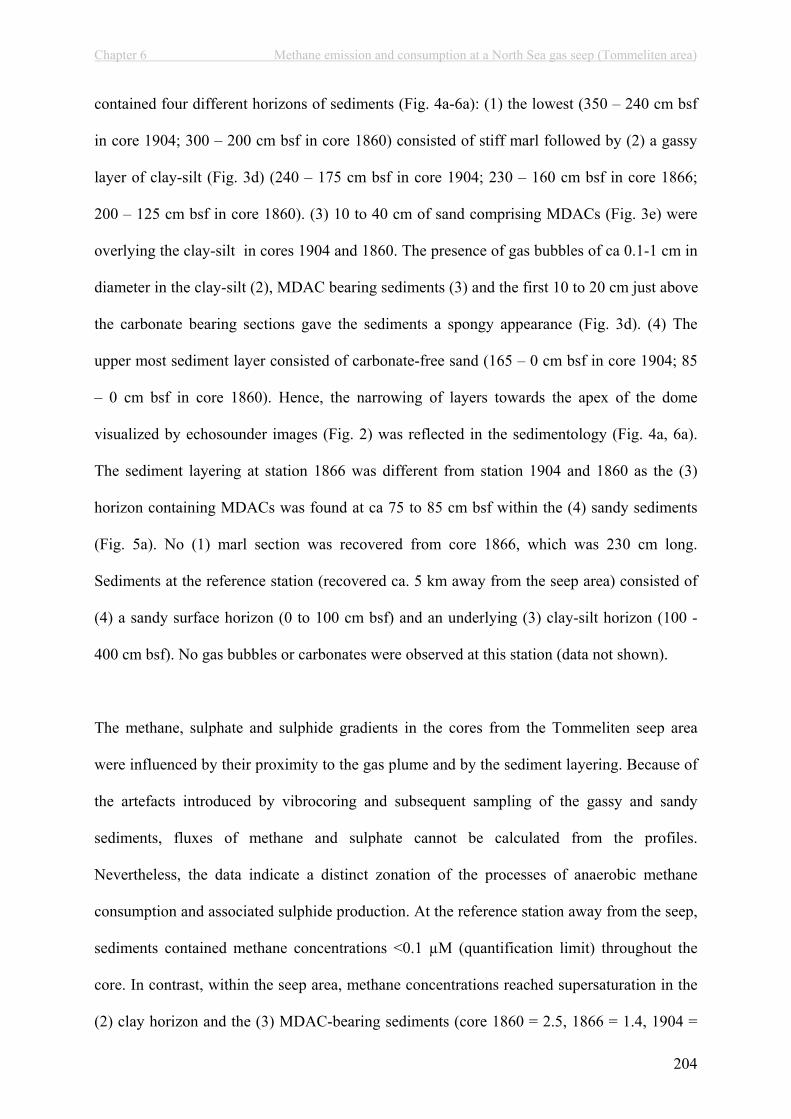
Chapter 6 Methane emission and consumption at a North Sea gas seep (Tommeliten area)
204
contained four different horizons of sediments (Fig. 4a-6a): (1) the lowest (350 – 240 cm bsf
in core 1904; 300 – 200 cm bsf in core 1860) consisted of stiff marl followed by (2) a gassy
layer of clay-silt (Fig. 3d) (240 – 175 cm bsf in core 1904; 230 – 160 cm bsf in core 1866;
200 – 125 cm bsf in core 1860). (3) 10 to 40 cm of sand comprising MDACs (Fig. 3e) were
overlying the clay-silt in cores 1904 and 1860. The presence of gas bubbles of ca 0.1-1 cm in
diameter in the clay-silt (2), MDAC bearing sediments (3) and the first 10 to 20 cm just above
the carbonate bearing sections gave the sediments a spongy appearance (Fig. 3d). (4) The
upper most sediment layer consisted of carbonate-free sand (165 – 0 cm bsf in core 1904; 85
– 0 cm bsf in core 1860). Hence, the narrowing of layers towards the apex of the dome
visualized by echosounder images (Fig. 2) was reflected in the sedimentology (Fig. 4a, 6a).
The sediment layering at station 1866 was different from station 1904 and 1860 as the (3)
horizon containing MDACs was found at ca 75 to 85 cm bsf within the (4) sandy sediments
(Fig. 5a). No (1) marl section was recovered from core 1866, which was 230 cm long.
Sediments at the reference station (recovered ca. 5 km away from the seep area) consisted of
(4) a sandy surface horizon (0 to 100 cm bsf) and an underlying (3) clay-silt horizon (100 -
400 cm bsf). No gas bubbles or carbonates were observed at this station (data not shown).
The methane, sulphate and sulphide gradients in the cores from the Tommeliten seep area
were influenced by their proximity to the gas plume and by the sediment layering. Because of
the artefacts introduced by vibrocoring and subsequent sampling of the gassy and sandy
sediments, fluxes of methane and sulphate cannot be calculated from the profiles.
Nevertheless, the data indicate a distinct zonation of the processes of anaerobic methane
consumption and associated sulphide production. At the reference station away from the seep,
sediments contained methane concentrations <0.1 µM (quantification limit) throughout the
core. In contrast, within the seep area, methane concentrations reached supersaturation in the
(2) clay horizon and the (3) MDAC-bearing sediments (core 1860 = 2.5, 1866 = 1.4, 1904 =
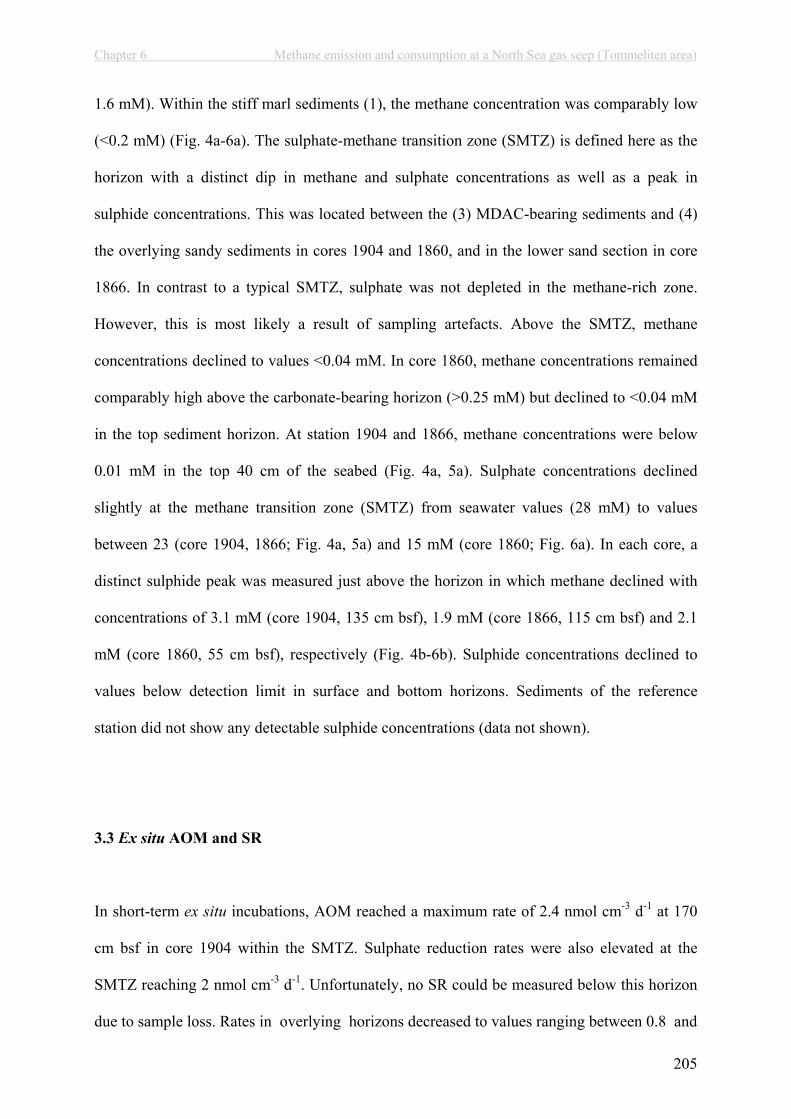
Chapter 6 Methane emission and consumption at a North Sea gas seep (Tommeliten area)
205
1.6 mM). Within the stiff marl sediments (1), the methane concentration was comparably low
(<0.2 mM) (Fig. 4a-6a). The sulphate-methane transition zone (SMTZ) is defined here as the
horizon with a distinct dip in methane and sulphate concentrations as well as a peak in
sulphide concentrations. This was located between the (3) MDAC-bearing sediments and (4)
the overlying sandy sediments in cores 1904 and 1860, and in the lower sand section in core
1866. In contrast to a typical SMTZ, sulphate was not depleted in the methane-rich zone.
However, this is most likely a result of sampling artefacts. Above the SMTZ, methane
concentrations declined to values <0.04 mM. In core 1860, methane concentrations remained
comparably high above the carbonate-bearing horizon (>0.25 mM) but declined to <0.04 mM
in the top sediment horizon. At station 1904 and 1866, methane concentrations were below
0.01 mM in the top 40 cm of the seabed (Fig. 4a, 5a). Sulphate concentrations declined
slightly at the methane transition zone (SMTZ) from seawater values (28 mM) to values
between 23 (core 1904, 1866; Fig. 4a, 5a) and 15 mM (core 1860; Fig. 6a). In each core, a
distinct sulphide peak was measured just above the horizon in which methane declined with
concentrations of 3.1 mM (core 1904, 135 cm bsf), 1.9 mM (core 1866, 115 cm bsf) and 2.1
mM (core 1860, 55 cm bsf), respectively (Fig. 4b-6b). Sulphide concentrations declined to
values below detection limit in surface and bottom horizons. Sediments of the reference
station did not show any detectable sulphide concentrations (data not shown).
3.3 Ex situ AOM and SR
In short-term ex situ incubations, AOM reached a maximum rate of 2.4 nmol cm-3 d-1 at 170
cm bsf in core 1904 within the SMTZ. Sulphate reduction rates were also elevated at the
SMTZ reaching 2 nmol cm-3 d-1. Unfortunately, no SR could be measured below this horizon
due to sample loss. Rates in overlying horizons decreased to values ranging between 0.8 and
Chapter 6 Methane emission and consumption at a North Sea gas seep (Tommeliten area)
206
Figu
re 4
. Sta
tion
1904
. (a)
Met
hane
and
sul
phat
e co
ncen
tratio
ns d
eclin
e at
dep
th o
f M
DA
C b
earin
g se
dim
ents
(15
0 cm
bsf
.). (
b) N
ote
that
su
lphi
de c
once
ntra
tions
, (c)
pot
entia
l met
hane
oxi
datio
n an
d (d
) su
lpha
te r
educ
tion
rate
s, (e
) ex
situ
mea
sure
d m
etha
ne o
xida
tion
and
sulp
hate
re
duct
ion
rate
s, (f
) cel
l cou
nts,
(g) c
once
ntra
tions
and
(h) s
tabl
e ca
rbon
isot
ope
valu
es o
f sel
ecte
d, b
acte
rial f
atty
aci
ds a
nd (i
) con
cent
ratio
ns o
f cl
eave
d, a
rcha
eal t
etra
ethe
r lip
ids p
eak
at th
e m
etha
ne-s
ulph
ate
trans
ition
zon
e. E
rror
s are
giv
en a
s sta
ndar
d er
rors
.
Chapter 6 Methane emission and consumption at a North Sea gas seep (Tommeliten area)
207
Figu
re 6
. St
atio
n 18
60.
(a)
Met
hane
and
sul
phat
e co
ncen
tratio
ns
decl
ine
at
dept
h of
ca
rbon
ate
bear
ing
sedi
men
ts
(70
cm
bsf)
. H
omol
ogou
s to
cor
e 19
04, (
b) s
ulph
ide
conc
entra
tions
and
pot
entia
l ra
tes
of (c
) met
hane
oxi
datio
n an
d (d
) sul
phat
e re
duct
ion
are
high
est
at th
e su
lpha
te-m
etha
ne tr
ansi
tion
zone
. Er
rors
are
giv
en a
s st
anda
rd
erro
rs.
Figu
re 5
. St
atio
n 18
66.
(a)
Met
hane
and
sul
phat
e co
ncen
tratio
ns
decl
ine
belo
w
carb
onat
e be
arin
g se
dim
ents
(1
00
cm
bsf)
. H
omol
ogou
s to
cor
e 19
04, (
b) s
ulph
ide
conc
entra
tions
and
pot
entia
l ra
tes
of (c
) met
hane
oxi
datio
n an
d (d
) sul
phat
e re
duct
ion
are
high
est
at th
e su
lpha
te-m
etha
ne tr
ansi
tion
zone
. Er
rors
are
giv
en a
s sta
ndar
d er
rors
.
Chapter 6 Methane emission and consumption at a North Sea gas seep (Tommeliten area)
208
0.1 nmol cm-3 (Fig. 4e). Highest SR were detected in the surface horizon (3.5 nmol cm-3 d-1).
AOM and SR were highly variable between replicate subsamples within one horizon leading
to standard errors of up to 83 % of the mean (Fig. 4e).
3.4 In Vitro Rates at Methane Saturation
Potential AOM and SR rates (AOMmax, SRmax) measured in long-term incubations were
highest in sediments collected from the SMTZ with 1.4 to 3 and 2.9 to 4.6 nmol cm-3 d-1,
respectively (Fig. 4c, d - 6c, d). In these incubations, the ratio of AOM to SR was 1:1 in core
1904, 0.3:1 in core 1866 and 0.5:1 core 1860. In sediment slurries from the SMTZ at station
1904, SR without methane was 70% lower compared to incubations with methane. This
indicates a close coupling between AOM and SR. AOMmax and SRmax were substantially
lower in slurries obtained from horizons above and below the SMTZ (Fig. 4c,d-6c,d).
3.5 Biomarker Signatures
3.5.1 Sediments
Concentration measurements of single lipid compounds showed maxima of specific bacterial
FAs and archaeal isoprenoidal lipids in sediments from the SMTZ of core 1904 (150 – 180
cm bsf; Fig. 4g, i, Tab. 1). At this horizon, stable carbon isotope analysis revealed the highest
depletion in 13C with minimum values of –79‰ (sn2-hydroxyarchaeol) in archaeal diether
lipids (Fig. 7) and –50‰ (ai-C15:0) in bacterial FAs (Fig. 4h, Fig. 9). The concentration of
both archaeal and bacterial lipids decreased just above and below the SMTZ where these
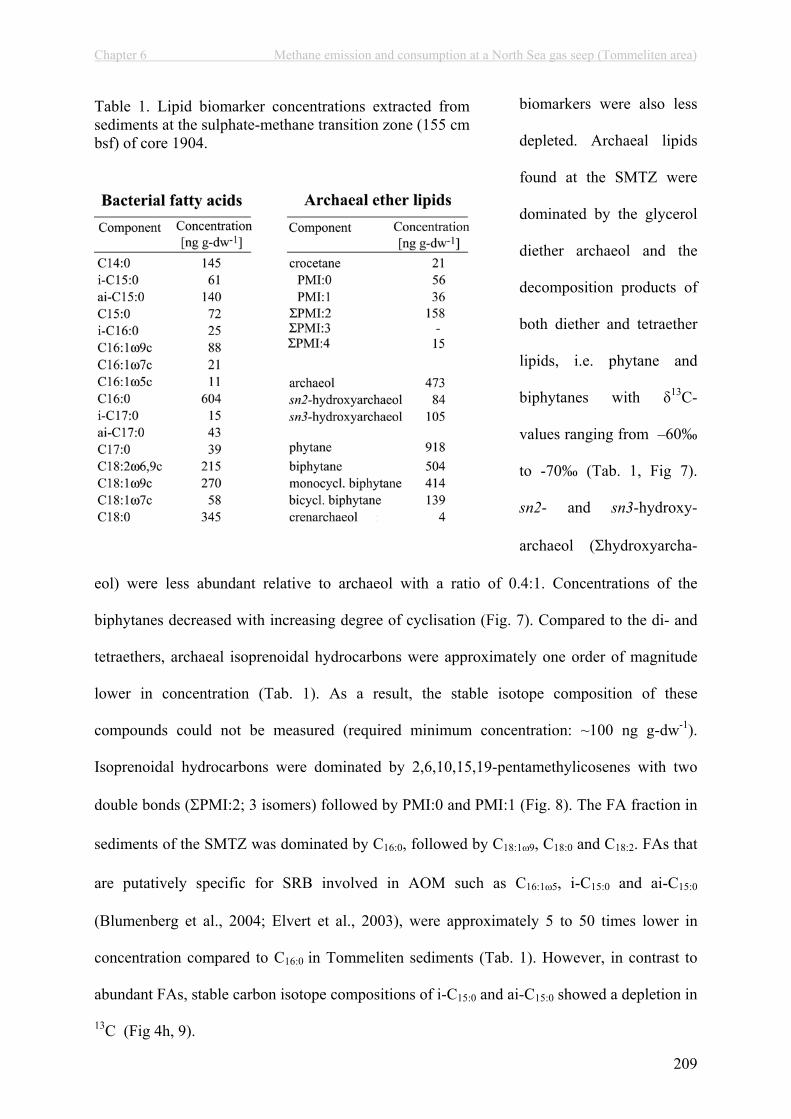
Chapter 6 Methane emission and consumption at a North Sea gas seep (Tommeliten area)
209
biomarkers were also less
depleted. Archaeal lipids
found at the SMTZ were
dominated by the glycerol
diether archaeol and the
decomposition products of
both diether and tetraether
lipids, i.e. phytane and
biphytanes with 13C-
values ranging from –60‰
to -70‰ (Tab. 1, Fig 7).
sn2- and sn3-hydroxy-
archaeol ( hydroxyarcha-
eol) were less abundant relative to archaeol with a ratio of 0.4:1. Concentrations of the
biphytanes decreased with increasing degree of cyclisation (Fig. 7). Compared to the di- and
tetraethers, archaeal isoprenoidal hydrocarbons were approximately one order of magnitude
lower in concentration (Tab. 1). As a result, the stable isotope composition of these
compounds could not be measured (required minimum concentration: ~100 ng g-dw-1).
Isoprenoidal hydrocarbons were dominated by 2,6,10,15,19-pentamethylicosenes with two
double bonds ( PMI:2; 3 isomers) followed by PMI:0 and PMI:1 (Fig. 8). The FA fraction in
sediments of the SMTZ was dominated by C16:0, followed by C18:1 9, C18:0 and C18:2. FAs that
are putatively specific for SRB involved in AOM such as C16:1 5, i-C15:0 and ai-C15:0
(Blumenberg et al., 2004; Elvert et al., 2003), were approximately 5 to 50 times lower in
concentration compared to C16:0 in Tommeliten sediments (Tab. 1). However, in contrast to
abundant FAs, stable carbon isotope compositions of i-C15:0 and ai-C15:0 showed a depletion in
13C (Fig 4h, 9).
Table 1. Lipid biomarker concentrations extracted from sediments at the sulphate-methane transition zone (155 cm bsf) of core 1904.
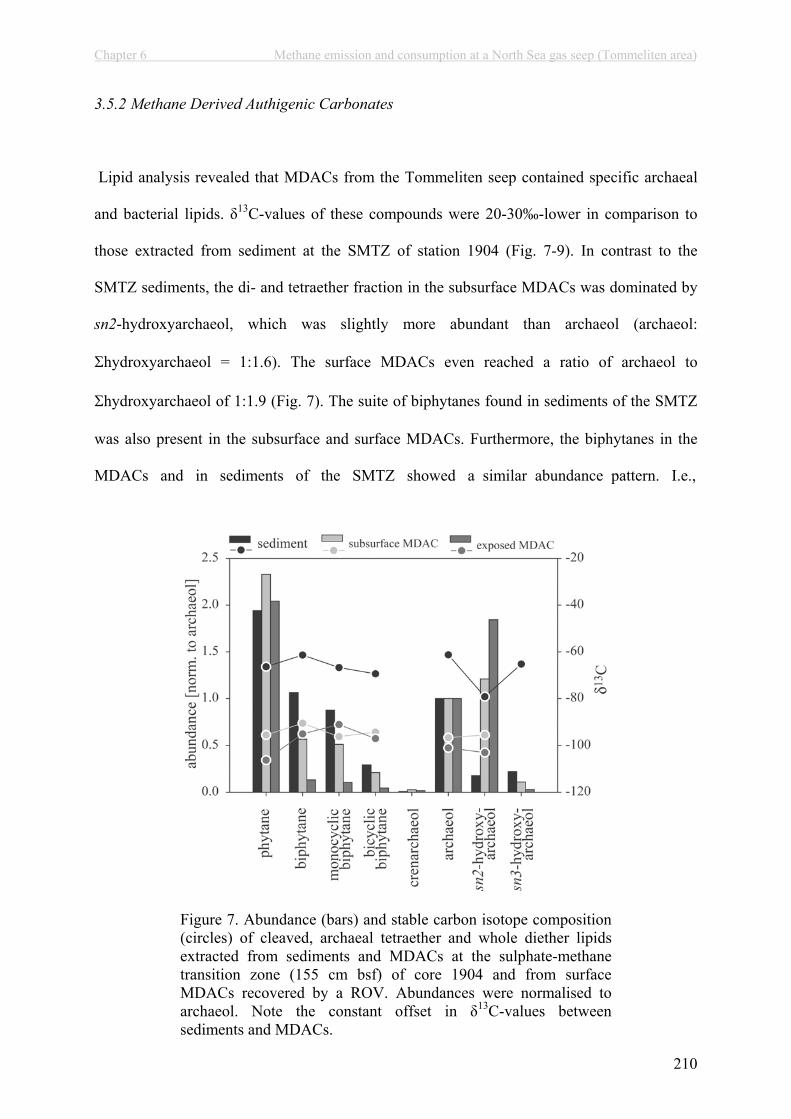
Chapter 6 Methane emission and consumption at a North Sea gas seep (Tommeliten area)
210
3.5.2 Methane Derived Authigenic Carbonates
Lipid analysis revealed that MDACs from the Tommeliten seep contained specific archaeal
and bacterial lipids. 13C-values of these compounds were 20-30‰-lower in comparison to
those extracted from sediment at the SMTZ of station 1904 (Fig. 7-9). In contrast to the
SMTZ sediments, the di- and tetraether fraction in the subsurface MDACs was dominated by
sn2-hydroxyarchaeol, which was slightly more abundant than archaeol (archaeol:
hydroxyarchaeol = 1:1.6). The surface MDACs even reached a ratio of archaeol to
hydroxyarchaeol of 1:1.9 (Fig. 7). The suite of biphytanes found in sediments of the SMTZ
was also present in the subsurface and surface MDACs. Furthermore, the biphytanes in the
MDACs and in sediments of the SMTZ showed a similar abundance pattern. I.e.,
Figure 7. Abundance (bars) and stable carbon isotope composition (circles) of cleaved, archaeal tetraether and whole diether lipids extracted from sediments and MDACs at the sulphate-methane transition zone (155 cm bsf) of core 1904 and from surface MDACs recovered by a ROV. Abundances were normalised to archaeol. Note the constant offset in 13C-values between sediments and MDACs.

Chapter 6 Methane emission and consumption at a North Sea gas seep (Tommeliten area)
211
concentrations of the biphytanes decreased with higher degrees of cyclisation. However, in
contrast to sediments of the SMTZ, the abundance of biphy-tanes relative to archaeol and
phytane was lower in the subsurface MDACs and lowest in surface MDACs (Fig. 7).
Furthermore, PMIs in the MDACs showed higher degrees of saturation (Fig. 8) and a higher
number of isomers compared to sediments of the SMTZ. PMI:1 comprised 4, PMI:2 5 and
PMI:3 2 isomers. Notably, surface MDACs contained very high amounts of crocetane.
Stable carbon isotope compositions of diethers, tetraethers and isoprenoid hydrocarbons were
uniformly <-90 ‰, both in the subsurface and the surface MDACs. An exception was
crocetane showing 13C values of –70 and –55 ‰ in the subsurface and the surface MDACs,
respectively (Fig. 8). Variations in 13C-values among the PMI isomers were small with a
Figure 8. Abundance (bars) and stable carbon isotope composition (circles) of archaeal, isoprenoid hydrocarbon lipids extracted from sediments and MDACs at the sulphate-methane transition zone (155 cm bsf) of core 1904 and from surface MDACs recovered by a ROV. Abundances were normalised to PMI:0. Note that concentrations of crocetane are ca. 7.5-fold increased in surface MDACs. Low concentrations prohibited 13C-measurements of hydrocarbons in the sediment.

Chapter 6 Methane emission and consumption at a North Sea gas seep (Tommeliten area)
212
maximum of 2 ‰. As with the biphytanes, the FA abundance pattern of the subsurface
MDACs showed comparably high similarities to the pattern found in sediments of the SMTZ,
whereas the abundance pattern of the surface MDACs showed lower similarities (Fig. 9).
Subsurface MDACs contained roughly twice as much i-C15:0 than ai-C15:0 while this ratio was
almost 1:1 in surface carbonates. In the subsurface MDACs, i-C15:0 and ai-C15:0 were the most
13C-depleted FAs with values down to -62‰. In contrast, the most 13C-depleted FA found in
the surface MDACs was C16:1 5 with a 13C-value of –80‰ while i-C15:0 and ai-C15:0 showed
values of -67‰ and -65‰, respectively (Fig. 9).
Figure 9. Abundance (bars) and stable carbon isotope composition (circles) of fatty acids extracted from sediments and MDACs at the sulphate-methane transition zone (155 cm bsf) of core 1904 and from surface MDACs recovered by a ROV. Abundances were normalised to i-C15:0. i-C15:0, ai-C15:0 and C16:1 5, are among the most depleted fatty acids. Note the offset in 13C-values between sediments and MDACs.
Chapter 6 Methane emission and consumption at a North Sea gas seep (Tommeliten area)
213
3.6 Archaeal and Bacterial Clone Libraries
One archaeal and one bacterial clone library were constructed from a sediment sample from
the SMTZ of station 1904 to study the microbial diversity in the AOM zone. A total of 57
archaeal and 54 bacterial clones were partially sequenced (~ 0.5 kb). From each phylogenetic
group, one representative sequence was almost fully (~1.5 kb) sequenced. The obtained 16S
rDNA archaeal clone library showed a low diversity in comparison to previous publications
of methane seep systems (Mills et al., 2003; Orphan et al., 2002; Teske et al., 2002). Two
different phylogentic groups of archaea were detected (Tab. 2). The ANME-1b cluster
(Methanosarcinales) accounted for 98 % of obtained sequences. The second group comprised
a single clone sequence, which belongs to the Marine Benthic Group D (Thermoplamatales).
Other ANME groups or methanogens were not detected.
The bacterial clone library consisted of seven uncultivated, methane seep-related lineages.
The next relatives to all sequences obtained are commonly found in marine cold seeps (Tab.
2). Most abundant were clones of the -Proteobacteria comprising sequences of the putative
bacterial partner for AOM (26% of bacterial clone sequences), i.e. the Seep-SRB1 cluster
(Knittel et al., 2003). One other abundant group among the -Proteobacteria were the
Desulfoarculaceae (26%). 38% of bacterial sequences were distantly related to the
Haloanaerobiales, which belong to the Firmicutes.
3.7 Total Cell Counts and ANME-1 Abundance
Direct cell counts showed highest numbers in surface sediment horizons (23.2 *108 cells cm-3
at 30 cm bsf). Cell counts decreased below this horizon to values <0.2*108 cells cm-3 at 130
cm bsf but showed an increase in sediments of the SMTZ (1.1 – 1.3 *108 cells cm-3 at 150 –
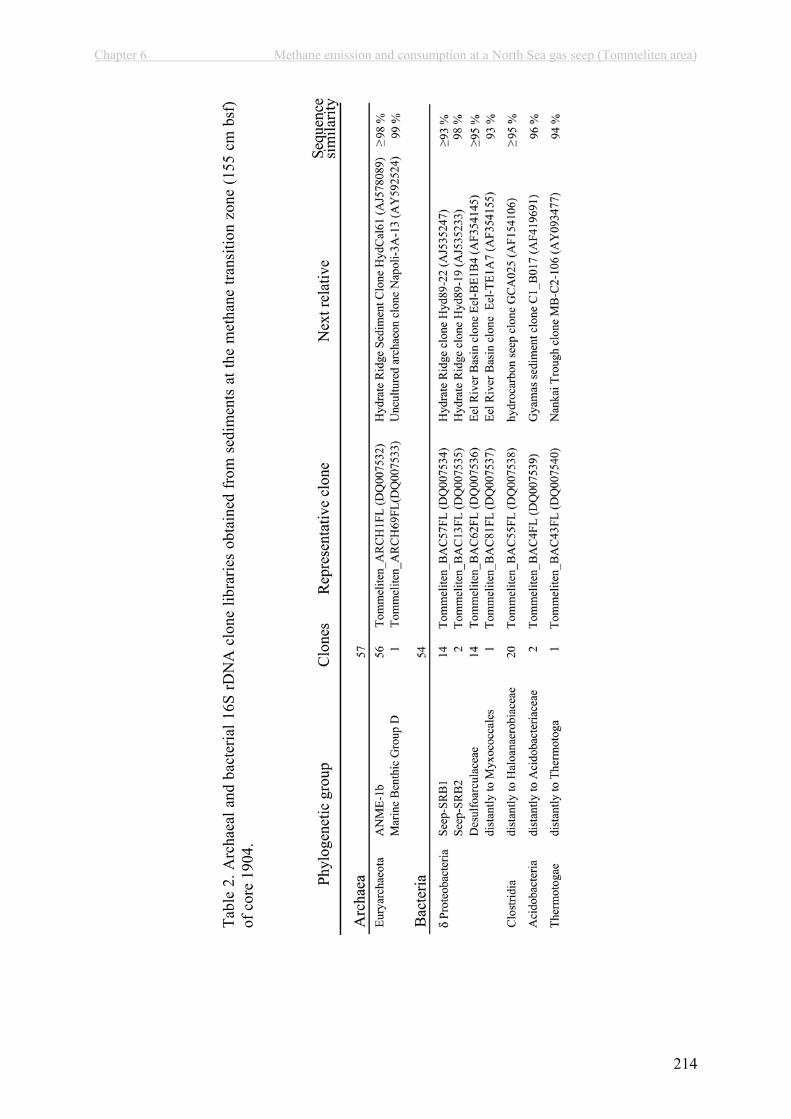
Chapter 6 Methane emission and consumption at a North Sea gas seep (Tommeliten area)
214
Tabl
e 2.
Arc
haea
l and
bac
teria
l 16S
rDN
A c
lone
libr
arie
s ob
tain
ed fr
om s
edim
ents
at t
he m
etha
ne tr
ansi
tion
zone
(155
cm
bsf
) of
cor
e 19
04.
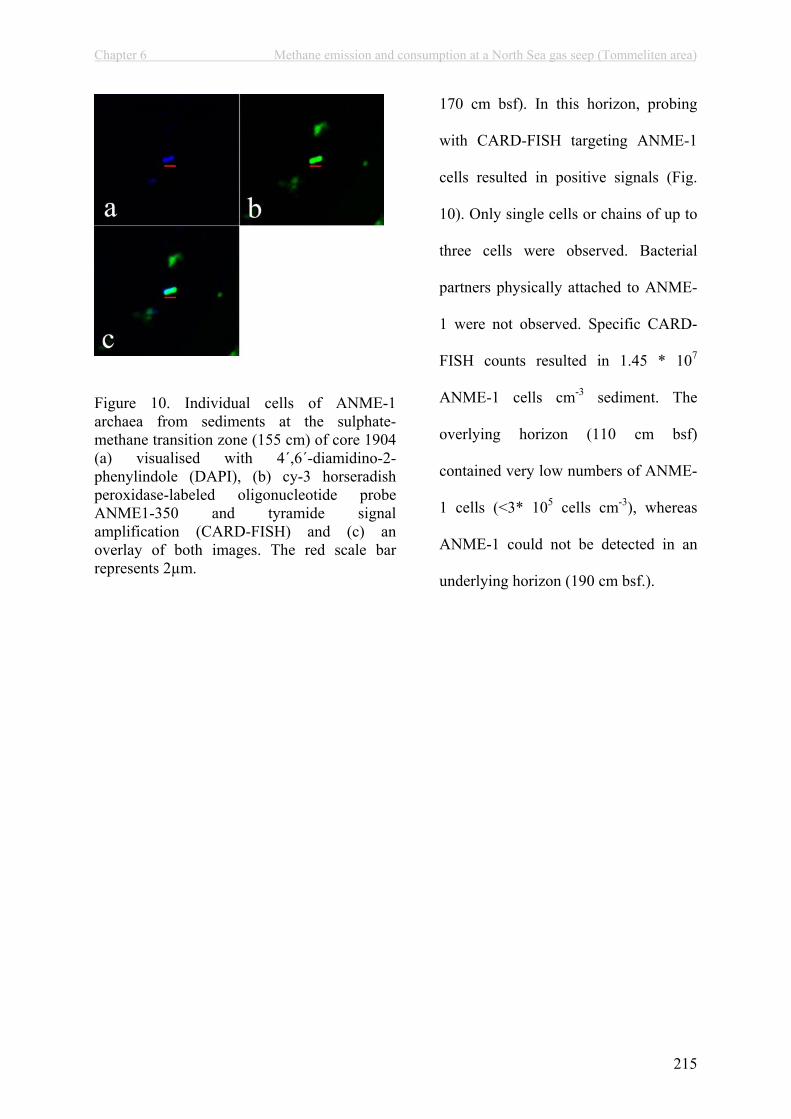
Chapter 6 Methane emission and consumption at a North Sea gas seep (Tommeliten area)
215
170 cm bsf). In this horizon, probing
with CARD-FISH targeting ANME-1
cells resulted in positive signals (Fig.
10). Only single cells or chains of up to
three cells were observed. Bacterial
partners physically attached to ANME-
1 were not observed. Specific CARD-
FISH counts resulted in 1.45 * 107
ANME-1 cells cm-3 sediment. The
overlying horizon (110 cm bsf)
contained very low numbers of ANME-
1 cells (<3* 105 cells cm-3), whereas
ANME-1 could not be detected in an
underlying horizon (190 cm bsf.).
Figure 10. Individual cells of ANME-1 archaea from sediments at the sulphate-methane transition zone (155 cm) of core 1904 (a) visualised with 4´,6´-diamidino-2-phenylindole (DAPI), (b) cy-3 horseradish peroxidase-labeled oligonucleotide probe ANME1-350 and tyramide signal amplification (CARD-FISH) and (c) an overlay of both images. The red scale bar represents 2µm.
Chapter 6 Methane emission and consumption at a North Sea gas seep (Tommeliten area)
216
4. DISCUSSION
4.1 Methane Emission from the Tommeliten Seep Area
Two decades after the discovery of gas seeps in the Tommeliten area by Hovland and Judd
(1988), we revisited this area for video and biogeochemical surveys. The Tommeliten area is
located in the central North Sea (56° 29.90’ N, 2° 59.80’ E) above three salt diapiers. Here,
the so-called Delta structure has pierced the enclosing sedimentary rocks allowing methane to
migrate to surface sediments. During ROV surveys, Hovland and Judd (1988) identified
several small gas vents emitting single streams of methane bubbles from the sandy seabed
into the hydrosphere. High reflective, small patches (<5 m across, ~0.5 m deep) noted on
short-range side-scan sonar records, which the authors termed “eyed pockmarks”, were found
to comprise MDAC crusts serving as a hard substrate for a variety of anthozoa such as sea-
anemones and sea pens. Furthermore, it was estimated that the flux of gas from the wider seep
area of 6500 m2 was 47 g CH4 m-2 yr-1 (Hovland and Judd, 1992; Hovland et al. 1993). Two
decades later, our observations provide evidence that the Tommeliten seep area is still active.
Here, several gas flares reaching almost to the sea surface were recorded by hydroacoustic
profiling (Fig. 2) and video surveys provided evidence for bubble streams being emitted from
the sandy sea floor (Fig. 3a). From these observations it can be concluded that the seeps of the
Tommeliten area contribute to atmospheric methane, especially during deep mixing situations
in the North Sea. Video observations also showed microbial mats of filamentous, presumably
thiotrophic bacteria (Fig. 3b) and reef like structures of MDACs as already described by
Hovland and Judd (1988).
Chapter 6 Methane emission and consumption at a North Sea gas seep (Tommeliten area)
217
Such features as observed at Tommeliten are typical for active cold seeps on continental
margins and generally indicate high methane fluxes and turnover rates (Boetius and Suess,
2004; Joye et al., 2004; Michaelis et al., 2002; Orphan et al., 2004; Treude et al., 2003).
However, we found only few highly focused point sources in the sandy seabed and very
patchy, small microbial mats pointing to very restricted AOM zones close to the sea floor.
4.2 Control of Methane Efflux from Seep Sediments
Our study provides evidence that methane flux at the Tommeliten seeps is controlled by a
combination of geological and microbial processes as illustrated in figure 11. The shallow
seismic profiles show strong, ascending reflectors in the sediment (Fig. 2). Moreover,
ascending and discontinuous reflectors on seismic plots of deep sediment layers (Hovland,
2002; Hovland and Judd, 1988) indicate that the process of local gas venting may have
occurred several times in the history of Tommeliten. At present, the position of the methane
plumes together with direct observations of methane bubbles (Fig 1, 3a) give evidence for
seepage pathways at the crest of the marl domes that allow for emission of free gas,
circumventing microbial consumption (Fig. 11-II). Our observations from vibrocorer
sampling indicate that the marl sediments represent a barrier to gas flow. A shallower depth
and narrowing of the marl boundary in the vicinity of plumes as observed previously
(Hovland and Judd, 1988) and in this study (Fig. 4a, 6a) suggests that subsurface gas pressure
lifts sediments (Fig. 11-I). As a consequence, the marl may locally crack, allowing an
advection of methane into and within the overlying clay-silt sediments. At the station 1860
closest to the gas plume, the marl horizon was missing. It is possible that the position of the
gas vents is connected to the distribution of sands, which facilitate the passage of free gas
bubbles compared to clays.

Chapter 6 Methane emission and consumption at a North Sea gas seep (Tommeliten area)
218
Figure 11. Schematic overview of seepage and related processes at Tommeliten modified from Hovland & Judd (1988). The different sediment horizons are indicated. (I) methane migrates through cracks in the uplifted marl into overlying, clay-silt sediments sediments. (II) sedimentary pathways at the crest of the marl dome permit the escape of free gas, circumventing microbial consumption. (III) subsurface, AOM depletes uprising methane at the interface between clay silt and sandy sediments where MDACs precipitate. With time and/or reduced methane fluxes, seepage at Tommeliten is sealed of as indicated by (IV) patches of thiotrophic, bacterial mats on the seafloor. These are commonly associated to high AOM rates in shallow surface sediments consuming uprising methane. (V) MDACs are precipitated in near-surface sediments. These provide a hard substrate for sessile macro fauna after exposure.
Within the sediments, methane is most likely advecting horizontally in the clay-silt layer
above the marl. Here, it is partially consumed in a very distinct subsurface horizon of no more
than 20 cm located at the SMTZ between the MDACs (horizon 3) and the sandy sediments
(horizon 4) (Fig. 11-III). The decline of methane concentrations in this sediment layer
coincided with increased concentrations of 13C-depleted lipid biomarkers, cell abundances as
well as with relatively elevated rates of AOM and SR measured by in vitro and ex situ
incubations.
Chapter 6 Methane emission and consumption at a North Sea gas seep (Tommeliten area)
219
The ex situ and in vitro AOM and SR rates at the Tommeliten seep SMTZ are 2 to 3 orders of
magnitude lower in comparison to highly active cold seeps such as Hydrate Ridge and the
Gulf of Mexico (Boetius et al., 2000; Joye et al., 2004; Treude et al., 2003), Nevertheless,
AOM apparently consumes all the methane diffusing into the sands. With respect to the
abundance of ANME-1 cells (1.5 * 107 cells cm-3) and the average AOM rate in sediments at
the SMTZ (2.4 nmol cm-3 d-1), the cell-specific AOM rate at Tommeliten was ~0.17 fmol d-1.
This value is comparable to highly active seeps. At Hydrate Ridge, ex situ measurements of
AOM showed near surface peaks with average values of 1.1 and 1.3 µmol cm-3 d-1,
respectively (Treude et al., 2003; study site Beggiatoa field 2 at 2.5 and 6.5cm bsf). In these
horizons, ca. 0.9*108 and 0.6*108 ANME-2 / Seep-SRB1 aggregates per cm3 were detected,
respectively (Treude et al., 2003). An average aggregate at Hydrate Ridge was found to
consist of ca. 100 archaeal and 200 SRB cells (Boetius et al., 2000). Hence, cell-specific
AOM rates are ranging between 0.13 and 0.21 fmol d-1. These values are in good agreement
with in vitro measurements from Hydrate Ridge. Nauhaus et al. (2005) measured in vitro
AOM rates of 2.5 µmol g-dw-1 d-1 in sediments from a Beggiatoa site, which contained
0.9*108 aggregates g-dw-1. This corresponds to a cell specific rate of 0.28 fmol d-1. Other
AOM systems such as the ANME-1 dominated microbial mats from the Black Sea were
found to contain ca. 4*1010 ANME-1 cells cm-3 (Knittel et al., 2005). Corrected for porosity
(~87%, Treude pers. com.), in vitro AOM at the Black Sea microbial mats was ca. 5.3 µmol
cm-3 d-1 (Nauhaus et al., 2005) which corresponds to a cell-specific rate of 0.13 fmol d-1. In
conclusion, the capacity for AOM at methane seep systems appears to be mainly related to the
biomass and distribution of the AOM community, which is in turn regulated by the
availability of methane and sulphate.
The sea floor observations of patches of presumably thiotrophic mats, above blackish,
reduced sediments (Fig.6b, Fig. 11-IV), give evidence for another type of patchy hot spot of
Chapter 6 Methane emission and consumption at a North Sea gas seep (Tommeliten area)
220
microbial activity just beneath the sea floor, possibly AOM as indicated by previous
observations of free methane trapped below microbial mats (Hovland, 2002). However, we
were not able to sample these sediments with our tools during the R/V Heincke expeditions.
The imprint of 13C-depleted archaeal and bacterial lipids in MDACs exposed at the sea floor
also provide evidence of AOM activity and resulting carbonate precipitation in near surface
sediments at Tommeliten. However, at present, no seepage was observed at the crusts
(Hovland, 2002; Hovland and Judd 1988; this work). It is possible that the precipitation of
carbonates in the AOM zone leads to a self-sealing of gas leakage pathways (Hovland, 2002).
The surface MDAC crusts found at the Tommmeliten site may have formed in near-surface
horizons just like the MDAC pieces found in the SMTZ, and may have been exposed due to
sediment erosion. Today they are providing a niche for sessile hard substrate fauna, which is
unusual for the sandy seabed of the central North Sea (Fig.3c, Fig. 11-V). Furthermore, the
crusts also attract demersal fish. Hence, these observations indicate that seepage related
carbonates, which outcrop the sea floor have a stimulating effect on the abundance of mega
fauna.
4.3 Distribution and Identity of Methanotrophic Communities
Specific lipid biomarkers with typically low 13C-values in sediments and MDACs of the
Tommeliten seep area provide evidence for anaerobic methanotrophic communities associated
with gas seepage. The differences in the biomarker patterns in sediments at the SMTZ and in
the surface and subsurface MDACs indicate the presence of different groups of
methanotrophs. Sediments of the SMTZ host a methanotrophic community dominated by
ANME-1. MDAC pieces at the SMTZ show a lipid pattern indicative of a mixed ANME-1 /
Chapter 6 Methane emission and consumption at a North Sea gas seep (Tommeliten area)
221
ANME-2 community whereas the exposed MDAC crusts contain a biomarker signature
typical of ANME-2 communities, as discussed in the following:
4.3.1 ANME-1 Community in Sediments of the SMTZ
13C-depleted acyclic and cyclic biphytanes were found in relatively high abundances in
sediments at the SMTZ (Fig. 7). Biphytanes are present in various methanogenic archaea and
planktonic crenarchaeota (De Rosa and Gambacorta, 1988; Koga et al., 1993; Schouten et al.,
2002). However, a substantial 13C-depletion as observed here and in other seep environments
points to methanotrophic organisms. A similar lipid pattern as in the Tommeliten SMTZ was
found in microbial mats from the Black Sea. These mats were dominated by ANME-1, as
shown by microscopic observation based on FISH (Blumenberg et al., 2004; Knittel et al.,
2005; Michaelis et al., 2002). Blumenberg et al. (2004) also showed that biphytanes are
absent or rare in ANME-2 dominated microbial mats and proposed to use biphytanes as
specific indicators for ANME-1 communities. Furthermore, in sediments of the SMTZ, the
low ratio of sn2-hydroxyarchaeol relative to archaeol (0.2:1, Fig. 7), both of which are 13C-
depleted, matches typical ANME-1 signatures known from other cold seep sediments and
MDACs (Aloisi et al., 2002; Blumenberg et al., 2004; Hinrichs et al., 1999; Hinrichs et al.,
2000; Teske et al., 2002). In contrast, a ratio of 2:1 or higher was found in ANME-2
dominated systems (Blumenberg et al., 2004; Elvert et al., submitted; Hinrichs et al., 2000;
Orphan et al., 2001a). The predominance of ANME-1 in the SMTZ of Tommeliten seeps is
confirmed by 16S rDNA and FISH analysis. We found a very low diversity of archaeal 16S
rDNA clone sequences, which belonged almost entirely to the ANME-1b sub-cluster (98 % of
the retrieved archaeal sequences, Tab. 2). Epifluorescence microscopy of CARD-FISH
targeted cells detected ANME-1 in the SMTZ zone (Fig. 10). In contrast, probes targeting
Chapter 6 Methane emission and consumption at a North Sea gas seep (Tommeliten area)
222
ANME-2a, ANME-2c or ANME-3 gave no positive results in sediments from the SMTZ or
around it.
Usually, ANME cells are found physically associated with SRB in samples from AOM zones
of most seep systems. It is generally assumed that these SRB are syntrophic partners of
ANME, however, so far, the mechanistic nature of their interaction remains unknown
(Boetius et al., 2000; Hoehler et al., 1994; Nauhaus et al., 2002; Orphan et al., 2001b).
Fingerprints of 13C-depleted bacterial FAs and microscopic observations using FISH showed,
that the most common partners of ANME-1 and ANME-2 communities are SRB of the Seep-
SRB1 cluster (Blumenberg et al., 2004; Elvert et al., 2003; Knittel et al., 2003). Accordingly,
the 16S rDNA clone library from sediments of the SMTZ contained high abundances of Seep-
SRB1 sequences. Although sequences of the Seep-SRB1 in ANME-1 and ANME-2
dominated habitats form one cluster, FA lipid patterns suggest the existence of two distinct
ecotypes of Seep-SRB1 with different FA fingerprints when associated to ANME-1 or
ANME-2 (Blumenberg et al., 2004; Elvert et al., 2003). In the Tommeliten SMTZ sediments,
the high content of ai-C15:0 relative to i-C15:0 and the lack of abundant amounts of C16:1 5
suggest the presence of the Seep-SRB1 type associated to ANME-1 (Blumenberg et al. 2004).
4.3.2 ANME-1 / ANME-2 Communities in MDACs
Previous investigations showed that biomarker patterns in MDACs may be derived from
living biomass or represent fossilized materials, or a mixture of both (Aloisi et al., 2002;
Peckmann et al., 2002; Thiel et al., 2001). The presence of 13C-depleted archaeal lipids in
subsurface and exposed MDACs indicate that carbonate precipitation at Tommeliten is
associated with processes of seepage and AOM. The shapes of subsurface MDACs suggest
Chapter 6 Methane emission and consumption at a North Sea gas seep (Tommeliten area)
223
that these were precipitated in pore spaces and channels formed by gas bubble streams. It is
interesting to note that the subsurface and exposed MDACs contained different biomarker
patterns. The subsurface MDACs were found to contain archaeal lipids which indicate a
mixed ANME-1 / ANME-2 community. Compared to sediments at the SMTZ, the relative
abundance of ANME-1 specific biphytanes was low (Fig. 7). The ratio of sn2-
hydroxyarchaeol relative to archaeol was comparable to available values from settings
comprising a mixed community consisting of ANME-1 / ANME-2 or dominated by ANME-2
(Blumenberg et al., 2004; Elvert et al., submitted; Hinrichs et al., 1999; Hinrichs et al., 2000; Orphan
et al., 2001a). In contrast to the subsurface MDACs, the MDACs exposed at the seafloor
contained a biomarker signature typical for ANME-2 communities. Low amounts of
biphytanes and high amounts of sn2-hydroxyarchaeol relative to archaeol (1:1.9, Fig. 7) as
well as substantial amounts of 13C-depleted crocetane (Fig. 8) are in good agreement with
published data for ANME-2 dominated systems (Blumenberg et al., 2004; Elvert et al., 2001;
Elvert et al., submitted; Elvert et al., 1999; Orphan et al., 2001a). The subsurface as well as
the surface MDACs also contained lipid signatures typical of the Seep-SRB1 cluster
commonly associated with ANME-1 or ANME-2. High amounts of ai-C15:0 relative to i-C15:0
(2.1:1, Fig. 9) in surface MDACs are indicative of Seep-SRB1 associated with ANME-1,
whereas in exposed MDACs, a ratio of nearly 1:1 and substantial amounts of C16:1 5 point to
the Seep-SRB1 ecotype associated to ANME-2 (Blumenberg et al., 2004; Elvert et al., 2003).
It is possible that the MDACs found at Tommeliten preserve signatures of previous ANME-2
communities once populating the surface sediments of this seep. At present, such a niche
could exist in the reduced patches covered by bacterial mats, which we unfortunately were not
able to sample because of their small size and patchy distribution. Previous studies at the cold
seep systems of Hydrate Ridge showed a similar trend in the distribution of ANME-1 and
ANME-2 communities. Here, surface sediments are dominated by ANME-2 whereas the
abundance of ANME-1 was found to increase subsurface (Knittel et al. 2003, 2005).

Chapter 6 Methane emission and consumption at a North Sea gas seep (Tommeliten area)
224
However, the environmental factors selecting for these different phylogenetic groups and their
bacterial partner remain unknown.
CONCLUSIONS
So far, only very little is known on the identity, activity and distribution of AOM
communities of shallow water cold seeps. In this investigation we revisited the Tommeliten
area, a seepage site of the central North Sea. Here, an impermeable horizon of stiff marl
sediments represents a natural barrier for methane rising from a deep gas reservoir. Methane
pressure lifts this horizon forming dome-like subsurface structures. As a consequence, the
marl may crack, allowing methane to advect into overlying, sediments of clay-silt. At the
interface between silty and sandy sediments, methane is oxidised anaerobically by a
community of ANME-1 archaea and SRB of the Seep-SRB1 group in a defined subsurface
horizon of ca. 20 cm. This horizon also bears methane-derived authigenic carbonates and
shows the highest AOM activity. AOM and SR rates are several orders of magnitude lower in
comparison to AOM zones of highly active cold seeps. Nevertheless, the specific activity of
methanotrophic cells detected in the sediments is comparable. All uprising methane is
consumed within the sediments, except for a few locations with active gas venting to the
hydrosphere. Here, at the crest of the marl domes, the ebullition of free gas circumvents
microbial consumption most likely due to the presence of gas channels through sandy
sediments. Thiotrophic bacterial mats as well as methane-derived authigenic carbonates
exposed at the sea floor also indicate the presence of local gas escape routes.

Chapter 6 Methane emission and consumption at a North Sea gas seep (Tommeliten area)
225
Acknowledgements
This study was conducted as part of the METROL project (www.metrol.org) of the 5th
framework program of the European Commission (EVK-3-CT-2002-00080). We thank
captain, crew and shipboard scientists of R/V Heincke cruise HE-169 and HE-180 for their
excellent support with work at sea. We thank Gert Wendt and Jens Wunderlich from Rostock
University and Innomar Technologie GmbH for providing and operating the echosounder
SES-2000 and Werner Dimmler from the Alfred Wegener Institute for Polar and Marine
Research for ROV maintenance and operation. We thank Regina Usbeck from FIELAX for
support with mapping and geo-referencing, Imke Busse, Viola Beyer and Thomas Wilkop for
laboratory analyses and Gerd Bening for handling the vibrocorer of the Institute for Baltic Sea
Research (IOW). This study would not have been possible without the technical support by
the Geology Department of the IOW. Rebecca Rendle-Bühring, Johanna Schwarz and
Stephan Steinke of the University Bremen are acknowledged for their help with
sedimentological descriptions. We also thank Thomas Pape of the University Hamburg for the
provision of analytical protocols.
Chapter 6 Methane emission and consumption at a North Sea gas seep (Tommeliten area)
226
References
Aloisi G., Bouloubassi I., Heijs S. K., Pancost R. D., Pierre C., Damste J. S. S., Gottschal J. C., Forney L. J., and Rouchy J. M. (2002) CH4-consuming microorganisms and the formation of carbonate crusts at cold seeps. Earth and Planetary Science Letters203(1), 195-203.
Barry J. P., Greene H. G., Orange D. L., Baxter C. H., Robison B. H., Kochevar R. E., Nybakken J. W., Reed D. L., and McHugh C. M. (1996) Biologic and geologic characteristics of cold seeps in Monterey bay, California. Deep-Sea Research Part I-Oceanographic Research Papers 43(11-12), 1739-&.
Barry J. P., Kochevar R. E., and Baxter C. H. (1997) The influence of pore-water chemistry and physiology on the distribution of vesicomyid clams at cold seeps in Monterey Bay: Implications for patterns of chemosynthetic community organization. Limnologyand Oceanography 42(2), 318-328.
Bian L. Q., Hinrichs K. U., Xie T. M., Brassell S. C., Iversen H., Fossing H., Jorgensen B. B., and Hayes J. M. (2001) Algal and archaeal polyisoprenoids in a recent marine sediment: Molecular isotopic evidence for anaerobic oxidation of methane. Geochemistry Geophysics Geosystems 2, U1-U22.
Blumenberg M., Seifert R., Reitner J., Pape T., and Michaelis W. (2004) Membrane lipid patterns typify distinct anaerobic methanotrophic consortia. Proceedings of the National Academy of Sciences of the United States of America 101(30).
Boetius A., Ravenschlag K., Schubert C., Rickert D., Widdel F., Gieseke A., Amann R., Jørgensen B. B., Witte U., and Pfannkuche O. (2000) A marine microbial consortium apparently mediating anaerobic methane of oxidation. Nature 407, 623-626.
Boetius A. and Suess E. (2004) Hydrate Ridge: a natural laboratory for the study of microbial life fueled by methane from near-surface gas hydrates. Chemical Geology 205(3-4),291-310.
Bohrmann G., Greinert J., Suess E., and Torres M. (1998) Authigenic carbonates from the Cascadia subduction zone and their relation to gas hydrate stability. Geology 26(7),647-650.
Bussmann I., Dando P. R., Niven S. J., and Suess E. (1999) Groundwater seepage in the marine environment: role for mass flux and bacterial activity. Marine Ecology-Progress Series 178, 169-177.
Çifçi G., Dondurur D., and Ergün M. (2003) Deep and shallow structures of large pockmarks in the Turkish shelf, Eastern Black Sea. Geo-Marine Letters 23(3-4), 311-322.
Dando P. R. and Hovland M. (1992) Environmental-Effects of Submarine Seeping Natural-Gas. Continental Shelf Research 12(10), 1197-&.
De Rosa M. and Gambacorta A. (1988) The lipids of archaebacteria. Progress in Lipid Research 27, 153-175.
Diaz-del-Rio V., Somoza L., Martinez-Frias J., Mata M. P., Delgado A., Hernandez-Molina F. J., Lunar R., Martin-Rubi J. A., Maestro A., Fernandez-Puga M. C., Leon R., Llave E., Medialdea T., and Vazquez J. T. (2003) Vast fields of hydrocarbon-derived carbonate chimneys related to the accretionary wedge/olistostrome of the Gulf of Cadiz. Marine Geology 195(1-4), 177-200.
Elvert M., Boetius A., Knittel K., and Jorgensen B. B. (2003) Characterization of specific membrane fatty acids as chemotaxonomic markers for sulfate-reducing bacteria involved in anaerobic oxidation of methane. Geomicrobiology Journal 20(4), 403-419.
Elvert M., Greinert J., Suess E., and Whiticar M. J. (2001) Carbon isotopes of biomarkers derived from methane-oxidizing microbes at Hydrate Ridge, Cascadia convergent
Chapter 6 Methane emission and consumption at a North Sea gas seep (Tommeliten area)
227
margin. In Natural gas hydrates: Occurrence, distribution, and dynamics, Vol. 124 (ed. C. K. Paull and W. P. Dillon), pp. 115-129. American Geophysical Union.
Elvert M., Hopmans E. C., Boetius A., and Hinrichs K.-U. (submitted) Spatial variatons of archaeal-bacterial assambladges in gas hydrate bearing sediments at a cold seep: Implications from a high resolution molecular and isotopic approach.
Elvert M., Suess E., and Whiticar M. J. (1999) Anaerobic methane oxidation associated with marine gas hydrates: superlight C-isotopes from saturated and unsaturated C20 and C25
irregular isoprenoids. Naturwissenschaften 86(6), 295-300. Garcia-Garcia A., Garcia-Gil S., and Vilas F. (2003) Monitoring the Spanish gas fields in the
Ria de Vigo (1991-2001). Geo-Marine Letters 23(3-4), 200-206. Hinrichs K.-U. and Boetius A. (2002) The anaerobic oxidation of methane: New insights in
microbial ecology and biogeochemistry. In Ocean Margin Systems (ed. G. Wefer, D. Billett, and D. Hebbeln), pp. 457-477. Springer-Verlag, Berlin.
Hinrichs K.-U., Hayes J. M., Sylva S. P., Brewer P. G., and DeLong E. F. (1999) Methane-consuming archaebacteria in marine sediments. Nature 398, 802-805.
Hinrichs K. U., Summons R. E., Orphan V., Sylva S. P., and Hayes J. M. (2000) Molecular and isotopic analysis of anaerobic methane-oxidizing communities in marine sediments. Organic Geochemistry 31(12), 1685-1701.
Hoehler T. M. and Alperin M. J. (1996) Anaerobic methane oxidation by a methanogen-sulfate reducer consortium: geochemical evidence and biogeochemical considerations. In Microbial Growth on C1 Compounds (ed. M. E. Lidstrom and F. R. Tabita), pp. 326-333. Kluwer Academic Publishers.
Hoehler T. M., Alperin M. J., Albert D. B., and Martens C. S. (1994) Field and laboratory studies of methane oxidation in an anoxic marine sediment: Evidence for a methanogenic-sulfate reducer consortium. Global Biogeochemical Cycles 8(4), 451-463.
Hovland M. (2002) On the self-sealing nature of marine seeps. Continental Shelf Research22(16), 2387-2394.
Hovland M. and Judd A. G. (1988) Seabed Pockmarks and Seepages: Impact on Geology, Biology and the Marine Environment. Graham & Trotman.
Hovland M. and Sommerville J. H. (1985) Characteristics of two natural gas seepages in the North Sea. Marine and Petroleum Geology 2(4), 319-326.
Hovland M., Talbot M., Olaussen S., and Aasberg L. (1985) Recently formed methane-derived carbonates from the North Sea floor. In Petroleum Geochemistry in Exploration of the Norwegian Shelf (ed. B. M. Thomas), pp. 263-266. Norwegian Petroleum Soc., Graham & Trotman.
Hovland M., Talbot M. R., Qvale H., Olaussen S., and Aasberg L. (1987) Methane-Related Carbonate Cements in Pockmarks of the North-Sea. Journal of Sedimentary Petrology57(5), 881-892.
Joye S. B., Boetius A., Orcutt B. N., Montoya J. P., Schulz H. N., Erickson M. J., and Lugo S. K. (2004) The anaerobic oxidation of methane and sulfate reduction in sediments from Gulf of Mexico cold seeps. Chemical Geology 205(3-4), 219-238.
Judd A. G. (2003) The global importance and context of methane escape from the seabed. Geo-Marine Letters 23(3-4), 147-154.
Kane M. D., Poulsen L. K., and Stahl D. A. (1993) Monitoring the Enrichment and Isolation of Sulfate-Reducing Bacteria by Using Oligonucleotide Hybridization Probes Designed from Environmentally Derived 16s Ribosomal-Rna Sequences. Applied and Environmental Microbiology 59(3), 682-686.
Knittel K., Boetius A., Lemke A., Eilers H., Lochte K., Pfannkuche O., Linke P., and Amann R. (2003) Activity, distribution, and diversity of sulfate reducers and other bacteria in

Chapter 6 Methane emission and consumption at a North Sea gas seep (Tommeliten area)
228
sediments above gas hydrate (Cascadia margin, Oregon). Geomicrobiology Journal20(4), 269-294.
Knittel K., Losekann T., Boetius A., Kort R., and Amann R. (2005) Diversity and distribution of methanotrophic archaea at cold seeps. Applied and Environmental Microbiology71(1), 467-479.
Koga Y., Nishihara M., Morii H., and Akagawa-Matsushita M. (1993) Ether polar lipids of methanogenic bacteria: Structures, comparative aspects, and biosyntheses. Microbiological Reviews 57(1), 164-182.
Kohnen M. E. L., Schouten S., Sinninghé Damste J. S., de Leeuw J. W., Merritt D. A., and Hayes J. M. (1992) Recognition of paleobiochemicals by a combined molecular sulfur and isotope geochemical approach. Science 256, 358-362.
Lane D. J., Pace B., Olsen G. J., Stahl D. A., Sogin M. L., and Pace N. R. (1985) Rapid-Determination of 16s Ribosomal-Rna Sequences for Phylogenetic Analyses. Proceedings of the National Academy of Sciences of the United States of America82(20), 6955-6959.
Massana R., Murray A. E., Preston C. M., and DeLong E. F. (1997) Vertical distribution and phylogenetic characterization of marine planktonic Archaea in the Santa Barbara Channel. Applied and Environmental Microbiology 63(1), 50-56.
Michaelis W., Seifert R., Nauhaus K., Treude T., Thiel V., Blumenberg M., Knittel K., Gieseke A., Peterknecht K., Pape T., Boetius A., Amann R., Jorgensen B. B., Widdel F., Peckmann J. R., Pimenov N. V., and Gulin M. B. (2002) Microbial reefs in the Black Sea fueled by anaerobic oxidation of methane. Science 297(5583), 1013-1015.
Mills H. J., Hodges C., Wilson K., MacDonald I. R., and Sobecky P. A. (2003) Microbial diversity in sediments associated with surface-breaching gas hydrate mounds in the Gulf of Mexico. Fems Microbiology Ecology 46(1), 39-52.
Moss C. W. and Lambert-Fair M. A. (1989) Location of Double Bonds in Monounsaturated Fatty Acids of Campylobacter cryaerophila with Dimethyl Disulfide Derivatives and Combined Gas Chromatography-Mass Spectrometry. JOURNAL OF CLINICAL MICROBIOLOGY 27(7), 1467-1470.
Muyzer G., Teske A., Wirsen C. O., and Jannasch H. W. (1995) Phylogenetic-Relationships of Thiomicrospira Species and Their Identification in Deep-Sea Hydrothermal Vent Samples by Denaturing Gradient Gel-Electrophoresis of 16s Rdna Fragments. Archives of Microbiology 164(3), 165-172.
Nauhaus K., Boetius A., Kruger M., and Widdel F. (2002) In vitro demonstration of anaerobic oxidation of methane coupled to sulphate reduction in sediment from a marine gas hydrate area. Environmental Microbiology 4(5), 296-305.
Nauhaus K., Treude T., Boetius A., and Kruger M. (2005) Environmental regulation of the anaerobic oxidation of methane: a comparison of ANME-I and ANME-II communities. Environmental Microbiology 7(1), 98-106.
Nichols P. D., Guckert J. B., and White D. C. (1986) Determination of monounsaturated fatty acid double-bond position and geometry for microbial monocultures and complex consortia by capillary GC-MS of their dimethyl disulphide adducts. Journal of Microbiological Methods 5, 49-55.
Orphan V. J., Hinrichs K. U., Ussler W., Paull C. K., Taylor L. T., Sylva S. P., Hayes J. M., and Delong E. F. (2001a) Comparative analysis of methane-oxidizing archaea and sulfate- reducing bacteria in anoxic marine sediments. Applied and Environmental Microbiology 67(4), 1922-1934.
Orphan V. J., House C. H., Hinrichs K. U., McKeegan K. D., and DeLong E. F. (2001b) Methane-consuming archaea revealed by directly coupled isotopic and phylogenetic analysis. Science 293(5529), 484-487.
Chapter 6 Methane emission and consumption at a North Sea gas seep (Tommeliten area)
229
Orphan V. J., House C. H., Hinrichs K. U., McKeegan K. D., and DeLong E. F. (2002) Multiple archaeal groups mediate methane oxidation in anoxic cold seep sediments. Proceedings of the National Academy of Sciences of the United States of America99(11), 7663-7668.
Orphan V. J., Ussler W., Naehr T. H., House C. H., Hinrichs K. U., and Paull C. K. (2004) Geological, geochemical, and microbiological heterogeneity of the seafloor around methane vents in the Eel River Basin, offshore California. Chemical Geology 205(3-4), 265-289.
Peckmann J., Goedert J. L., Thiel V., Michaelis W., and Reitner J. (2002) A comprehensive approach to the study of methane-seep deposits from the Lincoln Creek Formation, western Washington State, USA. Sedimentology 49(4), 855-873.
Peckmann J., Paul J., and Thiel V. (1999) Bacterially mediated formation of diagenetic aragonite and native sulfur in Zechstein carbonates (Upper Permian, Central Germany). Sedimentary Geology 126(1-4), 205-222.
Pernthaler A., Preston C. M., Pernthaler J., DeLong E. F., and Amann R. (2002) Comparison of fluorescently labeled oligonucleotide and polynucleotide probes for the detection of pelagic marine bacteria and archaea. Applied and Environmental Microbiology 68(2),661-667.
Ravenschlag K., Sahm K., Pernthaler J., and Amann R. (1999) High bacterial diversity in permanently cold marine sediments. Applied and Environmental Microbiology 65(9),3982-3989.
Reeburgh W. S. (1996) "Soft spots" in the global methane budget. In Microbial Growth on C1
Compounds (ed. M. E. Lidstrom and F. R. Tabita), pp. 334-342. Kluwer Academic Publishers.
Roberts H. H. and Aharon P. (1994) Hydrocarbon-Derived Carbonate Buildups of the Northern Gulf-of-Mexico Continental-Slope - a Review of Submersible Investigations. Geo-Marine Letters 14(2-3), 135-148.
Schouten S., Hoefs M. J. L., Koopmans M. P., Bosch H.-J., and Sinninghe Damsté J. S. (1998) Structural characterization, occurrence and fate of archael ether-bound acyclic and cyclic biphytanes and corresponding diols in sediments. Organic Geochemistry29(5-7), 1305-1319.
Schouten S., Hopmans E. C., Schefuss E., and Damste J. S. S. (2002) Distributional variations in marine crenarchaeotal membrane lipids: a new tool for reconstructing ancient sea water temperatures? Earth and Planetary Science Letters 204(1-2), 265-274.
Teske A., Hinrichs K. U., Edgcomb V., Gomez A. D., Kysela D., Sylva S. P., Sogin M. L., and Jannasch H. W. (2002) Microbial diversity of hydrothermal sediments in the Guaymas Basin: Evidence for anaerobic methanotrophic communities. Applied and Environmental Microbiology 68(4), 1994-2007.
Thiel V., Peckmann J., Richnow H. H., Luth U., Reitner J., and Michaelis W. (2001) Molecular signals for anaerobic methane oxidation in Black Sea seep carbonates and a microbial mat. Marine Chemistry 73(2), 97-112.
Thomsen T. R., Finster K., and Ramsing N. B. (2001) Biogeochemical and molecular signatures of anaerobic methane oxidation in a marine sediment. Applied and Environmental Microbiology 67(4), 1646-1656.
Thrasher J., Fleet S. J., Hovland M., and Düppenbecker S. (1996) Understanding geology as the key to using seepage in exploration: spectrum of seepage styles. In Hydrocarbonmigration and its near-surface expression (ed. D. Schumacher and M. A. Abrams), pp. 223-241. AAPG Memoir.
Treude T., Boetius A., Knittel K., Wallmann K., and Jorgensen B. B. (2003) Anaerobic oxidation of methane above gas hydrates at Hydrate Ridge, NE Pacific Ocean. MarineEcology-Progress Series 264, 1-14.

Chapter 6 Methane emission and consumption at a North Sea gas seep (Tommeliten area)
230
Treude T., Niggemann J., Kallmeyer J., Wintersteller P., Schubert C. J., Boetius A., and Jorgensen B. B. (2005) Anaerobic oxidation of methane and sulfate reduction along the Chilean continental margin. Geochimica et Cosmochimica Acta 69(11), 2767-2779.
Widdel F. and Bak F. (1992) The gram negative mesophilic sulfate reducing bacteria. In Theprokaryotes (ed. M. Dworkin). Springer.
Chapter 7 Final discussion and conclusion
231
Final discussion and conclusion
PREFACE
In this thesis, a variety of different cold seep systems were investigated in three oceanic
regions (Fig 1). The focus was on methane turnover at mud volcanoes (MVs) and coastal gas
seeps, which have not been investigated before with regard to their geomicrobiology. The
studies presented here combined biogeochemical, microbiological and geological tools for a
system-oriented investigation of those methane seeps. Major aims were to detect and to
quantify hot spots of methane oxidation as well as to assess environmental factors
determining the activity and the distribution of methanotrophic communities. Furthermore,
key microbial players mediating methanotrophy were identified and the impact of the
anaerobic oxidation of methane (AOM) and the aerobic oxidation of methane (MOx) on the
surrounding, marine environment was analysed. The studies were carried out at:
The highly active Håkon Mosby Mud Volcano (HMMV)
Quiescent mud volcanoes of the Gulf of the Cadiz
The Tommeliten gas seeps
In the first part of the final discussion, the magnitude of turnover rates and environmental
factors determining the distribution of AOM and MOx are summarized. Furthermore, the
dependency of methanotrophic activity and concentrations of diagnostic lipid biomarkers are
discussed. The second part focuses on the identity of methanotrophic communities and
diagnostic lipid signatures expressed by the key microbial players. The third part investigates
how methanotrophic activity changes a marine habitat. The last section of gives an outlook on
further research questions.
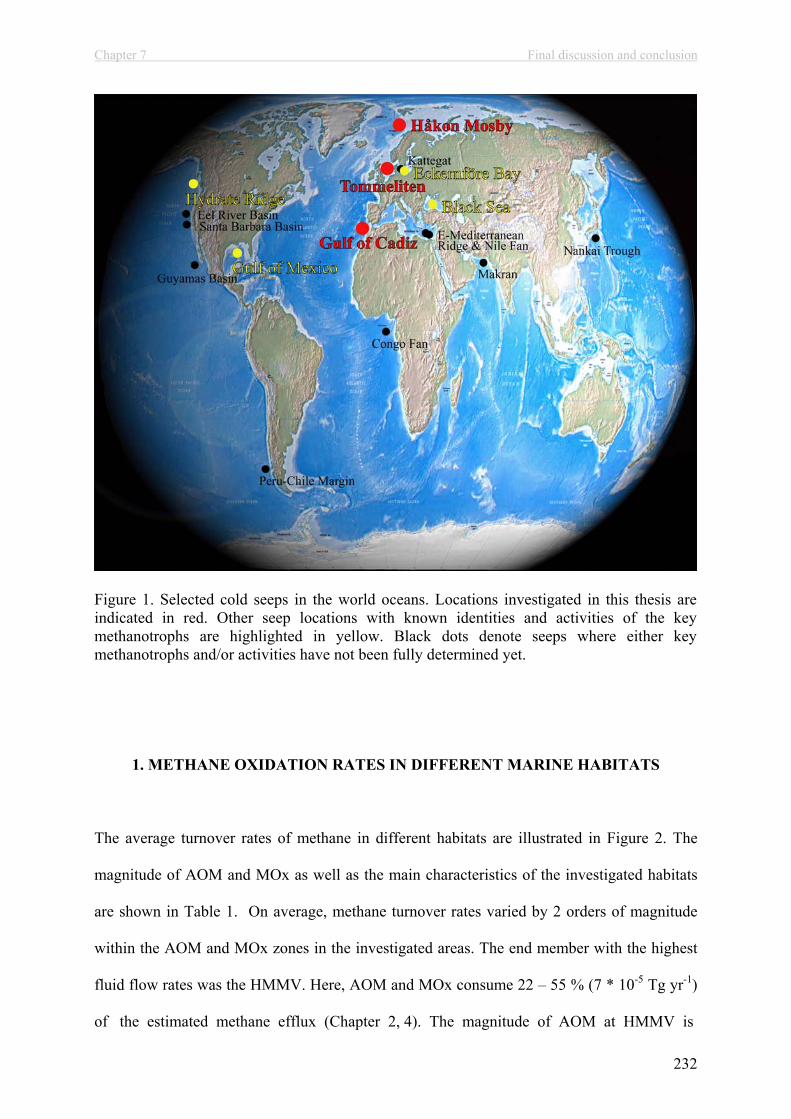
Chapter 7 Final discussion and conclusion
232
Figure 1. Selected cold seeps in the world oceans. Locations investigated in this thesis are indicated in red. Other seep locations with known identities and activities of the key methanotrophs are highlighted in yellow. Black dots denote seeps where either key methanotrophs and/or activities have not been fully determined yet.
1. METHANE OXIDATION RATES IN DIFFERENT MARINE HABITATS
The average turnover rates of methane in different habitats are illustrated in Figure 2. The
magnitude of AOM and MOx as well as the main characteristics of the investigated habitats
are shown in Table 1. On average, methane turnover rates varied by 2 orders of magnitude
within the AOM and MOx zones in the investigated areas. The end member with the highest
fluid flow rates was the HMMV. Here, AOM and MOx consume 22 – 55 % (7 * 10-5 Tg yr-1)
of the estimated methane efflux (Chapter 2, 4). The magnitude of AOM at HMMV is
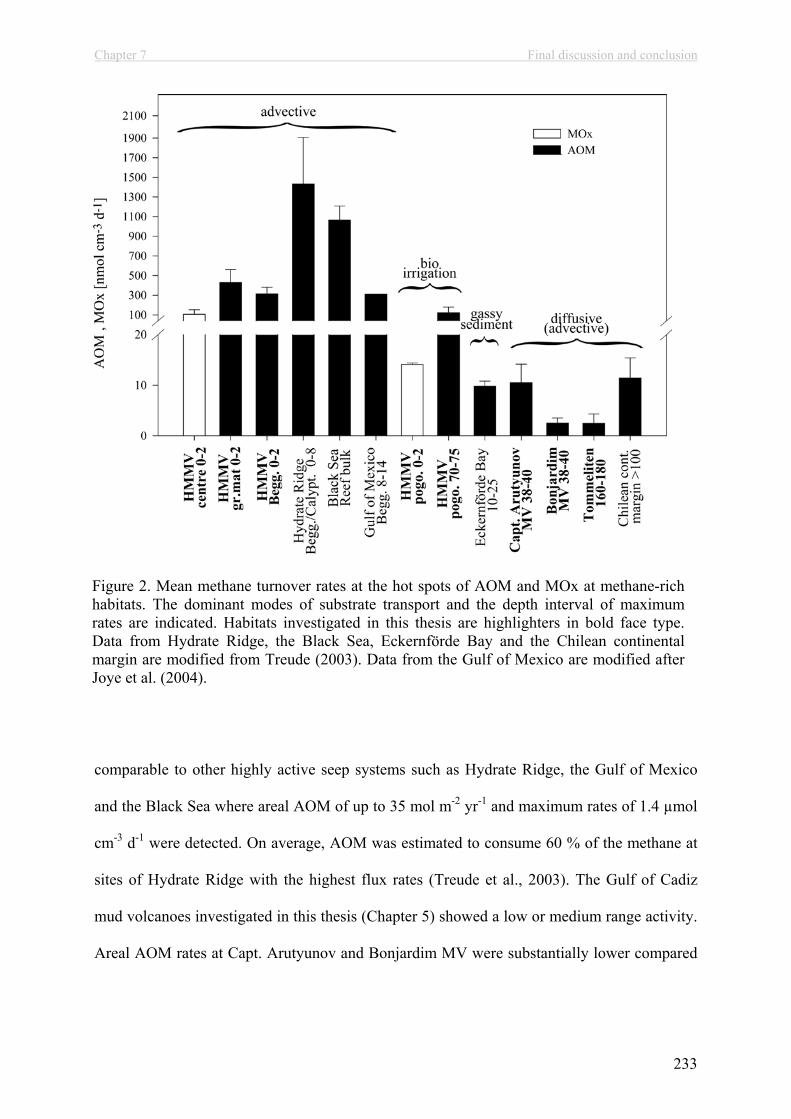
Chapter 7 Final discussion and conclusion
233
comparable to other highly active seep systems such as Hydrate Ridge, the Gulf of Mexico
and the Black Sea where areal AOM of up to 35 mol m-2 yr-1 and maximum rates of 1.4 µmol
cm-3 d-1 were detected. On average, AOM was estimated to consume 60 % of the methane at
sites of Hydrate Ridge with the highest flux rates (Treude et al., 2003). The Gulf of Cadiz
mud volcanoes investigated in this thesis (Chapter 5) showed a low or medium range activity.
Areal AOM rates at Capt. Arutyunov and Bonjardim MV were substantially lower compared
Figure 2. Mean methane turnover rates at the hot spots of AOM and MOx at methane-rich habitats. The dominant modes of substrate transport and the depth interval of maximum rates are indicated. Habitats investigated in this thesis are highlighters in bold face type. Data from Hydrate Ridge, the Black Sea, Eckernförde Bay and the Chilean continental margin are modified from Treude (2003). Data from the Gulf of Mexico are modified after Joye et al. (2004).
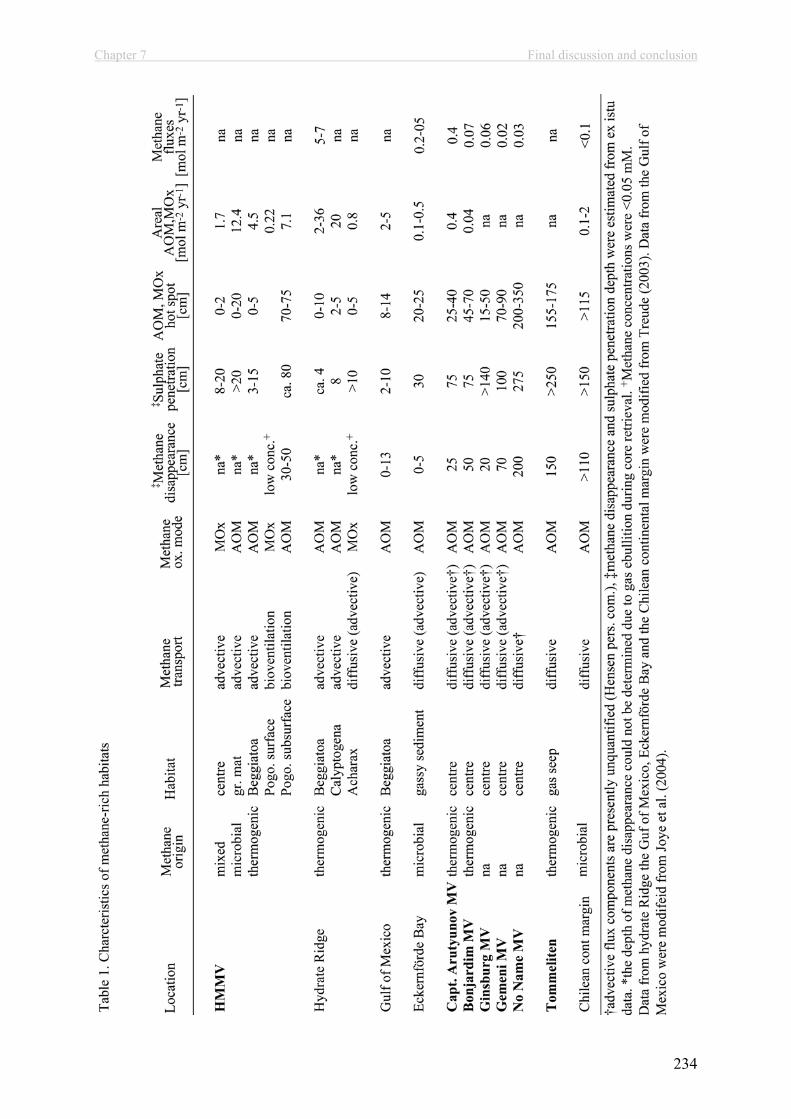
Chapter 7 Final discussion and conclusion
234
Chapter 7 Final discussion and conclusion
235
to HMMV but higher than those in diffusion dominated ocean sediments with AOM rates
<0.06 mol m-2 yr-1 (Hensen et al., 2003; Jørgensen et al., 2001; Niewöhner et al., 1998). These
values are comparable to Ginsburg MV Gemini MV and the “No Name” structure.
AOM at the Tommeliten seep area (Chapter 6) is very low and comparable to the gassy
sediments of Eckernförde Bay and some diffusive systems at the Chilean continental margin
where maximum rates of <0.01 µmol cm-3 d-1 were measured (Treude, 2003).
Today, less is known on MOx rates than on AOM in gassy sediments. The MOx rates in
surface sediments of the centre at HMMV (Chapter 2, 4) are to our knowledge among the
highest ever measured in marine sediments. However, since the penetration depth of oxygen
into the sediment was limited to a few millimetres (de Beer et al., submitted), the MOx zone
was very small, as was the proportion of total methane consumed by MOx.
MOx at HMMV’s centre was >1.5-fold higher in comparison to oxygenated surface
sediments of a methane seep in the Baltic Sea (Jensen et al., 1992) and in low-flux seep
sediments at Hydrate Ridge which are populated by the ventilating bivalve Acharax (Treude
et al., 2003).
1.1 Environmental Factors Determining Methane Turnover
Generally, the AOM rates correlate with the methane flux (Tab.1). At HMMV (Chapter 2, 4),
the high methane oxidation rates associated with the mats of sulphide oxidizing bacteria
(Beggiatoa site) are supported by high rates of methane flow from deeper sediment layers.
The deeper penetration depth of sulphate at the grey mat areas supported a 2-fold higher

Chapter 7 Final discussion and conclusion
236
AOM activity compared to the Beggiatoa site, indicating the relevance of the availability of
electron acceptors. At the Pogonophora site, high AOM rates were found just beneath the
roots of the worms (Fig. 2, Tab. 1, Chapter 4). Here, fluid flow is relatively small and
methane is sequestered as clathrate in the sediment below 100 cm bsf. The bioirrigation
activities of the worms pump sulphate to the methane-bearing sediment layers thereby
fostering a high AOM activity. In contrast, AOM was substantially lower at the mud
volcanoes in the Gulf of Cadiz and at the Tommeliten seep area (Fig. 2, Tab.1, Chapter 5, 6).
Although no advective fluxes were estimated for Capt. Arutyunov and Bonjardim MV, the
good agreement of AOM and diffusive methane fluxes indicate that the advective flux is
within the same order of magnitude as the diffusive transport component.
Increasing methane concentrations during in vitro incubations had a positive effect on MOx
and AOM activity (Nauhaus et al., 2002; Nauhaus et al., 2005; Chapter 4). AOM is the
reaction of the electron donor methane with the electron acceptor sulphate (Barnes and
Goldberg, 1976; Iversen and Jørgensen, 1985; Nauhaus et al., 2002; Nauhaus et al., 2005;
Treude et al., 2003). This thesis and previous work (Treude, 2003; Treude et al., 2003)
provide evidence that AOM hotspots are found where both substrates are available at
milimolar concentrations. If either methane or sulphate is depleted, other processes take over.
For example, the central area of HMMV is dominated by MOx because upward fluid flow
rates of 4 µm s-1 limit the penetration depth of sulphate to the top few millimetres where it co-
occurs with oxygen (de Beer et al., submitted). These are unfavourable conditions for AOM
but allow for comparably high MOx rates. Similarly, bioirrigation of pogonophoran worms
lead to an oxygen penetration depth of up to 10 cm sediment depth, which supports MOx but
excludes AOM in this horizon (de Beer et al., submitted; Chapter 2, 4).
Chapter 7 Final discussion and conclusion
237
An additional factor that controls the magnitude of methane turnover rates is the biomasses of
AOM and MOx communities. At Tommeliten, the magnitude of AOM (2.4 nmol cm-3 d-1)
and the abundance of ANME-1 cells (1.45 * 107 cells cm-3) correspond to a cell specific rate
of 0.17 fmol d-1 (Chapter 6). This value is in good agreement with highly active seeps such as
Hydrate Ridge and the Black Sea which have much higher population densities of
methanotrophs (Nauhaus et al., 2002; Nauhaus et al., 2005; Treude et al., 2003). A correlation
between AOM rates and cell counts of methanotrophs is also present on a smaller scale, i.e.
within the core. The vertical profiles of ANME-1 cell counts at Tommeliten and counts of
microbial aggregates consisting of ANME-3 and sulphate reducing bacteria (SRB) of the
Desulfobulbus (DBB) group matched the vertical distribution of AOM activity at Tommeliten
and HMMV, respectively. Similarly, highest counts of the type I methanotroph
Methylobacter sp. coincided with peaks in MOx activity at the centre of HMMV.
1.2 Hot Spots of AOM and MOx
Within the seabed, the hot spot of AOM and MOx were restricted to a few cm in the
investigated sites (Tab. 1). The dimension of these zones of maximum methane turnover was
controlled by (1) fluid flow, (2) bioirrigation activities, (3) diffusion and by (4)
sedimentology. At the vertical boundaries of the hot spots, AOM and MOx most probably
become unfavourable due to thermodynamic limitations.
(1) Fluid and/or gas flow is a defining characteristic of cold seep geosystems (Boetius and
Suess, 2004; Judd et al, 2002). At sites of high fluid and/or gas flow, sediments are often
covered by thiotrophic bacteria (Barry et al., 1996; Torres et al., 2002; Tryon et al., 2002)
indicating elevated rates of chemoautotrophic metabolism fuelled by the upward flux of
Chapter 7 Final discussion and conclusion
238
electron donors (Boetius et al., 2000; Joye et al., 2004; Treude et al., 2003). However, with
respect to the chemical composition of fluids and/or gases, high flow rates may also hinder
the influx of electron acceptors such as sulphate, oxygen and nitrate, thus limiting microbial
activity to near surface sediments. At HMMV, fluid flow and bioirrigation activities are
dominant factors controlling the vertical distribution of AOM and MOx. Hot spots of MOx
activity were generally restricted to the top mm surface sediments due to oxygen limitations.
The thickness of the MOx hot spot at the centre of HMMV is controlled by fluid flow. Here, a
pore water flow velocity of 4 µm s-1 restricts the in situ penetration depth of oxygen to about
2 - 3 mm (de Beer et al., submitted) allowing for comparably high MOx rates. These high
upward fluid flow rates also restrict the penetration depth of sulphate to a few centimetres into
the sediment at the Beggiatoa site, thus limiting AOM to the top of the seafloor due to
thermodynamic limitations. Unfortunately, in situ concentrations of AOM-reactants are
unknown, thus prohibiting further analysis of thermodynamics. At the grey mat sites, the
overlap of sulphate and methane over a larger depth interval allows for a comparably broad
AOM zone. The reason for the deeper penetration depth of sulphate in these patches of 1-2 m
in diameter remains unknown.
(2) Benthic animals can play an important role in the biogeochemical zonation by activities
like dwelling, burrowing and bioventilation. At cold seeps, a variety of symbiotic
chemosynthetic animals may occur which are adapted to transport sulphide and/or methane as
well as oxygen to their symbionts. The most important groups are vestimetiferan and
pogonophoran tubeworms, and the bivalves Calyptogena, Acharax and Bathymodiolus
(Cordes et al., 2005; Sahling et al., 2002; Treude et al., 2003). At the HMMV, the most
abundant chemosynthetic animals are two types of pogonophoran tubeworms (Oligobrachia
haakonmosbiensis, Sclerolinum contortum; Smirnov, 2000). The larger species
(O. haakonmosbiensis) form up to 60 cm long but thin (~1 mm) tubes and transports oxygen
Chapter 7 Final discussion and conclusion
239
and sulphate into methane rich sediments. The thickness of the MOx horizon at the
Pogonophora site is controlled by the irrigation activities of the worms, which oxygenate the
upper 10 cm of the sediment. The AOM horizon is also controlled by the bioirrigation
activities of the worms, indicated by its position directly below the lower end of the tubes (>
60 cm sediment depth). Bioirrigation activities of macrofauna organisms irrigating methane-
rich sediments with sulphate, thereby fueling AOM, were also reported from Hydrate Ridge
and the Gulf of Mexico (Cordes et al., 2005; Sahling et al., 2002; Treude et al., 2003).
(3) Diffusion controlled methane-rich sediments generally show the lowest methane turnover
and methanotrophic biomasses (Treude, 2003; Treude et al., 2005). Diffusion rather than
advection was the dominant factor controlling the fluxes of methane and sulphate at the MVs
of the Gulf of Cadiz. The depth of the sulphate methane transition zones (SMTs) at the
studied mud volcanoes in the Gulf of Cadiz was matching the magnitude of methane fluxes
(Tab. 1). At Capt. Arutyunov MV where the highest methane flux was encountered, the SMT
was at about 30 cm bsf, whereas at the “No Name” structure, the methane flux was 10-fold
lower and the SMT was at about 275 cm bsf. As an example of energy availability in
diffusion controlled systems, a simplified, high-resolution G profile from methane, sulphate
and sulphide concentrations is calculated according to the following reactions:
CH4 (aq) + 3H2O (l) HCO3-
(l) + 4H2 (aq) + H+(aq) (1)
SO42-
(aq) + 4H2 (aq) + H+(aq) HS-
(aq) + 4H2O (l) (2)
Single G values were calculated with the program Thermodyn and concentrations of
protons (10 nM), DIC (10 mM) and H2 (0.1 pM) were assumed without any changes over
depth. The G profile roughly follows the vertical distribution of AOM (Fig. 3). Background
values of methane at the sediment surface (0-10 cm) make AOM unfavourable with
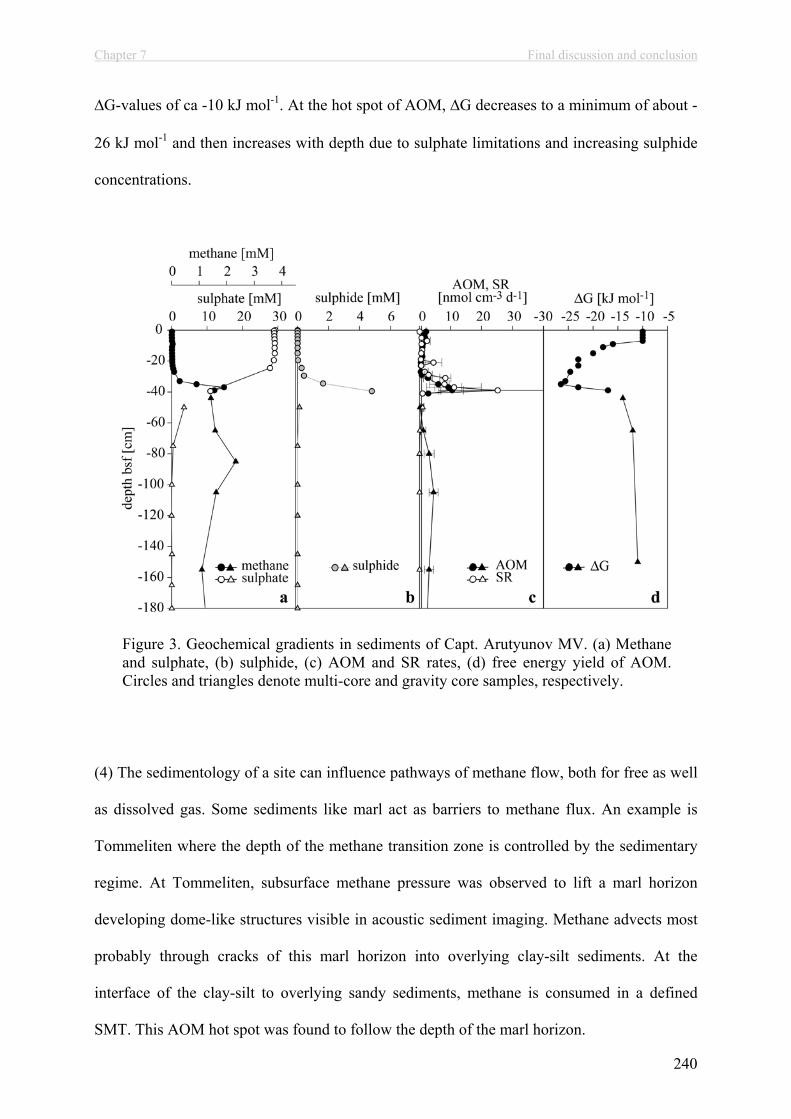
Chapter 7 Final discussion and conclusion
240
G-values of ca -10 kJ mol-1. At the hot spot of AOM, G decreases to a minimum of about -
26 kJ mol-1 and then increases with depth due to sulphate limitations and increasing sulphide
concentrations.
Figure 3. Geochemical gradients in sediments of Capt. Arutyunov MV. (a) Methane and sulphate, (b) sulphide, (c) AOM and SR rates, (d) free energy yield of AOM. Circles and triangles denote multi-core and gravity core samples, respectively.
(4) The sedimentology of a site can influence pathways of methane flow, both for free as well
as dissolved gas. Some sediments like marl act as barriers to methane flux. An example is
Tommeliten where the depth of the methane transition zone is controlled by the sedimentary
regime. At Tommeliten, subsurface methane pressure was observed to lift a marl horizon
developing dome-like structures visible in acoustic sediment imaging. Methane advects most
probably through cracks of this marl horizon into overlying clay-silt sediments. At the
interface of the clay-silt to overlying sandy sediments, methane is consumed in a defined
SMT. This AOM hot spot was found to follow the depth of the marl horizon.

Chapter 7 Final discussion and conclusion
241
1.3 Correlating Distribution of Microbial and Geochemical Signatures in Marine
Sediments.
The investigated habitats can be divided into two categories according to the location of the
hot spot of methane turnover in (1) surface or (2) subsurface sediment horizons (Fig. 4). The
first category encompasses the centre, Beggiatoa and grey mat site of HMMV. The
Pogonophora site with its deep AOM hotspot as well as the studied mud volcanoes in the
Gulf of Cadiz and the Tommeliten pockmarks represent the second category.
Figure 4. Scheme of the vertical distribution of (a) methane and sulphate concentrations, (b) methanotrophic biomass, (c) AOM, SRR and MOx activity, (d) diagnostic archaeal and bacterial lipid concentrations and (e) their associated 13C-values in methane bearing habitats. The upper and lower sections illustrate a methanotrophic hot spot in surface and subsurface sediments, respectively.
A surface AOM hot spot characterized by high methane and sulphate concentrations,
coinciding peaks in methane and sulphate turnover, biomarker and cell counts was first
described at Hydrate Ridge (Boetius et al., 2000; Elvert et al., submitted; Treude, 2003;
Treude et al., 2003). The biomass of key microbial players (Fig. 4b), methane turn over rates
(Fig. 4c), concentrations of membrane lipids specific for the key microbial players (Fig. 4d)
and their associated 13C-values (Fig. 4e) showed a matching vertical distribution. Hence, an
Chapter 7 Final discussion and conclusion
242
increase in AOM and MOx biomass appears to be associated to elevated methane turn over
rates (see section 1.1) as well as to elevated lipid biomarker concentrations and depleted
isotope signatures. With respect to the data presented in this work and those available in the
literature, the correlation of these parameters needs further investigation for quantitative
estimates. Cell specific lipid concentrations are available from only three habitats, i.e.,
Tommeliten (ANME-1 dominated; chapter 6), Hydrate Ridge (ANME-2 dominated; Elvert et
al., submitted) and from HMMV (ANME-3 dominated; chapter 3). Here, the cell specific
values of for instance archaeol were: 20 fg (Tommeliten), 0.25 fg (Hydrate Ridge) and 3.7 fg
(HMMV). In previous works, biomarker analyses and cell counts were usually not carried out
on the same sample but on replicate samples from one core or even replicate cores. As both
methods are very time consuming, the data are usually based on single measurements and not
averages of replicates. Hence, there is an additional error associated with both sets of data
since the methods do not account for small-scale heterogeneity.
One other interesting observation is the distinct minimum in 13C of lipid biomass associated
with the maximum activity (Fig. 4c, e). Subsurface AOM hot spots usually coincide with the
methane-sulphate transition zone (Iversen and Jørgensen, 1985). Here, methane with a given
carbon isotope signature rises upward and is completely consumed within the hot spot. The
AOM metabolism was found to discriminate against the heavy isotope 13C leading to a
depletion in the lipid biomass (Elvert et al., 1999; Hinrichs et al., 1999; Orphan et al., 2001b).
Hence, the uprising methane becomes progressively heavier according to Raleigh distillation
processes (Whiticar, 1999). This explains the enrichment of 13C in the lipid biomass at the
upper boundary of the AOM biomass peak at subsurface hot spots (Fig. 3e). However, the
same trend was also found at the lower boundary, which cannot be explained by Raleigh
distillation processes. Here, the uprising methane carries its source 13C-signal. Hence,
methanotrophic activity should lead to very low 13C-values of the lipid biomass. However, at

Chapter 7 Final discussion and conclusion
243
the lower boundary, sulphate is limiting making AOM unfavourable. This raises the question
whether the AOM community could switch from a methanotrophic to a methanogenic mode
once AOM becomes unfavourable.
2. IDENTITY OF METHANOTROPHIC MICROBES
At most of the study sides investigated here, i.e., HMMV, Capt. Arutyunov MV and at
Tommeliten, the microbial communities mediating AOM and MOx were identified by 16S
rDNA methods combined with biomarker analysis. All known archaea mediating AOM are
distantly related to methanogens of the orders Methanosarcinales and Methanomicrobiales
(Knittel et al., 2005). At HMMV, a novel AOM community was discovered (Chapter 2, 4). It
consists of archaea forming a distinct cluster closely related to ANME-2 and more distantly to
ANME-1. Previously, a few sequences clustering with this group were detected in the Santa
Barbara basin (Knittel et al., 2005; Orphan et al., 2001a). The new group was termed
ANME-3. Like the ANME-2, this group often forms shell-like, dense aggregates with SRB
enclosing the archaea. However, in contrast to ANME-2 which is associated with the Seep-
SRB1 group (Boetius et al., 2000; Knittel et al., 2003; Knittel et al., 2005; Orphan et al.,
2002), ANME-3 has been found in association with SRB of the Desulfobulbus group (Chapter
2, 3).
At Capt. Arutyunov MV (Gulf of Cadiz), 16S rDNA clone libraries indicate, that AOM is
mediated by ANME-2 and Seep-SRB1 (Tab. 2; Chapter 5). ANME-2 / Seep-SRB1 dominated
habitats were previously found in surface sediments at the cold seeps of Hydrate Ridge
(Boetius et al., 2000; Boetius and Suess, 2004; Knittel et al., 2003; Knittel et al., 2005), the
Chapter 7 Final discussion and conclusion
244
Eel River and Santa Barbara Basin (Orphan et al., 2001a; Orphan et al., 2002), cold seeps at
the Eckernförde Bay (Treude, 2003) and in the Black Sea (Knittel et al., 2003; Knittel et al.,
2005; Michaelis et al., 2002) but also in surface sediments of the hydrothermal vents of the
Guaymas Basin (Teske et al., 2002). At Tommeliten, a predominance of ANME-1 and
Seep-SRB1 was found in subsurface sediments (Chapter 6). Here, ANME-1 occurred as
single cells or small chains of up to three cells. ANME-1 associated with Seep-SRB1 was
previously found in surface sediments at the cold seeps of the Eel River- (Hinrichs et al.,
1999; Orphan et al., 2001a; Orphan et al., 2002) as well as at the hydrothermal vents at the
Guaymas Basin (Teske et al., 2002), microbial mats at cold seeps of the Black Sea (Knittel et
al., 2005; Middelburg et al., 2002), and carbonate crusts at the Napoli Mud Volcano (Aloisi et
al., 2002). Obviously, different phylogenetic groups of archaea and SRB with some
morphological variation in the form of their consortia can mediate AOM in a great variety of
oceanic settings. Unfortunately, the specific environmental conditions selecting for a
particular AOM community are still unknown.
In addition to AOM communities, also MOx bacteria were found at HMMV (Chapter 2, 4).
These were type I methanotrophs of the Methylobacter sp., belonging to the class -
Proteobacteria. In the HMMVs centre and in shallow sediments of the Pogonophora site
these methanotrophs consume a significant amount of methane. The ice-cold (-1°C) ambient
sea water temperature might be one parameter selecting for type I methanotrophs (Hanson and
Hanson, 1996). However, in most marine sediments, oxygen and methane do not overlap,
which makes MOx a minor sink of methane in marine sediments.
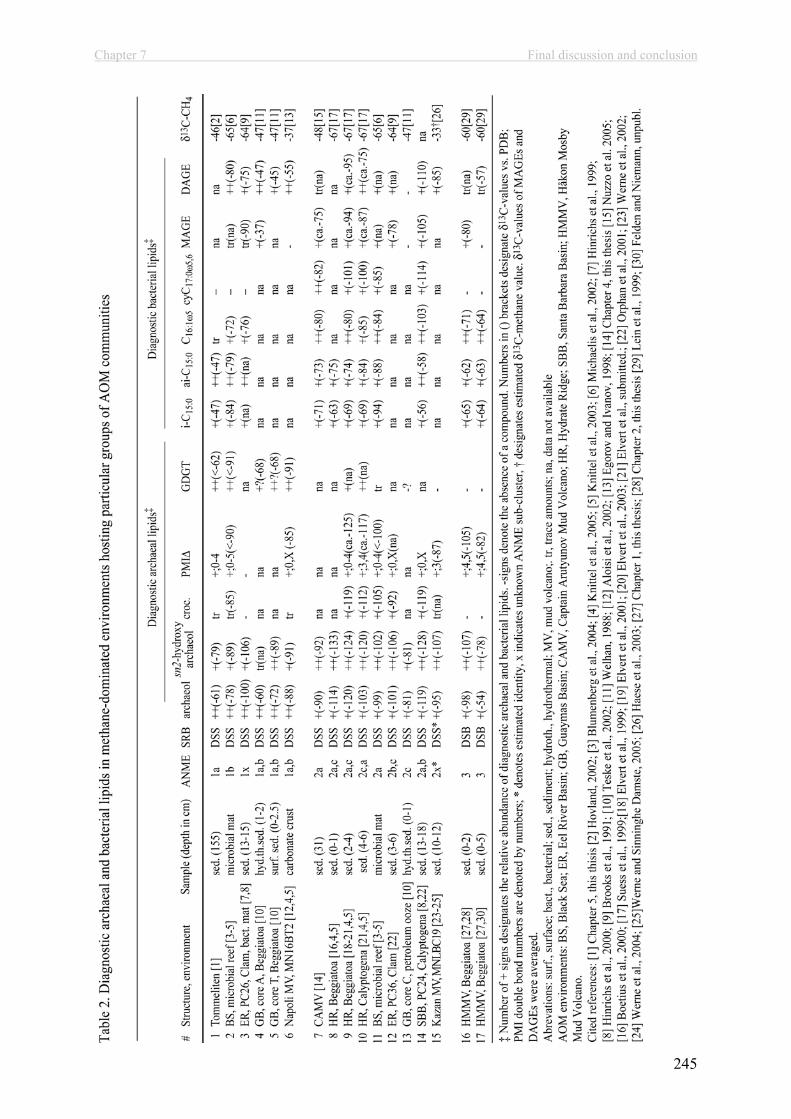
Chapter 7 Final discussion and conclusion
245

Chapter 7 Final discussion and conclusion
246
2.1 Lipid Fingerprints of Active Communities of Anaerobic Methanotrophs
Methanotrophic communities were identified by independent, molecular techniques, i.e. lipid
biomarker patterns, 16S rDNA clone libraries and/or FISH. 16S rDNA clone libraries and
FISH directly provide information on the phylogentic relations of microbes. Furthermore,
FISH allows to quantify key microbial players. Lipid biomarker analysis provides information
on dominant metabolic pathways (Boschker et al., 1998; Elvert et al., 2003; Hinrichs et al.,
1999). Furthermore, phylogentic information can be gained by analysing the pattern of
diagnostic lipids (Blumenberg et al., 2004; Elvert et al., 2003). This thesis and previous work
provide a database to assign lipid patterns to the known groups of methane oxidizing archaea
and to test the statistical relevance of these patterns. For identifying diagnostic lipid signatures
of particular ANME groups and their associated, sulphate reducing bacteria, I compared
literature data from methane–rich environments of which information on both, lipid signatures
and the identity of dominant key microbial players are available. Information on the particular
habitats, the dominant ANME and SRB groups, abundances and isotope signatures of
diagnostic lipids as well as 13C-values of the source methane is provided in Table 2.
2.1.1 Archaeal Biomarkers
A variety of lipid signatures putatively indicative for particular ANME-archaea have been
discussed in the literature during the last decade. These include the glycerol dialkyl diethers
archaeol and sn2-hydroxyarchaeol, the C20 and C25, irregular tail-to-tail linked, isoprenoidal
hydrocarbons 2,6,11,15-tetramethylhexadecane (crocetane) and 2,6,10,15,19-
pentamethyleicosane (PMI) and their unsaturated analogues (crocetenes and PMI ) as well as
a variety of isoprenoidal glycerol dialkyl tetraethers (GDGT). With the exception of
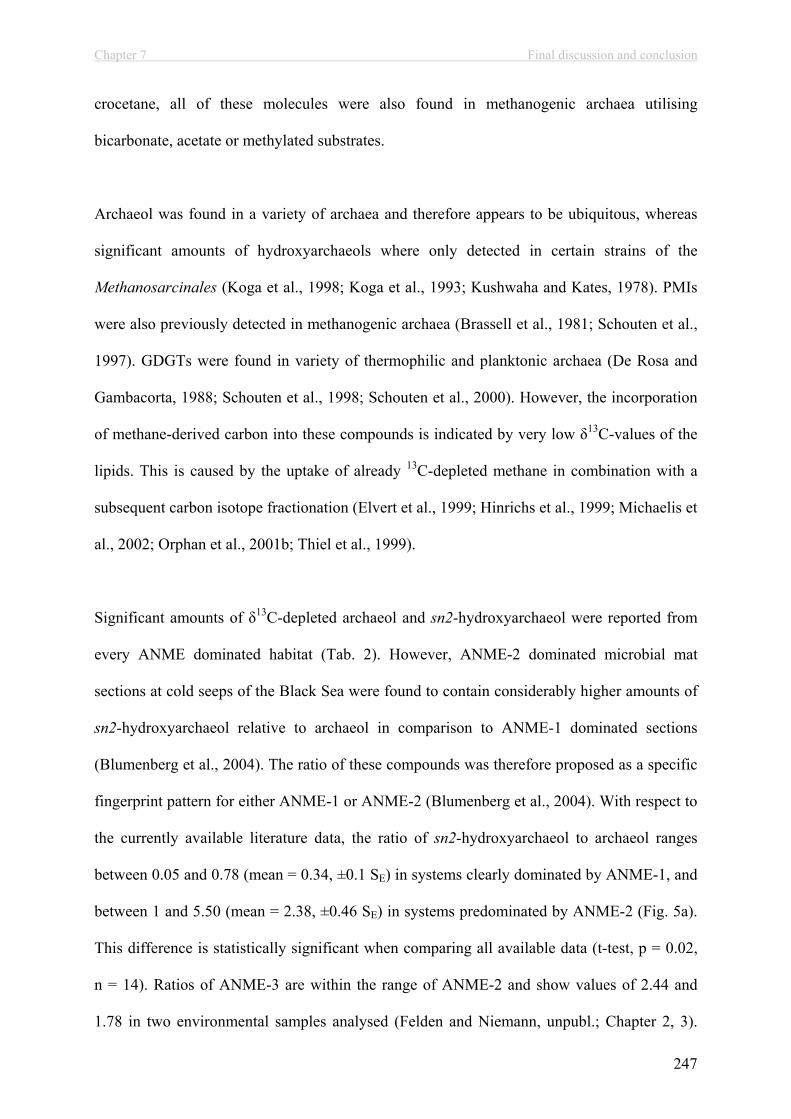
Chapter 7 Final discussion and conclusion
247
crocetane, all of these molecules were also found in methanogenic archaea utilising
bicarbonate, acetate or methylated substrates.
Archaeol was found in a variety of archaea and therefore appears to be ubiquitous, whereas
significant amounts of hydroxyarchaeols where only detected in certain strains of the
Methanosarcinales (Koga et al., 1998; Koga et al., 1993; Kushwaha and Kates, 1978). PMIs
were also previously detected in methanogenic archaea (Brassell et al., 1981; Schouten et al.,
1997). GDGTs were found in variety of thermophilic and planktonic archaea (De Rosa and
Gambacorta, 1988; Schouten et al., 1998; Schouten et al., 2000). However, the incorporation
of methane-derived carbon into these compounds is indicated by very low 13C-values of the
lipids. This is caused by the uptake of already 13C-depleted methane in combination with a
subsequent carbon isotope fractionation (Elvert et al., 1999; Hinrichs et al., 1999; Michaelis et
al., 2002; Orphan et al., 2001b; Thiel et al., 1999).
Significant amounts of 13C-depleted archaeol and sn2-hydroxyarchaeol were reported from
every ANME dominated habitat (Tab. 2). However, ANME-2 dominated microbial mat
sections at cold seeps of the Black Sea were found to contain considerably higher amounts of
sn2-hydroxyarchaeol relative to archaeol in comparison to ANME-1 dominated sections
(Blumenberg et al., 2004). The ratio of these compounds was therefore proposed as a specific
fingerprint pattern for either ANME-1 or ANME-2 (Blumenberg et al., 2004). With respect to
the currently available literature data, the ratio of sn2-hydroxyarchaeol to archaeol ranges
between 0.05 and 0.78 (mean = 0.34, ±0.1 SE) in systems clearly dominated by ANME-1, and
between 1 and 5.50 (mean = 2.38, ±0.46 SE) in systems predominated by ANME-2 (Fig. 5a).
This difference is statistically significant when comparing all available data (t-test, p = 0.02,
n = 14). Ratios of ANME-3 are within the range of ANME-2 and show values of 2.44 and
1.78 in two environmental samples analysed (Felden and Niemann, unpubl.; Chapter 2, 3).
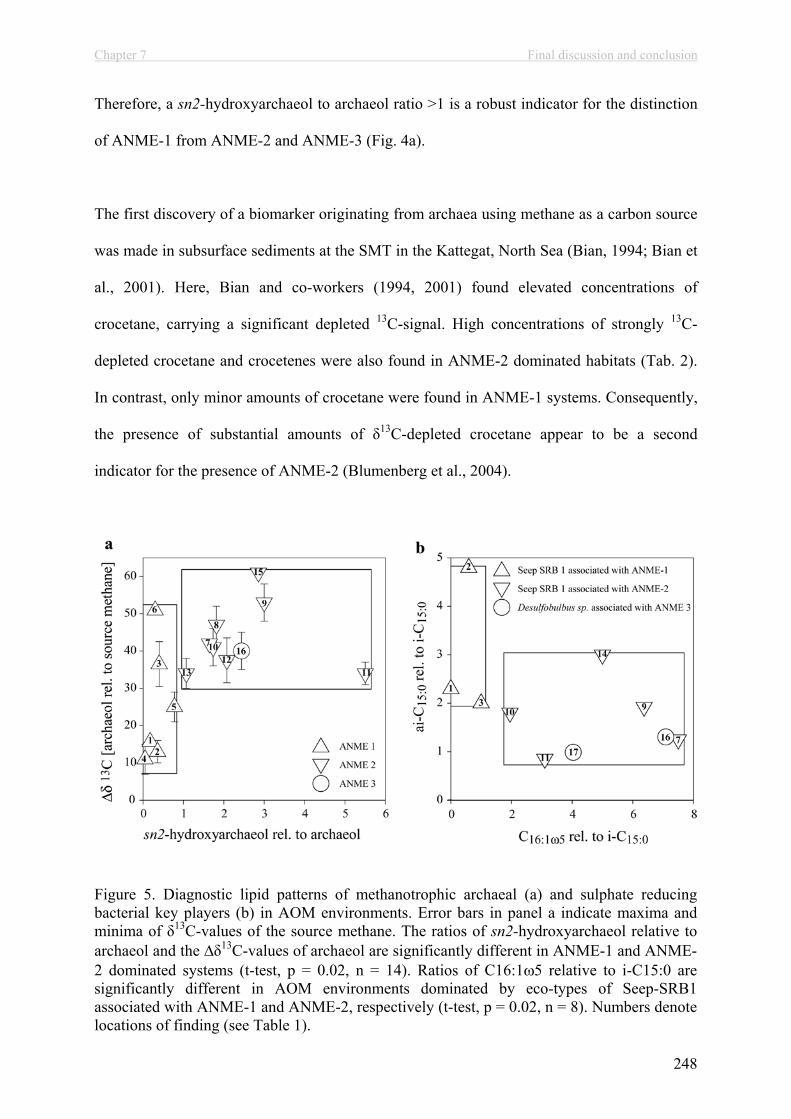
Chapter 7 Final discussion and conclusion
248
Therefore, a sn2-hydroxyarchaeol to archaeol ratio >1 is a robust indicator for the distinction
of ANME-1 from ANME-2 and ANME-3 (Fig. 4a).
The first discovery of a biomarker originating from archaea using methane as a carbon source
was made in subsurface sediments at the SMT in the Kattegat, North Sea (Bian, 1994; Bian et
al., 2001). Here, Bian and co-workers (1994, 2001) found elevated concentrations of
crocetane, carrying a significant depleted 13C-signal. High concentrations of strongly 13C-
depleted crocetane and crocetenes were also found in ANME-2 dominated habitats (Tab. 2).
In contrast, only minor amounts of crocetane were found in ANME-1 systems. Consequently,
the presence of substantial amounts of 13C-depleted crocetane appear to be a second
indicator for the presence of ANME-2 (Blumenberg et al., 2004).
Figure 5. Diagnostic lipid patterns of methanotrophic archaeal (a) and sulphate reducing bacterial key players (b) in AOM environments. Error bars in panel a indicate maxima and minima of 13C-values of the source methane. The ratios of sn2-hydroxyarchaeol relative to archaeol and the 13C-values of archaeol are significantly different in ANME-1 and ANME-2 dominated systems (t-test, p = 0.02, n = 14). Ratios of C16:1 5 relative to i-C15:0 are significantly different in AOM environments dominated by eco-types of Seep-SRB1 associated with ANME-1 and ANME-2, respectively (t-test, p = 0.02, n = 8). Numbers denote locations of finding (see Table 1).

Chapter 7 Final discussion and conclusion
249
13C-depleted PMI:0 and unsaturated PMIs were detected in virtually all studied AOM
environments (Tab. 2). Nevertheless, ANME-1 and ANME-2 systems were found to contain a
suite of PMIs ranging from PMI:0 to PMI:5 whereas ANME-3 was found to contain
exclusively PMI:4 accompanied by more abundant PMI:5. The presence of only PMI:4 and
PMI:5 and the absence of higher saturated PMI analogues may thus provide a tool to
distinguish ANME-3 from ANME-2 (Chapter 2, 3).
Concentration measurements of GDGTs require a high performance liquid chromatography
(HPLC) instrumentation. In the absence of this technique, GDGT contents have been inferred
from their decomposition products, the acyclic and cyclic biphytanes (Blumenberg et al.,
2004; Schouten et al. 1998; Chapter 6), but also free biphytanediols and biphytanic acids have
been detected (Teske et al., 2002). Significant amounts of GDGTs were commonly detected
in ANME-1 systems (Blumenberg et al., 2004; Hinrichs et al., 2000). Released biphytanes
were generally dominated by acyclic biphytane followed by monocyclic biphytane (one
cyclopentane ring) and bicyclic biphytane (two cylcopentane rings). The presence of 13C-
depleted biphytanes released from GDGTs was consequently used as an indicator for ANME-
1 (Blumenberg et al., 2004; Chapter 6). However, recently, Elvert and co-workers (submitted)
found GDGTs in ANME-2 dominated sediments (Tab. 2). At Hydrate Ridge, these authors
detected comparably high contents of intact GDGTs at a Calyptogena site where 80 % of the
ANME-2 cells belonged to the ANME-2c and 20 % to the ANME-2a sub-cluster (Knittel et
al., 2005). Significantly lower GDGT contents were found at a Beggiatoa site were the
ANME-2c / ANME-2a ratio was reverse to the Calyptogena site, indicating that the GDGTs
were probably derived from archaea of the ANME-2c subgroup (Elvert et al., submitted). An
ANME-1 origin is unlikely here, as the total content of ANME-1 cells was <10 % of detected
single cells (Elvert et al., submitted; Knittel et al., 2005). No biphytanediols were detected at
the Guaymas Basin at an ANME-2c dominated site (Teske et al., 2002). However, this is no
Chapter 7 Final discussion and conclusion
250
prove for the absence of intact GDGTs which were detected at high concentrations in other
cores obtained from this region (Schouten et al., 2003). Substantial amounts of 13C-depleted
GDGTs are therefore indicative for ANME-1 and most probably ANME-2c.
2.1.2 Bacterial Biomarkers
Biomarker surveys in AOM environments found 13C-depleted lipid compounds of presumably
bacterial origin that co-occur with 13C-depleted archaeal lipids. As for the archaeal partners,
the strong depletion in 13C is indicative for an incorporation of methane-derived carbon
(Blumenberg et al., 2004; Elvert et al., 2003; Hinrichs et al., 2000; Michaelis et al., 2002;
Zhang et al., 2002). At many different cold seep settings, ANME-1 and ANME-2 archaea
have been found in consortia with SRB of the Seep-SRB1 cluster belonging to the
Desulfosarcina/Desulfococcus group (Knittel et al., 2003). However, the suite of
13C-depleted, bacterial lipids is surprisingly diverse (Blumenberg et al., 2004; Elvert et al.,
2003; Hinrichs et al., 2000). This may indicate that the Seep-SRB1 cluster comprises
physiologically different ecotypes of the same species. Intriguingly, the physical association
of the same partner bacteria in the consortia also expresses morphological differences, e.g. in
the ANME-1 / Seep-SRB1 and ANME-2 / Seep-SRB1 communities (shell type, mixed type,
mat type, see also Knittel et al. 2005). ANME-3 has been found in close association with SRB
of the Desulfobulbus sp. that express lipid signatures substantially different from those
detected in Seep-SRB1 (Chapter 2, 3). Of particular value for typifying the sulphate reducing
AOM-partners are fatty acid glycerol esters of which the fatty acid (FA) moieties are
commonly cleaved off and separately analysed as fatty acid methyl esters (FAMEs). The
second class of compounds putatively derived from SRB involved in AOM encompasses the
non-isoprenoidal mono and dialkyl glycerol ethers (MAGE, DAGE) (Hinrichs et al., 2000;
Chapter 7 Final discussion and conclusion
251
Pancost et al., 2001; Rütters et al., 2001). Similar to the archaeal biomarker used for
identifying particular ANME groups, none of the bacterial lipid compound classes discussed
in the following is exclusively restricted to a particular group of SRB (Hinrichs and Boetius,
2002).
The iso and anteiso branched C15:0 fatty acid have been found in virtually all AOM
environments (Tab. 2). Similar to the use of the sn2-hydroxyarchaeol / archaeol ratio as an
archaeal fingerprint, the ratio of ai-C15:0 relative to i-C15:0 shows higher values in
ANME-1 / Seep-SRB1 compared to ANME-2 / Seep-SRB1 dominated systems and has
consequently been proposed to distinguish the two Seep-SRB1 eco-types (Blumenberg et al.,
2004). A value >>2 appears to be indicative for ANME-1-associated SRB (Fig. 5b). However,
a statistical analysis of a larger set of data shows that there is a comparably large overlap
between the two Seep-SRB1 eco-types and from a statistical point of view, the
ai-C15:0 / i-C15:0 ratios are not significantly different (t-test, p>0.5, n = 8). This is probably a
result of the still relatively small data pool available in the literature.
High concentrations of the fatty acid C16:1 5 were observed in ANME-2 / Seep-SRB1
dominated systems and thus suggested as an indicator for this Seep-SRB1 eco-type
(Blumenberg et al., 2004; Elvert et al., 2003). Relative to i-C15:0, the C16:1 5 content is
significantly higher (t-test, p = 0.02, n = 8) in ANME-2 / Seep-SRB1 systems (mean = 4.8
±1 SE) compared to ANME-1 / Seep-SRB1 systems (mean = 0.5 ±0.3 SE). A value <1.8 is
hence a robust indicator for the Seep-SRB1 ecotype associated with ANME-1 (Fig. 4b).
However, both ratios appear to be comparable in the Seep-SRB1 ecotype associated to
ANME-2 and in Desulfobulbus sp. (Fig. 4b). Elvert et al. (2003) suggested that the presence
of the unusual fatty acid cyC17:0 5,6 is restricted to the Seep-SRB1 ecotype associated to
ANME-2 which is consistent with the available literature data. Dseulfobulbus at HMMV was
Chapter 7 Final discussion and conclusion
252
found to express comparably high amounts of the unusual fatty acid C17:1 6 additionally
discerning these SRB (Felden and Niemann unpubl.; Chapter 2, 3)
13C-depleted MAGEs and DAGEs were detected in most AOM environments (Tab. 2) The
former seem to be a robust markers of the SRB involved in AOM because of their very
similar chain-length distribution and pattern of unsaturated bonds (Hinrichs et al., 2000).
Both, MAGEs and FAs have been detected in cultures of Desulfosarcina variabilis and
Desulforhabdus amnigenus (Rütters et al., 2001). The DAGEs have so far only been found in
deeply-branching thermophilic and halophilic bacteria (Huber et al., 1992; Langworthy et al.,
1983; Ollivier et al., 1991). DAGEs detected in AOM environments have been found to
comprise alkyl moieties with cyclohexane rings (Elvert et al., submitted; Pancost et al., 2001),
which is in stark contrast to the pattern of alkyl moieties in the FA fraction. Thus, the question
arises if DAGEs are directly produced by the syntrophic SRB or by an up to now unknown
source organism heterotrophically feeding on AOM biomass. Substantial amounts of MAGEs
appear to be restricted to the ANME-2 associated Seep-SRB1 ecotype and to Dseulfobulbus
(Tab. 2). Thus, in addition to the ratios of diagnostic fatty acids discussed above, substantial
amounts of MAGEs additionally point to these SRBs.
With respect to the currently available data on fatty acids as well as MAGEs and DAGEs, the
ratio of C16:1 5 relative to i-C15:0 and the presence or absence of cyC17:0 5,6 and C17:1 6 appear
to be the most robust fingerprints for discerning the different SRB types associated to the
ANMEs. However, further investigations have to be carried out to assess the role and a
potential involvement of other seep related bacteria such as Seep-SRB2 (Knittel et al., 2003)
in AOM.
Chapter 7 Final discussion and conclusion
253
2.1.3 Carbon Isotope Systematics of AOM
In comparison to ANME-1, ANME-2 shows a higher stable carbon isotope fractionation as
indicated by the respective 13C-values of archaeol and sn2-hydroxyarchaeol. Compared to
the source methane, 13C-values of archaeol range between -11‰ and -51‰ (mean = -25‰
±6 SE) in ANME-1 dominated systems and between -34‰ and -61‰ (mean = -44‰ ±3 SE) in
ANME-2 dominated systems (Fig. 4a, b). For sn2-hydroxyarchaeol, 13C-values are shifted
by ca. -10‰ compared to archaeol ranging between -24‰ and -54‰ (mean = -39‰ ±5 SE)
and between -34‰ and -74‰ (mean = -49 ±5 SE) in ANME-1 and ANME-2 dominated
systems, respectively. Both compounds are thus more strongly 13C-depleted in ANME-2
(t-test, p = 0.05, n = 14). A comparable isotope shift between ANME-1 and ANME-2 was
previously observed by Orphan et al. (2002). Similar to the ratio of sn2-hydroxyarchaeol
relative to archaeol, 13C-values of ANME-3 are within the range of ANME-2 (Fig. 4a).
However, at one site at HMMV, ANME-3 derived archaeol was found with a higher 13C-
value compared to the source methane (Tab. 2). The reason for this phenomenon is unknown.
The comparison of 13C-values of archaeol and sn2-hydroxyarchaeol show a considerable
overlap between the three ANME groups. Hence, 13C-values have to be regarded with
caution.
Compared to the archaeal lipids, 13C-values of specific bacterial fatty acids show an even
weaker difference among the two Seep-SRB1 ecotypes and Dseulfobulbus. The available
13C-values of i-C15:0 for instance show a depletion of -20‰ compared to the source methane
in ANME-1 / Seep-SRB1 systems in the Black Sea whereas source methane and ai-C15:0 have
comparable 13C-values at Tommeliten (Tab. 2). In ANME-2 / Seep-SRB1 systems the
carbon isotope fractionation appears to be slightly stronger ranging between –7‰ and -25‰
Chapter 7 Final discussion and conclusion
254
(mean = -14 ±4 SE). At HMMV, ai-C15:0 was only slightly depleted in comparison to the
source methane (Tab. 2). However, unlike ANMEs often accounting for the bulk of archaeal
cells, e.g. >90 % in Hydrate Ridge sediments (Knittel et al., 2005), up to 70 % in Black Sea
microbial mats (Michaelis et al., 2002), a comparably high diversity of bacteria was detected
in most AOM environments (Knittel et al., 2003; Lösekann et al., unpubl.; Orphan et al.,
2001a; Teske et al., 2002; Chapter 5, 6). A mixture of the methane-derived 13C-signal of
Seep-SRB1 or DBB with non-AOM sources is thus likely (Elvert et al., 2003). Furthermore,
an utilisation of multiple carbon sources by the syntrophic SRB can not be excluded.
2.1.4 Archaeal and Bacterial Biomass Ratios of AOM Communities
ANME-1 was found to comprise up to 70 % of cell counts (average 40 %, Knittel et al.
unpublished) in microbial mats of the Black Sea (Michaelis et al., 2002), whereas aggregates
at Hydrate Ridge are characterised by an ANME-2 relative to Seep-SRB1 ratio of 1:2
(Boetius et al., 2000). In several subsurface sediments, ANME-1 was observed without an
associated bacterial partner (Orphan et al., 2002; Chapter 6). Hence, the content of archaeal
lipid biomass relative to the bacterial one is most likely higher in ANME-1 systems compared
to ANME-2 systems. For ANME-3 systems, this has not been determined yet. However, it
remains entirely speculative if the ratio of archaeal relative to SRB cells as well as the
archaeal relative to the bacterial lipid content is constant to the ratio of total archaeal vs.
bacterial biomass in ANME-1, -2 and -3 dominated systems. Hence, the biomarker ratio
presented in the following should be regarded as a tool for discerning the syntrophic SRB and
not as an expression of biomass ratios. In order to estimate differences in the relative lipid
contents, one has to use ratios of diagnostic archaeal and bacterial lipids, which have

Chapter 7 Final discussion and conclusion
255
been detected and quantified in all
of the three known ANME / SRB
communities. The ratio of the
archaeal biomarker archaeol
relative to the sum of the bacterial
fatty acids i-C15:0, ai-C15:0 and C16: 5
can be used as an approximation to
discern the different AOM
communities (Fig. 6). With respect
to the currently available literature
data, the ratio of archaeol relative to
the sum of i-C15:0, ai-C15:0 and C16: 5
ranges between 0.9 and 2.4 (mean =
1.5 ±0.4 SE) in ANME-1 / Seep-SRB1 dominated systems and between 0.2 and 1.1 (mean =
0.4 ±0.1 SE) in ANME-2 / Seep-SRB1 dominated systems (Fig. 6). This ratio is thus
significantly higher in ANME-1 systems (t-test, p = 0.02). For ANME-3 / DBB, this ratio is
within the range of ANME-2 / Seep-SRB1. Hence, a value >1.5 is an additional, robust
indicator for ANME-1 / Seep-SRB1 systems and a value <0.4 for ANME-2 / Seep-SRB1 or
ANME-3 / Dseulfobulbus systems.
In conclusion, the combination of 13C values and ratios of diagnostic archaeal and bacterial
lipids presented in this section provide a robust tool to distinguish all of the three known
AOM communities. This is of particular value to gain information on the identity of AOM
communities and to interpret fossil lipid biomarker patterns in e.g. carbonates (Chapter 5, 6).
Figure 6. ratios of archaeol relative to selected bacterial FA. ANME-1 / Seep-SRB1 comprise significantly lower FA contents than ANME-2 / Seep-SRB1 and ANME-3 / Dseulfobulbus(T-test, p <0.05). Error bars = maxima and minima.
Chapter 7 Final discussion and conclusion
256
3. BIO-GEOSPHERE INTERACTION IN METHANE-BEARING,
MARINE SEDIMENTS
This thesis and previous works provide evidence that the chemoautotrophic activity of
methanotrophic organisms influence the benthic habitat (e.g. by mixing, by providing hard-
substrate in the form of shells or tubes) and channel methane-derived carbon into higher
trophic levels. At active cold seeps, fluids enriched in hydrocarbons are advected into surface
sediments where the activity of methanotrophic and sulphate reducing communities form
ecosystems that are almost independent from photosynthetic, primary production. The
biogeochemical activities at these cold seeps exceed the biomass production in the adjacent
none-seep sediments by orders of magnitude (Chapter 3). In near surface sediments, AOM
supports enormous biomasses of filamentous, sulphide oxidising bacteria, chemosynthetic
clams and vestimentiferan or pogonophoran worms (Boetius and Suess, 2004; Joye et al.,
2004; Levin et al., 2003; Olu et al., 1997; Orphan et al., 2004; Sahling et al., 2002;
Chapter 2, 3). For instance, AOM-related SR accounts for approximately all of the sulphide
production at the Beggiatoa site at HMMV (Chapter 2, 4). Apart from the indirect support of
thiotrophic biomass by AOM-derived sulphide, AOM communities may also represent a food
source for organisms of higher trophic levels (Levin and Michener, 2002; Werne et al., 2002).
Where oxygen or nitrate is available, all of the produced sulphide - representing an enormous
reducing power - is oxidised. However, the mechanisms removing free sulphide in deeper
sediment layers (>1m bsf), are poorly understood. Here, it appears unlikely that gliding
bacteria, burrowing clams or tubeworms are the mediators for sulphide oxidation (Chapter 5).
Hence a geochemical reaction of sulphide with iron as proposed previously is a more likely
explanation (Hensen et al., 2003; Jørgensen et al., 2004).

Chapter 7 Final discussion and conclusion
257
Free living cells of MOx bacteria may play an important role in the hydrosphere, reducing
methane which has circumvented the benthic microbial filter system (Larock et al., 1994).
However, very little is known about the identity and distribution of these microbes and the
magnitude of MOx in the marine water column. It appears that free-living MOx bacteria play
an important role if fluid flow limits the penetration depth of sulphate or if the comparably
fast growth rates of these bacteria allow to colonise the sea bed around newly created methane
sources (Chapter 2, 3). However, once oxygen is limiting and sulphate and methane overlap,
it is expected that AOM out-competes MOx. In contrast, endosymbiontic MOx bacteria and
some megafauna organisms have apparently formed a very successful symbiosis (Fisher,
1990; Hanson et al., 1993). At HMMV two species of Pogonophora, Oligobrachia
haakonmosbiensis and Sclerolinum contortum build up biomass volumes of about 2 kg m-2
(Chapter 2). Of these two species, at least O. haakonmosbiensis harbours methanotrophic
endosymbionts (Gebruk et al., 2003; Smirnov et al., 2000; Chapter 2). Little is known about
mechanisms selecting for either free-living AOM communities or symbiotic MOx-containing
animals. However, pogonophoran worms at HMMV were found to be confined to habitats
characterised by comparably low fluid flow rates (Chapter 2, 4).
The most striking geochemical process related to AOM is the build up of large structures due
to the precipitation of methane-related, authigenic carbonates. It is currently not known if this
process is directly induced by methane turnover or by other geochemical processes. However,
lipid biomarker analyses have provided evidence that AOM and carbonate precipitation are
spatially connected (Michaelis et al., 2002; Peckmann and Tiel, 2004; Thiel et al., 1999;
Chapter 5, 6). Such authigenic carbonates were found to form subsurface layers in marine
sediments or reef-like structures and chimneys. In permanently anoxic waters of the Black
Sea, calcified microbial reefs were also found to grow into the water column (Michaelis et al.,
2002). In oxic waters, the carbonate crusts may then serve as a hard substrate for sessile
Chapter 7 Final discussion and conclusion
258
organisms (Chapter 6; Bohrmann et al., 1998; Hovland and Judd, 1988; Hovland et al., 1987).
Similar to artificial reefs, carbonate reefs were also found to attract several fish species and
other non-endemic species to the seeps (Hovland and Judd 1988; Chapter 6).
4. FUTURE RESEARCH QUESTIONS
This thesis combined independent analytical tools to investigate dominant modes and
magnitudes of methane oxidation, the mechanisms controlling the vertical and horizontal
distribution of methane turnover, the identity of key methanotrophs and the impact of
methanotrophy on the habitat at active methane seeps. Yet, a quantitative and systematic
understanding of methane seeps as ecosystems and sources of methane to the ocean still
seems far away. In principle, a similar set of questions as addressed in the beginning of this
thesis should be asked again when it is possible to measure methane and sulfide gradients as
well as their turnover in situ at the seafloor:
What is the magnitude of methane oxidation?
What is the heterogeneity in the system?
How much methane escapes into the water column and potentially to the atmosphere?
What are the environmental conditions selecting for particular groups of methanotrophs?
How do methane seeps change over time?
It is still speculative how much methane is turned over in situ as sample recovery and
changing environmental conditions during ex situ measurements introduce artefacts. Hence,
an important research task would be to develop analytical tools allowing to measure substrate
Chapter 7 Final discussion and conclusion
259
concentrations and methane turnover in situ. With respect to a higher availability of
submarine technology such as submersibles, ROVs and AUVs, a combination of sea floor
mapping and high resolution in situ measurements of substrate turnover as well as flux
calculations from in situ pore water solute concentrations provide possibilities for accurate
estimates of microbial activity, environmental heterogeneity and to asses the controlling
mechanisms.
Estimates on methane emission to the hydrosphere and potentially to the atmosphere are
preliminary at most. One interesting task would therefore be to measure methane oxidation
rates in the water column as well as to develop methods allowing to estimate the amount of
methane that is leaving the benthos. For this purpose, instruments are needed which can
measure fluid flow as well as gas ebullition. Some prototypes for these tasks are already
available, but need further development.
Three types of AOM communities were discovered in the last five years and it is possible that
some have remained undiscovered. For example, it is not known which types of
methanotrophs could consume methane anaerobically at high temperatures. Also it is not clear
if terrestrial habitats and the deep biosphere host new groups of anaerobic methanotrophs. The
environmental factors determining for particular AOM communities are entirely speculative.
The morphology and varying contents of membrane lipids of the known, closely related AOM
communities may indicate a different physiological functioning or adaptation to yet unknown
environmental conditions. Very little is known on the phylogeny and membrane lipids of
symbiotic and free living MOx bacteria, and almost nothing is known on environmental
parameters selecting for particular groups of these bacteria. Hence, a first approach would be
Chapter 7 Final discussion and conclusion
260
to obtain AOM and MOx communities in pure culture for manipulation experiments.
Moreover, further analyses on phylogeny and intact membrane lipids in combination with
field studies on environmental conditions should be carried out in the future.
One additional gap in our knowledge on methane seeps and methane-bearing habitats is their
temporal behaviour. Future research should thus attempt to elucidate the variations in
methane fluxes and seep activities over time and the response of the ecosystem to such
variations.
Chapter 7 Final discussion and conclusion
261
References
Aloisi G., Bouloubassi I., Heijs S. K., Pancost R. D., Pierre C., Damste J. S. S., Gottschal J. C., Forney L. J., and Rouchy J. M. (2002) CH4-consuming microorganisms and the formation of carbonate crusts at cold seeps. Earth and Planetary Science Letters203(1), 195-203.
Barnes R. O. and Goldberg E. D. (1976) Methane Production and Consumption in Anoxic Marine-Sediments. Geology 4(5), 297-300.
Barry J. P., Greene H. G., Orange D. L., Baxter C. H., Robison B. H., Kochevar R. E., Nybakken J. W., Reed D. L., and McHugh C. M. (1996) Biologic and geologic characteristics of cold seeps in Monterey bay, California. Deep-Sea Research Part I-Oceanographic Research Papers 43(11-12), 1739-&.
Bian L. Q. (1994) Isotopic biogeochemistry of individual compounds in a modern coastal marine sediment (Kattegat, Denmark and Sweden). Master thesis, Indiana University.
Bian L. Q., Hinrichs K. U., Xie T. M., Brassell S. C., Iversen H., Fossing H., Jorgensen B. B., and Hayes J. M. (2001) Algal and archaeal polyisoprenoids in a recent marine sediment: Molecular isotopic evidence for anaerobic oxidation of methane. Geochemistry Geophysics Geosystems 2, U1-U22.
Blumenberg M., Seifert R., Reitner J., Pape T., and Michaelis W. (2004) Membrane lipid patterns typify distinct anaerobic methanotrophic consortia. Proceedings of the National Academy of Sciences of the United States of America 101(30).
Boetius A., Ravenschlag K., Schubert C., Rickert D., Widdel F., Gieseke A., Amann R., Jørgensen B. B., Witte U., and Pfannkuche O. (2000) A marine microbial consortium apparently mediating anaerobic methane of oxidation. Nature 407, 623-626.
Boetius A. and Suess E. (2004) Hydrate Ridge: a natural laboratory for the study of microbial life fueled by methane from near-surface gas hydrates. Chemical Geology 205(3-4),291-310.
Boschker H. T. S., Nold S. C., Wellsbury P., Bos D., de Graaf W., Pel R., Parkes R. J., and Cappenberg T. E. (1998) Direct linking of microbial populations to specific biogeochemical processes by 13C-labelling of biomarkers. Nature 392, 801-805.
Brassell S. C., Wardroper A. M. K., Thomson I. D., Maxwell J. R., and Eglinton G. (1981) Specific acyclic isoprenoids as biological markers of methanogenic bacteria in marine sediments. Nature 290, 693-696.
Brooks J. M., Field M. E., and Kennicutt M. C. (1991) Observations of Gas Hydrates in Marine-Sediments, Offshore Northern California. Marine Geology 96(1-2), 103-109.
Cordes E. E., Arthur M. A., Shea K., Arvidson R. S., and Fisher C. R. (2005) Modeling the mutualistic interactions between tubeworms and microbial consortia. Plos Biology3(3), 497-506.
de Beer D., Sauter E., Niemann H., Witte U., and Boetius A. (submitted) In situ fluxes and zonation of microbial activity in surface sediments of the Håkon Mosby Mud Volcano. Limnology and Oceanography.
De Rosa M. and Gambacorta A. (1988) The lipids of archaebacteria. Progress in Lipid Research 27, 153-175.
Egorov A. V. and Ivanov M. K. (1998) Hydrocarbon gases in sediments and mud breccia from the central and eastern part of the Mediterranean Ridge. Geo-Marine Letters18(2), 127-138.
Elvert M., Boetius A., Knittel K., and Jorgensen B. B. (2003) Characterization of specific membrane fatty acids as chemotaxonomic markers for sulfate-reducing bacteria involved in anaerobic oxidation of methane. Geomicrobiology Journal 20(4), 403-419.

Chapter 7 Final discussion and conclusion
262
Elvert M., Hopmans E. C., Boetius A., and Hinrichs K.-U. (submitted) Spatial variatons of archaeal-bacterial assambladges in gas hydrate bearing sediments at a cold seep: Implications from a high resolution molecular and isotopic approach.
Elvert M., Suess E., and Whiticar M. J. (1999) Anaerobic methane oxidation associated with marine gas hydrates: superlight C-isotopes from saturated and unsaturated C20 and C25
irregular isoprenoids. Naturwissenschaften 86(6), 295-300. Fisher C. R. (1990) Chemoautotrophic and Methanotrophic Symbioses in Marine-
Invertebrates. Reviews in Aquatic Sciences 2(3-4), 399-436. Gebruk A. V., Krylova E. M., Lein A. Y., Vinogradov G. M., Anderson E., Pimenov N. V.,
Cherkashev G. A., and Crane K. (2003) Methane seep community of the Hakon Mosby mud volcano (the Norwegian Sea): composition and trophic aspects. Sarsia88(6), 394-403.
Haese R. R., Meile C., Van Cappellen P., and De Lange G. J. (2003) Carbon geochemistry of cold seeps: Methane fluxes and transformation in sediments from Kazan mud volcano, eastern Mediterranean Sea. Earth and Planetary Science Letters 212(3-4), 361-375.
Hanson R. S., Bratina B. J., and Brusseau G. A. (1993) Phylogeny and ecology of methylotrophic bacteria. In Microbial Growth on C1 Compounds (ed. J. C. Murrell and D. P. Kelly), pp. 285-302. Intercept Limited.
Hanson R. S. and Hanson T. E. (1996) Methanotrophic bacteria. Microbiological Reviews60(2), 439-&.
Hensen C., Zabel M., Pfeifer K., Schwenk T., Kasten S., Riedinger N., Schulz H. D., and Boettius A. (2003) Control of sulfate pore-water profiles by sedimentary events and the significance of anaerobic oxidation of methane for the burial of sulfur in marine sediments. Geochimica Et Cosmochimica Acta 67(14), 2631-2647.
Hinrichs K.-U. and Boetius A. (2002) The anaerobic oxidation of methane: New insights in microbial ecology and biogeochemistry. In Ocean Margin Systems (ed. G. Wefer, D. Billett, and D. Hebbeln), pp. 457-477. Springer-Verlag, Berlin.
Hinrichs K.-U., Hayes J. M., Sylva S. P., Brewer P. G., and DeLong E. F. (1999) Methane-consuming archaebacteria in marine sediments. Nature 398, 802-805.
Hinrichs K. U., Summons R. E., Orphan V., Sylva S. P., and Hayes J. M. (2000) Molecular and isotopic analysis of anaerobic methane-oxidizing communities in marine sediments. Organic Geochemistry 31(12), 1685-1701.
Hovland M. and Judd A. G. (1988) Seabed Pockmarks and Seepages: Impact on Geology, Biology and the Marine Environment. Graham & Trotman.
Huber R., Wilharm T., Huber D., Trincone A., Burggraf S., König H., Rachel R., Rockinger I., Fricke H., and Stetter K. O. (1992) Aquifex pyrophilus gen. nov. sp. nov., represents a novel group of marine hyperthermophilic hydrogen-oxidizing bacteria. Systematicand Applied Microbiology 15, 340-351.
Iversen N. and Jørgensen B. B. (1985) Anaerobic methane oxidation rates at the sulfate-methane transition in marine sediments from Kattegat and Skagerrak (Denmark). Limnology and Oceanography 30(5), 944-955.
Jensen P., Aagaard I., Burke R. A., Dando P. R., Jorgensen N. O., Kuijpers A., Laier T., Ohara S. C. M., and Schmaljohann R. (1992) Bubbling Reefs in the Kattegat - Submarine Landscapes of Carbonate-Cemented Rocks Support a Diverse Ecosystem at Methane Seeps. Marine Ecology-Progress Series 83(2-3), 103-112.
Jørgensen B. B., Bottcher M. E., Luschen H., Neretin L. N., and Volkov, II. (2004) Anaerobic methane oxidation and a deep H2S sink generate isotopically heavy sulfides in Black Sea sediments. Geochimica Et Cosmochimica Acta 68(9), 2095-2118.
Jørgensen B. B., Weber A., and Zopfi J. (2001) Sulfate reduction and anaerobic methane oxidation in Black Sea sediments. Deep-Sea Research Part I-Oceanographic Research Papers 48(9), 2097-2120.

Chapter 7 Final discussion and conclusion
263
Joye S. B., Boetius A., Orcutt B. N., Montoya J. P., Schulz H. N., Erickson M. J., and Lugo S. K. (2004) The anaerobic oxidation of methane and sulfate reduction in sediments from Gulf of Mexico cold seeps. Chemical Geology 205(3-4), 219-238.
Knittel K., Boetius A., Lemke A., Eilers H., Lochte K., Pfannkuche O., Linke P., and Amann R. (2003) Activity, distribution, and diversity of sulfate reducers and other bacteria in sediments above gas hydrate (Cascadia margin, Oregon). Geomicrobiology Journal20(4), 269-294.
Knittel K., Losekann T., Boetius A., Kort R., and Amann R. (2005) Diversity and distribution of methanotrophic archaea at cold seeps. Applied and Environmental Microbiology71(1), 467-479.
Koga Y., Morii H., Akagawa-Matsushita M., and Ohga I. (1998) Correlation of polar lipid composition with 16S rRNA phylogeny in methanogens. Further analysis of lipid component parts. Bioscience Biotechnology and Biochemistry 62(2), 230-236.
Koga Y., Nishihara M., Morii H., and Akagawa-Matsushita M. (1993) Ether polar lipids of methanogenic bacteria: Structures, comparative aspects, and biosyntheses. Microbiological Reviews 57(1), 164-182.
Kushwaha S. C. and Kates M. (1978) 2,3-Di-O-Phytanyl-Sn-Glycerol and Prenols from Extremely Halophilic Bacteria. Phytochemistry 17(11), 2029-2030.
Langworthy T. A., Holzer G., Zeikus J. G., and Tornabene T. G. (1983) Iso- and anteiso-branched glycerol diethers of the thermophilic anaerobe Thermodesulfotobacteriumcommune. Systematic and Applied Microbiology 4(1), 1-17.
Larock P. A., Hyun J. H., and Bennison B. W. (1994) Bacterioplankton Growth and Production at the Louisiana Hydrocarbon Seeps. Geo-Marine Letters 14(2-3), 104-109.
Lein A., Vogt P., Crane K., Egorov A., and Ivanov M. (1999) Chemical and isotopic evidence for the nature of the fluid in CH4-containing sediments of the Hakon Mosby Mud Volcano. Geo-Marine Letters 19(1-2), 76-83.
Levin L. A. and Michener R. H. (2002) Isotopic evidence for chemosynthesis-based nutrition of macrobenthos: The lightness of being at Pacific methane seeps. Limnology and Oceanography 47(5), 1336-1345.
Levin L. A., Ziebis W., Mendoza G. F., Growney V. A., Tryon M. D., Brown K. M., Mahn C., Gieskes J. M., and Rathburn A. E. (2003) Spatial heterogeneity of macrofauna at northern California methane seeps: influence of sulfide concentration and fluid flow. Marine Ecology-Progress Series 265, 123-139.
Lösekann T., Nadalig T., Niemann H., Knittel K., Boetius A., and Amann R. (unpubl.) Identification of a new cluster of anaerobic methane oxidizers at an Arctic mud volcano (Haakon Mosby Mud Volcano, Barents Sea).
Michaelis W., Seifert R., Nauhaus K., Treude T., Thiel V., Blumenberg M., Knittel K., Gieseke A., Peterknecht K., Pape T., Boetius A., Amann R., Jorgensen B. B., Widdel F., Peckmann J. R., Pimenov N. V., and Gulin M. B. (2002) Microbial reefs in the Black Sea fueled by anaerobic oxidation of methane. Science 297(5583), 1013-1015.
Middelburg J. J., Nieuwenhuize J., Iversen N., Hogh N., De Wilde H., Helder W., Seifert R., and Christof O. (2002) Methane distribution in European tidal estuaries. Biogeochemistry 59(1-2), 95-119.
Nauhaus K., Boetius A., Kruger M., and Widdel F. (2002) In vitro demonstration of anaerobic oxidation of methane coupled to sulphate reduction in sediment from a marine gas hydrate area. Environmental Microbiology 4(5), 296-305.
Nauhaus K., Treude T., Boetius A., and Kruger M. (2005) Environmental regulation of the anaerobic oxidation of methane: a comparison of ANME-I and ANME-II communities. Environmental Microbiology 7(1), 98-106.
Chapter 7 Final discussion and conclusion
264
Niewöhner C., Hensen C., Kasten S., Zabel M., and Schulz H. D. (1998) Deep sulfate reduction completely mediated by anaerobic methane oxidation in sediments of the upwelling area off Namibia. Geochimica et Cosmochimica Acta 62(3), 455-464.
Nuzzo M., Hensen C., Hornibrook E., Brueckmann W., Magalhaes V. H., Parkes R. J., and Pinheiro L. M. (2005) Origin of Mud Volcano Fluids in the Gulf of Cadiz (E-Atlantic). EGU General Assembly.
Ollivier B., Hatchikian C. E., Prensier G., Guezennec J., and Garcia J. L. (1991) Desulfohalobium-Retbaense Gen-Nov, Sp-Nov, a Halophilic Sulfate-Reducing Bacterium from Sediments of a Hypersaline Lake in Senegal. International Journal of Systematic Bacteriology 41(1), 74-81.
Olu K., Lance S., Sibuet M., Henry P., Fiala-Médioni A., and Dinet A. (1997) Cold seep communities as indicators of fluid expulsion patterns through mud volcanoes seaward of the Barbados accretionary prism. Deep-Sea Research I 44(5), 811-841.
Orphan V. J., Hinrichs K. U., Ussler W., Paull C. K., Taylor L. T., Sylva S. P., Hayes J. M., and Delong E. F. (2001a) Comparative analysis of methane-oxidizing archaea and sulfate- reducing bacteria in anoxic marine sediments. Applied and Environmental Microbiology 67(4), 1922-1934.
Orphan V. J., House C. H., Hinrichs K. U., McKeegan K. D., and DeLong E. F. (2001b) Methane-consuming archaea revealed by directly coupled isotopic and phylogenetic analysis. Science 293(5529), 484-487.
Orphan V. J., House C. H., Hinrichs K. U., McKeegan K. D., and DeLong E. F. (2002) Multiple archaeal groups mediate methane oxidation in anoxic cold seep sediments. Proceedings of the National Academy of Sciences of the United States of America99(11), 7663-7668.
Orphan V. J., Ussler W., Naehr T. H., House C. H., Hinrichs K. U., and Paull C. K. (2004) Geological, geochemical, and microbiological heterogeneity of the seafloor around methane vents in the Eel River Basin, offshore California. Chemical Geology 205(3-4), 265-289.
Pancost R. D., Bouloubassi I., Aloisi G., and Damste J. S. S. (2001) Three series of non-isoprenoidal dialkyl glycerol diethers in cold-seep carbonate crusts. OrganicGeochemistry 32(5), 695-707.
Peckmann J. and Thiel V. (2004) Carbon cycling at ancient methane-seeps. ChemicalGeology 205(3-4), 443-467.
Rütters H., Sass H., Cypionka H., and Rullkötter J. (2001) Monoalkylether phospholipids in the sulfate-reducing bacteria Desulfosarcina variabilis and Desulforhabdusamnigenus. Archives of Microbiology 176(6), 435-442.
Sahling H., Rickert D., Lee R. W., Linke P., and Suess E. (2002) Macrofaunal community structure and sulfide flux at gas hydrate deposits from the Cascadia convergent margin, NE Pacific. Marine Ecology-Progress Series 231, 121-138.
Schouten S., Hoefs M. J. L., Koopmans M. P., Bosch H.-J., and Sinninghe Damsté J. S. (1998) Structural characterization, occurrence and fate of archael ether-bound acyclic and cyclic biphytanes and corresponding diols in sediments. Organic Geochemistry29(5-7), 1305-1319.
Schouten S., Hopmans E. C., Pancost R. D., and Sinninghe Damsté J. S. (2000) Widespread occurrence of structurally diverse tetraether membrane lipids: Evidence for the ubiquitous presence of low-temperature relatives of hyperthermophiles. Proceedingsof the Natinonal Academy of Sciences 97(26), 14421-14426.
Schouten S., van der Maarel M. J. E. C., Huber R., and Sinninghe Damsté J. S. (1997) 2,6,10,15,19-pentamethylicosenes in Methanolobus bombayensis, a marine methanogenic archaeon, and in Methanosarcina mazei. Organic Geochemistry26(5/6), 409-414.
Chapter 7 Final discussion and conclusion
265
Schouten S., Wakeham S. G., Hopmans E. C., and Sinninghe Damste J. S. (2003) Biogeochemical Evidence that Thermophilic Archaea Mediate the Anaerobic Oxidation of Methane. Appl. Environ. Microbiol. 69(3), 1680-1686.
Smirnov R. V. (2000) Two new species of Pogonophora from the arctic mud volcano off northwestern Norway. Sarsia 85(2), 141-150.
Suess E., Torres M. E., Bohrmann G., Collier R. W., Greinert J., Linke P., Rehder G., Trehu A., Wallmann K., Winckler G., and Zuleger E. (1999) Gas hydrate destabilization: enhanced dewatering, benthic material turnover and large methane plumes at the Cascadia convergent margin. Earth and Planetary Science Letters 170(1-2), 1-15.
Teske A., Hinrichs K. U., Edgcomb V., Gomez A. D., Kysela D., Sylva S. P., Sogin M. L., and Jannasch H. W. (2002) Microbial diversity of hydrothermal sediments in the Guaymas Basin: Evidence for anaerobic methanotrophic communities. Applied and Environmental Microbiology 68(4), 1994-2007.
Thiel V., Peckmann J., Seifert R., Wehrung P., Reitner J., and Michaelis W. (1999) Highly isotopically depleted isoprenoids: molecular markers for ancient methane venting. Geochimica et Cosmochimica Acta 63(23/24), 3959-3966.
Torres M. E., McManus J., Hammond D. E., de Angelis M. A., Heeschen K. U., Colbert S. L., Tryon M. D., Brown K. M., and Suess E. (2002) Fluid and chemical fluxes in and out of sediments hosting methane hydrate deposits on Hydrate Ridge, OR, I: Hydrological provinces. Earth and Planetary Science Letters 201(3-4), 525-540.
Treude T. (2003) The anaerobic oxidation of methane in marine sediments, Unversity of Bremen.
Treude T., Boetius A., Knittel K., Wallmann K., and Jorgensen B. B. (2003) Anaerobic oxidation of methane above gas hydrates at Hydrate Ridge, NE Pacific Ocean. MarineEcology-Progress Series 264, 1-14.
Treude T., Niggemann J., Kallmeyer J., Wintersteller P., Schubert C. J., Boetius A., and Jørgensen B. B. (accepted) Anarobic oxidation of methane and sulfate reduction along the Chilean continetal margin. Geochimica Et Cosmochimica Acta.
Tryon M. D., Brown K. M., and Torres M. E. (2002) Fluid and chemical flux in and out of sediments hosting methane hydrate deposits on Hydrate Ridge, OR, II: Hydrological processes. Earth and Planetary Science Letters 201(3-4), 541-557.
Werne J. P., Baas M., and Damste J. S. S. (2002) Molecular isotopic tracing of carbon flow and trophic relationships in a methane-supported benthic microbial community. Limnology and Oceanography 47(6), 1694-1701.
Werne J. P. and Damste J. S. S. (2005) Mixed sources contribute to the molecular isotopic signature of methane-rich mud breccia sediments of Kazan mud volcano (eastern Mediterranean). Organic Geochemistry 36(1), 13-27.
Werne J. P., Haese R. R., Zitter T., Aloisi G., Bouloubassi L., Heijs S., Fiala-Medioni A., Pancost R. D., Damste J. S. S., de Lange G., Forney L. J., Gottschal J. C., Foucher J. P., Mascle J., and Woodside J. (2004) Life at cold seeps: a synthesis of biogeochemical and ecological data from Kazan mud volcano, eastern Mediterranean Sea. Chemical Geology 205(3-4), 367-390.
Whiticar M. J. (1999) Carbon and hydrogen isotope systematics of bacterial formation and oxidation of methane. Chemical Geology 161(1-3), 291-314.
Zhang C. L. L., Li Y. L., Wall J. D., Larsen L., Sassen R., Huang Y. S., Wang Y., Peacock A., White D. C., Horita J., and Cole D. R. (2002) Lipid and carbon isotopic evidence of methane-oxidizing and sulfate-reducing bacteria in association with gas hydrates from the Gulf of Mexico. Geology 30(3), 239-242.

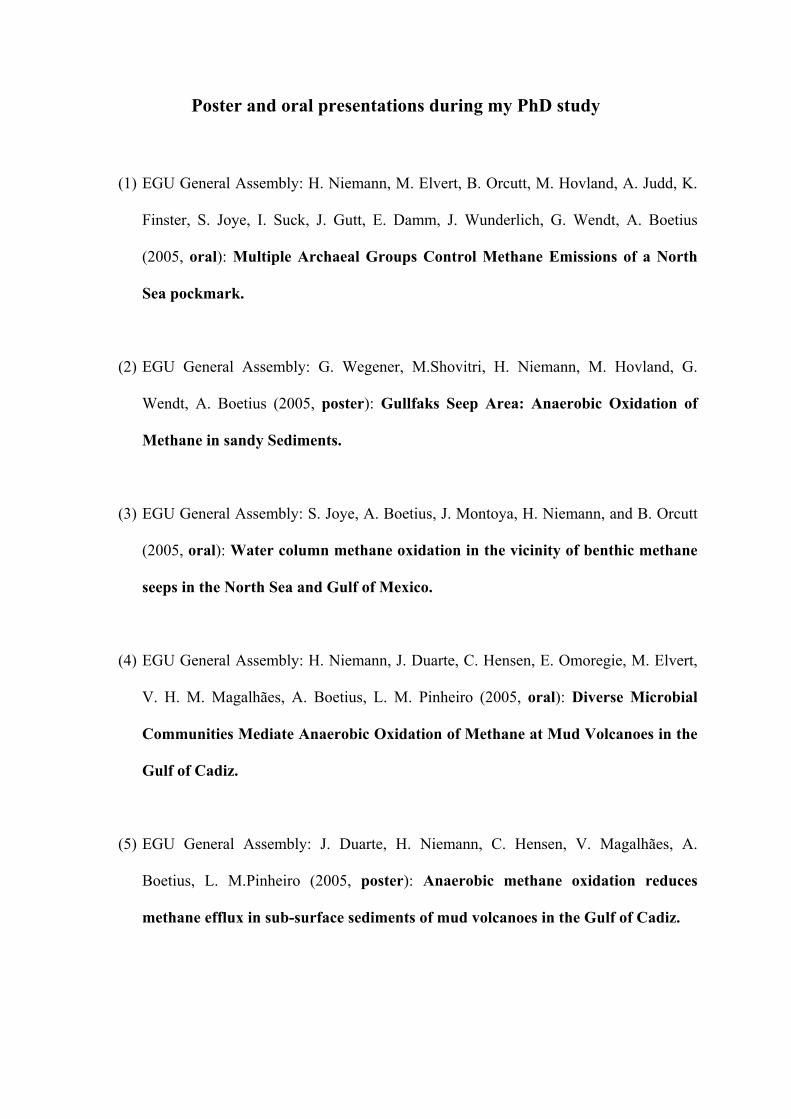
Poster and oral presentations during my PhD study
(1) EGU General Assembly: H. Niemann, M. Elvert, B. Orcutt, M. Hovland, A. Judd, K.
Finster, S. Joye, I. Suck, J. Gutt, E. Damm, J. Wunderlich, G. Wendt, A. Boetius
(2005, oral): Multiple Archaeal Groups Control Methane Emissions of a North
Sea pockmark.
(2) EGU General Assembly: G. Wegener, M.Shovitri, H. Niemann, M. Hovland, G.
Wendt, A. Boetius (2005, poster): Gullfaks Seep Area: Anaerobic Oxidation of
Methane in sandy Sediments.
(3) EGU General Assembly: S. Joye, A. Boetius, J. Montoya, H. Niemann, and B. Orcutt
(2005, oral): Water column methane oxidation in the vicinity of benthic methane
seeps in the North Sea and Gulf of Mexico.
(4) EGU General Assembly: H. Niemann, J. Duarte, C. Hensen, E. Omoregie, M. Elvert,
V. H. M. Magalhães, A. Boetius, L. M. Pinheiro (2005, oral): Diverse Microbial
Communities Mediate Anaerobic Oxidation of Methane at Mud Volcanoes in the
Gulf of Cadiz.
(5) EGU General Assembly: J. Duarte, H. Niemann, C. Hensen, V. Magalhães, A.
Boetius, L. M.Pinheiro (2005, poster): Anaerobic methane oxidation reduces
methane efflux in sub-surface sediments of mud volcanoes in the Gulf of Cadiz.
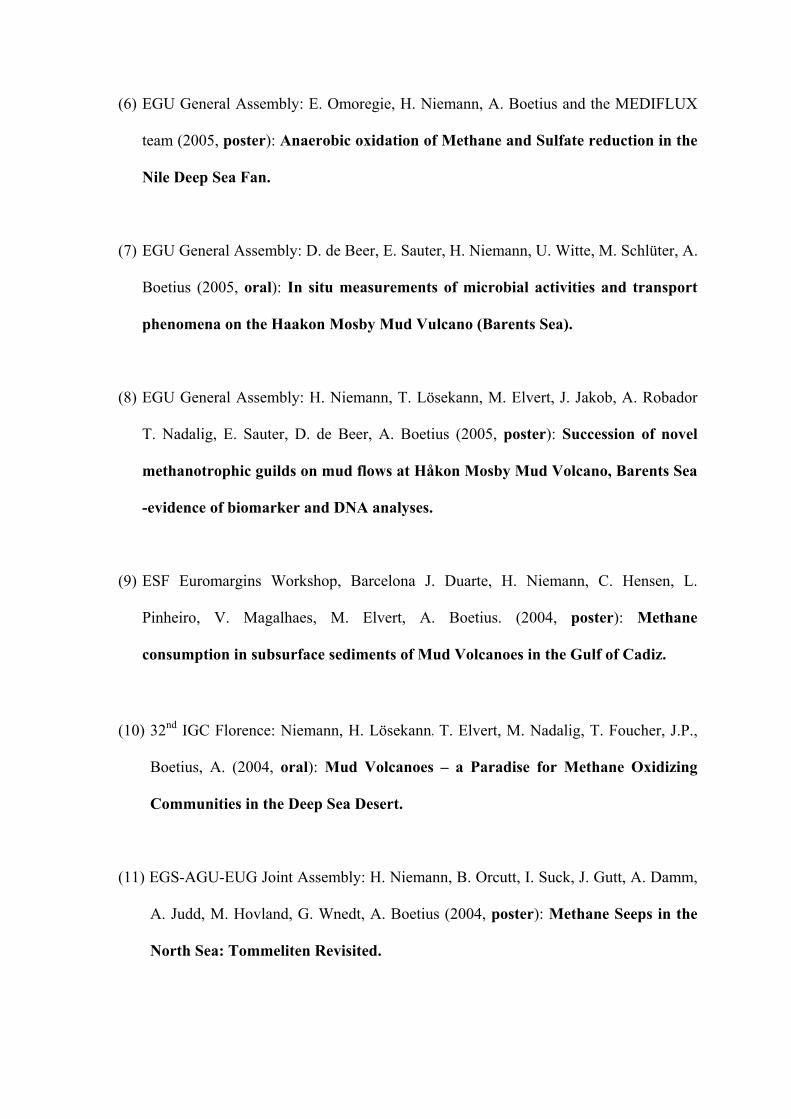
(6) EGU General Assembly: E. Omoregie, H. Niemann, A. Boetius and the MEDIFLUX
team (2005, poster): Anaerobic oxidation of Methane and Sulfate reduction in the
Nile Deep Sea Fan.
(7) EGU General Assembly: D. de Beer, E. Sauter, H. Niemann, U. Witte, M. Schlüter, A.
Boetius (2005, oral): In situ measurements of microbial activities and transport
phenomena on the Haakon Mosby Mud Vulcano (Barents Sea).
(8) EGU General Assembly: H. Niemann, T. Lösekann, M. Elvert, J. Jakob, A. Robador
T. Nadalig, E. Sauter, D. de Beer, A. Boetius (2005, poster): Succession of novel
methanotrophic guilds on mud flows at Håkon Mosby Mud Volcano, Barents Sea
-evidence of biomarker and DNA analyses.
(9) ESF Euromargins Workshop, Barcelona J. Duarte, H. Niemann, C. Hensen, L.
Pinheiro, V. Magalhaes, M. Elvert, A. Boetius. (2004, poster): Methane
consumption in subsurface sediments of Mud Volcanoes in the Gulf of Cadiz.
(10) 32nd IGC Florence: Niemann, H. Lösekann, T. Elvert, M. Nadalig, T. Foucher, J.P.,
Boetius, A. (2004, oral): Mud Volcanoes – a Paradise for Methane Oxidizing
Communities in the Deep Sea Desert.
(11) EGS-AGU-EUG Joint Assembly: H. Niemann, B. Orcutt, I. Suck, J. Gutt, A. Damm,
A. Judd, M. Hovland, G. Wnedt, A. Boetius (2004, poster): Methane Seeps in the
North Sea: Tommeliten Revisited.

(12) International Workshop on Geomicrobiology “aresearch area in progress”: Niemann,
H. Elvert, M. Lösekann, T. Nadalig, T. de Beer, D. Boetius, A. (2004, oral): Håkon
Mosby Mud Volcano, Barents Sea - a Paradise for Methanotrophic
Communities in the Deep Sea Desert.
(13) ESF Euromargins workshop, Amsterdam: German (Alfred Wegener and Max Planck
Institut) Contribution to Mediflux Ocean Margins Research Centre,
Bremen: A. Boetius, Niemann, H.*, Jørgensen, B. (2003, oral): Projekt
MEDIFLUX: Geosphären-Biosphären Interaktion an Schlammvulkanen und
Pockmarks des Nilfächers, Östliches Mittelmeer.
(14) University of Aarhus, Dept. for Ecology and Genetics; Invited Speaker: Niemann, H.,
Elvert, M. Lösekann, T., Nadalig, T., Boetius, A.(2003, oral): A Novel AOM
Community reduces Methane Efflux from Håkon Mosby Mud Volcano.
(15) EGS-AGU-EUG Joint Assembly: Elvert, M., Niemann, H., Sauter, E., Nadalig, T.,
Lösekann, T., Krüger, M., Boetius, A., Schlüter, M., Jørgensen, B. (2003, oral):
Various microbial communities reduce methane efflux from Håkon Mosby Mud
Volcano.
(16) VAAM, Society for General and Applied Microbiology: Lösekann, T., Nadalig, T.,
Niemann, H., Knittel, K., Boetius, A., Amann, R. (2003, oral): Microbial Diversity
and Community Structure at the Håkon Mosby Mud Volcano.
(17) ASLO Aquatic Science meeting: Niemann, H., Elvert, M., Nadalig, T., Boetius, A.
(2003, oral): Biomarker Evidence of Methane Oxidation in Sediments of Håkon
Mosby Mud Volcano.
(18) Goldschmidt Conference: Elvert, M., Niemann, H., Boetius, A., Treude, T., Knittel,
K. (2002, oral): Lipid Biomarkers as Tool for the Analysis of Anaerobic
Methanotrophy in Marine Environments.
(19) Gashydrates in the Geosystem Status Seminar, Kiel: Niemann, H., Elvert, M.,
Nadalig, T., Boetius, A. (2002, poster): Biomarker Evidence of Methane
Oxidation in Sediments of Håkon Mosby Mud Volcano.
Further publications during my PhD study
(1) D. de Beer, E. Sauter, H. Niemann, U. Witte, M. Schlüter, A. Boetius (submitted to
Limnol. Oceanogr.). In situ fluxes and zonation of microbial activity in surface
sediments of the Håkon Mosby Mud Volcano
(2) T. Lösekann, Knittel, K., Nadalig, T, Niemann, H., Boetius, A, Amann, R. (in prep).
Identification of novel clusters of aerobic and anaerobic methane oxidizers at an
Arctic mud volcano (Haakon Mosby Mud Volcano, Barents Sea)
(3) Vandieken, V., Mußmann, M., Niemann, H., Jørgensen B. B. (submitted to IJSEM).
Psychrophilic Fe-reducing bacteria isolated from Arctic sediments, Svalbard:
Desulfuromonas svalbardensis sp. nov. and Desulfuromusa ferrireducens sp. nov.
(4) D. Shlimon, M. W. Friedrich, H. Niemann, N. B. Ramsing and K. Finster (2004).
Methanobacterium aarhusense sp.nov., a novel methanogen isolated from a
marine sediment (Aarhus Bay, Denmark). IJSEM, DOI 10.1099/ijs.0.02994-0
(5) Niemann, H., Richter, C., Jonkers, H. M., Badran, M. (2004). Red Sea gravity
currents cascade near-reef phytoplankton to the twilight zone. MEPS, (269) 91-99
(6) Jonkers, H. M., Ludwig, R., De Wit, R., Pringault, O., Muyzer, G., Niemann, H.,
Finke, N., De Beer, D (2003). Structural and functional analysis of a microbial
mat ecosystem from a unique permanent hypersaline inland lake: La Salada de
Chiprana’ (NE Spain). FEMS Microbiol. Ecol., 44 (2), 175-189
Participations on research cruises during my PhD study
(1) R/V Atlantis, Costa Rica subduction zone, June 7 – June 16, 2005
(2) R/V Sonne, cruise SO175, Gulf of Cadiz, Nov. 27 – Dec. 23, 2003
(3) R/V Atalante cruise Nautinil, Eastern Medditerranean Ridge and Nile Deep Sea Fan,
Sep 5 – Sep 17, 2003
(4) R/V Polarstern cruise ARKXIX3b, Håkon Mosby Mud Volcano, June 26 -
July 21, 2003
(5) R/V Meteor, cruise ME56-2, Congo Deep Sea Fan, Dec 4 - Dec. 31, 2002
(6) R/V Heinke, cruise HE180, central North Sea and Norwegian margin, Oct. 17 -
Oct 27, 2002
(7) R/V Heinke, cruise HE169, central North Sea and Norwegian margin, May 27 -
June 4, 2002
Courses during my PhD study
(1) Grundkurs im Strahlenschutz (basic course in radiation protection), Sep 2 -
Sep 9, 2002
(2) International Geobiology Course at the USC Wrigley Institute for Environmental
Studies, Agouron Institute, July 6 – Aug 16, 2002


Danksagung
Zuerst einmal möchte ich meinem Prüfungskomitee (Antje Boetius und Dieter Wolf-Gladrow,
Willehelm Hagen, Marcus Elvert, Maxim Scheludchenko und Sybille Zitzmann) und meinem
Thesis Committee (Antje Boetius, Marcus Elvert, Bo Barker Jørgensen und Dieter Wolf-
Gladrow) für die Unterstützung bei meiner Dissertation danken. Ein weiterer, ganz herzlicher
Dank gilt vor allem Antje Boetius und Marcus Elvert: für die freundliche Aufnahme am MPI,
die intensive Einarbeitung in verschiedenste, analytische Methoden, insbesondere aber auch
dafür, dass es mir ermöglicht wurde, an einem so spannenden Thema in "allen sieben
Weltmeeren" arbeiten zu können. An dieser Stelle möchte ich auch erwähnen, dass mir die
zwischenmenschliche Seite an unserem Team sehr gefallen hat - so konnte man dann doch
auch mal das eine oder andere Bier zusammen trinken. Als "Doktoreltern" haben Antje und
Marcus mir neue Bereiche der Wissenschaftswelt gezeigt.
Auch Tina Lösekann sei für unsere erfolgreiche Zusammenarbeit an den Håkon Mosby
Proben gedankt. An dieser Stelle möchte ich auch ein großes Lob "meinen" Studenten, Joana
Duarte, Alberto Robador und Jacob Jacob aussprechen.
Ein ebenso herzlicher Dank meinerseits geht an die Techniker der Biogeochemie und Habitat
Gruppe für die tolle Unterstützung auf See und im Labor, vor allem Viola Beier, Imke Busse
und Tomas Wilkop (in alphabetischer Reihenfolge). Ich bin mir ganz sicher, dass die
wissenschaftlichen Ergebnisse ohne diese Drei - um es mal vorsichtig auszudrücken - eher
mager wären. Meine volles Lob gilt in diesem Zusammenhang auch den Ingenieuren und
Technikern der Länderhalle, Jens Langreder, Axel Nordhausen und Marc Viehweger sowie
auch Michael Fitze für die ein oder andere Bastelstunde und logistische Hilfe bei den
Expeditionsvorbereitungen. Nicht unerwähnt dürfen Manfred Schlösser und Axel Krack
bleiben, die sich um das Versenden von Radioisotopen gekümmert haben.
Ulrike Tietjen und Algrid Hillermann sei an dieser Stelle für die vielen Flug- und
Hotelbuchungen gedankt, die sich im Laufe meiner Doktorandenzeit angesammelt haben. Der
Verwaltung des MPI's möchte ich meinen Dank für die schnelle und unbürokratische
Abwicklung "lästiger" Formalitäten aussprechen. Insbesondere sei hier Heike Wojack lobend
erwähnt, die meine Reisekosten in "Lichtgeschwindigkeit" abgerechnet hat.
Ich möchte auch meinen anderen Kollegen aus dem MPI für das tolle Arbeitsklima hier am
Institut danken, vor allem meinen Bürokollegen Verona Vandieken, Julie Leloup, Jochen
Nüster und Lev Neritin.
Ich möchte an dieser Stelle auch meine Eltern und Großeltern erwähnen, die mich, vor allem
während meiner Studienzeit unterstützt haben. Ein großes Dankeschön soll auch an meine
Geschwister gehen, da mir unser Zusammenhalt im letzten Jahrzehnt viel geholfen hat. Auch
meinem langjährigen Freund Simon Gielnick möchte ich noch danken. Er hat mir über die
Jahre, direkt und indirekt, bei Entscheidungen geholfen, die mich letztendlich bis zum
Abschluss dieser Doktorarbeit gebracht haben.
Abschließend möchte ich auch noch all jenen danken, die ich namentlich hier nicht erwähnt
habe, die mich aber dennoch bei meiner Doktorarbeit unterstützt haben.
Erklärung
Hiermit versichere ich, dass ich die vorliegende Arbeit
1. Ohne unerlaubte, fremde Hilfe angefertigt habe
2. keine anderen, als die von mir im Text angegebenen Quellen und Hilfsmittel benutzt habe,
3. die den benutzten Werken wörtlich oder inhaltlich entnommenen Stellen als solche
kenntlich gemacht habe
Bremen den 03.06.2005
Helge Niemann