cover crop survey september 2017 - ctic
TRANSCRIPT

ANNUAL REPORT2016-2017Cover Crop SurveySeptember 2017

content
Abstract .................................................................................................................. 3Foreword ............................................................................................................... 4Introduction .......................................................................................................... 6Method ....................................................................................................................7General Information ............................................................................................ 8Farm Data .............................................................................................................. 9Cover Crop Users ............................................................................................... 10 Farm Size ......................................................................................................... 10 Tillage Practices .............................................................................................. 11 Cover Cropping Experience .......................................................................... 11 Cover Crop Acreage ........................................................................................12 The Perception of Cover Crop Benefits ....................................................... 13 Herbicide-Resistant Weeds ............................................................................16 Cover Crops and Commodity Prices ............................................................18 Cover Crop Species .........................................................................................19 Changes Planned for 2017 .............................................................................20 Cover Crop Species Mixes............................................................................. 22 Planting Cover Crops ..................................................................................... 24 Cover Crop Seed Costs ...................................................................................25 Purchasing Cover Crop Seed ........................................................................ 26 Planting Green ................................................................................................ 26 Interseeding Cover Crops ............................................................................. 30 Cover Crops and Crop Insurance .................................................................33 Cover Crops and Yield ....................................................................................35Non-Users of Cover Crops ................................................................................ 38 Concerns About Cover Crops .......................................................................40 Hunger for Knowledge ................................................................................... 43 Factors That Influence Adoption ..................................................................45Conclusion .......................................................................................................... 46

ABSTRACTThe fifth annual cover crop survey by the Sustainable Agriculture Research and Education (SARE) program and the Conservation Technology Information Center (CTIC) draws on the insight of 2,102 farmers—88% of whom reported using cover crops and 12% who identified themselves as non-users—from across the U.S. Cereal rye remained the top choice of farmers for cover cropping, followed by oats and radish. Sixty-five percent of the cover crop users reported planting mixes in 2016.
Modest but statistically significant yield gains were seen once again in corn (2.3 bushels per acre, or 1.3%) and soybeans (2.1 bushels, or 3.8%) following cover crops.
For the first time, the SARE/CTIC survey was able to gather enough data to allow Dr. Wallace Tyner and Marieke Fenton of Purdue University to also analyze yield differences in wheat (an increase of 1.9 bushels per acre, or 2.8%).
As in each of the previous surveys, plantings of cover crops maintained a steady increase to an average of 400 acres per participant, and projections are that the figure will increase to 451 acres in 2017.
About three-quarters of the 2016 cover crops were seeded by farmers themselves. Almost three out of four (73%) of the cover crops were planted after harvest, though inter-seeding covers into standing crops is on the radar, with 27% seeded at side-dress or later in the season.
Another practice—planting green into cover crops that are still alive but soon to be terminated—is also on the increase, tried or used by 39% of the sample. Respondents say these practices help control weeds and manage soil moisture.
Soil health was noted by 86% of the respondents to be a key benefit of cover crops; improving yield consistency was a second-rated reason, followed by yield advantage. More than half (54%) of the surveyed farmers believed that soil health benefits from cover crops began in the first year of use.
Other benefits explored in the survey were the help cover crops provided in controlling herbicide-resistant weeds (66% reported that weed control was improved after a cereal rye cover crop. In another question, cover crop mixes were rated as the top cover crop species for weed control).
Insight from non-users was also extremely valuable. Their major concerns about cover crops were time and labor, fear of a lack of economic return, and worries that cover crops could become weeds. When cash crop prices are good, non-users were about as likely to consider cover crops as users. However, when commodity prices are low, non-users are less committed to the idea of cover crops compared to current cover crop users.
In all, non-users participating in the survey declared themselves quite interested in learning more about cover crops. While cost share/incentive programs were the top factor non-users said would influence adoption, the next three factors were all about information: free technical assistance, more information on cover crop species and more knowledge of cover crop benefits.
3

FOREWORDCover crops are a hot topic in conservation agriculture. However, as evidenced by this report, they’re more than a buzzword today—farmers are using cover crops on a greater number of acres each year, and there is more and more momentum behind using cover crops to resist soil erosion and build soil health by improving a wide range of soil physical and biological properties. Each iteration of this survey brings new perspectives to light and gives more insights into the ways that farmers are using cover crops on their farms.
This survey is a compilation of facts, figures, statistics and information on cover crop use across the United States. It represents years of cover cropping experience and a wide variety of different methods and systems that farmers are using to plant and manage cover crops on their farms. Without those farmers who give of their time to share their knowledge, this survey would not contain the great information that you will read in the subsequent pages of this report. Their passion, knowledge and insights are invaluable to teaching all of us more about cover crops and how they can effectively be used in farming systems from north to south, east to west, and all parts in between.
You’ll find the same passion among our partners at USDA’s Sustainable Agriculture Research and Education (SARE) program and the American Seed Trade Association (ASTA) in their vision, their promotion of the survey, and for their support in making this survey and report happen. Dr. Rob Myers with the SARE program is a visionary in the realm of cover crops and works tirelessly to learn, teach and promote the innovation and conservation benefits that cover crops can bring to the farm and to the soil. Dr. Myers has been instrumental in initiating and continuing this survey for the past five years and we owe him a deep debt of gratitude for his passion, his zeal for promoting cover crop knowledge, and his vision in keeping this survey going. His tireless promotion of cover crops has been a driving force for this survey.
Jane DeMarchi and her colleagues at ASTA also deserve recognition for their support and their effort on this survey. From contributing questions to making sure that things are moving ahead, Jane and the ASTA members are supporting conservation and sustainability by continuing to promote and support this survey. Since they have been involved in the survey, they have done a great job of distributing the survey to their members, making sure that the questions can support the seed industry and the growing needs within the cover crop markets. Their review and edits to this report also contributed to the accuracy and relevance of the topics presented herein.
We would like to especially thank the ASTA member companies whose financial support made this survey possible: Beck’s Hybrids, Grassland Oregon, Justin Seed Company, La Crosse Seed, Monsanto and Seedway.
Dr. Wallace Tyner at Purdue University and his student Marieke Fenton were once again instrumental in helping to make sure that the yield results were analyzed and could be proven statistically accurate. Their help is paramount in making sure that the yield advantages from using cover crops, which are an often-cited statistic from the survey each year, are documented properly and represented accurately in this report.
Promoting this survey to potential participants is a huge part of making it successful. Without the help of many groups, agencies and organizations, the survey would not receive the number of respondents it did. Kurt Lawton and Scott Grau at Penton Media have been instrumental in expanding the range of farmers who contribute to this survey. By sending the survey link out to readers of Corn and Soybean Digest magazine, the number of people exposed to our survey is multiplied many times over, and their promotion is very important expanding the breadth and depth of information and insight brought to this survey. Many other commodity groups, trade associations and organizations have also helped by distributing the survey across their constituents.
4

Steve Werblow of Steve Werblow Communications is another significant contributor to this survey. Aside from being a sounding board for new questions and confidant on how to interpret information, Steve’s work has been crucial in making sure this report is accurate and the findings relevant to a wide-ranging audience. His ability to take complex concepts and complicated charts and graphs and transform them into meaningful information is uncanny and has contributed to the quality of this report, its broad appeal, and the utility of the information it contains.
This year, I heard from many farmers and survey participants when the survey was open. Their passion for making sure we got it right and represented cover crops accurately from their geography is honorable. They told me where the survey was hitting the mark and where we ought to make changes to better fit how they use cover crops on their farms or how to better represent how cover crops are used in their states or regions. This kind of passion is what drives innovation in the use of cover crops and keeps these farmers on a track towards learning, innovating and moving forward. I hope you find this passion for accurately representing cover crops knowledge and insights in this report.
Much work has gone into drafting questions, interpreting results and drafting the right language to accurately represent this body of knowledge that has been shared with us by so many passionate people. I hope you gain insight from this report and ultimately, I hope this report, and those from the past four years, are useful resources to promoting cover crops, soil health and conservation farming systems to a broad swath of farmers, conservation practitioners and researchers and agency personnel for years to come.
Chad WattsExecutive Director, CTIC
5

INTRODUCTIONThe 2016 growing season was a mixed one. Drought in the West, Northeast, and parts of the South and northern Plains surrounded stellar growing conditions in the center of the country. In the Corn Belt, adequate moisture coming out of the winter and good planting conditions set crops off for a good start, and favorable weather as crops matured contributed to excellent yields.
Despite pride in the yield figures coming out of the Midwest, American farmers suffered through another year of low commodity prices. The spring of 2017 did little to raise their spirits, as markets remained bearish and growers were forced to stay inside as cool, wet weather delayed planting. Many producers who jumped at brief planting windows were forced to replant.
If there was an upside to the wet spring, it was that it likely allowed more growers to participate in the 2016-2017 Cover Crop Survey.
Supported for the fifth year in a row by the Sustainable Agriculture Research and Education (SARE) program, the American Seed Trade Association (ASTA), and conducted by the Conservation Technology Information Center (CTIC), the online survey gathered insights into growers’ practices, preferences and concerns about cover crops.
With help from Purdue University and Penton Agriculture and support from Beck’s Hybrids, Grassland Oregon, Justin Seed Company, La Crosse Seed, Monsanto and Seedway, SARE and CTIC posted the 72-question survey on SurveyMonkey and invited farmers to participate via email solicitations, press releases and web links.
In April and May 2017, 2,012 respondents took the survey, of whom 88% (1,770) identified themselves as cover crop users. They provided insight into practices and attitudes, providing a snapshot for the year. Many had completed previous years’ SARE/CTIC cover crop surveys, but it is important to note that this year’s respondent pool must be considered separately from prior years, as it is not exactly the same group of farmers nor were the same questions asked in previous surveys. As a result, data comparisons with previous years’ surveys must be considered carefully and deliberately.
That said, this year’s survey provides a thorough look into the state of cover crops today, adding to the insight gained each of the past five years—a period that covers large differences in markets and weather conditions.
Our hope is that this survey, like the ones before it, can help contribute to our understanding of cover crops and guide the development of education, products and policy that will encourage greater adoption and further success for farmers who use them.
More information from this survey is available at www.sare.org/covercropsurvey.
6

METHODThe 2016-2017 survey was developed by SARE and CTIC with help from ASTA and researchers from Purdue University. The instrument included questions that have been asked in previous surveys, as well as new questions that sharpened this year’s survey focus on specific management techniques such as “planting green” into standing cover crops and inter-seeding covers into standing cash crops.
Farmers across the country were invited to participate in the survey through several contacts, including:
• An email by Penton Agriculture publications to its subscriber lists of more than 50,000 farmers;• Participants in previous SARE/CTIC cover crop surveys;• Participants in CTIC activities including cover crop tours, watershed projects and research and
demonstration plot tours;• Members of the steering committees of the Indian Creek Watershed Project, the Big Pine Watershed
Project, the Conservation Agriculture Systems Alliance (CASA) and other CTIC-related projects; • SARE lists that included farmers and crop advisors; • Corn and soybean producers who received the survey from the National Corn Growers Association
(NCGA) and American Soybean Association (ASA).• Members of Regional Cover Crop Councils networks in the Northeast, Midwest and South.
All data was collected anonymously.
Because the respondent samples and questions were not identical with previous surveys, statistical analysis practices prevent us from inferring trends from year to year. However, the 2016-2017 Cover Crop Survey provides an excellent insight into the current state of cover crops in a challenging economic period in American agriculture.
At the start of the survey, respondents were asked to identify whether they were farmers. If the answer was “no,” they were led out of the survey and thanked for their time.
Farmers were then separated into cover crop users and non-users; those reporting that they did not plant cover crops in 2016 were directed to a non-users question track. Of the 2,012 farmers who responded to the survey, 88% (1,770) reported themselves to be cover crop users and 12% (241) followed the non-user track.
COVER CROP USERS VS. NON USERS
7

Not all respondents completely filled out the survey, which accounts for different numbers of answers to specific questions (signified by the n value with each graph). Because we believe it is more valuable to capture the thoughts and practices of farmers across the country than to use data only from surveys that were fully complete, we included all the valid data we could capture.
For analysis of yield data, the top and bottom 1% of values were eliminated from the results to eliminate significant outliers (such as a single farmer reporting that he or she planted hundreds of thousands of acres of cover crops or those that did not report comparable yields from farms with and without cover crops).
The results of the 2016-2017 survey are detailed in the pages that follow.
GENERAL INFORMATIONRespondents to the survey represented 47 states and the District of Columbia, reporting on 691,164 acres of cover crops. Only Arizona, Nevada and New Mexico were not represented in the survey. Of that total acreage, 131,959 acres (19%) were reported by respondents who did not specify a state in which they farmed.
States with the largest numbers of respondents included Iowa, Illinois and Indiana. Iowa had the largest number of respondents, with 186 survey participants representing 56,843 acres of cover crops, while Indiana’s 112 participants planted 101,154 acres of covers.
2017 COVER CROP SURVEY COVER CROP USER RESPONDENTS
8

FARM DATAA large majority of the farmers who took the survey—80%, or 1,416 respondents—identified themselves as commodity producers. This was defined in the survey question as a grower of commodity crop farmer, a category that included corn, soybeans, wheat, cotton, sorghum, etc. The other 20% (354) placed themselves in the category of horticultural crop or vegetable farmer.
Compared to last year’s survey, that reflects 10% more respondents reporting themselves to be commodity crop farmers and almost the same number of vegetable/horticultural crop producers.
2017 COVER CROP SURVEY NON-USER RESPONDENTS
SURVEY RESPONDENTS
9
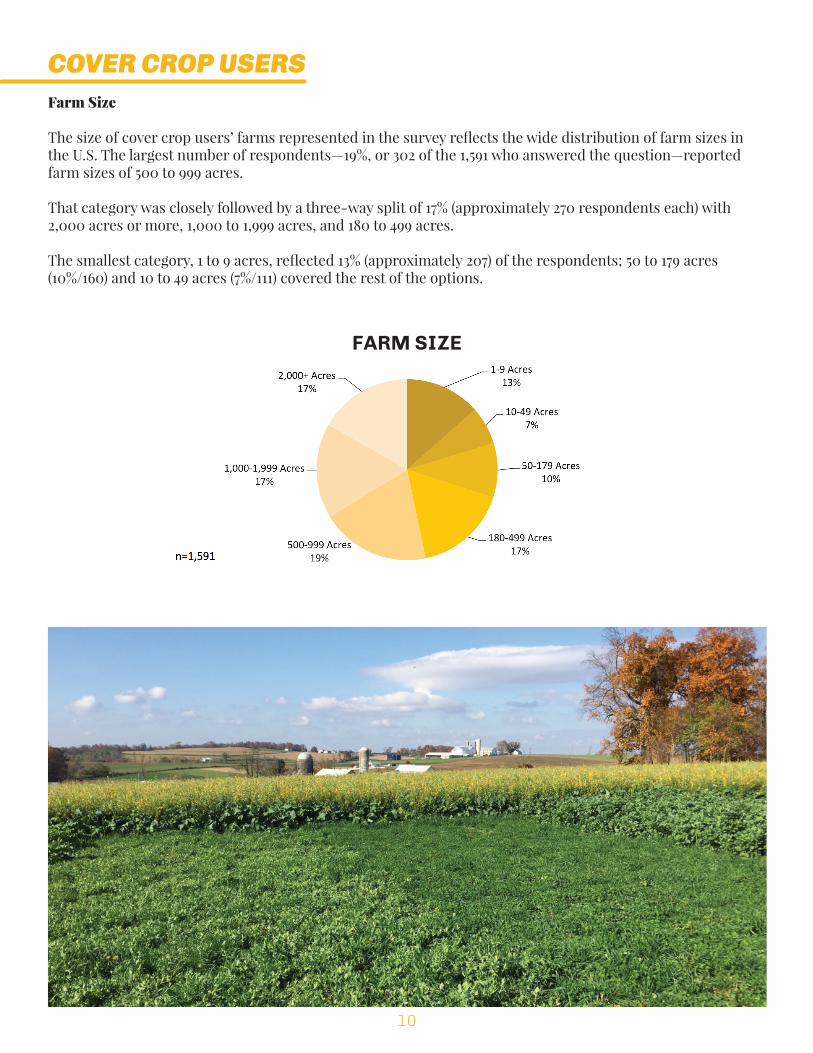
COVER CROP USERSFarm Size
The size of cover crop users’ farms represented in the survey reflects the wide distribution of farm sizes in the U.S. The largest number of respondents—19%, or 302 of the 1,591 who answered the question—reported farm sizes of 500 to 999 acres.
That category was closely followed by a three-way split of 17% (approximately 270 respondents each) with 2,000 acres or more, 1,000 to 1,999 acres, and 180 to 499 acres.
The smallest category, 1 to 9 acres, reflected 13% (approximately 207) of the respondents; 50 to 179 acres (10%/160) and 10 to 49 acres (7%/111) covered the rest of the options.
FARM SIZE
10

Tillage Practices
Not surprisingly given the level of interest in soil health among many cover crop users, their tillage practices trend toward little or no soil disturbance. However, the range of answers to a question on tillage practices demonstrated that cover crops are not solely used by “hardcore” no-till and conservation farming devotees.
Continuous no-till was a strong favorite among the 1,582 cover crop users who described tillage practices, with 41% (657) of the respondents. Reduced tillage was second with 27% (427), followed by rotational no-till (14%, or 223 respondents) and conventional tillage (14%/218). Vertical tillage was the choice for 4% (57) of the respondents.
Cover Cropping Experience
Of 1,595 respondents answering a multiple-choice question about the length of their experience with cover crops, 37% (588) had used cover crops for 3 years or less, while the remaining 63% (1,007) had used cover crops for 4 years or more.
TILLAGE PRACTICES
COVER CROPPING EXPERIENCE
11
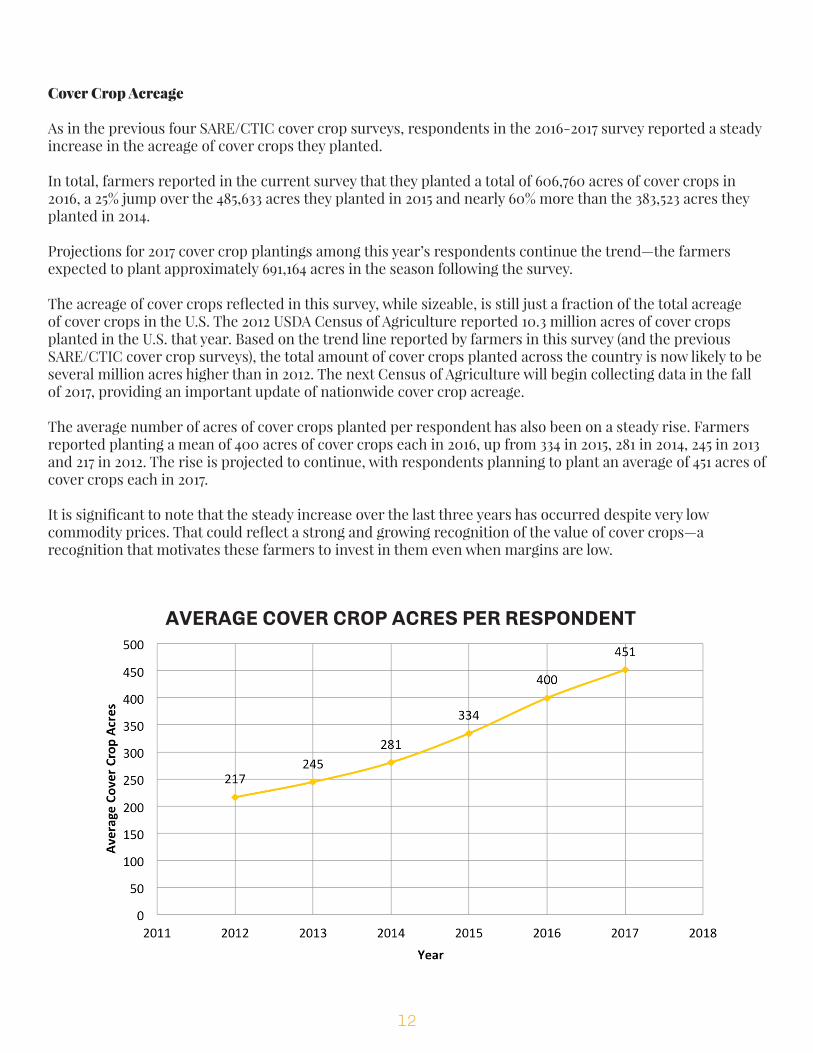
Cover Crop Acreage
As in the previous four SARE/CTIC cover crop surveys, respondents in the 2016-2017 survey reported a steady increase in the acreage of cover crops they planted.
In total, farmers reported in the current survey that they planted a total of 606,760 acres of cover crops in 2016, a 25% jump over the 485,633 acres they planted in 2015 and nearly 60% more than the 383,523 acres they planted in 2014.
Projections for 2017 cover crop plantings among this year’s respondents continue the trend—the farmers expected to plant approximately 691,164 acres in the season following the survey.
The acreage of cover crops reflected in this survey, while sizeable, is still just a fraction of the total acreage of cover crops in the U.S. The 2012 USDA Census of Agriculture reported 10.3 million acres of cover crops planted in the U.S. that year. Based on the trend line reported by farmers in this survey (and the previous SARE/CTIC cover crop surveys), the total amount of cover crops planted across the country is now likely to be several million acres higher than in 2012. The next Census of Agriculture will begin collecting data in the fall of 2017, providing an important update of nationwide cover crop acreage.
The average number of acres of cover crops planted per respondent has also been on a steady rise. Farmers reported planting a mean of 400 acres of cover crops each in 2016, up from 334 in 2015, 281 in 2014, 245 in 2013 and 217 in 2012. The rise is projected to continue, with respondents planning to plant an average of 451 acres of cover crops each in 2017.
It is significant to note that the steady increase over the last three years has occurred despite very low commodity prices. That could reflect a strong and growing recognition of the value of cover crops—a recognition that motivates these farmers to invest in them even when margins are low.
AVERAGE COVER CROP ACRES PER RESPONDENT
12

Cover crop acreage planted by respondents in this year’s survey was most likely to be either a very high or a very low percentage of their total farmland.
The largest category was 0 to 20% of the farm in cover crops, at 32% (509 of 1,579 respondents), followed by 24% (380) who reported planting 81 to 100% of their acreage to cover crops.
Levels of 21 to 40% totaled 18% (288) of the respondents; 41 to 60% accounted for 15% (236) and 61 to 80% of farm acreage committed to cover crops in 2016 was selected by 11% (166) of the cover crop users.
The Perception of Cover Crop Benefits
Learning what farmers believe to be the benefits of cover crops is vital to understanding what motivates them to invest in these systems. That is especially true in a struggling agricultural economy, in which many farmers would be tempted to cut any costs that did not appear to be delivering a significant return on investment.
When asked to indicate their level of agreement with a series of sentences about possible benefits of cover crops, users identified soil health as the top outcome of engaging in the practice.
In all, 1,208 farmers (86% of those who rated the statement) agreed or strongly agreed with the statement, “Using cover crops has improved soil health on my farm.” In fact, 640 (45%) strongly agreed, the largest single reaction to any of the statements. Just 18 (1%) disagreed with the soil health statement and 11 (less than 1%) strongly disagreed; the remaining 173 (12%) were neutral.
It is interesting—and heartening—to note that soil health reflects an embrace of a long-term, hard-to-quantify benefit of cover crops, and that for the past two surveys, it has achieved the top spot by garnering 86% of the responses. The first year “soil health” was an option was in the 2014-2015 survey, in which 22% of the respondents selected it as the top benefit.
Leveling out yield swings from season to season was widely ascribed to cover crops. When presented with the statement, “Using cover crops has helped my yields become more consistent on an annual basis regardless of the weather,” 450 (32%) of the farmers agreed and 242 (17%) strongly agreed. Slightly more than 42% (598) of the respondents were neutral on the statement, while 6% (78) disagreed and just 2% (31) strongly disagreed.
PERCENT OF FARM IN COVER CROPS
13
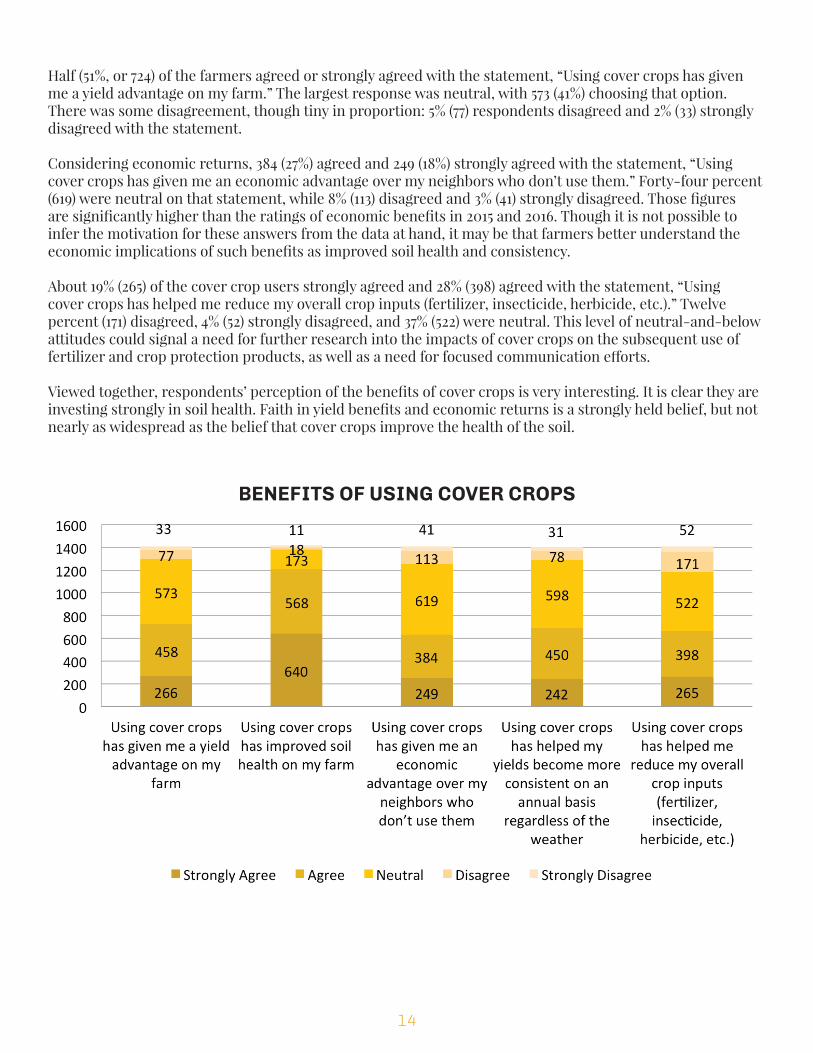
Half (51%, or 724) of the farmers agreed or strongly agreed with the statement, “Using cover crops has given me a yield advantage on my farm.” The largest response was neutral, with 573 (41%) choosing that option. There was some disagreement, though tiny in proportion: 5% (77) respondents disagreed and 2% (33) strongly disagreed with the statement.
Considering economic returns, 384 (27%) agreed and 249 (18%) strongly agreed with the statement, “Using cover crops has given me an economic advantage over my neighbors who don’t use them.” Forty-four percent (619) were neutral on that statement, while 8% (113) disagreed and 3% (41) strongly disagreed. Those figures are significantly higher than the ratings of economic benefits in 2015 and 2016. Though it is not possible to infer the motivation for these answers from the data at hand, it may be that farmers better understand the economic implications of such benefits as improved soil health and consistency.
About 19% (265) of the cover crop users strongly agreed and 28% (398) agreed with the statement, “Using cover crops has helped me reduce my overall crop inputs (fertilizer, insecticide, herbicide, etc.).” Twelve percent (171) disagreed, 4% (52) strongly disagreed, and 37% (522) were neutral. This level of neutral-and-below attitudes could signal a need for further research into the impacts of cover crops on the subsequent use of fertilizer and crop protection products, as well as a need for focused communication efforts.
Viewed together, respondents’ perception of the benefits of cover crops is very interesting. It is clear they are investing strongly in soil health. Faith in yield benefits and economic returns is a strongly held belief, but not nearly as widespread as the belief that cover crops improve the health of the soil.
BENEFITS OF USING COVER CROPS
14

Looking back to the 2014, 2015 and 2016 surveys, soil health and organic matter have always figured at the top of users’ lists of cover crop benefits. Farmers’ commitment to—and willingness to invest in—this long-term goal is deeply heartening.
Though building soil is a long-term process, more than half the farmers (54%, or 750 of 1,397 respondents) reported that soil improvements began appearing in less than 2 years. An additional 21% (294) said improvements appeared in 2 to 3 years, 5% (64) in 4 to 5 years, and 19% (268) reported waiting 5 years or more before seeing benefits in soils on their farm. Just 2% (21) said they have not seen benefits to their soils from cover crops. With one in four current cover crop users willing to wait four years or more to see benefits in their soils, long-term thinking appears to be deeply established in the cover crop community.
This range of answers may also reflect individual farmers’ focus on different aspects of soil health—for instance, some are likely reporting on fast-responding soil health parameters like earthworm populations or other biological activity, while others might be tracking soil changes that take longer to measure, such as changes in soil organic matter levels.
WHEN DID YOU BEGIN TO SEE SOIL HEALTH BENEFITS OF USING COVER CROPS?
15

Herbicide-Resistant Weeds
Herbicide-resistant weeds are a widespread problem, and cover crops can offer help in suppressing or controlling them.
When asked whether they had herbicide-resistant weeds on their farm, 59% (807) of 1,375 respondents said “yes” and 41% (568) said “no.”
Of 736 cover crop users who answered a follow-up question on the impact of a cereal rye cover crop on herbicide-resistant weeds, one in four (25%, or 186 farmers) said a cover crop of cereal rye is always followed by improved control of herbicide-resistant weeds, and 44% (322) said improved control of herbicide-resistant weeds sometimes followed a cover crop of cereal rye. Thirty-one percent (228) said “no” to the statement.
When asked which cover crop provided the most help controlling herbicide-resistant weeds, cover crop mixes came out on top, followed by annual ryegrass. (It is important to note that cereal rye was inadvertently left off the survey instrument as one of the options for this question, and although 102 farmers wrote in cereal rye under the “Other” category, cereal rye—which is a very widely used cover crop—would very likely have ranked significantly higher had it been a listed choice.)
DO YOU HAVE HERBICIDE-RESISTANT WEEDS ON YOUR FARM?
DO YOU SEE IMPROVED CONTROL OF HERBICIDE-RESISTANT WEEDS AFTER USING CEREAL RYE AS A COVER CROP?
16
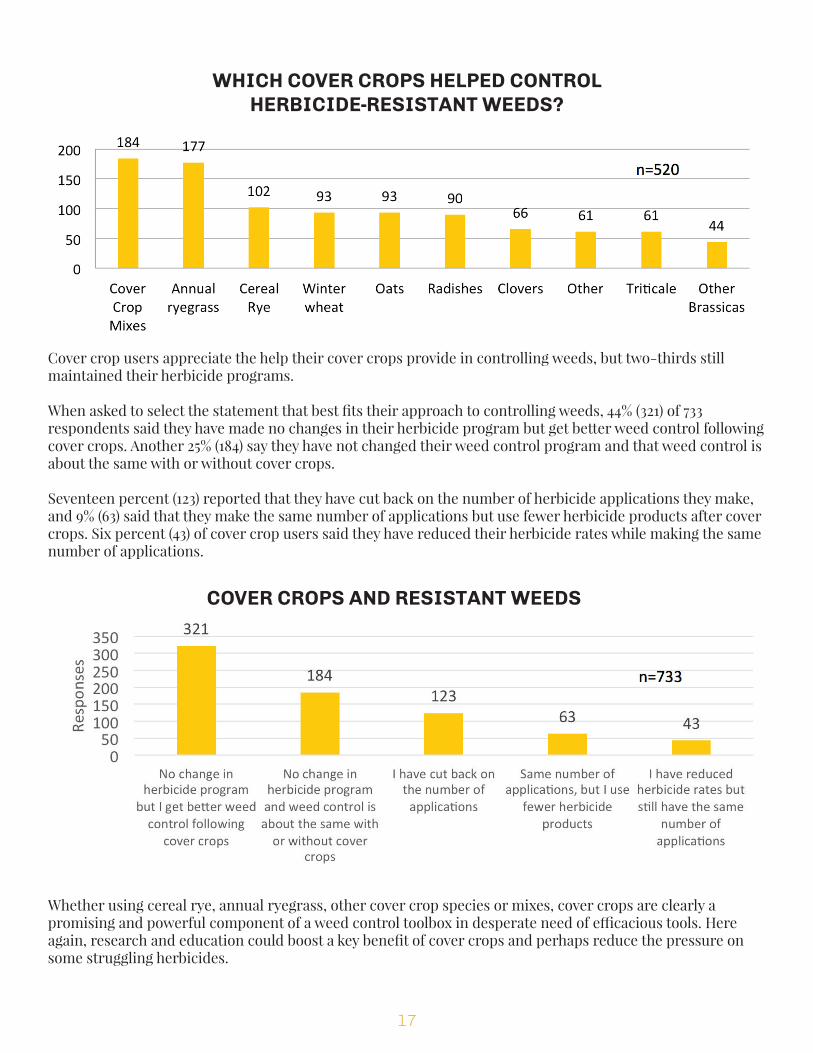
Cover crop users appreciate the help their cover crops provide in controlling weeds, but two-thirds still maintained their herbicide programs.
When asked to select the statement that best fits their approach to controlling weeds, 44% (321) of 733 respondents said they have made no changes in their herbicide program but get better weed control following cover crops. Another 25% (184) say they have not changed their weed control program and that weed control is about the same with or without cover crops.
Seventeen percent (123) reported that they have cut back on the number of herbicide applications they make, and 9% (63) said that they make the same number of applications but use fewer herbicide products after cover crops. Six percent (43) of cover crop users said they have reduced their herbicide rates while making the same number of applications.
Whether using cereal rye, annual ryegrass, other cover crop species or mixes, cover crops are clearly a promising and powerful component of a weed control toolbox in desperate need of efficacious tools. Here again, research and education could boost a key benefit of cover crops and perhaps reduce the pressure on some struggling herbicides.
WHICH COVER CROPS HELPED CONTROL HERBICIDE-RESISTANT WEEDS?
COVER CROPS AND RESISTANT WEEDS
17

Cover Crops And Commodity Prices
To further test farmers’ beliefs on the value of cover crops, the survey included two statements on the relationship between cover crops and commodity prices.
A strong market for cash crops certainly heightens the chances of adoption of cover crops. Asked for their level of agreement with the statement, “When commodity prices increase I use or am more likely to use cover crops,” 12% (154 of 1,297 respondents) strongly agreed, 28% (357) agreed and 45% (578) were neutral. Seventy-four (6%) strongly disagreed and 10% (134) disagreed.
However, farmers in the survey reported that they are not very likely to abandon cover crops when economic times are hard. Just 4% (49 of 1,293 respondents) strongly agreed and 14% (184) agreed when asked their level of agreement with the statement, “When commodity prices fall, I use less or am less likely to use cover crops.” Nearly half—49%, or 635 farmers—were neutral, while 22% (283) disagreed and 11% (142) strongly disagreed. Interestingly, that is a larger proportion of disagreement than found among last year’s respondents (33% vs. 29%).
Cover crop users appear to believe deeply enough in the advantages of cover crops that they may increase their use when commodity prices are good, but are less likely to decrease their planting of covers when cash crops are not as profitable. The proof is in the planting—over the past few years of low cash crop prices, total acreage of cover crops and the number of acres of cover crops per farm have increased.
COMMODITY PRICES AND COVER CROP USE
18

Cover Crop Species
Farmers have a wide range of cover crop choices, depending on the benefits they are seeking or how much management they are willing to commit to cover crops. For instance, they may be more willing to terminate an overwintering cover crop species rather than to choose a species that is easily killed by frost.
As in previous years, the 2016-2017 survey gathered acreage figures for many of the most popular cover crop species.
Cereal rye was once again the most popular cover crop, with 289,068 acres planted by participants in 2016 in this year’s survey. In the cereal grains category, oats were second most-popular, with 159,607 acres in 2016, followed by winter wheat (93,899 acres), annual ryegrass (76,148 acres), triticale (36,001) and winter barley (26,824).
Among brassicas, mustards and cole crops used as covers, radish was the leader with 139,476 acres in 2016 among survey respondents, followed by 98,577 acres of rapeseed, 70,002 acres of turnip and 14,503 acres of canola.
Crimson clover led the legume choices with 74,352 acres planted as cover crops in 2016 by respondents to the current survey. With 42,355 acres, winter pea was the second most popular legume, followed by hairy vetch (39,266 acres), other clovers (24,096), cowpea (22,129), red clover (21,561), sunn hemp (11,406) and other vetches (6,089 acres).
Among summer annuals, buckwheat was a strong leader with 31,973 acres planted by respondents in 2016, followed by 23,449 acres of sorghum sudan and 19,033 acres of millet. That represents a significant boost for buckwheat, which was second to sorghum sudan among last year’s survey participants.
Other than the buckwheat boom, cover crop species choices have been consistent for the past several years. Compared to last year’s survey, the only significant changes were the rise of oats over winter wheat and a gain in proportion for sunn hemp over “other vetches.”
19

Changes Planned for 2017
Plans for 2017 cereal crop cover crop planting among this year’s respondents predicted decreases in cereal rye (289,068 acres in 2016 to 279,036 in 2017) and winter barley 26,824 acres to 25,524), and more significant drops in oats (159,607 acres in 2016 to 97,965 in 2017) and winter wheat (93,899 acres vs. 77,062). That represents a predicted 38% drop in oats and an 18% decrease in winter wheat as cover crops between 2016 and 2017, as well as a 3% decline in cereal rye.
Meanwhile, respondents expected to increase their acreage of annual ryegrass (from 76,148 acres in 2016 to 91,534 acres in 2017, a 20% increase) and triticale (from 36,001 acres in 2016 to 37,744 in 2017, a 5% gain).
Brassicas, cole crops and mustards were expected to be more stable, with small drops in turnip, rapeseed and canola plantings and a slight gain in radish. Respondents predicted they would plant 2% more radish in 2017 than they did in 2016 (142,219 in 2017 vs. 139,476 in 2016) while committing 6% less acres to turnip (65,799 in 2017 vs. 70,002 in 2016), 6% less to rapeseed (93,085 acres vs. 98,577 the previous year) and 16% less canola (12,177 acres in 2017 compared to 14,503 the year before).
CEREAL GRAIN USE AS COVER CROPS
BRASSICA, COLE CROP, AND MUSTARD SPECIES
20

Among legume species, crimson clover was predicted to take the biggest loss in acreage between 2016 and 2017, with respondents predicting that they would plant 70,583 acres of crimson clover in 2017 vs. 74,352 acres in 2016, a 5% decline. Sunn hemp (+38%), cowpea (+28%), other clovers (+25%), hairy vetch (+21%) and red clover (+18%) were all expected to gain acreage.
Among non-leguminous summer annuals, buckwheat was expected to continue its climb, gaining 2,813 acres (9%) between 2016 and 2017. Respondents expected to decrease acreage of millet from 19,033 in 2016 to 16,096 (a 15% loss) and plant just 22,199 acres of sorghum sudan in 2017 compared to 23,449 in 2016 (a decrease of 5%).
LEGUME SPECIES
SUMMER ANNUALS (NON-LEGUME)
21

Cover Crop Species Mixes
The use of mixes of cover crop seed remains high. Combining the strengths of various cover crop species—for instance, the nutrient sequestration of grasses, nitrogen fixation from legumes, the fast growth of buckwheat, and deep soil penetration of radish—can deliver a wide range of benefits.
A significant majority of respondents reported using cover crop mixes in 2016—50% (709 of 1,454) said they planted mixes in 2016 and plan to do so again in 2017, while 15% (205) said they planted mixes in 2016. An additional 11% (156) indicated their intention to plant a mix in 2017, and 24% (339) said they have not used cover crop mixes.
Respondents to a subsequent question—how they started with blends—reflected a split between starting with mixes and starting with single species.
Half of the 1,095 cover crop users who answered the question—545 farmers—said they started with single-species plantings of cover crops, then began trying mixes. Thirty-two percent (344) reported that they started by using mixes and have been using them since. Another 14% (155) noted that they started with mixes and have increased their use of blends over time, and just 4% (48) said they started with mixes but have decreased their use of the combinations over time.
These results indicate that there is strong potential to encourage farmers to expand from single-species plantings to the use of cover crop mixes.
The number of species in a blend varied widely among participants in the survey. Just as the phrase “backyard barbecue” can evoke a wide range of images from simple burgers with salt and pepper to complex, secret family recipes, cover crop blends can reflect a huge range of philosophies and ingredients.
Among 1,079 users of cover crop blends, 28% (298) reported planting 3 species in a mix, while an almost identical number (293, or 27%) used 2 species. A similar proportion, 23% (252), said they mix 4 to 5 species, while 9% (67) combined 6 or 7 species and 13% (138) blended 8 or more.
USE OF COVER CROP MIXES
22

In terms of acres planted, the leading choices were 4-way-or-more mixes, with 123,250 acres compared to 75,267 acres of 2-way mixes and 64,374 acres of 3-way mixes planted in 2016.
When looking at their plans for 2017 cover crop planting, respondents intended to plant 128,819 acres to mixes of 4 or more species, 97,998 acres to 2-way mixes and 71,731 acres to 3-species blends. That reflects a small shift of 4% toward 2-way mixes from 4-or-more-species blends.
It is interesting to note that 66% (722 of 1,092) of the farmers who reported using cover crop mixes designed their own blends. Pre-packaged mixes were used by 16% (182) and blends custom-designed by a consultant accounted for 18% (193). Though we cannot infer a trend from one year’s survey to the next, it is interesting to note that the 66% figure for self-designed blends is higher than last year’s finding of 60%.
Still, designing or advising on species mixes may evolve into an excellent business opportunity for crop consultants, seed dealers and agricultural retailers as more farmers try cover crops (including mixes) and appreciation grows for the art and science of developing blends with specific benefits.
SPECIES USED IN MIXES
COVER CROP MIX USE
23

Planting Cover Crops
Asked, “Which of the following best describes the timing of your cover crop planting?” the vast majority of farmers—73%, or 1,125 of the 1,535 respondents to this question—reported planting cover crops after harvest. Late summer/prior to harvest was the choice of 18% (276) growers, while 9% (134) said they inter-seeded cover crops near side-dress. Side-dress timing is assumed to be, in most cases, when corn was roughly knee-high in June.
Side-dress timing shows significant promise for good cover crop establishment at a time farmers are already in their fields, making this an exciting subject for further field testing. It will be interesting to see if the practice grows.
The post-harvest timing may connect closely with the prevalence of farmers planting their own cover crops, as it most easily fits the timing and equipment available on many farms. This year, 74% (1,024 of the 410 respondents to the question) said they plant and establish their own cover crops, while 12% (164) hired an aerial applicator to plant their cover crops, 8% (108) hired an agricultural retailer, 6% (83) hired a friend or neighbor, and less than 1% (10) had the good fortune to have a neighbor or friend plant cover crops for free.
COVER CROP MIXES USED
TIMING OF COVER CROP PLANTING
24

Access to specialized equipment such as an airplane, high-clearance air seeders, or even broadcast seeders allows hired planting services to offer more timing options than most farmers can currently tackle on their own.
As cover crop adoption continues to increase, the market for custom cover crop planting is likely to grow. Custom cover crop planting can help agricultural retailers and aerial applicators utilize expensive machinery during traditionally slow periods in the summer. That can provide revenue opportunities and greater return on machinery investment; it can also help farmers get cover crops established earlier in the season, which has been shown in many cases to deliver benefits such as better stands and more biomass. Farmers who already feel too busy during the fall may also utilize custom seeding services after harvest.
Cover Crop Seed Costs
Only one-quarter of the respondents pay to have their cover crops planted, but seed is an expense for nearly all cover crop users.
Nearly half of the respondents paid $11 to $20 per acre for their cover crop seed in 2016—25% (327 of the 1,430 answers) reporting seed expenses of $11 to $15 and 22% (288) reporting them to be $16 to $20.
Reported seed expenses ranged from a low of $0 to $5 (3%/42 respondents) to a similar number—42 farmers, or 4%-paying $36 to $40. One respondent reported paying more than $40 in seed expenses.
COVER CROP SEED EXPENSES PER ACRE
DID YOU HIRE SOMEONE TO PLANT YOUR COVER CROPS?
25

Purchasing Cover Crop Seed
Demand is high—and growing—for cover crop seed, which is creating opportunities for seed specialists and agricultural retailers.
Of 1,387 respondents, 36% reported that they bought cover crop seed from a cover crop seed dealer (different from a commodity seed dealer, the category that captured 11% of the buyers). Agricultural retailers were the second most popular source of cover crop seed, with 31% of the responses. Twelve percent purchased their cover crop seed from another farmer, and 10% selected “other.”
Asked where they would like to purchase cover crop seed in the future, 43% preferred a cover crop seed dealer, 25% specified their ag retailer, 13% selected “another farmer,” 8% preferred a commodity seed dealer and 10% said “other.” In both questions, respondents were permitted to select all the answers that applied to their business, so totals could exceed 100%.
As the practice of planting cover crops matures and seed is purchased through commercial channels, the importance of a seed tag—which details information on the purity, germination and noxious weed content of the contents of the bag—grows significantly.
For the first time, participants in the SARE/CTIC survey were asked whether they look for a seed tag when buying cover crop seed.
Of 1,387 respondents to the question, 48% (659) said they always request a seed tag and 28% (395) said they sometimes request one. Just 24% (333) reported that they never request a seed tag when purchasing cover crop seed.
Planting Green
The practice of “planting green”—seeding a cash crop into a living cover crop—can multiply the benefits of cover crops by maximizing the cover crop growth period and sustaining soil biota such as mycorrhizal fungi with overlapping plant life cycles. Planting green also allows the cover crop to maintain suppression of weeds until after the cash crop has emerged.
When planting green, farmers normally wait to terminate the cover crop until after planting the cash crop. Sometimes termination is done later the same day, or it may be done in the subsequent few days, normally before the cash crop has emerged from the soil.
For the first time, the SARE/CTIC survey explored the prevalence of planting green. Of 1,412 respondents, a surprising 39% (549) said they had employed the practice; 61% (863) had not.
26

When asked to identify the most important benefits of the practice, the largest number of respondents (157 of 536) selected the statement “It allows me to get the most out of my cover crops.” Weed control was the second most popular answer with 102 responses, followed by more surface biomass (94), moisture management (55), and ease of cash crop establishment and nutrient management at 20 each. Eighty-eight respondents selected “Other,” naming reasons such as failure to terminate the cover crop before they had to plant—due to weather, herbicide problems or running out of time—grazing cattle, and “all of the above” as their primary motivation for planting green.
Among the write-in commentary about planting green, some reflected negative experiences, typically from growers who ended up planting green involuntarily, presumably due to rainy conditions during planting. Those with involuntary experiences planting green often stated that they would not do it again. However, many of the voluntary users of the planting green strategy lauded the benefits of the practice. One wrote, “It makes the ground more mellow and holds my crop residue in place so that I can no-till corn without the material balling up in front of my planter,” while others liked chopping covers for silage or using mustards for their nematicidal properties before planting orchards.
Weed control appeared to be a significant benefit to survey participants. Sixty-one percent (322 of 526 respondents) said weed control improved where they planted green; 31% (163) said weed control was unchanged and just 8% (41) reported that weed control was more challenging under the system.
HAVE YOU EVER “PLANTED GREEN”?
WHAT IS YOUR PRIMARY MOTIVATION FOR “PLANTING GREEN”?
n=536
27

Most respondents believed planting green provided benefits with soil moisture at planting. Of 518 respondents, 62% (321) said the practice helps with soil moisture management, while 27% (142) said soil moisture is similar to when cover crops are terminated prior to planting, and just 11% (55) reported that planting green dries out the soil too often.
HOW HAS “PLANTING GREEN” IMPACTED WEED CONTROL?
HOW HAS “PLANTING GREEN” IMPACTED SOIL MOISTURE AT PLANTING?
28

Soybeans were the cash crop selected by 69% (369) of the 531 respondents to the question, “Prior to which of the following crops have you ‘planted green’?” Corn was second with 42% (222) of the farmers selecting it; wheat garnered 5% (26), sorghum 3% (17) and cotton 2% (8). Because respondents could select more than one crop option, the total exceeds 100%.
Fifteen percent (82) of the farmers planting green selected “Other” and listed a range of cash crops, primarily vegetable and horticultural ones. Other crops planted green into covers included orchards, pasture/grazing crops, rice, sugar beets and potatoes.
Opinions were mixed on whether planting green simplified or complicated cash crop management. Of 532 respondents to the multiple-choice question, “How has ‘planting green’ affected cash crop management?” 27% (143) selected the statement “management was simpler.” Another 21% (114) selected “Management is more difficult and I am evaluating whether the benefits outweigh the challenges,” while 19% (100) chose “Management was more difficult but benefits outweighed the challenges” and 9% (46) said management was more difficult and they were moving away from the practice.
PRIOR TO WHICH OF THE FOLLOWING CROPS HAVE YOU “PLANTED GREEN”?
HOW HAS PLANTING GREEN AFFECTED CASH CROP MANAGEMENT?
29

Interseeding Cover Crops
Inter-seeding cover crops into corn or other crops early in the summer is becoming an increasingly common practice. Whether flown on, broadcast or seeded with a high-clearance drill, inter-seeding of cover crops is intended to give the covers a head start on establishment during the growing season. That can allow farmers to employ cover crop species that are less suited to post-harvest planting, and to overlap the life cycles of the cash crop and cover crop to maintain healthier soils.
Inter-seeding cover crops can be challenging, though, from the act of seeding to establishing good stands to getting cover crops to persist for a few months beneath the canopy of a growing cash crop. Choosing the right species of covers, selecting an appropriate seeding rate, and distributing the seed as well as possible are paramount.
In practice, these inter-seeded cover crops usually emerge under the cash crop canopy but do not grow more than a few inches tall until the cash crop dies later in the season. After the harvest of the cash crop, the understory cover crop can resume its growth before winter conditions occur.
The popularity of inter-seeding is small but significant. Asked whether they ever tried inter-seeding cover crops into standing corn, 13% (188) of 1,403 respondents said “yes,” while 87% (1,215) said they had not.
HAVE YOU TRIED INTERSEEDING COVER CROPSINTO STANDING CORN?
30

Among 172 cover crop users who reported that they inter-seeded their cover crops, annual ryegrass was the most popular species used in the practice, with 32% (55 respondents) naming it as the best cover crop choice for inter-seeding. Cereal rye garnered 19% (32), followed by clover at 14% (24), radish at 10% (18). Twenty-five percent (43) of the respondents chose “other,” noting that they planted a range of species including vetch, turnips, soybeans and others.
Stand establishment is a challenge for a significant number of farmers who inter-seed cover crops, but 61% of the 179 farmers who answered a question on the early progress of inter-seeded stands in corn reported that their initial stands of cover crops inter-seeded into corn were average (13%), fair (16%) or good (32%). Eighteen percent characterized their initial stands as below average and 21% said they were poor.
BEST COVER CROP SPECIES CHOICE FOR INTER-SEEDING
INITIAL COVER CROP STAND WHEN INTER-SEEDING
n=172
31

Later in the season, stands slipped a bit, with 56% of 179 respondents characterizing their stands at cash crop harvest as good (27%), fair (12%) or average (17%), while 21% called them below average and 23% said they were poor.
The impact on cash crops of an inter-seeded cover crop is largely seen as positive or neutral—61% of the 179 farmers who answered a question on their stands of corn after inter-seeding covers reported average (13%), fair (16%) or good (32%) stands. Eighteen percent characterized their initial stands as below average and 21% said they were poor.
Farmers reported seeing some inter-seeding among neighbors and peers, with 10% of 176 respondents strongly agreeing with the statement “I have seen more of my neighbors and peers inter-seeding cover crops,” 22% agreeing, 30% neutral, 22% disagreeing and 16% strongly disagreeing.
It is exciting to note that interest in the practice is relatively high. Of 179 respondents, 51% (92) strongly agreed with the line “I am interested in learning more about inter-seeding cover crops” and an additional 33% (59) agreed. Just 10% (18) were neutral, disagreed (4% or 8 farmers) or strongly disagreed (1%, or 2 individuals). That shows great promise for future adoption of inter-seeding, and highlights a need for technical help and information explaining the uses and benefits of the practice.
n=179
STANDS OF INTER-SEEDED COVER CROPS AT CASH CROP HARVEST
INTER-SEEDING COVER CROPS
32

Cover Crops and Crop Insurance
This year’s survey included questions exploring the impact of crop insurance rules and actions on the adoption of cover crops, including the use of inter-seeding.
In general, cover crops have become more widely accepted by crop insurance agents. Among 1,106 cover crop users who answered the question, 82% (908) selected the statement “My insurance agent is OK with me using cover crops.” Three percent (31) said their insurance agent was resistant to their use of cover crops at first but has changed his or her position, and 4% (40) stated that their insurance agent continues to be resistant to their use of cover crops.
However, perceptions of insurance trouble continue to occur within the farming community—11% (127) respondents agreed with the statement, “It is my perception that there are farmers in my area having problems with insurance and cover crops.”
The survey dug more deeply into what respondents have experienced or what they perceive in the field about confusion surrounding cover crops and crop insurance. Among farmers who selected a statement from a group of options on the topic, 70% (848 of 1,160) said they had not heard of anyone having problems with crop insurance rules while using cover crops. Eighteen percent (212) selected, “It is my perception that there are other farmers in my area who do not use cover crops because of potential problems with crop insurance, while 9% (108) said they no longer use crop insurance or have considered dropping it, and 3% (37) perceived that other farmers have foregone crop insurance because of cover crop rules.
COVER CROPS AND CROP INSURANCE
33

COVER CROPS AND INSURANCE CHALLENGES
Asked about their experience with crop insurance and inter-seeding cover crops, responses were almost equal among three of the four possible answer options—acceptance of inter-seeding by the crop insurance agent (32%, or 56 of 176 farmers), the agent being unaware that the farmer is inter-seeding (31%, or 55 respondents), or that the grower does not use crop insurance (31%, or 54 answers). Eleven growers (6%) say their crop insurance agent has questioned their use of inter-seeded cover crops.
CROP INSURANCE AND INTER-SEEDING COVER CROPS
34

Cover Crops and Yield
Consistent with past years’ SARE/CTIC cover crop surveys, farmer-reported yield data revealed a yield increase on land where cover crops had been implemented. This was true for corn, soybeans, and wheat, the three crops for which sufficient data was provided to conduct an analysis. The analysis was conducted by Marieke Fenton at Purdue University under the guidance of Dr. Wallace Tyner.
Yield data for 2016 was provided for 1,365 sets of acreage that were similar in soils, management, crop variety planted and planting date.
As in past years’ surveys, the top and bottom one percent of data were omitted to increase reliability of data and minimize the possibility that results are effected by outliers. This resulted in 586 paired field observations for corn yield, 552 paired field observations for soybean yield, and 192 paired field observations for wheat yield. It is important to note that yields are reported online by farmers in the survey, rather than randomly gathered, which may introduce selection bias, when farmers with more positive or more negative results may choose to report at higher frequencies.
Corn Yields
For corn, a statistically significant mean yield increase of 2.3 bushels per acre in 2016 was observed for fields on which cover crops had been planted in 2015. This represents an increase of 1.3% over the non-cover cropped mean reported yield of 175.4, for a mean of 177.7 bushels per acre.
Soybean Yields
Respondents reported a mean soybean yield increase of 2.1 bushels per acre for the 2016 season for acreage on which cover crops had been established in 2015. This was an increase of 3.8%, from 55.1 to 57.2 bushels per acre. As in past years, this difference is statistically significant.
Wheat Yields
This year, there were sufficient responses on wheat yield to run an analysis on the reported yield difference. The 2016 harvest results show an increase of 1.9 bushels per acre where cover crops were used, which again is statistically significant. This is an increase of 2.8%, from 67.6 to 69.6 bushels per acre.
CROP YIELDS INCREASED FOLLOWING COVER CROPS
35

State Yield Data
In addition to the nationwide trends, yield results were analyzed for individual states in the Midwest (Illinois, Indiana, Iowa, Kansas, Michigan, Minnesota, Missouri, Nebraska, North Dakota, Ohio, South Dakota and Wisconsin). In most cases, the reported change in yield for fields on which cover crops had been used was positive. However, in a few cases the mean change in yield was negative—most notably for wheat in North Dakota and for corn in Nebraska.
Due to small sample sizes, the majority of these values are not statistically significant. Exceptions where the difference in mean reported yield between non-cover cropped acreages and cover cropped acreages are statistically significant are the mean yield increase for corn in Minnesota and the mean yield increase for soybeans in Illinois, Indiana, Iowa, Kansas, Michigan, Minnesota, Missouri, Nebraska, North Dakota and Ohio.
STATE CORN YIELDS WITH AND WITHOUT COVER CROPS
36

STATE SOYBEAN YIELDS WITH AND WITHOUT COVER CROPS
STATE WHEAT YIELDS WITH AND WITHOUT COVER CROPS
37

NON-USERS OF COVER CROPSThough in the minority in this year’s survey, non-users of cover crops provided important perspective on the barriers to trying or sustaining the practice, and opportunities for inspiring or aiding in overcoming those barriers. In all, 12% of the survey’s respondents—241 farmers—were directed into the non-user track of the online questionnaire.
Non-users in the survey covered the range of farm sizes. In fact, in terms of farmed acreage, the distribution of non-users was quite similar to that of cover crop users.
The largest proportion, 25% (46 of 183 respondents) farmed 500 to 999 acres; they were almost evenly flanked by 19% (34) farming 180 to 499 acres and 18% (33) farming 1,000 to 1,999 acres. The largest (2,000-plus acres) and smallest (1 to 9 acres) farm-size categories were each represented by 13% (24 and 23 farmers, respectively) of the non-users. Four percent of the non-users farmed 10 to 49 acres and 9% (16) farmed 50 to 179 acres.
Anecdotal evidence suggests that some farmers are hesitant to employ conservation practices, including cover crops, on rented land—either because landowners do not understand or want those practices on their ground or because the renters are hesitant to invest in long-term benefits on land they do not own.
The 2016-2017 survey included a question on owned versus leased land to see if use of cover crops correlated with land ownership.
NON-USER RESPONDENTS’ FARM SIZE
38

Of the 183 respondents who answered the question, 26% (47) owned all the land they farm, 23% (42) owned 26 to 50% of their farmed land, and 20% owned 1 to 25% of the land they managed. In short, there did not seem to be a strong connection between land ownership and non-use of cover crops.
A follow-up question asked non-users to indicate their agreement with the statement, “It does not make sense for me to use cover crops on land I rent.” Nearly half—46%, or 84 farmers of the 180 who answered this question—were neutral on the statement. Fourteen percent (25) strongly agreed and 15% (27) agreed, which slightly outnumbered the 17% (30) who disagreed and 8% (14) who strongly disagreed. That, as well as the data from the previous question, indicates that many non-users could be convinced to try cover crops even on rented land.
The survey also asked about non-users’ tillage practices. In all, non-user respondents to the survey were much less likely to be continuous no-tillers (18% of non-users vs. 41% of cover crop users). More than twice as many non-users employed conventional tillage compared to cover crop users (32% of non-users reported using conventional tillage vs. 14% of users).
Interestingly, the rates of rotational no-till, reduced tillage and vertical tillage were quite similar between the two groups.
HOW MUCH OF YOUR FARM DO YOU OWN VS LEASE?
IT DOES NOT MAKE SENSE FOR ME TO USE COVER CROPS ON LAND I RENT
39

Concerns About Cover Crops
Understanding non-users’ concerns about cover crops is key to helping minimize barriers to entry.
Asked to rate their level of concern about various cover crop issues as major, minor or not a concern, interesting patterns emerged.
The top three major concerns among non-users included time/labor (116 of 180 respondents, or 64%), fear that there would be a lack of economic return (54%, or 98 farmers), and worries that cover crops could become a weed (51%, or 91 growers).
Other significant concerns included production risk increases, getting a good cover crop stand, the fear of yield reduction, and the challenges of selecting the right species of cover crops.
TILLAGE PRACTICES OF NON COVER CROP USERS
NON-USER CONCERNS WITH USING COVER CROPS
40

When asked specifically about weed control concerns, 14% (25 of 182 respondents) strongly agreed and 28% (51) agreed with the statement, “Concern about the spread of resistant weeds keeps me from using cover crops,” while 34% (63) were neutral, 19% (34) disagreed and 5% (9) strongly disagreed.
Crop insurance concerns, discussed earlier in this report, had a dissuasive effect on about one-third of the non-users who shared their level of agreement to the statement, “The crop insurance rules make me nervous about trying cover crops.” Eleven percent (20) of 179 non-users strongly agreed and 23% (42) agreed, while 52% (93) were neutral. Few took issue with the statement—9% (16) disagreed and 5% (8) strongly disagreed.
CONCERN ABOUT THE SPREAD OF RESISTANT WEEDSKEEPS ME FROM USING COVER CROPS
THE CROP INSURANCE RULES MAKE ME NERVOUS ABOUT TRYING COVER CROPS
5%11%
9%
23%
52%
41

It is interesting to see that non-users’ willingness to consider cover crops when commodity prices are good was almost the same as that of users, with 12% (21 of 176 respondents) strongly agreeing with the statement, “When crop prices increase, I am more likely to consider using cover crops,” 26% (46) agreeing and 43% (76) remaining neutral (vs. 12%, 26% and 43%, respectively, among users). Just 13% (23) of non-users disagreed with the statement, and 6% (10) strongly disagreed.
However, when commodity prices are low—as they were in 2016 and early 2017—non-users were more likely than users to strongly agree or agree with the statement, “When commodity prices fall, I am less likely to consider using cover crops.” In this year’s survey, 14% (26) of the non-users strongly agreed (vs. 4% of cover crop users) and 26% (45) agreed (compared to 14% of the users). Thirty-nine percent of non-users were neutral on the statement (less than the 49% of users), while 15% (27) disagreed and 4% strongly disagreed (compared to 22% and 11% of the users, respectively).
The data indicate that a return to good cash crop prices could inspire non-users to consider cover crops, but continued bear markets reduce the rate of change for non-users to become users.
INFLUENCE OF CROP PRICE ON COVER CROP USENON-USERS
42

Hunger For Knowledge
It is important to note that even among non-users of cover crops, the idea of employing them is widely considered. Non-users were asked whether they had ever considered trying cover crops on their farm; 82% (150 of 182 respondents) said “yes,” while just 18% (32) said they had not considered them.
Interest in cover crops among non-users is quite high—38% (70 of 182 respondents) strongly agreed with the statement, “I am interested in learning more about how cover crops can benefit my farm,” while 36% (65) agreed, 20% (36) were neutral, 4% (7) disagreed and only 2% (4) strongly disagreed.
Of course, selection bias is likely to have played a role in these results—after all, the respondents all voluntarily followed links to a survey on cover crops and took the time to fill it out, reflecting at least some interest in the topic. Even in light of that bias, the answers to this question present a heartening look at the possibility of engaging non-users with information on cover crops.
HAVE YOU EVER CONSIDERED TRYING COVER CROPS ON YOUR FARM?
n=182
I AM INTERESTED IN LEARNING MORE ABOUT HOWCOVER CROPS CAN BENEFIT MY FARM
43

Another approach to assessing non-users’ receptivity to information was asking for respondents’ level of agreement with the statement, “If I better understood how cover crops would benefit my farm, I would be more likely to use them.” Answers were overwhelmingly positive—30% (55) of the 181 farmers responding to the statement strongly agreed, and 39% more (71) agreed, a total of more than two-thirds of the sample. Twenty-four percent (43) were neutral, 3% (5) disagreed and 4% (7) strongly disagreed.
One of the traditional means of learning about a farming practice is from observing and talking with neighboring growers. That pathway is quite open to the non-users in this survey, nearly half of whom reported seeing more peers and neighbors using cover crops—9% (16 of 180 farmers) strongly agreed, 39% (70), agreed, 27% (49) were neutral. Nineteen percent (35) disagreed and 6% (10) strongly disagreed.
IF I BETTER UNDERSTOOD HOW COVER CROPS WOULD BENEFIT MY FARM, I WOULD BE MORE LIKELY TO USE THEM
n=181
I HAVE SEEN MORE OF MY PEERS AND NEIGHBORSUSING COVER CROPS
44

Factors That Influence Adoption
Non-users’ desire to learn more about cover crops was reflected strongly in a follow-up question. The 2016-2017 survey presented 178 respondents with eight statements about factors that influence their decision on whether to plant cover crops, and asked them to indicate their level of agreement with each statement.
Cost share or incentives received the most positive associations, with 53% (95) of the non-users selecting “very helpful” and 26% (46) indicating that they would be “moderately helpful. That makes cost share/incentives the leader in both “very helpful” ratings as well as the number-one in aggregated positive responses, with a total of 79%.
Close behind, with an aggregate positive score of 74%, was a desire for free technical assistance. That was rated “very helpful” by 43% (76) and “moderately helpful” by 31% (55) respondents. (In contrast, paid technical assistance received the lowest combined positive score, with 38%—17% (30) called it very helpful and 21% (37) said it would be moderately helpful.)
More information on cover crop species, which garnered 46% (74) ratings of very helpful and 35% (62) moderately helpful votes. The same number of respondents (46%, or 74 farmers) rated local field demo plots with cover crops to be very helpful, while 30% (53) called the idea of local plots moderately helpful.
Nearly as positive was “more knowledge of cover crop benefits,” with 40% (71) respondents rating it very helpful and 33% (59) calling it moderately helpful. Tax credits and discounted insurance premiums received lower positive scores, highlighting the fact that, aside from the preference for cost share or incentives, the other high-ranked factors were all about information.
FACTORS THAT INFLUENCE COVER CROP DECISIONS
n=178
45

CONCLUSIONEnthusiasm for cover crops remained high in 2016-2017, despite farmers’ suffering through several years of low commodity prices and some widely publicized concerns over crop insurance rules for cover crops. Cover crop acreage continued to climb among respondents, while strong belief in the benefits of cover crops from soil health to yield benefits to helping control herbicide-resistant weeds—remained high, and concerns were few.
Non-users of cover crops participating in the survey reported high interest in cover crops, and expressed concerns that could largely be addressed with more information on cover crop species and practices. Boosted by cost share or other economic incentives, it is likely that many non-users could be convinced to try cover crops, particularly as commodity prices recover and more education and training are provided.
Guided by the insights of farmers across the country in this survey and the four that preceded it, SARE and CTIC hope to shed light into the programs and practices that can aid in the success of users of cover crops and inspire non-users to adopt the strategy.
Citation:CTIC. 2017. Report of the 2016-17 National Cover Crop Survey. Joint publication of the Conservation Technology Information Center, the North Central Region Sustainable Agriculture Research and Education Program, and the American Seed Trade Association. West Lafayette, IN.
46