cover: award-winning artist stephanie dalton cowan created
TRANSCRIPT

1

COVER: Award-winning artist Stephanie Dalton Cowan created this design using shapes, lines, and colors that convey the Annual Report’s theme of American Innovation. Arched lines, dots, and intricate geometric patterns represent American University’s broad spectrum of arts and sciences, suggesting movement and progress, while circular windows reveal AU’s infrastructural and technological advances.
2 FROM THE CHAIR OF THE BOARD OF TRUSTEES
3 FROM THE PRESIDENT
4 AMERICAN INNOVATION
30 UNIVERSITY ADMINISTRATION
30 BOARD OF TRUSTEES
31 FINANCIAL STATEMENTS 2014–2015
33 FROM THE CFO, VICE PRESIDENT AND TREASURER
34 INDEPENDENT AUDITOR’S REPORT
35 CONSOLIDATED BALANCE SHEETS
36 CONSOLIDATED STATEMENTS OF ACTIVITIES
38 CONSOLIDATED STATEMENTS OF CASH FLOWS
39 CONSOLIDATED NOTES TO FINANCIAL STATEMENTS
2
FROM THE CHAIR OF THE BOARD OF TRUSTEESOur strategic plan, American University and the Next Decade: Leadership
for a Changing World, calls for us to align our facilities planning with our transformational goals. As we aspire to be an international leader in higher education, it is vital to provide our students, faculty, and staff with the world-class facilities they need to succeed.
Our campus plan, drafted in 2011, has provided a roadmap for unprecedented changes to American University’s landscape. Through the tireless work of the entire campus community, sound fiscal management, and significant support from our alumni donors, we have been able to effectively implement the plan and meet our ambitious goals.
We have already celebrated the renovation of McKinley Hall, home of the School of Communication; opening of 4401 Connecticut Avenue, home to WAMU 88.5, University Communications and Marketing, and the Office of Development and Alumni Relations; and completion of the Nebraska and Cassell Hall residential buildings. Each of these new facilities was met with resounding approval.
Now, we look forward to completion of the Washington College of Law’s Tenley Campus and the East Campus, which will include three residence halls and the Don Myers Technology and Innovation Building, all opening in 2016. Together, these expansions will add more than 675,000 square feet to our campus. These changes reflect AU’s history of excellence and our commitment to promote growth, progress, and innovation.
I encourage you to keep that idea in mind as you read through this report, and I look forward to continued success.
Sincerely,
Jack C. Cassell

3
FROM THE PRESIDENTIn an increasingly competitive world, it is crucial that American
University students gain the knowledge and skills necessary to excel and that we provide our faculty with the resources to educate students and conduct groundbreaking research.
AU has a strong legacy of scholarship and service, and we can point to several results that demonstrate our success in the past year:
• Nearly 90 percent of students participated in an internship before leaving AU.
• Among recent graduates, 90 percent are employed, pursuing graduate school, or both.
• For the fourth consecutive year, more than 100 students and alumni received national recognition as recipients, alternates, and finalists for scholarships, including Fulbright Scholarships, Boren Scholarships and Fellowships, Udall Scholarships, Truman Scholarships, and other prestigious awards.
To continue attracting the brightest minds to our campus, we have employed two new tools: the We KNOW Success website, which highlights successes of recent AU graduates, and the Reinventing the Student Experience (RiSE) initiative, which will develop and implement innovative student support structures.
Throughout this annual report, you will read about the outstanding accomplishments of students, faculty members, and alumni. These stories represent a small sample of the remarkable individuals who have made AU the consummate institution that it is today.
It is with tremendous confidence and pride that we can look ahead to a strong and bright future for AU.
Sincerely,
Cornelius M. Kerwin

4

5
INNOVATION happens every day at American University. In fact, we cultivate an ecology of innovation that drives developments in the classroom, in the boardroom, and beyond.
INNOVATION is powered by an infrastructure that ensures success, from the budgets we set to the facilities we build. It means we anticipate the needs of our university, nation, and world.
INNOVATION demands action-oriented research and the passionate pursuit of discovery. It must be interdisciplinary, because problems do not confine themselves to individual theoretical frameworks.
INNOVATION requires agility, ingenuity, and an eagerness to embark into unknown territory.
In all of these respects, AU students, faculty, leaders, and alumni exemplified innovation this year. We worked to improve our institution and our society, and those efforts contributed to our enduring prosperity.
At AU, innovation is more than an idea. It is tangible, with the power to shape the world in new and vital ways. You will find it permeating our campus culture, our people, and the decisions that determine our direction for years to come. And you will find plenty of innovation in action in the following pages.

6
More than 4,000 visitors participated in the Pop-Up Video Game Arcade, hosted by AU and partners at the Smithsonian American Art Museum.

7
GAMING FOR GOOD: PERSUASIVE PLAY LEADS TO WINS FOR ALL
T he master’s in game design is one of American University’s newest programs, but its students and faculty already have achieved an impressive list of accomplishments, among them the Princeton Review ranking the program number 21 worldwide.
“For a program that is less than one year old, this is major recognition and an affirmation of what we are doing here,” says Game Lab Director Lindsay Grace.
In a short 12 months, the program participated in the White House Educational Game Jam, hosted events with partners such as the Smithsonian and International Game Developers Association, and launched the Journalism Leadership Transformation (JoLT) initiative in game design and disruptive media leadership through a $250,000 grant from the John S. and James L. Knight Foundation.
The program is a collaboration of the School of Communication (SOC) and the College of Arts and Sciences (CAS). Multidisciplinary by design, it serves as a hub of experiential education and research in persuasive play.
“Games are a universal experience shared across cultures,” says Mike Treanor, a computer science professor who helped create the program. “We can use them to help understand and express opinions about the workings of the world we live in.”
Game design study meets a growing demand for more evolved interactivity and reflects the increasing use of games in nongame contexts. Treanor, computer science professor Josh McCoy, and game designer in residence Chris Totten joined developers and designers from the likes of Disney, Sony, Ubisoft, and others at the White House to develop prototypes for educational video games for children. Their math game, Function Force Four, was featured in USA Today.
The program is also a perfect fit for AU students’ commitment to social responsibility. Students learn to transform players’ interests and opinions into meaningful action and creative problem solving. Promoting the concept of
persuasive play for social good, AU hosted the second annual Games for Good, Games for All: Launching Your Career in Games and Gaming. The summit, focused on the need for greater diversity in game development, serves change-minded individuals seeking to enter the industry. AU also cohosted the 2015 Global Game Jam, in which professionals and amateurs team up to create games over a single weekend.
AU and several partners presented the Pop-Up Video Game Arcade at the Smithsonian American Art Museum. More than 4,000 visitors learned about game making and enjoyed plenty of play, including social impact games designed to change players’ thinking about topics ranging from immigration to native Alaskan culture.
“They experienced games that experiment with emotion, affection, storytelling, history, politics, and more,” says Grace, who’s eager to create future events that are even more successful than the initial arcade.
That drive to innovate and improve spurred SOC and CAS to create the JoLT initiative, which represents new forms of engagement in journalism and media through cutting-edge game design theory. The first JoLT Summit gathered participants from media, business, and academia to explore how user-centric and iterative game design thinking can help newsroom leaders.
“I am blown away by how crisply game designers think,” says JoLT facilitator Amy Eisman, who directs the master’s in media entrepreneurship program. “They don’t see limitations; they see problems to solve. Their approach is very refreshing—and very relevant.”
EAST CAMPUS HOME TO CENTERS FOR INNOVATION, TECHThe East Campus, which will open in summer 2016, has interdisciplinary collaboration built into its very design.
THE 65,000-SQUARE-FOOT DON MYERS TECHNOLOGY AND INNOVATION BUILDING WILL HOUSE LABS FROM DIVERSE DISCIPLINES; lecture, seminar, and meeting areas; and a space that can accommodate more than 100 individuals partnering on projects. A Computer Gaming Suite will serve students in the game design program, while the Kogod Entrepreneurship Incubator will provide an innovation lab. East Campus also will include three new residence halls.
8
DATA-DRIVEN: PURSUING THE POWER OF INFORMATION
With each passing second, we live in a more data-saturated world. The proliferation of information holds tantalizing potential to change lives. But it also challenges our abilities to manage and analyze the torrent of data for actionable insights, from improving aid to developing nations to
analyzing political opinion. At American University, diverse schools, programs, and scholars are stepping up to this challenge, advancing the uses of data to reveal surprising conclusions, predict trends, and guide effective action.
Economics professor Paul Winters puts his data research to work in developing countries to help answer vital and vexing questions: What kind of help best benefits the poor? Is it more effective to donate cash or food? How can nations prevent crop losses and improve food security?
“Countries spend a lot of time and money on economic development and oftentimes don’t know if what they did worked,” Winters says. His pioneering uses of data to evaluate the efficacy of aid and development programs can help inform policies with worldwide impact.
Naturally, the more quickly researchers can draw insights from data, the better. Real-time collection and evaluation of data represent the frontier of data science. Mathematics and statistics professor Michael Baron is a leader in this field. He specializes in sequential analysis, which often leads to conclusions at an earlier stage—and at a lower cost—than is possible with traditional techniques.
For example, by optimizing clinical trials, Baron’s work can reduce their cost, which in turn can reduce the cost of medicines. Baron also develops new statistical methods to better target terrorist threats, spot emerging epidemics, and assess product quality for businesses.
“I’m always satisfied when I can prove a result or derive a new method—something that people can actually implement and use,” Baron says. “It feels like a discovery.”
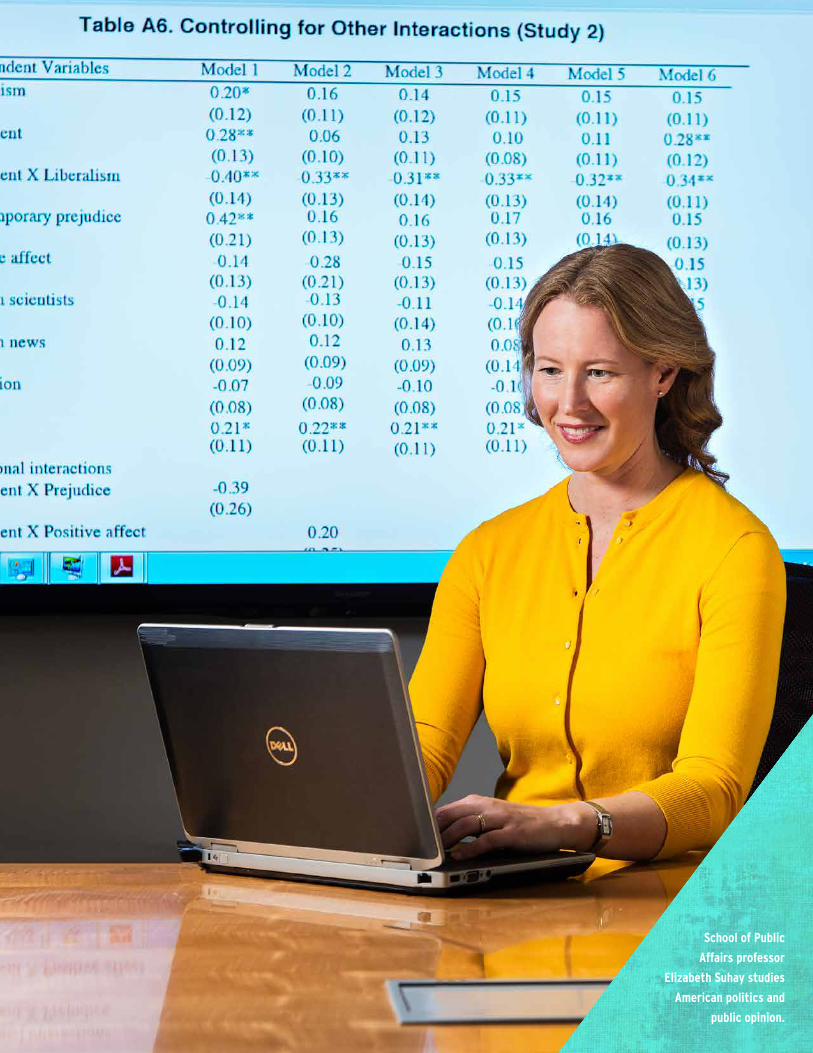
Of course, data can be misused or misinterpreted as well. For example, School of Public Affairs
professor Elizabeth Suhay researches the problem of cherry-picking data in partisan political battles.
Recent scholarship shows that the left and the right in the United States are growing further apart and partisanship is more pronounced. Thus, activists are motivated to get science on their side because it is a way to back up their policy beliefs.
“Now, more than ever, they feel that it’s very important to get their policies implemented and have the other side’s policies shut down,” Suhay says.
Many other AU scholars from a variety of disciplines have been busily exploring data applications and implications that can guide wiser action on pressing issues, from health care spending to the measurement of crime. As data continues to play a growing role in our lives, the university’s forward-looking stance on harnessing its power could yield exponential dividends for years to come.
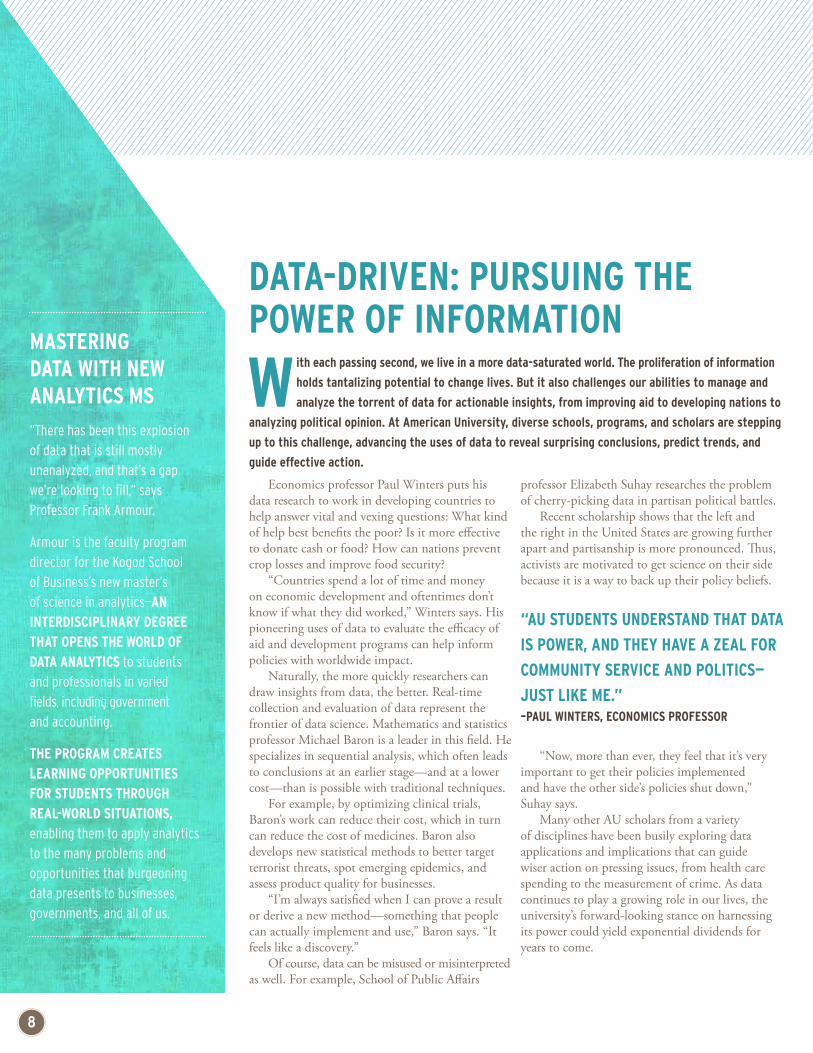
MASTERING DATA WITH NEW ANALYTICS MS “There has been this explosion of data that is still mostly unanalyzed, and that’s a gap we’re looking to fill,” says Professor Frank Armour.
Armour is the faculty program director for the Kogod School of Business’s new master’s of science in analytics—AN INTERDISCIPLINARY DEGREE THAT OPENS THE WORLD OF DATA ANALYTICS to students and professionals in varied fields, including government and accounting.
THE PROGRAM CREATES LEARNING OPPORTUNITIES FOR STUDENTS THROUGH REAL-WORLD SITUATIONS, enabling them to apply analytics to the many problems and opportunities that burgeoning data presents to businesses, governments, and all of us.
“AU STUDENTS UNDERSTAND THAT DATA IS POWER, AND THEY HAVE A ZEAL FOR COMMUNITY SERVICE AND POLITICS—JUST LIKE ME.”–PAUL WINTERS, ECONOMICS PROFESSOR
9
School of Public Affairs professor
Elizabeth Suhay studies American politics and
public opinion.

10
AA2 2222 222
2A
AA3X
3
333
3CC
@C
C 3 AB A
A
YC B
BB# #
#
==
==
=2 222222 A333
3C 3AB
AC =
90% employed or going to graduate school 85% hold jobs related to their degree 52% enrolled in or accepted to graduate school
WE KNOW SUCCESS WEBSITE
The interactive We KNOW Success website delivers data about AU graduates’ employment outcomes.

11
REACHING OUT: NEW INITIATIVES MEET EVOLVING STUDENT NEEDS
With a US college education now a major investment, undergraduate and graduate students are selective when it comes to choosing a school. Often, one of their biggest questions is how well alumni perform in the job market.
American University has developed several initiatives that respond to this concern and strengthen AU’s position in a competitive market: a new modular master’s degree, the data-driven website We KNOW Success: Where AU Grads Land, and RiSE (Reinventing the Student Experience), an in-depth initiative to deliver the best student support.
The modular master’s program, housed in the School of Professional and Extended Studies (SPExS), will launch in spring 2016. Based on research that identified skills gaps in the market, these customizable degrees will equip students with in-demand skill sets. Tracks will pair two areas of expertise, such as strategic communication and business analytics, nutrition education and biostatistics, and digital media and economic analysis, among others.
We KNOW Success (american.edu/weknowsuccess) demonstrates the value of an AU degree through interactive data on alumni outcomes, six months post-graduation. The site is a collaboration among the Office of Information Technology, Office of Institutional Research and Assessment, Career Center, and University Communications and Marketing.
We KNOW Success “fits an existing need in the broader community of people who are considering attending universities like ours,” says Gihan Fernando, executive director of AU’s Career Center. “It allows us to showcase some of the terrific successes that we’ve had over the years.”
The interactive site provides snapshots of information about recent graduates’ employment by school, major, and degree; salary ranges; internships and study abroad experiences; and profiles of successful alumni and outstanding
faculty mentors. As more universities deploy similar sites, the comprehensiveness and transparency of We KNOW Success continue to stand out. Ohio State University, the US State Department Fulbright Program, and others have expressed interest in adopting similar models.
When students do choose AU for their undergraduate degree, the university wants to ensure they feel supported and engaged. This support is critical as the student body becomes more diverse. Accordingly, AU this year launched RiSE with funding from the Andrew W. Mellon Foundation.
AU provost and RiSE Leadership Steering Committee member Scott Bass points to a growing gap between contemporary students’ desire for integrated services and the conventional model of higher education infrastructure.
“The RiSE project is an opportunity for AU to explore, with an open mind, the creation of an innovative model for student services,” Bass says. “As we look at best practices in a variety of industries and listen to our students and staff, we seek to create a structure that delivers high-quality services reflective of students’ needs while providing a rewarding work environment for the professionals who serve our students. Should AU be successful, a national model for student services, worthy of emulation, will be created.”
A RiSE Task Force is analyzing existing student services with an eye toward developing a new model of support tailored for today’s students. This model will emphasize development of a service culture, innovative uses of technology, best practices from industries inside and outside higher education, and a variety of other means to maximize students’ success.
“THE RiSE PROJECT IS AN OPPORTUNITY FOR AU TO EXPLORE, WITH AN OPEN MIND, THE CREATION OF AN INNOVATIVE MODEL FOR STUDENT SERVICES.”–Provost Scott Bass
12
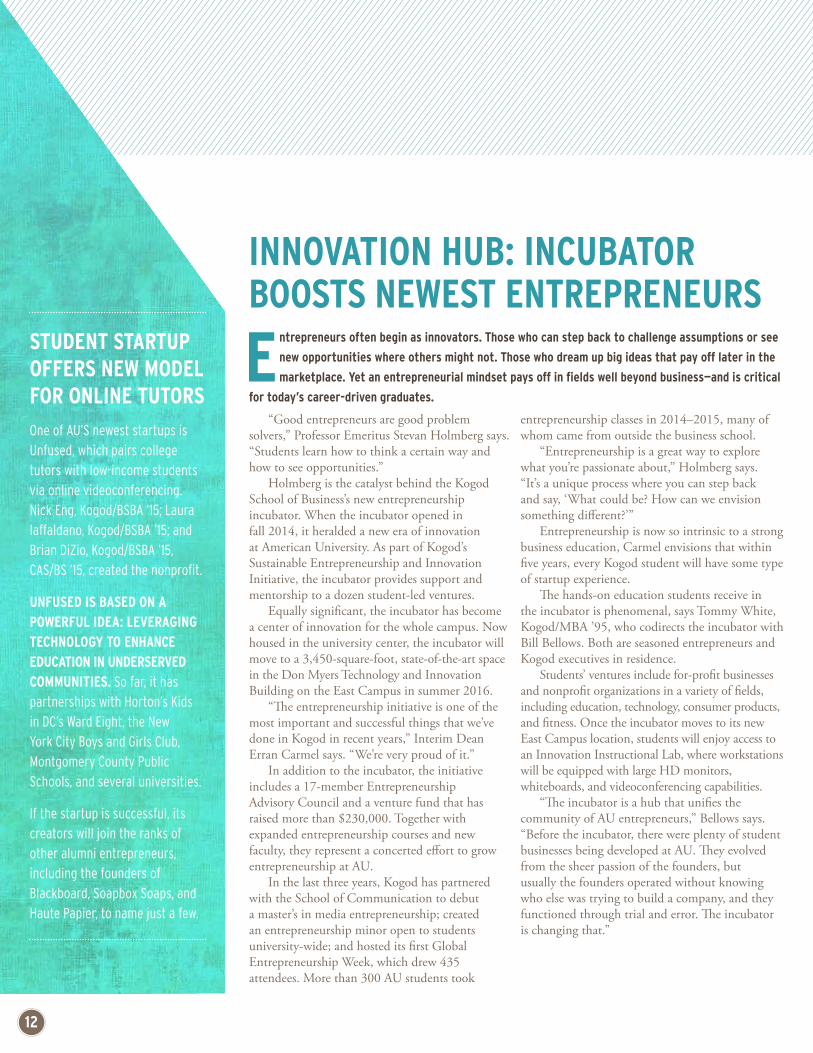
INNOVATION HUB: INCUBATOR BOOSTS NEWEST ENTREPRENEURS
Entrepreneurs often begin as innovators. Those who can step back to challenge assumptions or see new opportunities where others might not. Those who dream up big ideas that pay off later in the marketplace. Yet an entrepreneurial mindset pays off in fields well beyond business—and is critical
for today’s career-driven graduates.
“Good entrepreneurs are good problem solvers,” Professor Emeritus Stevan Holmberg says. “Students learn how to think a certain way and how to see opportunities.”
Holmberg is the catalyst behind the Kogod School of Business’s new entrepreneurship incubator. When the incubator opened in fall 2014, it heralded a new era of innovation at American University. As part of Kogod’s Sustainable Entrepreneurship and Innovation Initiative, the incubator provides support and mentorship to a dozen student-led ventures.
Equally significant, the incubator has become a center of innovation for the whole campus. Now housed in the university center, the incubator will move to a 3,450-square-foot, state-of-the-art space in the Don Myers Technology and Innovation Building on the East Campus in summer 2016.
“The entrepreneurship initiative is one of the most important and successful things that we’ve done in Kogod in recent years,” Interim Dean Erran Carmel says. “We’re very proud of it.”
In addition to the incubator, the initiative includes a 17-member Entrepreneurship Advisory Council and a venture fund that has raised more than $230,000. Together with expanded entrepreneurship courses and new faculty, they represent a concerted effort to grow entrepreneurship at AU.
In the last three years, Kogod has partnered with the School of Communication to debut a master’s in media entrepreneurship; created an entrepreneurship minor open to students university-wide; and hosted its first Global Entrepreneurship Week, which drew 435 attendees. More than 300 AU students took
entrepreneurship classes in 2014–2015, many of whom came from outside the business school.
“Entrepreneurship is a great way to explore what you’re passionate about,” Holmberg says. “It’s a unique process where you can step back and say, ‘What could be? How can we envision something different?’”
Entrepreneurship is now so intrinsic to a strong business education, Carmel envisions that within five years, every Kogod student will have some type of startup experience.
The hands-on education students receive in the incubator is phenomenal, says Tommy White, Kogod/MBA ’95, who codirects the incubator with Bill Bellows. Both are seasoned entrepreneurs and Kogod executives in residence.
Students’ ventures include for-profit businesses and nonprofit organizations in a variety of fields, including education, technology, consumer products, and fitness. Once the incubator moves to its new East Campus location, students will enjoy access to an Innovation Instructional Lab, where workstations will be equipped with large HD monitors, whiteboards, and videoconferencing capabilities.
“The incubator is a hub that unifies the community of AU entrepreneurs,” Bellows says. “Before the incubator, there were plenty of student businesses being developed at AU. They evolved from the sheer passion of the founders, but usually the founders operated without knowing who else was trying to build a company, and they functioned through trial and error. The incubator is changing that.”
STUDENT STARTUP OFFERS NEW MODEL FOR ONLINE TUTORS One of AU’S newest startups is Unfused, which pairs college tutors with low-income students via online videoconferencing. Nick Eng, Kogod/BSBA ’15; Laura Iaffaldano, Kogod/BSBA ’15; and Brian DiZio, Kogod/BSBA ’15, CAS/BS ’15, created the nonprofit.
UNFUSED IS BASED ON A POWERFUL IDEA: LEVERAGING TECHNOLOGY TO ENHANCE EDUCATION IN UNDERSERVED COMMUNITIES. So far, it has partnerships with Horton’s Kids in DC’s Ward Eight, the New York City Boys and Girls Club, Montgomery County Public Schools, and several universities.
If the startup is successful, its creators will join the ranks of other alumni entrepreneurs, including the founders of Blackboard, Soapbox Soaps, and Haute Papier, to name just a few.

13
Aviva Kamler, KSB/BS ’15,
right, founder of SHELF cosmetics app,
works with Amirah Keaton, SOC/BA ’18, left, and
Trish Robbins, SOC/BA ’15, center, in the Kogod Incubator.

OBAMA SPEAKS AT AU
ALUM TAKES TOP OFFICE
President Barack Obama’s foreign policy address at AU was both pragmatic and symbolic. Arguing for the wisdom of diplomacy over the risks of war, OBAMA MADE HIS CASE FOR THE PROPOSED JOINT COMPREHENSIVE PLAN OF ACTION THAT WOULD PREVENT IRAN FROM ACQUIRING A NUCLEAR WEAPON. The White House chose AU to host the address because it is where John F. Kennedy delivered his groundbreaking 1963 speech on nuclear disarmament and world peace.
WASHINGTON, DC, MAYOR MURIEL BOWSER, SPA/MPP ’00, SAID ONE OF HER MOST IMPORTANT JOBS IS TO HIRE GREAT PEOPLE, SET CLEAR GOALS, AND EXPECT ACCOUNTABILITY. She does so as the second woman to hold the mayor’s title in DC: “I don’t think any of us aspire to be the woman chief or the woman mayor or the woman schools chancellor, but I think it’s fitting for the nation’s capital to say that we are appointing and electing the most qualified people that share our values.”
14

15
OBAMA SPEAKS AT AU
ALUM TAKES TOP OFFICE CHEMISTRY LAB STANDS OUT
RUSSIA INSTITUTE EXPANDS
A new laboratory curriculum for chemistry and biochemistry majors is so unique, Professor Matt Hartings and colleagues published a paper about it in the Journal of Chemical Education. Science magazine recognized the paper as an Editor’s Choice selection. STUDENTS, SUCH AS THOSE IN EXPERIMENTAL BIOLOGICAL CHEMISTRY, TAKE OWNERSHIP OF RESEARCH PROJECTS AS JUNIORS AND SENIORS UNDER FACULTY GUIDANCE. As each class graduates, the next class continues the research and decision making, shaping the project year to year.
THE CARMEL INSTITUTE OF RUSSIAN CULTURE AND HISTORY, ESTABLISHED BY SUSAN CARMEL LEHRMAN, PROMISES A RICH ARRAY OF CLASSES, SYMPOSIA, AND OTHER OFFERINGS to expand AU’s cultural diplomacy and facilitate connections between Russians and Americans. From left: College of Arts and Sciences dean Peter Starr; Institute director Anton Fedyashin; Lehrman; Karen Shakhnazarov, director-general of Mosfilm Studios, director, producer, and screenwriter; and Eric Lohr, Susan Carmel Lehrman Chair in Russian History and Culture.

WCL CELEBRATES NEW HOMEWashington College of Law will have much to celebrate in 2016. For starters, Supreme Court Justice Ruth Bader Ginsburg will speak at the Tenley Campus ribbon-cutting. “With state-of-the-art facilities, expanded experiential learning initiatives, improved indoor and outdoor spaces, and a design that facilitates collaboration throughout, THE NEW CAMPUS WILL FURTHER DEEPEN OUR COMMITMENT TO EXCELLENCE IN TEACHING, SCHOLARSHIP, AND SERVICE,” Dean Claudio Grossman says. “At our new Tenley Campus, we are truly building a world of possibilities.”
NEW DEGREE FOR ENGINEERSAU students can earn a BA in the natural sciences and a BS in engineering in three to five years as part of a new joint degree program with Columbia University’s Fu Foundation School of Engineering and Applied Sciences. “IT IS A FANTASTIC RECRUITING TOOL FOR STEM PROGRAMS AT AMERICAN UNIVERSITY. But more than that, it gives our students an opportunity to receive two degrees on their resume, instead of one. It quadruples the number of opportunities for them,” says Teresa Larkin, professor of physics and director of the program.
16

17
WCL CELEBRATES NEW HOME
FROM STAGE TO VIDEO
FAIR USE FOR ARTISTS
College of Arts and Sciences professor Caleen Jennings’s Hands Up, a performance piece, is an artful reflection on the state of race relations in America. After performing the piece for AU students, Jennings partnered with University Communications and Marketing to create a video version. TRANSITIONING TO A NEW MEDIUM, WHILE RETAINING THE PIECE’S EMOTIONAL POWER, REQUIRED CREATIVITY AND TECHNICAL EXPERTISE. The video debuted to a live audience of 150 faculty members and reached nearly 80,000 people on social media.
Thousands of artists, scholars, museum professionals, and editors provided input for a new Code of Best Practices in Fair Use for the Visual Arts, led by Washington College of Law professor Peter Jaszi and School of Communication professor Patricia Aufderheide. THE MUCH-NEEDED CODE CLARIFIES COPYRIGHT LAW AND FAIR USE PRACTICES FOR ARTISTS. “Codes give museums, broadcasters, museums, insurers, publishers, educational institutions, and their lawyers a new and valuable tool to use in making better, more reasonable assessments of risk,” Aufderheide says.
NEW DEGREE FOR ENGINEERS

AU, OECD SIGN HISTORIC PACT
PRESIDENT’S AWARD WINNER
James Thurber, far right, director of the Center for Congressional and Presidential Studies (CCPS) at the School of Public Affairs (SPA), facilitated an agreement for AU to advise the Organisation for Economic Co-operation and Development (OECD) on lobbying, ethics, and corruption research—BELIEVED TO BE THE FIRST SUCH AGREEMENT WITH A RESEARCH UNIVERSITY. From left: SPA dean Barbara Romzek; Candice Nelson, Campaign Management Institute; Pat Griffin, CCPS; US Ambassador to OECD Connie Morella; AU provost Scott Bass; and OECD Deputy Secretary-General William Danvers.
Candace Evilsizor, SIS/BA ’15, 2015 President’s Award winner and Frederick Douglass Distinguished Scholarship recipient, is deeply committed to social justice in immigration. EVILSIZOR STUDIED IN FRANCE AND MOROCCO AND WORKED WITH REFUGEE COMMUNITIES IN THE MIDDLE EAST, NORTH AFRICA, EUROPE, AND THE UNITED STATES. She also developed a presentation for high school counselors in her home state of Arizona about college access for undocumented immigrants. This award, presented by AU president Neil Kerwin, is AU’s highest undergraduate honor.
18
19
AU, OECD SIGN HISTORIC PACT
PRESIDENT’S AWARD WINNER ENVIRONMENT LECTURE SERIES
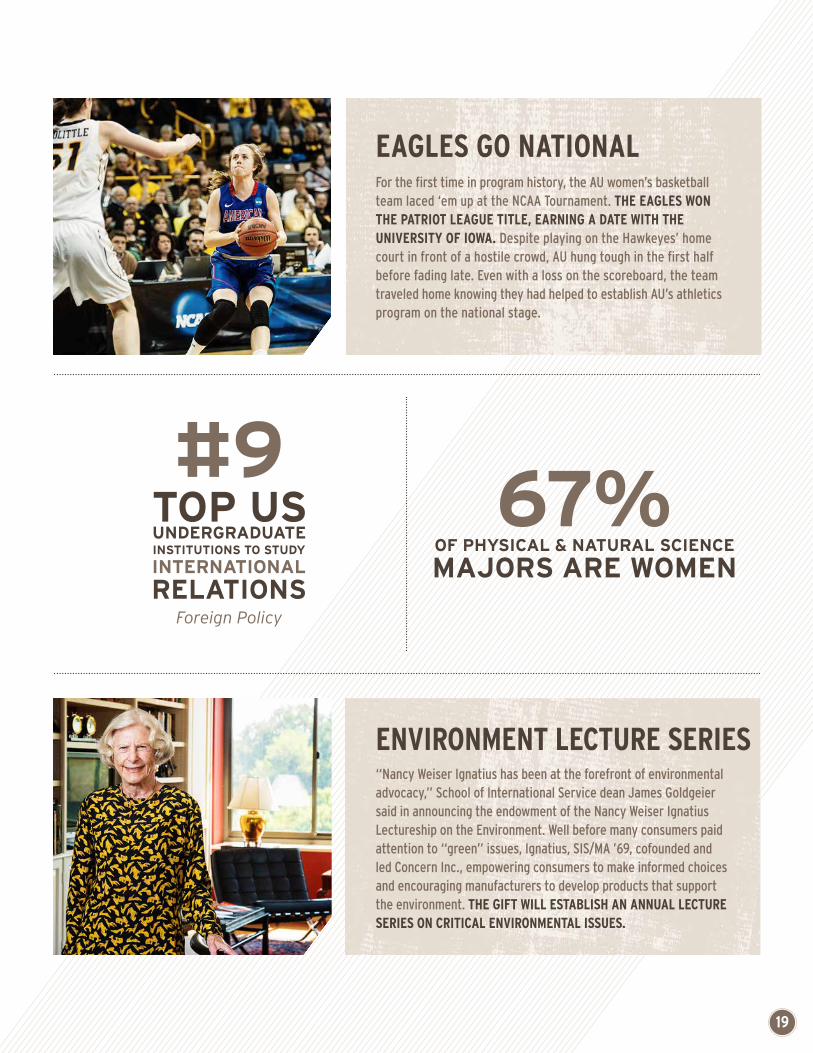
EAGLES GO NATIONAL
“Nancy Weiser Ignatius has been at the forefront of environmental advocacy,” School of International Service dean James Goldgeier said in announcing the endowment of the Nancy Weiser Ignatius Lectureship on the Environment. Well before many consumers paid attention to “green” issues, Ignatius, SIS/MA ’69, cofounded and led Concern Inc., empowering consumers to make informed choices and encouraging manufacturers to develop products that support the environment. THE GIFT WILL ESTABLISH AN ANNUAL LECTURE SERIES ON CRITICAL ENVIRONMENTAL ISSUES.
For the first time in program history, the AU women’s basketball team laced ‘em up at the NCAA Tournament. THE EAGLES WON THE PATRIOT LEAGUE TITLE, EARNING A DATE WITH THE UNIVERSITY OF IOWA. Despite playing on the Hawkeyes’ home court in front of a hostile crowd, AU hung tough in the first half before fading late. Even with a loss on the scoreboard, the team traveled home knowing they had helped to establish AU’s athletics program on the national stage.

NEW TOOL TO FIGHT HUNGERMaria Rose Belding, CAS/BA ’18, received the 2015 President Clinton Hunger Leadership Award in recognition of her work in the movement to end hunger. Among other projects, BELDING DESIGNED A DATABASE TO HELP FOOD PANTRIES SHARE INFORMATION ABOUT INVENTORY AND DECREASE FOOD WASTE. In 2014, she received the President’s Volunteer Service Award. Stop Hunger Now and the North Carolina State University Center for Student Leadership, Ethics, and Public Service cosponsor the Hunger Leadership Award.
FORT BLISS LOOKS AT FAMILY School of Communication professor Claudia Myers wrote and directed Fort Bliss, which has won awards at several film festivals. THIS INDEPENDENT FILM TELLS THE STORY OF AN ARMY MEDIC AND SINGLE MOTHER WHO STRUGGLES TO RECONNECT WITH HER YOUNG SON AFTER RETURNING FROM SERVICE IN AFGHANISTAN. Myers wrote the film after working on a training film for the US Army, where she spoke with soldiers and combat veterans about the impacts of war service on family relationships.
20

21
NEW TOOL TO FIGHT HUNGER
NOISE MODELS FOR US NAVY
YOUNG PEOPLE’S POLITICS
As an audio technology and physics student, Valerie Rennoll, CAS/BS ’16, had the opportunity to apply her diverse skills to real-world scenarios in an internship with Applied Research in Acoustics LLC (ARiA). IN A PROJECT FOR THE OFFICE OF NAVAL RESEARCH, RENNOLL HELPED TO DEVELOP AND TEST AMBIENT OCEAN NOISE MODELS FOR WAVEQUEST, AN UNDERWATER ACOUSTICS GAME FOR SONAR OPERATORS. Users interact with real-time simulations to gain a better understanding of underwater acoustics.
In Running from Office: Why Young Americans Are Turning Off to Politics, School of Public Affairs professor Jennifer Lawless and Loyola Marymount University’s Richard Fox explore the younger generation’s disillusionment with politics as a problem-solving tool. Equally important, they propose solutions. “IF YOUNG PEOPLE SAW POLITICS AS A VIBRANT, EFFECTIVE WAY TO ENGAGE WITH AND IMPROVE THEIR COMMUNITIES AND SOCIETY, THEN MORE OF THEM WOULD NOT BE TURNED OFF BY THE THOUGHT OF ENTERING THE FRAY,” the authors write.
FORT BLISS LOOKS AT FAMILY
22
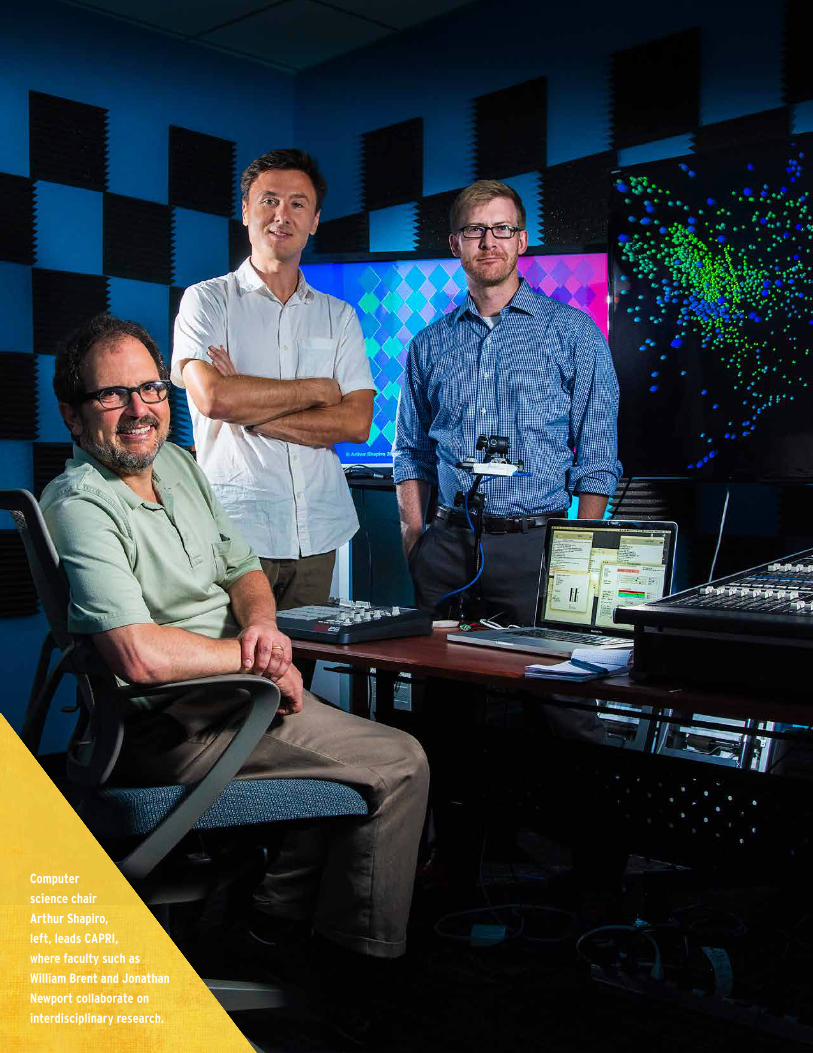
Computer science chair Arthur Shapiro, left, leads CAPRI, where faculty such as William Brent and Jonathan Newport collaborate on interdisciplinary research.

23
ART, SCIENCE, AND TECHNOLOGY MERGER LOOKS TO THE FUTURE
Innovation does not spring from silos. Solutions for today’s complex issues require diverse teams of researchers, thinkers, and experimenters working together—often in surprising combinations. That is why American University launched the Collaborative for Applied Perceptual Research and Innovation
(CAPRI). So far, it has partnered faculty from audio technology, biology, computer science, math and statistics, performing arts, physics, psychology, and sociology.
CAPRI reflects the belief that in the next 30 years, developments in interactive technology will change the world as much as the Internet has altered the past 30 years. The new initiative leverages these developments—such as the neuroscience of optical illusions, uber-interactive computers, and cutting-edge robotics—to create a hub for perceptual research and practical applications.
Founded by the College of Arts and Sciences, CAPRI is led by Arthur Shapiro, who chairs the Department of Computer Science.
“The goal of CAPRI is to push the technological envelope and build a culture of cutting-edge technological innovation across departments and disciplines,” Shapiro says. “We want CAPRI to become an axis for perceptual research, science, innovation, and application.”
Recent projects included “Magic and the Brain” and “Sounding Movement: Cross-Mappings in Music and Dance.” Through demonstrations and interactive exhibits, members develop original methodologies and acquire new perspectives on important research questions.
“Magic and the Brain” featured renowned neuroscientists Stephen Macknik and Susana Martinez-Conde, founders of the new discipline of neuromagic and authors of the book Sleights of Mind. Macknik and Martinez-Conde probed how the mind’s interaction with magic is yielding new insight into brain function. Their work has interesting implications for fields as diverse as marketing, education, and the diagnosis of neurodevelopmental disorders.
“Sounding Movement” used custom technology to create new relationships among physical
movement, acoustic and computer-generated sound, and real-time video manipulation. Various aspects of a cellist’s playing—including pitch, loudness, and liveliness—controlled video of a dancer in real time, while the dancer’s movement controlled the sound of the cello in a surround-sound environment.
“CAPRI will become an open collaborative laboratory,” says William Brent, a performing arts professor. “The work will be exceptionally public and visible—creating a space of interactive demonstrations and installations that the general public can freely explore.”
By transcending traditional divides between disciplines, CAPRI allows faculty, students, and artists to share expertise in new ways, combining state-of-the-art tools and approaches from scientific research, multimedia art, and advanced data representation. The initiative holds promise for research in all corners of AU: explorations of neuroscience, gaming, and big data already have homes at the new collaborative.
CAPRI will also serve as an incubator for novel software and interface development for digital musical instrument design, medical testing, assistive technologies, improved training procedures, and educational tools.
Ultimately, the creative thinking and technical solutions developed at CAPRI will have real-world applications in a range of industries. Education, museums, performing arts, athletics, and assistive technologies for individuals with disabilities are among the hundreds of areas that can potentially benefit from CAPRI’s collaborative innovation.
ELDER PLANNING: GOOGLE MAPS, DATA ANALYSIS PREDICT HOUSING OUTCOMES One in five Americans will be 65 or older by 2030, and AU professor Michael Bader, a CAPRI participant, is assessing their ability to live safely at home.
Bader and colleagues combine Google Maps with geographic information systems and geostatistical computation TO SPEED DATA COLLECTION AND EXAMINE WHY ELDERS LEAVE COMMUNITIES. The resulting app—Computer-Assisted Neighborhood Visual Assessment System (CANVAS)—uses Google Street View to map neighborhoods and understand their effect on seniors.
Bader and his team use the data to predict the likelihood that elders will be able to age in place and then share this information with policy makers.

24
LIVE AND LEARN: NEW PROGRAMS BUILD EDUCATION COMMUNITIES
Whether students aspire to conduct cancer research at the National Institutes of Health, break powerful news stories, or serve communities across the world, American University encourages the discovery of individual inspirations. Often, experiences outside the classroom
are an important piece in helping students identify their passions—and then translate them into rewarding professions.
Undergraduate students’ demand for rigorous, intensive living-learning experiences became evident when AU received an unprecedented 5,000 applicants for the Class of 2017’s five spots in the Frederick Douglass Distinguished Scholars (FDDS) program. The program selects talented scholars who are committed to serving underserved populations.
“One thing that stood out to me was the success rate of the students,” says FDDS participant Shyheim Snead of the program. “You meet all types of people, icons in the country, to help you connect with your goals.”
AU moved quickly to expand its capacity to deliver more of these experiences. By the next application cycle, the university was offering students opportunities to participate in Community-Based Research Scholars, Three-Year Scholars, and AU Scholars programs and had revamped its Honors Program. These programs now join FDDS and University College, AU’s oldest living-learning community.
AU sought to foster learning and research environments where like-minded, high-achieving students can live and learn together. Living-learning communities also ease the college transition by making a new environment feel more like home: students share residences based on common interests, so they can jump into areas of study with others who share their passions.
With the new communities, nearly 70 percent of the Class of 2018 had the opportunity to participate in a living-learning program. Each program’s focus is slightly different, but all share a residential component, allowing students to easily
continue discussions outside the classroom and pursue goals together.
“Courses are based on what you are interested in, and that’s why this was compelling to me,” says AU Scholar Luke Theuma, SIS/BA ’18.
Community-Based Research Scholars participate in meaningful service learning and research. Faculty help students forge partnerships with local organizations, with the goal of creating informed solutions for pressing social problems.
AU Scholars develop their research skills and identities from the start of their academic careers, so they can pursue independent research and scholarship opportunities in the future.
Three-Year Scholars can earn a bachelor’s degree in international affairs; public health; communications, legal institutions, economics, and government; or law and society. The program is distinctive because of its pace of study, together with seminars and enhanced mentorships that help students develop discipline-specific strengths in investigation and inquiry.
In the new Honors Program, students learn in team-taught courses with a multidisciplinary triad of professors and do hands-on work with Washington, DC, institutions.
By encouraging students to delve into subjects that inspire them and to apply their knowledge to the real world, research-based learning communities put AU students on track to create both meaningful college experiences and impactful careers.
“ONE THING THAT STOOD OUT TO ME WAS THE SUCCESS RATE OF THE STUDENTS. YOU MEET ALL TYPES OF PEOPLE, ICONS IN THE COUNTRY, TO HELP YOU CONNECT WITH YOUR GOALS.” –Shyheim Snead, Frederick Douglass Distinguished Scholar

25
Frederick Douglass
Distinguished Scholar Shyheim
Snead, SPA/BA ’18, interns in the office of Washington, DC, mayor
Muriel Bowser, SPA/MPP ’00.

26
Professors William LeoGrande, Philip Brenner, and Ana Serra have published several books on Cuban politics, history, and culture.

27
A t the heart of successful innovation is preparation meeting opportunity. A prime example is American University’s Center for Latin American and Latino Studies (CLALS) being ready to answer the many questions raised by the normalization of relations between the United States
and Cuba after President Obama’s December 17, 2014, announcement sent shockwaves around the world.
In fact, School of Public Affairs (SPA) professor Eric Hershberg, center director, and a half dozen colleagues—including SPA professor William LeoGrande and School of International Service professor Philip Brenner—were in Havana at the precise moment the countries’ leaders announced the commitment to normalize bilateral relations.
Established in 2010, CLALS advances and disseminates research that promotes a deeper understanding of Latin America and Latino communities in the United States. Its faculty affiliates and partners are at the forefront of efforts to study economic development, democratic governance, cultural diversity and change, peace and diplomacy, health, education, and environmental well-being.
“The final weeks of 2014 were remarkably exciting for faculty, fellows, and staff at CLALS,” Hershberg says.
The center hosted a workshop on Religion and Democratic Contestation in Latin America and launched a book in Santiago, Chile, based on its examination of emerging challenges in Latin American economies. It also published Unaccompanied Migrant Children from Central America: Context, Causes, and Advocacy Responses and gave presentations to researchers and practitioners throughout the United States about factors leading families and unaccompanied minors from Central America to migrate to this country.
But 2014 will be remembered primarily for the thaw between Washington and Havana. In the wake of what is now known as “D-17,” the media sought out the expertise—and predictions on what the future holds for the two nations—from LeoGrande. One of the world’s foremost experts
on the subject, he published Back Channel to Cuba: The Hidden History of Negotiations between Washington and Havana just two months before the historic day.
Brenner also has studied the US-Cuba relationship for decades. In 2014, he edited A Contemporary Cuba Reader: The Revolution under Raúl Castro with LeoGrande, Marguerite Rose Jiménez, CAS/MA ’08, SPA/PhD ’13, and John Kirk. Jiménez, a former White House Fellow, has worked with the Council on Foreign Relations, Institute for Policy Studies, and US Department of State.
College of Arts and Sciences professor Ana Serra also is contributing to the public conversation on Cuba. She currently is writing Transatlantic Currents: Cuban and Spanish Intellectuals in Exile, a follow-up to her book The New Man in Cuba: Culture and Identity in the Revolution.
Its deep expertise on Cuba notwithstanding, CLALS’s projects range widely, from analyses of the relationship between religion and violence to research on Latino entrepreneurs in Washington, DC. CLALS is hosting leading economist Ricardo Torres Pérez of the University of Havana for a research semester at AU in fall 2015. It is also expanding its online scholarly series “Implications of Normalization” into a book.
As the world watches developments in Cuba and other Latin American nations, CLALS affiliates will be there to analyze them—and to share their knowledge and insights with other scholars, practitioners, political leaders, and communities.
“THE FINAL WEEKS OF 2014 WERE REMARKABLY EXCITING FOR FACULTY, FELLOWS, AND STAFF AT [THE CENTER FOR LATIN AMERICAN AND LATINO STUDIES].”–CLALS Director Eric Hershberg
AU PROFESSORS IN HAVANA ON DAY US-CUBA RELATIONS BEGIN THAW

28
WCL POSES TOUGH QUESTIONS IN UNITED NATIONS PARTNERSHIP
T he United Nations Committee Against Torture (UN CAT) Project at the Washington College of Law (WCL) gives students a one-of-a-kind experiential learning opportunity to affect international human rights law.
Under the guidance of WCL dean Claudio Grossman, who chairs the UN committee, participating students engage with some of the toughest questions on torture, contributing to international human rights law and working to eradicate suffering. So far, approximately 100 WCL students have participated in the program, which just marked its first decade.
“This is an incredibly unique opportunity for students,” says Project Coordinator Jennifer de Laurentiis, WCL/JD ’92, who cofounded the project with Grossman. “They get to see their work make a direct impact within an international forum.”
Each year, students and faculty attend the UN CAT’s spring and fall meetings in Geneva, where the committee of international human rights experts convenes to deliberate individual petitions, consider the global state of torture, and monitor compliance with the UN Convention
Against Torture and Other Cruel, Inhuman, or Degrading Treatment or Punishment. Dean Grossman presides over the meetings, prompting the committee with questions that AU students helped to develop and delivering their assessments of allegations and potential compliance issues.
One of the most significant achievements of faculty and student participants was influencing the adoption of the committee’s “General Comment 3,” a seminal advance in ensuring that victims of torture and other ill treatment have an enforceable right to fair and adequate compensation. Participants also have enhanced the committee’s body of research on issues related to its work, including the critical role of legal safeguards such as due process.
Grossman says, “The project has made tremendous contributions to the development of human rights law that would not have been possible without [its] leadership and research.”
AU students not only research and draft extensive papers, they also meet with project alumni and professors to plan and conduct their analyses. They see firsthand how UN committees function, and they gain exposure to the nuanced strategizing that is instrumental to developing effective lawyers and advocates. Upon returning to campus, they continue their work by drafting articles, giving presentations, and raising awareness of international human rights. Faculty participation in the project has resulted in the development of innovative learning activities, such as simulations of committee proceedings.
Altogether, the intensive project includes a semester of preparation, site visits, meetings with nongovernmental organizations, an annual WCL alumni dinner, and follow-up research and publishing.
Many graduates of the UN CAT Project go on to strengthen human dignity and the rule of law locally, nationally, and around the world through their work in the private and public sectors.
“THIS IS AN INCREDIBLY UNIQUE OPPORTUNITY FOR STUDENTS. THEY GET TO SEE THEIR WORK MAKE A DIRECT IMPACT WITHIN AN INTERNATIONAL FORUM.”–UN CAT PROJECT COORDINATOR JENNIFER DE LAURENTIIS
HUMANITARIAN LAW DEGREE IN SPANISH IS FIRST OF ITS KINDIf international human rights law is to be equitable throughout the world, its champions must be multilingual. AU is leading the way towards that objective.
Beginning in spring 2016, WCL will offer an LL.M. DEGREE IN INTERNATIONAL HUMAN RIGHTS AND HUMANITARIAN LAW TAUGHT ENTIRELY IN SPANISH. The program will correlate with the existing English-language LL.M. program while building on WCL’s success in incorporating language and cultural developments.
The Spanish LL.M. program is the only one of its kind offered at a US law school, with components for practitioners and human rights professionals who want to pursue advanced studies.

29
WCL POSES TOUGH QUESTIONS IN UNITED NATIONS PARTNERSHIP
WCL students and UN CAT
Project members Alanna Kennedy, Dina
Navar, Andrew Mutavdzija, Elizabeth Leman, and Ben
Juvelier on the new Tenley Campus, which opens for classes in January 2016.

30
UNIVERSITY ADMINISTRATION
PRESIDENT’S CABINETCornelius M. Kerwin,* PresidentScott A. Bass, ProvostTeresa Flannery, Vice President of CommunicationGail S. Hanson, Vice President of Campus LifeMary E. Kennard, Vice President and General CounselDouglas Kudravetz, Chief Financial Officer, Vice President and TreasurerCourtney L. Surls, Vice President of Development and Alumni RelationsDavid Swartz, Chief Information OfficerDavid E. Taylor, Chief of Staff and Secretary, Board of Trustees
DEANSErran Carmel, Interim Dean, Kogod School of Business Mary L. Clark, Dean of Academic Affairs and Senior Vice ProvostJames M. Goldgeier, Dean, School of International ServiceClaudio M. Grossman, Dean, Washington College of LawBarbara S. Romzek, Dean, School of Public AffairsJeffrey Rutenbeck, Dean, School of CommunicationPeter Starr, Dean, College of Arts and SciencesJonathan Tubman, Vice Provost for Research and Dean of Graduate StudiesCarola Weil, Dean, School of Professional and Extended Studies
OTHER SENIOR ADMINISTRATORSNancy Davenport, University LibrarianWilliam Walker, Director, Athletics and Recreation
BOARD OF TRUSTEES
Jack C. Cassell,* ChairMarc N. Duber,* Vice ChairGary M. Abramson*Gina F. Adams*Stephanie M. Bennett-SmithKim CapeGary D. Cohn*Pamela M. Deese*Larry EngelHani M. S. Farsi*Thomas A. GottschalkGisela B. Huberman*C. Nicholas Keating Jr.*Cornelius M. Kerwin*
Margery Kraus*Gerald Bruce Lee*Ross B. LevinsohnCharles H. Lydecker*Betsy A. MangoneRobyn Rafferty Mathias*Marcus MatthewsAlan L. Meltzer*Arthur J. RothkopfPeter L. Scher*Jeffery A. Sine*Evangeline C. Unsworth* Lacey Wootton
* alumna or alumnus of American University

31

32
AU’s thoughtful financial stewardship and our commitment to provide the university community with environmentally friendly, state-of-the-art facilities have combined to create and support an ‘ecology of innovation.’
DOUGLAS KUDRAVETZ | CFO, VICE PRESIDENT AND TREASURER

33
From the CFO, Vice President and TreasurerInnovation—the pursuit of it and our willingness to embrace it—is an essential component in the cultural fabric of American University. It has been the impetus to many of our past achievements and to our current goals and pursuits, and surely will remain a key factor in ensuring the university’s place at the forefront of higher education in the future.
To support such an environment, we have continued our tradition of sound financial management and disciplined investment. As a result, AU continues to maintain a strong financial position. Total assets now stand at $1.71 billion and net assets are $1.06 billion, as both Standard and Poor’s and Moody’s reaffirmed the university’s A+ and A1 credit ratings, respectively. To provide the necessary financial infrastructure to support our ambitions, the university issued $128.5 million of 30-year taxable, fixed-rate bonds to complete the external financing component of the 2011 capital plan. The financing will
help support our capital projects, including the Nebraska Hall addition, Cassell Hall, Washington College of Law, and East Campus.
The past year saw a number of our capital projects edge towards realization. Most significant to the physical landscape of AU, the Washington College of Law at Tenley Campus nears completion, and students are set to start classes there in January 2016. The new campus also will help to spearhead revitalization of the Tenleytown corridor along Wisconsin Avenue.
The university made notable strides in our pursuit of being carbon-neutral by 2020. We finalized and issued our sustainability plan, American University: An Active Pursuit of Sustainability, and continue to implement energy conservation and efficiency initiatives in support of our Climate Action Plan. Our newly renovated McKinley Building earned the US Green Building Council’s Leadership in Energy and Environmental Design (LEED) Gold certification. It is the second building on AU’s campus to receive the Gold distinction, following the School of International Service’s Gold award in 2011. The Office of Sustainability also is seeking LEED certification for Cassell Hall, Nebraska Hall, and several other buildings on campus.
AU’s thoughtful financial stewardship and our commitment to provide the university community with environmentally friendly, state-of-the-art facilities have combined to create and support an “ecology of innovation.”
I am confident that such an environment will be conducive to producing future leaders and unparalleled achievement, and will further cement AU’s stature as a premier institution of higher education.
Sincerely,
Douglas Kudravetz

34
INDEPENDENT AUDITOR’S REPORT
TO THE BOARD OF TRUSTEES OF AMERICAN UNIVERSITY:We have audited the accompanying consolidated financial statements of American University (the “University”) and its subsidiaries, which comprise the consolidated balance sheets as of April 30, 2015, and April 30, 2014, and the related consolidated statements of activities and of cash flows for the years then ended.
Management’s Responsibility for the Consolidated Financial Statements Management is responsible for the preparation and fair presentation of the consolidated financial statements in accordance with accounting principles generally accepted in the United States of America; this includes the design, implementation, and maintenance of internal control relevant to the preparation and fair presentation of consolidated financial statements that are free from material misstatement, whether due to fraud or error.
Auditor’s Responsibility Our responsibility is to express an opinion on the consolidated financial statements based on our audits. We conducted our audits in accordance with auditing standards generally accepted in the United States of America. Those standards require that we plan and perform the audit to obtain reasonable assurance about whether the consolidated financial statements are free from material misstatement.
An audit involves performing procedures to obtain audit evidence about the amounts and disclosures in the consolidated financial statements. The procedures selected depend on our judgment, including the assessment of the risks of material misstatement of the consolidated financial statements, whether due to fraud or error. In making those risk assessments, we consider internal control relevant to the University’s preparation and fair presentation of the consolidated financial statements in order to design audit procedures that are appropriate in the circumstances, but not for the purpose of expressing an opinion on the effectiveness of the University’s internal control. Accordingly, we express no such opinion. An audit also includes evaluating the appropriateness of accounting policies used and the reasonableness of significant accounting estimates made by management, as well as evaluating the overall presentation of the consolidated financial statements. We believe that the audit evidence we have obtained is sufficient and appropriate to provide a basis for our audit opinion.
Opinion In our opinion, the consolidated financial statements referred to above present fairly, in all material respects, the financial position of American University and its subsidiaries as of April 30, 2015, and April 30, 2014, and the changes in its net assets and its cash flows for the years then ended in accordance with accounting principles generally accepted in the United States of America.
August 28, 2015

35
CONSOLIDATED BALANCE SHEETS APRIL 30, 2015 AND 2014
(IN THOUSANDS) 2015 2014
ASSETS
1 Cash and cash equivalents $ 76,536 $ 21,605
2 Accounts and University loans receivable, net 35,968 32,133
3 Contributions receivable, net 10,917 11,835
4 Prepaid expenses and inventory 2,036 2,316
5 Investments 876,401 864,858
6 Deposits with trustees/others 2,817 1,377
7 Deposits for collateralized swaps 34,816 13,897
8 Property, plant, and equipment, net 653,461 580,738
9 Deferred financing costs 2,870 2,226
10 Interest in perpetual trust 18,285 17,826
11 Total assets $1,714,107 $1,548,811
LIABILITIES AND NET ASSETS
Liabilities:
12 Accounts payable and accrued liabilities $ 72,423 $ 52,872
13 Deferred revenue and deposits 15,359 12,386
14 Notes payable and long-term debt 481,905 418,676
15 Swap agreements 76,181 50,436
16 Assets retirement obligations 2,217 4,058
17 Refundable advances from the US government 9,102 8,846
18 Total liabilities 657,187 547,274
Net assets:
Unrestricted
19 General operations 9,321 8,882
20 Internally designated 212,645 189,242
Capital
21 Designated funds functioning as endowments 460,776 428,476
22 Designated for plant 160,834 172,674
23 Total unrestricted 843,576 799,274
24 Temporarily restricted 107,986 103,056
25 Permanently restricted 105,358 99,207
26 Total net assets 1,056,920 1,001,537
27 Total liabilities and net assets $1,714,107 $1,548,811
SEE ACCOMPANYING NOTES TO THE FINANCIAL STATEMENTS

36
UNRESTRICTED NET ASSETS TEMPORARILY RESTRICTED NET ASSETS
PERMANENTLY RESTRICTED NET ASSETS(IN THOUSANDS)
GENERAL OPERATIONS
INTERNALLY DESIGNATED CAPITAL TOTAL TOTAL
Operating revenues and support
1 Tuition and fees $480,392 $ 7,178 $ - $487,570 $ - $ - $ 487,570
2 Less scholarship allowances (103,570) (9,517) - (113,087) - - (113,087)
3 Net tuition and fees 376,822 (2,339) - 374,483 - - 374,483
4 Federal grants and contracts 1,233 19,224 - 20,457 - - 20,457
5 Private grants and contracts 9,121 8,612 - 17,733 - - 17,733
6 Indirect cost recovery 2,222 - - 2,222 - - 2,222
7 Contributions 10,674 6,305 1,936 18,915 3,762 4,796 27,473
8 Endowment income 4,382 5,261 228 9,871 5,662 130 15,663
9 Investment income 7,420 633 27 8,080 754 - 8,834
10 Auxiliary enterprises 72,356 119 - 72,475 - - 72,475
11 Other sources 911 1,015 72 1,998 - - 1,998 12 Net asset release 804 7,572 2,034 10,410 (10,410) - -
13Total operating revenues and support 485,945 46,402 4,297 536,644 (232) 4,926 541,338
Operating expenses
14 Instruction 140,445 2,544 20,505 163,494 - - 163,494
15 Research 33,419 19,060 - 52,479 - - 52,479
16 Public service 21,507 239 3,753 25,499 - - 25,499
17 Academic support 43,016 6,055 7,187 56,258 - - 56,258
18 Student services 39,988 398 3,218 43,604 - - 43,604
19 Institutional support 74,485 2,970 12,765 90,220 - - 90,220
20 Auxiliary enterprises 24,202 22 35,585 59,809 - - 59,809
21Facilities operations and maintenance 48,952 - (48,952) - - - -
22 Interest expense 13,533 - (13,533) - - - -
23Total operating expenses 439,547 31,288 20,528 491,363 - - 491,363
24Total operating activities 46,398 15,114 (16,231) 45,281 (232) 4,926 49,975
25 Transfer among funds (45,641) 3,628 42,013 - - - -
Nonoperating items
26 Other nonoperating sources 10 8,766 (11,277) (2,501) (246) 377 (2,370)
27Realized and unrealized net capital gains (losses) (328) (4,105) 5,955 1,522 5,408 848 7,778
28Total nonoperating activities (318) 4,661 (5,322) (979) 5,162 1,225 5,408
29 Change in net assets 439 23,403 20,460 44,302 4,930 6,151 55,383
30 Net assets at beginning of year 8,882 189,242 601,150 799,274 103,056 99,207 1,001,537
31 Net assets at end of year $ 9,321 $212,645 $621,610 $843,576 $107,986 $105,358 $1,056,920
CONSOLIDATED STATEMENTS OF ACTIVITIES YEAR ENDED APRIL 30, 2015
SEE ACCOMPANYING NOTES TO THE FINANCIAL STATEMENTS
37
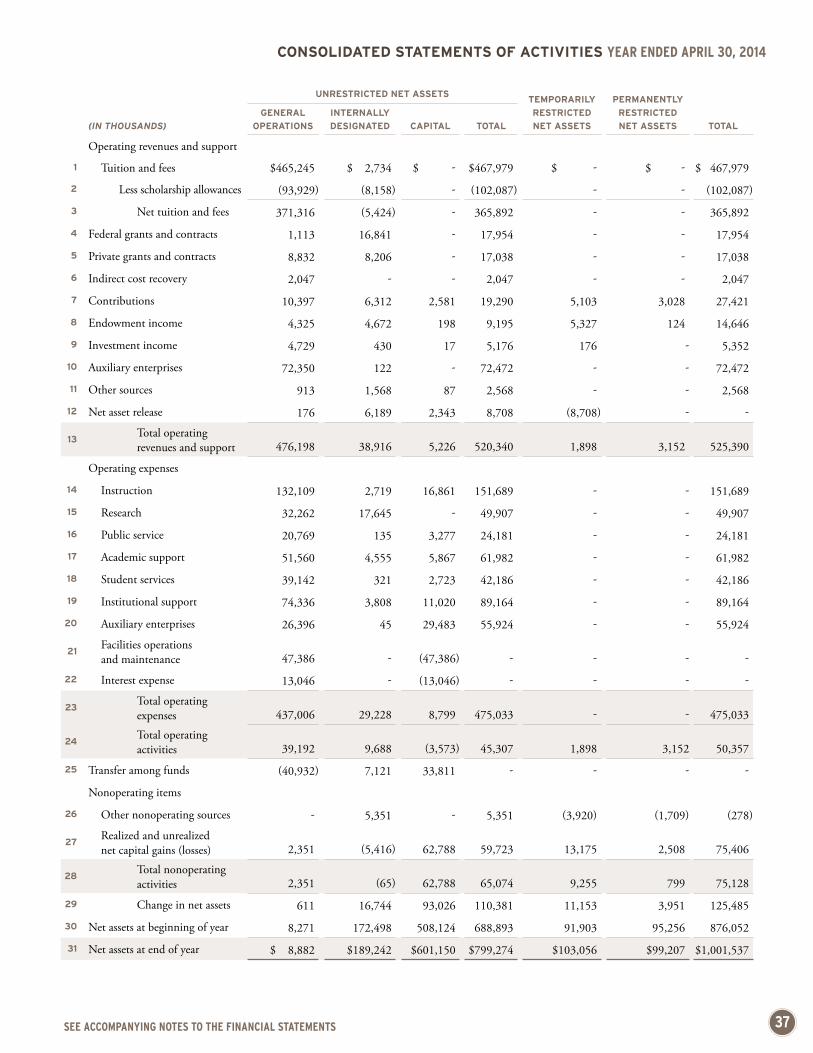
UNRESTRICTED NET ASSETS TEMPORARILY RESTRICTED NET ASSETS
PERMANENTLY RESTRICTED NET ASSETS TOTAL(IN THOUSANDS)
GENERAL OPERATIONS
INTERNALLY DESIGNATED CAPITAL TOTAL
Operating revenues and support
1 Tuition and fees $465,245 $ 2,734 $ - $467,979 $ - $ - $ 467,979
2 Less scholarship allowances (93,929) (8,158) - (102,087) - - (102,087)
3 Net tuition and fees 371,316 (5,424) - 365,892 - - 365,892
4 Federal grants and contracts 1,113 16,841 - 17,954 - - 17,954
5 Private grants and contracts 8,832 8,206 - 17,038 - - 17,038
6 Indirect cost recovery 2,047 - - 2,047 - - 2,047
7 Contributions 10,397 6,312 2,581 19,290 5,103 3,028 27,421
8 Endowment income 4,325 4,672 198 9,195 5,327 124 14,646
9 Investment income 4,729 430 17 5,176 176 - 5,352
10 Auxiliary enterprises 72,350 122 - 72,472 - - 72,472
11 Other sources 913 1,568 87 2,568 - - 2,568
12 Net asset release 176 6,189 2,343 8,708 (8,708) - -
13Total operating revenues and support 476,198 38,916 5,226 520,340 1,898 3,152 525,390
Operating expenses
14 Instruction 132,109 2,719 16,861 151,689 - - 151,689
15 Research 32,262 17,645 - 49,907 - - 49,907
16 Public service 20,769 135 3,277 24,181 - - 24,181
17 Academic support 51,560 4,555 5,867 61,982 - - 61,982
18 Student services 39,142 321 2,723 42,186 - - 42,186
19 Institutional support 74,336 3,808 11,020 89,164 - - 89,164
20 Auxiliary enterprises 26,396 45 29,483 55,924 - - 55,924
21Facilities operations and maintenance 47,386 - (47,386) - - - -
22 Interest expense 13,046 - (13,046) - - - -
23Total operating expenses 437,006 29,228 8,799 475,033 - - 475,033
24Total operating activities 39,192 9,688 (3,573) 45,307 1,898 3,152 50,357
25 Transfer among funds (40,932) 7,121 33,811 - - - -
Nonoperating items
26 Other nonoperating sources - 5,351 - 5,351 (3,920) (1,709) (278)
27Realized and unrealized net capital gains (losses) 2,351 (5,416) 62,788 59,723 13,175 2,508 75,406
28Total nonoperating activities 2,351 (65) 62,788 65,074 9,255 799 75,128
29 Change in net assets 611 16,744 93,026 110,381 11,153 3,951 125,485
30 Net assets at beginning of year 8,271 172,498 508,124 688,893 91,903 95,256 876,052
31 Net assets at end of year $ 8,882 $189,242 $601,150 $799,274 $103,056 $99,207 $1,001,537
CONSOLIDATED STATEMENTS OF ACTIVITIES YEAR ENDED APRIL 30, 2014
SEE ACCOMPANYING NOTES TO THE FINANCIAL STATEMENTS

38
CONSOLIDATED STATEMENTS OF CASH FLOWS YEARS ENDED APRIL 30, 2015 AND 2014
SEE ACCOMPANYING NOTES TO THE FINANCIAL STATEMENTS
(IN THOUSANDS) 2015 2014
CASH FLOWS FROM OPERATING ACTIVITIES
1 Increase in net assets $55,383 $125,485
Adjustments to reconcile increase in net assets to net cash provided by operating activities:
2 Contributed art and property (7,502) (7,548)
3 Net realized and unrealized capital gains (43,721) (66,731)
4 Loss on disposal of fixed assets - 70
5 Gain on asset retirement obligation remediation (1,121) (593)
6 Change in fair value of interest rate swaps 25,745 (20,440)
7 Depreciation, amortization, and accretion 32,454 30,229
8 Changes in assets and liabilities
9 Increase in accounts and university loans receivable, net (3,480) (3,928)
10 Decrease (increase) in contributions receivable, net 918 (986)
11 Decrease (increase) in prepaid expenses 280 (492)
12 Increase (decrease) in accounts payable and accrued liabilities 10,877 (9,593)
13 Increase (decrease) in deferred revenue, deposits, and other refundable advance 3,229 (3,569)
14 Contributions collected and revenues restricted for long-term investment (6,980) (5,551)
15 Net cash provided by operating activities 66,082 36,353
CASH FLOWS FROM INVESTING ACTIVITIES
16 Purchases of investments (235,175) (369,894)17 Proceeds from sales and maturities of investments 266,894 319,920 18 Purchases of property, plant, and equipment (87,320) (78,850)19 Capitalized interest (2,401) (1,770)
20 Increase (decrease) in deposits with trustees/other, net (22,359) 18,864 21 Net cash used in investing activities (80,361) (111,730)
CASH FLOWS FROM FINANCING ACTIVITIES
22 Student loans issued (1,684) (1,731)23 Student loans repaid 1,329 1,242 24 Issuance of debt 163,500 35,000 25 Repayment of debt (100,271) (254)26 Debt issuance costs (644) - 27 Proceeds from contributions restricted for28 Investment in plant 1,856 2,341 29 Investment in endowment 5,124 3,210 30 Net cash provided by financing activities 69,210 39,808 31 Net (decrease) increase in cash and cash equivalents 54,931 (35,569)32 Cash and cash equivalents at beginning of year 21,605 57,174 33 Cash and cash equivalents at end of year $76,536 $ 21,605
SUPPLEMENTAL DISCLOSURE OF CASH FLOW INFORMATION
34 Cash paid during year for interest $15,283 $ 14,317 35 Contributed art and property 7,502 7,548 36 Accrued payment for property, plant, and equipment 8,674 3,471
39
CONSOLIDATED NOTES TO FINANCIAL STATEMENTS APRIL 30, 2015 AND 2014
1. AMERICAN UNIVERSITY
American University (the University) is an independent, coeducational university located on an 85-acre campus in northwest Washington, DC. It was chartered by an Act of Congress in 1893 (the Act). The Act empowered the establishment and maintenance of a university for the promotion of education under the auspices of the Methodist Church. While still maintaining its Methodist connection, the University is nonsectarian in all of its policies.
American University offers a wide range of graduate and undergraduate degree programs, as well as non-degree study. There are approximately 850 full-time faculty members in six academic divisions, and approximately 13,000 students, of which 7,900 are undergraduate students and 5,100 are graduate students. The University attracts students from all 50 states, the District of Columbia, Puerto Rico, and nearly 140 foreign countries.
2. SUMMARY OF SIGNIFICANT ACCOUNTING POLICIES
BASIS OF PRESENTATION The financial statements of the University have been reported on the accrual basis of accounting in accordance with accounting principles generally accepted in the United States of America.
CLASSIFICATION OF NET ASSETS Net assets, revenues, gains, and losses are classified based on the existence or absence of donor-imposed restrictions. Accordingly, net assets of the University and changes therein are classified and reported as follows:
Unrestricted—Net assets not subject to donor-imposed stipulations.
Temporarily Restricted—Net assets subject to donor-imposed stipulations that either expire by passage of time or can be fulfilled by actions of the University pursuant to those stipulations.
Permanently Restricted—Net assets subject to donor-imposed stipulations that they be maintained permanently by the University.
Revenues are reported as increases in unrestricted net assets unless use of the related assets is limited by donor-imposed restrictions. Contributions are reported as increases in the appropriate category of net assets. Expenses are reported as decreases in unrestricted net assets. Gains and losses on investments are reported as increases or decreases in unrestricted net assets unless their use is restricted by explicit donor stipulations or by law. Expirations of temporary restrictions recognized on net assets (i.e., the donor-stipulated purpose has been fulfilled and/or the stipulated time period has elapsed) are reported as reclassifications from temporarily restricted net assets to unrestricted net assets. Temporary restrictions on gifts to acquire long-lived assets are considered met in the period in which the assets are acquired or placed in service.
Contributions, including unconditional promises to give, are recognized as revenues in the period received. Conditional promises to give are not recognized until the conditions on which they depend are substantially met. Contributions of assets other than cash are recorded at their estimated fair value at the date of gift. Contributions to be received after one year are discounted at a rate commensurate with the risk involved. Amortization of the discount is recorded as contribution revenue. Allowance is made for uncollectible contributions based upon management’s judgment and analysis of the creditworthiness of the donors, past collection experience, and other relevant factors.
The University follows a practice of classifying its unrestricted net asset class of revenues and expenses as general operations, internally designated, or capital. Items classified as general operations include those revenues and expenses included in the University’s annual operating budget. Items classified as capital include accounts and transactions related to endowment funds and plant facilities and allocation of facilities operations and maintenance, depreciation, and interest expense. All other accounts and transactions are classified as internally designated.
Transfers consist primarily of funding designations for specific purposes and for future plant acquisitions and improvements.
Non-operating activities represent transactions relating to the University’s long-term investments and plant activities, including contributions to be invested by the University to generate a return that will support future operations, contributions to be received in the future or to be used for facilities and equipment, and investment gains or losses.
40
PRINCIPLES OF CONSOLIDATION In May 2012, the University became the sole member of American University at Connecticut Avenue LLC (“the LLC”). The LLC purchased an office building to house the University’s public radio station, WAMU - 88.5 FM, and other administrative offices. Our consolidated financial statements include our accounts and that of our wholly owned and controlled subsidiary after elimination of intercompany accounts and transactions.
CASH AND CASH EQUIVALENTS All highly liquid cash investments with maturities at date of purchase of three months or less are considered to be cash equivalents. Cash equivalents consist primarily of money market funds.
RECEIVABLES Receivables consist of tuition and fee charges to students and auxiliary enterprises’ sales and services, loans receivable primarily related to donor-structured loans and federal student financial aid programs, and amounts due from the federal government, state and local governments, or private sources, in connection with reimbursement of allowable expenditures made pursuant to grants and contracts. Receivables are recorded net of estimated uncollectible amounts. The University reviews the individual receivables as well as the history of collectability to determine the collectible amount as of the balance sheet date. Additionally, loans receivable are evaluated annually by looking at both unsecured and secured loans.
DEPOSITS FOR COLLATERALIZED SWAPS Deposits consist of the cash held as collateral for the University’s interest rate swaps.
INVESTMENTS Equity securities with readily determinable fair values and all debt securities are recorded at fair value in the balance sheet. See Note 6 for an explanation as to methodology for determining fair value. Endowment income included in operating revenues consists of annual amounts allocated for spending of endowment funds in accordance with the University’s spending policy. All realized and unrealized gains and losses from investments of endowment funds are reported as non-operating revenues. Investment income included in operating revenues consists primarily of interest and dividends from investments of working capital funds and unexpended plant funds.
The University has interests in alternative investments consisting of limited partnerships. The alternative investments are carried at estimated fair value. See Note 6 for an explanation as to methodology for determining fair value. Alternative investments are less liquid than the University’s other investments. Furthermore, the investments in these limited partnerships, as well as certain mutual funds classified as equity securities, may include derivatives and certain private investments that do not trade on public markets and therefore may be subject to greater liquidity risk.
Investment income is reported net of management fees and rental real estate property expenses.
PROPERTY, PLANT, AND EQUIPMENT, NET Property, plant, and equipment are stated at cost on the date of acquisition or at estimated fair value if acquired by gift, including interest capitalized on related borrowings during the period of construction, less accumulated depreciation. Certain costs associated with the financing of plant assets are deferred and amortized over the terms of the financing. Depreciation of the University’s plant assets is computed using the straight line method over the asset’s estimated useful life, generally over 50 years for buildings, 20 years for land improvements, 5 years for equipment, 10 years for library collections, and 50 years for art collections. The University’s capitalization policy is to capitalize all fixed assets and collection items that have a cost of $5,000 or more per unit and a useful life of two years or more.
REFUNDABLE ADVANCES FROM THE US GOVERNMENT Funds provided by the United States Government under the Federal Perkins Loan Program are loaned to qualified students and may be reloaned after collections. Such funds are ultimately refundable to the government. Approximately 43% and 44% of net tuition and fees revenue for the years ended April 30, 2015 and 2014, respectively, was funded by federal student financial aid programs (including loan, grant, and work-study programs).
ASSET RETIREMENT OBLIGATIONS The University records asset retirement obligations (ARO) in accordance with the accounting standard for the Accounting for Conditional Asset Retirement Obligations. This standard requires the fair value of the liability for the ARO be recognized in the
CONSOLIDATED NOTES TO FINANCIAL STATEMENTS APRIL 30, 2015 AND 2014
41
period in which it is incurred and the settlement date is estimable, even if the exact timing or method of settlement is unknown. The ARO is capitalized as part of the carrying amount of the long-lived asset retroactively to the time at which legal or contractual regulations created the obligation. The University’s ARO is primarily associated with the cost of removal and disposal of asbestos, lead paint, and asset decommissioning. For the years ended April 30, 2015 and 2014, the accretion expenses were $42,000 and $193,000, respectively. Obligations of $1.9 million were settled during the fiscal year ended April 30, 2015.
INCOME TAXES The University has been recognized by the Internal Revenue Service as exempt from federal income tax under Section 501(c)(3) of the US Internal Revenue Code, except for taxes on income from activities unrelated to its exempt purpose. Such activities resulted in no net taxable income in fiscal years 2015 and 2014.
FUNCTIONAL EXPENSES The University has developed and implemented a system of allocating expenses related to more than one function. These expenses are depreciation, interest, and operations and maintenance of plant. Depreciation is allocated by individual fixed assets to the function utilizing that asset. Interest is allocated based on the use of borrowed money in the individual functional category.
The operations and maintenance of plant is divided into expenses used for the total institution not charged back to the operating units, and those expenses charged to some units but not all units. The allocation was determined through a study of departmental uses of the operations and maintenance budget within each category.
USE OF ESTIMATES The preparation of financial statements in conformity with generally accepted accounting principles requires management to make estimates and assumptions that affect: (1) the reported amounts of assets and liabilities; (2) disclosure of contingent assets and liabilities at the date of the financial statements; and (3) the reported amounts of revenues and expenses during the reporting period. Significant items subject to such estimates and assumptions are the value of alternative investments, the asset retirement obligations, the postretirement benefit plan, and swap agreements. Actual results could differ materially, in the near term, from the amounts reported.
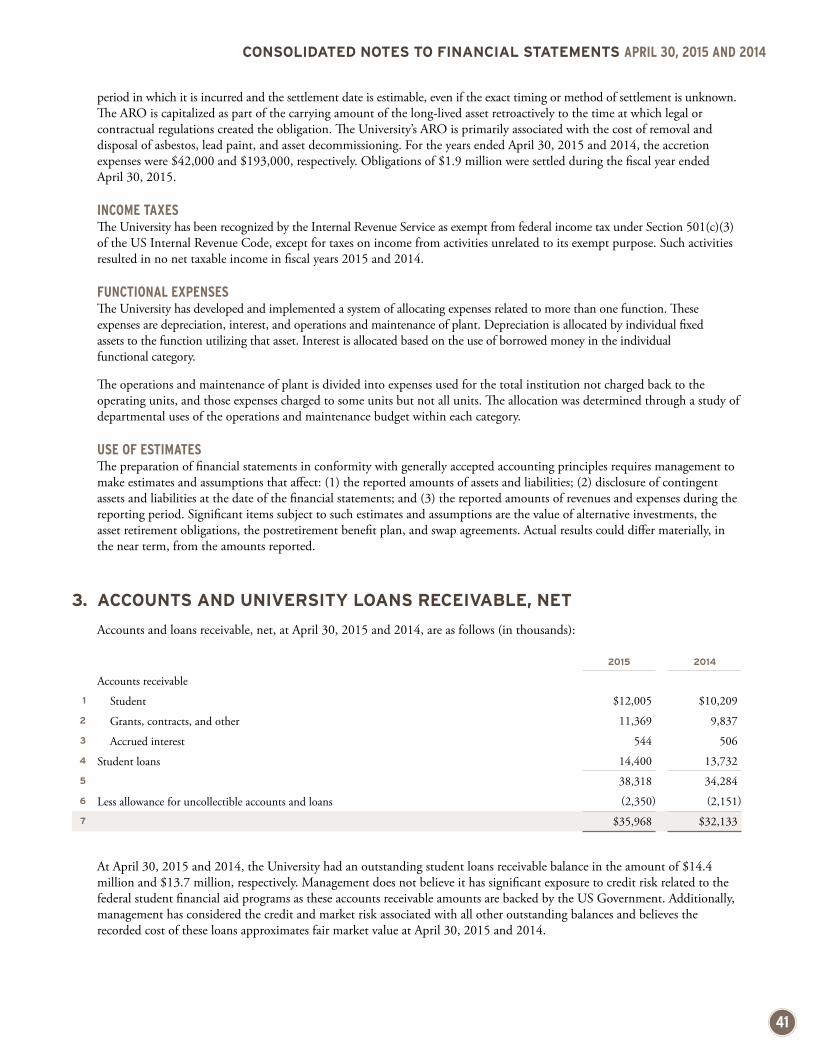
3. ACCOUNTS AND UNIVERSITY LOANS RECEIVABLE, NET
Accounts and loans receivable, net, at April 30, 2015 and 2014, are as follows (in thousands):
2015 2014
Accounts receivable1 Student $12,005 $10,209
2 Grants, contracts, and other 11,369 9,837
3 Accrued interest 544 506
4 Student loans 14,400 13,732
5 38,318 34,284
6 Less allowance for uncollectible accounts and loans (2,350) (2,151)
7 $35,968 $32,133
At April 30, 2015 and 2014, the University had an outstanding student loans receivable balance in the amount of $14.4 million and $13.7 million, respectively. Management does not believe it has significant exposure to credit risk related to the federal student financial aid programs as these accounts receivable amounts are backed by the US Government. Additionally, management has considered the credit and market risk associated with all other outstanding balances and believes the recorded cost of these loans approximates fair market value at April 30, 2015 and 2014.
CONSOLIDATED NOTES TO FINANCIAL STATEMENTS APRIL 30, 2015 AND 2014

42
4. CONTRIBUTIONS RECEIVABLE, NET
As of April 30, 2015 and 2014, unconditional promises to give were as follows (in thousands):
2015 2014
Amounts due in:1 Less than one year $ 8,085 $10,883
2 One year to five years 7,707 6,280 3 Over five years 1,262 745 4 17,054 17,908 5 Less unamortized discount (824) (928)6 Less allowance for doubtful accounts (5,313) (5,145)7 $10,917 $11,835
Contributions receivable over more than one year are discounted at rates ranging from 3.0% to 6.5%. New contributions received during fiscal years 2015 and 2014 were assigned a discount rate that is commensurate with the market and credit risk involved.
As of April 30, 2015 and 2014, the University had also received bequest intentions and conditional promises to give of $31.7 million and $24.5 million, respectively. These intentions to give are not recognized as assets. If the bequests are received, they will generally be restricted for specific purposes stipulated by the donors, primarily endowments for faculty support, scholarships, or general operating support of a particular department of the University. Conditional promises to give are recognized as contributions when the donor-imposed conditions are substantially met.
5. PROPERTY, PLANT, AND EQUIPMENT, NET
Property, plant, and equipment and related accumulated depreciation and amortization at April 30, 2015 and 2014, are as follows (in thousands):
2015 2014
8 Land and improvements $ 57,153 $ 56,779 9 Buildings 710,177 687,751
10 Equipment 122,914 118,821 11 Construction in progress 99,195 28,454
12 Library and art collections 114,318 106,816 13 1,103,757 998,621 14 Less accumulated depreciation and amortization (450,296) (417,883)15 $653,461 $580,738
Construction in progress at April 30, 2015 and 2014, relates to building improvements and renovations.
Capitalized interest for the years ended April 30, 2015 and 2014, was $2.4 million and $1.8 million, respectively.
For the years ended April 30, 2015 and 2014, depreciation expense was approximately $32.4 million and $29.9 million, respectively.
CONSOLIDATED NOTES TO FINANCIAL STATEMENTS APRIL 30, 2015 AND 2014
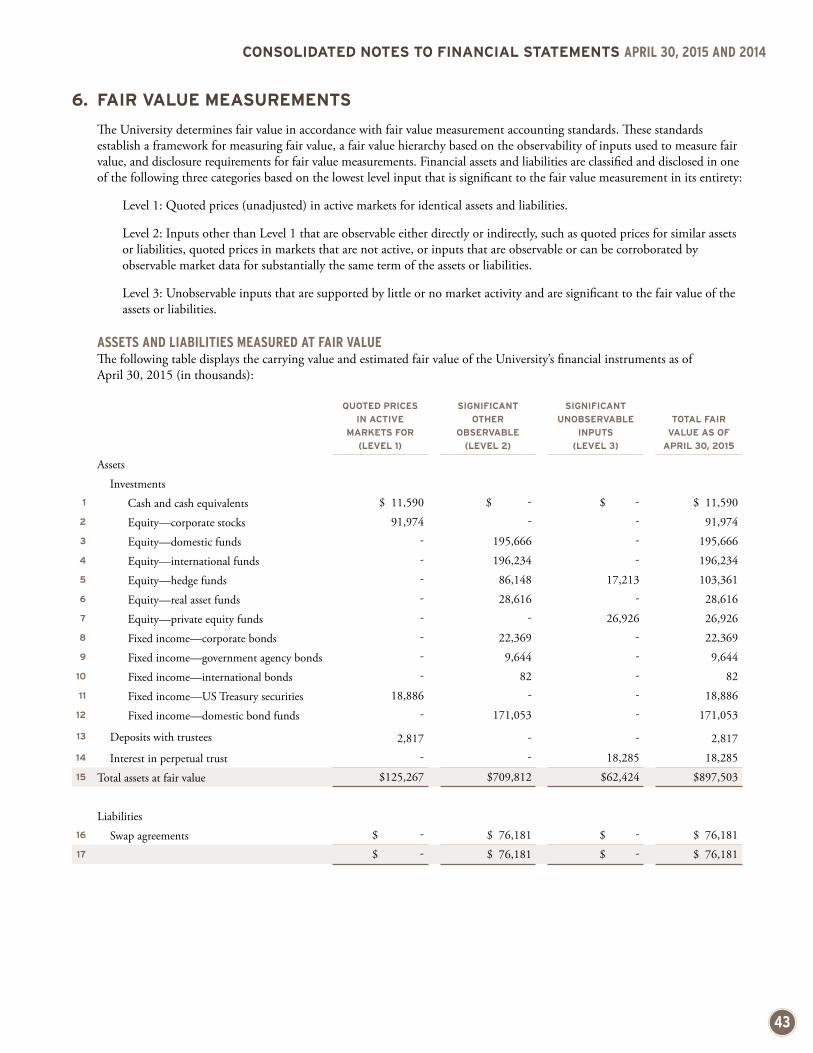
43
CONSOLIDATED NOTES TO FINANCIAL STATEMENTS APRIL 30, 2015 AND 2014
6. FAIR VALUE MEASUREMENTS
The University determines fair value in accordance with fair value measurement accounting standards. These standards establish a framework for measuring fair value, a fair value hierarchy based on the observability of inputs used to measure fair value, and disclosure requirements for fair value measurements. Financial assets and liabilities are classified and disclosed in one of the following three categories based on the lowest level input that is significant to the fair value measurement in its entirety:
Level 1: Quoted prices (unadjusted) in active markets for identical assets and liabilities.
Level 2: Inputs other than Level 1 that are observable either directly or indirectly, such as quoted prices for similar assets or liabilities, quoted prices in markets that are not active, or inputs that are observable or can be corroborated by observable market data for substantially the same term of the assets or liabilities.
Level 3: Unobservable inputs that are supported by little or no market activity and are significant to the fair value of the assets or liabilities.
ASSETS AND LIABILITIES MEASURED AT FAIR VALUE The following table displays the carrying value and estimated fair value of the University’s financial instruments as of April 30, 2015 (in thousands):
QUOTED PRICES IN ACTIVE
MARKETS FOR (LEVEL 1)
SIGNIFICANT OTHER
OBSERVABLE (LEVEL 2)
SIGNIFICANT UNOBSERVABLE
INPUTS (LEVEL 3)
TOTAL FAIR VALUE AS OF
APRIL 30, 2015
Assets
Investments1 Cash and cash equivalents $ 11,590 $ - $ - $ 11,590
2 Equity—corporate stocks 91,974 - - 91,974 3 Equity—domestic funds - 195,666 - 195,666 4 Equity—international funds - 196,234 - 196,234 5 Equity—hedge funds - 86,148 17,213 103,361 6 Equity—real asset funds - 28,616 - 28,616 7 Equity—private equity funds - - 26,926 26,926 8 Fixed income—corporate bonds - 22,369 - 22,369 9 Fixed income—government agency bonds - 9,644 - 9,644
10 Fixed income—international bonds - 82 - 82 11 Fixed income—US Treasury securities 18,886 - - 18,886
12 Fixed income—domestic bond funds - 171,053 - 171,053
13 Deposits with trustees 2,817 - - 2,817 14 Interest in perpetual trust - - 18,285 18,285 15 Total assets at fair value $125,267 $709,812 $62,424 $897,503
Liabilities16 Swap agreements $ - $ 76,181 $ - $ 76,181 17 $ - $ 76,181 $ - $ 76,181

44
CONSOLIDATED NOTES TO FINANCIAL STATEMENTS APRIL 30, 2015 AND 2014
The following table displays the carrying value and estimated fair value of the University’s financial instruments as of April 30, 2014 (in thousands):
QUOTED PRICES IN ACTIVE
MARKETS FOR (LEVEL 1)
SIGNIFICANT OTHER
OBSERVABLE (LEVEL 2)
SIGNIFICANT UNOBSERVABLE
INPUTS (LEVEL 3)
TOTAL FAIR VALUE AS OF
APRIL 30, 2014
Assets
Investments1 Cash and cash equivalents $ 9,100 $ - $ - $ 9,100
2 Equity—corporate stocks 95,809 - - 95,809 3 Equity—domestic funds - 171,599 - 171,599 4 Equity—international funds - 190,648 - 190,648 5 Equity—hedge funds - 78,688 18,434 97,122 6 Equity—real asset funds - 27,778 - 27,778 7 Equity—private equity funds - - 18,472 18,472 8 Fixed income—corporate bonds - 26,028 - 26,028 9 Fixed income—government agency bonds - 10,606 - 10,606
10 Fixed income—international bonds - 23 - 23
11 Fixed income—US Treasury securities 12,023 - - 12,023 12 Fixed income—domestic bond funds - 205,650 - 205,650 13 Deposits with trustees 1,377 - - 1,377 14 Interest in perpetual trust - - 17,826 17,826 15 Total assets at fair value $118,309 $711,020 $54,732 $884,061
Liabilities16 Swap agreements $ - $ 50,436 $ - $ 50,436 17 $ - $ 50,436 $ - $ 50,436
The University determines a valuation estimate based on techniques and processes that have been reviewed for propriety and consistency with consideration given to asset type and investment strategy. In addition, the funds and fund custodians may also use established procedures for determining the fair value of securities that reflect their own assumptions. Management makes best estimates based on information available. The following estimates and assumptions were used to determine the fair value of the financial instruments listed above:
• Cash equivalents—Cash equivalents primarily consist of deposits in money market funds and short-term investments. These are priced using quoted prices in active markets and are classified as Level 1.
• Equity investments—Equity investments consist of, but are not limited to, separate accounts, common trust funds, and hedge funds. These assets consist of both publicly traded and privately held funds.
o Publicly traded securities—These investments consist of domestic and foreign equity holdings. Securities traded on active exchanges are priced using unadjusted market quotes for identical assets and are classified as Level 1. Securities that are traded infrequently or that have comparable traded assets are priced using available quotes and other market data that are observable and are classified as Level 2.
o Privately held funds—These investments consist of domestic, international, hedge, real asset, and private equity funds that are privately held. The valuations of the funds are calculated by the investment managers based on valuation techniques that take into account the market value of the underlying assets to arrive at a net asset value or interest in the fund shares. The funds are commingled funds and limited partnerships and shares may not be readily redeemable. If an active market exists for the fund and shares are redeemable at net asset value, these investments are classified as Level 2.

45
CONSOLIDATED NOTES TO FINANCIAL STATEMENTS APRIL 30, 2015 AND 2014
If no active market exists for these investments and/or there are significant redemption restrictions, they are classified as Level 3. In the absence of readily determinable fair value, fair value of each investment is determined based on a review of the audited financial statements of the underlying funds, when available, and other information from independent third parties, including information provided by the fund managers. Investments in such funds do carry certain risks, including lack of regulatory oversight, interest rate risk, and market risk.
• Fixed-income investments—Fixed-income securities include, but are not limited to, US Treasury issues, US Government Agency issues, corporate debt, and domestic and international bond funds. Fixed-income securities assets are valued using quoted prices in active markets for similar securities and are classified as Level 2. If an active market exists for fixed-income funds and shares are redeemable at net asset value, these investments are classified as Level 2. If no active market exists for these investments and/or there are significant redemption restrictions, they are classified as Level 3.
• Deposits with trustees—Deposits with trustees consist of debt service funds and the unexpended proceeds of certain bonds payable. These funds are invested in short-term, highly liquid securities and will be used for construction of, or payment of debt service on, certain facilities.
• Interest in perpetual trust—Beneficial interest in perpetual trust held by third parties is valued using the fair value of the trust assets. The trust assets are priced using unadjusted market quotes. Based on the terms of the existing agreement, the University must retain the assets in perpetuity. Therefore, they are classified within Level 3.
• Swap agreements—Interest rate swaps are valued using both observable and unobservable inputs, such as quotations received from the counterparty, dealers, or brokers, whenever available and considered reliable. In instances where models are used, the value of the interest rate swap depends upon the contractual terms of, and specific risks inherent in, the instrument as well as the availability and reliability of observable inputs. Such inputs include market prices for reference securities, yield curves, credit curves, measures of volatility, prepayment rates, assumptions for nonperformance risk, and correlations of such inputs. Certain of the interest rate swap arrangements have inputs that can generally be corroborated by market data and are therefore classified within Level 2.
The methods described above may produce a fair value calculation that may not be indicative of net realizable value or reflective of future fair values. Furthermore, while the University believes its valuation methods are appropriate and consistent with other market participants, the use of different methodologies or assumptions to determine the fair value of certain financial instruments could result in a different estimate of fair value at the reporting date.
CHANGES IN LEVEL 3 ASSETS The following table is a roll-forward of the statement of financial position amounts for financial instruments classified by the University within Level 3 of the fair value hierarchy defined above for the years ended April 30, 2015 and 2014 (in thousands):
INVESTMENTS EQUITY—HEDGE
FUNDS
INVESTMENTS EQUITY—PRIVATE EQUITY FUNDS
INTEREST IN PERPETUAL
TRUST TOTAL
1 Beginning balance at May 1, 2014 $18,434 $18,472 $17,826 $54,732
2Total gains or losses (realized/unrealized) included in earnings 568 1,941 459 2,968
Purchases, issuances, sales, and settlements3 Purchases 961 9,298 - 10,259 4 Sales (2,750) (2,785) - (5,535)5 Ending balance at April 30, 2015 $17,213 $26,926 $18,285 $62,424
6
Total gains or losses for the period included in earnings attributable to the change in unrealized gains or losses relating to assets still held at period end $ (189) $ 997 $ 459 $ 1,267

46
CONSOLIDATED NOTES TO FINANCIAL STATEMENTS APRIL 30, 2015 AND 2014
INVESTMENTS EQUITY—HEDGE
FUNDS
INVESTMENTS EQUITY—PRIVATE EQUITY FUNDS
INTEREST IN PERPETUAL
TRUST TOTAL
1 Beginning balance at May 1, 2013 $ 2,159 $12,333 $15,922 $30,414
2Total gains or losses (realized/unrealized) included in earnings 1,382 1,548 1,904 4,834
Purchases, issuances, sales, and settlements3 Purchases 10,000 6,432 - 16,432 4 Sales - (1,841) - (1,841)5 Transfers into Level 3 4,893 - - 4,893 6 Ending balance at April 30, 2014 $18,434 $18,472 $17,826 $54,732
7
Total gains or losses for the period included in earnings attributable to the change in unrealized gains or losses relating to assets still held at period end $ 1,382 $ 1,548 $ 1,904 $ 4,834
Transfers into and out of Level 3 are typically the result of a change in the availability and the ability to observe market data, which is considered a significant valuation input required by various models. Generally, as markets evolve, the data required to support valuations becomes more widely available and observable.
There were no significant transfers between Levels 1 and 2 or between Level 3 for the year ended April 30, 2015.
INVESTMENTS THAT CALCULATE NET ASSET VALUE Investments in certain entities that calculate net asset values at April 30, 2015 and 2014, are as follows (in thousands):
APRIL 30, 2015
FAIR VALUEUNFUNDED
COMMITMENTSREDEMPTION FREQUENCY
REDEMPTION NOTICE PERIOD
8 Domestic equity funds $195,666 $ - daily same day9 International equity funds 196,234 - daily, biweekly same day–5 days
10 Domestic bond funds 171,053 - daily same day11 Real asset funds 28,616 - daily, monthly 1–10 days
12 Hedge funds 103,361 5,039 monthly, annually 30–90 days13 Private equity funds 26,926 38,187 n/a n/a14 Total $721,856 $43,226
APRIL 30, 2014
FAIR VALUEUNFUNDED
COMMITMENTSREDEMPTION FREQUENCY
REDEMPTION NOTICE PERIOD
15 Domestic equity funds $171,599 $ - daily same day16 International equity funds 190,648 - daily, biweekly same day–5 days17 Domestic bond funds 205,650 - daily same day18 Real asset funds 27,778 - daily, monthly 1–10 days19 Hedge funds 97,122 - monthly, annually 30–90 days
20 Private equity funds 18,472 32,033 n/a n/a21 Total $711,269 $32,033

47
CONSOLIDATED NOTES TO FINANCIAL STATEMENTS APRIL 30, 2015 AND 2014
Investments in debt securities and equity securities consist primarily of investments in funds managed by external investment managers.
For the years ended April 30, 2015 and 2014, the University’s investment management fees were approximately $1.4 million and $1.3 million, respectively.
INVESTMENT INCOME Total net investment income for the years ended April 30, 2015 and 2014, consists of the following (in thousands):
2015
UNRESTRICTEDTEMPORARILY RESTRICTED
PERMANENTLY RESTRICTED TOTAL
1 Endowment income $ 9,871 $ 5,662 $ 130 $15,663 2 Investment income 8,080 754 - 8,834 3 Realized and unrealized net capital gains 1,522 5,408 848 7,778 4 Total $19,473 $11,824 $ 978 $32,275
Operating5 Investment income $ 8,080 $ 754 $ - $ 8,834 6 Endowment income 3,293 1,066 7 4,366 7 Allocated from non-operating 6,578 4,596 124 11,298
Non-operating8 Realized and unrealized net capital gains 8,100 10,004 971 19,075 9 Allocation to operations (6,578) (4,596) (124) (11,298)
10 Total $19,473 $11,824 $ 978 $32,275
2014
UNRESTRICTEDTEMPORARILY RESTRICTED
PERMANENTLY RESTRICTED TOTAL
11 Endowment income $ 9,195 $ 5,327 $ 124 $14,646 12 Investment income 5,176 176 - 5,352 13 Realized and unrealized net capital gains 59,723 13,175 2,508 75,406 14 Total $74,094 $18,678 $2,632 $95,404
Operating15 Investment income $ 5,176 $ 176 $ - $ 5,352 16 Endowment income 593 2,168 124 2,885 17 Allocated from non-operating 8,602 3,159 - 11,761
Non-operating18 Realized and unrealized net capital gains 68,325 16,334 2,508 87,167 19 Allocation to operations (8,602) (3,159) - (11,761)
20 Total $74,094 $18,678 $2,632 $95,404

48
7. NOTES PAYABLE AND LONG-TERM DEBT
The University classifies its notes payable and long-term debt into two categories: core debt and special-purpose debt. Core debt represents debt that will be repaid from the general operations of the University and includes borrowings for educational and auxiliary purposes. Special-purpose debt represents debt that is repaid from sources outside of general operations and includes borrowings for buildings, which house some administrative offices, along with rental space.
Notes payable and long-term debt at April 30, 2015 and 2014, consist of the following (in thousands):
2015 2014
Core debt1 District of Columbia University Revenue Bonds, American University
Issue Series 1999 maturing in 2028 $ 21,000 $ 21,0002 District of Columbia University Revenue Bonds, American University
Issue Series 2003 maturing in 2034 37,000 37,0003 District of Columbia University Revenue Bonds, American University
Issue Series 2006 maturing in 2037 99,975 99,9754 District of Columbia University Revenue Bonds, American University
Issue Series 2008 maturing in 2039 60,900 60,900
American University Taxable Bonds
Issue Series 2015 maturing in fiscal year 2045 128,500 - 5 Term loan maturing in 2022 75,000 75,0006 Taxable commercial paper note program - 65,000 7 Total core debt 422,375 358,875
Special-purpose debt8 Note payable due in full in 2022 22,000 22,0009 Note payable due in full in 2020 15,000 15,000
10 Mortgage payable due in full in 2018 22,530 22,801 11 Total special-purpose debt 59,530 59,801
12 Total indebtedness $481,905 $418,676
The principal balance of notes payable and long-term debt outstanding as of April 30, 2015, is due as follows (in thousands):
Year ending April 30:13 2016 $ 285 14 2017 308 15 2018 21,937 16 2019 - 17 2020 - 18 Thereafter 459,375 19 $481,905
Due to the nature of certain variable-rate bond agreements, the University may receive notice of an optional tender on some of its variable-rate bonds. In that event, the University would have an obligation to purchase the tendered bonds if they were unable to be remarketed. The University has entered into a letter of credit agreement with a financial institution to support the 2006 series variable-rate demand obligations, totaling $99.975 million. The letter of credit agreement expires in fiscal year 2018. Under the agreement, the financial institution has agreed to purchase the bonds if the bonds are unable to be
CONSOLIDATED NOTES TO FINANCIAL STATEMENTS APRIL 30, 2015 AND 2014

49
CONSOLIDATED NOTES TO FINANCIAL STATEMENTS APRIL 30, 2015 AND 2014
remarketed. Should that occur, payment would be accelerated and ultimately differ from the dates stated above. In accordance with the terms of the agreement, $99.975 million would convert to a term loan with principal and interest payable over two years. The University has entered into three direct purchase agreements with two financial institutions for its 1999, 2003, and 2008 variable-rate bonds. Under the agreements, the bonds were purchased directly by the banks and cannot be tendered back to the University until the expiration of the agreements in fiscal years 2018 (1999 and 2003 series) and 2020 (2008 series).
The estimated fair value of the University’s notes payable and long-term debt at April 30, 2015 and 2014, was $486.3 million and $422.1 million, respectively. Taxable Commercial Paper, the District of Columbia revenue bonds, and the American University taxable bonds were valued using fair market prices. The Term Loan and Special-Purpose debt were valued using the discounted cash flow method.
As of April 30, 2015, the University was in compliance with all debt covenants.
DISTRICT OF COLUMBIA BONDS PAYABLE In October 2008, the University refunded and reissued the Series 1985 and Series 1985A bonds as Series 2008 variable-rate demand bonds with interest payable weekly. These bonds are general unsecured obligations of the University. The interest rate at April 30, 2015, was 0.12%.
The Series 1999 bonds are general unsecured obligations of the University and bear interest at a variable rate, payable weekly. The proceeds from the bonds were used to repay a mortgage note prior to its scheduled maturity. The interest rate at April 30, 2015, was 0.11%.
The Series 2003 bonds are general unsecured obligations of the University and bear interest at a variable rate, payable weekly. The proceeds were used to fund construction and renovation of Katzen Arts Center and Greenberg Theatre. The interest rate at April 30, 2015, was 0.11%.
The Series 2006 bonds are general unsecured obligations of the University and bear interest at a variable rate, payable weekly. The proceeds were used to advance refund the Series 1996 bond issue, thus reducing the University’s overall interest costs, and to fund construction and renovation projects including Nebraska Hall and the School of International Service building. The interest rate at April 30, 2015, was 0.11%.
On December 23, 2014, the University replaced the existing letter of credit for the 2006 bonds with a new letter of credit from Royal Bank of Canada, expiring in fiscal year 2018. Additionally, on February 2, 2015, the existing letters of credit for the 1999 and 2003 Bonds were replaced with direct purchase agreements from Wells Fargo Bank, N.A., and the existing letter of credit for the 2008 Bond was replaced with a direct purchase agreement from U.S. Bank, N.A, expiring in fiscal years 2018 and 2020, respectively.
AMERICAN UNIVERSITY BONDS PAYABLE In March 2015, the University issued the Series 2015 taxable bonds to fund facilities development projects. The 2015 bonds are general unsecured obligations of the University and bear a fixed 4.32% interest rate, payable semiannually.
TERM LOAN In 2011, the University entered into a $75 million term loan with JPMorgan Chase Bank, N.A., to fund its facilities development projects. The term loan is due in full in June 2021 and has a fixed 4.19% interest rate, payable monthly.
TAXABLE COMMERCIAL PAPER NOTE PROGRAM On December 15, 2011, the University established a $125.0 million taxable commercial paper note program to fund long-term projects for a temporary period until long-term financing is implemented. The notes can be issued for a maximum of 270 days and carry a floating taxable interest rate. As of April 30, 2015, there were no borrowings under the commercial paper note program.
NOTES PAYABLE In 2001, the University issued a $22 million note for the purchase of a building. The note is payable in full in September 2021 and bears an interest rate of LIBOR plus 0.45%, payable monthly. The interest rate at April 30, 2015, was 0.62925%.
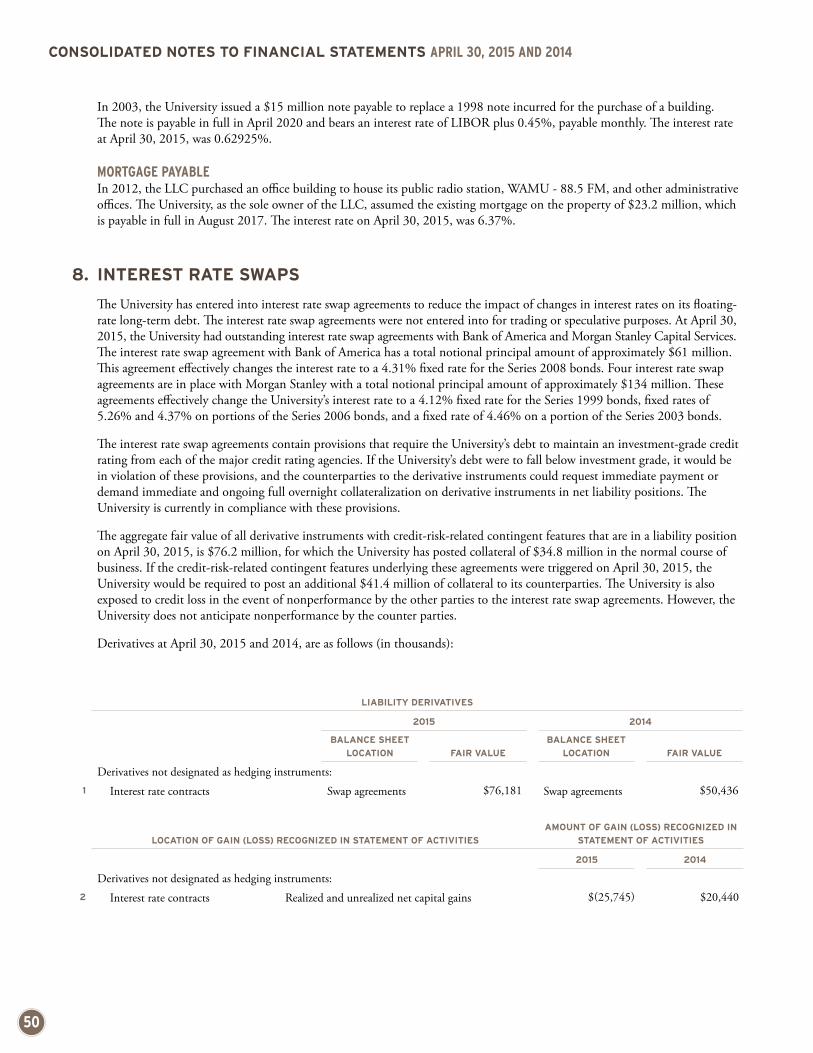
50
In 2003, the University issued a $15 million note payable to replace a 1998 note incurred for the purchase of a building. The note is payable in full in April 2020 and bears an interest rate of LIBOR plus 0.45%, payable monthly. The interest rate at April 30, 2015, was 0.62925%.
MORTGAGE PAYABLE In 2012, the LLC purchased an office building to house its public radio station, WAMU - 88.5 FM, and other administrative offices. The University, as the sole owner of the LLC, assumed the existing mortgage on the property of $23.2 million, which is payable in full in August 2017. The interest rate on April 30, 2015, was 6.37%.
8. INTEREST RATE SWAPS
The University has entered into interest rate swap agreements to reduce the impact of changes in interest rates on its floating- rate long-term debt. The interest rate swap agreements were not entered into for trading or speculative purposes. At April 30, 2015, the University had outstanding interest rate swap agreements with Bank of America and Morgan Stanley Capital Services. The interest rate swap agreement with Bank of America has a total notional principal amount of approximately $61 million. This agreement effectively changes the interest rate to a 4.31% fixed rate for the Series 2008 bonds. Four interest rate swap agreements are in place with Morgan Stanley with a total notional principal amount of approximately $134 million. These agreements effectively change the University’s interest rate to a 4.12% fixed rate for the Series 1999 bonds, fixed rates of 5.26% and 4.37% on portions of the Series 2006 bonds, and a fixed rate of 4.46% on a portion of the Series 2003 bonds.
The interest rate swap agreements contain provisions that require the University’s debt to maintain an investment-grade credit rating from each of the major credit rating agencies. If the University’s debt were to fall below investment grade, it would be in violation of these provisions, and the counterparties to the derivative instruments could request immediate payment or demand immediate and ongoing full overnight collateralization on derivative instruments in net liability positions. The University is currently in compliance with these provisions.
The aggregate fair value of all derivative instruments with credit-risk-related contingent features that are in a liability position on April 30, 2015, is $76.2 million, for which the University has posted collateral of $34.8 million in the normal course of business. If the credit-risk-related contingent features underlying these agreements were triggered on April 30, 2015, the University would be required to post an additional $41.4 million of collateral to its counterparties. The University is also exposed to credit loss in the event of nonperformance by the other parties to the interest rate swap agreements. However, the University does not anticipate nonperformance by the counter parties.
Derivatives at April 30, 2015 and 2014, are as follows (in thousands):
LIABILITY DERIVATIVES
2015 2014
BALANCE SHEET LOCATION FAIR VALUE
BALANCE SHEET LOCATION FAIR VALUE
Derivatives not designated as hedging instruments:1 Interest rate contracts Swap agreements $76,181 Swap agreements $50,436
LOCATION OF GAIN (LOSS) RECOGNIZED IN STATEMENT OF ACTIVITIESAMOUNT OF GAIN (LOSS) RECOGNIZED IN
STATEMENT OF ACTIVITIES
2015 2014
Derivatives not designated as hedging instruments:2 Interest rate contracts Realized and unrealized net capital gains $(25,745) $20,440
CONSOLIDATED NOTES TO FINANCIAL STATEMENTS APRIL 30, 2015 AND 2014

51
CONSOLIDATED NOTES TO FINANCIAL STATEMENTS APRIL 30, 2015 AND 2014
9. ENDOWMENTS
The University’s endowment consists of approximately 450 individual funds established for scholarships and related academic activities. Its endowment includes both donor-restricted endowment funds and funds designated by the Board of Trustees to function as endowments. As required by generally accepted accounting principles, net assets associated with endowment funds, including funds designated by the Board of Trustees to function as endowments, are classified and reported based on the existence or absence of donor-imposed restrictions.
PERMANENTLY RESTRICTED NET ASSETS—INTERPRETATION OF RELEVANT LAW The Board of Trustees has interpreted the District of Columbia enacted version of Uniform Prudent Management of Institutional Funds Act (UPMIFA) as requiring the preservation of the fair value of the original gift as of the gift date of the donor-restricted endowment funds absent explicit donor stipulations to the contrary. As a result of this interpretation, the University classifies as permanently restricted net assets: (a) the original value of gifts to the permanent endowment, (b) the original value of subsequent gifts to the permanent endowment, and (c) accumulations to the permanent endowment made in accordance with the direction of the applicable donor gift instrument at the time the accumulation is added to the fund. The remaining portion of the donor- restricted endowment fund not classified in permanently restricted net assets is classified as temporarily restricted net assets until purpose and timing restrictions are met and amounts are appropriated for expenditure by the Board of Trustees of the University in a manner consistent with the standard of prudence prescribed by UPMIFA.
In accordance with UPMIFA, the University considers the following factors in making a determination to appropriate or accumulate donor-restricted endowment funds:
(1) The duration and preservation of the fund
(2) The purposes of the University and the donor-restricted endowment fund
(3) General economic conditions
(4) The possible effect of inflation and deflation
(5) The expected total return from income and the appreciation of investments
(6) Other resources of the University
(7) The investment policies of the University
The endowment net assets composition by type of fund at April 30, 2015, is as follows (in thousands):
UNRESTRICTEDTEMPORARILY RESTRICTED
PERMANENTLY RESTRICTED TOTAL
1 Donor-restricted endowment funds $ - $90,854 $96,102 $186,956 2 Board-designated endowment funds 402,930 - - 402,930
3 Total endowment funds $402,930 $90,854 $96,102 $589,886

52
CONSOLIDATED NOTES TO FINANCIAL STATEMENTS APRIL 30, 2015 AND 2014
The changes in endowment net assets for the year ended April 30, 2015, is as follows (in thousands):
UNRESTRICTEDTEMPORARILY RESTRICTED
PERMANENTLY RESTRICTED TOTAL
1 Endowment net assets, May 1, 2014 $370,606 $85,446 $90,078 $546,130
Investment return:2 Net depreciation on investments 25,901 10,003 723 36,627 3 Interest, dividends, and capital distributions 3,288 1,846 - 5,134 4 Total investment return 29,189 11,849 723 41,761
5 Contributions to endowment 323 - 5,301 5,624
6Appropriation of endowment assets for expenditure (9,846) (6,441) - (16,287)
Other changes:
7Transfers to create board-designated endowment funds 12,658 - - 12,658
8Transfers to remove board-designated endowment funds - - - -
9 Endowment net assets, April 30, 2015 $402,930 $90,854 $96,102 $589,886
The endowment net assets composition by type of fund at April 30, 2014, is as follows (in thousands):
UNRESTRICTEDTEMPORARILY RESTRICTED
PERMANENTLY RESTRICTED TOTAL
10 Donor-restricted endowment funds $ - $85,446 $90,078 $175,524 11 Board-designated endowment funds 370,606 - - 370,606
12 Total endowment funds $370,606 $85,446 $90,078 $546,130
The changes in endowment net assets for the year ended April 30, 2014, are as follows (in thousands):
UNRESTRICTEDTEMPORARILY RESTRICTED
PERMANENTLY RESTRICTED TOTAL
13 Endowment net assets, May 1, 2013 $327,562 $72,271 $85,099 $484,932
Investment return:14 Net appreciation on investments 39,546 16,277 2,557 58,380 15 Interest, dividends, and capital distributions 582 2,425 - 3,007 16 Total investment return 40,128 18,702 2,557 61,387 17 Contributions to endowment - - 2,422 2,422
18Appropriation of endowment assets for expenditure (9,171) (5,527) - (14,698)
Other changes:
19Transfers to create board-designated endowment funds 12,087 - - 12,087
20 Endowment net assets, April 30, 2014 $370,606 $85,446 $90,078 $546,130
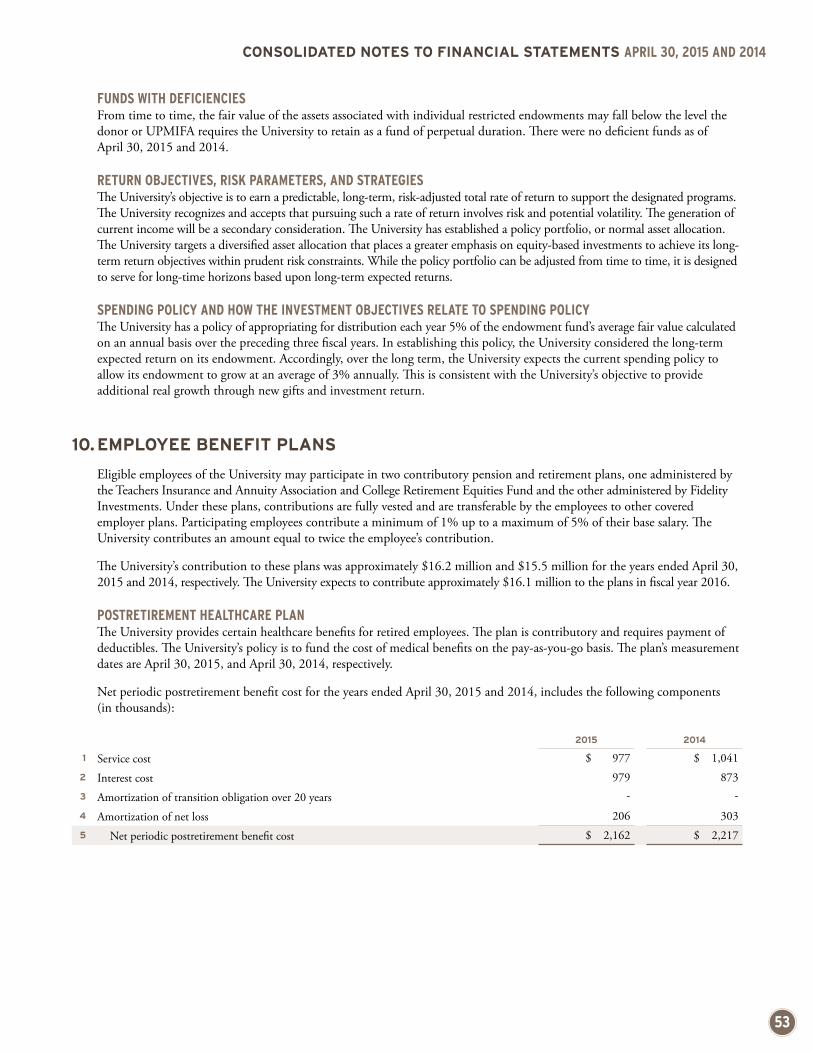
53
CONSOLIDATED NOTES TO FINANCIAL STATEMENTS APRIL 30, 2015 AND 2014
FUNDS WITH DEFICIENCIES From time to time, the fair value of the assets associated with individual restricted endowments may fall below the level the donor or UPMIFA requires the University to retain as a fund of perpetual duration. There were no deficient funds as of April 30, 2015 and 2014.
RETURN OBJECTIVES, RISK PARAMETERS, AND STRATEGIES The University’s objective is to earn a predictable, long-term, risk-adjusted total rate of return to support the designated programs. The University recognizes and accepts that pursuing such a rate of return involves risk and potential volatility. The generation of current income will be a secondary consideration. The University has established a policy portfolio, or normal asset allocation. The University targets a diversified asset allocation that places a greater emphasis on equity-based investments to achieve its long- term return objectives within prudent risk constraints. While the policy portfolio can be adjusted from time to time, it is designed to serve for long-time horizons based upon long-term expected returns.
SPENDING POLICY AND HOW THE INVESTMENT OBJECTIVES RELATE TO SPENDING POLICY The University has a policy of appropriating for distribution each year 5% of the endowment fund’s average fair value calculated on an annual basis over the preceding three fiscal years. In establishing this policy, the University considered the long-term expected return on its endowment. Accordingly, over the long term, the University expects the current spending policy to allow its endowment to grow at an average of 3% annually. This is consistent with the University’s objective to provide additional real growth through new gifts and investment return.
10. EMPLOYEE BENEFIT PLANS
Eligible employees of the University may participate in two contributory pension and retirement plans, one administered by the Teachers Insurance and Annuity Association and College Retirement Equities Fund and the other administered by Fidelity Investments. Under these plans, contributions are fully vested and are transferable by the employees to other covered employer plans. Participating employees contribute a minimum of 1% up to a maximum of 5% of their base salary. The University contributes an amount equal to twice the employee’s contribution.
The University’s contribution to these plans was approximately $16.2 million and $15.5 million for the years ended April 30, 2015 and 2014, respectively. The University expects to contribute approximately $16.1 million to the plans in fiscal year 2016.
POSTRETIREMENT HEALTHCARE PLAN The University provides certain healthcare benefits for retired employees. The plan is contributory and requires payment of deductibles. The University’s policy is to fund the cost of medical benefits on the pay-as-you-go basis. The plan’s measurement dates are April 30, 2015, and April 30, 2014, respectively.
Net periodic postretirement benefit cost for the years ended April 30, 2015 and 2014, includes the following components (in thousands):
2015 2014
1 Service cost $ 977 $ 1,041 2 Interest cost 979 873 3 Amortization of transition obligation over 20 years - - 4 Amortization of net loss 206 303 5 Net periodic postretirement benefit cost $ 2,162 $ 2,217
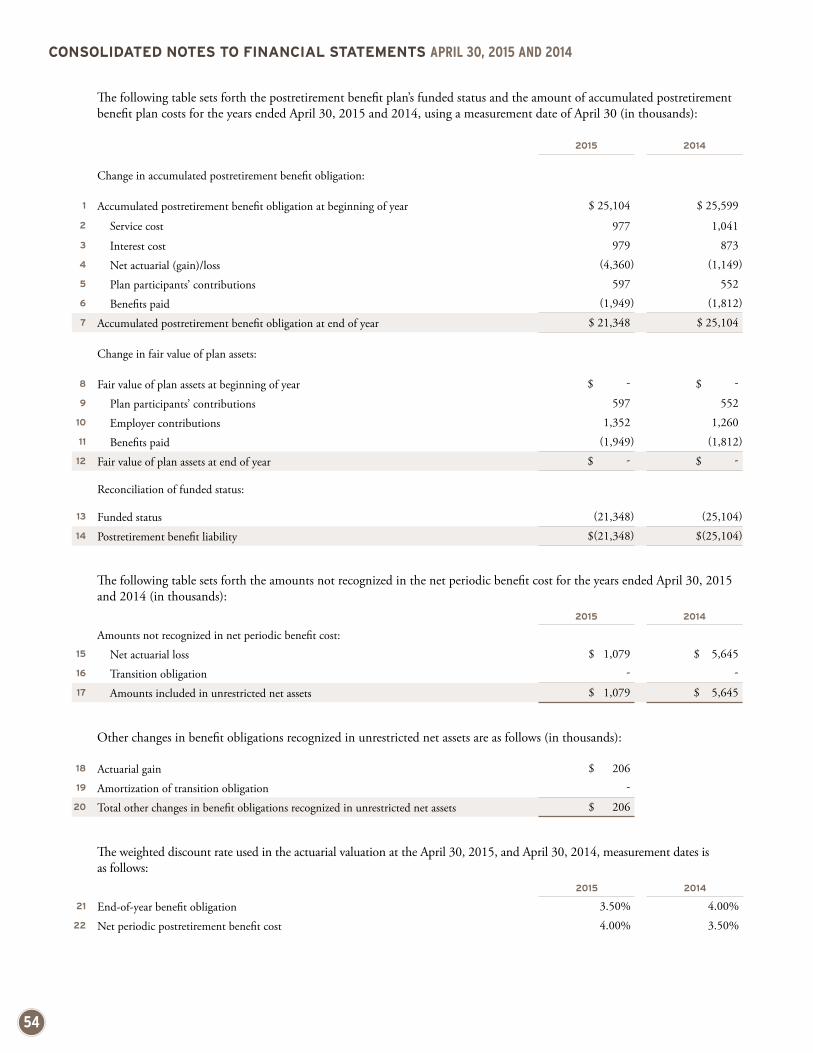
54
The following table sets forth the postretirement benefit plan’s funded status and the amount of accumulated postretirement benefit plan costs for the years ended April 30, 2015 and 2014, using a measurement date of April 30 (in thousands):
2015 2014
Change in accumulated postretirement benefit obligation:
1 Accumulated postretirement benefit obligation at beginning of year $ 25,104 $ 25,599
2 Service cost 977 1,041 3 Interest cost 979 873 4 Net actuarial (gain)/loss (4,360) (1,149)5 Plan participants’ contributions 597 552 6 Benefits paid (1,949) (1,812)7 Accumulated postretirement benefit obligation at end of year $ 21,348 $ 25,104
Change in fair value of plan assets:
8 Fair value of plan assets at beginning of year $ - $ - 9 Plan participants’ contributions 597 552
10 Employer contributions 1,352 1,260 11 Benefits paid (1,949) (1,812)
12 Fair value of plan assets at end of year $ - $ -
Reconciliation of funded status:
13 Funded status (21,348) (25,104)14 Postretirement benefit liability $(21,348) $(25,104)
The following table sets forth the amounts not recognized in the net periodic benefit cost for the years ended April 30, 2015 and 2014 (in thousands):
2015 2014
Amounts not recognized in net periodic benefit cost:15 Net actuarial loss $ 1,079 $ 5,645 16 Transition obligation - - 17 Amounts included in unrestricted net assets $ 1,079 $ 5,645
Other changes in benefit obligations recognized in unrestricted net assets are as follows (in thousands):
18 Actuarial gain $ 20619 Amortization of transition obligation -
20 Total other changes in benefit obligations recognized in unrestricted net assets $ 206
The weighted discount rate used in the actuarial valuation at the April 30, 2015, and April 30, 2014, measurement dates is as follows:
2015 2014
21 End-of-year benefit obligation 3.50% 4.00%22 Net periodic postretirement benefit cost 4.00% 3.50%
CONSOLIDATED NOTES TO FINANCIAL STATEMENTS APRIL 30, 2015 AND 2014

55
CONSOLIDATED NOTES TO FINANCIAL STATEMENTS APRIL 30, 2015 AND 2014
A 7% healthcare cost trend rate was assumed for fiscal year 2015, with the rate in the following fiscal years assumed to be 6.5%, 6.0%, 5.5%, 5.2%, and 5.1% until reaching an ultimate rate of 5% in fiscal year 2021 and thereafter. An increase in the assumed healthcare cost trend rate of 1% would increase the aggregate of the service and interest cost by approximately $236,000 and $242,000 for 2015 and 2014, respectively, and the accumulated postretirement benefit obligation at April 30, 2015 and 2014, by approximately $992,000 and $1,561,000, respectively. A decrease in the assumed healthcare cost trend rate of 1% would decrease the net periodic postretirement benefit cost by approximately $197,000 and $200,000 for 2015 and 2014, respectively, and the accumulated postretirement benefit obligations at April 30, 2015 and 2014, by approximately $864,000 and $1,335,000, respectively.
The expected contributions by the University to the plan are as follows:
YEAR ENDING APRIL 30
PAYMENT WITH MEDICARE
PART D SUBSIDY
PAYMENT WITHOUT
MEDICARE PART D SUBSIDY
MEDICARE PART D SUBSIDY
RECEIPTS
1 2016 $1,221,125 $1,361,791 $140,666 2 2017 1,243,153 1,397,228 154,075 3 2018 1,267,951 1,439,062 171,111 4 2019 1,270,632 1,452,055 181,423 5 2020 1,471,186 1,471,186 - 6 2021–2025 7,326,928 7,326,928 -
SPECIAL TERMINATION BENEFITS During fiscal year 2015, the University offered a one-time voluntary retirement incentive opportunity for faculty members who met certain criteria. The cost of providing the one-time voluntary retirement incentive program for the fiscal year ended April 30, 2015, was $2.5 million.
11. EXPENSES
For the years ended April 30, 2015 and 2014, the University’s program services and supporting services were as follows (in thousands):
2015 2014
Program services7 Instruction $ 163,494 $151,689 8 Research 52,479 49,907 9 Public service 25,499 24,181
10 Academic support 56,258 61,982 11 Student services 43,604 42,186
12 Total program services 341,334 329,945
Supporting services13 Institutional support14 Auxiliary enterprises 90,220 89,164 15 59,809 55,924
$ 491,363 $475,033
For the years ended April 30, 2015 and 2014, the University’s fundraising expenses totaled approximately $19.2 million and $18.1 million, respectively. The expenses are included in institutional support in the accompanying statements of activities.

56
CONSOLIDATED NOTES TO FINANCIAL STATEMENTS APRIL 30, 2015 AND 2014
12. NET ASSETS
Temporarily restricted net assets consist of the following at April 30, 2015 and 2014 (in thousands):
2015 2014
1Unspent contributions and related investment income for instruction and faculty support $102,891 $ 97,009
2 Gifts received for construction of facilities 5,095 6,047 3 $107,986 $103,056
Permanently restricted net assets were held, the income of which will benefit the following at April 30, 2015 and 2014 (in thousands):
2015 2014
4Permanent endowment funds, for scholarships and related academic activity $ 80,238 $ 74,795
5 Interest in trust assets 18,285 17,827 6 Student loans 6,835 6,585 7 $105,358 $ 99,207
13. OPERATING LEASES
The University leases office space and buildings used for student housing with terms ranging from 3 to 10 years. The leases for student housing and office space do not expire until 2018. Additionally, the University leases radio station space that does not expire until 2020. Minimum lease payments under these agreements are as follows (in thousands):
Year ending April 30:8 2016 $2,138 9 2017 1,135
10 2018 302 11 2019 9
12 2020 4 13 Thereafter - 14 $3,588
Rent expense in 2015 and 2014 was approximately $3.3 million and $4.9 million, respectively.
14. COMMITMENTS AND CONTINGENCIES
At April 30, 2015 and 2014, commitments of the University under contracts for construction of plant facilities amounted to approximately $129.3 million and $97.0 million, respectively. Subsequent to April 30, 2015, the University entered into commitments with various investment fund managers totaling $17.9 million.
Amounts received and expended by the University under various federal programs are subject to audit by governmental agencies. In the opinion of the University’s administration, audit adjustments, if any, will not have a significant effect on the financial position, changes in net assets, or cash flows of the University.
The University is a party to various litigations, arising out of the normal conduct of its operations. In the opinion of the University’s administration, the ultimate resolution of these matters will not have a materially adverse effect on the University’s financial position, changes in net assets, or cash flows.
57
15. RELATED PARTIES
Members of the University’s Board of Trustees and their related entities contributed approximately $742,000 and $1.3 million during the years ended April 30, 2015 and 2014, respectively, which is included in contribution revenue in the accompanying statements of operations. Also for the years ended April 30, 2015 and 2014, approximately $4.4 million and $4.7 million, respectively, were included in contribution receivable in the accompanying balance sheets.
16. SUBSEQUENT EVENTS
The University has performed an evaluation of subsequent events through August 28, 2015, which is the date the financial statements were issued. Nothing was noted that affects the financial statements as of April 30, 2015.
CONSOLIDATED NOTES TO FINANCIAL STATEMENTS APRIL 30, 2015 AND 2014

58
NONDISCRIMINATION NOTICE American University is an equal opportunity, affirmative action institution that operates in compliance with applicable laws and regulations. The university prohibits discrimination and discriminatory harassment (including sexual harassment and sexual violence) against any AU community member on the basis of race, color, national origin, religion, sex (including pregnancy), age, sexual orientation, disability, marital status, personal appearance, gender identity and expression, family responsibilities, political affiliation, source of income, veteran status, an individual’s genetic information, or any other bases under federal or local laws (collectively “Protected Bases”). For information, contact the dean of students ([email protected]), assistant vice president of human resources ([email protected]), or dean of academic affairs ([email protected]); write American University, 4400 Massachusetts Avenue NW, Washington, DC 20016; or call 202-885-1000.
PRODUCED BY UNIVERSITY PUBLICATIONS, AMERICAN UNIVERSITY
ASSISTANT VICE PRESIDENT FOR CREATIVE SERVICESKevin Grasty
ASSOCIATE DIRECTOR FOR CONTENT STRATEGYLaura Garner
EDITOR AND PROJECT MANAGERAmy Burroughs
GRAPHIC DESIGNER AND ART DIRECTORRena Münster
PHOTOGRAPHERJeff Watts
WRITERSKatlin ChadwickAli Kahn
Mike UngerGarfinkel and Associates
CONTRIBUTORSRebecca BasuAbbey BeckerTraci CrockettHelen DodsonEricka FloydCaitlin FriessLaura HerringPatty HousmanDiane HsiungLee Ivory
J. Paul JohnsonAlexa Maria KellyAnita KondoyanidiTeresa LarkinMelissa McKeownRavi RamanGregg SangilloRobert Van HoekPaula Warrick
ADDITIONAL IMAGESCover, Stephanie Dalton Cowanp. 8, Darren Milligan, Smithsonian Center for Learning and Digital Access, 2014, Indie Arcade, Smithsonian American Art Museump. 17 (top right), Shmulik Almany p. 21 (top right), Jeff Beckerp. 23 (top right), Alan Bushnell
For information regarding the accreditation and state licensing of American University, please visit american.edu/academics. UP16-004

