coventry partnership household survey 2013. contents background and methodology sample profile...
TRANSCRIPT

Coventry Partnership
Household Survey 2013

Contents
• Background and methodology• Sample profile• Survey results:
– Equalities and communities– Housing and environment– Community safety– Health and well-being– Work and training– 10 ways to feeling good and doing well

Background
• BMG Research was commissioned to undertake the 2013 Household Survey
• The survey provides an overview of quality of life and well being across the city
• It also provides tracking across previous years, with minor amends to questions in 2013
• Fieldwork between February and March 2013
Methodology
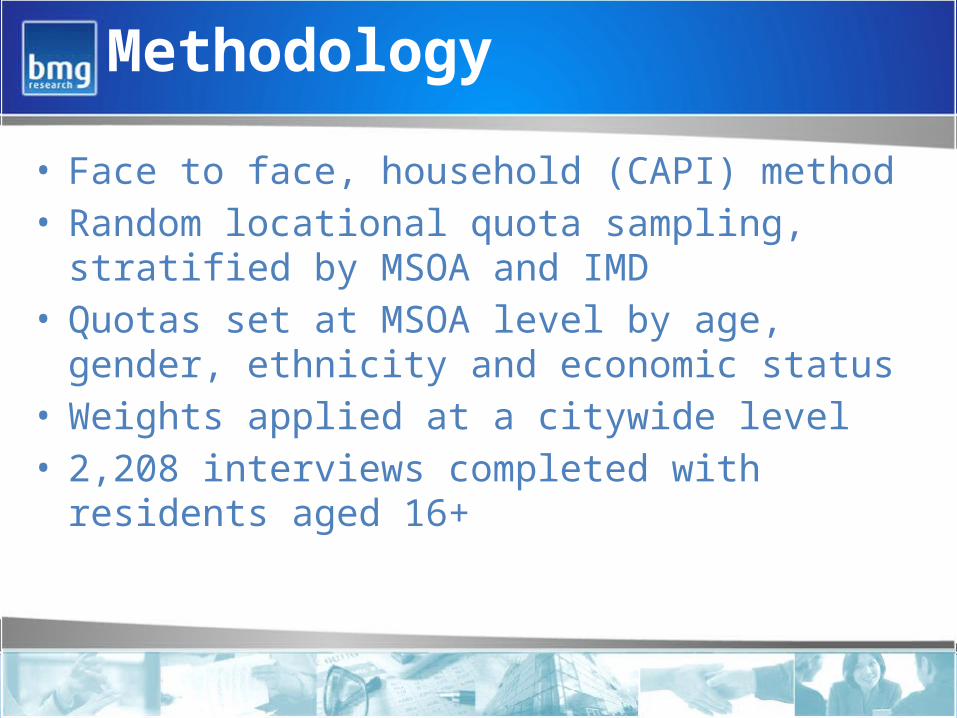
• Face to face, household (CAPI) method• Random locational quota sampling, stratified by
MSOA and IMD• Quotas set at MSOA level by age, gender, ethnicity
and economic status• Weights applied at a citywide level• 2,208 interviews completed with residents aged 16+
This report…
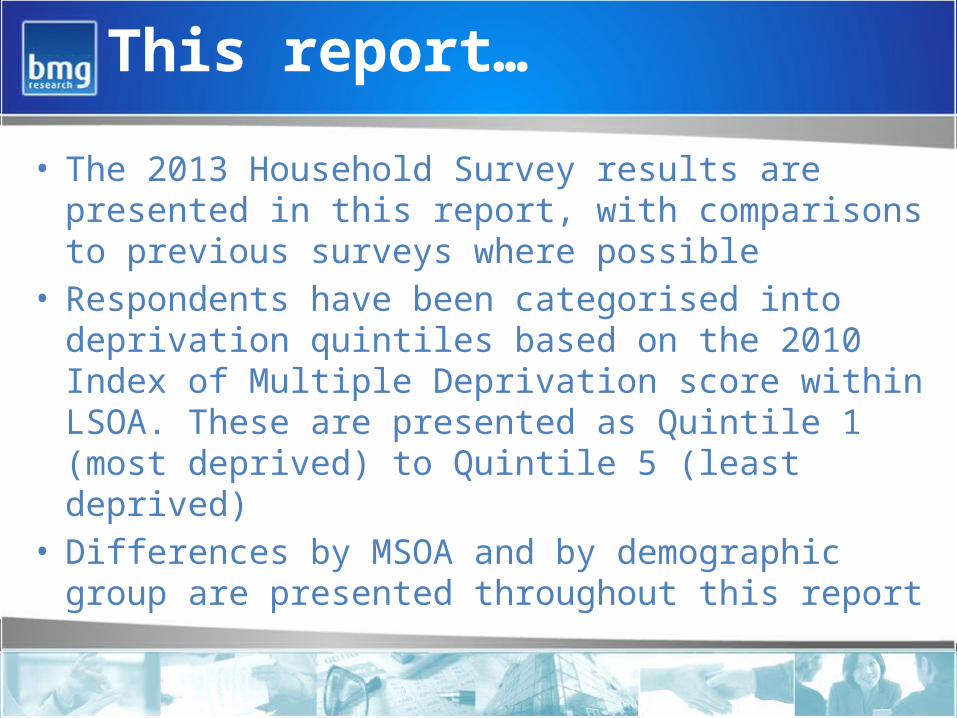
• The 2013 Household Survey results are presented in this report, with comparisons to previous surveys where possible
• Respondents have been categorised into deprivation quintiles based on the 2010 Index of Multiple Deprivation score within LSOA. These are presented as Quintile 1 (most deprived) to Quintile 5 (least deprived)
• Differences by MSOA and by demographic group are presented throughout this report
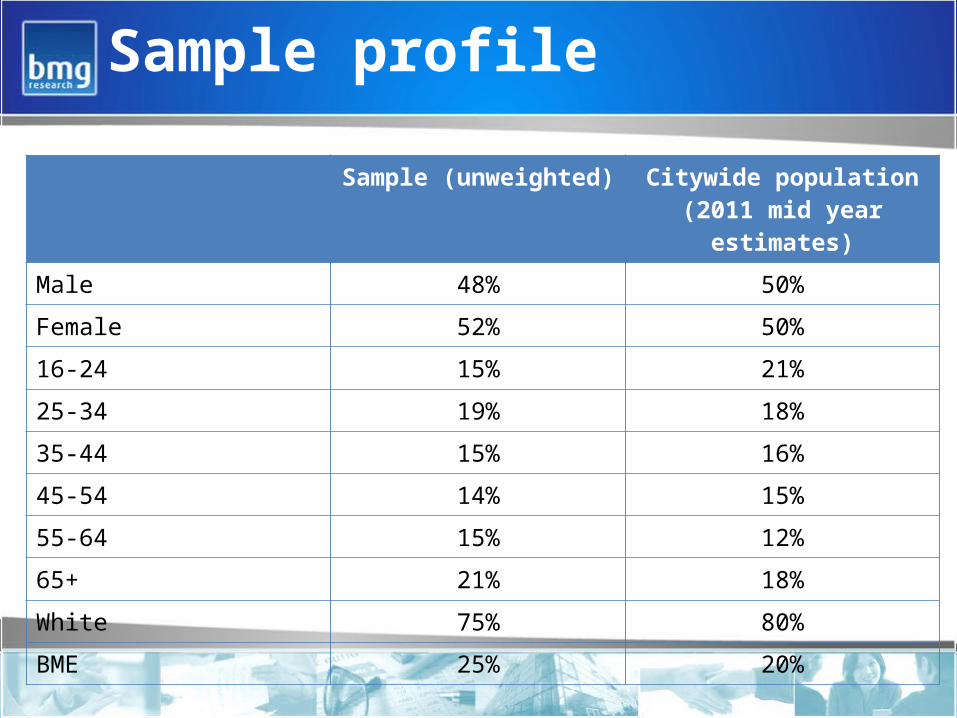
Sample profile
Sample (unweighted) Citywide population (2011 mid year estimates)
Male 48% 50%
Female 52% 50%
16-24 15% 21%
25-34 19% 18%
35-44 15% 16%
45-54 14% 15%
55-64 15% 12%
65+ 21% 18%
White 75% 80%
BME 25% 20%

Equalities and Communities
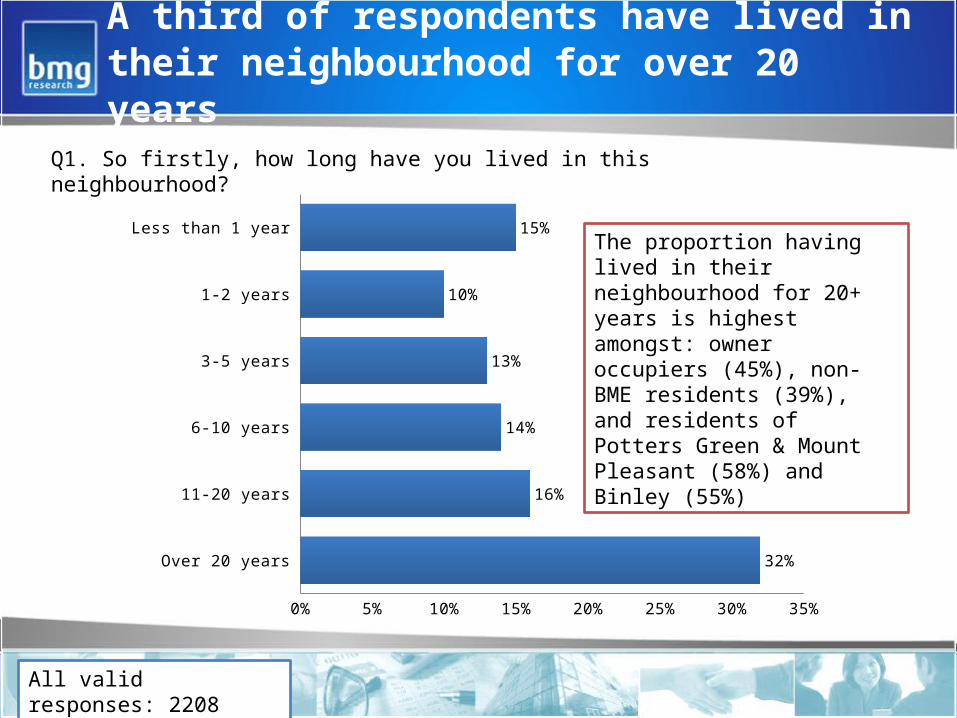
A third of respondents have lived in their neighbourhood for over 20 years
Less than 1 year
1-2 years
3-5 years
6-10 years
11-20 years
Over 20 years
0% 5% 10% 15% 20% 25% 30% 35%
15%
10%
13%
14%
16%
32%
All valid responses: 2208
Q1. So firstly, how long have you lived in this neighbourhood?
The proportion having lived in their neighbourhood for 20+ years is highest amongst: owner occupiers (45%), non-BME residents (39%), and residents of Potters Green & Mount Pleasant (58%) and Binley (55%)

What do you like MOST about the neighbourhood where you live?

What do you like MOST about the neighbourhood where you live?
Quiet /peaceful areaFriendly people
Close to amenities/ convenientNice area/ location
Close to/ good educational establishmentsClose to shops
Nice neighboursNear to green / open spaces
Close to town/city centreSafe
Close to family / friendsGood transport links
Home/ born hereIt's alright/ not too badNo trouble/ low crime
Close to workOther
NothingDon't know
0% 5% 10% 15% 20% 25% 30% 35% 40%
34%11%
9%7%
5%4%4%4%4%
3%2%2%2%2%
1%1%
3%10%
2%
All respondents: 2208
Top mentions in 2012:- Quiet/peaceful area = 40%- Friendly people = 10%- Close to shops = 6%- Close to amenities = 6%
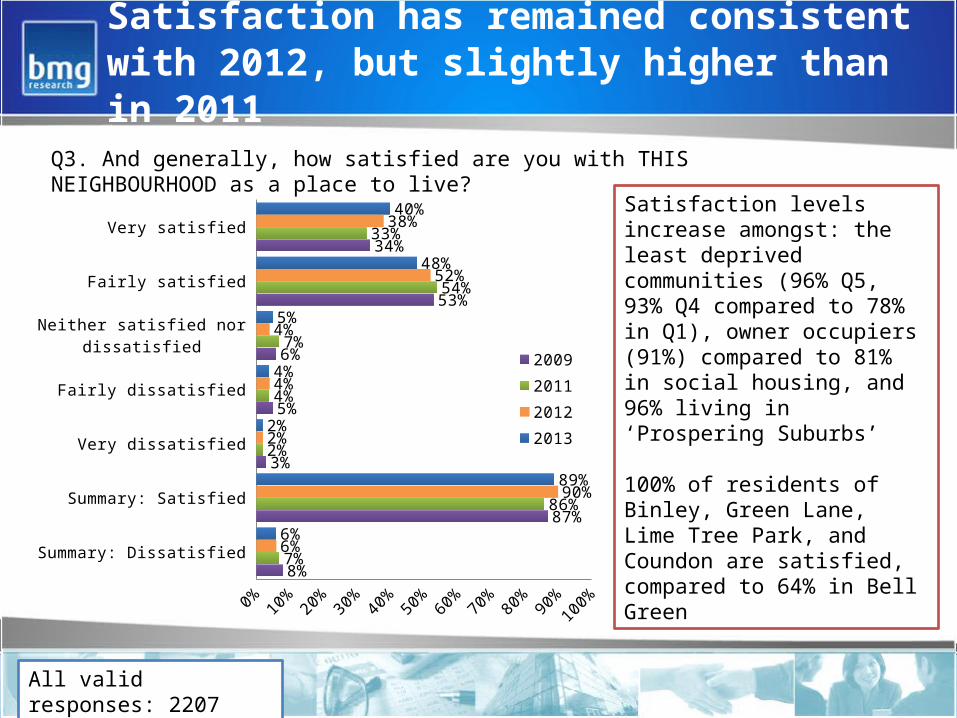
Satisfaction has remained consistent with 2012, but slightly higher than in 2011
Very satisfied
Fairly satisfied
Neither satisfied nor dissatisfied
Fairly dissatisfied
Very dissatisfied
Summary: Satisfied
Summary: Dissatisfied
0% 10% 20% 30% 40% 50% 60% 70% 80% 90% 100%
40%
48%
5%
4%
2%
89%
6%
38%
52%
4%
4%
2%
90%
6%
33%
54%
7%
4%
2%
86%
7%
34%
53%
6%
5%
3%
87%
8%
2009
2011
2012
2013
All valid responses: 2207
Q3. And generally, how satisfied are you with THIS NEIGHBOURHOOD as a place to live?
Satisfaction levels increase amongst: the least deprived communities (96% Q5, 93% Q4 compared to 78% in Q1), owner occupiers (91%) compared to 81% in social housing, and 96% living in ‘Prospering Suburbs’
100% of residents of Binley, Green Lane, Lime Tree Park, and Coundon are satisfied, compared to 64% in Bell Green

Three quarters of residents are satisfied with the quality of parks and open spaces
Very satisfied
Fairly satisfied
Neither satisfied nor dissatisfied
Fairly dissatisfied
Very dissatisfied
Summary: Satisfied
Summary: Dissatisfied
0% 10% 20% 30% 40% 50% 60% 70% 80% 90%
28%
47%
12%
10%
3%
75%
13%
31%
46%
8%
9%
5%
77%
14%
2012
2013
All valid responses: 2072
Q15/1. And now thinking about the environment, how satisfied are you with the quality of parks & open spaces (how well they are maintained and looked after)
99% of residents in Finham, South Cheylesmore are satisfied with parks, as are 96% in Earlsdon, Beechwood, and 96% in Longford Village Just 36% in Wyken Green are satisfied

The large majority of residents are satisfied with access to parks and open spaces
Very satisfied
Fairly satisfied
Neither satisfied nor dissatisfied
Fairly dissatisfied
Very dissatisfied
Summary: Satisfied
Summary: Dissatisfied
0% 10% 20% 30% 40% 50% 60% 70% 80% 90%
31%
50%
11%
7%
1%
81%
8%
34%
48%
8%
6%
4%
82%
10%
2012
2013
All valid responses: 2092
Q15/1. And now thinking about the environment, how satisfied are you with the access to parks and open spaces (how easy they are to get to and use)?
100% of residents in Finham, Cheylesmore and in Longford Village are satisfied with access to parks. This drops to 40% in Wyken Green

Fewer residents feel their quality of life has got worse in the last 2 years compared to in 2012
Improved
Stayed the same
Got worse
0% 10% 20% 30% 40% 50% 60% 70% 80%
13%
70%
17%
12%
68%
20%
15%
66%
19%
13%
65%
22%
2009
2011
2012
2013
All valid responses: 1960
Q4. What is your overall perception of how quality of life in this neighbourhood has changed over the last 2 years?
22% of residents in the most deprived quintile feel their quality of life has got worse, compared to 13% in Q5. This is also the case for residents aged 55 to 64, and those living in Courtaulds, Edgwick (45%) and Bell Green (42%)
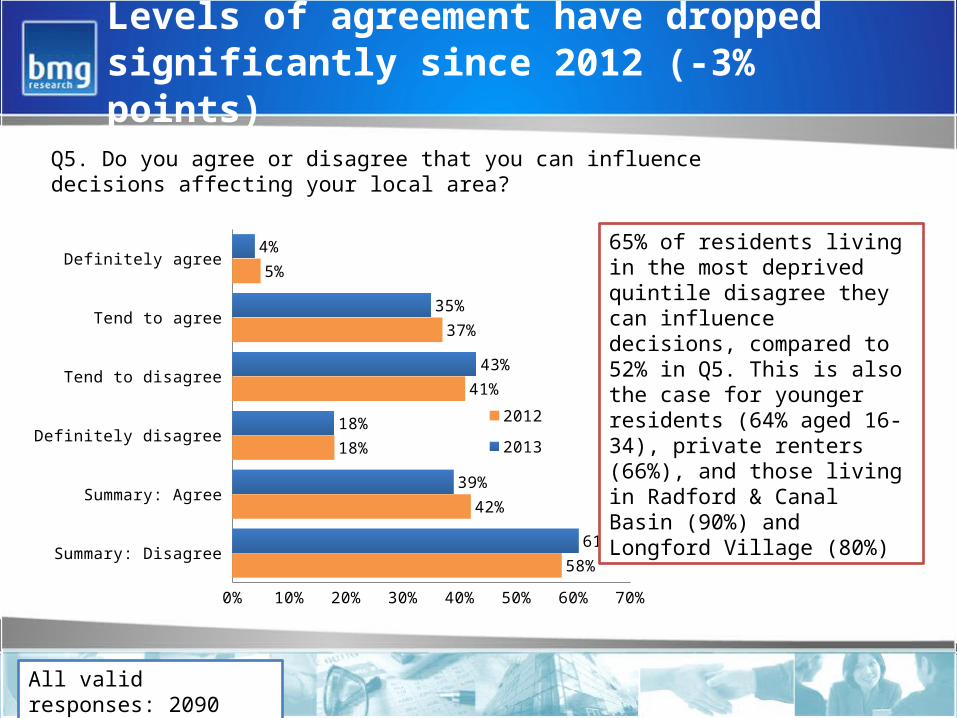
Levels of agreement have dropped significantly since 2012 (-3% points)
Definitely agree
Tend to agree
Tend to disagree
Definitely disagree
Summary: Agree
Summary: Disagree
0% 10% 20% 30% 40% 50% 60% 70%
4%
35%
43%
18%
39%
61%
5%
37%
41%
18%
42%
58%
2012
2013
All valid responses: 2090
Q5. Do you agree or disagree that you can influence decisions affecting your local area?
65% of residents living in the most deprived quintile disagree they can influence decisions, compared to 52% in Q5. This is also the case for younger residents (64% aged 16-34), private renters (66%), and those living in Radford & Canal Basin (90%) and Longford Village (80%)
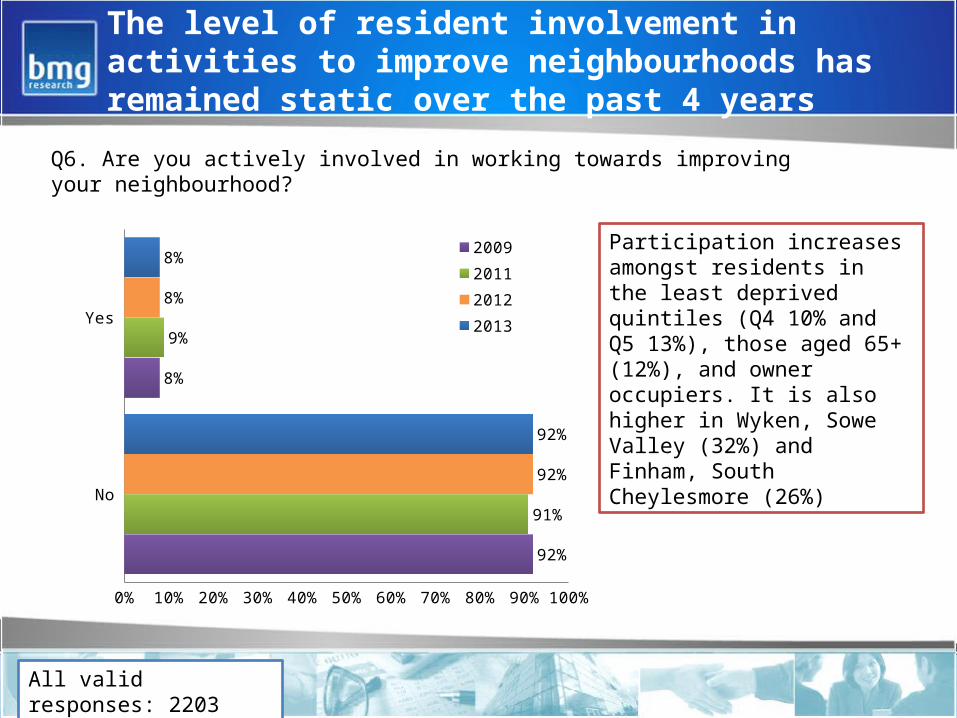
The level of resident involvement in activities to improve neighbourhoods has remained static over the past 4 years
Yes
No
0% 10% 20% 30% 40% 50% 60% 70% 80% 90% 100%
8%
92%
8%
92%
9%
91%
8%
92%
2009
2011
2012
2013
All valid responses: 2203
Q6. Are you actively involved in working towards improving your neighbourhood?
Participation increases amongst residents in the least deprived quintiles (Q4 10% and Q5 13%), those aged 65+ (12%), and owner occupiers. It is also higher in Wyken, Sowe Valley (32%) and Finham, South Cheylesmore (26%)

The large majority of residents feel people in their neighbourhood of different backgrounds get on well together
Definitely agree
Tend to agree
Tend to disagree
Definitely disagree
Summary: Agree
Summary: Disagree
0% 10% 20% 30% 40% 50% 60% 70% 80% 90% 100%
38%
57%
4%
1%
95%
5%
41%
53%
4%
2%
94%
6%
33%
60%
5%
2%
92%
8%
43%
51%
5%
2%
90%
6%
2009
2011
2012
2013
All valid responses: 2103
Q7. To what extent do you agree or disagree that this neighbourhood is a place where people from different backgrounds get on well together?
13% of residents in Tile Hill and in Courtaulds, Edgwick disagree that people get on together. Levels of disagreement are also high in the most deprived areas (9%)
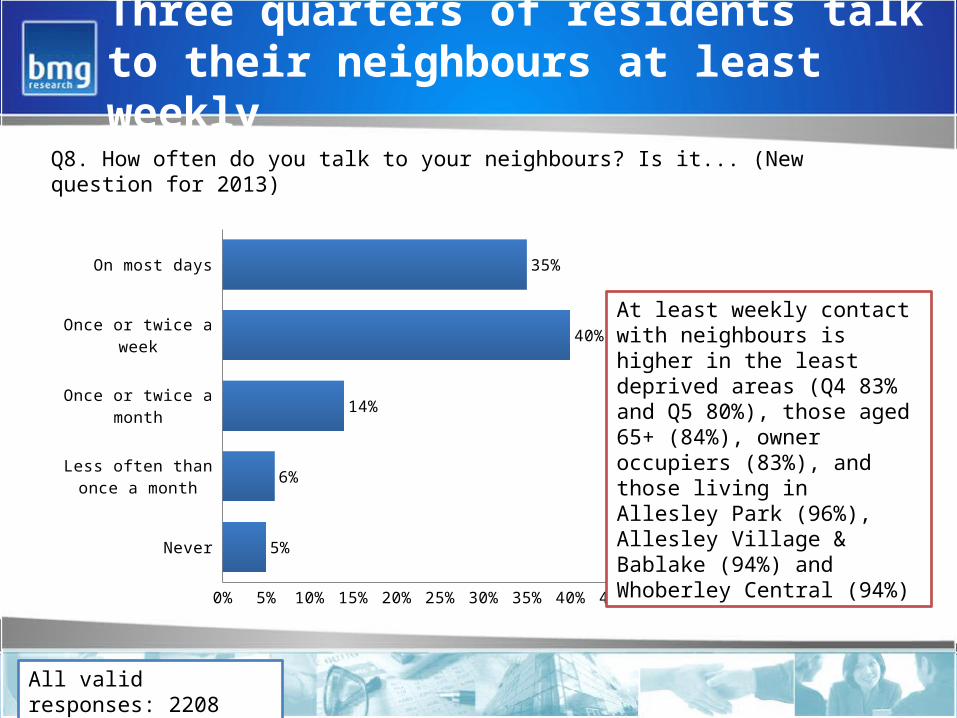
Three quarters of residents talk to their neighbours at least weekly
On most days
Once or twice a week
Once or twice a month
Less often than once a month
Never
0% 5% 10% 15% 20% 25% 30% 35% 40% 45%
35%
40%
14%
6%
5%
All valid responses: 2208
Q8. How often do you talk to your neighbours? Is it... (New question for 2013)
At least weekly contact with neighbours is higher in the least deprived areas (Q4 83% and Q5 80%), those aged 65+ (84%), owner occupiers (83%), and those living in Allesley Park (96%), Allesley Village & Bablake (94%) and Whoberley Central (94%)

There has been an increase in residents saying they meet friends and relatives who don’t live with them on most days
On most days
Once or twice a week
Once or twice a month
Less often than once a month
Never
0% 10% 20% 30% 40% 50% 60%
49%
39%
8%
3%
1%
38%
47%
10%
4%
1%
2012
2013
All valid responses: 2208
Q9. Whether at home or elsewhere, how often do you meet friends or relatives who are not living with you?
61% of residents in the most deprived quintile meet friends and relatives on most days, as do 54% of females and 56% of those in social housing.
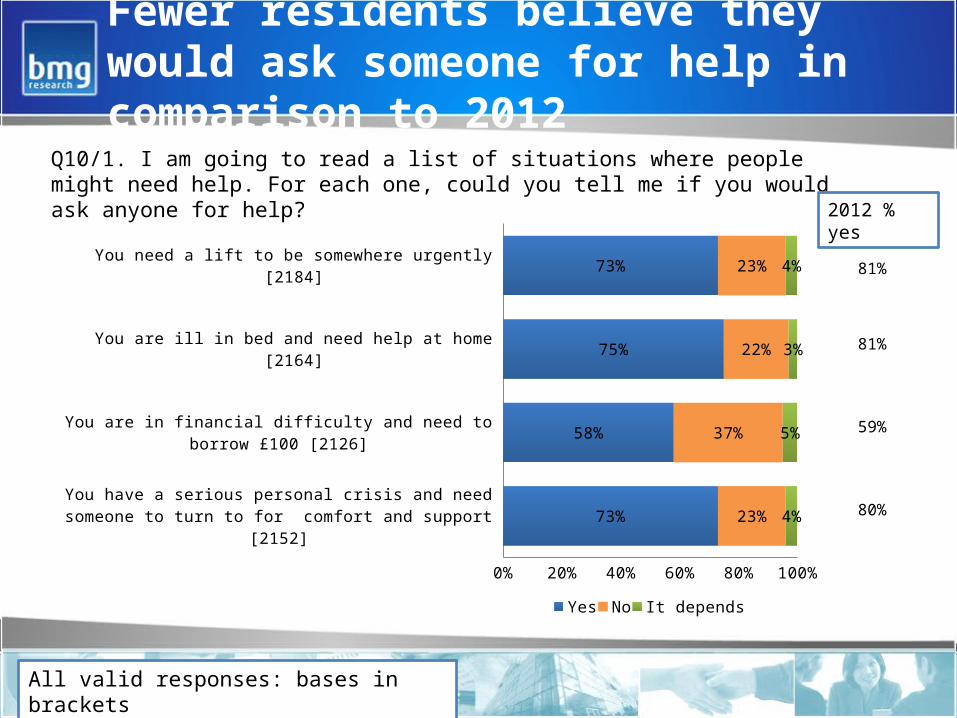
Fewer residents believe they would ask someone for help in comparison to 2012
You need a lift to be somewhere urgently [2184]
You are ill in bed and need help at home [2164]
You are in financial difficulty and need to borrow £100 [2126]
You have a serious personal crisis and need someone to turn to for comfort and support [2152]
0% 10% 20% 30% 40% 50% 60% 70% 80% 90%100%
73%
75%
58%
73%
23%
22%
37%
23%
4%
3%
5%
4%
Yes No It depends
All valid responses: bases in brackets
Q10/1. I am going to read a list of situations where people might need help. For each one, could you tell me if you would ask anyone for help?
2012 % yes
81%
81%
59%
80%

Almost half of residents are very satisfied with their personal relationships
Very satisfied
Fairly satisfied
Neither satisfied nor dissatisfied
Fairly dissatisfied
Very dissatisfied
Summary: Satisfied
Summary: Dissatisfied
0% 10% 20% 30% 40% 50% 60% 70% 80% 90% 100%
47%
44%
9%
1%
<0.5%
91%
1%
All valid responses: 2192
Q11. All things considered how satisfied are you with your personal relationships? (New question for 2013)
Satisfaction with personal relationships varies from 84% in the most deprived quintile to 93% in the least deprived. Levels also drop amongst the unemployed but economically active (80%).
Just 43% of residents in Wood End, Henley and Manor Farm and 55% in Upper Foleshill are satisfied.
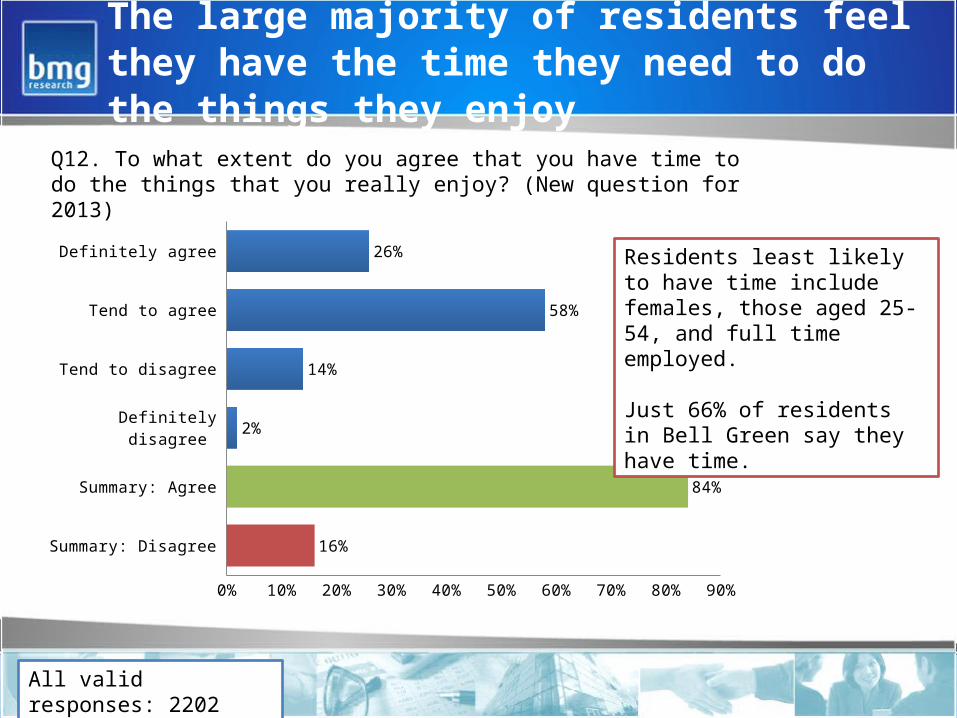
The large majority of residents feel they have the time they need to do the things they enjoy
Definitely agree
Tend to agree
Tend to disagree
Definitely disagree
Summary: Agree
Summary: Disagree
0% 10% 20% 30% 40% 50% 60% 70% 80% 90%
26%
58%
14%
2%
84%
16%
All valid responses: 2202
Q12. To what extent do you agree that you have time to do the things that you really enjoy? (New question for 2013)
Residents least likely to have time include females, those aged 25-54, and full time employed.
Just 66% of residents in Bell Green say they have time.
Housing and environment
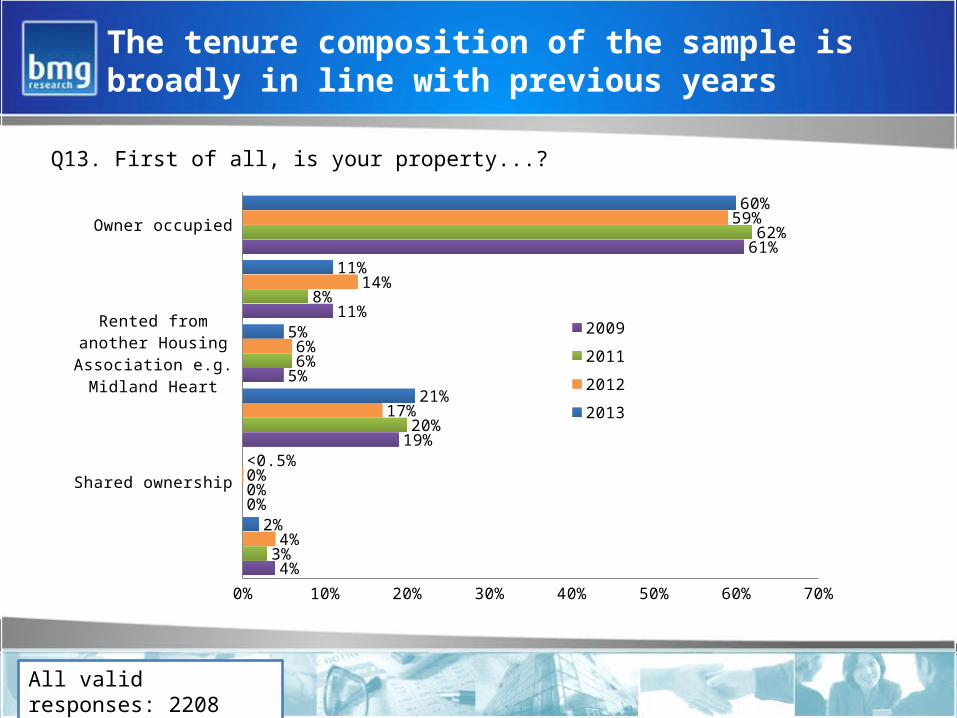
The tenure composition of the sample is broadly in line with previous years
Owner occupied
Rented from Whitefriars
Rented from another Housing Association e.g. Midland Heart
Rented from private landlord
Shared ownership
Other
0% 10% 20% 30% 40% 50% 60% 70%
60%
11%
5%
21%
<0.5%
2%
59%
14%
6%
17%
0%
4%
62%
8%
6%
20%
0%
3%
61%
11%
5%
19%
0%
4%
2009
2011
2012
2013
All valid responses: 2208
Q13. First of all, is your property...?
Fewer residents are very satisfied with their home compared to in 2012 (-4% points)
Very satisfied
Fairly satisfied
Neither satisfied nor dissatisfied
Fairly dissatisfied
Very dissatisfied
Summary: Satisfied
Summary: Dissatisfied
0% 10% 20% 30% 40% 50% 60% 70% 80% 90% 100%
48%
43%
4%
4%
2%
90%
6%
52%
40%
3%
4%
2%
92%
6%
44%
48%
5%
3%
1%
91%
4%
48%
42%
4%
4%
2%
90%
6%
2009
2011
2012
2013
All valid responses: 2207
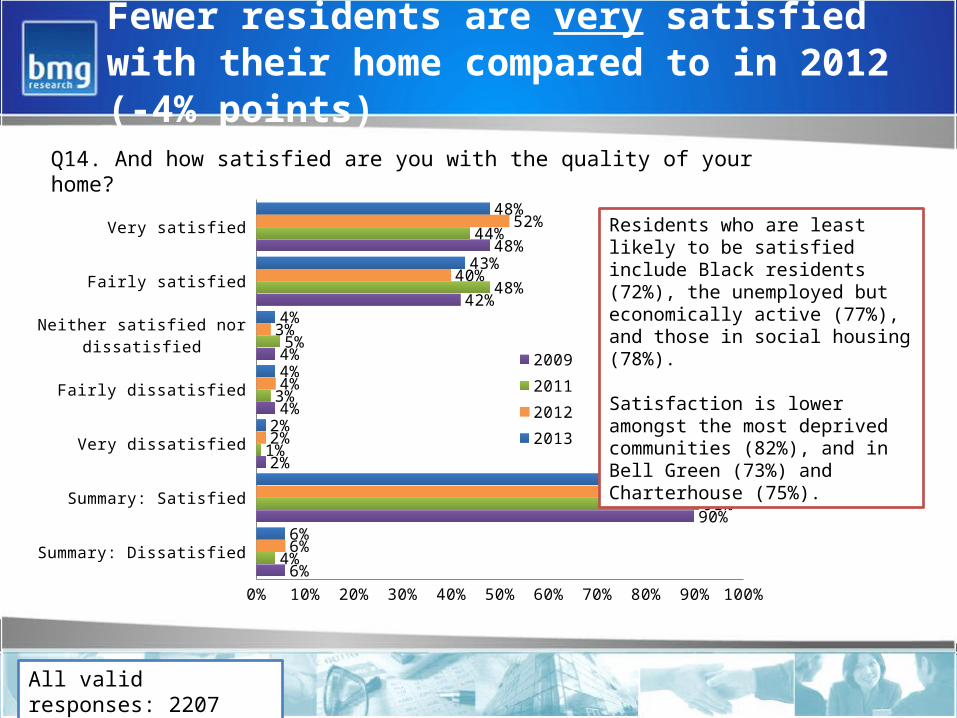
Q14. And how satisfied are you with the quality of your home?
Residents who are least likely to be satisfied include Black residents (72%), the unemployed but economically active (77%), and those in social housing (78%).
Satisfaction is lower amongst the most deprived communities (82%), and in Bell Green (73%) and Charterhouse (75%).
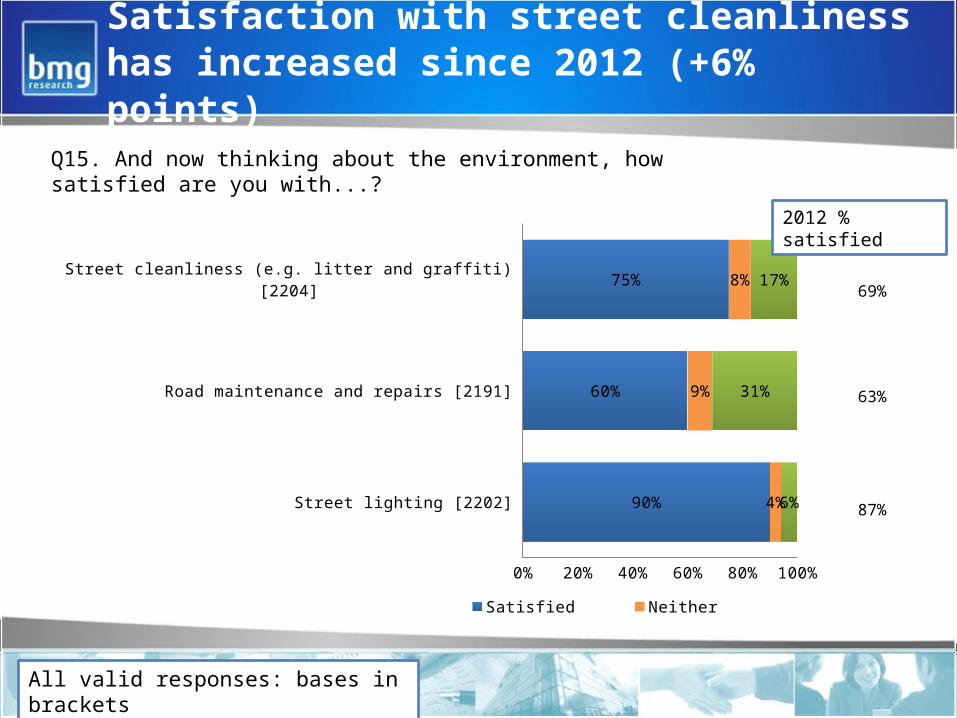
Satisfaction with street cleanliness has increased since 2012 (+6% points)
All valid responses: bases in brackets
Q15. And now thinking about the environment, how satisfied are you with...?
Street cleanliness (e.g. litter and graffiti) [2204]
Road maintenance and repairs [2191]
Street lighting [2202]
0% 10% 20% 30% 40% 50% 60% 70% 80% 90% 100%
75%
60%
90%
8%
9%
4%
17%
31%
6%
Satisfied Neither Dissatisfied
2012 % satisfied
69%
63%
87%
MSOA variations
• Satisfaction with street cleanliness varies from 42% in Courtaulds, Edgwick to 98% in Finham, South Cheylesmore
• Just 35% of residents in Binley and 38% in Cheylesmore, Quinton are satisfied with road maintenance and repairs. This compares to 85% in Lower Eastern Green

Community safety
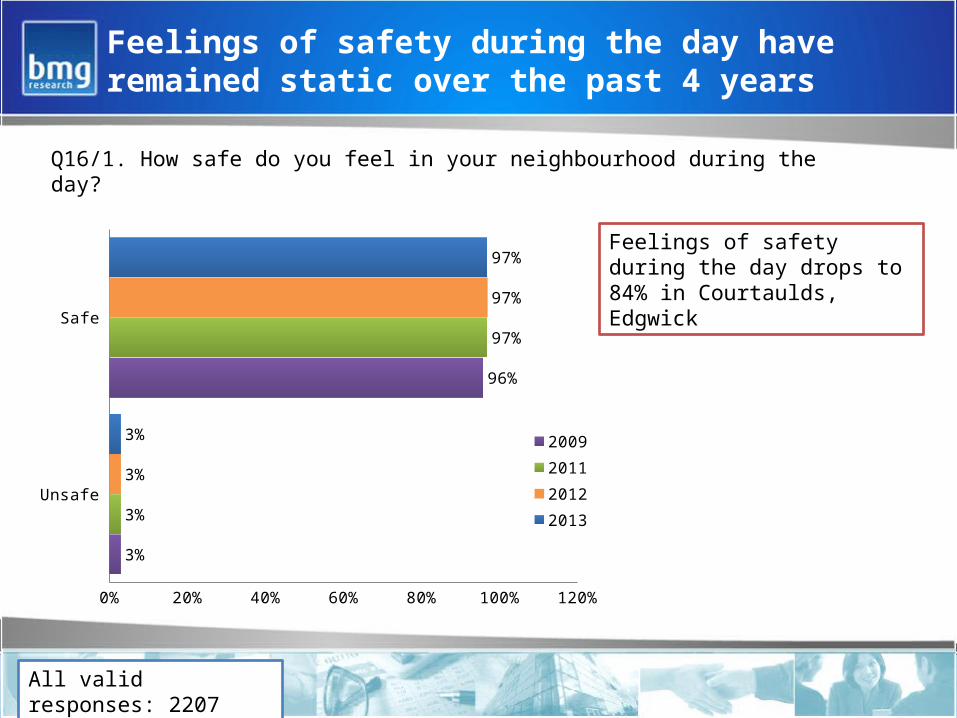
Feelings of safety during the day have remained static over the past 4 years
Safe
Unsafe
0% 20% 40% 60% 80% 100% 120%
97%
3%
97%
3%
97%
3%
96%
3%
2009
2011
2012
2013
All valid responses: 2207
Q16/1. How safe do you feel in your neighbourhood during the day?
Feelings of safety during the day drops to 84% in Courtaulds, Edgwick

Feelings of safety at night have continued to increase over time
Very safe
Fairly safe
A bit unsafe
Very unsafe
Summary: Safe
Summary: Unsafe
0% 10% 20% 30% 40% 50% 60% 70% 80% 90%
37%
44%
14%
5%
81%
19%
40%
40%
15%
5%
80%
20%
28%
51%
15%
6%
79%
21%
25%
50%
19%
6%
75%
25%
2009
2011
2012
2013
All valid responses: 2172
Q16/2. How safe do you feel in your neighbourhood at night?
Feelings of safety at night are lowest amongst females (76%), BMEs (78%), Asians (74%), and those in social housing (76%).
Levels also drop in Courtaulds, Edgwick (54%) and Stoke Park & New Century Business Park (54%)
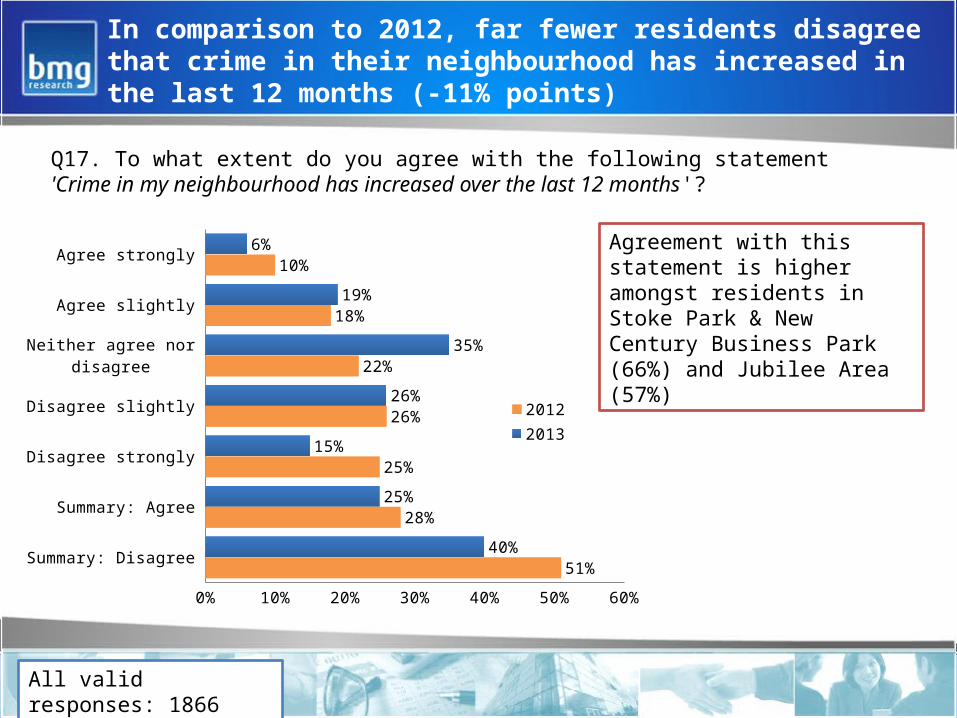
In comparison to 2012, far fewer residents disagree that crime in their neighbourhood has increased in the last 12 months (-11% points)
Agree strongly
Agree slightly
Neither agree nor disagree
Disagree slightly
Disagree strongly
Summary: Agree
Summary: Disagree
0% 10% 20% 30% 40% 50% 60%
6%
19%
35%
26%
15%
25%
40%
10%
18%
22%
26%
25%
28%
51%
20122013
All valid responses: 1866
Q17. To what extent do you agree with the following statement 'Crime in my neighbourhood has increased over the last 12 months'?
Agreement with this statement is higher amongst residents in Stoke Park & New Century Business Park (66%) and Jubilee Area (57%)

Health and well-being
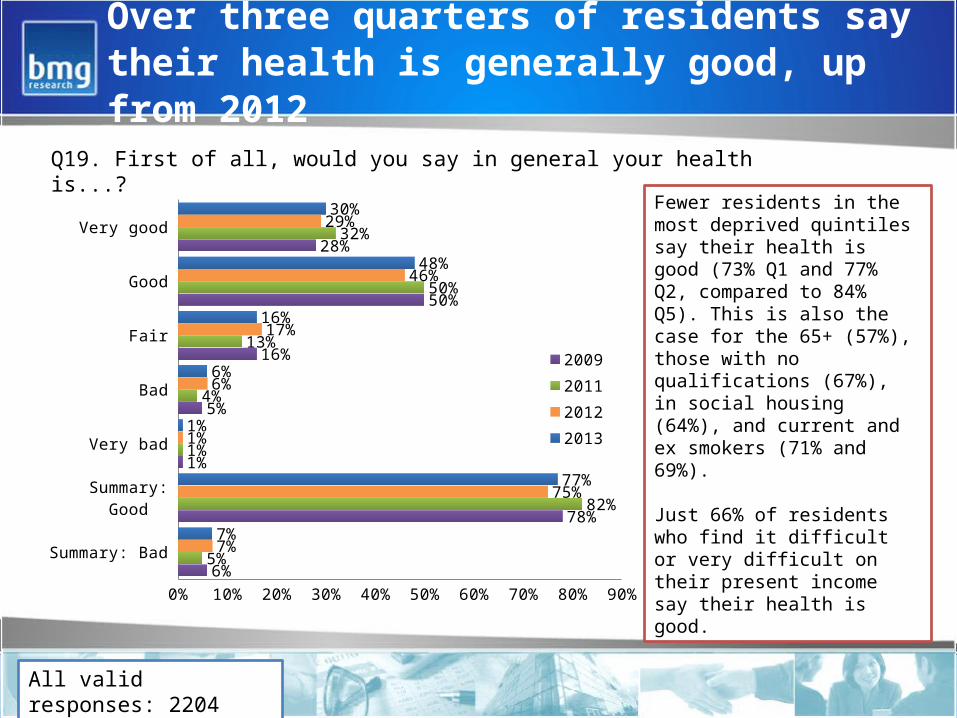
Over three quarters of residents say their health is generally good, up from 2012
Very good
Good
Fair
Bad
Very bad
Summary: Good
Summary: Bad
0% 10% 20% 30% 40% 50% 60% 70% 80% 90%
30%
48%
16%
6%
1%
77%
7%
29%
46%
17%
6%
1%
75%
7%
32%
50%
13%
4%
1%
82%
5%
28%
50%
16%
5%
1%
78%
6%
2009
2011
2012
2013
All valid responses: 2204
Q19. First of all, would you say in general your health is...?
Fewer residents in the most deprived quintiles say their health is good (73% Q1 and 77% Q2, compared to 84% Q5). This is also the case for the 65+ (57%), those with no qualifications (67%), in social housing (64%), and current and ex smokers (71% and 69%).
Just 66% of residents who find it difficult or very difficult on their present income say their health is good.

Fewer residents in 2013 have a health problem or disability (-5% points); 87% describe it as a ‘physical’ disability
Yes, limited a lot
Yes, limited a little
Not at all
0% 10% 20% 30% 40% 50% 60% 70% 80% 90%
7%
11%
82%
9%
14%
77%
2012
2013
All valid responses: 2208
Q32. Are your day-to-day activities limited because of a health problem or disability which has lasted, or is expected to last, at least 12 months? (include problems related to old age)
47% of residents aged 65+ have a health problem or disability, compared to 11% aged 16-64. Levels are also higher amongst those in social housing (29%) and current and ex smokers (21% and 26%).

More residents have no problem carrying out their
usual activities compared to in 2012 (+5% points)
All valid responses: bases in brackets
Q34/35/36. Please tell us which of these statements best describes you at the moment?
Level of mobility (walking about) [2204]
Ability to care for self (washing and dressing) [2201]
Ability to carry out usual activities [2202]
0% 10% 20% 30% 40% 50% 60% 70% 80% 90% 100%
84%
95%
89%
15%
5%
10%
0.01
0.01
No problem Some problems Unable to
2012 % no problem
83%
94%
84%

Just 3% of the sample suffer extreme anxiety or depression, whilst 12% suffer moderate to extreme levels
All valid responses: bases in brackets
Q37/38. Please tell us which of these statements best describes you at the moment?
Level of pain or discomfort [2201]
Level of anxiety or depression [2200]
0% 10% 20% 30% 40% 50% 60% 70% 80% 90% 100%
79%
88%
17%
9%
4%
3%
None Moderate Extreme
2012 % no pain
78%
87%
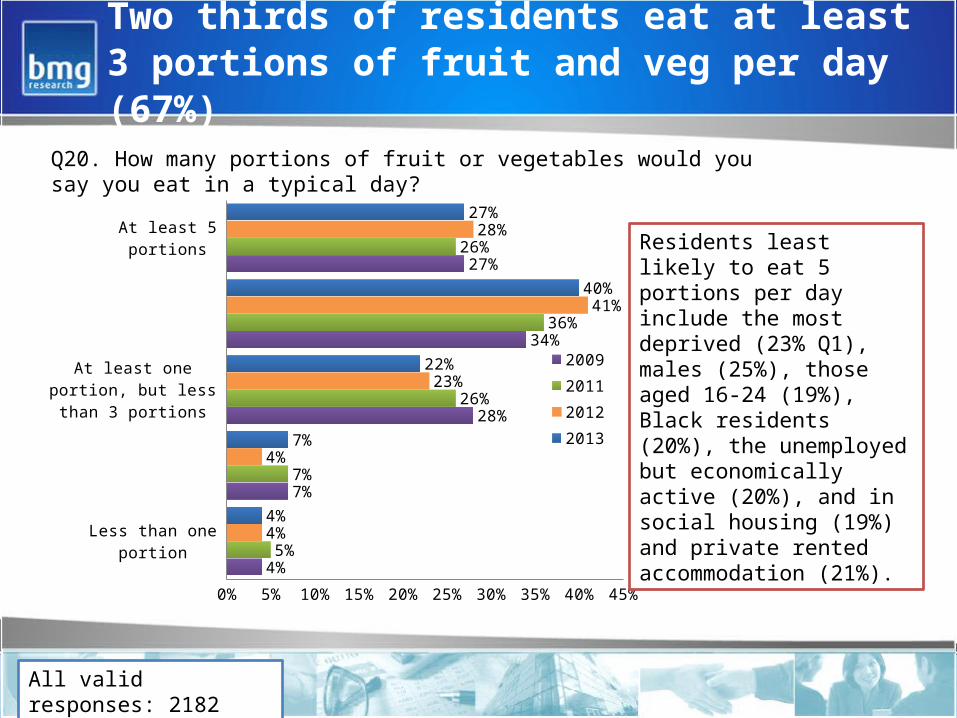
Two thirds of residents eat at least 3 portions of fruit and veg per day (67%)
At least 5 portions
At least 3 portions, but less than 5 portions
At least one portion, but less than 3 portions
About one portion
Less than one portion
0% 5% 10% 15% 20% 25% 30% 35% 40% 45%
27%
40%
22%
7%
4%
28%
41%
23%
4%
4%
26%
36%
26%
7%
5%
27%
34%
28%
7%
4%
2009
2011
2012
2013
All valid responses: 2182
Q20. How many portions of fruit or vegetables would you say you eat in a typical day?
Residents least likely to eat 5 portions per day include the most deprived (23% Q1), males (25%), those aged 16-24 (19%), Black residents (20%), the unemployed but economically active (20%), and in social housing (19%) and private rented accommodation (21%).

There has been a 3% point drop in the prevalence of smoking since 2012
Yes I currently smoke
Yes but I no longer smoke
No
0% 10% 20% 30% 40% 50% 60% 70%
22%
13%
65%
25%
13%
63%
24%
10%
66%
27%
9%
65%
2009201120122013
All valid responses: 2201
Q21. Do you, or have you ever, smoked?
The prevalence of smoking increases amongst the most deprived (33% Q1), males (26%), non-BMEs (25%), the unemployed but economically active (46%), and those in social housing (40%).
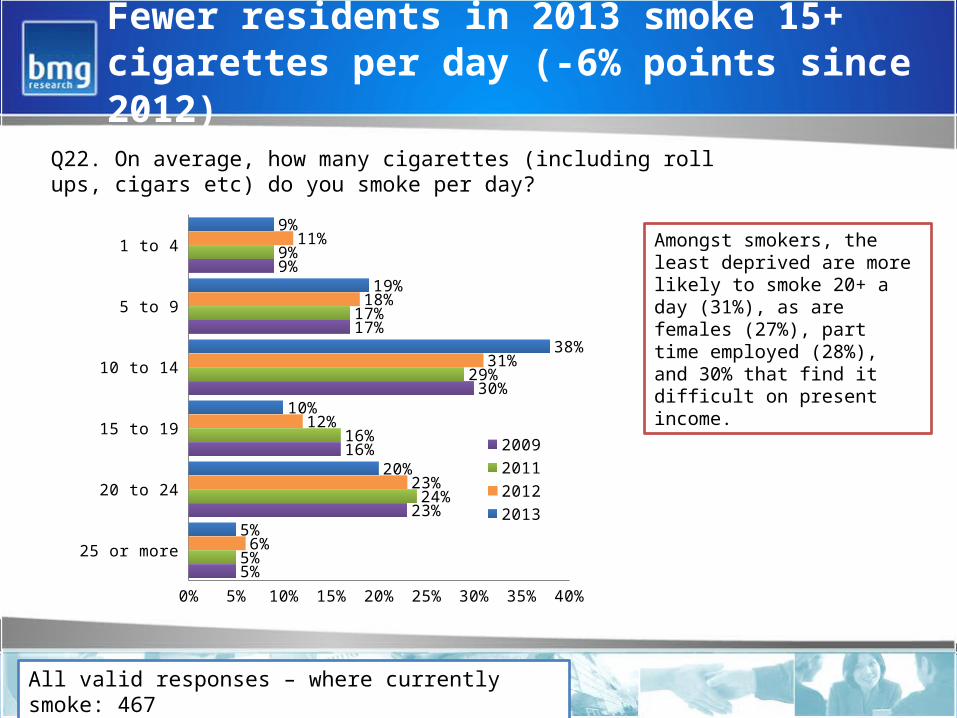
Fewer residents in 2013 smoke 15+ cigarettes per day (-6% points since 2012)
1 to 4
5 to 9
10 to 14
15 to 19
20 to 24
25 or more
0% 5% 10% 15% 20% 25% 30% 35% 40%
9%
19%
38%
10%
20%
5%
11%
18%
31%
12%
23%
6%
9%
17%
29%
16%
24%
5%
9%
17%
30%
16%
23%
5%
2009201120122013
All valid responses – where currently smoke: 467
Q22. On average, how many cigarettes (including roll ups, cigars etc) do you smoke per day?
Amongst smokers, the least deprived are more likely to smoke 20+ a day (31%), as are females (27%), part time employed (28%), and 30% that find it difficult on present income.

A small proportion of residents have or do smoke shisha
Yes I currently smoke shisha
Yes but I no longer smoke shisha
No
0% 20% 40% 60% 80% 100% 120%
2%
2%
96%
All valid responses: 2202
Q23. Do you, or have you ever, smoked 'shisha'- sometimes known as hookah? (Shisha is a fruit flavoured tobacco smoked through a waterpipe) (New question for 2013)
Current use of ‘shisha’ increases amongst the most deprived (3% Q1), those aged 16 to 24 (6%), and BME residents (3%), especially White Other (4%), Chinese/other (4%) and Asian (3%) residents.
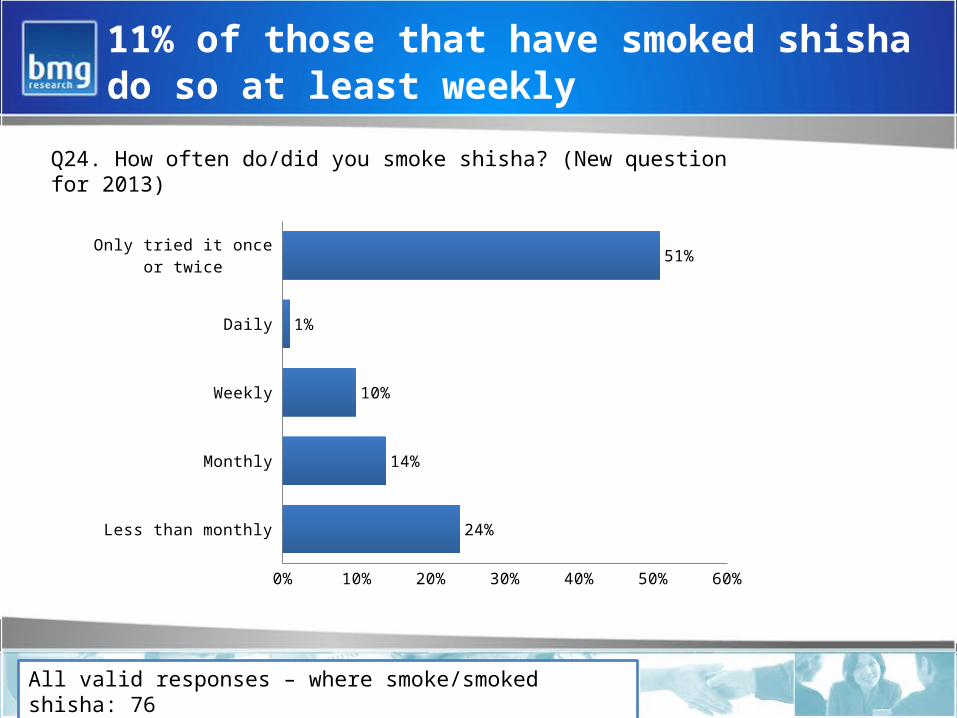
11% of those that have smoked shisha do so at least weekly
Only tried it once or twice
Daily
Weekly
Monthly
Less than monthly
0% 10% 20% 30% 40% 50% 60%
51%
1%
10%
14%
24%
All valid responses – where smoke/smoked shisha: 76
Q24. How often do/did you smoke shisha? (New question for 2013)

Over two in five residents say they do not drink alcohol, up from 2012
7 days
5-6 days
2-4 days
Once per week
Less than once per week
I don't drink
0% 5% 10% 15% 20% 25% 30% 35% 40% 45% 50%
3%
2%
20%
15%
19%
42%
3%
3%
19%
17%
20%
38%
3%
3%
19%
15%
14%
46%
5%
3%
23%
14%
16%
38%
2009201120122013
All valid responses: 2191
Q25. How many days in a typical week do you usually drink alcohol?
Males are more likely to drink alcohol 2 or more days per week (32%), as are the least deprived (38% Q5), those aged 45-74 (33%), non-BMEs (31%), the full time employed (30%) and owner occupiers (31%).
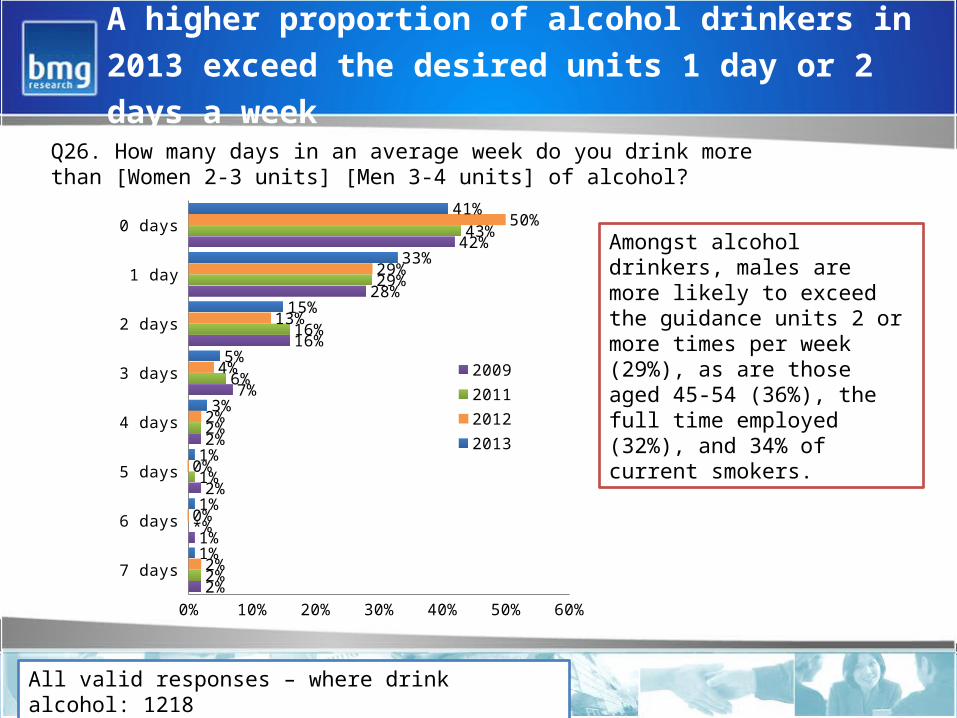
A higher proportion of alcohol drinkers in 2013
exceed the desired units 1 day or 2 days a week
0 days
1 day
2 days
3 days
4 days
5 days
6 days
7 days
0% 10% 20% 30% 40% 50% 60%
41%
33%
15%
5%
3%
1%
1%
1%
50%
29%
13%
4%
2%
0%
0%
2%
43%
29%
16%
6%
2%
1%
*%
2%
42%
28%
16%
7%
2%
2%
1%
2%
2009201120122013
All valid responses – where drink alcohol: 1218
Q26. How many days in an average week do you drink more than [Women 2-3 units] [Men 3-4 units] of alcohol?
Amongst alcohol drinkers, males are more likely to exceed the guidance units 2 or more times per week (29%), as are those aged 45-54 (36%), the full time employed (32%), and 34% of current smokers.
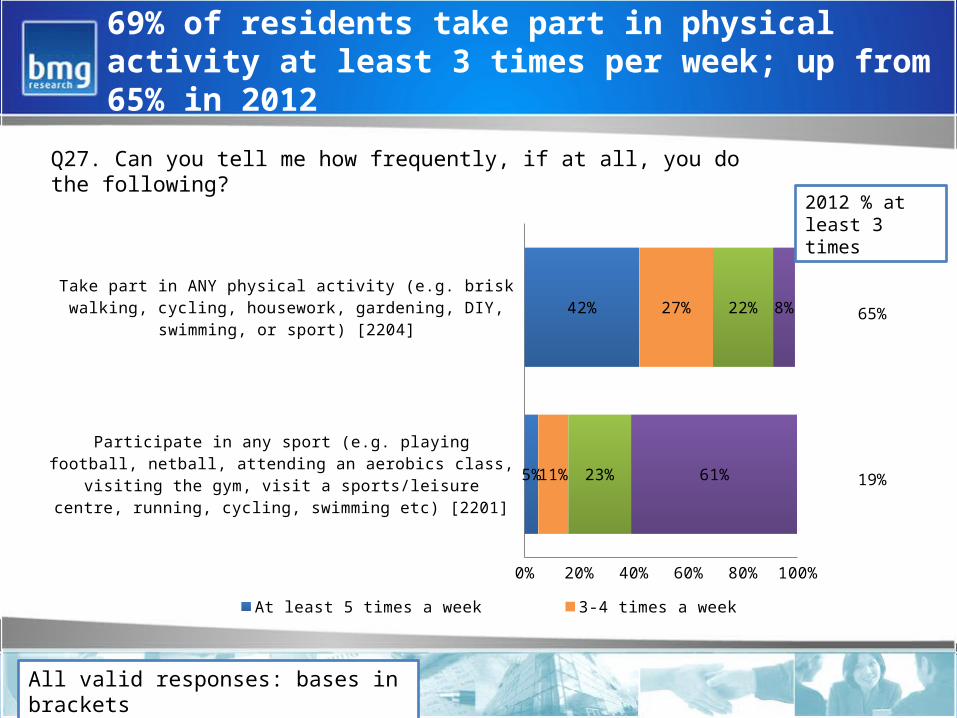
69% of residents take part in physical activity at least 3 times per week; up from 65% in 2012
All valid responses: bases in brackets
Q27. Can you tell me how frequently, if at all, you do the following?
Take part in ANY physical activity (e.g. brisk walking, cycling, housework, gardening, DIY, swimming, or sport) [2204]
Participate in any sport (e.g. playing football, netball, attending an aerobics class, visiting the gym, visit a sports/leisure centre, running, cycling,
swimming etc) [2201]
0% 20% 40% 60% 80% 100%
42%
5%
27%
11%
22%
23%
8%
61%
At least 5 times a week 3-4 times a week Less than 3 times a week Never
2012 % at least 3 times
65%
19%
Physical activity - key variations
• Residents least likely to do physical activity 3 or more times per week include males (65%), those aged 65+ (62%), Asian residents (65%), and the full time employed (66%).

There has been an increase since 2012 in the % of residents that have had good sleep in the last month (+9% points)
Good
Average
Poor
0% 10% 20% 30% 40% 50% 60% 70%
53%
35%
12%
44%
42%
15%
55%
33%
13%
60%
28%
12%
2009201120122013
All valid responses: 2207
Q28. And how would you rate the quality of your sleep in the last month?
Males are more likely to say they had good sleep (57%), as are those aged 16 to 24 (64%), BME (59%), those living comfortably on income (61%).
Just 46% of residents in social housing have had good sleep.
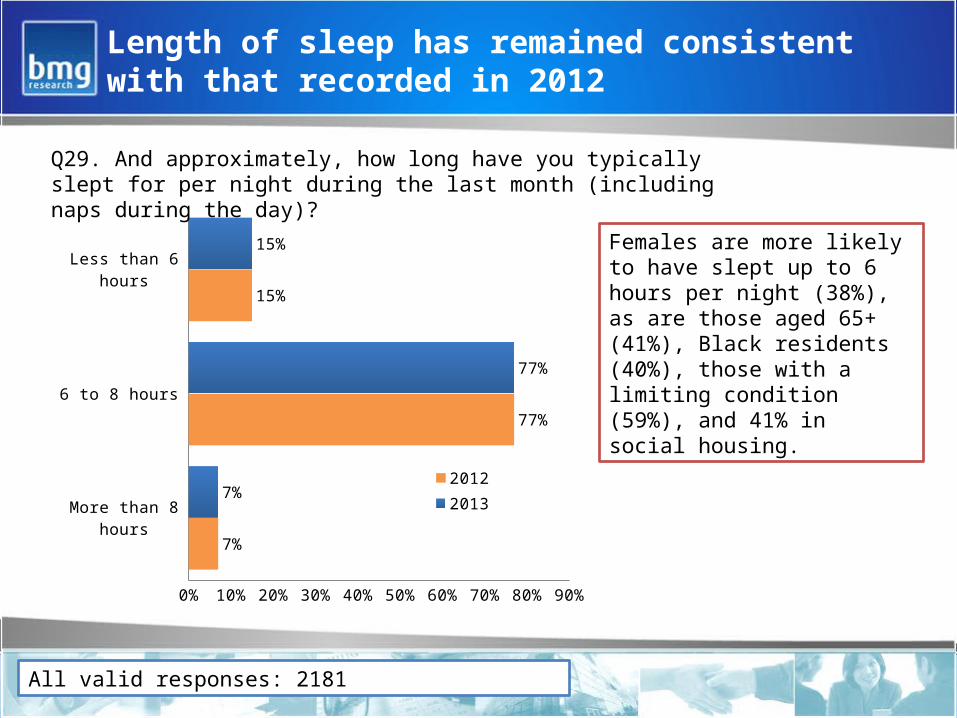
Length of sleep has remained consistent with that recorded in 2012
Less than 6 hours
6 to 8 hours
More than 8 hours
0% 10% 20% 30% 40% 50% 60% 70% 80% 90%
15%
77%
7%
15%
77%
7%
20122013
All valid responses: 2181
Q29. And approximately, how long have you typically slept for per night during the last month (including naps during the day)?
Females are more likely to have slept up to 6 hours per night (38%), as are those aged 65+ (41%), Black residents (40%), those with a limiting condition (59%), and 41% in social housing.
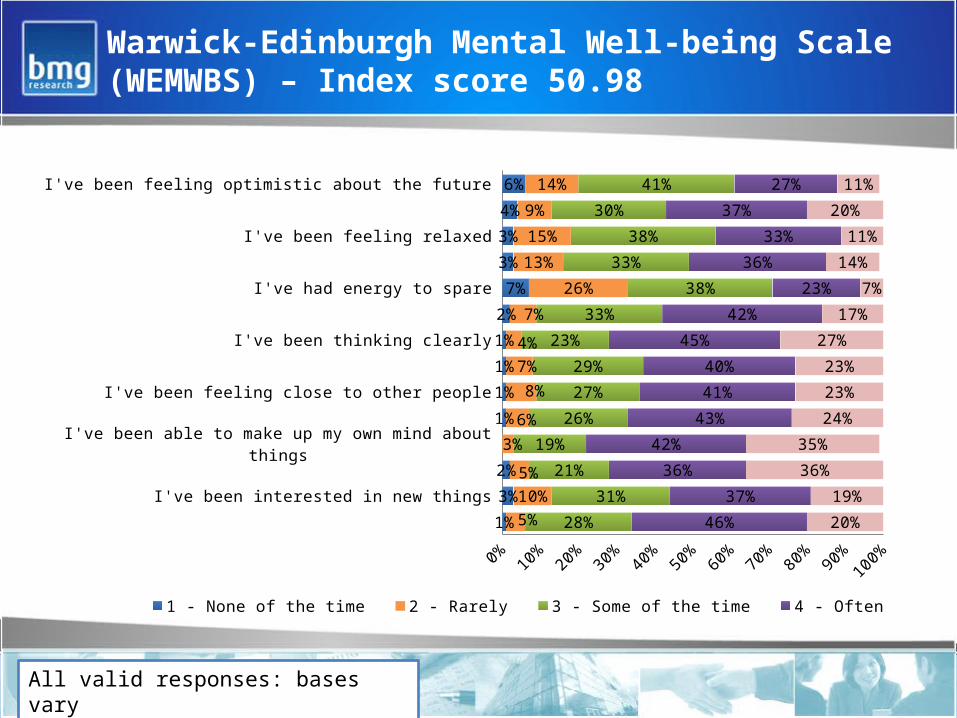
Warwick-Edinburgh Mental Well-being Scale (WEMWBS) – Index score 50.98
All valid responses: bases vary
I've been feeling optimistic about the future
I've been feeling useful
I've been feeling relaxed
I've been feeling interested in other people
I've had energy to spare
I've been dealing with problems well
I've been thinking clearly
I've been feeling good about myself
I've been feeling close to other people
I've been feeling confident
I've been able to make up my own mind about things
I've been feeling loved
I've been interested in new things
I've been feeling cheerful
0% 10% 20% 30% 40% 50% 60% 70% 80% 90% 100%
6%
4%
3%
3%
7%
2%
1%
1%
1%
1%
2%
3%
1%
14%
9%
15%
13%
26%
7%
4%
7%
8%
6%
3%
5%
10%
5%
41%
30%
38%
33%
38%
33%
23%
29%
27%
26%
19%
21%
31%
28%
27%
37%
33%
36%
23%
42%
45%
40%
41%
43%
42%
36%
37%
46%
11%
20%
11%
14%
7%
17%
27%
23%
23%
24%
35%
36%
19%
20%
1 - None of the time 2 - Rarely 3 - Some of the time 4 - Often 5 - All of the time

63% of residents rate their satisfaction with life nowadays as 8 or above, with a mean of 7.73
1
2
3
4
5
6
7
8
9
10
0% 5% 10% 15% 20% 25% 30% 35% 40%
<0.5%
<0.5%
0.01
0.01
0.05
0.08
0.2
0.35
0.17
0.11
0%
1%
1%
2%
7%
7%
20%
34%
17%
10%
20122013
All valid responses: 2195
Q31. And all things considered, how satisfied are you with your life as a whole nowadays? (Where 1 is extremely dissatisfied and 10 is extremely satisfied)
Mean satisfaction is highest amongst the least deprived (8), those aged 16 to 24 (7.94), Asian residents (7.97), the full time employed (7.95), and those living comfortably on present income (8.2). Levels drop to 6.04 where they find it very difficult on present income.
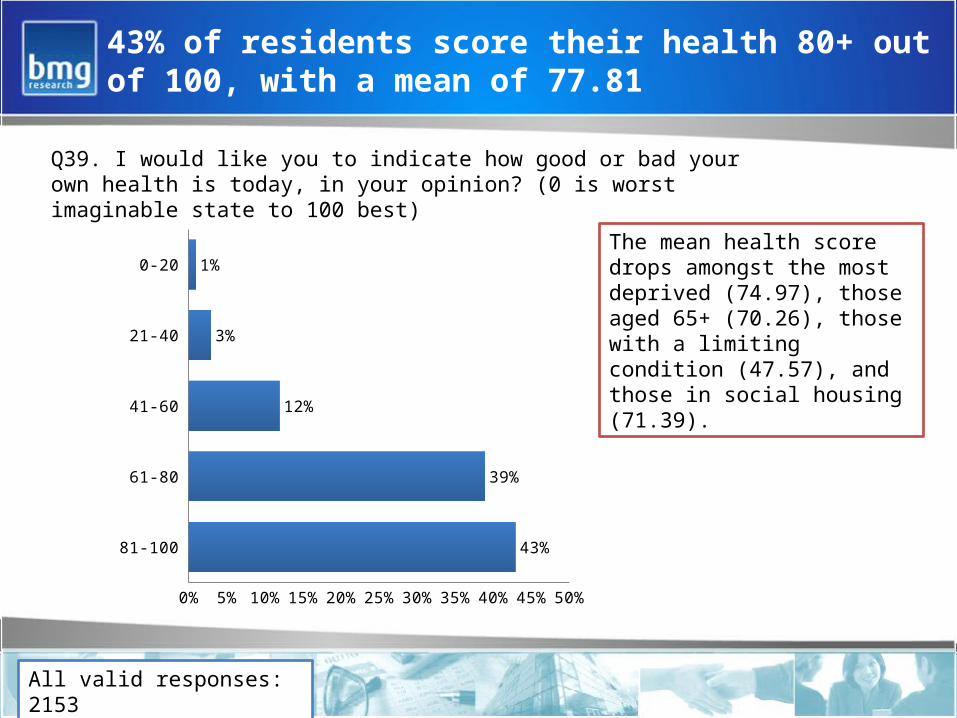
43% of residents score their health 80+ out of 100, with a mean of 77.81
0-20
21-40
41-60
61-80
81-100
0% 5% 10% 15% 20% 25% 30% 35% 40% 45% 50%
1%
3%
12%
39%
43%
All valid responses: 2153
Q39. I would like you to indicate how good or bad your own health is today, in your opinion? (0 is worst imaginable state to 100 best)
The mean health score drops amongst the most deprived (74.97), those aged 65+ (70.26), those with a limiting condition (47.57), and those in social housing (71.39).

Work and training
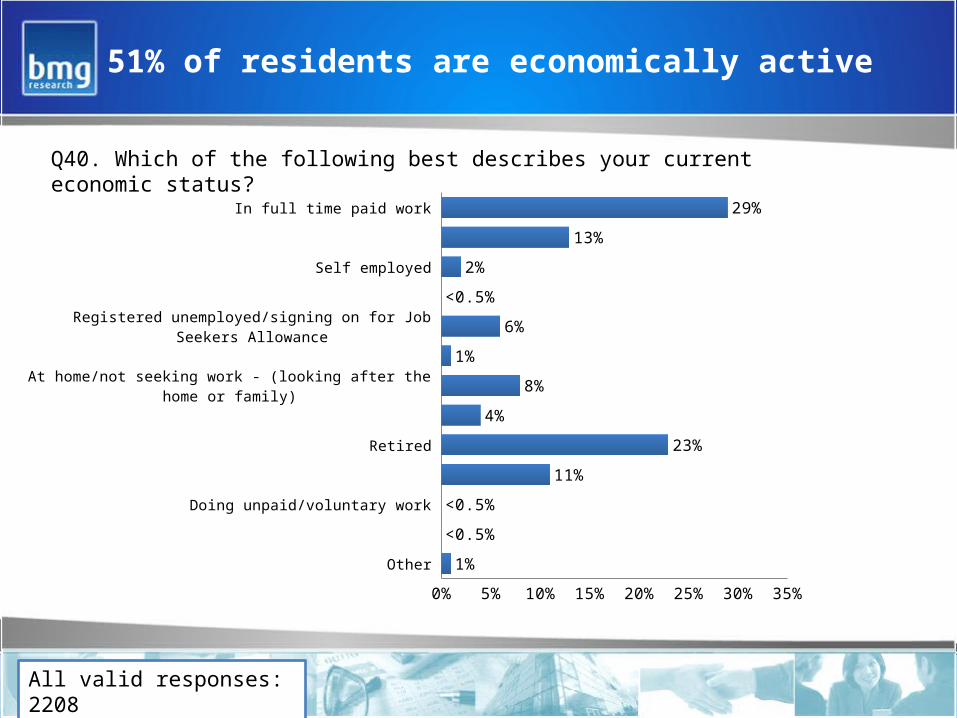
51% of residents are economically active
In full time paid work
In part time paid work
Self employed
Taking part in a government training programme
Registered unemployed/signing on for Job Seekers Allowance
Not registered unemployed but actively seeking work
At home/not seeking work - (looking after the home or family)
Long-term sick or disabled
Retired
In full-time education
Doing unpaid/voluntary work
Carer
Other
0% 5% 10% 15% 20% 25% 30% 35%
29%
13%
2%
<0.5%
6%
1%
8%
4%
23%
11%
<0.5%
<0.5%
1%
All valid responses: 2208
Q40. Which of the following best describes your current economic status?

A third of residents do not have any qualifications, up from 2012
Level 1
Level 2
Level 3
Level 4/5
Other qualifications/level unknown
No qualifications
0% 5% 10% 15% 20% 25% 30% 35%
9%
14%
16%
20%
9%
33%
11%
15%
14%
21%
12%
26%
20122013
All valid responses: 2177
Q41. And could you tell me, which of these is your highest qualification?
Residents more likely to have no qualifications include the most deprived (42% Q1), the unemployed but economically active (45%), and those in social housing (44%).
This is also the case in Wyken Green (53%) and Stoke Park & Century Business Park (54%).

More residents state that they are living comfortably on their present income than in 2012 (+3% points)
Living comfortably on present income
Coping on present income
Finding it difficult on present income
Finding it very difficult on present income
0% 5% 10% 15% 20% 25% 30% 35% 40% 45% 50%
39%
45%
13%
3%
36%
46%
15%
3%
20122013
All valid responses: 2141
Q42. Which of these phrases comes closest to describing your feelings about your household income these days?
25% of residents in the Q1 deprivation quintile find it difficult/very difficult on present income. Levels are also higher amongst the unemployed but economically active (54%) and those in social housing (28%).
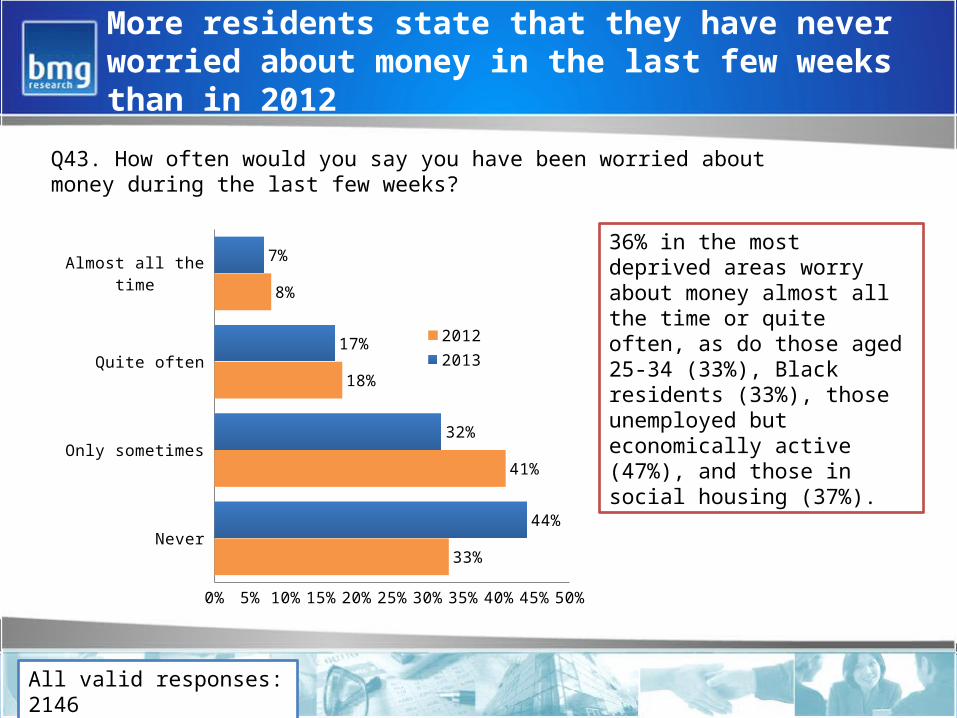
More residents state that they have never worried about money in the last few weeks than in 2012
Almost all the time
Quite often
Only sometimes
Never
0% 5% 10% 15% 20% 25% 30% 35% 40% 45% 50%
7%
17%
32%
44%
8%
18%
41%
33%
20122013
All valid responses: 2146
Q43. How often would you say you have been worried about money during the last few weeks?
36% in the most deprived areas worry about money almost all the time or quite often, as do those aged 25-34 (33%), Black residents (33%), those unemployed but economically active (47%), and those in social housing (37%).
10 ways to health and well-being
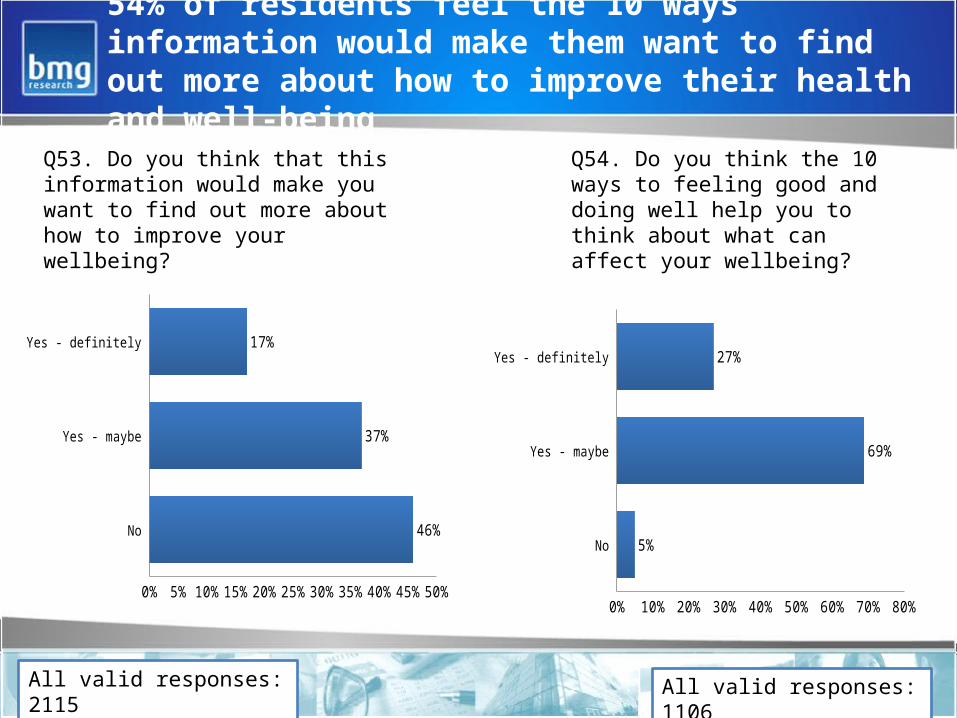
54% of residents feel the 10 ways information would make them want to find out more about how to improve their health and well-being
Yes - defi-nitely
Yes - maybe
No
0% 5% 10% 15% 20% 25% 30% 35% 40% 45% 50%
17%
37%
46%
All valid responses: 2115
Q53. Do you think that this information would make you want to find out more about how to improve your wellbeing?
Yes - defi-nitely
Yes - maybe
No
0% 10% 20% 30% 40% 50% 60% 70% 80%
27%
69%
5%
Q54. Do you think the 10 ways to feeling good and doing well help you to think about what can affect your wellbeing?
All valid responses: 1106
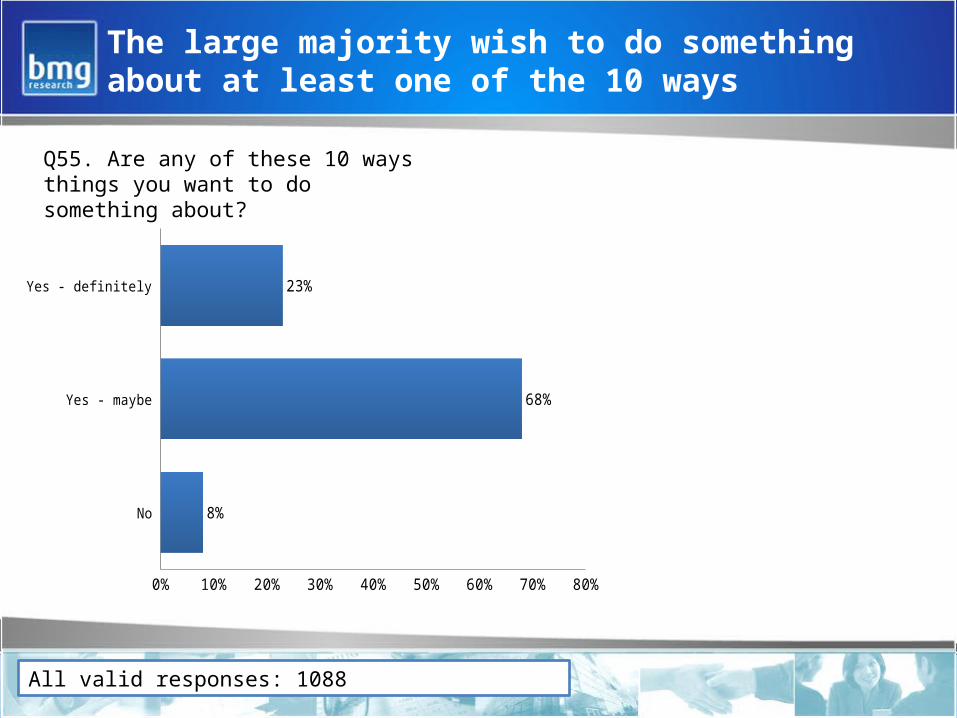
The large majority wish to do something about at least one of the 10 ways
Yes - def-initely
Yes - maybe
No
0% 10% 20% 30% 40% 50% 60% 70% 80%
23%
68%
8%
All valid responses: 1088
Q55. Are any of these 10 ways things you want to do something about?

Thank you0121 333 6006
www.bmgresearch.co.uk