covalon technologies ltd
TRANSCRIPT

Page 1 of 33
Covalon Technologies Ltd.
CONSOLIDATED FINANCIAL STATEMENTS
For the years ended September 30, 2019 and 2018
Contents
Independent Auditor’s Report 2
Consolidated Statements of Financial Position 6
Consolidated Statements of Operations and Comprehensive Income (Loss) 7
Consolidated Statements of Changes in Equity 8
Consolidated Statements of Cash Flows 9
Notes to the Consolidated Financial Statements 10-33

PricewaterhouseCoopers LLP PwC Centre, 354 Davis Road, Suite 600, Oakville, Ontario, Canada L6J 0C5 T: +1 905 815 6300, F: +1 905 815 6499
“PwC” refers to PricewaterhouseCoopers LLP, an Ontario limited liability partnership.
Independent auditor’s report
To the Shareholders of Covalon Technologies Ltd.
Our opinion
In our opinion, the accompanying consolidated financial statements present fairly, in all material respects, the financial position of Covalon Technologies Ltd. and its subsidiaries (together, the Company) as at September 30, 2019 and its financial performance and its cash flows for the year then ended in accordance with International Financial Reporting Standards as issued by the International Accounting Standards Board (IFRS).
What we have audited The Company’s consolidated financial statements comprise:
the consolidated statement of financial position as at September 30, 2019;
the consolidated statement of operations and comprehensive income (loss) for the year then ended;
the consolidated statement of changes in equity for the year then ended;
the consolidated statement of cash flows for the year then ended; and
the notes to the consolidated financial statements, which include a summary of significant accounting policies.
Basis for opinion
We conducted our audit in accordance with Canadian generally accepted auditing standards. Our responsibilities under those standards are further described in the Auditor’s responsibilities for the audit of the consolidated financial statements section of our report.
We believe that the audit evidence we have obtained is sufficient and appropriate to provide a basis for our opinion.
Independence We are independent of the Company in accordance with the ethical requirements that are relevant to our audit of the consolidated financial statements in Canada. We have fulfilled our other ethical responsibilities in accordance with these requirements.
Comparative information
The financial statements of the Company for the year ended September 30, 2018 were audited by another auditor who expressed an unmodified opinion on those statements on December 17, 2018.

Other information
Management is responsible for the other information. The other information comprises the Management’s Discussion and Analysis.
Our opinion on the consolidated financial statements does not cover the other information and we do not express any form of assurance conclusion thereon.
In connection with our audit of the consolidated financial statements, our responsibility is to read the other information identified above and, in doing so, consider whether the other information is materially inconsistent with the consolidated financial statements or our knowledge obtained in the audit, or otherwise appears to be materially misstated.
If, based on the work we have performed, we conclude that there is a material misstatement of this other information, we are required to report that fact. We have nothing to report in this regard.
Responsibilities of management and those charged with governance for the consolidated financial statements
Management is responsible for the preparation and fair presentation of the consolidated financial statements in accordance with IFRS, and for such internal control as management determines is necessary to enable the preparation of consolidated financial statements that are free from material misstatement, whether due to fraud or error.
In preparing the consolidated financial statements, management is responsible for assessing the Company’s ability to continue as a going concern, disclosing, as applicable, matters related to going concern and using the going concern basis of accounting unless management either intends to liquidate the Company or to cease operations, or has no realistic alternative but to do so.
Those charged with governance are responsible for overseeing the Company’s financial reporting process.
Auditor’s responsibilities for the audit of the consolidated financial statements
Our objectives are to obtain reasonable assurance about whether the consolidated financial statements as a whole are free from material misstatement, whether due to fraud or error, and to issue an auditor’s report that includes our opinion. Reasonable assurance is a high level of assurance, but is not a guarantee that an audit conducted in accordance with Canadian generally accepted auditing standards will always detect a material misstatement when it exists. Misstatements can arise from fraud or error and are considered material if, individually or in the aggregate, they could reasonably be expected to influence the economic decisions of users taken on the basis of these consolidated financial statements.
As part of an audit in accordance with Canadian generally accepted auditing standards, we exercise professional judgment and maintain professional skepticism throughout the audit. We also:
Identify and assess the risks of material misstatement of the consolidated financial statements, whether due to fraud or error, design and perform audit procedures responsive to those risks, and obtain audit evidence that is sufficient and appropriate to provide a basis for our opinion. The risk of not detecting a material misstatement resulting from fraud is higher than for one resulting from error, as fraud may involve collusion, forgery, intentional omissions, misrepresentations, or the override of internal control.
Obtain an understanding of internal control relevant to the audit in order to design audit procedures that are appropriate in the circumstances, but not for the purpose of expressing an opinion on the effectiveness of the Company’s internal control.
Evaluate the appropriateness of accounting policies used and the reasonableness of accounting estimates and related disclosures made by management.
Conclude on the appropriateness of management’s use of the going concern basis of accounting and, based on the audit evidence obtained, whether a material uncertainty exists related to events or conditions that may cast significant doubt on the Company’s ability to continue as a going concern. If we conclude that a material uncertainty exists, we are required to draw attention in our auditor’s report to the related disclosures in the consolidated financial statements or, if such disclosures are inadequate, to modify our opinion. Our conclusions are based on the audit evidence obtained up to the date of our auditor’s report. However, future events or conditions may cause the Company to cease to continue as a going concern.
Evaluate the overall presentation, structure and content of the consolidated financial statements, including the disclosures, and whether the consolidated financial statements represent the underlying transactions and events in a manner that achieves fair presentation.
Obtain sufficient appropriate audit evidence regarding the financial information of the entities or business activities within the Company to express an opinion on the consolidated financial statements. We are responsible for the direction, supervision and performance of the group audit. We remain solely responsible for our audit opinion.
We communicate with those charged with governance regarding, among other matters, the planned scope and timing of the audit and significant audit findings, including any significant deficiencies in internal control that we identify during our audit.
We also provide those charged with governance with a statement that we have complied with relevant ethical requirements regarding independence, and to communicate with them all relationships and other matters that may reasonably be thought to bear on our independence, and where applicable, related safeguards.
The engagement partner on the audit resulting in this independent auditor’s report is Neil Rostant.
(Signed) "PricewaterhouseCoopers LLP"
Chartered Professional Accountants, Licensed Public Accountants
Oakville, Ontario January 28, 2020

Covalon Technologies Ltd. CONSOLIDATED STATEMENTS OF FINANCIAL POSITION Expressed in Canadian Dollars
Page 6 of 33
September 30, 2019
September 30, 2018
Assets
Current assets
Cash and cash equivalents $9,575,149 $5,483,087
Accounts receivable 3,635,281 5,132,693
Inventories (Note 6) 8,581,378 5,564,539
Prepaid expenses 601,333 959,915
Total current assets 22,393,141 17,140,234
Non-current assets
Restricted cash 36,624 36,052
Property, plant and equipment (Note 8) 1,894,568 1,161,201
Intangible assets (Note 7) 2,358,188 1,370,346
Goodwill (Note 7) 12,924,412 -
Total non-current assets 17,213,792 2,567,599
Total assets $39,606,933 $19,707,833
Liabilities and shareholders’ equity
Current liabilities
Accounts payable and accrued liabilities $5,681,415 $4,721,381
Short-term debt (Note 10) 8,422,966 1,526,928
Acquisition note payable (Note 5) 3,380,011 -
Deferred revenue (Note 9) 459,315 206,811
Total current liabilities 17,943,707 6,455,120
Non-current liabilities
Deferred revenue (Note 9) 139,052 -
Deferred rent 299,856 127,937
Acquisition note payable (Note 5) 6,294,200 -
Total non-current liabilities 6,733,108 127,937
Total liabilities 24,676,815 6,583,057
Shareholders’ equity
Share capital (Note 11) 44,607,119 39,257,032
Contributed surplus (Note 11) 10,717,141 5,572,839
Foreign exchange translation reserve 372,612 (76,114)
Accumulated deficit (40,766,754) (31,628,981)
Total shareholders’ equity 14,930,118 13,124,776
Total liabilities and shareholders’ equity $39,606,933 $19,707,833
On behalf of the Board: (signed) “Abe Schwartz”
(signed) “Brian Pedlar”Director Director
The accompanying notes are an integral part of these consolidated financial statements.

Covalon Technologies Ltd. CONSOLIDATED STATEMENTS OF OPERATIONS AND COMPREHENSIVE INCOME (LOSS) Expressed in Canadian Dollars
Page 7 of 33
Year ended September 30,
2019 2018
Revenue
Product $30,147,854 $19,990,663
Development and consulting services 3,265,636 1,782,368
Licensing and royalty fees 591,132 4,950,311
Total revenue 34,004,622 26,723,342
Cost of sales 12,182,263 7,058,506
Gross profit before operating expenses 21,822,359 19,664,836
Operating expenses
Operations 1,909,748 1,990,549
Research and development activities 1,359,417 1,416,640
Sales, marketing and agency fees 14,952,989 8,186,811
General and administrative 11,848,837 6,453,188
30,070,991 18,047,188
Financing expenses 889,141 -
Net income (loss) $(9,137,773) $1,617,648
Other comprehensive income
Amount that may be reclassified to profit or loss
Foreign currency translation adjustment 448,726 376,321
Total comprehensive income (loss) $(8,689,047) $1,993,969
Basic earnings (loss) per share (Note 18) $(0.41) $0.08
Diluted earnings (loss) per share (Note 18) $(0.41) $0.07
The accompanying notes are an integral part of these consolidated financial statements.

Covalon Technologies Ltd. CONSOLIDATED STATEMENTS OF CHANGES IN EQUITY Expressed in Canadian Dollars
Page 8 of 33
Number of shares Share capital
Contributed surplus
Accumulated deficit
Foreign exchange
translation reserve Total
Balance at October 1, 2017 21,325,587 $37,879,335 $4,800,816 $(33,246,629) $(452,435) $8,981,087 Share-based payment expense - - 1,252,577 - - $1,252,577 Exercise of stock options 452,170 1,001,539 (480,554) - - $520,985 Exercise of warrants (Note 11) 231,373 376,158 - - - $376,158Net income for the year - - - 1,617,648 - $1,617,648 Foreign currency translation adjustment - - - - 376,321 $376,321
Balance at September 30, 2018 22,009,130 $39,257,032 $5,572,839 $(31,628,981) $(76,114) $13,124,776
Balance at October 1, 2018 22,009,130 $39,257,032 $5,572,839 $(31,628,981) $(76,114) $13,124,776 Share-based payment expense - - 1,717,091 - - $1,717,091Exercise of stock options 77,669 277,284 (120,744) - - $156,540Exercise of warrants (Note 11) 803,850 1,848,857 - - - $1,848,857Issuance of common shares on acquisition (Note 5) 178,028 1,271,901 - - - $1,271,901 Issuance of common shares on private placement (Note 11) 2,750,000 1,952,045 3,547,955 - - $5,500,000 Net loss for the year - - - (9,137,773) - $(9,137,773)Foreign currency translation adjustment - - - - 448,726 $ 448,726
Balance at September 30, 2019 25,818,677 $44,607,119 $10,717,141 $(40,766,754) $372,612 $14,930,118
The accompanying notes are an integral part of these consolidated financial statements.
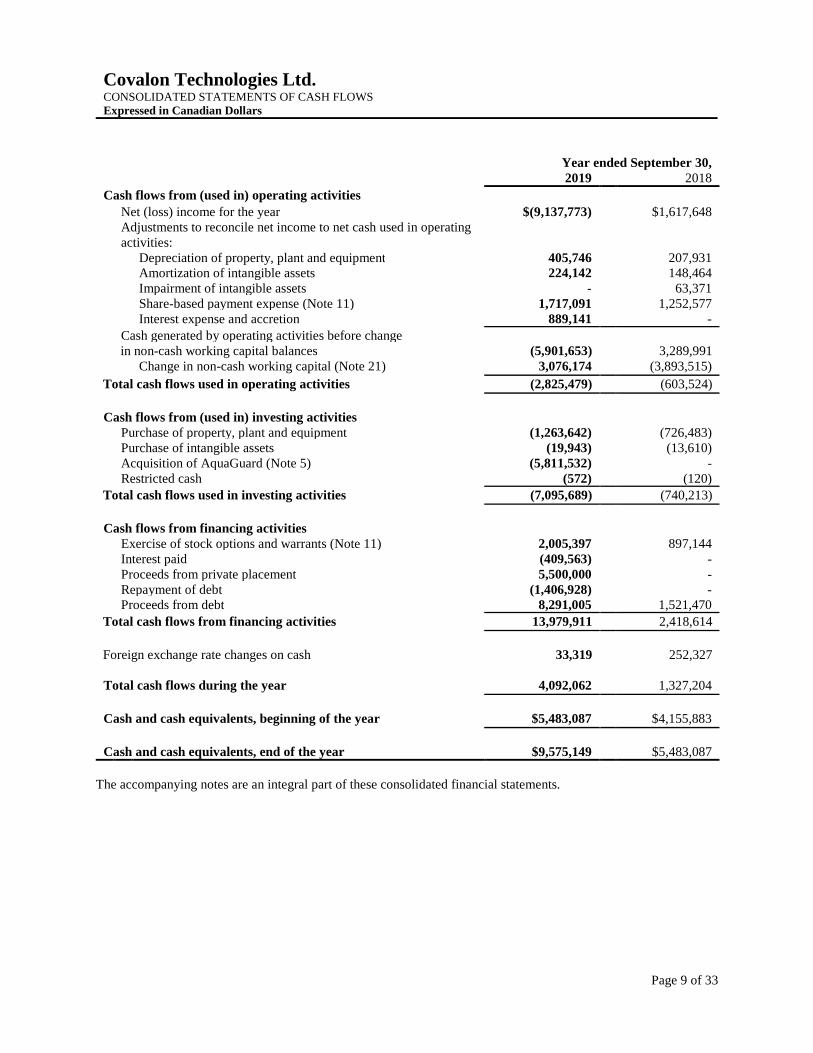
Covalon Technologies Ltd. CONSOLIDATED STATEMENTS OF CASH FLOWS Expressed in Canadian Dollars
Page 9 of 33
Year ended September 30, 2019 2018
Cash flows from (used in) operating activities
Net (loss) income for the year $(9,137,773) $1,617,648 Adjustments to reconcile net income to net cash used in operating
activities:Depreciation of property, plant and equipment 405,746 207,931Amortization of intangible assets 224,142 148,464Impairment of intangible assets - 63,371Share-based payment expense (Note 11) 1,717,091 1,252,577Interest expense and accretion 889,141 -
Cash generated by operating activities before changein non-cash working capital balances (5,901,653) 3,289,991
Change in non-cash working capital (Note 21) 3,076,174 (3,893,515)
Total cash flows used in operating activities (2,825,479) (603,524)
Cash flows from (used in) investing activities Purchase of property, plant and equipment (1,263,642) (726,483)Purchase of intangible assets (19,943) (13,610)Acquisition of AquaGuard (Note 5) (5,811,532) -Restricted cash (572) (120)
Total cash flows used in investing activities (7,095,689) (740,213)
Cash flows from financing activities Exercise of stock options and warrants (Note 11) 2,005,397 897,144 Interest paid (409,563) -Proceeds from private placement 5,500,000 -Repayment of debt (1,406,928) -Proceeds from debt 8,291,005 1,521,470
Total cash flows from financing activities 13,979,911 2,418,614
Foreign exchange rate changes on cash 33,319 252,327
Total cash flows during the year 4,092,062 1,327,204
Cash and cash equivalents, beginning of the year $5,483,087 $4,155,883
Cash and cash equivalents, end of the year $9,575,149 $5,483,087
The accompanying notes are an integral part of these consolidated financial statements.

Covalon Technologies Ltd. NOTES TO THE CONSOLIDATED FINANCIAL STATEMENTS Expressed in Canadian Dollars For the years ended September 30, 2019 and 2018
Page 10 of 33
1. CORPORATE INFORMATION
Covalon Technologies Ltd. (“the Company”) is incorporated under the laws of Ontario and is engaged in the
business of developing, licensing, and selling medical technologies and products. The consolidated financial
statements of Covalon Technologies Ltd. for the year ended September 30, 2019 comprise the results of the
Company and its wholly owned subsidiaries. The Company has received regulatory approval on numerous
products and is currently generating revenue. The Company has adopted a business model that predominantly
contracts the manufacturing and distribution of its commercialized products through partners. The Company
generates its revenues through development contracts, licensing agreements and distribution contracts, and sales
of products.
On October 1, 2018 the Company completed the acquisition of AquaGuard, a division of a Seattle-based medical
company (Note 5). The Company acquired all of the assets of AquaGuard, to allow the Company to carry on the
operations of the business, including the AquaGuard family of moisture barrier products as well as their
specialised salesforce in the United States.
The Company is listed on the TSX Venture Exchange, having the symbol COV. The Company also trades on the
OTCQX Best Market, having the symbol of CVALF.
The address of the Company’s corporate office and principal place of business is 1660 Tech Avenue, Unit 5,
Mississauga, Ontario, Canada.
2. LIQUIDITY
The Company entered into an Acquisition Note Payable (“Acquisition Note”) agreement (discussed in Note 5)
with the prior owners of the AquaGuard assets (“Vendor”) pursuant to which a milestone payment of $2.5m USD
became due on October 1, 2019 and a milestone payment of $5m USD will become due on October 1, 2020. The
Company had intended to fund the Acquisition Note milestone payments through the Acquisition Line Facility
(“Facility”) with HSBC Bank Canada (“HSBC”).
As of September 30, 2019, the Company did not meet one covenant related to the Facility with HSBC that required
the Company to have a Fixed Charge Coverage ratio of 1.00 to 1.00. As a result, the Company was prohibited
from making the first instalment payment of the Acquisition Note using funds made available under the Facility
as originally intended in order to meet the commitments to the Vendor. The first payment to the Vendor of $2.5m
USD was due October 1, 2019. The Company was also unable to use cash on hand to make the payment to the
Vendor without being offside on future covenant calculations. When entering into the purchase and banking
agreements described above, the Company, the Vendor, and HSBC entered into a subordination agreement which
states that no Acquisition Note amounts will be due if the Company is in breach of the Facility agreement.
Subsequent to September 30, 2019, the Company obtained a waiver from HSBC that addressed the breach of the
Facility for the quarter then ended. The Facility agreement was also amended to address both ratios, and
definitions, that will provide relief to the Company in future quarters. The Company will be required to maintain
a minimum cash balance of $1.5m and the Company is not currently permitted to make any cash payments to the
Vendor.
The Vendor can only make a claim against the Company for non-payment under the Acquisition Note in
accordance with the terms of the subordination agreement. The Acquisition Note, as outlined in the subordination
agreement, is unconditionally and irrevocably deferred, postponed and subordinated in all respects until

Covalon Technologies Ltd. NOTES TO THE CONSOLIDATED FINANCIAL STATEMENTS Expressed in Canadian Dollars For the years ended September 30, 2019 and 2018
Page 11 of 33
repayment in full has been made to HSBC, and therefore the Vendor currently have no recourse under the
subordination agreement.
While the Company believes that based on cash on hand and amounts available under the HSBC operating line
discussed in Note 10, it has sufficient future cash flow to support its operating needs for the near future, without
access to remaining funds from the Facility, the Company may not generate sufficient operating cash flows to be
able to repay the Acquisition Note and/or the Facility, should they both become due and payable during fiscal
2020, without refinancing these liabilities, or though the issuance of additional equity of the Company. While the
company does not anticipate the need to raise capital, this may be required. Therefore it is essential that the
Company maintains compliance with the amended covenants.
To address the future payments required the Company: a) is in negotiations with the Vendor to renegotiate the terms of the Acquisition Note which could favorably impact the revised covenant calculations beginning in Q3 2020; and, b) continues to look for ways to expand its business, with both new, and existing clients globally.
The Company continually monitors working capital to ensure sufficient cash is available to meet operational and
capital expenditure requirements. The following table shows the Company’s significant contractual maturities,
on an undiscounted cash flow basis, as at September 30, 2019:
Carrying
amount ($)
Future cash
flows ($)
Less than
1 year ($)
Between 1 and
5 years ($)
Greater than
5 years ($)
Accounts payable and
accrued liabilities
5,681,415 5,681,415 5,681,415 - -
Debt 8,422,966 8,422,966 8,422,966 - -
Acquisition note
payable
9,674,211 10,001,511 3,380,011 6,621,500 -
Total 23,778,592 24,105,892 17,484,392 6,621,500 -
3. SUMMARY OF SIGNIFICANT ACCOUNTING POLICIES AND BASIS OF PRESENTATION
Basis of preparation
The Company’s consolidated financial statements have been prepared in accordance with International Financial
Reporting Standards as issued by the International Accounting Standards Board (“IFRS”).The consolidated
financial statements were authorized for issue by the Board of Directors on January 27, 2020.
Use of estimates and judgments
The preparation of consolidated financial statements in conformity with IFRS requires the use of certain critical
accounting estimates. It also requires management to exercise its judgment in the process of applying the
Company’s accounting policies. The areas involving a higher degree of judgment or complexity, or areas where
assumptions and estimates are significant to the consolidated financial statements are disclosed in Note 4.
Consolidation
These consolidated financial statements include the accounts of the Company and its wholly owned subsidiaries
over which the Company has control: Covalon Technologies Inc.; Covalon Technologies (USA) Ltd.; Covalon
Medical Device Shanghai Co., Ltd.; Covalon Technologies (Israel) Ltd.; Covalon Technologies (Europe)
Limited; and, Covalon Technologies AG Ltd. The Company controls an entity when it is exposed to, or has
rights to, variable returns from its involvement with the entity and has the ability to affect those returns through

Covalon Technologies Ltd. NOTES TO THE CONSOLIDATED FINANCIAL STATEMENTS Expressed in Canadian Dollars For the years ended September 30, 2019 and 2018
Page 12 of 33
its power over the entity. The wholly owned subsidiaries of the Company are consolidated from the date control
is obtained. All intercompany transactions, balances, income and expenses have been eliminated upon
consolidation.
Business combinations
The acquisition method of accounting is used to account for business combinations. The consideration
transferred in a business combination is measured at fair value at the date of acquisition. Acquisition-related
transaction costs are recognized in the consolidated statements of operations and comprehensive income (loss)
as incurred. At the acquisition date, the identifiable assets acquired and the liabilities assumed are initially
recognized at their fair value. Goodwill is measured as the excess of the sum of the consideration transferred and
the fair value of the acquirer’s previously held equity interest in the acquiree (if any) over the net of the
acquisition-date amounts of the identifiable assets acquired and liabilities assumed. When the consideration
transferred by the Company in a business combination includes assets or liabilities resulting from a contingent
consideration arrangement, the contingent consideration is measured at its acquisition date fair value and is
included as part of the consideration transferred in a business combination. Changes in the acquisition date fair
values of the identifiable assets, liabilities and contingent consideration that qualify as measurement period
adjustments are adjusted retrospectively, with corresponding adjustments against goodwill. Measurement period
adjustments are adjustments that arise from additional information obtained during the measurement period
(which cannot exceed one year from the acquisition date) about facts and circumstances that existed at the
acquisition date.
Other than measurement period adjustments, contingent consideration that is classified as a financial liability is
remeasured at subsequent reporting dates, with the corresponding gain or loss recognized in the consolidated
statements of operations and comprehensive income (loss).
Segment reporting
Operating segments are reported in a manner consistent with the internal reporting provided to the chief operating
decision maker. The chief operating decision maker has been identified as the chief executive officer.
Foreign currency translation
The Company has a functional currency of Canadian dollars and the functional currency of each subsidiary is
determined based on facts and circumstances relevant for each subsidiary. Where the Company’s presentation
currency of Canadian dollars differs from the functional currency of a subsidiary, the assets and liabilities of the
subsidiary are translated from the functional currency into the presentation currency at the exchange rates as at
the reporting date. The income and expenses of the subsidiaries are translated at rates approximating the
exchange rates at the dates of the transactions. Exchange differences arising on the translation of the consolidated
financial statements of the Company’s subsidiaries are recognized in other comprehensive loss (income).
Foreign currency transactions are translated into the functional currency of the Company or its subsidiaries, using
the exchange rates prevailing at the dates of these transactions. Foreign exchange gains and losses resulting from
the settlement of foreign currency transactions and from the translation at year-end exchange rates of monetary
assets and liabilities denominated in currencies other than an entity’s functional currency are recognized in the
consolidated statements of operations and comprehensive income (loss).

Covalon Technologies Ltd. NOTES TO THE CONSOLIDATED FINANCIAL STATEMENTS Expressed in Canadian Dollars For the years ended September 30, 2019 and 2018
Page 13 of 33
Accounting policy applied from October 1, 2018 – financial assets
From October 1, 2018, the Company classifies its financial assets in the following measurement categories:
those to be measured subsequently at fair value (either through other comprehensive income (loss), or
through profit or loss); and
those to be measured at amortized cost.
The classification depends on the Company’s business model for managing the financial assets and the
contractual terms of the cash flows. The Company does not currently have any assets measured subsequently at
fair value.
At initial recognition, the Company measures a financial asset at its fair value plus, in the case of a financial
asset not at fair value through profit or loss, transaction costs that are directly attributable to the acquisition of
the financial asset.
Financial assets are derecognized when the rights to receive cash flows from the financial assets have expired or
have been transferred and the Company has transferred substantially all the risks and rewards of ownership.
The Company assesses on a forward-looking basis the expected credit losses associated with its financial assets
carried at amortized cost. For accounts receivable, the Company applies the simplified approach permitted by
IFRS 9, which requires lifetime expected credit losses to be recognized at the time of initial recognition of the
receivables.
Inventories
Inventories are valued at the lower of cost and net realizable value. Net realizable value is the estimated selling
price in the ordinary course of business less the estimated costs of completion and the estimated costs necessary
to make the sale. Cost is determined using either the first-in, first-out method or the weighted average cost
method.
Property, plant and equipment
On initial recognition property, plant and equipment are valued at cost, being the purchase price and directly
attributable cost of acquisition or construction required to bring the asset to the location and condition necessary
to be capable of operating in the manner intended by the Company. When parts of an item of property, plant and
equipment have different useful lives they are accounted for as separate items (major components) of property,
plant and equipment. Property, plant and equipment is subsequently measured at cost less accumulated
depreciation, and any accumulated impairment losses.
Covalon Technologies Ltd. NOTES TO THE CONSOLIDATED FINANCIAL STATEMENTS Expressed in Canadian Dollars For the years ended September 30, 2019 and 2018
Page 14 of 33
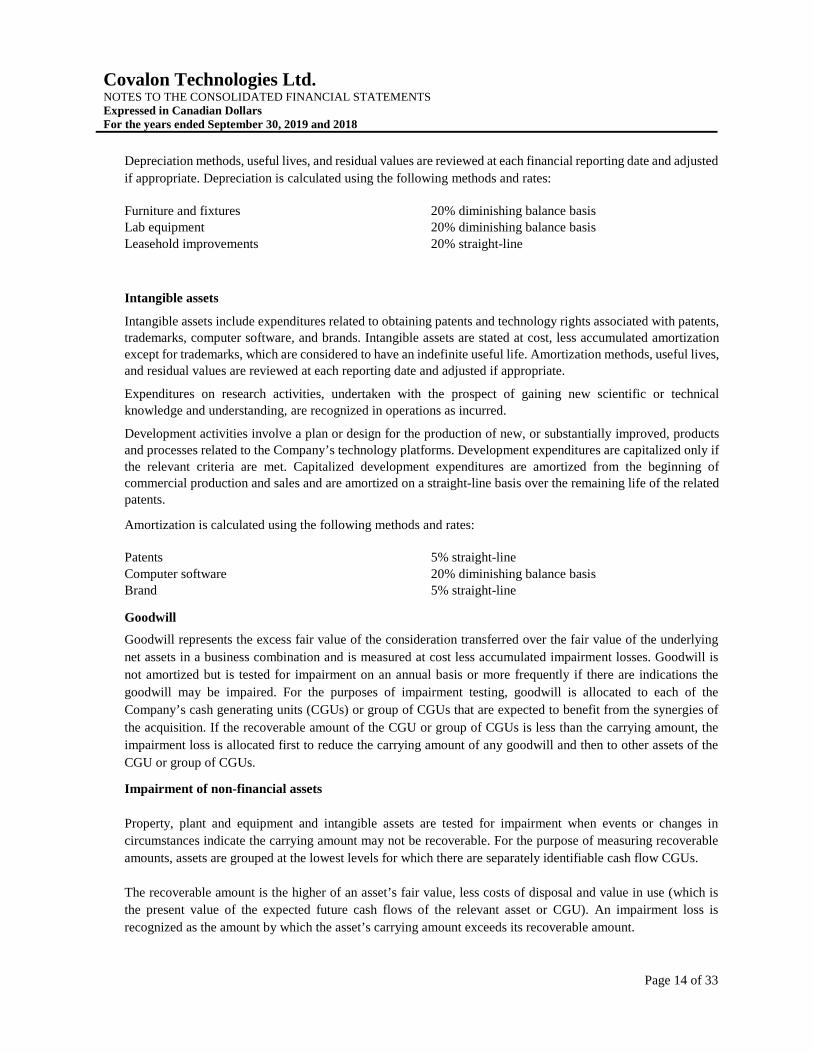
Depreciation methods, useful lives, and residual values are reviewed at each financial reporting date and adjusted
if appropriate. Depreciation is calculated using the following methods and rates:
Furniture and fixtures 20% diminishing balance basis Lab equipment 20% diminishing balance basis
Leasehold improvements 20% straight-line
Intangible assets
Intangible assets include expenditures related to obtaining patents and technology rights associated with patents, trademarks, computer software, and brands. Intangible assets are stated at cost, less accumulated amortization
except for trademarks, which are considered to have an indefinite useful life. Amortization methods, useful lives, and residual values are reviewed at each reporting date and adjusted if appropriate.
Expenditures on research activities, undertaken with the prospect of gaining new scientific or technical
knowledge and understanding, are recognized in operations as incurred.
Development activities involve a plan or design for the production of new, or substantially improved, products and processes related to the Company’s technology platforms. Development expenditures are capitalized only if
the relevant criteria are met. Capitalized development expenditures are amortized from the beginning of commercial production and sales and are amortized on a straight-line basis over the remaining life of the related patents.
Amortization is calculated using the following methods and rates:
Patents 5% straight-line
Computer software 20% diminishing balance basis Brand 5% straight-line
Goodwill
Goodwill represents the excess fair value of the consideration transferred over the fair value of the underlying
net assets in a business combination and is measured at cost less accumulated impairment losses. Goodwill is
not amortized but is tested for impairment on an annual basis or more frequently if there are indications the
goodwill may be impaired. For the purposes of impairment testing, goodwill is allocated to each of the
Company’s cash generating units (CGUs) or group of CGUs that are expected to benefit from the synergies of
the acquisition. If the recoverable amount of the CGU or group of CGUs is less than the carrying amount, the
impairment loss is allocated first to reduce the carrying amount of any goodwill and then to other assets of the
CGU or group of CGUs.
Impairment of non-financial assets
Property, plant and equipment and intangible assets are tested for impairment when events or changes in
circumstances indicate the carrying amount may not be recoverable. For the purpose of measuring recoverable
amounts, assets are grouped at the lowest levels for which there are separately identifiable cash flow CGUs.
The recoverable amount is the higher of an asset’s fair value, less costs of disposal and value in use (which is
the present value of the expected future cash flows of the relevant asset or CGU). An impairment loss is
recognized as the amount by which the asset’s carrying amount exceeds its recoverable amount.

Covalon Technologies Ltd. NOTES TO THE CONSOLIDATED FINANCIAL STATEMENTS Expressed in Canadian Dollars For the years ended September 30, 2019 and 2018
Page 15 of 33
The Company evaluates impairment losses for potential reversals when events or circumstances warrant such
consideration.
Accounts payable and accrued liabilities
These amounts represent liabilities for goods and services provided to the Company before the end of the
financial year, which are unpaid. Accounts payable and accrued liabilities are presented as current liabilities
unless payment is not due within 12 months after the reporting period.
Debt
Debt is initially recognized at fair value, net of transaction costs incurred. Debt is subsequently measured at
amortized cost. Any difference between the proceeds (net of transaction costs) and the redemption amount is
recognized in the consolidated statements of operations and comprehensive income (loss) over the period of the
debt using the effective interest method.
Debt is removed from the consolidated balance sheets when the obligation specified in the contract is discharged,
cancelled or expired. The difference between the carrying amount of a financial liability that has been
extinguished and the consideration paid is recognized in the consolidated statements of operations and
comprehensive income (loss) within finance expenses.
Revenue
The Company generates revenue from product sales, development and consulting services, as well as licensing,
and royalty fees.
Product revenue is recognized when control over products has been transferred to the customer and this either
occurs when products are shipped or delivered based upon the contractual agreements in place. The amount of
revenue is recorded as the amount that the Company expects to be entitled to in exchange for transferring the
promised goods net of estimated returns, chargebacks, or discounts.
Development, and consulting revenue is recognized over the period in which the services are performed.
The Company may enter into product development, consulting, licensing, and royalty agreements with
customers. The terms of the agreements may include non-refundable signing fees, milestone payments, hourly
rates, or royalty fees. These multiple element arrangements are analysed to determine whether the deliverables
can be separated or whether they must be accounted for as a single unit of accounting. Upfront fees are recognized
as revenue when persuasive evidence of an arrangement exists, the fee is fixed or determinable, delivery or
performance has been substantially completed and collection is reasonably assured. If there are no substantive
performance obligations over the life of the contract, the upfront non-refundable payment is recognized when
the underlying performance obligation is satisfied. If substantive contractual obligations are satisfied over time
or over the life of the contract, revenue is deferred and recognized over the performance period. The term over
which upfront fees are recognized is revised if the period over which the Company maintains substantive
contractual obligations changes. Service revenue is recognized over the period in which the services are
performed.
In some instances, cash is received before the Company has satisfied the performance obligations and this amount
is recorded as deferred revenue.

Covalon Technologies Ltd. NOTES TO THE CONSOLIDATED FINANCIAL STATEMENTS Expressed in Canadian Dollars For the years ended September 30, 2019 and 2018
Page 16 of 33
Income taxes
Income taxes are accounted for using the liability method. Deferred tax assets and liabilities are recognized for
the differences between the tax basis and carrying amounts of assets and liabilities, for operating losses and for
tax credit carry-forwards. Deferred tax assets are recognized to the extent that it is probable that future taxable
income will be available against which temporary differences can be utilized. Deferred tax assets and liabilities
are measured using enacted or substantively enacted tax rates and laws.
Share-based compensation
The Company grants stock options periodically to certain directors, officers, employees or service providers.
Options currently outstanding vest over three years and have a contractual life of five years. Each tranche in an
award is considered a separate award with its own vesting period and grant date fair value. The fair value of each
tranche is measured at the date of grant using the Black-Scholes option pricing model. Compensation expense is
recognized over the tranche’s vesting period using the graded vesting method by increasing contributed surplus
based on the number of awards expected to vest.
Leases
Leases are classified as finance leases when the lease arrangement transfers substantially all of the risks and
rewards related to the ownership of the leased asset. All other leases are treated as operating leases. Payments
on operating lease agreements are recognized as an expense on a straight-line basis over the lease term.
Associated costs, such as maintenance and insurance, are expensed as incurred.
Earnings (loss) per share
Basic earnings (loss) per share is calculated by dividing the net loss by the weighted average number of common
shares outstanding during the year. Diluted earnings (loss) per share is calculated by dividing the applicable net
loss by the sum of the weighted average number of shares outstanding during the year and all additional common
shares that would have been outstanding if potentially dilutive common shares had been issued during the year.
Adoption of new accounting standards
A number of new amended standards became applicable for the current reporting period and the Company had
to change its accounting policies as a result. The impact of the adoption of these standards is disclosed below:
IFRS 9, Financial Instruments (“IFRS 9”)
IFRS 9, Financial Instruments replaces the provisions of International Accounting Standard (IAS) 39, Financial
Instruments – Recognition and Measurement (“IAS 39”) that relate to the recognition, classification and
measurement of financial assets and financial liabilities, derecognition of financial instruments, impairment of
financial assets and hedge accounting. The adoption of IFRS 9 from October 1, 2018 resulted in changes in the
Company’s accounting policies but it did not result in any adjustments.

Covalon Technologies Ltd. NOTES TO THE CONSOLIDATED FINANCIAL STATEMENTS Expressed in Canadian Dollars For the years ended September 30, 2019 and 2018
Page 17 of 33
The Company has applied IFRS 9 retrospectively, but has elected not to restate comparative information. As a
result, the comparative information provided continues to be accounted for in accordance with the Company’s
previous accounting policy.
The Company has one type of financial asset that is subject to IFRS 9’s new expected credit loss model, which
is accounts receivable. The Company was required to revise its impairment methodology under IFRS 9 for
accounts receivable and this resulted in no adjustments as at October 1, 2018. The Company applies the IFRS 9
simplified approach to measuring expected credit losses, which uses a lifetime expected loss allowance for all
accounts receivable. To measure the expected credit losses, accounts receivable have been grouped based on
shared credit risk characteristics and the days past due. On that basis, the loss allowance as at October 1, 2018
and September 30, 2019 is nominal and has not incurred significant credit losses.
Accounts receivable are written off when there is no reasonable expectation of recovery. Indicators that there is
no reasonable expectation of recovery include, among others, failure to make contractual payments for an
extended period of time.
There was no impact on the Company’s financial liabilities as a result of the adoption of IFRS 9 and no
material change to the Company’s accounting policies for financial liabilities.
The following table shows the original financial instrument classification under IAS 39 and the new classification
under IFRS 9:
Financial instrument Classification under IFRS 9 Classification under IAS 39Cash and cash equivalents Amortized cost Loans and receivablesAccounts receivable Amortized cost Loans and receivablesRestricted cash Amortized cost Loans and receivablesDebt Amortized cost Other financial liabilitiesAcquisition note payable Amortized cost Other financial liabilitiesTrade and other payables Amortized cost Other financial liabilities
IFRS 15, Revenue from Contracts with Customers (“IFRS 15”)
IFRS 15, Revenue from Contracts with Customers amends revenue recognition requirements and establishes
principles for reporting information about the nature, amount, timing and uncertainty of revenue and cash
flows arising from contracts with customers. The adoption of IFRS 15 from October 1, 2018 did not result in
any adjustments. In accordance with the transitional provisions in IFRS 15, the Company has adopted the new
rules on a full retrospective basis.
Accounting standards issued but not yet adopted
IFRS 16, Leases (“IFRS 16”)
On January 13, 2016, the IASB published a new standard, IFRS 16. The new standard will eliminate the
distinction between operating and finance leases and will bring most leases onto the consolidated balance sheet
for lessees. This standard is effective for annual reporting periods beginning on or after January 1, 2019. The
Company intends to adopt IFRS 16 in its consolidated financial statements for the annual period beginning

Covalon Technologies Ltd. NOTES TO THE CONSOLIDATED FINANCIAL STATEMENTS Expressed in Canadian Dollars For the years ended September 30, 2019 and 2018
Page 18 of 33
October 1, 2019. As the Company has significant contractual obligations in the form of operating leases under
current IFRS, there will be a material increase to both assets and liabilities on adoption of IFRS 16, and
changes to the timing of recognition of expenses associated with the lease arrangements. The Company is
analyzing the new standard to determine its impact on the Company’s consolidated balance sheets and
consolidated statements of operations and comprehensive income (loss). The Company expects to adopt IFRS
16 using the modified retrospective transition method. Further, the Company currently expects to apply the
following practical expedients: (i) grandfather the assessment of which transactions are leases; (ii) recognition
exemption of short-term leases; and (iii) recognition exemption leases of low-value items.
IFRIC 23, Uncertainty over Income Tax Treatments (“IFRIC 23”)
In June 2017, the IASB issued IFRIC 23, with a mandatory effective date of January 1, 2019. The
interpretations provide guidance on how to value uncertain income tax positions based on the probability of
whether the relevant tax authorities will accept the Company’s tax treatments. A Company is to assume that a
taxation authority with the right to examine any amounts reported to it will examine those amounts and will
have full knowledge of all relevant information when doing so. IFRIC 23 is to be applied by recognizing the
cumulative effect of initially applying these guidelines in opening deficit without adjusting comparative
information. The Company currently expects no impact in applying the new standard.
4. CRITICAL ACCOUNTING ESTIMATES AND JUDGMENTS
Accounting for acquisitions
The Company assessed whether an acquisition should be accounted for as an asset acquisition or a business
combination under IFRS 3, Business Combinations (“IFRS 3”). This assessment requires management to assess
whether the assets acquired and liabilities assumed constitute a business as defined in IFRS 3 and if the integrated
set of activities, including input and processes acquired, is capable of being conducted and managed as a business
and the Company obtains control of the business. The Company’s acquisition has been accounted for as a
business combination. Areas of estimation include the determination and fair value measurement of the
contingent consideration, the probability of the contingency being achieved, and the discount rate. Management
is also required to make estimates of the fair value of assets acquired and liabilities assumed.
Impairment of non-financial assets
The Company reviews amortized non-financial assets for impairment whenever events or changes in
circumstances indicate the carrying amount of the assets may be impaired. It also reviews goodwill annually
for impairment. If the recoverable amount of the respective non-financial asset is less than its carrying amount,
it is considered to be impaired. In the process of measuring the recoverable amount, management makes
assumptions about future events and circumstances. The actual results may vary and may cause significant
adjustments.
5. BUSINESS COMBINATION
On October 1, 2018, Covalon completed the acquisition of AquaGuard, a Seattle, Washington-based division of
medical technologies company Cenorin, LLC. AquaGuard's specialized products provide patients with crucial
moisture protection for wound, surgical, and vascular access sites throughout the body while showering.
Covalon Technologies Ltd. NOTES TO THE CONSOLIDATED FINANCIAL STATEMENTS Expressed in Canadian Dollars For the years ended September 30, 2019 and 2018
Page 19 of 33
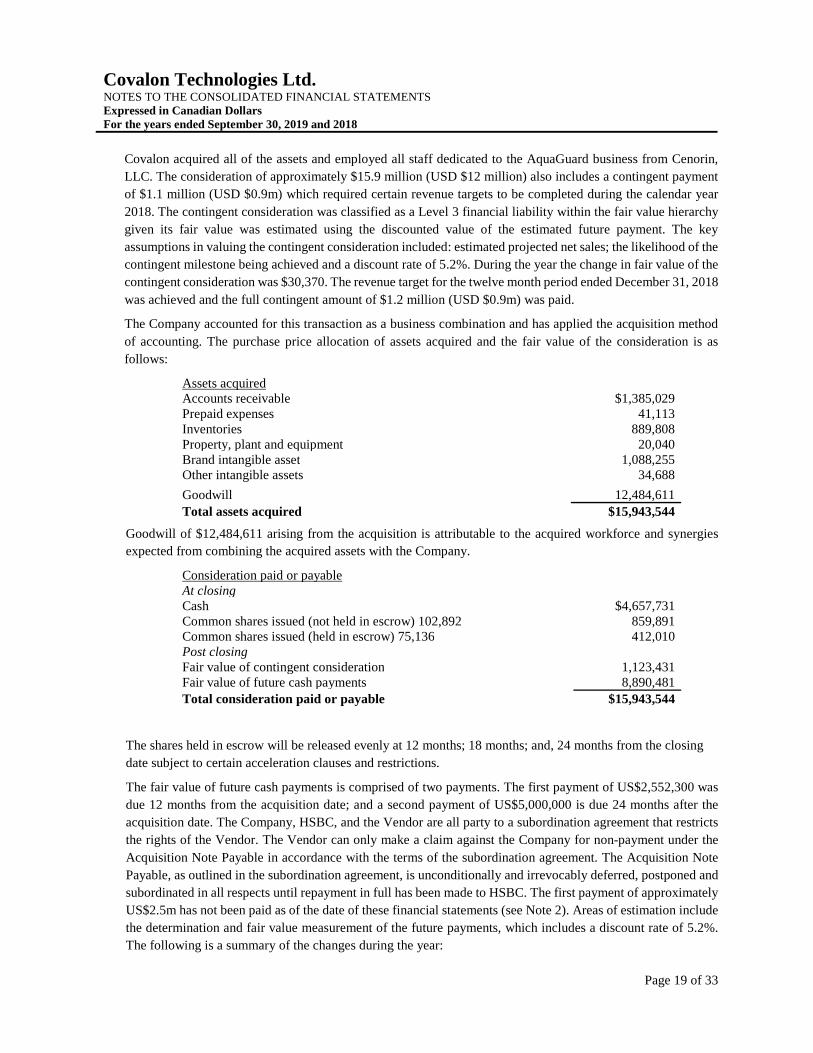
Covalon acquired all of the assets and employed all staff dedicated to the AquaGuard business from Cenorin,
LLC. The consideration of approximately $15.9 million (USD $12 million) also includes a contingent payment
of $1.1 million (USD $0.9m) which required certain revenue targets to be completed during the calendar year
2018. The contingent consideration was classified as a Level 3 financial liability within the fair value hierarchy
given its fair value was estimated using the discounted value of the estimated future payment. The key
assumptions in valuing the contingent consideration included: estimated projected net sales; the likelihood of the
contingent milestone being achieved and a discount rate of 5.2%. During the year the change in fair value of the
contingent consideration was $30,370. The revenue target for the twelve month period ended December 31, 2018
was achieved and the full contingent amount of $1.2 million (USD $0.9m) was paid.
The Company accounted for this transaction as a business combination and has applied the acquisition method
of accounting. The purchase price allocation of assets acquired and the fair value of the consideration is as
follows:
Assets acquired Accounts receivable $1,385,029Prepaid expenses 41,113Inventories 889,808Property, plant and equipment 20,040Brand intangible asset 1,088,255Other intangible assets 34,688
Goodwill 12,484,611
Total assets acquired $15,943,544
Goodwill of $12,484,611 arising from the acquisition is attributable to the acquired workforce and synergies
expected from combining the acquired assets with the Company.
Consideration paid or payableAt closingCash $4,657,731Common shares issued (not held in escrow) 102,892 859,891Common shares issued (held in escrow) 75,136 412,010Post closingFair value of contingent consideration 1,123,431Fair value of future cash payments 8,890,481
Total consideration paid or payable $15,943,544
The shares held in escrow will be released evenly at 12 months; 18 months; and, 24 months from the closing
date subject to certain acceleration clauses and restrictions.
The fair value of future cash payments is comprised of two payments. The first payment of US$2,552,300 was
due 12 months from the acquisition date; and a second payment of US$5,000,000 is due 24 months after the
acquisition date. The Company, HSBC, and the Vendor are all party to a subordination agreement that restricts
the rights of the Vendor. The Vendor can only make a claim against the Company for non-payment under the
Acquisition Note Payable in accordance with the terms of the subordination agreement. The Acquisition Note
Payable, as outlined in the subordination agreement, is unconditionally and irrevocably deferred, postponed and
subordinated in all respects until repayment in full has been made to HSBC. The first payment of approximately
US$2.5m has not been paid as of the date of these financial statements (see Note 2). Areas of estimation include
the determination and fair value measurement of the future payments, which includes a discount rate of 5.2%.
The following is a summary of the changes during the year:

Covalon Technologies Ltd. NOTES TO THE CONSOLIDATED FINANCIAL STATEMENTS Expressed in Canadian Dollars For the years ended September 30, 2019 and 2018
Page 20 of 33
Fair value ($)
Balance at acquisition 8,890,481
Accretion 479,578
Foreign exchange 304,152
Balance at September 30, 2019 9,674,211
Acquisition related costs of $473,015 have been charged to general and administrative expense during the year.
During the year ended September 30, 2019, there was revenue of $13,521,092 and a net loss and comprehensive
loss of $(2,468,059) recorded in the consolidated statements of operations and comprehensive income (loss)
related to the former AquaGuard business.
6. INVENTORIES
Inventories consist of the following:
September 30, September 30,2019 2018
Raw materials $2,347,981 $1,546,489 Finished goods 6,293,426 4,083,155
Inventory provision (176,124) (65,105)
$8,581,378 $5,564,539
Cost of product sales for the year ended September 30, 2019 include $10,213,576 (2018 - $6,751,698), respectively in inventoried materials.
7. INTANGIBLE ASSETS AND GOODWILL
Goodwill is comprised of the following amounts:
Goodwill ($)
Balance at September 30, 2018 -Acquisition 12,484,611
Foreign exchange 439,801
Balance at September 30, 2019 12,924,412
In accordance with the Company’s accounting policy, the carrying value of goodwill is assessed annually as
well as assessed for impairment triggers at each reporting date to determine whether there exists any indicators
of impairment. When there is an indicator of impairment of non-current assets within a CGU or group of CGUs
containing goodwill, the Company tests the non-current assets for impairment first and recognizes any
impairment loss on goodwill before applying any remaining impairment loss against the non-current assets
within the CGU.
The Company completed its annual goodwill impairment testing on the goodwill related to the
AquaGuard CGU, which comprises all of the goodwill of the Company at September 30, 2019. The
recoverable amount of the AquaGuard CGU was calculated using fair value less costs of disposal (FVLCD).

Covalon Technologies Ltd. NOTES TO THE CONSOLIDATED FINANCIAL STATEMENTS Expressed in Canadian Dollars For the years ended September 30, 2019 and 2018
Page 21 of 33
The calculation of the recoverable amount of the AquaGuard CGU was determined using discounted cash flow
projections based on financial forecasts approved by management covering a five-year period (Level 3 of the
fair value hierarchy) and a terminal growth assumption of 2%. The key assumptions and estimates used in
determining the FVLCD are related to revenue and EBITDA assumptions, which are based on the financial
forecast and assumed growth rates, working capital assumptions, the effective tax rate of 21% and the discount
rate of 15.5% applied to the cash flow projections. As a result of the impairment testing performed, it was
determined that the recoverable amount of the AquaGuard CGU of $18.2m exceeded the carrying value of
$14.8m and no impairment writedown was required.
Intangible assets are comprised of the following amounts:
Deferred Development
Costs ($) Brand
($) Patents
($) Trademarks
($)
Computer Software
($) Total
($)
CostBalance at September 30, 2017 2,036,709 - 954,041 74,989 142,078 3,207,817
Additions - - 13,610 - - 13,610 Impairment - - (66,578) - - (66,578)
Foreign exchange 122,549 - 16,189 2,794 5,294 146,826
Balance at September 30, 2018 2,159,258 - 917,262 77,783 147,372 3,301,675 Acquisition - 1,088,255 25,395 3,411 5,882 1,122,943 Additions - - - - 19,943 19,943
Foreign exchange 49,707 37,400 21,988 1,908 3,516 114,519
Balance at September 30, 2019 2,208,965 1,125,655 964,645 83,102 176,713 4,559,080
Accumulated amortizationBalance at September 30, 2017 1,251,943 - 281,231 - 139,265 1,672,439
Amortization 107,023 - 40,862 - 579 148,464 Impairment - - (3,207) - - (3,207)
Foreign exchange 94,250 - 14,189 - 5,194 113,633
Balance at September 30, 2018 1,453,216 - 333,075 - 145,038 1,931,329 Amortization 110,674 56,257 50,993 - 6,218 224,142
Foreign exchange 33,228 26 8,847 - 3,320 45,421
Balance at September 30, 2019 1,597,118 56,283 392,915 - 154,576 2,200,892
Carrying amounts At September 30, 2018 706,042 - 584,187 77,783 2,334 1,370,346
At September 30, 2019 611,847 1,069,372 571,730 83,102 22,137 2,358,188
Covalon Technologies Ltd. NOTES TO THE CONSOLIDATED FINANCIAL STATEMENTS Expressed in Canadian Dollars For the years ended September 30, 2019 and 2018
Page 22 of 33
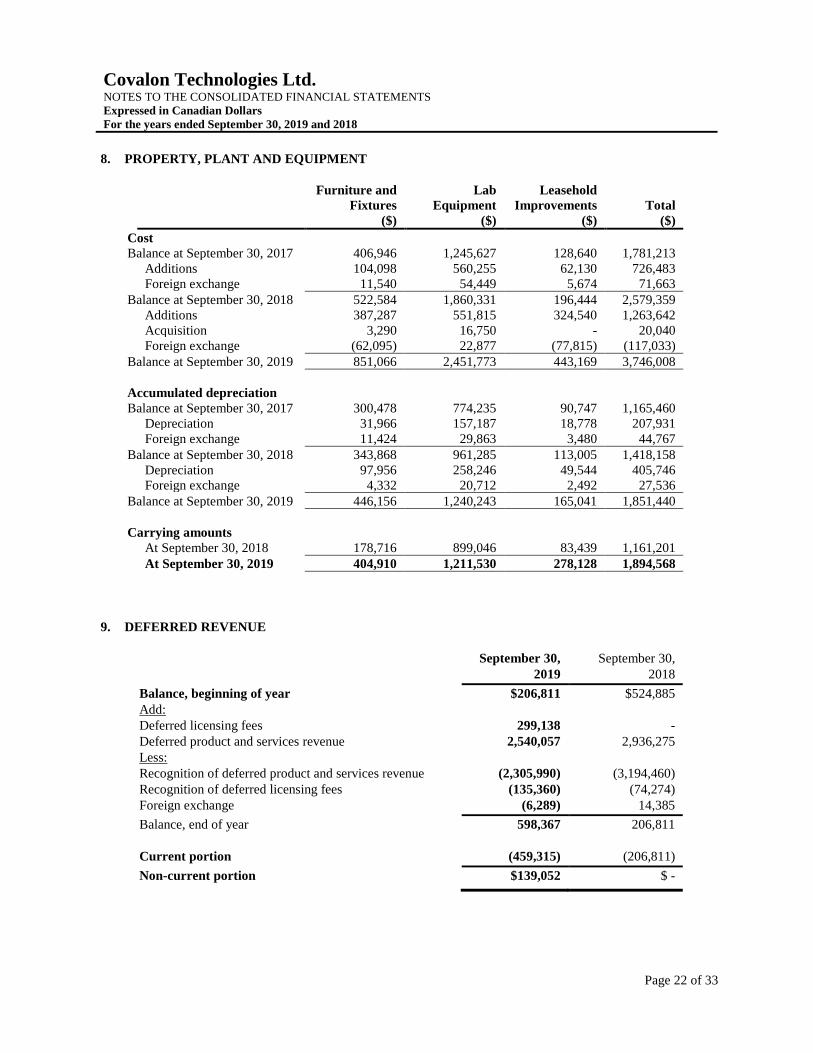
8. PROPERTY, PLANT AND EQUIPMENT
Furniture and Fixtures
($)
Lab Equipment
($)
Leasehold Improvements
($) Total
($)
Cost Balance at September 30, 2017 406,946 1,245,627 128,640 1,781,213
Additions 104,098 560,255 62,130 726,483 Foreign exchange 11,540 54,449 5,674 71,663
Balance at September 30, 2018 522,584 1,860,331 196,444 2,579,359 Additions 387,287 551,815 324,540 1,263,642 Acquisition 3,290 16,750 - 20,040 Foreign exchange (62,095) 22,877 (77,815) (117,033)
Balance at September 30, 2019 851,066 2,451,773 443,169 3,746,008
Accumulated depreciation Balance at September 30, 2017 300,478 774,235 90,747 1,165,460
Depreciation 31,966 157,187 18,778 207,931 Foreign exchange 11,424 29,863 3,480 44,767
Balance at September 30, 2018 343,868 961,285 113,005 1,418,158 Depreciation 97,956 258,246 49,544 405,746 Foreign exchange 4,332 20,712 2,492 27,536
Balance at September 30, 2019 446,156 1,240,243 165,041 1,851,440
Carrying amounts At September 30, 2018 178,716 899,046 83,439 1,161,201
At September 30, 2019 404,910 1,211,530 278,128 1,894,568
9. DEFERRED REVENUE
September 30, September 30, 2019 2018
Balance, beginning of year $206,811 $524,885 Add: Deferred licensing fees 299,138 - Deferred product and services revenue 2,540,057 2,936,275 Less: Recognition of deferred product and services revenue (2,305,990) (3,194,460) Recognition of deferred licensing fees (135,360) (74,274) Foreign exchange (6,289) 14,385
Balance, end of year 598,367 206,811
Current portion (459,315) (206,811)
Non-current portion $139,052 $ -

Covalon Technologies Ltd. NOTES TO THE CONSOLIDATED FINANCIAL STATEMENTS Expressed in Canadian Dollars For the years ended September 30, 2019 and 2018
Page 23 of 33
10. DEBT
During the year ended September 30, 2018, the Company entered into the Facility with HSBC. This Facility
provides credit of up to approximately $17 million and is comprised of:
• An Acquisition Line of $9,000,000;
• A revolving operating line of $5,000,000;
• A guarantee facility of $2,000,000 (USD); and,
• Other facilities of $480,000 (USD) and $100,000 for other liabilities.
The Facility is secured by a General Security Agreement which also includes the wholly owned subsidiaries.
The Company is also subject to financial covenant and certain reporting requirements. These covenants include:
1) funded debt to adjusted EBIDTA; 2) fixed charged coverage ratio; and, 3) current ratio. As of September 30,
2019, the Company was not able to fulfill all financial covenants as stipulated under the Facility, for the
Acquisition Line, which constituted an event of default. Since the Company did not have an unconditional right
to defer the settlement of the debt for at least 12 months, IFRS requires the liability to be classified as current as
at September 30, 2019. The carrying amount of the acquisition line is $4,872,966 as of September 30, 2019.
Subsequent to September 30, 2019, the Company obtained a waiver and amendment to the Facility from HSBC
for the breach of covenants thereof as described in Note 2.
A reconciliation of the operating line is as follows:
September 30, 2019 ($)
Balance – October 1, 2018 1,526,928Proceeds received 2,350,000
Interest accrued during the year 149,715
Interest paid during the year (149,715)
Repayment of principal (326,928)Balance – Ending 3,550,000
Less: Current portion 3,550,000Non-current portion -
As of September 30, 2019, the Company has $3,550,000 drawn and outstanding on the revolving operating line.
This facility is repayable on demand by HSBC which could occur if there was a deficiency in the borrowing
base of assets used to support this line. The interest rate associated with the operating line is Prime Rate plus
1.0%. During the year ended September 30, 2019, the Company recognized $149,715 of interest expense on this
loan.

Covalon Technologies Ltd. NOTES TO THE CONSOLIDATED FINANCIAL STATEMENTS Expressed in Canadian Dollars For the years ended September 30, 2019 and 2018
Page 24 of 33
A reconciliation of the Acquisition Line is as follows:
September 30, 2019 ($)
Balance – October 1, 2018 -Proceeds received 5,941,005Repayments of principal (1,080,000)Interest accrued during the year 240,557Interest paid during the year (259,848)Accretion 31,252 Balance – Ending 4,872,966
Less: Current portion 4,872,966Non-current portion -
To facilitate the AquaGuard acquisition (discussed in Note 5) the Company drew funds against the Acquisition
Line. This facility is repayable on demand by HSBC which could occur if there was a default on the financial
covenants. As of September 30, 2019, the Company has $4,872,966 drawn and outstanding on the acquisition
line. During the year ended September 30, 2019, the Company recognized $240,557 of interest and accretion
expense on the Acquisition Line. The Company will require HSBC approval to further access funds available
under this line (as discussed in Note 2).
11. SHAREHOLDERS’ EQUITY
Common shares
The Company is authorized to issue an unlimited number of common shares with no par value. All shares are
fully paid.
On September 18, 2019, the Company completed a non-brokered private placement offering comprised of
2,750,000 units (each, a “Unit”) of the Corporation at a price of $2.00 per unit for aggregate gross proceeds
of $5,500,000 (the “Offering”). Each Unit is comprised of one common share of the Company
(a “Common Share”) and one Common Share purchase warrant (a “Warrant”). Each Warrant entitles the holder
to acquire an additional Common Share at a price of $2.00 per share for a period of five years from the closing
date.
During the year ended September 30, 2019, 803,850 warrants were exercised for common shares of the Company
for aggregate proceeds of $1,848,857.
During the year ended September 30, 2019, 77,669 stock options were exercised for proceeds of $156,540.
Additionally, $120,744 of contributed surplus related those stock options was reclassified to share capital.
On October 1, 2018, Covalon acquired AquaGuard, a division of Cenorin LLC., and issued 102,891 common
shares as a closing share payment (see Note 5). These shares were valued at $859,891 based on the Company’s
closing share price at the acquisition date. In addition, 75,136 common shares of the Company were issued in
escrow with release at 12 months, 18 months and 24 months after the acquisition date. These shares were valued
at $412,010 based on the share price at the date of acquisition, reduced for the implied cost of synthetically
calculated put options to reflect the escrow release dates.
Warrants
As a result of the September 18, 2019 private placement, the Company issued 2,750,000 warrants. The Company
estimated the fair value of the warrants using the Black-Scholes option pricing model with the following

Covalon Technologies Ltd. NOTES TO THE CONSOLIDATED FINANCIAL STATEMENTS Expressed in Canadian Dollars For the years ended September 30, 2019 and 2018
Page 25 of 33
assumptions: share price - $1.91, average risk-free rate of interest - 1.23%, dividend rate - Nil, volatility –
87.67% and a term of 5 years. The fair value of the warrants issued was $3,547,955, or $1.29 per warrant, and
was included in contributed surplus.
The following is a summary of all warrants:
Number of Warrants
Weighted average exercise
Price
Weighted Average Expiry
(years)
Balance at October 1, 2017 1,310,671 $2.18
Exercised during the year 231,373 $1.63
Balance at September 30, 2018 1,079,298 $2.30 1.67
Exercised during the year 803,851 $2.30
Issued during the year 2,750,000 $2.00
Balance at September 30, 2019 3,025,447 $2.03 4.58
12. SHARE-BASED PAYMENTS
Option plan details
The Company has a Stock Option Plan (“the Plan”) under which non-transferable options to purchase common
shares of the Company may be granted to directors, officers, employees, or service providers of the Company.
The terms of the Plan provide that the Directors have the right to grant options to acquire common shares of the
Company at not less than the closing market price of the shares on the day preceding the grant at terms of up to
five years. No amounts are paid or payable by the recipient on receipt of the option, and the options granted are
not dependent on any performance-based criteria. Unless the board of directors decides otherwise, options
granted under the plan will vest as follows: 33% of the options vest in one year, with a further 33% vesting in
each of the subsequent two years on the anniversary of the initial grant date.

Covalon Technologies Ltd. NOTES TO THE CONSOLIDATED FINANCIAL STATEMENTS Expressed in Canadian Dollars For the years ended September 30, 2019 and 2018
Page 26 of 33
The following is a summary of change in stock options from October 1, 2017 to September 30, 2018:
Grant Date
Expiry Date
Exercise Price
Opening Balance
Granted Exercised Expired Forfeited Closing Balance
Vested Unvested
Weighted Average Expiry (years)
16-Aug-13 16-Aug-18 $0.16 40,000 - (35,000) (5,000) - - - - -
26-Sep-13 26-Sep-18 $0.85 230,000 - (230,000) - - - - - 0.01
13-Jun-14 13-Jun-19 $2.00 85,001 - (50,000) - - 35,001 35,001 - 0.70
26-Mar-15 26-Mar-20 $1.40 134,666 - (34,000) - - 100,666 100,666 - 1.49
7-Mar-16 7-Mar-21 $1.13 164,166 - (29,169) - (10,000) 124,997 80,275 44,722 2.44
23-Jun-16 23-Jun-21 $1.29 174,999 - (31,667) - - 143,332 84,999 58,333 2.73
14-Sep-16 14-Sep-21 $2.29 65,000 - - - (35,000) 30,000 20,000 10,000 2.96
8-Feb-17 8-Feb-22 $2.20 260,000 - (23,333) - (5,000) 231,667 63,334 168,333 3.36
20-Jun-17 20-Jun-22 $2.47 422,500 - (19,000) - (20,000) 383,500 121,833 261,667 3.72
25-Oct-17 25-Oct-22 $3.80 - 60,000 - - - 60,000 - 60,000 4.07
21-Dec-17 21-Dec-22 $4.65 - 187,500 - - - 187,500 - 187,500 4.23
24-Jan-18 24-Jan-23 $6.02 - 60,000 - - - 60,000 - 60,000 4.32
27-Sep-18 27-Sep-23 $8.50 - 155,000 - - - 155,000 - 155,000 4.99
1,576,332 462,500 (452,169) (5,000) (70,000) 1,511,663 506,108 1,005,555 3.46
Weighted Average Exercise Price $1.74 $6.01 $1.15 $0.16 $2.17 $3.20 $1.77 $3.92
The following is a summary of changes in stock options from October 1, 2018 to September 30, 2019:
Grant Date
Expiry Date
Exercise Price
Opening Balance
Granted Exercised Forfeited Closing Balance
Vested Unvested
Weighted Average Expiry (years)
13-Jun-14 13-Jun-19 $2.00 35,001 - (30,001) (5,000) - - - -
26-Mar-15 26-Mar-20 $1.40 100,666 - (21,667) (5,000) 73,999 73,999 - 0.49
7-Mar-16 7-Mar-21 $1.13 124,997 - (12,499) (12,498) 100,000 100,000 - 1.44
23-Jun-16 23-Jun-21 $1.29 143,332 - (6,668) (20,832) 115,832 115,832 - 1.73
14-Sep-16 14-Sep-21 $2.29 30,000 - - (10,000) 20,000 20,000 - 1.96
8-Feb-17 8-Feb-22 $2.20 231,667 - (3,334) (60,000) 168,333 112,222 56,111 2.36
20-Jun-17 20-Jun-22 $2.47 383,500 - (3,500) (31,667) 348,333 232,222 116,111 2.72
25-Oct-17 25-Oct-22 $3.80 60,000 - - - 60,000 20,000 40,000 3.07
21-Dec-17 21-Dec-22 $4.65 187,500 - - (20,000) 167,500 55,833 111,667 3.23
24-Jan-18 24-Jan-23 $6.02 60,000 - - - 60,000 20,000 40,000 3.32
27-Sep-18 27-Sep-23 $8.50 155,000 - - (12,500) 142,500 47,500 95,000 3.99
22-Dec-18 22-Dec-23 $4.28 - 425,000 - (73,333) 351,667 - 351,667 4.23
15-Mar-19 15-Mar-24 $5.03 - 182,500 - - 182,500 - 182,500 4.46
1,511,663 607,500 (77,669) (250,830) 1,790,664 797,608 993,056 3.10
Weighted Average Exercise Price $3.20 $4.51 $1.66 $3.21 $3.71 $2.62 $4.58

Covalon Technologies Ltd. NOTES TO THE CONSOLIDATED FINANCIAL STATEMENTS Expressed in Canadian Dollars For the years ended September 30, 2019 and 2018
Page 27 of 33
Fair value of options issued during the year
During the year ended September 30, 2019, the Company issued the following options:
On March 15, 2019, 182,500 options with a weighted average fair value of $3.37 were granted. The fair market
value of options granted was determined using the Black-Scholes valuation model with the following implicit
assumptions: average risk-free rate of interest – 1.79%, dividend rate – NIL, volatility – 89.15% and an expected
life of 5 years. The estimated forfeiture rate is 7.47%.
On December 22, 2018, 425,000 options with a weighted average fair value of $2.93 were granted. The fair
market value of options granted was determined using the Black-Scholes valuation model with the following
implicit assumptions: average risk-free rate of interest – 2.26%, dividend rate – NIL, volatility – 91.6% and an
expected life of 5 years. The estimated forfeiture rate is 7.52%.
During the year ended September 30, 2018, the Company issued the following options:
On September 27, 2018, 155,000 options with a weighted average fair value of $5.86 were granted. Trading
price of the stock at the time of the grant was $8.50. The fair market value of options granted was determined
using the Black-Scholes valuation model with the following implicit assumptions: average risk-free rate of
interest – 2.2%, dividend rate – NIL, average volatility – 92.5% and an average term of 5 years. The estimated
forfeiture rate is 6.71%.
On January 24, 2018, 60,000 options with a weighted average fair value of $4.44 were granted. Trading price of
the stock at the time of the grant was $6.02. The fair market value of options granted was determined using the
Black-Scholes valuation model with the following implicit assumptions: average risk-free rate of interest –
1.77%, dividend rate – NIL, average volatility – 103.31% and an average term of 5 years. The estimated
forfeiture rate is 6.07%.
On December 21, 2017, 187,500 options with a weighted average fair value of $3.51 were granted. Trading price
of the stock at the time of the grant was $4.65. The fair market value of options granted was determined using
the Black-Scholes valuation model with the following implicit assumptions: average risk-free rate of interest –
1.57%, dividend rate – NIL, average volatility – 107.36% and an average term of 5 years. The estimated
forfeiture rate is 5.87%.
On October 25, 2017, 60,000 options with a weighted average fair value of $3.05 were granted. Trading price
of the stock at the time of the grant was $3.80. The fair market value of options granted was determined using
the Black-Scholes valuation model with the following implicit assumptions: average risk-free rate of interest –
1.73%, dividend rate – NIL, average volatility – 119.81% and an average term of 5 years. The estimated
forfeiture rate is 6.23%.
Share based payment expense
Total expense arising from share based payment transactions recognized during the year ended September
30, 2019, as part of employee benefit expense were $1,717,091 (2018 - $1,252,577).
13. FINANCIAL RISK MANAGEMENT
The following is a discussion of market, credit, and liquidity risks and related mitigation strategies that have
been identified.
Credit risk
The Company is exposed to credit risk associated with its cash and cash equivalents and accounts receivable.
The risk is reduced by having accounts receivables insured or obtaining letters of credit when the Company

Covalon Technologies Ltd. NOTES TO THE CONSOLIDATED FINANCIAL STATEMENTS Expressed in Canadian Dollars For the years ended September 30, 2019 and 2018
Page 28 of 33
determines that it is warranted. The Company applies the simplified approach to providing for expected credit
losses, which allows the use of a lifetime expected loss for all receivables. Receivables have been grouped based
on shared credit risk characteristics and the days outstanding to measure the expected credit loss. On this basis
the loss allowance at September 30, 2019, and September 30, 2018, is nominal.
Accounts receivable are written off when there is no reasonable expectation of recovery which may be supported
by failure to make contractual payments for more than 180 days as well as other factors.
Accounts receivable are subject to normal industry risks in each geographic region in which the Company
operates. The Company attempts to manage these risks by dealing with creditworthy customers; however, due
to the limited number of potential customers in each market this is not always possible. As at September 30,
2019, three customers accounted for 43% (2018 – three customers for 80%) of the accounts receivable balance.
These customers, who are distributors and strategic partners of the Company, represent substantially all of the
Company’s sales. Credit risk exposure is mitigated by strong credit granting policies, the use of Letters of Credit,
and due diligence procedures for new customers.
The aging of accounts receivable is as follows:
September 30, September 30,2019 2018
Current $3,399,503 $4,972,81030-60 days past due 72,350 159,883Over 60 days past due 163,428 -
3,635,281 5,132,693
Interest rate risk
The Company is subject to interest rate risk on its cash, cash equivalents and debt. The Company believes that
interest rate risk is low due to market based variable interest rates. During fiscal 2019, the Company took on
floating rate debt to fund the acquisition described in Note 5 and to fund working capital. At September 30,
2019, if interest rates had been 1% higher or lower then the interest expense would have been $84,230 higher or
lower, respectively, during the year.
Covalon Technologies Ltd. NOTES TO THE CONSOLIDATED FINANCIAL STATEMENTS Expressed in Canadian Dollars For the years ended September 30, 2019 and 2018
Page 29 of 33
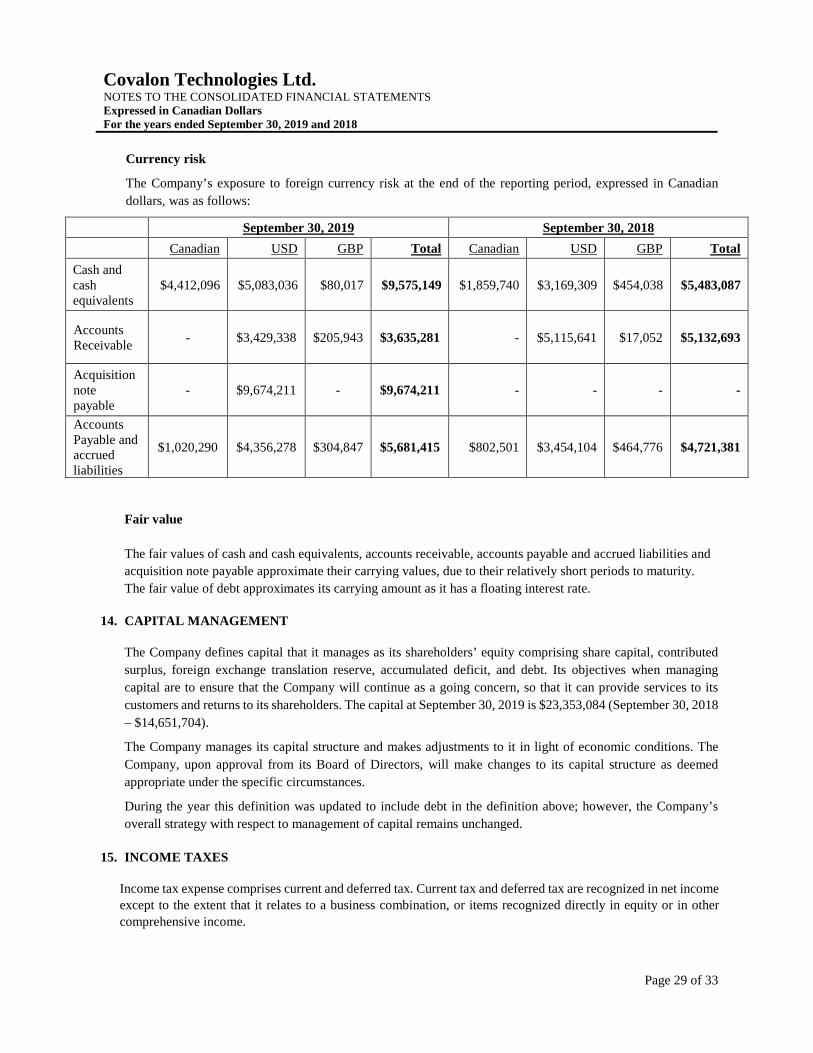
Currency risk
The Company’s exposure to foreign currency risk at the end of the reporting period, expressed in Canadian
dollars, was as follows:
September 30, 2019 September 30, 2018
Canadian USD GBP Total Canadian USD GBP Total
Cash and cash equivalents
$4,412,096 $5,083,036 $80,017 $9,575,149 $1,859,740 $3,169,309 $454,038 $5,483,087
Accounts Receivable
- $3,429,338 $205,943 $3,635,281 - $5,115,641 $17,052 $5,132,693
Acquisition note payable
- $9,674,211 - $9,674,211 - - - -
Accounts Payable and accrued liabilities
$1,020,290 $4,356,278 $304,847 $5,681,415 $802,501 $3,454,104 $464,776 $4,721,381
Fair value
The fair values of cash and cash equivalents, accounts receivable, accounts payable and accrued liabilities and
acquisition note payable approximate their carrying values, due to their relatively short periods to maturity.
The fair value of debt approximates its carrying amount as it has a floating interest rate.
14. CAPITAL MANAGEMENT
The Company defines capital that it manages as its shareholders’ equity comprising share capital, contributed
surplus, foreign exchange translation reserve, accumulated deficit, and debt. Its objectives when managing
capital are to ensure that the Company will continue as a going concern, so that it can provide services to its
customers and returns to its shareholders. The capital at September 30, 2019 is $23,353,084 (September 30, 2018
– $14,651,704).
The Company manages its capital structure and makes adjustments to it in light of economic conditions. The
Company, upon approval from its Board of Directors, will make changes to its capital structure as deemed
appropriate under the specific circumstances.
During the year this definition was updated to include debt in the definition above; however, the Company’s
overall strategy with respect to management of capital remains unchanged.
15. INCOME TAXES
Income tax expense comprises current and deferred tax. Current tax and deferred tax are recognized in net income except to the extent that it relates to a business combination, or items recognized directly in equity or in other
comprehensive income.
Covalon Technologies Ltd. NOTES TO THE CONSOLIDATED FINANCIAL STATEMENTS Expressed in Canadian Dollars For the years ended September 30, 2019 and 2018
Page 30 of 33
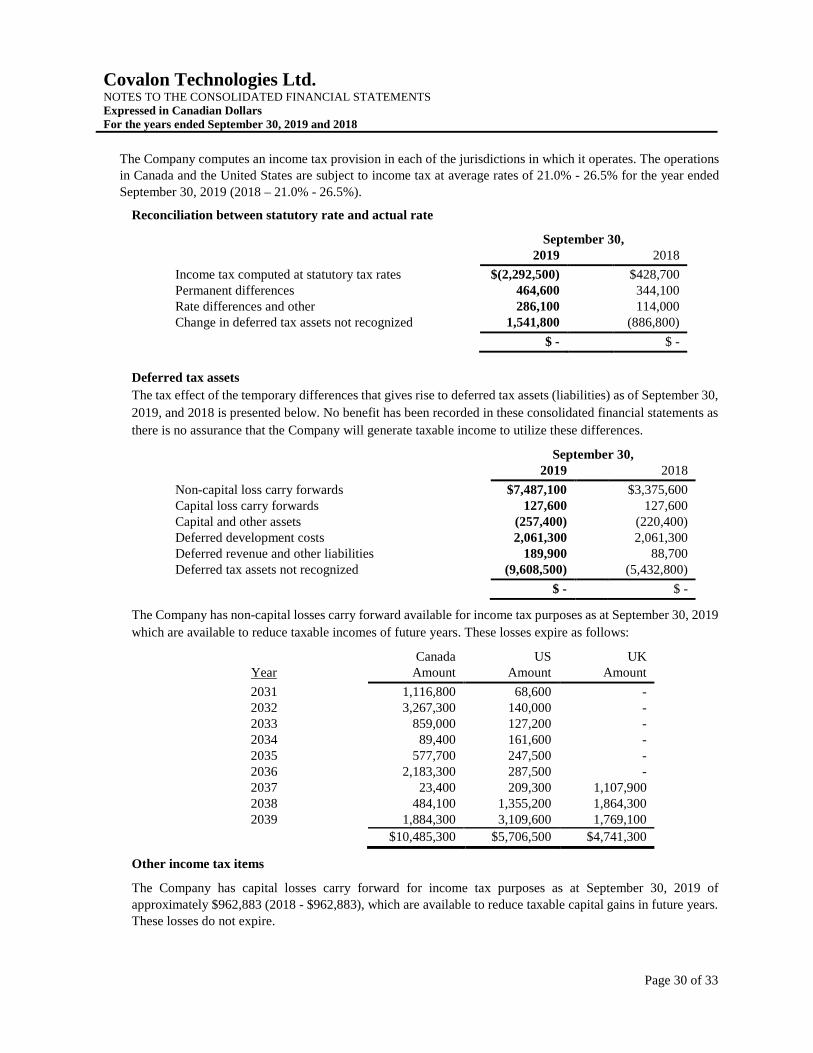
The Company computes an income tax provision in each of the jurisdictions in which it operates. The operations in Canada and the United States are subject to income tax at average rates of 21.0% - 26.5% for the year ended
September 30, 2019 (2018 – 21.0% - 26.5%).
Reconciliation between statutory rate and actual rate
September 30, 2019 2018
Income tax computed at statutory tax rates $(2,292,500) $428,700 Permanent differences 464,600 344,100 Rate differences and other 286,100 114,000 Change in deferred tax assets not recognized 1,541,800 (886,800)
$ - $ -
Deferred tax assets
The tax effect of the temporary differences that gives rise to deferred tax assets (liabilities) as of September 30,
2019, and 2018 is presented below. No benefit has been recorded in these consolidated financial statements as
there is no assurance that the Company will generate taxable income to utilize these differences.
September 30, 2019 2018
Non-capital loss carry forwards $7,487,100 $3,375,600 Capital loss carry forwards 127,600 127,600 Capital and other assets (257,400) (220,400) Deferred development costs 2,061,300 2,061,300 Deferred revenue and other liabilities 189,900 88,700 Deferred tax assets not recognized (9,608,500) (5,432,800)
$ - $ -
The Company has non-capital losses carry forward available for income tax purposes as at September 30, 2019
which are available to reduce taxable incomes of future years. These losses expire as follows:
Canada US UK Year Amount Amount Amount
2031 1,116,800 68,600 - 2032 3,267,300 140,000 - 2033 859,000 127,200 - 2034 89,400 161,600 - 2035 577,700 247,500 - 2036 2,183,300 287,500 - 2037 23,400 209,300 1,107,900 2038 484,100 1,355,200 1,864,300 2039 1,884,300 3,109,600 1,769,100
$10,485,300 $5,706,500 $4,741,300
Other income tax items
The Company has capital losses carry forward for income tax purposes as at September 30, 2019 of
approximately $962,883 (2018 - $962,883), which are available to reduce taxable capital gains in future years. These losses do not expire.

Covalon Technologies Ltd. NOTES TO THE CONSOLIDATED FINANCIAL STATEMENTS Expressed in Canadian Dollars For the years ended September 30, 2019 and 2018
Page 31 of 33
Investment tax credits
From time to time the Company receives investment tax credits. Investment tax credits are accrued when there
is reasonable assurance of realization and these are reflected as a reduction of the related expense. In the event
the investment tax credits received are less than the amount previously recognized, the difference will be
reflected in operations for the period in which it is determined.
The Company is eligible for the Ontario Innovation Tax Credit ("OITC") at the rate of 10.0% on its research
and development expenditures and refundable in cash to the Company. The Company is also eligible for a
20.0% federal research and development investment tax credit and a 4.5% Ontario Research and Development
Tax Credit (“ORDTC”) which are available to offset federal income taxes payable and Ontario income taxes
payable, respectively, in the future.
The tax credits ultimately received by the Company are subject to review by Canada Revenue Agency and the
Ontario Ministry of Finance.
At September 30, 2019, the Company has $1,679,947 (2018 - $1,679,947) of unclaimed investment tax credits
available to reduce federal income taxes payable in future years. If not utilized, these investment tax credits
will start expiring in 2023. These unclaimed investment tax credits have not been recognized as a deferred tax
asset.
At September 30, 2019, the Company has $160,043 (2018 – $160,043) of unclaimed ORDTC available to
reduce Ontario income taxes payable in future years. If not utilized, these ORDTC will start expiring in 2029.
These unclaimed ORDTC have not been recognized as a deferred tax asset.
16. RELATED PARTY TRANSACTIONS
Key management personnel includes the Company’s directors and senior management team. These individuals
are responsible for planning, directing and controlling the activities of an entity. Key management personnel
compensation comprised:
Year ended September 30,
2019 2018
Compensation and short term employee benefits $2,807,973 $1,365,291
Share based payment expense 664,971
603,232
$3,472,944 $1,968,523
During the year end September 30, 2013, a non-interest bearing loan of $50,000 was made to a key employee. As of September 30, 2019, $10,000 of this loan remained outstanding.

Covalon Technologies Ltd. NOTES TO THE CONSOLIDATED FINANCIAL STATEMENTS Expressed in Canadian Dollars For the years ended September 30, 2019 and 2018
Page 32 of 33
17. EXPENSES BY NATURE The consolidated statements of operations and comprehensive income (loss) include the following expenses by nature:
Employee costs
Year ended September 30, 2019 2018
Short-term wages & benefits, commissions, $17,516,624 $7,246,434 contract and director fees Share based payments 1,717,091 1,252,577
Total employee costs $19,233,715 $8,499,011
Included in
Cost of product sales 937,314 887,792
Operations 1,072,402 1,026,305 Research and development activities 1,066,463 969,757 Sales, marketing and agency fees 8,914,673 2,360,260
General and administrative 7,242,863 3,254,897
Total employee costs $19,233,715 $8,499,011
Depreciation and amortization
Year ended September 30, 2019 2018
Cost of product sales $328,056 $237,182 Operations 4,201 5,079Research and development activities 36,008 21,950General and administrative 261,623 92,184
Total depreciation and amortization $629,888 $356,395
18. EARNINGS (LOSS) PER SHARE
The weighted average number of shares outstanding during the year ended September 30, 2019 was 22,461,193
(September 30, 2018 – 21,560,162).
For the year ended September 30, 2019, the computation of diluted loss per share is equal to the basic loss per
share due to the anti-dilutive effect of the stock options and warrants.
Details of dilutive securities outstanding that would be included in diluted earnings (loss) per share calculations
as follows:
September 30, September 30, Potentially dilutive securities 2019 2018
Common shares potentially dilutive- stock options 600,903 994,844- warrants 647,431 667,245
Total potentially dilutive shares 1,248,334 1,662,089

Covalon Technologies Ltd. NOTES TO THE CONSOLIDATED FINANCIAL STATEMENTS Expressed in Canadian Dollars For the years ended September 30, 2019 and 2018
Page 33 of 33
19. CONTINGENCIES AND COMMITMENTS
The Company has signed lease agreements for four locations in Mississauga, Ontario and one in each of:
Shanghai, China; Leicestershire, United Kingdom; and, Seattle Washington. The leases range from a monthly
term to a term of seven years. The minimum annual payments for the next five years are as follows:
Year Annual Commitment
2020 582,001
2021 598,334
2022 589,319
2023 577,875
2024 577,875
Thereafter $645,595
From time to time, the Company is party to legal proceedings arising out of the normal course of business. The
results of these litigations cannot be predicted with certainty, and management is of the opinion that the outcome
of these types of proceedings is generally not determinable. Any loss resulting from these proceedings will be
charged to operations in the period that a loss becomes probable.
20. SEGMENT REPORTING
During the year ended September 30, 2019, there was one customer who individually accounted for
approximately 25% of revenue (2018 – approximately 48%). The Company generated revenue of $24,083,097
(2018 – $12,768,225) in the US, $8,758,827 (2018 – $13,044,819) in the Middle East, $32,001 (2018 – $18,546)
in Canada, and $1,130,697 (2018 – $891,752) in the rest of the world.
As of September 30, 2019, the Company had $2,797,245 of its property, plant, and equipment and intangible
assets located in Canada and $1,455,511 in the rest of the world. Goodwill in the amount of $12,924,412 is
attributed to US.
21. CHANGES IN NON-CASH WORKING CAPITAL ITEMS
Net changes in non-cash working capital balances are as follows:
September 30, 2019 September 30, 2018
Accounts receivable $3,349,494 $(2,316,843) Prepaid expenses 415,103 (537,462) Inventories (2,144,114) (2,998,642) Accounts payable and accrued liabilities 921,538 2,329,252 Deferred revenue 365,132 (373,759) Deferred rent 169,021 3,939
$3,076,174 $(3,893,515)