coupling detailed radiation model with process simulation...
TRANSCRIPT
warwick.ac.uk/lib-publications
Original citation: Hu, Yukun, Wang, Jihong, Tan, CK., Sun, Chenggong and Liu, Hao. (2017) Coupling detailed radiation model with process simulation in Aspen Plus : a case study on fluidized bed combustor. Applied Energy . Permanent WRAP URL: http://wrap.warwick.ac.uk/91859 Copyright and reuse: The Warwick Research Archive Portal (WRAP) makes this work of researchers of the University of Warwick available open access under the following conditions. This article is made available under the Creative Commons Attribution 4.0 International license (CC BY 4.0) and may be reused according to the conditions of the license. For more details see: http://creativecommons.org/licenses/by/4.0/ A note on versions: The version presented in WRAP is the published version, or, version of record, and may be cited as it appears here. For more information, please contact the WRAP Team at: [email protected]

Contents lists available at ScienceDirect
Applied Energy
journal homepage: www.elsevier.com/locate/apenergy
Coupling detailed radiation model with process simulation in Aspen Plus: Acase study on fluidized bed combustor
Yukun Hua, Jihong Wanga,⁎, CK Tanb, Chenggong Sunc, Hao Liuc
a School of Engineering, University of Warwick, Coventry CV4 7AL, UKb Faculty of Computing, Engineering and Science, University of South Wales, Pontypridd CF37 1DL, UKc Faculty of Engineering, University of Nottingham, Nottingham NG7 2RD, UK
H I G H L I G H T S
• Detailed radiation model coupled process simulation of fluidized beds.
• Combining the advantages of zone method and Aspen Plus.
• A case study on a 0.3 MW fluidized bed.
• A modest computing demand.
A R T I C L E I N F O
Keywords:Zone methodAspen PlusFluidized bedsProcess simulationRadiation analysis
A B S T R A C T
While providing a fast and accurate tool for simulating fluidized beds, the major limitations of classical zero-dimensional ideal reactor models used in process simulations become irreconcilable, such as models built intocommercial software (e.g. Aspen Plus®). For example, the limitations of incorporating heat absorption by thewater wall and super-heaters and inferring thermal reciprocity between each reactor model/module. This paperproposes a novel modelling approach to address these limitations by incorporating an external model thatmarries the advantages of the zone method and Aspen Plus to the greatest extent. A steady state operation of a0.3 MW atmospheric bubbling fluidized-bed combustor test rig was simulated using the developed modellingapproach and the results were compared with experimental data. The comparison showed that the predictionswere in agreement with the measurements. Further improvement is to be expected through incorporating morerealistic zoned geometry and more complex reaction mechanisms. In addition, the developed model has a re-latively modest computing demand and hence demonstrates its potential to be incorporated into process si-mulations of a whole power plant.
1. Introduction
Circulating Fluidized Bed (CFB) technology has been developed andserved as an effective means for burning solid fuels for many industrialapplications (such as coal combustion) since the 1980s due to its in-herent advantages in fuel flexibility, high combustion intensity and lowemissions [1]. Although technical knowledge about the design andoperation of CFB is widely available for pilot plant and large scale units[2], few researchers have conducted modelling of the whole CFB powerplant [3–7] and hence little is known about its dynamic performanceand operational flexibility, like oxy-fuel combustion [8] and co-firing[9]. This was due to the challenges faced in modelling the highlycomplex gas/solid chemical reactions coupled with fluid flow and heatand mass transfer occurring in a CFB boiler.
One of the earliest simulation studies of fluidized beds is theNational Aeronautics and Space Administration (NASA)’s ‘Simulation offluidized bed coal combustors’ project conducted in the 1970s [10,11].They developed a comprehensive model using in-house code to simu-late the aforementioned physical and chemical processes in fluidizedbeds. Although the model is imperfect from the current point of view, itframed a modelling approach for fluidized beds and inspired the follow-up studies. de Souza-Santos [12–18] also developed a comprehensivemodel for the simulation of fluidized bed equipment, and the latestversion includes all sub-models related to combustion and gasificationof solid fuels and allows detailed simulation of boilers and gasifiers.With the maturity of commercial software for process simulations [19],various process simulators such as Aspen Plus® are available and havebeen widely employed for process simulation purposes by industrial
http://dx.doi.org/10.1016/j.apenergy.2017.08.030Received 15 January 2017; Received in revised form 22 June 2017; Accepted 8 August 2017
⁎ Corresponding author.E-mail address: [email protected] (J. Wang).
Applied Energy xxx (xxxx) xxx–xxx
0306-2619/ © 2017 The Authors. Published by Elsevier Ltd. This is an open access article under the CC BY license (http://creativecommons.org/licenses/BY/4.0/).
Please cite this article as: Hu, Y., Applied Energy (2017), http://dx.doi.org/10.1016/j.apenergy.2017.08.030

entities since the late 1990s. The commercial process simulators usuallyhave a powerful physical and chemical properties database, which isthey’re greatest advantage over models developed using in-house code.
Despite the advances in Aspen Plus for time-dependent dynamicsimulation and process control, no provision is currently available tocouple detailed heat transfer models with a process simulation as partof a complete engineering solution. As a result, in fluidized bed mod-elling the heat absorption by the water wall and super-heaters is usuallyspecified as model inputs explicitly rather than predicted directly by themodels. Furthermore, the modular modelling strategy does not involvethermal reciprocity between each reactor module [20–28]. These as-pects of modelling are particularly useful for the design and evaluationof the operational flexibility of a fluidized bed boiler in supercriticalconditions [29]. This is due to the fact that, under supercritical con-ditions, the boiler uses once-through circulation for the water wall andif excessive heat flux on the furnace side occurs, this cannot be auto-matically compensated for with a larger water flow rate in the tubes,thus resulting in over-heating of the water membrane.
On the other hand, although Computational Particle Fluid Dynamics(CPFD) is widely used to simulate fluidized bed combustion systemsand can predict the detailed local heat and mass transfer information
for the entire computational domain, it often takes several days, if notweeks, to provide useful results for large industrial cases. Therefore,CPFD models [30,31] are not feasible for incorporation into processsimulations of a whole power plant. Moreover, Selçuk et al. [32,33], byusing in-house codes investigated the radiative heat transfer char-acteristics on a bubbling fluidized bed combustor test rig. However,their developed fluidized bed combustion models relied on empiricalmodels, rather than on first principles, to calculate gas temperatureprofiles and therefore may not generalise correctly in unknown situa-tions.
As the combustion efficiency of fluidized bed combustor dependslargely on the heat recovered in the freeboard region, where thedominant component of heat transfer is radiation [34], accurate mod-elling of the radiative heat transfer in such systems is essential. Previouswork by Hu et al. [35] has been devoted to further improving theclassical zone method of radiation analysis (hereafter called zonemodel) using in-house codes which can be applied to a wide range ofindustrial furnaces. In this paper, the authors further extend the ap-plication of the zone model by integrating it in an efficient manner withprocess simulation in Aspen Plus, thus providing a more complete andflexible solution for optimising the thermal performance of fluidized-
Nomenclature
Abbreviations
ABFBC Atmospheric Bubbling Fluidized-bed CombustorCFB Circulating Fluidized BedCFD Computational Fluid DynamicsCPFD Computational Particle Fluid DynamicsFC Fixed CarbonHHV high heating valueMCRT Monte-Carlo based Ray-TracingDEAs direct exchange areasDFAs directed flux areasTEAs total exchange areasVM Volatile MatterULT ultimate analysisWSGG weighted sum of mixed grey gases model
Symbols
ag,n, as,n weighting coefficient in mixed grey gas model [–]Ai area of the i-th surface zone [m2]An mie scattering coefficient [–]b1, b2 correlation coefficients [–]Bn mie scattering coefficient [–]d32 sauter mean diameter [mm]Dp mean particles diameterFair air flow rate [kmol h−1]Fcoal coal flow rate [kg h−1]Fr Froude number [–]g gravitational constant, 9.81 [m s−2]g g g s g, ,s ,s si j i j i j i j direct exchange areas [m2]↼ ⎯⎯⎯⎯⎯ ↼ ⎯⎯⎯⎯⎯ ↼ ⎯⎯⎯⎯⎯ ↼ ⎯⎯⎯⎯G G G S S G S S, , ,i j i j i j i j directed flux area [m2]G G G S S G S S, , ,i j i j i j i j total exchange areas [m2]Gs mass flux of solid particles [kg s−1 m−2]Hg gas enthalpy [kJ kg−1]Iλ spectral radiation intensity [W m−2 sr−1]k, k k,g s, kp constant of reaction rate; imaginary part of complex
index of refraction; grey gas, soot, or particles extinctioncoefficient [–]
Ki extinction coefficient of gas zone i [m−1]m mass flow rate [kg s−1]
n index of infinite series within Mie equations; real part ofcomplex index of refraction [–]
P pressure [atm]Qabs absorption efficiency factor [–]Qext extinction efficiency factor [–]Qsca scattering efficiency factor [–]qconv,i heat convection term of surface zone i [W m−2]Qconv,i heat convection term of gas zone i [W]Qenth,i enthalpy transport term of gas zone i [W]Qs,i net radiation from the surface zone i [W]Qg,i net radiation absorbed by the gas zone i [W]r radius [m]Re real part of complex number [–]s travelled distance [m]t time [s]T temperature [K]Tbed mean bed temperature [K]Tg,i or j temperature of gas zone i or j [K]Tm mean bulk temperature [K]Ts, i or j temperature of surface zone i or j [K]Ttop mean top temperature [K]U overall convective heat transfer coefficient [W m−2 K−1]Ug superficial velocity [m s−1]Umf critical fluidization velocity [m s−1]Vi volume of gas zone i [m3]x particle size parameter [–]Z height [cm]a delay index [–]ε voidage [–]εb voidage of the lower region [–]ε∗ voidage under saturated conditions [–]λ wave number [–]λm mean wavelength [μm]μ gas viscosity [N s m−2]ρcoal density of coal [kg m−3]ρg density of gas [kg m−3]ρp density of particles material [kg m−3]σ Stefan-Boltzmann constant (5.6687 × 10⁻⁸) [W m−2
K−4]σsp scattering coefficient [–]ϕ slip factor [–]∊ emissivity [–]
Y. Hu et al. Applied Energy xxx (xxxx) xxx–xxx
2

bed boilers. As far as the authors are aware, no other process simula-tions of the fluidized bed boiler with similar features have been pub-lished. The developed model is expected to be relatively modest incomputing demand and hence can be feasibly incorporated into dy-namic simulations of a whole CFB power plant.
2. Object of the study
To demonstrate the proposed modelling approach, a 0.3 MWAtmospheric Bubbling Fluidized-bed Combustor (ABFBC) test rig,shown in Fig. 1, was chosen as the object for this study. The mainfeature of the test rig is the modular combustor formed of five 1 m highmodules of internal cross-sectional area of 0.45 m × 0.45 m. The innerwalls of the modules are lined and insulated with alumina-based re-fractory bricks of 6 cm in thickness. The first and fifth modules refer tothe bed (bottom) and cooler (top), respectively. The ones between themare the freeboard modules. There exist two cooling surfaces in themodular combustor, as shown in Fig. 1, providing 0.35 m2 and 4.3 m2
of cooling surfaces, respectively.Previously, Selçuk et al. [32,33] have conducted experimental and
numerical studies on this test rig to investigate its heat transfer char-acteristics. The experiments, consisting of two combustion tests withand without recycling of fine particles from the cyclone, were carriedout by burning a typical lignite coal. For the purpose of demonstratingthe developed models, only the combustion test without particle re-cycling was simulated in this study. The coal analysis is as shown inTable 1 and the steady state operating conditions are presented inTable 2.
3. Methodology of fluidized bed modelling
Due to the complexity of coal combustion in fluidized beds, only the
major steps of coal combustion are considered in the model, with somesimplifying assumptions. When the coal particles travel through afluidized bed combustor, drying, devolatilization, volatile combustionand char combustion occur consecutively, as illustrated in Fig. 2. Ahydrodynamics model is also adopted to describe the influence of thegas-phase superficial velocity on the char particle pore size profile(which further influences the reaction rate of char combustion) along
Cyclone
Air Lock
Diverter Valve
Recycle LineCarryover
Bin
LimestoneCoal
Ash
Air
Under bed Feeder
On bed Feeder
Bed Ash Removal
Cooling Water
Magnetic Conditioner
Bed Ash Bin Drainage
Tap WaterAir LineLPG Line
Wind Box
Burner
Module 1
Module 2
Module 3
Module 4
Module 5
Fig. 1. Schematic of the 0.3 MW ABFBC test rig (adaptedfrom Fig. 1 in [36]).
Table 1Analysis of the lignite coal [32,33].
Proximate analysis (asreceived)
Ultimate analysis (dry basis) Sieve analysis
Component w% Component w% Size, mm w%
Moisture 13.7 C 38.1 4.000–3.350 11.5Ash 36.4 H 3.2 3.350–2.360 20.2VM 32.7 O 12.4 2.360–2.000 17.7FC 17.2 N 1.4 2.000–1.700 16.8
HHV: 13.2 MJ/kg Scomb 2.7 1.700–1.180 15.7d32: 1.26 mm Stotal 4.5 1.180–0.710 12.2ρcoal: 1.58 g/cm3 Ash 42.2 0.710–0.000 5.9
Table 2Operating conditions of the experiment [32,33].
Coal flow rate (Fcoal), kg h−1 101Air flow rate (Fair), kmol h−1 22Particle density (ρp), kg m−3 537Mass flux of solid particles (Gs), kg s−1 m−2 0.03Superficial velocity (Ug), m s−1 3Mean bed temperature (Tbed), K 1146Mean top temperature (Ttop), K 822
Y. Hu et al. Applied Energy xxx (xxxx) xxx–xxx
3
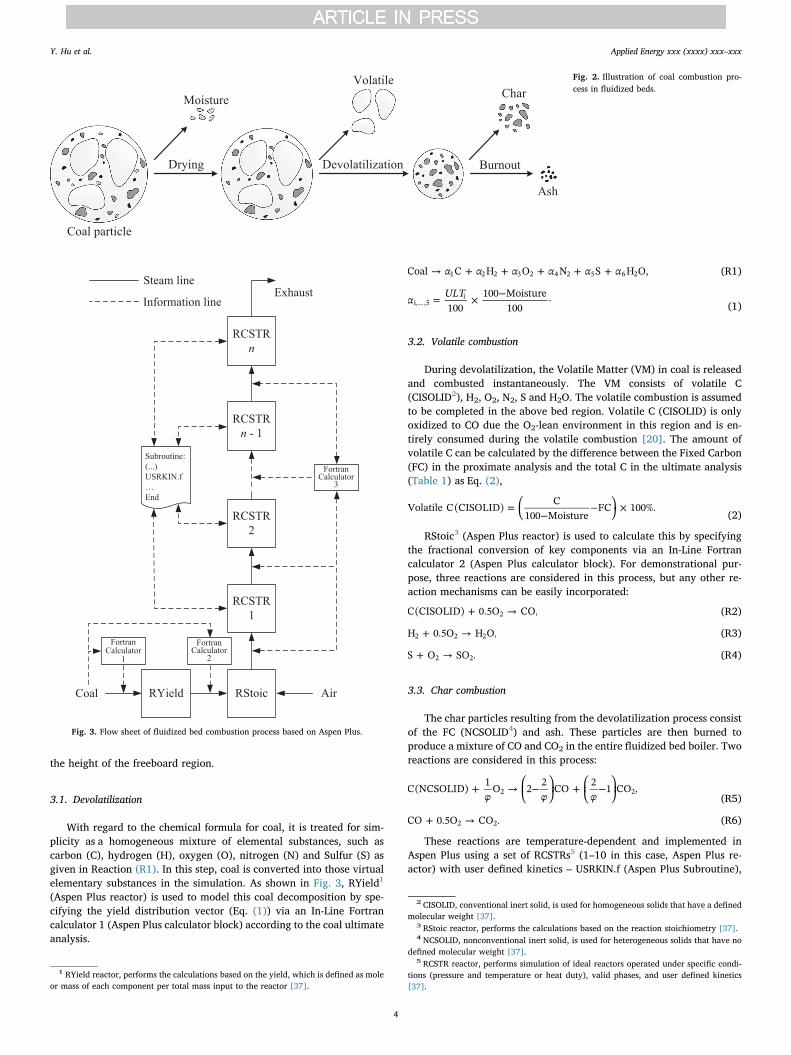
the height of the freeboard region.
3.1. Devolatilization
With regard to the chemical formula for coal, it is treated for sim-plicity as a homogeneous mixture of elemental substances, such ascarbon (C), hydrogen (H), oxygen (O), nitrogen (N) and Sulfur (S) asgiven in Reaction (R1). In this step, coal is converted into those virtualelementary substances in the simulation. As shown in Fig. 3, RYield1
(Aspen Plus reactor) is used to model this coal decomposition by spe-cifying the yield distribution vector (Eq. (1)) via an In-Line Fortrancalculator 1 (Aspen Plus calculator block) according to the coal ultimateanalysis.
→ + + + + +α α α α α αCoal C H O N S H O,1 2 2 3 2 4 2 5 6 2 (R1)
= × −…α ULT
100100 Moisture
100·i, ,5
i(1)
3.2. Volatile combustion
During devolatilization, the Volatile Matter (VM) in coal is releasedand combusted instantaneously. The VM consists of volatile C(CISOLID2), H2, O2, N2, S and H2O. The volatile combustion is assumedto be completed in the above bed region. Volatile C (CISOLID) is onlyoxidized to CO due the O2-lean environment in this region and is en-tirely consumed during the volatile combustion [20]. The amount ofvolatile C can be calculated by the difference between the Fixed Carbon(FC) in the proximate analysis and the total C in the ultimate analysis(Table 1) as Eq. (2),
= ⎛⎝ −
− ⎞⎠
×Volatile C (CISOLID) C100 Moisture
FC 100%.(2)
RStoic3 (Aspen Plus reactor) is used to calculate this by specifyingthe fractional conversion of key components via an In-Line Fortrancalculator 2 (Aspen Plus calculator block). For demonstrational pur-pose, three reactions are considered in this process, but any other re-action mechanisms can be easily incorporated:
+ →C(CISOLID) 0.5O CO,2 (R2)
+ →H 0.5O H O,2 2 2 (R3)
+ →S O SO .2 2 (R4)
3.3. Char combustion
The char particles resulting from the devolatilization process consistof the FC (NCSOLID4) and ash. These particles are then burned toproduce a mixture of CO and CO2 in the entire fluidized bed boiler. Tworeactions are considered in this process:
⎜ ⎟ ⎜ ⎟+ → ⎛⎝
− ⎞⎠
+ ⎛⎝
− ⎞⎠φ φ φ
C(NCSOLID) 1 O 2 2 CO 2 1 CO ,2 2(R5)
+ →CO 0.5O CO .2 2 (R6)
These reactions are temperature-dependent and implemented inAspen Plus using a set of RCSTRs5 (1–10 in this case, Aspen Plus re-actor) with user defined kinetics – USRKIN.f (Aspen Plus Subroutine),
Coal particle
Drying
Moisture
Devolatilization
VolatileChar
Ash
Burnout
Fig. 2. Illustration of coal combustion pro-cess in fluidized beds.
AirRYield RStoic
RCSTR1
RCSTR2
RCSTRn - 1
RCSTRn
Subroutine:(...)USRKIN.f…End
FortranCalculator
2
FortranCalculator
1
Coal
FortranCalculator
3
ExhaustSteam line
Information line
Fig. 3. Flow sheet of fluidized bed combustion process based on Aspen Plus.
1 RYield reactor, performs the calculations based on the yield, which is defined as moleor mass of each component per total mass input to the reactor [37].
2 CISOLID, conventional inert solid, is used for homogeneous solids that have a definedmolecular weight [37].
3 RStoic reactor, performs the calculations based on the reaction stoichiometry [37].4 NCSOLID, nonconventional inert solid, is used for heterogeneous solids that have no
defined molecular weight [37].5 RCSTR reactor, performs simulation of ideal reactors operated under specific condi-
tions (pressure and temperature or heat duty), valid phases, and user defined kinetics[37].
Y. Hu et al. Applied Energy xxx (xxxx) xxx–xxx
4

as listed in Table 3. Again, any other emission related reactions oc-curring in the entire fluidized bed boiler can be easily incorporated,such as SO2 absorption [20], fuel and thermal NOx formations [38], viathe user defined kinetics in the same way. Since those emission relatedreactions are not the main exothermal reactions and do not affectthermal performance appreciably, they are not considered in this study.
3.4. Hydrodynamics model
A lumped hydrodynamics model [40,41] was chosen to predict thevoidage profile in the free board region of the studied fluidized bedcombustor. According to the model, the free board region is dividedinto a discrete number of intervals and consists of two zones: a lowerregion and an upper region (Fig. 4).
In the lower region, because of the turbulent fluidization condition,the voidage (ε) can be assumed to be a constant [42] for a given gassuperficial velocity (Ug); in the upper region, the value of ε in a certaininterval between heights Zi−1 and Zi can be calculated based on Eqs. (3)and (4) via an In-Line Fortran calculator 3 (Aspen Plus calculator block)at every iteration:
= − −−
− = …∗∗
−
− − −ε ε ε εa Z Z( )
(exp exp ) , i 1,3, ,n;aZ aZi
b
i 1 ii i 1
(3)
=+
∗εϕG U ρ
11 /
,s g p (4)
where ε∗ denotes the voidage under saturated conditions in the dilutephase at the top of fluidized bed riser column; εb the voidage of thelower region, εb ≈ 0.55 [40]; a represents the decay constant, and ex-perimental data shows that Ug is inversely proportional to the decayconstant with a proportional constant of 4.0 s−1 [41,43]; ϕ representsthe slip factor, which is a function of Froude number (Fr) as given inEqs. (5)–(7),6
= + +ϕF
F1 5.6 0.47 ,r
r0.41
(5)
=FUgd
,rmf2
e (6)
=−
Ud ρ ρ g
μ
( )
1650.mf
e2
p g
(7)
3.5. Zone method of radiation analysis
Due to the relatively simple geometry of the ABFBC, the freeboardregion is split into a finite number of isothermal volume and surfacezones along the height, as shown in Fig. 5. For modelling purposes, thebottom and the top surfaces, which also include the cooling tubes, areapproximated each by an equivalent grey surface. An assumption ofplug flow is applied to the flow pattern, which is reasonable given that
the flow-induced enthalpy transport is predominantly in the long-itudinal direction of the fluidized bed. However, even more compli-cated zoning arrangement and flow pattern are also possible, see [35],which depend on the requirements of a specific problem. An energybalance is then formulated for each zone, taking into account radiationinterchange between all volume and surface zones, the enthalpytransport, and the source term associated with combustion and heatrelease [44]. Fig. 6 shows the flow sheet of the coupled solutions inAspen Plus for ABFBC modelling. In the simulation, the RCSTR blocktemperatures are updated continuously by the zone model until anappropriate convergent tolerance is satisfied; i.e. negligible tempera-ture difference between successive iterations.
3.5.1. Models with internal zone energy balanceThe radiation term in the energy balance equations is written in
terms of exchange factors known as the directed flux areas (DFAs)(denoted by ↼ ⎯⎯⎯⎯⎯ ↼ ⎯⎯⎯⎯⎯ ↼ ⎯⎯⎯⎯⎯ ↼ ⎯⎯⎯⎯G G G S S G S S, , ,i j i j i j i j for gas-gas, gas-surface, surface-gas,and surface-surface exchange, respectively, in Eqs. (8) and (9)). Theenergy balances on all zones yield a set of simultaneous non-linearequations which can be solved to determine the temperature and heatflux on each zone.
For a system of N volume zones and M surface zones, the followingenergy balances can be written.
∑ ∑= ↼ ⎯⎯⎯⎯⎯ + ↼ ⎯⎯⎯⎯⎯ − − += =
Q G G T G S σT K V σT Q Q σ 4 ,N M
g,ij 1
i j g,j4
j 1i j s,j
4i i g,i
4conv,i enth,i
(8)
∑ ∑= ↼ ⎯⎯⎯⎯ + ↼ ⎯⎯⎯⎯⎯ − ∊ += =
Q S S T S G σT A σT A q σ .M N
s,ij 1
i j j4
j 1i j g,j
4i i i
4i conv,i
(9)
For the i-th volume (gas) zone, Qg,i represents the net rate of heattransfer to the volume (gas) zone; Qconv,i is the convection to all surfacesin contact with the volume zone; for the plug flow pattern assumed inthis study where the enthalpy of the combustion products leaving onezone is the enthalpy input to an adjacent zone, Qenth,i can be expressedas:
= −−+
−−Q m H T m H T ( ) ( ).enth,i i 1 g g,i 1 i g g,i (10)
Likewise, for the i-th surface zone, Qs,i represents the net rate of heattransfer to the surface zone. If the surface temperature is not known, it
Table 3Reaction kinetics in char combustion process.
No. Reaction rate Constant of reaction rate Ref.
R5 − =+
dndt
P
k k
c O21
5,film
1
5,ash
= ×k Td T5,film
0.292 4.26( / 1800)1.75
p
[39]
=−
k k εpy
y5,ash 5,film2.5
1
=y rr
coreparticle
R6 − = k C C CdCdtCO
6 CO O20.3
H2O0.5 = × −( )k 1.9 10 exp
T6 6 8056 [26]
Z1
Z2
Z3
Zn-1
Zn
Ris
er h
eigh
t, m
Voidage,
i (Zi-1, Zi)
1
Upper region
*
...
Lower
region
2
Fig. 4. Typical voidage profile alone the height of fluidized beds.6 Gas density (ρg) of 0.316 kg/m3 and gas viscosity (μ) of 4.49 × 10⁻⁵ N s m−2 [2] are
used in this study.
Y. Hu et al. Applied Energy xxx (xxxx) xxx–xxx
5

must be expressed as an additional equation in Ti relating, for example,to a wall heat loss term or to the heat transfer to a load.
The DFAs in Eqs. (8) and (9) represent the radiant flux between eachzone-pair and can be expressed as an a-weighted summation of the totalexchange areas (TEAs) (denoted by G G G S S G S S, , ,i j i j i j i j ) for each of theradiating grey gases. This is a well proven method, known as theWeighted Sum of mixed Grey Gases (WSGG) model [44], to approx-imate the radiative behaviour of real gases, defined as follows:
Gas – Surface directed flux area,
∑↼ ⎯⎯⎯⎯⎯ ==
=G S a T G S( )( ) ,N
k ki jn 1
g,n s,j i j
g
g,n(11)
Surface – Surface directed flux area,
∑↼ ⎯⎯⎯⎯ ==
=S S a T S S( )( ) .N
k ki jn 1
s,n s,j i j
g
g,n(12)
For a grey gas system, the total exchange areas are independent oftemperature and need only be calculated once for a given geometry, and forfixed surface emissivity (ε) and attenuation coefficient (K). For a givenboundary condition, theseM+ N non-linear equations (M unknown surfacetemperatures; N unknown gas temperatures) can be solved using theNewton-Raphson method [45]. This method provides an approach ofcomputing successive approximations of the variables which converge to-wards the solution. Furthermore, an updated Monte-Carlo based Ray-Tra-cing (MCRT) algorithm [46] was used to calculate the radiation exchangeareas. This, together with the retrieved enthalpy flow data in Fig. 6, pro-vides the input data that needs to be supplied to the zone model.
1
n-1
n
+i-1
-i
+i
-i+1
Y
ZXAbove bed
(bottom) surface
Top surface
Isothermal surface
Isothermal volume
Heat exchange with water
walls
Fig. 5. Illustration of zone method applied in the freeboard region of ABFBC.
AirRYield RStoic
RCSTR1
RCSTR2
RCSTRn - 1
RCSTRn
Subroutine:(...)USRKIN .f…End
Fortran Calculator
2
Fortran Calculator
1
Coal
Fortran Calculator
3
ExhaustSteam line
Information line
Zonemodel
Fig. 6. Zone model incorporated Aspen Plus flow sheet for ABFBCmodelling.
Y. Hu et al. Applied Energy xxx (xxxx) xxx–xxx
6
3.5.2. Radiation properties of gas media (non-grey gas with particles)In fluidized beds, particulate matter in the form of soot and ash
particles exist in the gas medium and their sizes are close to, or largerthan, the wavelengths of emission and absorption. Hence the impact ofscattering due to particles can no longer be considered negligiblecompared with emission and absorption. When a beam of radiation isincident on an opaque particle, some of it will be absorbed and theremaining scattered away from the direction of the incident beam. Thespectral attenuation of the beam by absorption and scattering can beexpressed by Eq. (13):
− = + + +dIds
k k k σ I( ) ,λλ λ λ λ λg, s, p, sp, (13)
where, kg,λ, ks,λ, and kp,λ are the absorption coefficients of gas, soot, andparticles at the specific wave number n, respectively. In this study,Truelove’s WSGG model (Ng = 3, Ns = 2, =p p/ 1H O CO2 2 ) [47] was usedto calculate the gas radiative properties, and the grey gas parametersused in this model are listed in Table 4.
For the evaluation of absorption and scattering of radiation by theparticles cloud, both the extinction efficiency factor (Qabs) and thescattering efficiency factor (Qsca) were evaluated via the classical Mietheory [48]. These are given by:
∑= + +=
∞
Qx
n Re A B2 (2 1) { },n
n next 21 (14)
∑= + +=
∞
Qx
n A B2 (2 1)(| | | | ),n
n nsca 21
2 2
(15)
where
= −Q Q Q .abs ext sca (16)
The details related to these equations can be found in Ref. [49]. Anin-house code was developed to evaluate these efficiency factors andthe code had been validated with benchmark data (Table 4.1 in [49]).Then the absorption and scattering coefficients (kp,λ and σsp,λ) of thesuspended particles can be obtained by:
=k G Q λρ D
3 ( )2
,λp,s abs
p p (17)
=σ G Q λρ D
3 ( )2
.λsp,s sca
p p (18)
Similar to the non-grey gas properties, calculation of the absorptionand scattering coefficient of particles requires the evaluation of theseproperties as a function of wavelength, which means a high computa-tional cost. For engineering applications, grey approximation for thesuspended particles is a reasonable compromise. A mean wavelength(λm) was used to represent the spectral distribution of the incident ra-diation energy. This wavelength can be calculated from the displace-ment law for black-body radiation [50], given by Eq. (19).
=λ T 4107 μm K,m m (19)
here Tm is the mean bulk temperature of the gas media in the enclosure,and assumes that suspended particles have the same temperature as thegas phase since previous Computational Fluid Dynamics (CFD)
simulation showed that their temperature difference is always less than50 K [51]. Radiation properties of the gas media in this study aresummarized in Table 5.
3.6. Thermal boundary conditions at walls in the zone model
In most instances, heat losses from furnace walls and/or heattransfer to a water-cooled loads exist, which are generally not knownprior to measurements. In this study, the freeboard region is insulatedwith refractory bricks 6 cm in thickness and cooling tubes are arrangedat the bed and exit areas and the mean bed temperature was measuredas 1148 K in the experiment in Ref. [33]. Based on these facts, anadiabatic boundary condition was assumed for the side walls. The twoimaginary surfaces were assumed as having the same temperature astheir respective adjacent upstream gas zones where cooling tubes arearranged. Due to the plug flow assumption, it can be seen that only thecooling system in the bed region has a significant effect on convectionterms in the zone model, as indicated by the red-dash7 line in Fig. 7; thegas flowing through the cooling system arranged at the top region haslimited effect on its upstream processes. Therefore, the overall con-vective heat transfer coefficient (U in Eq. (20)) of the cooling system atthe bed region was tuned to match the bottom gas zone temperature(Tg,1) to the measured bed temperature. The convective heat transfer isgiven by,
= −Q UA T T ( )cooling s,bottom bed (20)
4. Results and discussion
To demonstrate the proposed modelling approach, firstly the voi-dage profile was evaluated and compared with available experimentaldata; then the direct exchange areas (DEAs) required by the zone modelwas prepared according to the geometry of the studied fluidized bedcombustor using the MCRT algorithm. The computational efficiency ofthe MCRT was also compared to a direct numerical integration algo-rithm. Next, based on the developed model, the thermal performance ofthe fluidized bed combustor and reaction kinetics characteristics waspredicted and compared with experimental data. Finally, the possibilityof applying this model to large-scale fluidized bed boilers is discussed. Itshould be noted that the accuracy of the zone model is only sig-nificantly affected by the number of divisions along the height if a largetemperature gradient exists, which was not the case in this study asindicated by the experimental measurements. Therefore 10 divisionswere chosen which gave adequate resolution and yet meaningfulcomparison with actual measurement points.
4.1. Voidage profile
In fluidized bed design, the decay constant is an important para-meter, but their reported values are scattered and sketchy. Based onavailable experimental data, Kunii et al. [41] drew an important con-clusion that the mechanism of decay for solid fraction in the upperregion of fast fluid beds is basically similar to the decay above bubblingand turbulent beds. This conclusion makes Eq. (3) applicable to allthree types of beds. In a specific case, only the voidage of the lowerregion or solid fraction needs to be determined carefully. The authorsalso reviewed the literature and concluded the values for voidage at thelower region (εb)8 as follows, bubbling bed: εb = 0.45–0.60; turbulentbed: εb = 0.60–0.78; fast fluidization: εb = 0.78–0.84. The calculatedvoidage profile of the bubbling bed in the process simulation was
Table 4Grey gas parameters used in the WSGG model [47].
i j b1 b2 × 103 (K−1) kg,i (m−1 atm−1) ks,j m−1 (kg m−3)−1
1 1 0.717 −0.2964 0.0 3501 2 −0.231 0.3861 0.0 17802 1 0.459 −0.1787 2.5 3502 2 −0.078 0.1391 2.5 17803 1 0.120 −0.0499 109.0 3503 2 0.013 −0.0002 109.0 1780
7 For interpretation of color in Figs. 7 and 16, the reader is referred to the web versionof this article.
8 Converted from the volume fraction of solids in lower dense region (εsd),εb = 1− εsd.
Y. Hu et al. Applied Energy xxx (xxxx) xxx–xxx
7

plotted in normalized height and compared with that of an ultra-tallCFB riser [53] in Fig. 8. From the comparison, it can be observed thatappreciable differences exist at the lower region. These may be due tothe inherent differences in features of various beds. More precise datathat reflect how the voidage may vary with the imposed operatingconditions would need to be further investigated.
4.2. Direction exchange areas (DEAs)
Although the radiation exchange areas used in the zone model in-clude DEAs, TEAs, and DFAs, the main computing time is due to thecalculation of the DEAs, which are functions of the geometry and gasattenuation coefficient. Since all the radiation emitted by a surface mustgo somewhere, the sum of all the DEAs for a surface is its area and fromthe symmetry of the integral, it follows that:
∑ =s s A ,j
i j i(21)
=s s s si j j i (22)
The accuracy of the MCRT algorithm highly depends on the raydensity. A large ray density (> 10,000 ray m−2) is required to ensurelow errors [44]. Three ray densities (10,000 ray m−2, 20,000 ray m−2,
and 50,000 ray m−2) were applied in the DEAs calculations. An algo-rithm for smoothing the approximate exchange areas [54] was used inthe updated MCRT algorithm to ensure that both the summation andsymmetry rules of Eqs. (21) and (22) are satisfied within a convergentcriteria of 1e−10. Even with such a strict convergent criteria the
Table 5Summary of the radiation properties of gas media in this study.
Mean bulk temperature of freeboard region, Tm 1120 K [33]Mean wavelength, λm 3.667 μmParticle size parameter, x= Dpπ/λ 1 [52]Particle diameter, Dp 1.167 μmReal part of complex index of refraction, n 1.7 [52]Imaginary part of complex index of refraction, k 0.066 [52]Efficiency factors for extinction, Qext 0.585Efficiency factors for scattering, Qsca 0.398Efficiency factors for absorption, Qabs 0.187Absorption coefficient, kp 4.476 m−1
Scattering coefficient, σsp 9.526 m−1
Fig. 7. Thermal boundary conditions at walls in the zone model.
0.87 0.90 0.93 0.96 0.990.0
0.1
0.2
0.3
0.4
0.5
0.6
0.7
0.8
0.9
1.0Exp. data (Hu et. al., 2009):
Iv = 40 kgIv = 50 kgIv = 60 kgIv = 70 kgIv = 80 kg
This study:εb = 0.55
εb = 0.80
Nor
mal
ized
hei
ght
Voidage εFig. 8. Voidage profile of fluidized beds.
Table 6Computing efficiency of DEAs by different algorithms.
Updated MCRT algorithm (thisstudy)
Direct Numerical Integration [32]
Raydensity,rays/m2
Max. abs. err.in symmetry/summationrules
CPUtime,s
Number ofvolumeelements
Max. abs. err.insummationrule, %
CPU time, s
10,000 1e−10 3.97 10 × 13×13 5.78 21420,000 1e−10 7.16 20 × 26×26 2.93 921850,000 1e−10 16.59 30 × 40×40 1.91 107189
Hardware: HP ZBook/17 Model G2 Hardware: IBM RS/6000 Model 590CPU: Intel i7-4910MQ 2.9 GHz CPU: Power2 66.7 MHz
0 50 100 150 200 250 300 350 400 450 500400
500
600
700
800
900
1000
1100
1200
1300
1400
Tem
pera
ture
, K
Height, cm
Exp. data Emis. = 1.00 Emis. = 0.95 Emis. = 0.90 Emis. = 0.80 Emis. = 0.70
Bed Freeboard Cooler
Fig. 9. Measured- and predicted gas temperature profiles along the height of combustor.
Y. Hu et al. Applied Energy xxx (xxxx) xxx–xxx
8
calculation was obtained within a few seconds of CPU time, as shown inthe left hand side of Table 6. On the right hand side, the accuracy of thedirect numerical integration algorithm depends on the number of vo-lume elements and increases exponentially with it. Without using thesmoothing algorithm, relatively larger errors in energy balances may beexpected, especially in the case with a small number of volume zones.Despite significant improvement in accuracy (by almost eight orders ofmagnitude) using the updated MCRT algorithm, the required CPU timeis still much less than the direct numerical integration algorithm.
4.3. Thermal performance
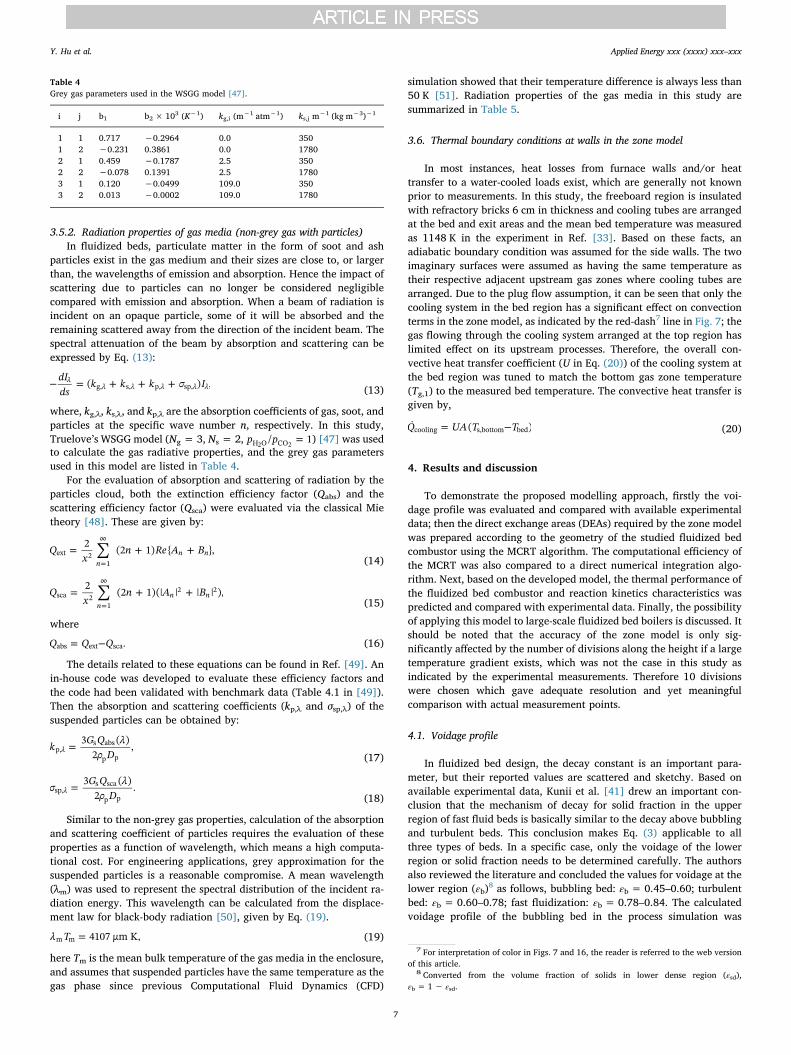
The simulation of a steady state operation of the studied fluidizedbed showed that the calculation took 0.40 s to reach a converged so-lution after 3 iterations, and the maximum temperature difference be-tween the values calculated by RCSTR blocks and zone model was lessthan 10−4 K. The measured and predicted thermal performance, in-cluding gas temperature profile and mean incident radiative heat flux,
is shown in Figs. 9 and 10, respectively. The gas temperature profilesare found to be in good agreement, but appreciable discrepancies arefound in the incident radiative heat flux at the locations close to the bedand the cooler. These discrepancies might be due to the equivalentsurfaces which do not really exist and this would interdict ‘cold’ beamsfrom the cooling tubes, and the radiometer probes located at thoseheights are also affected by the cooling tubes. Further sensitivity studyon the emissivity of the wall surfaces showed that the emissivity hasalmost has no effect on the gas temperature profiles but a significantaffect the incident radiative heat flux. In general, the incident radiativeheat flux increases with increasing surface emissivity. This is becausethe temperature profile of the system will be constant when thermalequilibrium is attained under steady-state operation. The net incidentradiative heat flux on a surface depends on the fourth-power tem-perature difference between gas and the surface and their emissivities.Hence, increasing the water wall emissivity will help to improve theboiler thermal performance. For the studied fluidized bed, since theinner walls of the freeboard are refractory lined and insulated, heatlosses are negligible. The wall temperatures of the freeboard aretherefore close to the adjacent gas temperatures during the steady stateoperation.
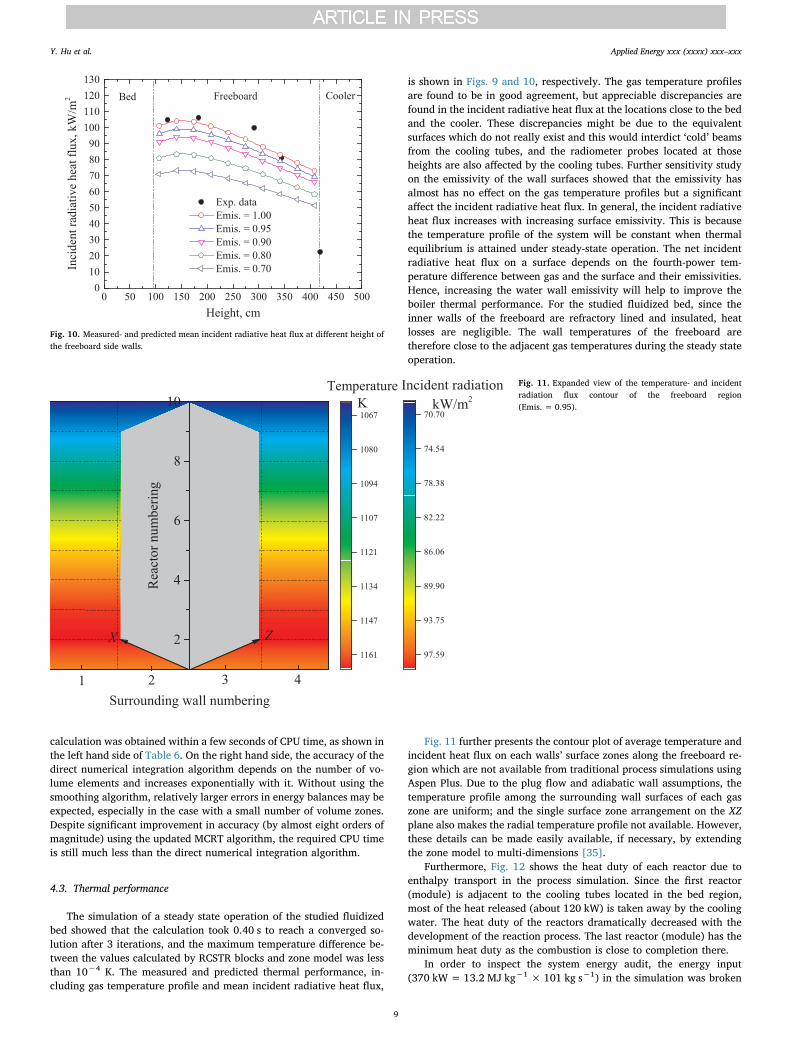
Fig. 11 further presents the contour plot of average temperature andincident heat flux on each walls’ surface zones along the freeboard re-gion which are not available from traditional process simulations usingAspen Plus. Due to the plug flow and adiabatic wall assumptions, thetemperature profile among the surrounding wall surfaces of each gaszone are uniform; and the single surface zone arrangement on the XZplane also makes the radial temperature profile not available. However,these details can be made easily available, if necessary, by extendingthe zone model to multi-dimensions [35].
Furthermore, Fig. 12 shows the heat duty of each reactor due toenthalpy transport in the process simulation. Since the first reactor(module) is adjacent to the cooling tubes located in the bed region,most of the heat released (about 120 kW) is taken away by the coolingwater. The heat duty of the reactors dramatically decreased with thedevelopment of the reaction process. The last reactor (module) has theminimum heat duty as the combustion is close to completion there.
In order to inspect the system energy audit, the energy input(370 kW= 13.2 MJ kg−1 × 101 kg s−1) in the simulation was broken
0 50 100 150 200 250 300 350 400 450 5000
102030405060708090
100110120130
Inci
dent
radi
ativ
e he
at fl
ux, k
W/m
2
Height, cm
Exp. data Emis. = 1.00 Emis. = 0.95 Emis. = 0.90 Emis. = 0.80 Emis. = 0.70
Bed Freeboard Cooler
Fig. 10. Measured- and predicted mean incident radiative heat flux at different height ofthe freeboard side walls.
Fig. 11. Expanded view of the temperature- and incidentradiation flux contour of the freeboard region(Emis. = 0.95).
Y. Hu et al. Applied Energy xxx (xxxx) xxx–xxx
9

down into the heat duty of bed cooling, heat duty of top cooling plusloss in exhaust9, and loss in unburned coal, as plotted in Fig. 13. Thecombustion efficiency can be evaluated based on the unburned coal,
which was about 95% in this study. This result is within a reasonablerange of the normal combustion efficiency (over 90%) of bubblingfluidized beds in the technical report [55].
4.4. Reaction kinetics
Not only the thermal performance, but also the reaction kineticscharacteristics of each gas/volume zone are available in the processsimulation. Fig. 14 shows the reaction rate of key components in theexothermic reactions. A positive value means production and a negativevalue means consumption. From this figure it can be seen that O2 isalways being consumed and CO2 is always being produced, while thereaction rates drop asymptotically to zero, as expected. The reactionrate of CO highly depends on the combustion atmosphere. Due to theassumption that Volatile C (CISOLID) is only oxidized to CO in the O2-lean environment at bed level, as mentioned in Section 3.2, a relativelylarge amount of CO is therefore present at the lower region of thefreeboard region. In practical operation, appropriate air staging can beapplied to ensure low pollutant emissions and completed combustion[56].
Fig. 15 shows the comparison of the measured and predicted O2,CO2 and CO concentrations in the process simulation. Despite sig-nificant deviations, the predicted trends of concentration are in
1 2 3 4 5 6 7 8 9 1010-5
10-4
10-3
10-2
10-1
100
101
102
103H
eat d
uty,
kW
Numbering of RCSTR reactors
Fig. 12. Heat duty due to enthalpy transport of each reactor in the process simulation.
Unburn coal19 (5.14%)
Top cooling + Exhaust234 (63.24%)
Bed cooling117 (31.62%)
Unit: kW
Fig. 13. System energy audit of the base case.
Fig. 14. Predicted reaction rate of O2, CO2, and CO.
0 50 100 150 200 250 300 350 400 450 5000
3
6
9
12
15
18
21
Exp. data - O2 Prediction - O2
Exp. data - CO2 Prediction - CO2
Exp. data - CO Prediction - CO
Con
cent
ratio
n, m
ol%
Height, cm
Bed Freeboard Cooler
Fig. 15. Measured and predicted O2, CO2, and CO concentrations.
Water
Vapor
Ice
Criticalpoint
Supercriticaloperation
areaPr
essu
re, a
tm
Temperature, K647
218Vapor-liquid
phase
1
373
Fig. 16. Pressure-Temperature phase diagram of water.
9 Due to the exhaust temperature not being available, only the sum of the heat duty ofthe top cooling system and the heat loss in the exhausted flue gas is available.
Y. Hu et al. Applied Energy xxx (xxxx) xxx–xxx
10

agreement with the measurements. These results prove the effective-ness of the proposed modelling approach to some extent. The deviationin the absolute values is most likely due to the over simplification of thecombustion mechanisms applied in this study, and the fact that com-bustion reactions are influenced by many factors such as the type offuel, and the physical state of reactants and their dispersion, which arenot fully considered. In addition, the assumption of virtual elementalsubstances during devolatilization may also cause the deviations sincethis is not the case in the real process. In order to improve the pre-diction, more complicated combustion mechanisms [2] have to be in-volved to accurately calculate the O2 consumption rate in its relatedreactions. Further, a devolatilization mechanism which is more similarto the real process is also helpful to improve the prediction.
4.5. Discussion on the real application of the proposed modelling approach
The results shown above have demonstrated the application of theproposed modelling approach on a bubbling fluidized bed combustor.For real-time simulations of a whole power plant, the prerequisite isthat the model execution is faster than real-time. The modest com-puting demand implies that the developed model can be potentiallyincorporated into process simulations of a whole power plant. Whenapplying the proposed modelling approach to a large-scale fluidizedbed boiler, the main difference would lie in boundary conditions of heattransfer through water walls. In subcritical operations, heat is trans-ferred to a boiling fluid (vapour-liquid phase) at an operating tem-perature, as indicated by the solid red line in Fig. 16. Therefore, theDirichlet (or first-type) boundary conditions [57] are applicable to thewater walls. Even though excessive heat flux on the furnace side mayoccur, it can be automatically compensated for with a larger water flowrate in the tubes. Latent heat of phase changes takes the role of a bufferand maintains the temperature of the water membrane within a safelimit. In supercritical or ultra-supercritical cases, the conditions aremuch more sophisticated if excessive heat flux on the furnace side oc-curs. This is because, under supercritical conditions, only one state ofphase exists. The temperature of the water membrane is very sensitiveto the change of heat flux on the furnace side. If excess heat flux on thefurnace side occurs and cannot be compensated in time, it can easilylead to heat transfer deterioration of the whole system. That is thereason why involving heat transfer to water walls is of particular im-portance to the evaluation of operating conditions and flexibility of afluidized bed boiler in supercritical conditions. In that case, the waterwall should be considered as heating load (or internal obstacle) in-dividually in the zone model and the heat conduction through thewater-cooled wall to the supercritical fluid needs to be considered aswell. By doing so, the local heat absorption by water walls is in-corporated and available in the process simulation.
In addition, the implication of the current work highlighted theexisting limitation of the sequential modular strategy in Aspen Plus, inthat there is no thermal reciprocity within its modelling framework. Byincorporating the zone model with Aspen Plus interface in this work,the energy balance takes account of radiation interchange between allvolume and surface zones, the enthalpy transport, and the source termassociated with combustion and heat release. Although the developedmodel is one-dimensional in this case, the proposed modelling approachis equally applicable to two- and three-dimensional cases. For a multi-dimensional model with more complex geometry, the plug flow as-sumption is no longer applicable. The enthalpy transport term needs tobe expanded to include the flows in all relevant directions. The flowdata may be derived from other means such as physical models andisothermal CFD simulations [36].
5. Conclusions
This paper successfully demonstrated a novel modelling approachfor fluidized beds which incorporated the classical zone method with
Aspen Plus interface. A main advantage of the proposed modellingapproach stems from the thermal reciprocity within a combustor de-rived from the zone model which resolves the limitation of the se-quential modular strategy in Aspen Plus. A steady state operation on a0.3 MW atmospheric bubbling fluidized-bed combustor test rig was si-mulated and completed in a few seconds of CPU time. The predictedthermal performance and the reaction kinetics of the studied fluidizedbed combustor (such as the temperature profile, incident radiative heatflux) are in agreement with the experimental data; and the predictedoverall combustion efficiency is also within a reasonable range of thenormal combustion efficiency of bubbling fluidized beds. Relativelymodest computing demand and acceptable accuracy make it possiblefor the developed model to be incorporated into process simulations ofa whole power plant and to be used to study the operational flexibilityof the whole power plant.
Acknowledgements
This work was supported by the Engineering and Physical SciencesResearch Council (EPSRC, EP/M01536X/1; EP/K21095/1, UK). Theauthors thank Dr. Mark Dooner for assistance with proofreading.
References
[1] Zhu Q. IEA Report: Developments in circulating fluidised bed combustion. CCC/219, IEA Clean Coal Centre; 2013.
[2] Basu P. Circulating fluidized bed boilers: design, operation and maintenance. NewYork: Springer Inc; 2015. p. 2015.
[3] Li Y. Research on the dynamic characteristics of a 600 MWe supercritical circulatingfluidized bed boiler system PhD Thesis Tsinghua University; 2009.
[4] Li J. Studies on dynamic characteristics of large-scale circulating fluidized beds PhDThesis Tsinghua University; 2009.
[5] Lockwood T. IEA Report: Techno-economic analysis of PC versus CFB combustiontechnology. CCC/226, IEA Clean Coal Centre; 2013.
[6] Guo Z, Wang Q, Fang M, Luo Z, Cen K. Thermodynamic and economic analysis ofpolygeneration system integrating atmospheric pressure coal pyrolysis technologywith circulating fluidized bed power plant. Appl Energy 2014;113:1301–14.
[7] Kotowicz J, Michalski S. Thermodynamic and economic analysis of a supercriticaland an ultracritical oxy-type power plant without and with waste heat recovery.Appl Energy 2016;179:806–20.
[8] Leckner B, Gómez-Barea A. Oxy-fuel combustion in circulating fluidized bed boilers.Appl Energy 2014;125:308–18.
[9] Akram M, Tan CK, Garwood DR, Fisher M, Gent DR, Kaye WG. Co-firing of pressedsugar beet pulp with coal in a laboratory-scale fluidised bed combustor. Appl Energy2015;139:1–8.
[10] Rajan R, Krishnan R, Wen CY. Simulation of fluidized bed coal combustors. NASAReport; February 1979.
[11] Rajan RR, Wen CY. A comprehensive model for fluidized bed coal combustors.AIChE J 1980;26(4):642–55.
[12] de Souza-Santos ML. Modelling and simulation of fluidized-bed boilers and gasifiersfor carbonaceous solids Ph.D. thesis United Kingdom: University of Sheffield,Department of Chemical Engineer and Fuel Technology; 1987.
[13] de Souza-Santos ML. Comprehensive modelling and simulation of fluidized-bedboilers and gasifiers. Fuel 1989;68:1507–21.
[14] de Souza-Santos ML. Application of comprehensive simulation of fluidized-bed re-actors to the pressurized gasification of biomass. J Brazil Soc Mech Sci1994;16:376–83.
[15] de Souza-Santos ML. A new version of CSFB, comprehensive simulator for fluidizedbed equipment. Fuel 2007;86:1684–709.
[16] de Souza-Santos ML. Comprehensive simulator (CSFMB) applied to circulatingfluidized bed boilers and gasifiers. Open Chem Eng J 2008;2:106–18.
[17] de Souza-Santos ML. CSFB applied to fluidized-bed gasification of special fuels. Fuel2009;88:826–33.
[18] de Souza-Santos ML. Comprehensive simulator applied to fluidized bed coal gasi-fication. Open Chem Eng J 2010;4:68–79.
[19] List of chemical process simulators. en.wikipedia.org/wiki/List_of_chemical_pro-cess_simulators; [access 02.02.17].
[20] Sotudeh-Gharehaagh R, Legros R, Chaouki J, Paris J. Simulation of circulatingfluidized bed reactors using ASPEN PLUS. Fuel 1998;77(4):327–37.
[21] Yan HM, Zhang DK. Modelling of a low temperature pyrolysis process using ASPENPLUS. Dev Chem Eng Min Process 1999;7(5/6):577–91.
[22] Ngampradit N, Piumsomboon P, Sajjakulnukitb B. Simulation of a circulating flui-dized bed combustor with shrinking core and emission models. Science Asia2004;30:365–74.
[23] Hughes RW, Lu DY, Anthony EJ, Macchi A. Design, process simulation and con-struction of an atmospheric dual fluidized bed combustion system for in situ CO2
capture using high-temperature sorbents. Fuel Process Technol 2005;86:1523–31.[24] Nikoo MB, Mahinpey N. Simulation of biomass gasification in fluidized bed reactor
Y. Hu et al. Applied Energy xxx (xxxx) xxx–xxx
11

using Aspen Plus. Biomass Bioenergy 2008;32:1245–54.[25] Liu B, Yang X, Song W, Lin W. Process simulation development of coal combustion
in a circulating fluidized bed combustor based on Aspen Plus. Energy Fuel2011;25:1721–30.
[26] Liu B, Yang X, Song W, Lin W. Process simulation of formation and emission of NOand N2O during coal decoupling combustion in a circulating fluidized bed com-bustor using Aspen Plus. Chem Eng Sci 2012;71:375–91.
[27] Abdelouahed L, Authier O, Mauviel JP, Corriou GV, Dufour A. Detailed modeling ofbiomass gasification in dual fluidized bed reactors under Aspen Plus. Energy Fuel2012;26:3840–55.
[28] Pauls JH, Mahinpey N, Mostafavi E. Simulation of air-steam gasification of woodybiomass in a bubbling fluidized bed using Aspen Plus: A comprehensive modelincluding pyrolysis, hydrodynamics and tar production. Biomass Biomenergy2016;95:157–66.
[29] Yue G, Cai R, Lv J, Zhang H. From a CFB reactor to a CFB boiler – The review ofR & D progress of CFB coal combustion technology in China. Powder Technolhttp://dx.doi.org/10.1016/j.powtec.2016.10.062.
[30] Snider DM, Clark SM, O’Rourke PJ. Eulerian-Lagrangian method for three-dimen-sional thermal reacting flow with application to coal gasifiers. Chem Eng Sci2011;66:1285–95.
[31] Wang Q, Yang H, Wang P, Lu J, Liu Q, Zhang H, Wei L, Zhang M. Application ofCPFD method in the simulation of a circulating fluidized bed with a loop seal Part II– Investigation of solids circulation. Powder Technol 2014;253:822–8.
[32] Batu A, Selçuk N. Modeling of radiative heat transfer in the freeboard of a fluidizedbed combustor using the zone method of analysis. Turk J Eng Environ Sci2002;26:49–58.
[33] Alagoz DE, Kulah G, Selçuk N. A comprehensive fluidized bed combustion modelcoupled with a radiation model. Combust Sci Technol 2008;180:910–26.
[34] Lindsay JJ, Morton W, Newey DC. Radiative heat transfer in the freeboard region ofa fluidised bed. In: Proceedings of the fifth engineering foundation conference onfluidization, engineering foundation, New York, NY’; 1986. p. 385–92.
[35] Hu Y, Tan CK, Broughton J, Roach PA. Development of a first-principles hybridmodel for large-scale reheating furnaces. Appl Energy 2016;173:555–66.
[36] Selçuk N, Gogebakan Y, Harmandar H, Altindag H. Effect of recycle on fluidized-bed combustion and emission characteristics of high-sulfur lignite. Combust SciTechnol 2004;176:959–75.
[37] Aspen Plus V8.8 User Guide, Cambridge: Aspen Technology Inc; 2016.[38] Hill SC, Smoot LD. Modeling of nitrogen oxides formation and destruction in
combustion systems. Prog Energy Combust Sci 2000;26(4):417–58.[39] Wen CY, Chen H, Onozaki M. User’s manual for computer simulation and design of
the moving bed coal gasifier. In: Report submitted to Morgantown Energy
Technology Center and U.S. Department of Energy, Contract DOE/MC/16474-1390;1982.
[40] Kunii D, Levenspiel O. Entrainment of solids from fluidized beds II operation of fastfluidized bed. Powder Technol 1990;61:193–206.
[41] Kunii D, Levenspiel O. Flow modeling of fast fluidized beds. In: Basu P, Hasatani M,Horio M, editors. Circulating fluidized bed III. Oxford: Pergamon Press; 1991. p.91–8.
[42] Chehbouni A, Chaouki J, Guy C, Klvana D. Characterization of the flow transitionbetween bubbling and turbulent fluidization. Ind Eng Chem Res1994;33(8):1889–96.
[43] Lewis WK, Gilliland ER, Lang PM. Entrainment from fluidized beds. Chem EngProgress Sympos Series 1962;58(38):65–78.
[44] Rhine JM, Tucker RJ. Modelling of gas-fired furnaces and boilers. New York:McGraw-Hill Inc; 1991.
[45] Hildebrand F. Introduction to numerical analysis. Dover Publications; 1987.[46] Matthew AD, Tan CK, Roach PA, Ward J, Broughton J, Heeley A. Calculation of the
Radiative Heat-Exchange Areas in a Large-Scale Furnace with the Use of the MonteCarlo Method. J Eng Phys Thermophys 2014;87(3):732–42.
[47] Truelove JS. A moxed grey gas model for flame radiation. United Kingdom AtomicEnergy Authority Report AERE-R-8494, Harwell; 1976.
[48] Mie GA. Beiträge zur Optik trüber Medien, speziell kolloidaler Metallösungen.Annalen der Physik 1908;25:377–445.
[49] Bohren CF, Huffman RD. Absorption and scattering of light by small particles. NewYork: Wiley & Sons Inc; 1983.
[50] Hottel HC, Sarofim AF. Radiative transfer. New York: McGraw-Hill Inc; 1967.[51] Ma J, Eason JP, Dowling AW, Biegler LT. Development of a first-principles hybrid
boiler model for oxy-combustion power generation system. Int J Greenhouse GasControl 2016;46:136–57.
[52] Modest MF. Radiation heat transfer. New York: Academic Press; 2003.[53] Hu N, Zhang H, Yang H, Yang S, Yue G, Lu J, Liu Q. Effects of riser height and total
solids inventory on the gas-solids in an ultra-tall CFB riser. Powder Technol2009;196:8–13.
[54] Lawson DA. An improved method for smoothing approximate exchange areas. Int JHeat Mass Transf 1995;38:3109–10.
[55] Peña JAP. Bubbling fluidized bed (BFB), When to use this technology? In:Proceedings of IFSA 2011 Industrial Fluidization, Johannesburg, South Africa;16–17 November 2011.
[56] Liu H, Chaney J, Li J, Sun C. Control of NOx emissions of a domestic/small-scalebiomass pellet boiler by air staging. Fuel 2013;103:792–8.
[57] Cheng A, Cheng DT. Heritage and early history of the boundary element method.Eng Anal Boundary Elem 2005;29:268–302.
Y. Hu et al. Applied Energy xxx (xxxx) xxx–xxx
12