coupled physical-biological model for the pearl river...
TRANSCRIPT
1 Xue and Chai
To appear in the Proceedings of the 7th International Conference on Estuarine and Coastal Modeling, St. Petersberg, Fl, November, 2001
Coupled Physical-Biological Model for the Pearl River Estuary: A Phosphate Limited Subtropical Ecosystem Huijie Xue and Fei Chai, School of Marine Sciences, University of Maine, (207)581-4318, [email protected] Abstract The Pearl River, with an annual mean discharge rate of ~ 10,000 m3s-1, has profound dynamic and ecological influences on the northern shelf of the South China Sea. A coastal ocean model is set up to simulate the circulation in the Pearl River Estuary and the neighboring coastal regions. In winter the Guangdong Coastal Current, which flows southwestward and passes the mouth of the estuary, forces the Pearl River plume to the western side of the estuary. Therefore, intrusion occurs mostly in the Da-Yu Channel, which is toward the eastern side of the estuary. As a result, the coastal current has a large impact on the southeastern side of the estuary. A phosphate based biological model with two sizes of phytoplankton and zooplankton is embedded in the circulation model to investigate nutrient and plankton dynamics in the estuary. 1. Introduction
The Pearl River is the 16th largest river in the world with an annual averaged discharge rate of ~ 10,000 m3 s-1 (Perry et al. 1996). Its watershed covers some of the most densely populated regions in China that gives rise to a severely polluted river system. As a result, Pearl River Estuary (PRE) is one of the regions with the most frequent occurrence of harmful algae blooms, which impose a great threat to the local fishery and aquaculture industry, and the health of the communities along its perimeter.

2 Xue and Chai
Fig. 1. The schematic showing the front associated with the Pearl River plume (dotted line for winter and dashed line for summer) and the residual circulation in the PRE (adapted from Huang (1984)). Open circles represent the 8 outlets through which the Pearl River enters the sea. From north to south they are Hu-Men (HM), Jiao-Men (JM), Hong-Qi-Men (HQM), Heng-Men (HNM), MO-Dao-Men (MDM), Ji-Ti-Men (JTM), Hu-Tiao-Men (HTM), and Ya-Men (YM). Other notations are HK –Hong Kong, MC – Macau, SZ – Shenzhen, LD – Ling-Ding Island, and LT – Lantau Island.
The PRE, a bell
shaped estuary, is about 60 km in the N-S direction. Its width increases from 20 km at the head of the estuary on the northern end to about 50 km at the mouth between Macau and Hong Kong. Pearl River is a common name for a complex river system in the southern China province of Guang-dong. It consists of three major rivers: the East, the North, and the West River, respectively. These three rivers branch and intertwine in the lower river delta and eventually enter the sea through eight channels (Fig. 1). Four out of eight channels are located on the northwestern side of the PRE. Together, these four channels carry a little over half of the total discharge of the Pearl River. Mo-Dao-Men, which carries about 30 % of the total discharge, enters the sea south of Macau.
Due to the asymmetry of the fresh water source, salinity in the PRE increases from the northwest to the southeast. Fig. 1 shows the front associated with the Pearl River plume. Discharge is small between November and February due to limited precipitation. Furthermore, the northeasterly monsoon helps to restrict the plume from spreading southeastward. As a result, the front retracts within the PRE during winter. The flood season spans from May to September during which the river plume can extend 50 km offshore. The plume would flow along the west bank of the estuary due to the Coriolis effect. The southwesterly wind at this time of year, however, drives part of the plume
3 Xue and Chai
towards northeast (Xue et al. 2001). Salinity south of Hong Kong can be lower than 24, and aquatic species of Pearl River origin have been found in the Taiwan Strait. The summer plume is known to have strong inter-annual variability associated with the monsoon strength.
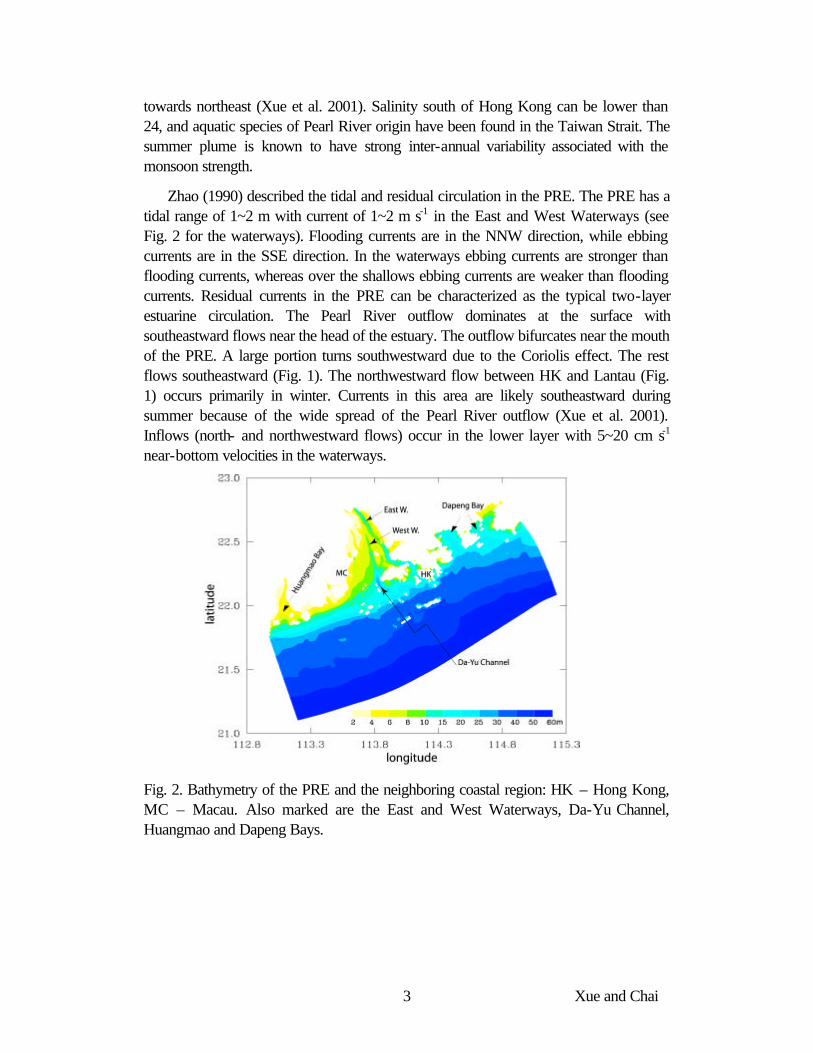
Zhao (1990) described the tidal and residual circulation in the PRE. The PRE has a tidal range of 1~2 m with current of 1~2 m s-1 in the East and West Waterways (see Fig. 2 for the waterways). Flooding currents are in the NNW direction, while ebbing currents are in the SSE direction. In the waterways ebbing currents are stronger than flooding currents, whereas over the shallows ebbing currents are weaker than flooding currents. Residual currents in the PRE can be characterized as the typical two-layer estuarine circulation. The Pearl River outflow dominates at the surface with southeastward flows near the head of the estuary. The outflow bifurcates near the mouth of the PRE. A large portion turns southwestward due to the Coriolis effect. The rest flows southeastward (Fig. 1). The northwestward flow between HK and Lantau (Fig. 1) occurs primarily in winter. Currents in this area are likely southeastward during summer because of the wide spread of the Pearl River outflow (Xue et al. 2001). Inflows (north- and northwestward flows) occur in the lower layer with 5~20 cm s-1 near-bottom velocities in the waterways.
Fig. 2. Bathymetry of the PRE and the neighboring coastal region: HK – Hong Kong, MC – Macau. Also marked are the East and West Waterways, Da-Yu Channel, Huangmao and Dapeng Bays.
4 Xue and Chai
y = -0 .0147x3 + 0 .9526x2 - 22.274x + 229.81R 2 = 0 .977
0.0
10.0
20.0
30.0
40.0
50.0
60.0
70.0
80.0
10 15 20 25 30 35
salinity
(a)
NO
3(µ
mol
/L)
y = -0.0154x3 + 1.0582x2 - 27.403x + 322.46R2 = 0.9758
0
20
40
60
80
100
120
10 15 20 25 30 35
salinity
(b)S
i(OH
) 4(µ
mol
/L)
y = -0.0005823x3 + 0.0350957x
2 - 0.6541175x + 4.7460302
R2 = 0.616
0.00
0.20
0.40
0.60
0.80
1.00
1.20
1.40
1.60
10 15 20 25 30 35
salinity
(c)
PO4
(µm
ol/L
)
Fig. 3. Regression relationships based on data collected in the PRE in December 1996: salinity and NO3 (a), salinity and Si(OH)4 (b), and salinity and PO4 (c).
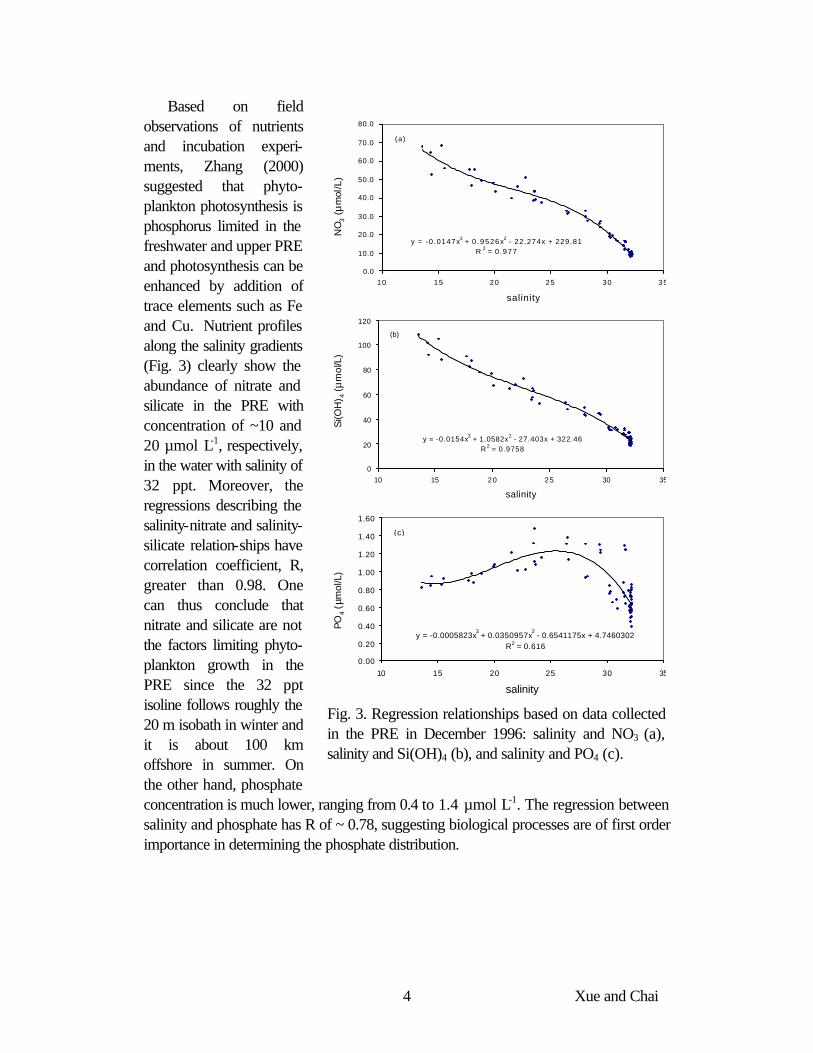
Based on field observations of nutrients and incubation experi-ments, Zhang (2000) suggested that phyto-plankton photosynthesis is phosphorus limited in the freshwater and upper PRE and photosynthesis can be enhanced by addition of trace elements such as Fe and Cu. Nutrient profiles along the salinity gradients (Fig. 3) clearly show the abundance of nitrate and silicate in the PRE with concentration of ~10 and 20 µmol L-1, respectively, in the water with salinity of 32 ppt. Moreover, the regressions describing the salinity-nitrate and salinity-silicate relation-ships have correlation coefficient, R, greater than 0.98. One can thus conclude that nitrate and silicate are not the factors limiting phyto-plankton growth in the PRE since the 32 ppt isoline follows roughly the 20 m isobath in winter and it is about 100 km offshore in summer. On the other hand, phosphate concentration is much lower, ranging from 0.4 to 1.4 µmol L-1. The regression between salinity and phosphate has R of ~ 0.78, suggesting biological processes are of first order importance in determining the phosphate distribution.
5 Xue and Chai
MicroZooplankton
[Z1]
Detritus[DP]
MesoZooplankton
[Z2]
Diatoms[S2]
Phosphate[PO4]
Sinking
Circulation
VerticalMixing
Sinking Resuspension
Sediment
P-Uptake
Grazing
Grazing
Loss
Fecal Pellet
P-Uptake
River Loadings
Circulation
Small Phytoplankton
[S1]
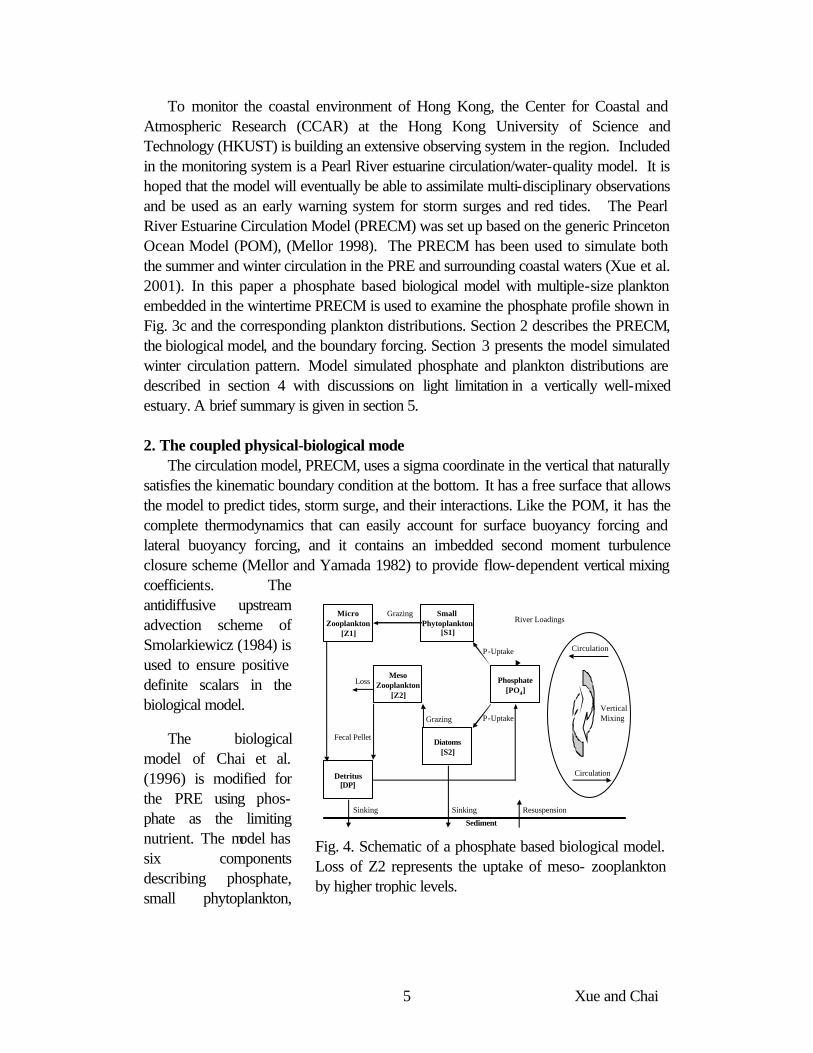
Fig. 4. Schematic of a phosphate based biological model. Loss of Z2 represents the uptake of meso- zooplankton by higher trophic levels.
To monitor the coastal environment of Hong Kong, the Center for Coastal and Atmospheric Research (CCAR) at the Hong Kong University of Science and Technology (HKUST) is building an extensive observing system in the region. Included in the monitoring system is a Pearl River estuarine circulation/water-quality model. It is hoped that the model will eventually be able to assimilate multi-disciplinary observations and be used as an early warning system for storm surges and red tides. The Pearl River Estuarine Circulation Model (PRECM) was set up based on the generic Princeton Ocean Model (POM), (Mellor 1998). The PRECM has been used to simulate both the summer and winter circulation in the PRE and surrounding coastal waters (Xue et al. 2001). In this paper a phosphate based biological model with multiple-size plankton embedded in the wintertime PRECM is used to examine the phosphate profile shown in Fig. 3c and the corresponding plankton distributions. Section 2 describes the PRECM, the biological model, and the boundary forcing. Section 3 presents the model simulated winter circulation pattern. Model simulated phosphate and plankton distributions are described in section 4 with discussions on light limitation in a vertically well-mixed estuary. A brief summary is given in section 5. 2. The coupled physical-biological mode
The circulation model, PRECM, uses a sigma coordinate in the vertical that naturally satisfies the kinematic boundary condition at the bottom. It has a free surface that allows the model to predict tides, storm surge, and their interactions. Like the POM, it has the complete thermodynamics that can easily account for surface buoyancy forcing and lateral buoyancy forcing, and it contains an imbedded second moment turbulence closure scheme (Mellor and Yamada 1982) to provide flow-dependent vertical mixing coefficients. The antidiffusive upstream advection scheme of Smolarkiewicz (1984) is used to ensure positive definite scalars in the biological model.
The biological model of Chai et al. (1996) is modified for the PRE using phos-phate as the limiting nutrient. The model has six components describing phosphate, small phytoplankton,
6 Xue and Chai
diatoms, micro- and meso- zooplankton, and nonliving particulate organic matter. Each component is governed by the advection-diffusion equation with the inter-compartment interactions (biological source-sink terms) shown in Fig. 4. At the water-sediment interface, it is assumed that the resuspension balances sinking. Detailed parameterizations of the biological source-sink terms can be found in Chai et al. (1996 and 2002). Constants used in the parameterizations (such as half saturation concentrations, maximum phytoplankton growth rate, etc.) are adjusted for the PRE based on the estimates of Zhang et al. (1999) and Zhang (2000).
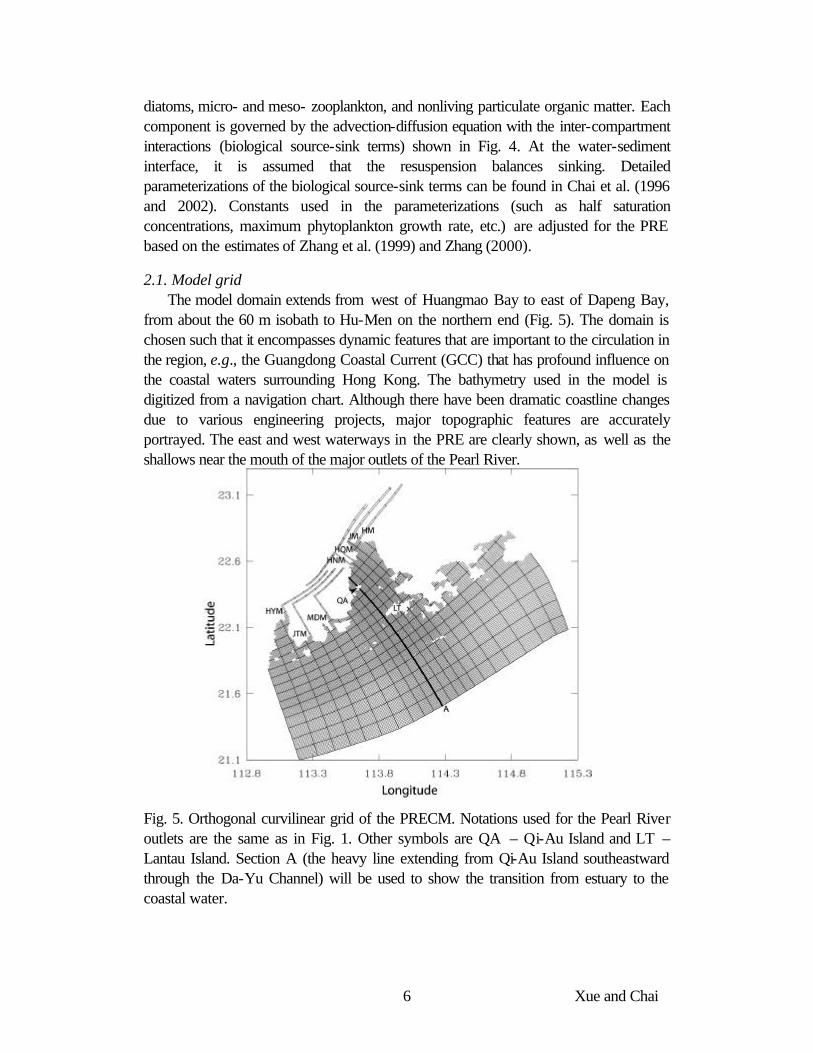
2.1. Model grid The model domain extends from west of Huangmao Bay to east of Dapeng Bay,
from about the 60 m isobath to Hu-Men on the northern end (Fig. 5). The domain is chosen such that it encompasses dynamic features that are important to the circulation in the region, e.g., the Guangdong Coastal Current (GCC) that has profound influence on the coastal waters surrounding Hong Kong. The bathymetry used in the model is digitized from a navigation chart. Although there have been dramatic coastline changes due to various engineering projects, major topographic features are accurately portrayed. The east and west waterways in the PRE are clearly shown, as well as the shallows near the mouth of the major outlets of the Pearl River.
Fig. 5. Orthogonal curvilinear grid of the PRECM. Notations used for the Pearl River outlets are the same as in Fig. 1. Other symbols are QA – Qi-Au Island and LT – Lantau Island. Section A (the heavy line extending from Qi-Au Island southeastward through the Da-Yu Channel) will be used to show the transition from estuary to the coastal water.
7 Xue and Chai
An orthogonal curvilinear grid (Fig. 5) is used with 211 grid points in the along-shore direction and 161 grid points in the offshore direction. Horizontal resolution varies from about 500 m in the PRE to about 1000 m in the shelf region. There are 15 sigma levels in the vertical, scaled to the height of the water column. Resolution is higher in the surface and bottom boundary layer. Single-cell-width channels are added to represent the major channels of the Pearl River.
2.2. Boundary forcing The boundary forcing data set consists of the meteorological forcing, river outflows,
and tidal and subtidal forcing of the open ocean. The northern South China Sea including the PRE is under the influence of alternating winter and summer monsoon every year. From May to September, southerly and southwesterly winds carry the warm and moist oceanic air over the region. From November to March, cold northeasterly winds blow over the region as a result of the Siberian High located over the East Asian continent. Radiative cooling and persistent cold air advection result in a negative net downward flux (Luo et al. 1992). A constant northeasterly wind at speed of 6 m s-1 and a net heat flux of 150 W m-2 (from the water to the air) are used for the winter simulation.
Pearl River enters the coastal sea through 8 major outlets: Hu-Men, Jiao-Men, Hong-Qi-Li, Heng-Men, Mo-Dao-Men, Ji-Ti-Men, Hu-Tiao-Men, and Ya-Men (Fig. 1). Annual discharges and yearly-averaged discharge rates through each outlet are given in Table 1. Wu (1996) estimated that the discharge during flood season amounts to ~ 80% of the annual discharge. The mean discharge rate during the winter (summer) is thus estimated at 0.3 (1.8) times the yearly-averaged discharge rate, respectively. Furthermore, since Hu-Tiao-Men and Ya-Men are so close to each other that we combined them into one outlet (HYM) in this model (Fig. 5).
Generally speaking, M2 and K1 are the two dominant tidal components on the northern shelf of the South China Sea. According to the global tidal charts of Schwiderski (1979 and 1981), phase of the M2 differs by about 20 degrees from the model eastern boundary to the western boundary, and about 10 degrees from the offshore boundary to the mouth of the PRE. The M2 amplitude increases from about 30 cm at the southeastern corner of the model domain to about 50 cm at the mouth of Huangmao Bay. For K1, the phase difference is less than 10 degree and the amplitude varies from 26 to 32 cm across the area. These boundary values have been adjusted to obtain an optimal comparison between the modeled and the observed tide in the PRE (Dr. Lai-Ah Wong, HKUST, personal communication).
The subtidal open ocean forcing can be applied by specifying the temperature, salinity and sea surface elevation along the model open boundary. The NOAA climatological atlas of the world ocean (Antonov et al. 1998) is used to specify the
8 Xue and Chai
temperature and salinity along the open boundary. Then, a relative sea level across the boundary is calculated according to the steric setup theory of Csanady (1979). The procedure results in a coastal setup of 2 and 4 cm on the eastern and western boundary, respectively.
Table 1. Yearly discharges and annual-averaged discharge rates from the 8 major outlets of the Pearl River.
HM JM HQM HNM MDM JTM HTM YM Yearly discharge
(x 108 m3) 603 565 209 365 923 197 202 196
Discharge rate (m3 s -1)
1912 1792 663 1157 2927 625 641 622
3. Winter circulation in the PRE The initial temperature and salinity are also obtained from the NOAA climatological
atlas of the world ocean. In winter, temperature at the surface ranges from less than 19 oC near the coast to above 23 oC on the shelf, and it is vertically well mixed in most part of the domain. Salinity varies from 32 near the coast to 34.3 on the shelf. The initial velocity is set to zero. A diagnostic calculation is performed at the beginning during which the velocity field is adjusted to the initial salinity and temperature distribution. It is followed by a “ramping” period during which the external forcing is linearly increased to its expected strength to avoid sudden glitches. Since the climatology reflects mostly the offshore condition in the northern shelf of the South China Sea, the initial near-shore temperature is too warm and salinity too salty compared to in situ measurements. Local cooling and river outflows in the model are able to correct the biases in the climatology. After the switch-on of external forcing, sea level on the western side of the PRE gradually increases while salinity decreases. A plume develops, hugging the west bank of the PRE.
The model reaches an equilibrium state after about 50 days. Fig. 6 shows the surface salinity and residual currents at the equilibrium state. Due to the close proximity of the 4 northern outlets, there is a single salinity front in the PRE that aligns in the northeast-southwest direction and straddles Ling-Ding Island, which agrees with the schematics shown in Fig. 1. Sensitivity experiments (not shown) suggest the front can shift in the north-south direction by about 20 km when the discharge decreases/increases by 25% or when the wind speed increases/decreases by 1 m s-1.
The Pearl River outflow moves south- and southwestward. Strong currents are found in the frontal zone and the speed increases gradually downstream as outflows from the three western outlets (MDM, JTM and HYM) join together and eventually merge with the GCC. The GCC flows between the 20 m and the 40 m isobath from
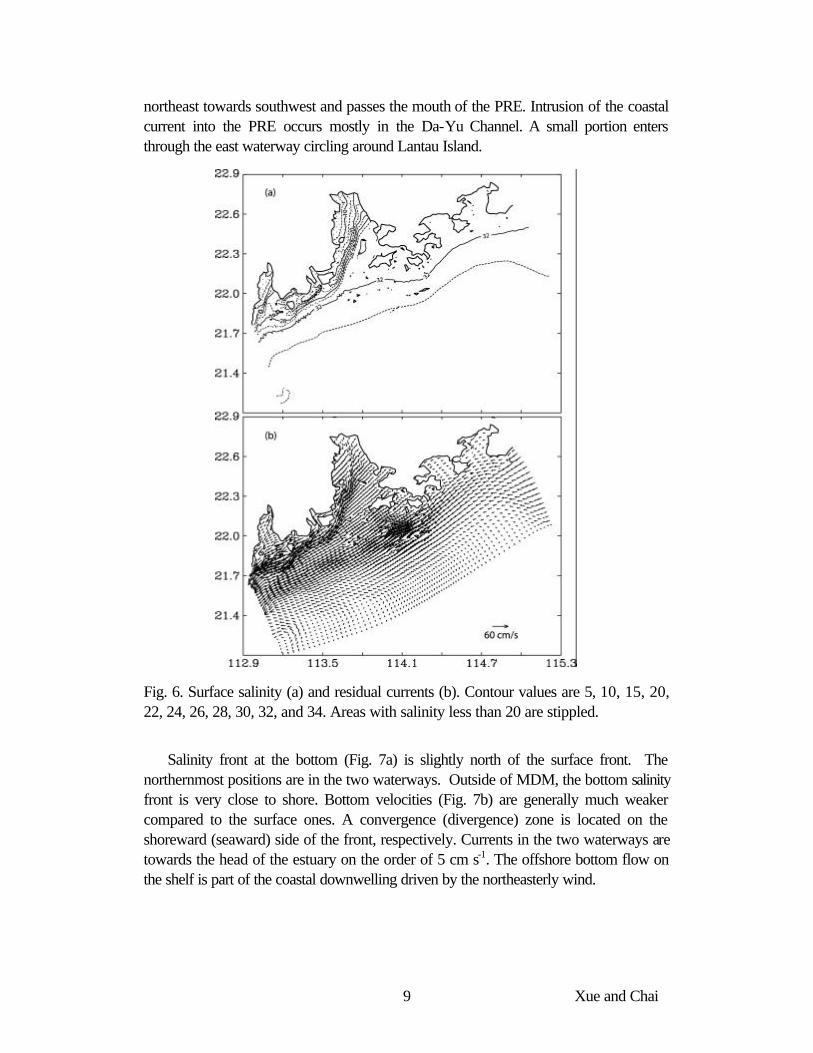
9 Xue and Chai
northeast towards southwest and passes the mouth of the PRE. Intrusion of the coastal current into the PRE occurs mostly in the Da-Yu Channel. A small portion enters through the east waterway circling around Lantau Island.
Fig. 6. Surface salinity (a) and residual currents (b). Contour values are 5, 10, 15, 20, 22, 24, 26, 28, 30, 32, and 34. Areas with salinity less than 20 are stippled.
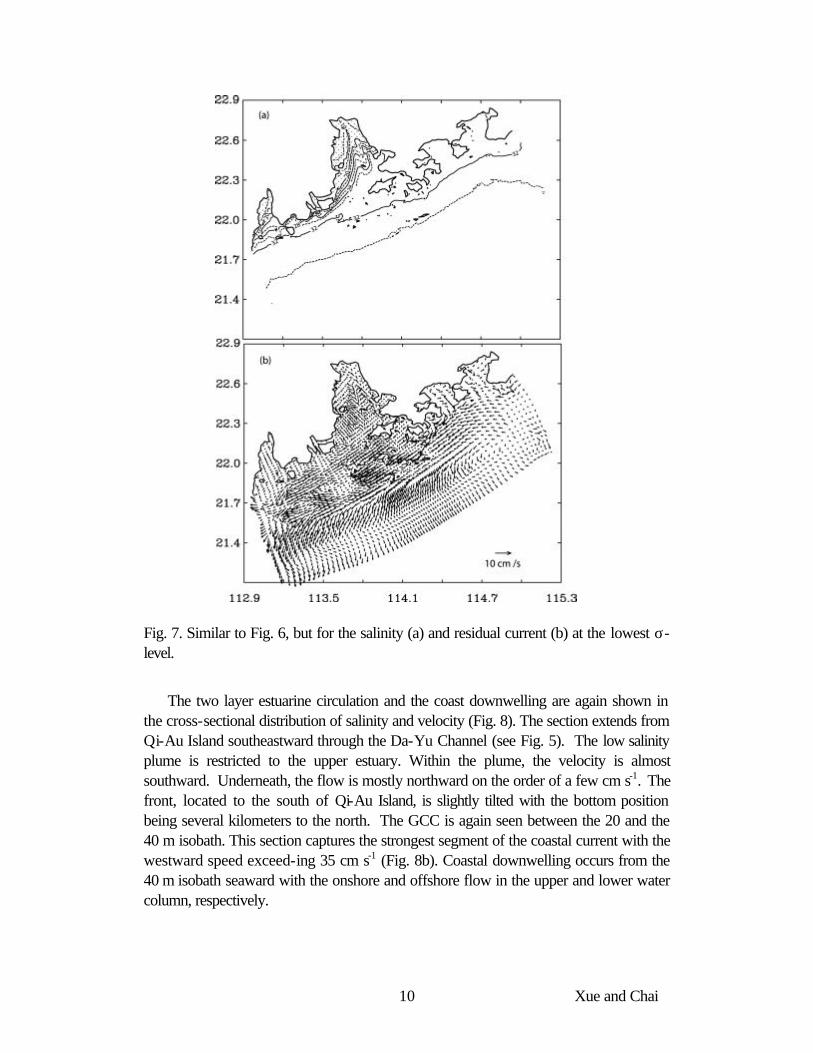
Salinity front at the bottom (Fig. 7a) is slightly north of the surface front. The northernmost positions are in the two waterways. Outside of MDM, the bottom salinity front is very close to shore. Bottom velocities (Fig. 7b) are generally much weaker compared to the surface ones. A convergence (divergence) zone is located on the shoreward (seaward) side of the front, respectively. Currents in the two waterways are towards the head of the estuary on the order of 5 cm s-1. The offshore bottom flow on the shelf is part of the coastal downwelling driven by the northeasterly wind.
10 Xue and Chai
Fig. 7. Similar to Fig. 6, but for the salinity (a) and residual current (b) at the lowest σ-level.
The two layer estuarine circulation and the coast downwelling are again shown in the cross-sectional distribution of salinity and velocity (Fig. 8). The section extends from Qi-Au Island southeastward through the Da-Yu Channel (see Fig. 5). The low salinity plume is restricted to the upper estuary. Within the plume, the velocity is almost southward. Underneath, the flow is mostly northward on the order of a few cm s-1. The front, located to the south of Qi-Au Island, is slightly tilted with the bottom position being several kilometers to the north. The GCC is again seen between the 20 and the 40 m isobath. This section captures the strongest segment of the coastal current with the westward speed exceed-ing 35 cm s-1 (Fig. 8b). Coastal downwelling occurs from the 40 m isobath seaward with the onshore and offshore flow in the upper and lower water column, respectively.

11 Xue and Chai
Fig. 8. Salinity (a), velocity perpendicular to section A (b), and velocity parallel to section A (c). Salinity contour values are 15, 20, 22, 24, 26, 28, 30, 32, and 34. Areas with salinity less than 20 are stippled. Contour interval for velocity is 5 cm s-1. Shaded areas represent negative velocity, approximately westward in (b) and southward in (c).
4. Nutrient dynamics in the PRE
To investigate the influences of the circu-lation and biological processes on phosphate spatial distribution, the biological model is initialized with a uniform phosphate concentration of 0.8 µmol L-
1. Other biological variables are also initialized with constant concentrations. Phosphate concentration in the river is set to 0.8 µmol L-1. At the open boundaries, upstream advection condition is applied. When the velocity is inward at the open boundary, it carries the nutrient and chlorophyll at values obtained from the Pacific Ocean Atlas of Conkright et al. (1998). The biological model is integrated simultaneously with the circulation model for 60 days. Total phosphate within the model increases initially attributed to the river input. As the phosphate concentration increases, the export through the open boundary increases as well. Eventually, the equilibrium is reached when the river input of phosphate and the net export through the open boundary is balanced, which takes about 40 days. The output from the last 20 days of the model integration (day 40 to day 60) is averaged to demonstrate the spatial distribution of phosphate and phytoplankton.
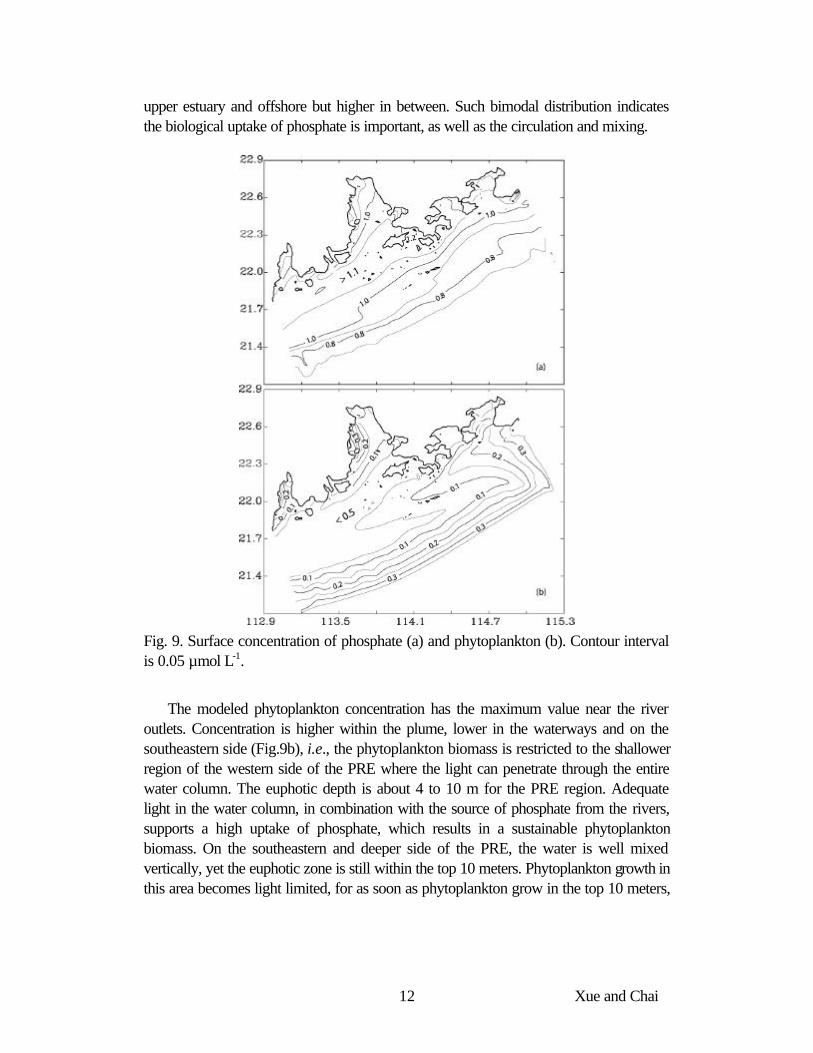
The modeled surface phosphate concentration shows a local minimum along the west bank of the PRE. The maximum concentration appears in a band near the mouth of the estuary, Fig. 9a. The source of phosphate is from the rivers, yet the modeled phosphate concentration shows a bimodal distribution inside the PRE, i.e., lower in the
12 Xue and Chai
upper estuary and offshore but higher in between. Such bimodal distribution indicates the biological uptake of phosphate is important, as well as the circulation and mixing.
Fig. 9. Surface concentration of phosphate (a) and phytoplankton (b). Contour interval is 0.05 µmol L-1.
The modeled phytoplankton concentration has the maximum value near the river outlets. Concentration is higher within the plume, lower in the waterways and on the southeastern side (Fig.9b), i.e., the phytoplankton biomass is restricted to the shallower region of the western side of the PRE where the light can penetrate through the entire water column. The euphotic depth is about 4 to 10 m for the PRE region. Adequate light in the water column, in combination with the source of phosphate from the rivers, supports a high uptake of phosphate, which results in a sustainable phytoplankton biomass. On the southeastern and deeper side of the PRE, the water is well mixed vertically, yet the euphotic zone is still within the top 10 meters. Phytoplankton growth in this area becomes light limited, for as soon as phytoplankton grow in the top 10 meters,
13 Xue and Chai
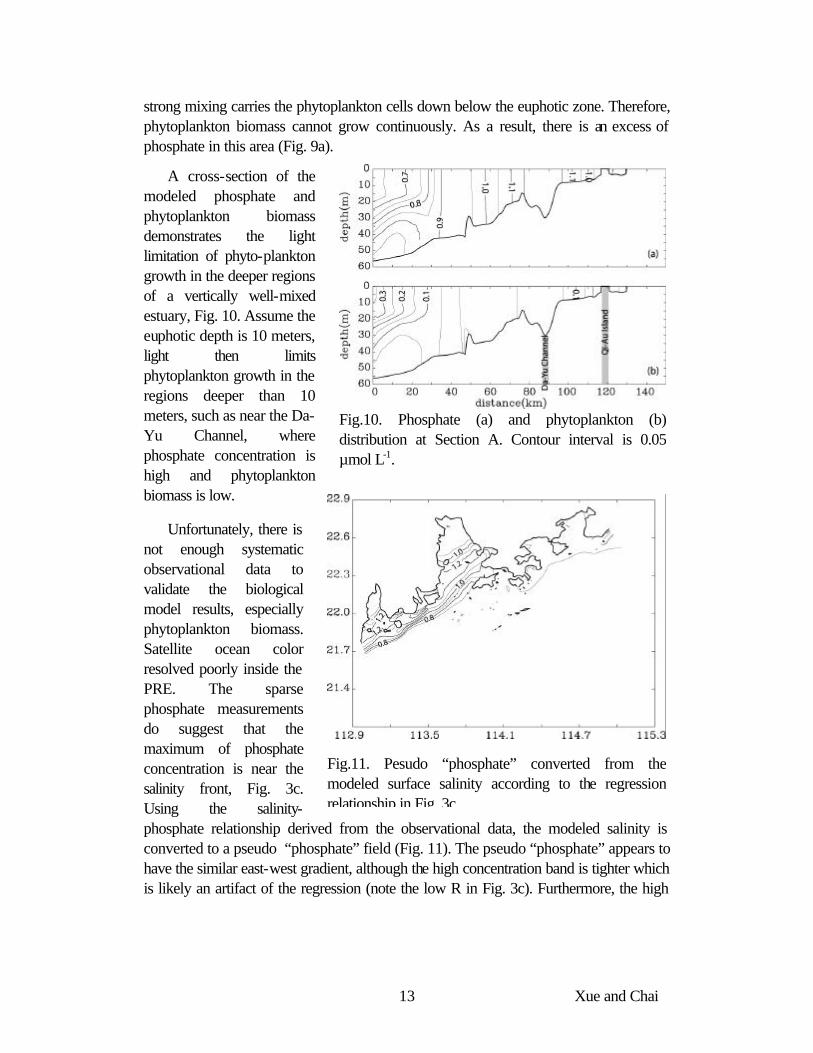
Fig.10. Phosphate (a) and phytoplankton (b) distribution at Section A. Contour interval is 0.05 µmol L-1.
Fig.11. Pesudo “phosphate” converted from the modeled surface salinity according to the regression relationship in Fig. 3c.
strong mixing carries the phytoplankton cells down below the euphotic zone. Therefore, phytoplankton biomass cannot grow continuously. As a result, there is an excess of phosphate in this area (Fig. 9a).
A cross-section of the modeled phosphate and phytoplankton biomass demonstrates the light limitation of phyto-plankton growth in the deeper regions of a vertically well-mixed estuary, Fig. 10. Assume the euphotic depth is 10 meters, light then limits phytoplankton growth in the regions deeper than 10 meters, such as near the Da-Yu Channel, where phosphate concentration is high and phytoplankton biomass is low.
Unfortunately, there is not enough systematic observational data to validate the biological model results, especially phytoplankton biomass. Satellite ocean color resolved poorly inside the PRE. The sparse phosphate measurements do suggest that the maximum of phosphate concentration is near the salinity front, Fig. 3c. Using the salinity-phosphate relationship derived from the observational data, the modeled salinity is converted to a pseudo “phosphate” field (Fig. 11). The pseudo “phosphate” appears to have the similar east-west gradient, although the high concentration band is tighter which is likely an artifact of the regression (note the low R in Fig. 3c). Furthermore, the high
14 Xue and Chai
concentration band of the pseudo “phosphate” is inside of the estuary, collocating with the salinity front. Similar distributions of phosphate were also observed in the Mississippi and Amazon Estuary (Fox et al. 1985; Froelich 1988). A possible explanation of this type of longitudinal profiles of PO4 along the salinity gradients of estuaries is the so called “phosphate buffer mechanism” (Froelich 1988). The additional phosphat might be released from bottom sediments and/or suspended particles. In the future, the physical-biological model should be coupled with a sediment transport model to examine the effects of “phosphate buffer mechanism” in the PRE. 5. Summary
A circulation model based on the generic code of the POM coupled with a phosphate based biological model is used to simulate the circulation and phosphate and phytoplankton distributions in the PRE. During winter, the Pearl River plume is restricted to the western side of the PRE. The Guandong Coastal Current flows southwestward and passes the mouth of the estuary. Intrusion occurs in the Da-Yu Channel, as well as around the eastern side of Lantau Island. As a result, the PRE is divided both hydrodynamically and biologically into two regions. The northwestern regime is controlled by the Pearl River outflow and relatively high phytoplankton biomass that draws down phosphate concentration. In contrast, the southeastern regime is influenced by the marine water with relatively high salinity. The area is also the deeper part of the PRE. The water column is well mixed due to persistent surface cooling. On the other hand, light becomes limited below 10 m, which prevents the continuous growth of phytoplankton. This region, thus, has relatively high concentration of phosphate.
There have been several more survey cruises in the PRE in recent years. The data, when it becomes available, will be used to further calibrate the physical-biological model as well as to validate the results. Furthermore, a sediment transport model is being developed at the CCAR, HKUST. In the future, the physical-biological model will be coupled with the transport model to investigate whether “phosphate buffer mechanism” plays a significant role in nutrient dynamics in the PRE. Acknowledgements. This work stems from a contractual project supported by the CCAR, HKUST. Assistance from the CCAR scientists and stuff members, especially Dr. Lai-Ah Wong, is greatly appreciated. We also thank the anonymous reviewers for helpful suggestions and comments. 6. References Antonov, J., Levitus, S., T.P. Boyer, M. Conkright, T. O' Brien, C. Stephens, 1998:
World Ocean Atlas 1998 Vol. 2: Temperature of the Pacific Ocean. NOAA Atlas NESDIS 28. U.S. Gov. Printing Office, Wash., D.C., 166 pp.
15 Xue and Chai
Chai, F., R. T. Barber, and S. T. Lindley, 1996. Origin and maintenance of high nutrient condition in the equatorial Pacific. Deep-Sea Res. II, Vol. 42, No. 4-6, 1031-1064.
Chai, F., R. C. Dugdale, T.-H. Peng, F. P. Wilkerson, and R. T. Barber, 2002. One Dimensional Ecosystem Model of the Equatorial Pacific Upwelling System, Part I: Model Development and Silicon and Nitrogen Cycle. Deep-Sea Res. II, in press.
Conkright, T. O' Brien, M., S. Levitus, T.P. Boyer, J. Antonov, C. Stephens, 1998: World Ocean Atlas 1998 Vol. 11: Nutrients and Chlorophyll of the Pacific Ocean. NOAA Atlas NESDIS 37.U.S. Gov. Print Office, Wash., D.C., 245 pp.
Csanady, G. T., 1979. The pressure field along the western margin of the north Atlantic. J. Geosphy. Res., 84, 4905-4915.
Fox, L. E., S. L. Sager, and S. C. Wofsy, 1985. Factors controlling the concentrations of soluble phosphate in the Mississippi estuary. Limnol. Oceanogr., 30: 826-632.
Froelich, P. N., 1988. Kinetic control of dissolved phosphate in natural rivers and estuaries: A primer on the phosphate buffer mechanism. Limnol. Oceanogr., 33, 649-668.
Luo, Z.-R., Z.-H. Yin, G.-R. Yang, H.-S. Wang, X.-L. Luo, and X.-P. Tian, 1992. Harbors in southern China (in Chinese). Zhongshan Univ., Guangzhou, China.
Mellor, G. L., 1998. Users guide for a three-dimensional, primitive equation, numerical ocean model. Princeton University, 41 pp.
Mellor, G. L., and T. Yamada, 1982. Development of a turbulence closure model for geophysical fluid problems. Rev. Geophys. Space Phys., 20, 851-875.
Perry, G. D., P. B. Duffy, and N. L. Miller, 1996. An extended data set of river discharges for validation of general circulation models. J. Geophys. Res., 101, 21339-21349.
Schwiderski, E.W., 1979. Global ocean tides, II, The semidiurnal principal lunar tide (M2). Atlas of Tidal Charts and Maps. NSWC TR 79-414, Nav. Surf. Weapons Cent., Dahlgren, VA.
Schwiderski, E.W., 1981. Global ocean tides, IV, The diurnal luni-solar declination tide (K1). Atlas of Tidal Charts and Maps. NSWC TR 81-142, Nav. Surf. Weapons Cent., Dahlgren, VA.
Smolarkiewicz, P. K., 1984. A fully multidimensional positive definite advection transport algorithm with small implicit diffusion. J. Comp. Phys., 54, 325-362.
Wu, C.-Y., 1996. Possible influences of the rising sea level on the invasion of salt tide: Strategic studies (in Chinese). Zhong-Shan University, Guangzhou.
Xue, H., F. Chai, L.-A. Wong, and J.-C. Chen, 2001. Zhujiang (Pearl River) estuarine circulation model. Oceanography in China, 13, H. Xue, F. Chai, and J. Xu, Ed., China Ocean Press, 254 pp.
Zhang, J., 2000. Evidence of Trace Metal Limited Photosynthesis in Eutrophic Estuarine and Coastal Waters. Limnol. Oceanogr., 45, 1871-1878.
16 Xue and Chai
Zhang, J., Z. G. Yu, J. T., Wang, J. L. Ren, H. T. Chen, H. Xiong, L. X. Dong, and W. Y. Xu, 1999. The subtropical Zhujiang (Pearl River) estuary nutrient, trace species and their relationship to photosynthesis. Estuarine, Coastal and Shelf Sci., 49, 385-400.
Zhao, H.-T., 1990. Evolution of the Pearl River Estuary (in Chinese). China Ocean Press, 357 pp.