county of santa barbara state of california comprehensive
TRANSCRIPT
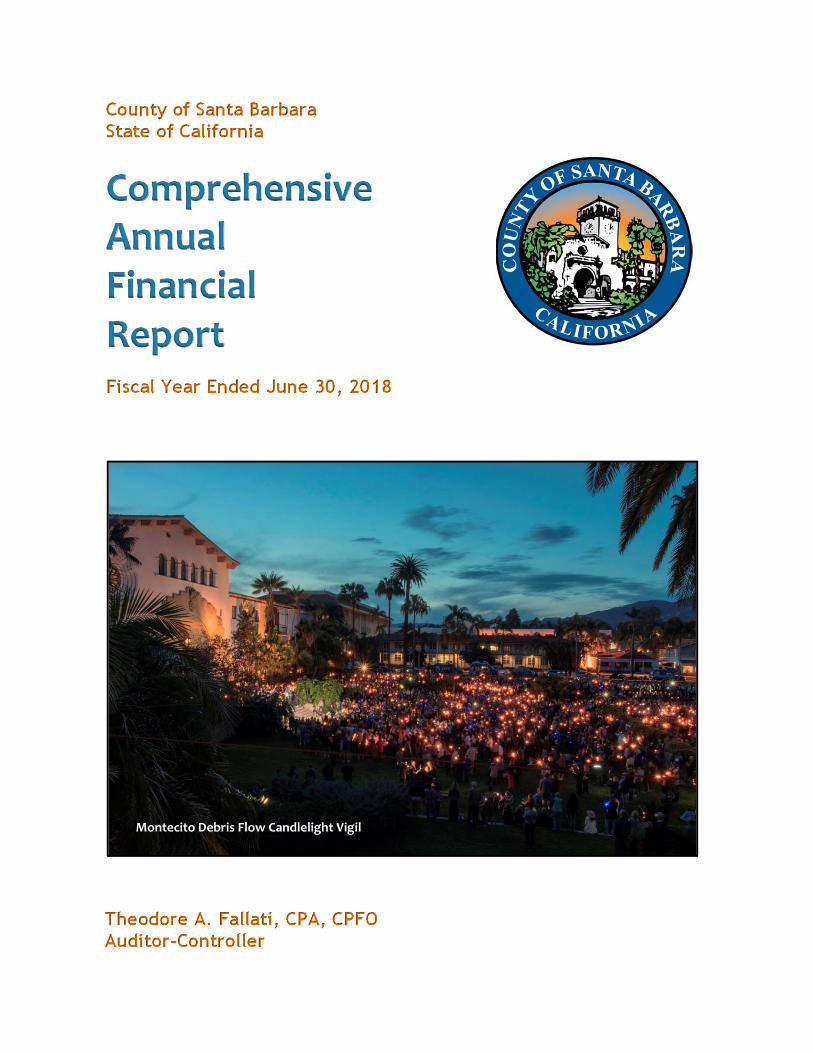
County of Santa Barbara State of California
Comprehensive Annual Financial Report
Fiscal Year Ended June 30, 2018
Theodore A. Fallati, CPA, CPFO Auditor-Controller
Montecito Debris Flow Candlelight Vigil
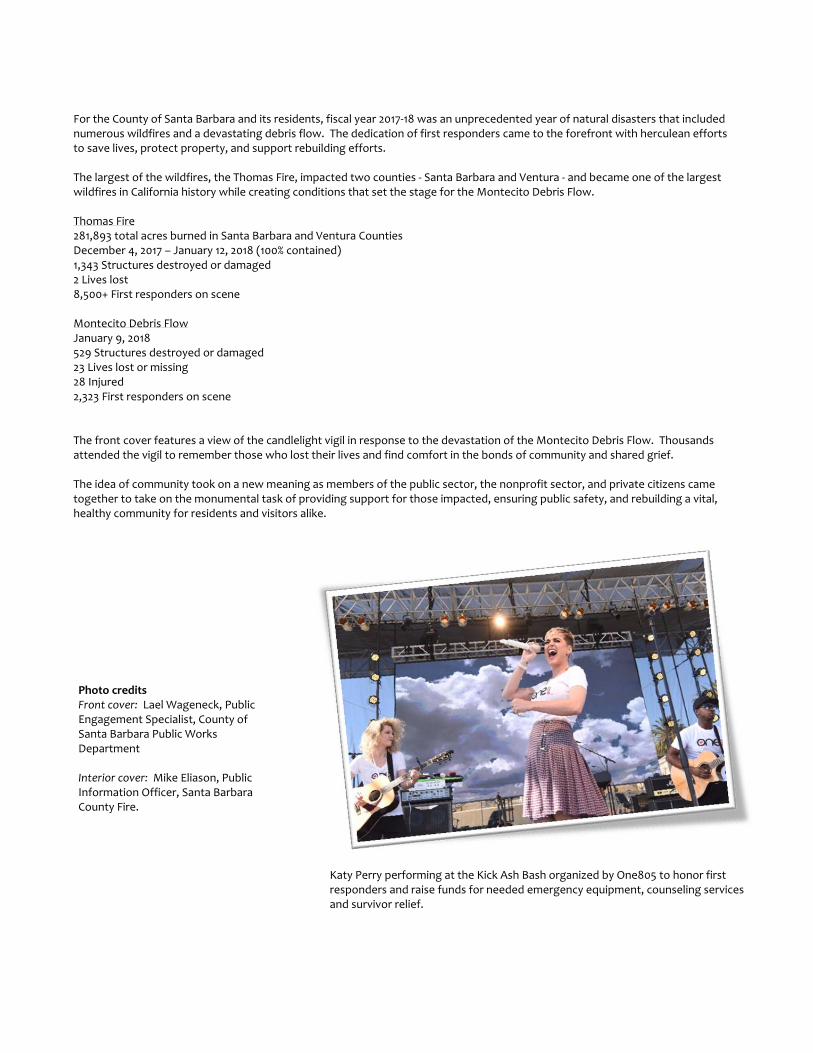
Photo credits Front cover: Lael Wageneck, Public Engagement Specialist, County of Santa Barbara Public Works Department Interior cover: Mike Eliason, Public Information Officer, Santa Barbara County Fire.
Katy Perry performing at the Kick Ash Bash organized by One805 to honor first responders and raise funds for needed emergency equipment, counseling services and survivor relief.
For the County of Santa Barbara and its residents, fiscal year 2017‐18 was an unprecedented year of natural disasters that included numerous wildfires and a devastating debris flow. The dedication of first responders came to the forefront with herculean efforts to save lives, protect property, and support rebuilding efforts. The largest of the wildfires, the Thomas Fire, impacted two counties ‐ Santa Barbara and Ventura ‐ and became one of the largest wildfires in California history while creating conditions that set the stage for the Montecito Debris Flow. Thomas Fire 281,893 total acres burned in Santa Barbara and Ventura Counties December 4, 2017 – January 12, 2018 (100% contained) 1,343 Structures destroyed or damaged 2 Lives lost 8,500+ First responders on scene Montecito Debris Flow January 9, 2018 529 Structures destroyed or damaged 23 Lives lost or missing 28 Injured 2,323 First responders on scene The front cover features a view of the candlelight vigil in response to the devastation of the Montecito Debris Flow. Thousands attended the vigil to remember those who lost their lives and find comfort in the bonds of community and shared grief. The idea of community took on a new meaning as members of the public sector, the nonprofit sector, and private citizens came together to take on the monumental task of providing support for those impacted, ensuring public safety, and rebuilding a vital, healthy community for residents and visitors alike.
County of Santa Barbara
State of California
Comprehensive Annual Financial Report
For Fiscal Year Ended June 30, 2018
Prepared Under the Supervision of Theodore A. Fallati, CPA, CPFO
Auditor-Controller

COUNTY OF SANTA BARBARA | COMPREHENSIVE ANNUAL FINANCIAL REPORT FISCAL YEAR ENDED JUNE 30, 2018
ii
TABLE OF CONTENTS
Page Table of Contents
Introductory Section
Letter of Transmittal . . . . . . . . . . . . . . . . . . . . . . . . . . . . . . . . . . . . . . . . . . . . . . . 1
Financial Section
Independent Auditor’s Report . . . . . . . . . . . . . . . . . . . . . . . . . . . . . . . . . . . . . . . . . 9 Management’s Discussion and Analysis (Unaudited) . . . . . . . . . . . . . . . . . . . . . . . . . . . . 11 Basic Financial Statements:
Governmentwide Financial Statements: Statement of Net Position . . . . . . . . . . . . . . . . . . . . . . . . . . . . . . . . . . . . . . 32 Statement of Activities . . . . . . . . . . . . . . . . . . . . . . . . . . . . . . . . . . . . . . . 33
Fund Financial Statements: Governmental Funds: Balance Sheet . . . . . . . . . . . . . . . . . . . . . . . . . . . . . . . . . . . . . . . . . . 34 Statement of Revenues, Expenditures, and Changes in Fund Balances . . . . . . . . . . . 36
Proprietary Funds: Statement of Net Position . . . . . . . . . . . . . . . . . . . . . . . . . . . . . . . . . . . 38 Statement of Revenues, Expenses, and Changes in Fund Net Position . . . . . . . . . . . 39 Statement of Cash Flows . . . . . . . . . . . . . . . . . . . . . . . . . . . . . . . . . . . . 40
Fiduciary Funds: Statement of Fiduciary Net Position . . . . . . . . . . . . . . . . . . . . . . . . . . . . . . 41 Statement of Changes in Fiduciary Net Position . . . . . . . . . . . . . . . . . . . . . . . 42
Notes to the Financial Statements . . . . . . . . . . . . . . . . . . . . . . . . . . . . . . . . . 43
Required Supplementary Information (Unaudited): Santa Barbara County Employees’ Retirement System ‐ Schedule of the County’s Proportionate Share of the Net Pension Liability . . . . . . . . . . . . . . . . . . . . . . . . . . . . . . . . . . . 112 Santa Barbara County Employees’ Retirement System – Schedule of the County’s Contributions . 112 Other Postemployment Benefits (OPEB) Plan – Schedule of Changes in the County’s Net OPEB Liability and Related Ratios . . . . . . . . . . . . . . . . . . . . . . . . . . . . . . . . . . . . . . . 113 Governmental Funds – General and Major Special Revenue: Schedule of Revenues, Expenditures, and Changes in Fund Balances ‐ Budget and Actual: General Fund . . . . . . . . . . . . . . . . . . . . . . . . . . . . . . . . . . . . . . . . . . 117 Roads Special Revenue Fund . . . . . . . . . . . . . . . . . . . . . . . . . . . . . . . . . . 118 Public Health Special Revenue Fund . . . . . . . . . . . . . . . . . . . . . . . . . . . . . . 119 Social Services Special Revenue Fund . . . . . . . . . . . . . . . . . . . . . . . . . . . . . 120 Behavioral Wellness Special Revenue Fund . . . . . . . . . . . . . . . . . . . . . . . . . . 121 Flood Control District Special Revenue Fund . . . . . . . . . . . . . . . . . . . . . . . . . 122 Affordable Housing Special Revenue Fund . . . . . . . . . . . . . . . . . . . . . . . . . . 123 Fire Protection District Special Revenue Fund . . . . . . . . . . . . . . . . . . . . . . . . . 124 Notes to Required Supplementary Information . . . . . . . . . . . . . . . . . . . . . . . . . . . . 125 Other Supplementary Information (Unaudited):
Other Major Governmental Fund: Schedule of Revenues, Expenditures, and Changes in Fund Balances ‐ Budget and Actual: Capital Projects Fund . . . . . . . . . . . . . . . . . . . . . . . . . . . . . . . . . . . . . . 130

COUNTY OF SANTA BARBARA | COMPREHENSIVE ANNUAL FINANCIAL REPORT FISCAL YEAR ENDED JUNE 30, 2018
iii
TABLE OF CONTENTS
Nonmajor Governmental Funds: Narrative Summary . . . . . . . . . . . . . . . . . . . . . . . . . . . . . . . . . . . . . . . . . 132 Combining Balance Sheet . . . . . . . . . . . . . . . . . . . . . . . . . . . . . . . . . . . . . . 136 Combining Statement of Revenues, Expenditures, and Changes in Fund Balances . . . . . . 140 Schedules of Revenues, Expenditures, and Changes in Fund Balances ‐ Budget and Actual . . 144
Internal Service Funds: Narrative Summary . . . . . . . . . . . . . . . . . . . . . . . . . . . . . . . . . . . . . . . . 164 Combining Statement of Net Position . . . . . . . . . . . . . . . . . . . . . . . . . . . . . . 166 Combining Statement of Revenues, Expenses, and Changes in Fund Net Position . . . . . . . 167 Combining Statement of Cash Flows . . . . . . . . . . . . . . . . . . . . . . . . . . . . . . . 168
Agency Funds: Narrative Summary . . . . . . . . . . . . . . . . . . . . . . . . . . . . . . . . . . . . . . . . . 170 Combining Statement of Changes in Assets and Liabilities . . . . . . . . . . . . . . . . . . . . 171 Statistical Section (Unaudited)
Narrative Summary . . . . . . . . . . . . . . . . . . . . . . . . . . . . . . . . . . . . . . . . . . . . . . 173
Financial Trends: Net Position by Category . . . . . . . . . . . . . . . . . . . . . . . . . . . . . . . . . . . . . . . . . 174 Changes in Net Position . . . . . . . . . . . . . . . . . . . . . . . . . . . . . . . . . . . . . . . . . 175 Fund Balances, Governmental Funds . . . . . . . . . . . . . . . . . . . . . . . . . . . . . . . . . . 176 Changes in Fund Balances, Governmental Funds . . . . . . . . . . . . . . . . . . . . . . . . . . . . 177
Revenue Capacity: Assessed Value of Taxable Property and Actual Value of Property . . . . . . . . . . . . . . . . . . 178 Property Tax Rates ‐ Direct and Overlapping Governments . . . . . . . . . . . . . . . . . . . . . . 179 Principal Property Taxpayers . . . . . . . . . . . . . . . . . . . . . . . . . . . . . . . . . . . . . . 180 Property Tax Levies and Collections . . . . . . . . . . . . . . . . . . . . . . . . . . . . . . . . . . . 181
Debt Capacity: Ratios of Outstanding Debt by Type . . . . . . . . . . . . . . . . . . . . . . . . . . . . . . . . . . . 182 Computation of Legal Debt Margin . . . . . . . . . . . . . . . . . . . . . . . . . . . . . . . . . . . 183 Direct and Overlapping Bonded Debt . . . . . . . . . . . . . . . . . . . . . . . . . . . . . . . . . 184
Demographic and Economic Information: Demographics and Economic Statistics . . . . . . . . . . . . . . . . . . . . . . . . . . . . . . . . . 185 Principal Employers . . . . . . . . . . . . . . . . . . . . . . . . . . . . . . . . . . . . . . . . . . . 186
Operating Information: County Employees by Function/Program . . . . . . . . . . . . . . . . . . . . . . . . . . . . . . . . 187 Operating Indicators by Function/Program . . . . . . . . . . . . . . . . . . . . . . . . . . . . . . 188 Capital Assets and Infrastructure Statistics by Function/Program . . . . . . . . . . . . . . . . . . 189
Glossary
Glossary . . . . . . . . . . . . . . . . . . . . . . . . . . . . . . . . . . . . . . . . . . . . . . . . . . . . 191


Intro
ducto
ry S
ectio
n
Introductory Section

LETTER OF TRANSMITTAL
August 28, 2018 To the Citizens of Santa Barbara County: The Comprehensive Annual Financial Report (CAFR) of the County of Santa Barbara (County) for the fiscal year ended June 30, 2018, is hereby submitted in compliance with Sections 25250 and 25253 of the Government Code of the State of California. Management assumes full responsibility for the completeness and reliability of the information contained in this report, based upon a comprehensive internal control framework it established for this purpose. Because the cost of internal controls should not exceed anticipated benefits, the objective is to provide reasonable, rather than absolute, assurance that the financial statements are free of any material misstatements. The independent auditor’s report is located at the front of the financial section of this report. Brown Armstrong Accountancy Corporation has issued an unmodified (“clean”) opinion on the County’s financial statements for the year ended June 30, 2018. Management’s discussion and analysis (MD&A) immediately follows the independent auditor’s report and provides a narrative introduction, overview, and analysis of the financial statements. MD&A complements this letter of transmittal and should be read in conjunction with it.
Profile of the Government
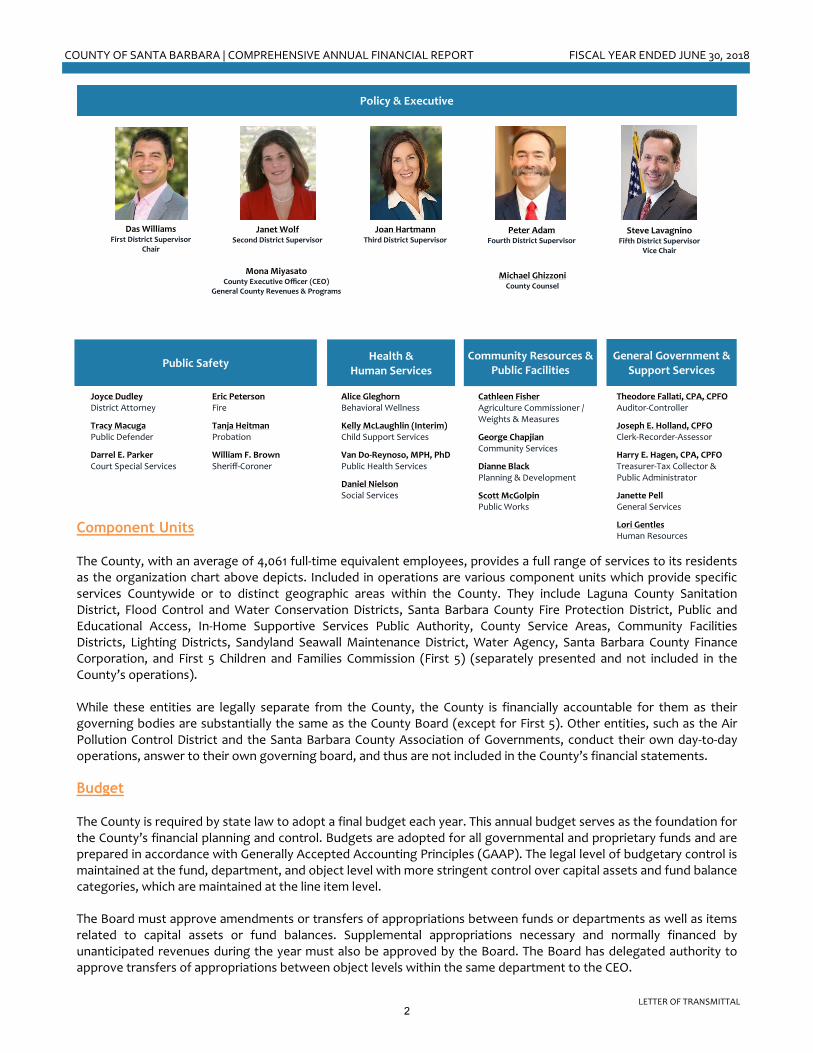
Policymaking and legislative authority is vested in the County Board of Supervisors (Board), which consists of an elected supervisor from each of the five districts. The Board is responsible for, among other things, passing ordinances, adopting budgets and appointing committees, the County Executive Officer (CEO), and non-elected department directors. Supervisors are elected to four-year staggered terms with two supervisors elected in even-years and three supervisors elected in odd-years. The County has five elected department directors responsible for the offices of the Clerk-Recorder-Assessor, Auditor-Controller, District Attorney, Sheriff-Coroner, and Treasurer-Tax Collector-Public Administrator. The following organization chart reflects the various functional categories reported in the governmentwide Statement of Activities as well as identifies principal officials.
Geography and Industry The County, located approximately 100 miles north of Los Angeles and 300 miles south of San Francisco, was established by an act of the State Legislature on February 18, 1850. It occupies 2,737 square miles, one-third of which is located in the Los Padres National Forest, and has a population of 453,457. Eight incorporated cities are within the County: Santa Barbara, Santa Maria, Lompoc, Goleta, Carpinteria, Guadalupe, Solvang, and Buellton. The largest employment categories include services, wholesale and retail trade, public administration, and manufacturing. The mild climate, picturesque coastline, scenic mountains, and numerous parks and beaches make the County a popular tourist and recreational area.
COUNTY OF SANTA BARBARA
Theodore Fallati, CPA Auditor-Controller
Betsy Schaffer, CPA
Assistant Auditor-Controller
County Administration Building 105 E. Anapamu Street, Rm. 303
Santa Barbara, CA 93101 (805) 568-2100
Mailing Address:
P.O. Box 39 Santa Barbara, CA 93102-0039
Fax: (805) 568-2016
1
COUNTY OF SANTA BARBARA | COMPREHENSIVE ANNUAL FINANCIAL REPORT FISCAL YEAR ENDED JUNE 30, 2018
LETTER OF TRANSMITTAL
Component Units The County, with an average of 4,061 full-time equivalent employees, provides a full range of services to its residents as the organization chart above depicts. Included in operations are various component units which provide specific services Countywide or to distinct geographic areas within the County. They include Laguna County Sanitation District, Flood Control and Water Conservation Districts, Santa Barbara County Fire Protection District, Public and Educational Access, In-Home Supportive Services Public Authority, County Service Areas, Community Facilities Districts, Lighting Districts, Sandyland Seawall Maintenance District, Water Agency, Santa Barbara County Finance Corporation, and First 5 Children and Families Commission (First 5) (separately presented and not included in the County’s operations). While these entities are legally separate from the County, the County is financially accountable for them as their governing bodies are substantially the same as the County Board (except for First 5). Other entities, such as the Air Pollution Control District and the Santa Barbara County Association of Governments, conduct their own day-to-day operations, answer to their own governing board, and thus are not included in the County’s financial statements. Budget The County is required by state law to adopt a final budget each year. This annual budget serves as the foundation for the County’s financial planning and control. Budgets are adopted for all governmental and proprietary funds and are prepared in accordance with Generally Accepted Accounting Principles (GAAP). The legal level of budgetary control is maintained at the fund, department, and object level with more stringent control over capital assets and fund balance categories, which are maintained at the line item level.
The Board must approve amendments or transfers of appropriations between funds or departments as well as items related to capital assets or fund balances. Supplemental appropriations necessary and normally financed by unanticipated revenues during the year must also be approved by the Board. The Board has delegated authority to approve transfers of appropriations between object levels within the same department to the CEO.
Steve Lavagnino
Fifth District Supervisor Vice Chair
Policy & Executive
Public Safety General Government &
Support Services Community Resources &
Public Facilities
Joan Hartmann Third District Supervisor
Mona Miyasato County Executive Officer (CEO)
General County Revenues & Programs
Peter Adam Fourth District Supervisor
Janet Wolf Second District Supervisor
Michael Ghizzoni County Counsel
Health & Human Services
Joyce Dudley District Attorney
Tracy Macuga Public Defender
Darrel E. Parker Court Special Services
Eric Peterson Fire
Tanja Heitman Probation
William F. Brown Sheriff-Coroner
Theodore Fallati, CPA, CPFO Auditor-Controller
Joseph E. Holland, CPFO Clerk-Recorder-Assessor
Harry E. Hagen, CPA, CPFO Treasurer-Tax Collector & Public Administrator
Janette Pell General Services
Lori Gentles Human Resources
Cathleen Fisher Agriculture Commissioner / Weights & Measures
George Chapjian Community Services
Dianne Black Planning & Development
Scott McGolpin Public Works
Alice Gleghorn Behavioral Wellness
Kelly McLaughlin (Interim) Child Support Services
Van Do-Reynoso, MPH, PhD Public Health Services
Daniel Nielson Social Services
Das Williams First District Supervisor
Chair
2
COUNTY OF SANTA BARBARA | COMPREHENSIVE ANNUAL FINANCIAL REPORT FISCAL YEAR ENDED JUNE 30, 2018
LETTER OF TRANSMITTAL
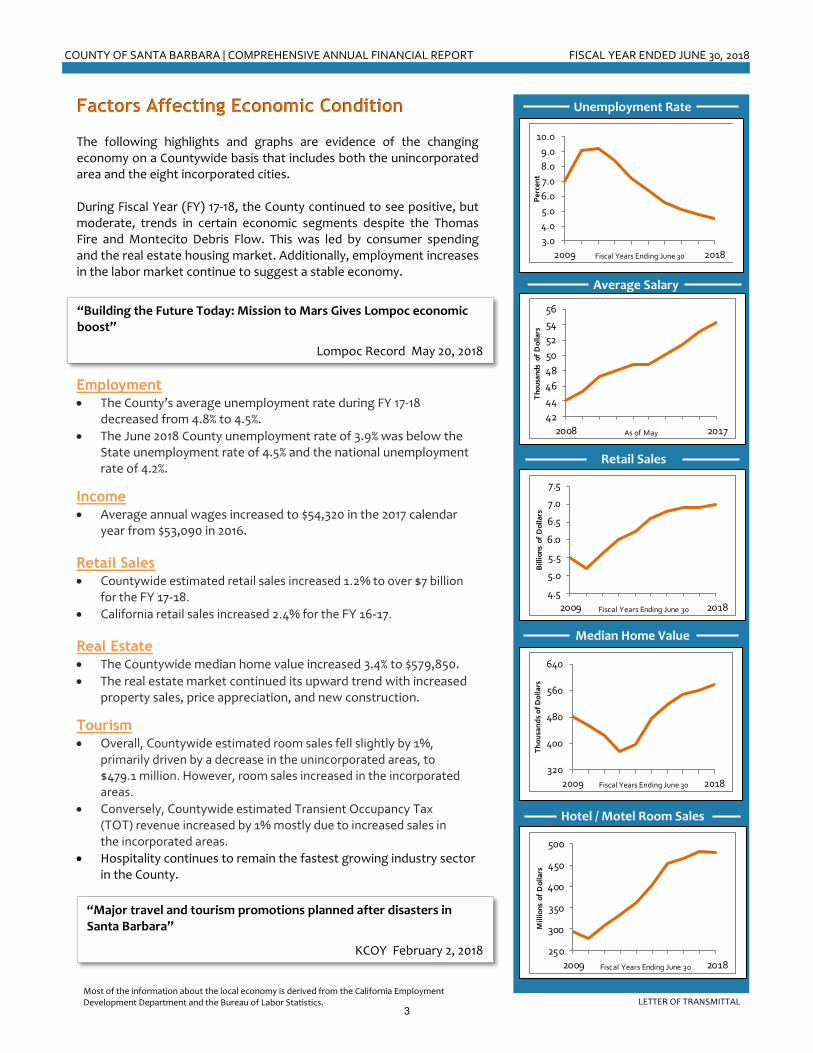
Factors Affecting Economic Condition The following highlights and graphs are evidence of the changing economy on a Countywide basis that includes both the unincorporated area and the eight incorporated cities. During Fiscal Year (FY) 17-18, the County continued to see positive, but moderate, trends in certain economic segments despite the Thomas Fire and Montecito Debris Flow. This was led by consumer spending and the real estate housing market. Additionally, employment increases in the labor market continue to suggest a stable economy.
Employment
The County’s average unemployment rate during FY 17-18 decreased from 4.8% to 4.5%.
The June 2018 County unemployment rate of 3.9% was below the State unemployment rate of 4.5% and the national unemployment rate of 4.2%.
Income
Average annual wages increased to $54,320 in the 2017 calendar year from $53,090 in 2016.
Retail Sales
Countywide estimated retail sales increased 1.2% to over $7 billion for the FY 17-18.
California retail sales increased 2.4% for the FY 16-17. Real Estate
The Countywide median home value increased 3.4% to $579,850.
The real estate market continued its upward trend with increased property sales, price appreciation, and new construction.
Tourism
Overall, Countywide estimated room sales fell slightly by 1%, primarily driven by a decrease in the unincorporated areas, to $479.1 million. However, room sales increased in the incorporated areas.
Conversely, Countywide estimated Transient Occupancy Tax (TOT) revenue increased by 1% mostly due to increased sales in the incorporated areas.
Hospitality continues to remain the fastest growing industry sector in the County.
Unemployment Rate
Average Salary
Retail Sales
Hotel / Motel Room Sales
Median Home Value
3.0
4.0
5.0
6.0
7.0
8.0
9.0
10.0
2009 2018
Pe
rce
nt
Fiscal Years Ending June 30
4.5
5.0
5.5
6.0
6.5
7.0
7.5
2009 2018
Bil
lio
ns
of
Do
lla
rs
Fiscal Years Ending June 30
320
400
480
560
640
2009 2018
Th
ou
san
ds
of
Do
llars
Fiscal Years Ending June 30
250
300
350
400
450
500
2009 2018
Mill
ions
of
Dol
lars
Fiscal Years Ending June 30
42
44
46
48
50
52
54
56
2008 2017
Th
ou
san
ds
of
Do
llars
As of May
“Building the Future Today: Mission to Mars Gives Lompoc economic boost”
Lompoc Record May 20, 2018
“Major travel and tourism promotions planned after disasters in Santa Barbara”
KCOY February 2, 2018
Most of the information about the local economy is derived from the California Employment Development Department and the Bureau of Labor Statistics.
3

COUNTY OF SANTA BARBARA | COMPREHENSIVE ANNUAL FINANCIAL REPORT FISCAL YEAR ENDED JUNE 30, 2018
LETTER OF TRANSMITTAL
Economic Indicators
According to the California Fiscal Outlook, the forecast anticipates a continuing of the expansion in the U.S. economy, but with anticipated stock market weakness. In California, the economy in 2018 is expected to have slower job growth and a tight labor market with relatively low unemployment rates. At the local level, the 2018 University of California Economic Forecast Project reported that the most recent data show a significant decline in real gross domestic product, increased payrolls, climbing real per capita income, and moderate housing price increases in Santa Barbara County. Overall, economic indicators at the national, state and local levels show that the economy continued to improve slowly but steadily on most measures in FY 17-18.
Financial Indicators
County tax revenues experienced moderate growth due to increased assessments, new development, and prior year billings. Property tax is the County’s largest source of discretionary revenue. Certain leading indicators of future property tax growth are property transfer tax and supplemental property tax. Property transfer tax increased in FY 17-18 by 11%, suggesting continued property tax growth in future years. Supplemental property tax decreased $509 or 10.6% in FY 17-18; however, most of the decrease was due to the clearing of backlogged property tax transactions in the prior year and thus may not be a good indicator this year. The secured property tax growth rate for FY 17-18 was 4.2% and for FY 18-19 is estimated at 5%. With property taxes overall showing positive growth, the County general discretionary revenues are estimated to grow in the 3% to 5% range. Countywide estimated total Transient Occupancy Tax (TOT) revenues increased by 1% mostly due to increased sales in the incorporated area and due to the TOT rate change from 10% t0 12% in the unincorporated areas in FY 16-17. However, TOT decreased 17% in the unincorporated area of the County due to the impacts from the Thomas Fire and Montecito Debris Flow, while incorporated areas increased by 1% due in part to the displacement of residents to hotels in incorporated areas. Countywide estimated retail sales increased modestly by 1.2%, while retail sales decreased by 2.6% in the city of Santa Barbara. This decrease was offset by an increase of 4.4% in Santa Maria. Statewide sales tax for Proposition 172 public safety, a ½ cent tax, increased 4.8% to $36.4 million. The County also had improvements in program revenues with increases in charges for services of 2.5%, operating grants and contributions of 6.2%, and general revenues of 5% despite the Thomas Fire and Montecito Debris Flow. On the expenditure side, the largest category of expenditures as a service organization is County salaries and benefits, which increased by $48 million, or 8.9%, to $588.3 million. This represents 63.5% of total County governmental fund expenditures. The majority of the increase is due to increased regular salaries and increased overtime costs related to the Thomas Fire and Montecito Debris Flow. Service and Supplies expenditures increased by $17.2 million, or 10.2%, to $186 million. The majority of this increase is due to increased maintenance and cleanout of debris basins and spillways, creek and channel clearing services, and mutual aid claims from assisting agencies. These expenditures were mostly due to the Thomas Fire and Montecito Debris Flow. Total service and supply expenditures related to the Thomas Fire and Montecito Debris Flow totaled $17.5 million in FY 17-18.
Major Initiatives
During the last fiscal year, under the leadership of the Board, many outstanding key programs, projects and initiatives were successfully undertaken by the County that:
Coordinated with over 40 different public safety organizations to respond to the Thomas Fire and subsequent Montecito Debris Flow. Following these horrific events, the County committed its focus to the recovery, rebuilding and future safety of the communities impacted. This included establishing the Montecito Center for Preparedness, Recovery and Rebuilding to serve as a central source of support, information and resources for residents, businesses, employees and the communities affected.
4

COUNTY OF SANTA BARBARA | COMPREHENSIVE ANNUAL FINANCIAL REPORT FISCAL YEAR ENDED JUNE 30, 2018
LETTER OF TRANSMITTAL
Launched the County’s Renew ’22 initiative to examine County processes and procedures to improve methods of delivering quality services, and redesign how work is accomplished. As part of the FY 18-19 budget process and hearings, the Board considered short and long term plans, proposals and next steps. Many Renew ’22 initiatives are in various stages and have the potential to transform County government.
Implemented a comprehensive program for regulating and licensing commercial cannabis operations in the unincorporated areas of the County, and received voter approval in the June 2018 Primary Election to tax commercial cannabis activities to generate revenue available for any governmental purposes.
Continued to support local efforts to provide the community with cost-effective renewable energy options by directing staff to further explore the possibilities of forming a new Community Choice Energy (CCE) program or joining existing CCE programs. CCE enables local governments to leverage the purchasing power of their residents, businesses and governmental entities to buy or generate power for their communities.
Implemented paperless initiatives throughout County departments to improve efficiency and customer service while being good stewards of the environment. Child Support Services switched to electronic filing for its volume of more than 1,000 court document every month, cutting in half the amount of time spent processing each document and freeing up staff to fulfill other customer services. Social Services stopped accepting cash payments, instead relying on fully insured, vendor-serviced payment kiosks which increased monthly collections significantly. Various other departments have or are implementing similar paperless initiatives.
Implemented a new Whistleblower Hotline overseen by the Internal Audit Division of the Auditor-Controller’s Office to encourage employees to report any suspected cases of fraud, waste, or abuse of which they become aware. The Whistleblower Hotline provides an alternative reporting mechanism to ensure concerns are properly addressed and as a means for anonymous, confidential reporting.
Completed various public infrastructure projects, including the construction of the new Goleta Beach Park Bridge. The new bridge includes a sidewalk and railings to make the bridge safer for pedestrians and cyclists by separating them from vehicular traffic. The project cost of $4.86 million was 100 percent underwritten with state and federal transportation funding.
Completed the implementation of a new computer system used by the Assessor, Tax Collector, and Auditor-Controller to administer nearly $1 billion in countywide property taxes collected and distributed to schools, cities, special districts and the County.
Continued construction of the new $111 million Northern Branch Jail located outside the Santa Maria city limits. With 376 beds, the new jail will provide inmate housing, medical and mental health treatment, and a program space. The facility is expected to open in the summer of 2019.
Approved the redesign and construction of the Tajiguas Resource Recovery Project. The new facilities will sort recyclables and organic materials that are converted into compost and bio-gas to generate electricity. The project will reduce greenhouse gas emissions equivalent of removing 22 thousand vehicles off of our roads annually. Construction of the project will begin in early 2019.
Maintained organizational stability, customer service levels, and program efficiencies during the leadership changeover of the Chief Probation Officer, the Director of Public Health, the Director of Planning and Development, and the Director of Child Support Services.
5
COUNTY OF SANTA BARBARA | COMPREHENSIVE ANNUAL FINANCIAL REPORT FISCAL YEAR ENDED JUNE 30, 2018
LETTER OF TRANSMITTAL
Significant Capital Projects and Operating Impacts
The County completed $20,448 million in capital projects in the current year, and has approved $106.9 million in capital and capital maintenance projects, equipment, software, and information systems projects for FY 18-19, as described in Section E “Capital Budget Summary” of the County’s Proposed Operating Budget (available at http://countyofsb.org/budgetbook/2018). The largest of the ongoing projects is the Northern Branch Jail.
Long-term Financial Planning
The budget is projecting modest growth in County revenues. For budget year FY 18-19, local property, retail sales and transient occupancy taxes are estimated to grow in the 3% to 5% range. The County had committed to building and maintaining a strategic reserve equal to 8% of annual General Fund revenues, or approximately 30 days working capital. As a result of the economic impacts of the Thomas Fire and Montecito Debris Flow, the balance decreased to $23.717 million at the end of FY 17-18. The FY 18-19 budget appropriated additional funds of $5.9 million to add to the reserve in the next fiscal year. The County is also addressing capital needs by continuing to incorporate a policy which earmarks 18% of available discretionary General Fund revenue growth for deferred maintenance. The County’s Five-Year Capital Improvement Plan (CIP) identifies capital needs as well as funding sources and funding shortfalls. For FY 18-19, the CIP includes $106.9 million of funding for planned projects that are included in the budget. FY 18-19 significant projects include:
$35.8 million for the Northern Branch Jail (total estimated project cost of $111 million).
$21.9 for upgrades, improvement, and expansion of the Laguna County Sanitation District (total estimated project cost of $63 million).
$4.4 million for flood channel improvements in North and South County (total estimated project cost of $157 million).
A significant project expected to begin in FY 18-19, but not included in the Recommended Budget due to pending debt financing, is the Tajiguas Resource Recovery Project, which is estimated at $142.7 million.
6

COUNTY OF SANTA BARBARA | COMPREHENSIVE ANNUAL FINANCIAL REPORT FISCAL YEAR ENDED JUNE 30, 2018
LETTER OF TRANSMITTAL
Relevant Financial Policies
The County benchmarks its financial policies to a set of Best Financial Management Practices for Governmental Issuers of Municipal Debt published by Fitch Ratings.
Fund Balance Reserve
The County is committed to building a strategic reserve as discussed previously in Long-Term Financial Planning.
Multiyear Financial Forecasting
The County prepares a five-year financial forecast annually focusing on discretionary revenues and their uses to aid in current year decisions.
Quarterly Financial Reporting and Monitoring
The CEO and Budget Director chair quarterly review each department’s year-to-date actual and projected revenues and expenditures. These meetings also focus on their operations and performance measures.
Contingency Planning
The County does not have a formal contingency policy and maintains only a small operating contingency of less than 1% in the General Fund. However, the County has established a strategic reserve policy, and is in the process of building a strategic reserve that will equal 8% of annual General Fund revenues (approximately 30 days working capital). The County also has other significant fund balances in its special revenue funds. The most noteworthy is the Flood Control District fund balance used to hedge against storm related disasters.
Nonrecurring Revenue
One of the principal budget tenets is that nonrecurring revenue should be used for one-time needs and that ongoing expenditures should have identified ongoing sources. Additionally, the County’s General Fund Allocation Policy states that “Requests for additional FTE’s … will identify the ongoing funding source.”
Financial Reporting Awards
The Government Finance Officers Association (GFOA) has awarded the Certificate of Achievement for Excellence in Financial Reporting to the County for its CAFR annually since 1991, and the Certificate of Achievement in Popular Annual Financial Reporting for the Financial Highlights annually since 1995.
Debt Affordability
The County established a Debt Advisory Committee (DAC) to provide advice to the Board on debt issuance and management. The DAC looks at repayment sources as one of the key criteria for approval of new debt issues. In addition, all long-term equipment or real property leases are reviewed for lease vs. purchase decisions.
Superior Debt Disclosure Practices
The County maintains a complex set of debt disclosures in the County’s Recommended Budget and the CAFR statistical section. We believe that time is of the essence in the publication of these documents. The budget is adopted before June 30 and loaded into the financial system before the close of the first month of the new fiscal year. The CAFR publication date is generally within 45-60 days of the close of the fiscal year. The County’s major financial documents are available on the web at www.countyofsb.org.
Capital and Maintenance Funding
The County has an informal pay-as-you-go policy for funding capital. However, many of the County’s funds only utilize pay-as-you-go financing. Beginning with the 2015-16 fiscal year, the Board established a budget policy to set aside 18% of general revenue growth to address aging infrastructure and facilities.
Debt Repayment Plan
The County’s current outstanding debt schedule features a debt repayment plan that will reduce debt by 69.2% over the next ten years.
Five-Year Capital Improvement Program
The County’s Five-Year Capital Improvement Program provides for an integration of capital projects and operating impacts in the recommended operating budget for each budget cycle.
Budgeting Awards
The GFOA has presented the Distinguished Budget Presentation Award to the County annually since 1998.
7

COUNTY OF SANTA BARBARA | COMPREHENSIVE ANNUAL FINANCIAL REPORT FISCAL YEAR ENDED JUNE 30, 2018
LETTER OF TRANSMITTAL
Awards and Acknowledgments
We are very proud of this CAFR and all of the County’s award-winning financial reporting publications. Each publication has been prepared with great care and expertise with a goal of meeting the highest level of financial reporting preparation standards.
GFOA Financial Reporting Certificate of Achievement
The GFOA awarded a Certificate of Achievement for Excellence in Financial Reporting to the County’s CAFR for the fiscal year ended June 30, 2017. This award has been achieved annually since 1991. To receive this prestigious award, a government must publish an easily readable and efficiently organized CAFR that satisfied both generally accepted accounting principles (GAAP) and applicable legal requirements. A Certificate of Achievement is valid for a period of one year only. We believe our current CAFR continues to meet the Certificate of Achievement Program’s requirements and we are submitting it to the GFOA to determine its eligibility for another certificate.
GFOA Budget Presentation Award
The County received the GFOA’s Distinguished Budget Presentation Award for its annual budget document for the fiscal year beginning July 1, 2017. This award has been achieved annually since 1998. To receive this prestigious award, a governmental unit must publish a budget document that meets program criteria as a policy document, as an operations guide, as a financial plan, and as a communications device.
GFOA Popular Annual Financial Reporting Award The County received the GFOA’s Award for Outstanding Achievement in Popular Annual Financial Reporting for its Financial Highlights publication for the fiscal year ended June 30, 2017. This award has been achieved annually since 1995. To receive this prestigious award, a government must publish a Popular Annual Financial Report that conforms to program standards of creativity, presentation, understandability, and reader appeal.
Acknowledgments The preparation of the CAFR and its timely issuance is the result of a concentrated, dedicated, and coordinated effort by the entire Auditor-Controller staff. We would like to acknowledge the special efforts of the Financial Reporting Division for their assistance in the report’s preparation. We would also like to thank all County departments who participated in its preparation.
Respectfully submitted,
Mona Miyasato
County Executive Officer
Theodore A. Fallati, CPA, CPFO Auditor-Controller
8

Fin
ancia
l Sectio
n
Financial Section


9
INDEPENDENT AUDITOR’S REPORT
To the Honorable Board of Supervisors County of Santa Barbara, California Report on the Financial Statements We have audited the accompanying financial statements of the governmental activities, the business-type activities, the aggregate discretely presented component unit, each major fund, and the aggregate remaining fund information of the County of Santa Barbara, California (the County) as of and for the year ended June 30, 2018, and the related notes to the financial statements, which collectively comprise the County of Santa Barbara’s basic financial statements as listed in the table of contents. Management’s Responsibility for the Financial Statements Management is responsible for the preparation and fair presentation of these financial statements in accordance with accounting principles generally accepted in the United States of America; this includes the design, implementation, and maintenance of internal control relevant to the preparation and fair presentation of financial statements that are free from material misstatement, whether due to fraud or error. Auditor’s Responsibility Our responsibility is to express opinions on these financial statements based on our audit. We conducted our audit in accordance with auditing standards generally accepted in the United States of America and the standards applicable to financial audits contained in Government Auditing Standards, issued by the Comptroller General of the United States. Those standards require that we plan and perform the audit to obtain reasonable assurance about whether the financial statements are free from material misstatement. An audit involves performing procedures to obtain audit evidence about the amounts and disclosures in the financial statements. The procedures selected depend on the auditor’s judgment, including the assessment of the risks of material misstatement of the financial statements, whether due to fraud or error. In making those risk assessments, the auditor considers internal control relevant to the County’s preparation and fair presentation of the financial statements in order to design audit procedures that are appropriate in the circumstances, but not for the purpose of expressing an opinion on the effectiveness of the County’s internal control. Accordingly, we express no such opinion. An audit also includes evaluating the appropriateness of accounting policies used and the reasonableness of significant accounting estimates made by management, as well as evaluating the overall presentation of the financial statements. We believe that the audit evidence we have obtained is sufficient and appropriate to provide a basis for our audit opinions. Opinions In our opinion, the financial statements referred to above present fairly, in all material respects, the respective financial position of the governmental activities, the business-type activities, the aggregate discretely presented component unit, each major fund, and the aggregate remaining fund information of the County as of June 30, 2018, and the respective changes in financial position, and, where applicable, cash flows thereof for the year then ended in accordance with accounting principles generally accepted in the United States of America.

10
Other Matters Required Supplementary Information Accounting principles generally accepted in the United States of America require that the Management’s Discussion and Analysis on pages 11-29, the Santa Barbara County Employees’ Retirement System Schedule of the County’s Proportionate Share of the Net Pension Liability on page 112, the Santa Barbara County Employees’ Retirement System Schedule of the County’s Contributions on page 112, Other Postemployment Benefits (OPEB) Plan Schedule of Changes in the County’s Net OPEB Liability and Related Ratios on page 113, and the respective budgetary comparison for the General and Major Special Revenue Funds on pages 117-125 be presented to supplement the basic financial statements. Such information, although not a part of the basic financial statements, is required by the Governmental Accounting Standards Board (GASB), who considers it to be an essential part of financial reporting for placing the basic financial statements in an appropriate operational, economic, or historical context. We have applied certain limited procedures to the required supplementary information in accordance with auditing standards generally accepted in the United States of America, which consisted of inquiries of management about the methods of preparing the information and comparing the information for consistency with management’s responses to our inquiries, the basic financial statements, and other knowledge we obtained during our audit of the basic financial statements. We do not express an opinion or provide any assurance on the information because the limited procedures do not provide us with sufficient evidence to express an opinion or provide any assurance. Other Information Our audit was conducted for the purpose of forming opinions on the financial statements that collectively comprise the County’s basic financial statements. The introductory section, combining and individual nonmajor fund financial statements and schedules, budgetary comparison for the Capital Projects Fund, and statistical section, are presented for purposes of additional analysis and are not a required part of the basic financial statements. The Combining and Individual Nonmajor Fund Financial Statements and schedules and the budgetary comparison for the Capital Projects Fund are the responsibility of management and were derived from and relate directly to the underlying accounting and other records used to prepare the basic financial statements. Such information has been subjected to the auditing procedures applied in the audit of the basic financial statements and certain additional procedures, including comparing and reconciling such information directly to the underlying accounting and other records used to prepare the basic financial statements or to the basic financial statements themselves, and other additional procedures in accordance with auditing standards generally accepted in the United States of America. In our opinion, the combining and individual nonmajor fund financial statements and schedules and the budgetary comparison for the Capital Projects Fund are fairly stated in all material respects in relation to the basic financial statements as a whole. The introductory and statistical sections have not been subjected to the auditing procedures applied in the audit of the basic financial statements and, accordingly, we do not express an opinion or provide any assurance on them. Implementation of New Accounting Standards As disclosed in the Note 1 of the financial statements, the County implemented GASB Statement No. 75, Accounting and Financial Reporting for Postemployment Benefits Other than Pensions, during fiscal year 2018. Our opinion is not modified with respect to this matter. Other Reporting Required by Government Auditing Standards In accordance with Government Auditing Standards, we have also issued our report dated August 28, 2018, on our consideration of the County’s internal control over financial reporting and on our tests of its compliance with certain provisions of laws, regulations, contracts, and grant agreements and other matters. The purpose of that report is solely to describe the scope of our testing of internal control over financial reporting and compliance and the results of that testing, and not to provide an opinion on the effectiveness of the County’s internal control over financial reporting or on compliance. That report is an integral part of an audit performed in accordance with Government Auditing Standards in considering the County’s internal control over financial reporting and compliance. BROWN ARMSTRONG ACCOUNTANCY CORPORATION Bakersfield, California August 28, 2018

COUNTY OF SANTA BARBARA | COMPREHENSIVE ANNUAL FINANCIAL REPORT FISCAL YEAR ENDED JUNE 30, 2018
MANAGEMENT’S DISCUSSION & ANALYSIS UNAUDITED AND IN THOUSANDS
Table of Contents – Management’s Discussion and Analysis
Financial Highlights 12 Governmentwide Financial Analysis 12 Financial Analysis of the County’s Funds 12
Description of the Basic Financial Statements 12 Governmentwide Financial Statements 13 Fund Financial Statements 14 Notes to the Financial Statements 15 Appropriated Funds 16
Governmentwide Financial Analysis 17 Analysis of Net Position 17 Analysis of Governmental Activities 19 Analysis of Business-type Activities 22
Financial Analysis of the County’s Fund Balances 22 Governmental Funds 22 Proprietary Funds 25
Capital Assets & Debt 25 Capital Assets 25 Debt 26
General Fund Budgetary Highlights 27 Economic Factors and Next Year’s Budget and Rates 28 Requests for Information 29
11

COUNTY OF SANTA BARBARA | COMPREHENSIVE ANNUAL FINANCIAL REPORT FISCAL YEAR ENDED JUNE 30, 2018
MANAGEMENT’S DISCUSSION & ANALYSIS UNAUDITED AND IN THOUSANDS
The information in this section is not covered by the Independent Auditor’s Report, but is presented as required supplementary information for the benefit of the readers of the CAFR. As management of the County, we offer readers of the County’s financial statements this narrative overview and analysis of the financial activities of the County for the year ended June 30, 2018. We encourage readers to consider the information presented here in conjunction with additional information that we have furnished in the County’s Basic Financial Statements, which immediately follow this section. All dollar amounts are expressed in thousands.
Financial Highlights
Governmentwide Financial Analysis
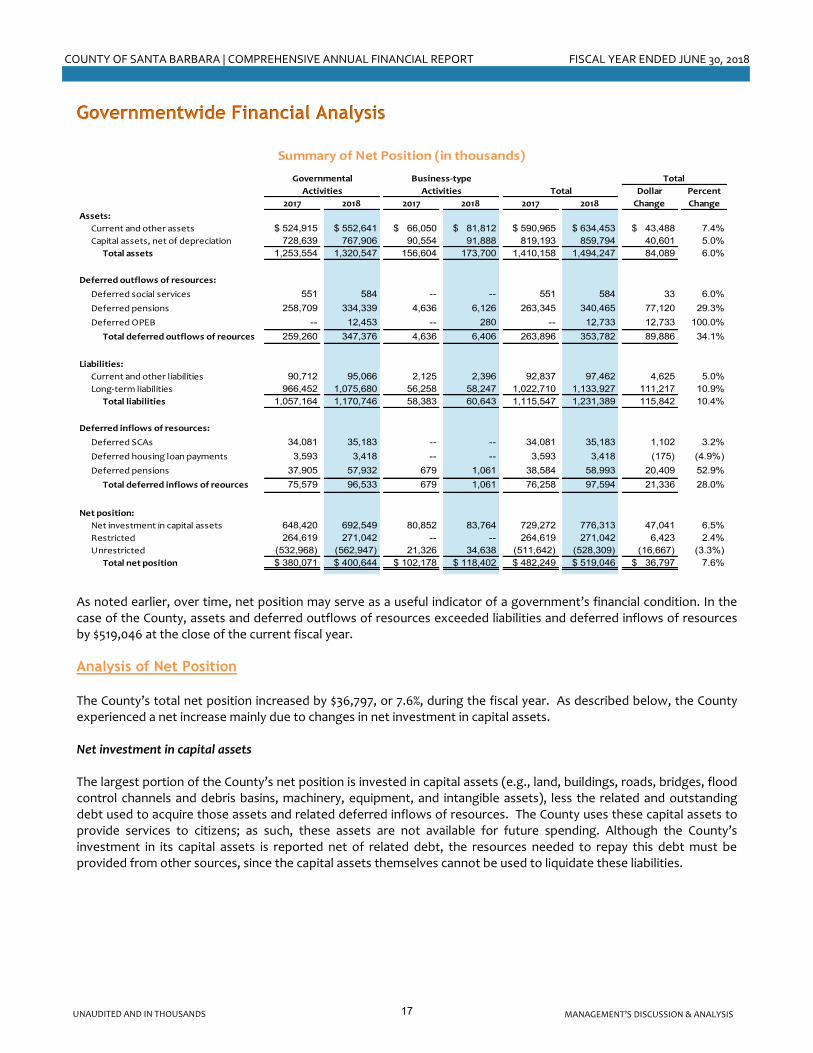
The assets and deferred outflows of resources of the County exceeded its liabilities and deferred inflows of resources at the close of the most recent fiscal year by $515,810 (See Summary of Net Position and analysis on page 17):
$776,313 represents the County’s investment in capital assets, less (1) accumulated depreciation, (2) related outstanding debt used to acquire those assets, and (3) related deferred inflows of resources,
$271,042 is available for the County’s ongoing obligations related to programs with external restrictions, and -$528,309 in unrestricted net position is primarily the result of the County’s unfunded pension and Other
Postemployment Benefits (OPEB) liabilities. The County’s total net position increased by $36,797 over the prior year: The $47,041 increase in net position from the net investment in capital assets represents capital acquisitions and
deletions, less current year depreciation, and the addition and/or retirement of related long-term debt and deferred inflows of resources,
The $6,423 increase in restricted net position represents the change in resources that are subject to external restrictions on their use, and
The $16,667 decrease in unrestricted net position is the change in resources available to fund County programs to citizens and debt obligations to creditors.
Financial Analysis of the County’s Funds The County’s governmental funds’ combined ending fund balance of $336,627 was an increase of $15,578 from the prior year ending fund balance of $321,049. Amounts available for spending include Restricted, Committed, and Unassigned Fund Balances; these totaled $322,936 or 95.9% of ending fund balance. Of this amount:
$213,662 is restricted by law or externally imposed requirements,
$98,683 is committed for specific purposes, and
$10,591 is unassigned fund balance. Spendable fund balance for the General Fund increased $18,447 to $117,898, which equates to 32.4% of total General Fund expenditures for the year.
Description of the Basic Financial Statements
Management’s Discussion and Analysis introduces the County’s Basic Financial Statements. The County’s Basic Financial Statements include three components:
Governmentwide Financial Statements
Fund Financial Statements
Notes to the Financial Statements
12
COUNTY OF SANTA BARBARA | COMPREHENSIVE ANNUAL FINANCIAL REPORT FISCAL YEAR ENDED JUNE 30, 2018
MANAGEMENT’S DISCUSSION & ANALYSIS UNAUDITED AND IN THOUSANDS
Governmentwide Financial Statements The Governmentwide Financial Statements provide readers with a broad overview of the County’s finances, in a manner similar to a private sector business. The Statement of Net Position presents information on all of the County’s Assets and Deferred Outflows of Resources and Liabilities and Deferred Inflows of Resources with the difference reported as Net Position.
Net Position = (Assets + Deferred Outflows of Resources) – (Liabilities + Deferred Inflows of Resources)
Over time, increases or decreases in Net Position are a useful indicator of an improving or deteriorating County financial condition. The Statement of Activities presents the most recent fiscal year changes in the County’s net position. All changes in net position are reported as soon as the underlying event giving rise to the change occurs, regardless of the timing of related cash flows (Accrual Basis of Accounting). The statement reports items resulting in cash flows in future fiscal periods (e.g., uncollected taxes, and earned but unused vacation leave) as revenues and expenses. The Governmentwide Financial Statements distinguish functions of the County principally supported by taxes and intergovernmental revenues (governmental activities) from other functions intended to recover all or a significant portion of their costs through user fees and charges (business-type activities). The governmental activities grouped by function of the County include Policy and Executive, Public Safety, Health and Public Assistance, Community Resources and Public Facilities, General Government and Support Services, and General County Programs. The business-type activities of the County include Resource Recovery and Laguna Sanitation. Component units are included in the financial statements and are legally separate entities for which the County is financially accountable. If a component unit’s total debt is expected to be repaid entirely by the County, if the component unit provides services entirely to the County, or if the component unit has substantially the same governing board as the County and there is a financial benefit or burden relationship or County management has operational responsibility for a component unit, then the component will be classified as a blended component unit. If a component unit does not meet any of the preceding requirements it will be presented as a discrete component unit. The following is a list of the County’s blended component units:
Laguna County Sanitation District
Flood Control and Water Conservation Districts
Santa Barbara County Fire Protection District
Public and Educational Access
In-Home Supportive Services Public Authority
County Service Areas
Community Facilities Districts
Lighting Districts
Sandyland Seawall Maintenance District
Water Agency
Santa Barbara County Finance Corporation The County’s only discretely presented component unit is the First 5 Children and Families Commission. Pages 32-33 of this report display the Governmentwide Financial Statements.
13
COUNTY OF SANTA BARBARA | COMPREHENSIVE ANNUAL FINANCIAL REPORT FISCAL YEAR ENDED JUNE 30, 2018
MANAGEMENT’S DISCUSSION & ANALYSIS UNAUDITED AND IN THOUSANDS
Fund Financial Statements A fund is a grouping of related accounts used to maintain control over resources segregated for specific activities or objectives. The County, like other state and local governments, uses fund accounting to ensure and demonstrate compliance with finance-related legal requirements. The County’s funds are divided into three types:
Governmental funds
Proprietary funds
Fiduciary funds Governmental Funds Governmental funds account for essentially the same functions reported as governmental activities in the Governmentwide Financial Statements. However, unlike the Governmentwide Financial Statements, governmental fund financial statements focus on near-term inflows and outflows of spendable resources, as well as on balances of spendable resources available at the end of the fiscal year (Modified Accrual Basis of Accounting). Such information may be useful in evaluating the County’s near-term financing requirements. To understand the long-term impact of the County’s near-term financing decisions, it is useful to compare the information presented for governmental funds with similar information presented for governmental activities in the Governmentwide Financial Statements. Both the Governmental Funds Balance Sheet and the Governmental Funds Statement of Revenues, Expenditures, and Changes in Fund Balances provide a reconciliation to facilitate this comparison between governmental funds and governmental activities. The County maintains 62 individual governmental funds combined into 27 funds for financial reporting purposes. The County segregates from the General Fund a number of significant functions in 8 major funds. Information is presented separately in the Governmental Funds Balance Sheet and in the Governmental Funds Statement of Revenues, Expenditures, and Changes in Fund Balances for the General; Roads; Public Health; Social Services; Behavioral Wellness; Flood Control District; Affordable Housing; Fire Protection District; and Capital Projects funds, all considered major funds. Data for the other 18 governmental funds are combined into a single, aggregated presentation. Individual fund data for these nonmajor governmental funds are provided in the form of combining statements elsewhere in this report. The County adopts an annual appropriated budget for all of its operating funds. The budget and actual comparison schedules provided for the General Fund and major special revenue funds demonstrate performance against this budget. Pages 34-37 of this report display the Governmental Funds Financial Statements.
Proprietary Funds The County maintains two different types of proprietary funds: enterprise funds and internal service funds. The County has two enterprise funds, both qualify as major funds. Enterprise Funds report the same functions presented as business-type activities in the Governmentwide Financial Statements. The County uses enterprise funds to account for Resource Recovery and Laguna Sanitation. Internal Service Funds are an accounting device used to accumulate and allocate costs internally among the County’s various functions. The County’s internal service funds account for information technology services, vehicle operations and maintenance, risk management and insurance, communications services, and utilities. Since these services predominantly benefit governmental rather than business-type functions, they are consolidated within governmental activities in the Governmentwide Financial Statements.
14
COUNTY OF SANTA BARBARA | COMPREHENSIVE ANNUAL FINANCIAL REPORT FISCAL YEAR ENDED JUNE 30, 2018
MANAGEMENT’S DISCUSSION & ANALYSIS UNAUDITED AND IN THOUSANDS
Proprietary funds provide the same type of information as the Governmentwide Financial Statements, but in more detail. The proprietary funds financial statements provide separate information for the Resource Recovery and Waste Management Fund (Resource Recovery), and the Laguna Sanitation Fund. Data for the five internal service funds are combined into a single, aggregated presentation in the proprietary funds financial statements. Pages 38-40 of this report display the Proprietary Funds Financial Statements.
Fiduciary Funds Fiduciary funds account for resources held for the benefit of parties outside the County. Fiduciary funds are not reflected in the Governmentwide Financial Statements because the resources of those funds are not available to support the County’s own programs. Fiduciary fund accounting is similar to proprietary fund accounting. Fiduciary funds report the external portions of the Treasurer’s investment pool, a private-purpose trust fund, and agency funds. Pages 41-42 of this report display the Fiduciary Funds Financial Statements. Notes to the Financial Statements The Notes to the Financial Statements provide additional information that is essential to a full understanding of the data provided in the Governmentwide and Fund Financial Statements. Information in the Notes to the Financial Statements is described as follows:
Note 1 provides a general description of the County’s Significant Accounting Policies.
Note 2 provides a Reconciliation for Governmentwide and Fund Financial Statements.
Notes 3 to 21 provide detailed notes on cash and investments, restricted cash and investments, receivables, capital assets, service concession arrangements, deferred outflows of resources, advances from grantors and third parties, debt obligations, leases, certificates of participation, bonds and notes payable, self-insurance, commitments and contingencies, landfill closure and postclosure, deferred inflows of resources, fund balances, restricted component of net position, interfund transactions, and tax abatements.
Notes 22 to 26 provide detailed notes on pension plans, OPEB, deferred compensation plans, voluntary termination benefits, and prior period adjustments.
Pages 43-110 of this report display the Notes to the Financial Statements.
15

COUNTY OF SANTA BARBARA | COMPREHENSIVE ANNUAL FINANCIAL REPORT FISCAL YEAR ENDED JUNE 30, 2018
MANAGEMENT’S DISCUSSION & ANALYSIS UNAUDITED AND IN THOUSANDS
General Fund(Major Fund)
Special Revenue Funds
Capital Project Funds
Debt Service Funds
Internal ServiceFunds
Enterprise Funds
Governmental Funds Proprietary Funds
Major Fund:Capital Projects
Major Funds:Roads
Public Health
Social Services
Behavioral Wellness
Flood Control District
Affordable Housing
Fire Protection District
Nonmajor Funds:Fish & Game
Petroleum
Public & Educational Access
Special Aviation
IHSS
Child Support
Services
Fishermen Assistance
Coastal Resources
Enhancement
Court Activities
Criminal Justice Construction
Courthouse Construction
Inmate Welfare
Special Districts Under the Board of
Supervisors
Nonmajor Fund:Santa Barbara
County Finance Corporation
Nonmajor Funds:Information Technology
Services
Vehicle Operations and Maintenance
Risk Management and Insurance
Communications Services
Utilities
Major Funds:Resource Recovery
Laguna Sanitation
Governmental Activities
Business-Type
Activities
Appropriated Funds
General Fund Departments
Policy & Executive
Board of Supervisors
County Executive Office
County Counsel
Public Safety
Courts
District Attorney
Public Defender
Probation
Sheriff
Health & Public Assistance
Public Health
Social Services
Community Resources & Public Facilities
Ag Commission
Community Services
Planning & Devel.
Public Works
General Government & Support Services
Auditor-Controller
Clerk-Recorder-Assessor
General Services
Treasurer-Tax-Collector
General County
Programs
General County Programs
County Service Areas
Community
Facilities Districts
Lighting Districts
Sandyland Seawall Maintenance
Water Agency
Legend:
Governmental Activities featuring Departments
Governmental Activities
Business-Type Activities
16
COUNTY OF SANTA BARBARA | COMPREHENSIVE ANNUAL FINANCIAL REPORT FISCAL YEAR ENDED JUNE 30, 2018
MANAGEMENT’S DISCUSSION & ANALYSIS UNAUDITED AND IN THOUSANDS
Governmentwide Financial Analysis
Dollar Percent
2017 2018 2017 2018 2017 2018 Change Change
Assets:
Current and other assets $ 524,915 $ 552,641 $ 66,050 $ 81,812 $ 590,965 $ 634,453 $ 43,488 7.4%Capital assets, net of depreciation 728,639 767,906 90,554 91,888 819,193 859,794 40,601 5.0%
Total assets 1,253,554 1,320,547 156,604 173,700 1,410,158 1,494,247 84,089 6.0%
Deferred outflows of resources:
551 584 -- -- 551 584 33 6.0% 258,709 334,339 4,636 6,126 263,345 340,465 77,120 29.3% -- 12,453 -- 280 -- 12,733 12,733 100.0%
Total deferred outflows of reources 259,260 347,376 4,636 6,406 263,896 353,782 89,886 34.1%
Liabilities:
Current and other liabilities 90,712 95,066 2,125 2,396 92,837 97,462 4,625 5.0%Long-term liabilities 966,452 1,075,680 56,258 58,247 1,022,710 1,133,927 111,217 10.9%
Total liabilities 1,057,164 1,170,746 58,383 60,643 1,115,547 1,231,389 115,842 10.4%
Deferred inflows of resources:
Deferred SCAs 34,081 35,183 -- -- 34,081 35,183 1,102 3.2%Deferred housing loan payments 3,593 3,418 -- -- 3,593 3,418 (175) (4.9%)Deferred pensions 37,905 57,932 679 1,061 38,584 58,993 20,409 52.9%
Total deferred inflows of reources 75,579 96,533 679 1,061 76,258 97,594 21,336 28.0%
Net investment in capital assets 648,420 692,549 80,852 83,764 729,272 776,313 47,041 6.5%Restricted 264,619 271,042 -- -- 264,619 271,042 6,423 2.4%Unrestricted (532,968) (562,947) 21,326 34,638 (511,642) (528,309) (16,667) (3.3%)
Total net position $ 380,071 $ 400,644 $ 102,178 $ 118,402 $ 482,249 $ 519,046 $ 36,797 7.6%
Summary of Net Position (in thousands)
Governmental Business-type Total
Net position:
Activities Activities Total
Deferred social services
Deferred OPEB
Deferred pensions
As noted earlier, over time, net position may serve as a useful indicator of a government’s financial condition. In the case of the County, assets and deferred outflows of resources exceeded liabilities and deferred inflows of resources by $519,046 at the close of the current fiscal year.
Analysis of Net Position The County’s total net position increased by $36,797, or 7.6%, during the fiscal year. As described below, the County experienced a net increase mainly due to changes in net investment in capital assets. Net investment in capital assets The largest portion of the County’s net position is invested in capital assets (e.g., land, buildings, roads, bridges, flood control channels and debris basins, machinery, equipment, and intangible assets), less the related and outstanding debt used to acquire those assets and related deferred inflows of resources. The County uses these capital assets to provide services to citizens; as such, these assets are not available for future spending. Although the County’s investment in its capital assets is reported net of related debt, the resources needed to repay this debt must be provided from other sources, since the capital assets themselves cannot be used to liquidate these liabilities.
17

COUNTY OF SANTA BARBARA | COMPREHENSIVE ANNUAL FINANCIAL REPORT FISCAL YEAR ENDED JUNE 30, 2018
MANAGEMENT’S DISCUSSION & ANALYSIS UNAUDITED AND IN THOUSANDS
The County’s net investment in capital assets was $776,313 at year-end, and consisted of the following:
2017 2018
Dollar
Change
Precentage
Change
819,193$ 859,794$ 40,601$ 5.0%
Less:
Related Debt 56,030 50,163 (5,867) (10.5%)
Related Deferred Inflows of Resources 33,891 33,318 (573) (1.7%)
729,272$ 776,313$ 47,041$ 6.5%
Investment in Capital Assets (net of
accumulated depreciation)
Net Investment in Capital Assets
The $47,041, or 6.5%, increase in net position from the net investment in capital assets represents capital acquisitions and deletions, less current year depreciation, and the addition and/or retirement of related long-term debt and deferred inflows of resources. Capital additions were related primarily to construction activity on the Northern Branch Jail, infrastructure (roads & road improvements), other building projects, and equipment and software. The County recorded depreciation expense of $28,972 . Restricted net position Restricted net position of $271,042 represents resources that are subject to external restrictions on their use or by enabling legislation. Due to the unique nature of funding sources and the unrestricted impact of the net pension and OPEB liabilities, the County has significantly more restricted net position dollars than unrestricted net position dollars. Restricted net position is comprised of the following:
$125,466 (46.29%) for property taxes dedicated to specific services such as flood control and fire protection,
$60,146 (22.19%) for federally imposed restrictions for health and housing programs,
$31,757 (11.72%) for numerous State imposed restrictions,
$29,768 (10.98%) for federal and State allocations for roads and health services,
$12,057 (4.45%) for various other restrictions imposed on the County, and
$11,848 (4.37%) for grant, land use, and permit agreements. Restricted net position increased $6,423 or 2.4%. Significant changes to restricted net position, by function, include:
The Public Safety function increased $5,716 due primarily to increases in charges for emergency responses and other incident reimbursements for local disaters as well as a one time contribution for a ladder truck and its associated equipment. Unspent Public Safety realignment growth funds (Assembly Bill (AB) 109), Proposition 172 funds and Youth Offender Block Grant funds were set aside for future continued and enhanced service levels.
The Health and Public Assistance function increased $437 as a result of increases for unspent Mental Health Services Act (MHSA) funding in Behavioral Wellness and increases in the Department of Social Services for 2011 Realignment excess revenues, offset by decreases to Public Health restricted fund balance for capital projects.
The Community Resources and Public Facilities function increased $325 primarily as a result of current revenues to be spent on future Housing & Community Development projects and surplus foreclosure sales proceeds in the Affordable Housing fund. Additionally, homeowner assessments were collected for anticipated maintenance work on the Sandyland Seawall that was delayed by the Montecito Debris Flow. There were also increases in the Senate Bill 1 (SB 1) gasoline tax unspent proceeds in the Roads fund. All these increases were offset by expenses related to the Montecito Debris Flow in the Flood Control fund and Roads funds.
Unrestricted net position The negative unrestricted net position of $528,309 grew by $16,667, or 3.3% from the prior year. The majority of negative unrestricted net position is primarily the result of the County’s unfunded pension and OPEB liabilities offset by positive unrestricted net position predominantly in the County’s General Fund.
18
COUNTY OF SANTA BARBARA | COMPREHENSIVE ANNUAL FINANCIAL REPORT FISCAL YEAR ENDED JUNE 30, 2018
MANAGEMENT’S DISCUSSION & ANALYSIS UNAUDITED AND IN THOUSANDS
Dollar Percent
2017 2018 2017 2018 2017 2018 Change Change
$ 210,885 $ 216,085 $ 38,697 $ 43,904 $ 249,582 $ 259,989 $ 10,407 4.2% 364,316 386,829 1,155 1,049 365,471 387,878 22,407 6.1% 3,201 200 -- -- 3,201 200 (3,001) (93.8%)
Total program revenues 578,402 603,114 39,852 44,953 618,254 648,067 29,813 4.8%
267,613 284,284 -- -- 267,613 284,284 16,671 6.2% 18,172 18,118 -- -- 18,172 18,118 (54) (.3%) 10,068 8,364 -- -- 10,068 8,364 (1,704) (16.9%) 1,869 1,909 -- -- 1,869 1,909 40 2.1% 3,104 3,252 -- -- 3,104 3,252 148 4.8% 335 753 265 405 600 1,158 558 93.0% 1,099 815 3 -- 1,102 815 (287) (26.0%)
Total general revenues 302,260 317,495 268 405 302,528 317,900 15,372 5.1%Total revenues 880,662 920,609 40,120 45,358 920,782 965,967 45,185 4.9%
14,315 18,938 -- -- 14,315 18,938 4,623 32.3% 314,026 361,703 -- -- 314,026 361,703 47,677 15.2% 364,675 360,185 -- -- 364,675 360,185 (4,490) (1.2%) 94,387 110,529 -- -- 94,387 110,529 16,142 17.1% 37,716 39,023 -- -- 37,716 39,023 1,307 3.5% 2,206 2,514 -- -- 2,206 2,514 308 14.0% 2,152 2,024 -- -- 2,152 2,024 (128) (5.9%) -- -- 29,196 24,507 29,196 24,507 (4,689) (16.1%) -- -- 6,822 6,564 6,822 6,564 (258) (3.8%)
Total expenses 829,477 894,916 36,018 31,071 865,495 925,987 60,492 7.0%Excess (deficiency) of revenues
over (under) expenses 51,185 25,693 4,102 14,287 55,287 39,980 (15,307) (27.7%)
-- 36 -- (36) -- -- -- --
Change in net position 51,185 25,729 4,102 14,251 55,287 39,980 (15,307) (27.7%)
Net position - beginning 322,003 380,071 98,076 102,178 420,079 482,249 62,170 14.8%Prior period adjustment 6,883 (5,156) -- 1,973 6,883 (3,183) (10,066) (146.2%)Net position - beginning, as restated 328,886 374,915 98,076 104,151 426,962 479,066 52,104 12.2%Net position - ending $ 380,071 $ 400,644 $ 102,178 $ 118,402 $ 482,249 $ 519,046 $ 36,797 7.6%
Interest on long-term debt
Resource recovery
Health & public assistance
Transfers
Community resources & public facilities
Laguna sanitation
General government & support services
General county programs
Public safety
Property taxes
Sales taxes
Transient occupancy tax
Unrestricted investment earnings
Other
Expenses
Policy & executive
Franchise fees
Payments in lieu of taxes
General revenues:
Activities Activities Total
Changes in Net Position (in thousands)
Governmental Business-type Total
Revenues
Program revenues:
Charges for services
Operating grants and contributions
Capital grants and contributions
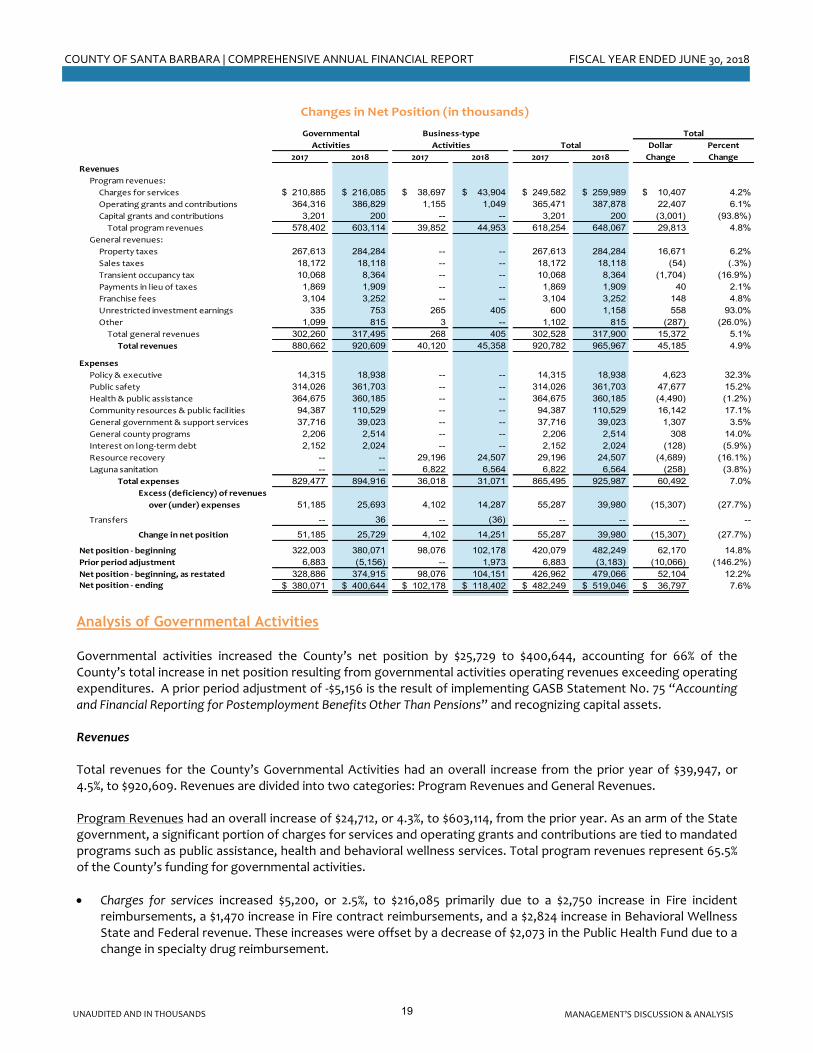
Analysis of Governmental Activities Governmental activities increased the County’s net position by $25,729 to $400,644, accounting for 66% of the County’s total increase in net position resulting from governmental activities operating revenues exceeding operating expenditures. A prior period adjustment of -$5,156 is the result of implementing GASB Statement No. 75 “Accounting and Financial Reporting for Postemployment Benefits Other Than Pensions” and recognizing capital assets. Revenues Total revenues for the County’s Governmental Activities had an overall increase from the prior year of $39,947, or 4.5%, to $920,609. Revenues are divided into two categories: Program Revenues and General Revenues. Program Revenues had an overall increase of $24,712, or 4.3%, to $603,114, from the prior year. As an arm of the State government, a significant portion of charges for services and operating grants and contributions are tied to mandated programs such as public assistance, health and behavioral wellness services. Total program revenues represent 65.5% of the County’s funding for governmental activities.
Charges for services increased $5,200, or 2.5%, to $216,085 primarily due to a $2,750 increase in Fire incident reimbursements, a $1,470 increase in Fire contract reimbursements, and a $2,824 increase in Behavioral Wellness State and Federal revenue. These increases were offset by a decrease of $2,073 in the Public Health Fund due to a change in specialty drug reimbursement.
19
COUNTY OF SANTA BARBARA | COMPREHENSIVE ANNUAL FINANCIAL REPORT FISCAL YEAR ENDED JUNE 30, 2018
MANAGEMENT’S DISCUSSION & ANALYSIS UNAUDITED AND IN THOUSANDS
Operating grants and contributions (intergovernmental revenues) increased $22,513, or 6.2%, to $386,829 primarily from increases of $13,640 of State grant reimbursements for the Northern Branch Jail, $3,029 for Social Services Calworks Family Support, $2,247 in revenues for SB 1 gasoline tax and State Highway Users Tax in Public Works, $1,835 for a security enhancement grant at the Santa Ynez Valley Airport Authority, $1,811 for the Probation Department local realignment revenue, and $1,798 in Mental Health Services Act revenue and $2,026 realignment revenues received by Behavioral Wellness. All these increases were offset by decreased revenues for the Highway Bridge Program in Public Works of $4,359.
Capital grants and contributions (intergovernmental revenues) decreased $3,001, or 93.8%, to $200 because of a one-time land easement donation that occurred in the prior year.
General Revenues had an overall increase of $15,235, or 5%, to $317,495. These revenues included general taxes which provided the Board of Supervisors with the most discretionary spending ability. Since the formation of County government in the 1850’s, basic public safety services such as sheriff, fire, probation and district attorney consume most of these resources. The increase in general revenues is due primarily to the following changes:
Property Tax Revenue increased $16,671, or 6.2%, to $284,284 primarily from increased assessments, new development, and prior year billings.
Sales Tax Revenue decreased $54, or .3%, to $18,118 primarily due to the economic impact associated with the Thomas Fire and Montecito Debris Flow.
Transient Occupancy Tax revenue decreased $1,704, or 16.9%, to $8,364 primarily due to the economic impact associated with the Thomas Fire and Montecito Debris Flow.
Expenses had an overall increase for governmental activities of $65,439, or 7.9%, to $894,916 from the prior year. As a service delivery entity, the County’s major cost component is salaries and benefits, amounting to 63.5% of the total County expenses. The average full-time equivalent (FTE) count for the County (including business-type activities) had a net decrease of 157 FTEs from 4,218 in the prior year to 4,061 at June 30, 2018. Program expenses for the County’s governmental activities are generally attributable to the following factors:
Total salaries and benefits expense increased $48,011, or 8.9%, to $588,271 across all functions and is primarily made up of the following: An increase in retirement pension expense of $38,680, or 28.7%, to $173,182 mainly due to decreasing the
discount rate used to measure the total pension liability from 7.5% to 7.0%. An increase in regular salary costs of $3,523, or 1.2%, to $305,588 primarily due to additional positions, merit
increases, and cost-of-living adjustments (COLAs). An increase in health insurance costs of $738, or 2.2%, to $33,910 due to premium increases. An increase in overtime costs of $6,175, or 23.9%, to $32,039 primarily in the Sheriff and Fire Departments due
to the Thomas Fire and Montecito Debris Flow. A decrease in OPEB expense of $4,433, or 30.6%, to $10,058 is the result of implementation of a new OPEB
accounting standard. An increase in compensated absences expense of $1,209, or 195%, from a negative $620, to a positive $589
resulted from a decreased use by employees of their accumulated paid time off balances. An increase in workers’ compensation expense of $2,492, or 18%, to $16,316 due to actuarial adjustments,
increased cost of claims, and increased litigation of claims.
Total services and supplies increased by $17,249, or 10.2%, to $186,201 across all functions and is primarily made up of the following: An increase in Channel and Drain Maintenance of $4,750, or 2,039%, to $4,983 in Flood Control Funds primarily
for creek and channel clearing services for the Montecito Debris Flow. An increase in Professional and Special Services of $4,735, or 19.4%, to $29,151, in the Sheriff Department for
mutual aid claims from assisting agencies in the Montecito Debris Flow and increases in the base fees for correctional healthcare services.
20

COUNTY OF SANTA BARBARA | COMPREHENSIVE ANNUAL FINANCIAL REPORT FISCAL YEAR ENDED JUNE 30, 2018
MANAGEMENT’S DISCUSSION & ANALYSIS UNAUDITED AND IN THOUSANDS
$47$708
$1,624$2,098
$2,643
$3,343
$6,992
$0
$1,000
$2,000
$3,000
$4,000
$5,000
$6,000
$7,000
$8,000
December January February March April May June
Thomas Fire and Montecito Debris Flow Service and Supply Expenditures
Expenditures
$0
$50,000
$100,000
$150,000
$200,000
$250,000
$300,000
$350,000
$400,000
Policy & Executive Public Safety Health & PublicAssistance
Comm. Res. & PublicFacilities
General Gov't &Support Services
General CountyPrograms
Program Expenses and Revenues - Governmental Activities
Program Expenses Program Revenues
An increase in Debris Basin Maintenance from $25 to $1,541 due to debris basin and spillway cleanout and repair after the Montecito Debris Flow.
An increase in Structure and Ground Maintenance costs of $1,262, or 34.4%, to $4,928, primarily due to a roof repair and maintenance related to Fire facilities.
An increase in In Home Supportive Services expense of $940, or 13.7%, to $7,793, in the Department of Social Services primarily due to increases in the County’s required contributions per the memorandum of understanding with the State.
An increase in Service Contracts expense with community based organizations of $827, or 3.1%, to $27,398, in the Behavioral Wellness funds.
Service and Supply expenditures for the Thomas Fire and Montecito Debris Flow totaled $17,455 at June 30, 2018. Expenditures by month are shown in the graph below.
21

COUNTY OF SANTA BARBARA | COMPREHENSIVE ANNUAL FINANCIAL REPORT FISCAL YEAR ENDED JUNE 30, 2018
MANAGEMENT’S DISCUSSION & ANALYSIS UNAUDITED AND IN THOUSANDS
Analysis of Business-type Activities The net position of business-type activities increased by 13.7%, or $14,251, to $118,402 which indicates these activities generated revenues sufficient to cover the costs of operations. $1,973 of this increase was due to the prior period adjustments discussed in Note 26. (See discussion on Proprietary Funds in the next section.)
$0
$8,000
$16,000
$24,000
$32,000
Resource Recovery Laguna Sanitation
Program Expenses and Revenues Business-type Activities (in thousands)
Program Expenses
Program Revenues
Charges for services, $43,904 ,
96.8%
Investment earnings,
$405 , 0.9%
Other, $1,049 , 2.3%
Revenues by Source Business-type Activities (in thousands)
Financial Analysis of the County’s Fund Balances
Fund Balances (in thousands)
Nonspendable Dollar Percent
2018 2017 Change Change
11,977$ 38,002$ 69,305$ 10,591$ 129,875$ 113,070$ 16,805$ 14.9%
-- 18,492 -- -- 18,492 18,900 (408) (2.2%)-- 19,006 6,772 -- 25,778 30,977 (5,199) (16.8%)-- 3,644 1,784 -- 5,428 4,131 1,297 31.4%-- 11,276 -- -- 11,276 9,116 2,160 23.7%
155 64,500 -- -- 64,655 68,223 (3,568) (5.2%)-- 8,023 -- -- 8,023 7,366 657 8.9%
1,479 24,269 -- -- 25,748 24,419 1,329 5.4%-- 1,616 19,658 -- 21,274 21,639 (365) (1.7%)
80 24,834 1,164 -- 26,078 23,208 2,870 12.4%
13,691$ 213,662$ 98,683$ 10,591$ 336,627$ 321,049$ 15,578$ 4.9%
2018
Social Services
General Fund
Major Funds
Roads
Public Health
Total Fund Balances
Behavioral Wellness
Flood Control
Affordable Housing
Fire Projection
Capital Projects
Other Governmental
Funds
Total
TotalRestricted Committed Unassigned
Governmental Funds The focus of the County’s governmental funds is to provide information on near-term inflows, outflows, and balances of spendable resources (modified accrual basis of accounting). Such information is useful in assessing the County’s financing requirements. In particular, total fund balance less the nonspendable portion is a useful measure of a government’s resources available for spending at the end of the fiscal year.
22

COUNTY OF SANTA BARBARA | COMPREHENSIVE ANNUAL FINANCIAL REPORT FISCAL YEAR ENDED JUNE 30, 2018
MANAGEMENT’S DISCUSSION & ANALYSIS UNAUDITED AND IN THOUSANDS
At June 30, 2018, the County’s Governmental Funds reported total fund balance of $336,627, a $15,578 increase in comparison with the prior year’s total ending fund balances. The components of total fund balance are as follows (for more information see Note 18 – Fund Balances):
Nonspendable Fund Balance, $13,691, are amounts that are not spendable in form, or are legally or contractually required to be maintained intact, and are made up of (1) legally required Teeter Tax program loss reserves of $8,656, (2) long-term receivables of $4,985, and (3) prepaid expenses and deposits of $50.
Restricted Fund Balance, $213,662, consists of amounts with constraints put on their use by creditors, grantors, contributors, laws, regulations or enabling legislation. Examples of restrictions on funds are those for (1) purpose of fund (i.e., flood control), (2) grants for capital outlay, and (3) legislated amounts reserved for health care.
Committed Fund Balance, $98,683, consists of amounts for specific purposes determined by the Board, which includes a Strategic Reserve account of $23,717, Purpose of Fund of $18,245, a Northern Branch Jail Operations account of $13,054, Health Care Programs of $6,768, Litigation account of $4,439, General Services Projects of $4,144, Parks Projects of $3,546, Emerging Issues account of $3,276, and various other commitments less than $3,000.
Unassigned Fund Balance, $10,591, represents the residual balance for the County’s General Fund. Approximately 95.9%, or $322,936, of the total fund balances is spendable which means it is available to meet the County’s current and future needs. With the approval of the Board, County management can earmark a portion of fund balance to a particular function, project or activity, and can also earmark it for purposes beyond the current year, within the constraints applied to the various categories of fund balance. With the exception of the nonspendable portion, fund balances are available for appropriation at any time. General Fund The General Fund is the main operating fund of the County. The General Fund’s total fund balance increased by 14.9%, or $16,805, to $129,875 at June 30, 2018. The spendable portion of fund balance increased $18,447 to $117,898 due to increases to committed fund balance for the Northern Branch Jail of $9,100, increase of $8,456 for emerging issues, increase of $3,959 for litigation, increase of $2,275 for contingencies, and increase of $634 for tobacco settlement. These increases were offset by a draw on the Strategic Reserve committed fund balance of $7,150 for expenditures related to the Montecito Debris Flow, $6,927 for emerging issues, and draws for other Board priorities. Increases to restricted fund balance were primarily $4,009 for local realignment, $1,599 for Prop 172, and $938 for Probation block grant. The nonspendable portion of fund balance decreased $1,642 to $11,977 due to decreases in receivables of $2,644, which was offset by additional property tax impounds of $643 and increases 0f $359 to the Reserve for Tax Losses under the Teeter Plan. As a measure of the General Fund’s liquidity, it is useful to compare both total fund balance and spendable fund balance to total fund expenditures. Total fund balance equates to 35.7% of total General Fund expenditures while spendable fund balance equates to 32.4% of total General Fund expenditures. Of the General Fund spendable fund balance, $38,002, or 32.2%, is restricted, $69,305, or 58.8%, is committed and $10,591, or 9%, is unassigned. Some significant committed fund balance amounts of the General Fund include:
$23,717 Strategic Reserve earmarked for severe economic downturns and emergencies,
$13,054 in New Jail Operations,
$4,439 for Litigation,
$3,276 for Emerging Issues,
$2,005 for Contingencies,
$1,875 for Program Stabilization,
$1,795 for Clerk-Recorder Assessor Projects,
$1,765 for Auditor Systems Maintenance/Development,
$1,483 for Purpose of Fund, and
$1,353 for Parks Projects.
23

COUNTY OF SANTA BARBARA | COMPREHENSIVE ANNUAL FINANCIAL REPORT FISCAL YEAR ENDED JUNE 30, 2018
MANAGEMENT’S DISCUSSION & ANALYSIS UNAUDITED AND IN THOUSANDS
General Fund unassigned fund balance at year-end was $10,591, or 9% of spendable fund balance, a 36.5%, or $2,830, increase from the prior year. The increase is primarily attributable to better than estimated property taxes, higher than anticipated penalties collected on delinquent property taxes, reductions in salaries and benefits due to unfilled positions, and savings in services and supplies. Major Funds As compared with the prior year, the total fund balances of the major funds decreased 2.2%, or $4,097, to $180,674 with the following significant changes:
The Public Health Fund, with expenditures of $76,212, finished the year with a decrease to fund balance of $5,199, or a 16.8% decrease, to $25,778. The primary driver of the decrease was a $2,971 release of restricted funds for capital projects and increased operating costs and $2,073 in reduced pharmacy revenues due to a change in specialty drug reimbursement.
The Flood Control District, with expenditures of $20,594, decreased its fund balance by $3,568, or a 5.2% decrease, to $64,655. This was primarily due to an increase of $4,750 in creek and channel clearing, an increase of $1,515 for debris basin and spillway cleanout and repair, and a $200 increase in salary and benefit overtime costs. The majority of these increased expenditures were related to the Montecito Debris Flow. This was offset by increases in property taxes of $590, RDA distributions of $580, charges for services of $364, federal aid for disasters of $337, and prior year tax collections of $167.
The Behavioral Wellness Fund, with expenditures of $97,836, finished the year with an increase to fund balance of $2,160, or a 23.7% increase, to $11,276. The increase in fund balance was primarily due to increased State and Federal revenues in the Mental Health Services Act fund of $4,671, which was offset by cost overruns and revenue shortfalls of $2,964 related to the Psychiatric Health Facility.
The Fire Protection District Fund, with expenditures of $80,538, finished positive with an increase to fund balance of $1,329, or a 5.4% increase, to $25,748. This was primarily from an increase in reimbursable incident revenue of $2,570 due to the active fire season, Montecito Debris Flow, and State fire contracts. This was offset by increased overtime costs related to increased levels of emergency response and increased facilities maintenance.
Other Governmental Funds The fund balances of nonmajor governmental funds as a whole increased $2,870, or 12.4%, to $26,078. The significant changes occurred in the following funds:
The Water Agency fund balance increased by $1,000 to set aside funds for future capital projects and to meet grant and permit compliance requirements. The funds were from increased revenue and maintenance savings.
The Sandyland Seawall Maintenance District fund balance increased by $750 due to planned maintenance work delayed by the Montecito Debris Flow.
The Courthouse Construction fund balance increased by $470 due to unspent fee and fine revenues.
Additional information on the County’s fund balance components can be found in Note 18 in the Notes to the Financial Statements
24

COUNTY OF SANTA BARBARA | COMPREHENSIVE ANNUAL FINANCIAL REPORT FISCAL YEAR ENDED JUNE 30, 2018
MANAGEMENT’S DISCUSSION & ANALYSIS UNAUDITED AND IN THOUSANDS
Proprietary Funds The enterprise funds total net position, which includes the Resource Recovery Fund and the Laguna Sanitation District Fund, increased by $14,199, or 13.6%, from the prior year. The Resource Recovery Fund net position increased by $7,243, while Laguna Sanitation District Fund net position increased by $6,956. Operating revenues increased $5,207, or 13.5%, to $43,904. Operating revenues generated by the Resource Recovery Fund increased $4,668 primarily related to increased charges for sanitation services and hazardous waste program and recycling billings. Laguna Sanitation District user fee revenue increased $539 primarily due to increases in charges for services for sanitation services, trunk line fees, and connection fees. Resource Recovery Fund expenses decreased $4,840, due mainly to significant landfill closure expenses incurred in the prior year and delayed projects due to the Montecito Debris Flow. Laguna Sanitation District Fund expenses decreased $335 primarily related to savings for operating supplies, maintenance projects, and professional services. The Laguna Sanitation District Fund’s increase in net position reflects an accumulation of resources for planned capital projects. Total internal service funds’ net position increased by $4,507, or 8.7%, to $56,357. The Vehicle Operations and Maintenance Fund’s net position increased $2,999, or 8.6%, to $37,762. This was due to fuel savings, reduced salary and benefit costs, and lower capital asset acquisitions. The Communications Services Fund had an increase in net position of $1,046 due primarily to a General Fund contribution for radio equipment acquisition in the subsequent year and increased charges for services. The remaining internal service funds experienced the following changes as a result of normal operations: the Information Technology Services Fund increased net position by $280. The Risk Management and Insurance Fund also had an increase in net position of $280. The Utilities Fund had a decrease in net position of $98.
Capital Assets & Debt Capital Assets
Dollar Percent
2017 2018 2017 2018 2017 2018 Change Change
Land $ 55,473 $ 55,473 $ 15,654 $ 15,654 $ 71,127 $ 71,127 $ -- 0.0%Land easements 53,133 53,133 -- -- 53,133 53,133 -- 0.0%SCA assets 40,482 40,856 -- -- 40,482 40,856 374 0.9%Work in progress 75,270 108,696 4,070 7,613 79,340 116,309 36,969 46.6%
Capital assets, not being depreciated 224,358 258,158 19,724 23,267 244,082 281,425 37,343 15.3%
Land improvements 21,068 20,313 468 260 21,536 20,573 (963) (4.5%)Structures and improvements 155,116 151,038 5,756 5,985 160,872 157,023 (3,849) (2.4%)Equipment and software 57,398 61,588 15,503 14,441 72,901 76,029 3,128 4.3%Infrastructure 270,699 276,809 49,103 47,935 319,802 324,744 4,942 1.5%
Capital assets, net of
accumulated depreciation 504,281 509,748 70,830 68,621 575,111 578,369 3,258 0.6%Total $ 728,639 $ 767,906 $ 90,554 $ 91,888 $819,193 $ 859,794 $ 40,601 5.0%
Activities Activities Total
Capital Assets (net of depreciation, in thousands)
Governmental Business-type Total
During the fiscal year, the County’s investment in capital assets increased by $40,601, or 5%, to $859,794 (net of accumulated depreciation/amortization). This investment is in a broad range of capital assets including land, land easements, work in progress (WIP), Service Concession Arrangement (SCA) assets, land improvements, structures and improvements, equipment and software, and infrastructure. Major capital additions include:
Structures and Improvements – $651 of Administration building electrical upgrades and $423 of Casa Nueva improvements
Equipment and Software – $3,360 for Aumentum Property Tax System and $1,340 for Electronic Health Record System
25

COUNTY OF SANTA BARBARA | COMPREHENSIVE ANNUAL FINANCIAL REPORT FISCAL YEAR ENDED JUNE 30, 2018
MANAGEMENT’S DISCUSSION & ANALYSIS UNAUDITED AND IN THOUSANDS
Infrastructure – $6,924 for Sandspit Road Bridge, $2,099 for Faraday Storm Drain, $1,576 for Orcutt Airport Ditch, and $1,463 for San Jose Creek Bike Path
WIP: The County both purchases and constructs capital assets throughout the year. When a capital project will be completed in a subsequent fiscal year, related project costs are recorded as WIP. In the year of completion, a project’s WIP is allocated to the appropriate capital asset classification(s). In the current fiscal year, WIP had a net increase of $36,969. Total WIP increases of $57,507 and a prior year restatement of $1,270 were offset by project completions of $21,808. Of the $57,507 increases to WIP, major project costs include: $37,331 for the Northern Branch Jail, $2,771 for the Tajiguas Landfill Liner, $1,595 for the Santa Ynez Valley Airport safety improvements, $1,423 for the Santa Maria Channel Improvements, $1,367 for the Mission Creek project, $741 for the Santa Ynez Valley Airport electrical upgrades, and $548 for the Floridale Avenue Bridge. Structures and structure improvements: The County capitalized $2,413 of structures and improvements related to completed WIP, net of $6,262 in related depreciation and deletions for all structures and improvements, for a total decrease of $3,849 or 2.4%. Equipment and Software: The County capitalized $17,564 of equipment and software, net of $15,676 in related depreciation and deletions for all equipment and software. A prior year restatement of $1,240 increased equipment and software to a total of $3,128 or 4.3%. Infrastructure: The County capitalized $12,537 in infrastructure related to completed WIP, net of $7,595 in related depreciation and deletions, for a total increase of $4,942 or 1.5%. Additional capital asset information, including depreciation, amortization, and outstanding WIP by project as of June 30, 2018, can be found in Note 6 of the Notes to the Financial Statements. Additional information regarding prior period adjustments can be found in Note 26 of the Notes to the Financial Statements.
Debt
Dollar Percent
2017 2018 2017 2018 2017 2018 Change Change
Capital lease obligations $ 1,983 $ 1,636 $ -- $ -- $ 1,983 $ 1,636 $ (347) (17.5%)Certificates of participation 27,798 26,872 4,554 3,766 32,352 30,638 (1,714) (5.3%)Bonds and notes payable 17,745 14,730 5,930 5,139 23,675 19,869 (3,806) (16.1%)
Total $ 47,526 $ 43,238 $ 10,484 $ 8,905 $ 58,010 $ 52,143 $ (5,867) (10.1%)
Activities Activities Total
Outstanding Debt (in thousands)
Governmental Business-type Total
At June 30, 2018, the County had total long-term debt outstanding of $52,143. This amount was comprised of $30,638 of certificates of participation (COP) issued by the County Finance Corporation that are secured by the County’s lease rental payments with a covenant to budget and appropriate lease payments. It also includes $19,869 of bonds and notes payable and $1,636 of capital lease obligations. The County’s total long-term debt decreased by $5,867, or 10.1%, during the fiscal year. The net decrease was due to $347 of payments for capital lease obligations, $1,714 of payments for COP debt, and $3,806 of payments for bonds and notes payable.
26

COUNTY OF SANTA BARBARA | COMPREHENSIVE ANNUAL FINANCIAL REPORT FISCAL YEAR ENDED JUNE 30, 2018
MANAGEMENT’S DISCUSSION & ANALYSIS UNAUDITED AND IN THOUSANDS
Additional information on the County’s long-term debt can be found in Notes 10 through 13 in the Notes to the Financial Statements General Fund Budgetary Highlights The variance between the final budget and actual expenditures resulted in $19,586 of unspent appropriations. Key variances are as follows: salary and benefit cost savings of approximately $8,962 resulting from unfilled positions; $5,958 resulting from unspent appropriations for services, supplies, and other charges across all functions; and $3,697 resulting from capital assets budgeted but not procured in this fiscal cycle. Expenditures: The County’s final budget appropriations for expenditures for the General Fund differ from the original budget by supplemental appropriations of $13,376, or 3.6%. The major changes in appropriations are as follows:
Salaries and benefits increased $4,262 primarily due to $2,750 for overtime costs in the Sheriff’s Department related to the Montecito Debris Flow and $1,520 for overtime costs associated with high vacancy rate within the department. The Office of Emergency Management also incurred $200 for overtime costs related to the Montecito Debris Flow. These increases were offset by $558 in salary savings in the Probation Department from restricted AB 109 revenues.
Services, supplies and other charges increased $8,228 made up primarily of $3,864 in the Sheriff’s Department for mutual aid services related to the Montecito Debris Flow. The Office of Emergency Management also incurred $3,300 of increased contractual services related to the Montecito Debris Flow and received an appropriation for $140 in donations for disaster consulting services.
Capital asset appropriations increased $885. This increase is mostly due to $680 for armored vehicles donated to the Sheriff’s Department.
Revenues: General Fund actual revenues were $1,642 more than total adjusted budgeted revenue estimates.
Taxes outperformed estimates by $1,042, primarily due to greater than expected prior year unsecured corrections and escapes of $1,698, prior year unsecured property tax collections of $2,178, and greater than expected residual redevelopment agency distributions of $1,591. These increases were offset by decreases in the Transient
$200,000
$275,000
$350,000
$425,000
Original Budget* Final Budget* Actual
General FundBudget to Actual Comparison
Expenditure Revenue *Fund balances are used to balance budgets.
The County maintains a Standard & Poor’s ‘SP-1+’ rating for short-term notes and a Standard & Poor’s ‘AA+’ for long-term certificates of participation. In addition, the County maintains a Moody’s Aa2 rating on its series 2008 Certificates of Participation. The rationale behind the ratings reflects the rating agencies’ view of:
The long–term general creditworthiness of the County;
The County’s covenants to budget and appropriate lease payments;
A stable, moderately growing economic base with access to the broader Ventura and Los Angeles area economies;
Consistent maintenance of very strong unreserved general fund balances despite limited financial flexibility due to state mandates;
An experienced management team that has implemented strong financial policies and prudent expenditure controls;
Low overall debt levels; and
The County’s very strong underlying general credit characteristics.
27

COUNTY OF SANTA BARBARA | COMPREHENSIVE ANNUAL FINANCIAL REPORT FISCAL YEAR ENDED JUNE 30, 2018
MANAGEMENT’S DISCUSSION & ANALYSIS UNAUDITED AND IN THOUSANDS
Occupancy Tax of $3,433 and Sales and Use Tax of $389 primarily due to the economic impacts associated with the Thomas Fire and Montecito Debris Flow.
Fines, forfeitures, and penalties outperformed estimates by $2,538 due to higher penalty collections associated with delinquent property tax payments.
Use of money and property performed better than estimates by $780 due primarily to increased interest income of $1,177, which was offset by a decrease of $519 due to unrealized losses on investments.
Charges for services were less than estimates by $3,058 primarily due to lower than expected environmental resource reimbursements of $2,451, recording fees of $415, and administrative revenue of $793. These decreases were offset by increased tax administration fees of $543.
The General Fund Budget to Actual schedule can be found on page 117 of this report.
Fund Balance: The General Fund’s equity position increased by $16,805, versus the adjusted budget plan to decrease fund equity by $7,768. By year-end, the increase to fund balance was more than the budget plan as departmental savings and positive operating results exceeded estimates.
Economic Factors and Next Year’s Budget and Rates
The following factors were considered in preparing the County’s operating budget for FY 18-19: The budget is projecting modest growth in County revenues. For budget year FY 18-19 local property, retail sales and transient occupancy taxes are estimated to grow in the 3% to 5% range. Total Governmental Fund revenues show an increase of 4.6%, or $44,252, comparing FY 18-19 budget to FY 17-18 actual revenues. The FY 18-19 budget shows an increase in General Fund total revenues of 3.6%, or $15,035, compared to FY 17-18 actual revenues. The budget appropriations for total Governmental Fund expenditures for FY 18-19 includes a 11.1%, or $103,178, increase when compared to FY 17-18 actual primarily due to favorable budget variances such as salary savings in FY 17-18. The FY 18-19 budget includes funding to cover increased employee pension costs and moderate increases for salary COLAs and employee benefits while maintaining current service levels in most areas. The State once again adopted an on-time budget and its financial condition continues to modestly improve as it preserves core programs and increases reserves in anticipation of a mild recession in late 2019. As of June 30, 2019, the recommended available spendable General Fund balance is projected to be $101,497. Of this amount, $29,932 is Restricted and $69,875 is Committed but remains available for appropriation. The County’s General Fund is projected to end with $1,690 of Unassigned fund balance. The County’s Recommended performance-based FY 18-19 budget and the County’s Five Year Capital Improvement Program can be found at www.countyofsb.org/ceo under the Budget heading.
($10,000)($5,000)
$0$5,000
$10,000$15,000$20,000
Original Budget Final Budget Actual
General FundBudgeted Effect on Fund Balance
28
COUNTY OF SANTA BARBARA | COMPREHENSIVE ANNUAL FINANCIAL REPORT FISCAL YEAR ENDED JUNE 30, 2018
MANAGEMENT’S DISCUSSION & ANALYSIS UNAUDITED AND IN THOUSANDS
Requests for Information
This financial report is designed to provide a general overview of the County’s finances for all interested parties. Questions concerning any of the information provided in this report or requests for additional information should be addressed to Santa Barbara County Auditor-Controller, PO Box 39, Santa Barbara, CA 93102-0039. The County’s Comprehensive Annual Financial Report and Financial Highlights publications can also be found on the County’s website at http://www.countyofsb.org/auditor/PublicationsLatest.sbc. A separately issued financial report for the County’s discretely presented component unit, the First 5 Children and Families Commission, can be obtained online at http://first5santabarbaracounty.org or by writing to: First 5 Children and Families Commission, 5385 Hollister Avenue, Building 10, Suite 110, Santa Barbara, CA 93111.
29

30

Basic Financial Statements
31
COUNTY OF SANTA BARBARA, CALIFORNIA
STATEMENT OF NET POSITION
GOVERNMENTWIDE
June 30, 2018 (in thousands)
Component Unit
First 5 Children
Governmental Business‐type and Families
Activities Activities Total Commission
Assets
Cash and investments (Note 3) 354,355$ 54,580$ 408,935$ 4,419$ Accounts receivable, net:
Taxes 20,297 -- 20,297 -- Licenses, permits, and franchises 712 2,547 3,259 -- Fines, forfeitures, and penalties 320 -- 320 -- Use of money and property 1,521 341 1,862 17 Intergovernmental 52,610 36 52,646 874 Charges for services 30,383 2,502 32,885 -- Other 1,534 2 1,536 --
Internal balances 526 (526) -- -- Inventories 290 175 465 -- Prepaid items 50 -- 50 -- Notes receivable (Note 5) 11,825 -- 11,825 -- Other receivables 9,546 968 10,514 6 Restricted cash and investments (Note 4) 21,564 21,187 42,751 -- Housing loans receivable (Note 5) 38,495 -- 38,495 -- Housing loans interest receivable (Note 5) 8,613 -- 8,613 -- Capital assets, not being depreciated/amortized (Note 6) 258,158 23,267 281,425 -- Capital assets, net of accumulated depreciation/amortization (Note 6) 509,748 68,621 578,369 --
Total assets 1,320,547 173,700 1,494,247 5,316
Deferred outflows of resources (Note 8)
Deferred social services 584 -- 584 -- Deferred pensions 334,339 6,126 340,465 824 Deferred OPEB 12,453 280 12,733 40
Total deferred outflows of resources 347,376 6,406 353,782 864
Liabilities
Accounts payable 29,054 1,843 30,897 548 Salaries and benefits payable 20,017 409 20,426 52 Interest payable 192 39 231 -- Other payables 6,196 1 6,197 -- Advances from grantors and third parties (Note 9) 28,159 -- 28,159 -- Unearned revenue 1,582 -- 1,582 -- Customer deposits payable 9,866 104 9,970 -- Long‐term liabilities (Note 10):
Portion due within one year:
Compensated absences (Note 10) 30,386 679 31,065 86 Capital lease obligations (Note 11) 324 -- 324 -- Certificates of participation, net (Note 12) 974 806 1,780 -- Bonds and notes payable (Note 13) 3,075 804 3,879 -- Liability for self‐insurance claims (Note 14) 5,972 -- 5,972 -- Landfill closure/postclosure care costs (Note 16) -- 1,018 1,018 --
Portion due in more than one year:
Compensated absences (Note 10) 3,044 -- 3,044 -- Capital lease obligations (Note 11) 1,312 -- 1,312 -- Certificates of participation, net (Note 12) 25,898 2,960 28,858 -- Other long‐term obligations (Note 10) 1,238 -- 1,238 -- Bonds and notes payable (Note 13) 11,655 4,335 15,990 -- Liability for self‐insurance claims (Note 14) 13,681 -- 13,681 -- Estimated litigation liability (Note 15) 809 -- 809 -- Landfill closure/postclosure care costs (Note 16) -- 29,245 29,245 -- Net pension liability (Note 22) 858,100 15,722 873,822 2,115 Net OPEB liability (Note 23) 119,212 2,678 121,890 386 Total liabilities 1,170,746 60,643 1,231,389 3,187
Deferred inflows of resources (Note 17)
Deferred service concession arrangements (Note 7) 35,183 -- 35,183 -- Deferred housing loan payments 3,418 -- 3,418 -- Deferred pensions 57,932 1,061 58,993 143
Total deferred inflows of resources 96,533 1,061 97,594 143
Net position
Net investment in capital assets 692,549 83,764 776,313 -- Restricted for (Note 19):
Policy & Executive 716 -- 716 -- Public safety 54,810 -- 54,810 -- Health & public assistance 36,848 -- 36,848 -- Community resources & public facilities 154,848 -- 154,848 -- General government & support services 5,447 -- 5,447 -- General county programs 18,373 -- 18,373 -- First 5 -- -- -- 2,850
Unrestricted (562,947) 34,638 (528,309) -- Total net position 400,644$ 118,402$ 519,046$ 2,850$
The notes to the financial statements are an integral part of this statement.
Primary Government
32

COUNTY OF SANTA BARBARA, CALIFORNIA
STATEMENT OF ACTIVITIES
GOVERNMENTWIDE
FOR THE FISCAL YEAR ENDED June 30, 2018 (in thousands)
Component
Unit
First 5
Operating Capital Children
Direct Indirect Total Charges for Grants and Grants and Governmental Business‐type and Families
Functions/Programs Expenses Expenses Expenses Services Contributions Contributions Activities Activities Total Commission
Governmental activities:
Policy & executive 23,231$ (4,293)$ 18,938$ 4,807$ 795$ --$ (13,336)$ --$ (13,336)$ Public safety 350,653 11,050 361,703 59,746 116,111 -- (185,846) -- (185,846) Health & public assistance 353,805 6,380 360,185 94,589 236,212 -- (29,384) -- (29,384) Community resources &
public facilities 106,810 3,719 110,529 32,702 26,403 200 (51,224) -- (51,224) General government &
support services 56,414 (17,391) 39,023 14,956 3,654 -- (20,413) -- (20,413) General county programs 2,484 30 2,514 9,285 3,654 -- 10,425 -- 10,425 Interest on long‐term debt 2,024 -- 2,024 -- -- -- (2,024) -- (2,024)
Total governmental activities 895,421 (505) 894,916 216,085 386,829 200 (291,802) -- (291,802)
Business‐type activities:
Resource Recovery 24,121 386 24,507 30,721 769 -- -- 6,983 6,983 Laguna Sanitation 6,445 119 6,564 13,183 280 -- -- 6,899 6,899
Total business‐type activities 30,566 505 31,071 43,904 1,049 -- -- 13,882 13,882 Total primary government 925,987$ --$ 925,987$ 259,989$ 387,878$ 200$ (291,802)$ 13,882$ (277,920)$
Component unit:
First 5 Children and Families Comm. 4,057$ --$ 4,057$ --$ 3,760$ --$ (297)$
General Revenues:
Taxes:
Property 205,703 -- 205,703 -- Sales 11,947 -- 11,947 -- Transient occupancy 8,364 -- 8,364 --
Payments in‐lieu of taxes 1,909 -- 1,909 -- Motor vehicle in‐lieu tax 198 -- 198 -- Franchise fees 3,252 -- 3,252 -- Other general revenues 594 -- 594 -- Restricted for community resources and public facilities: -- Sales tax, allocated to roads 6,171 -- 6,171 -- Property tax, levied for flood control districts 11,012 -- 11,012 -- Property tax, levied for county service areas 1,411 -- 1,411 -- Property tax, levied for water agency 2,889 -- 2,889 -- Property tax, levied for lighting districts 518 -- 518 -- Property tax, levied for community facilities districts 635 -- 635 -- Property tax, residual distribution from the redevelopment property tax trust fund 10,268 -- 10,268 --
Restricted for public safety:
Property tax, levied for fire district 51,848 -- 51,848 -- Unrestricted investment earnings 753 405 1,158 30 Gain on sale of capital assets 23 -- 23 -- Transfers 36 (36) -- -- Total general revenues and transfers 317,531 369 317,900 30 Change in net position 25,729 14,251 39,980 (267)
Net position ‐ beginning 380,071 102,178 482,249 3,099 Prior period adjustment (Note 26) (5,156) 1,973 (3,183) 18
Net position ‐ beginning, as restated 374,915 104,151 479,066 3,117 Net position ‐ ending 400,644$ 118,402$ 519,046$ 2,850$
The notes to the financial statements are an integral part of this statement.
Program Revenues Primary Government
Net (Expense) Revenue and Changes in Net Position
33
COUNTY OF SANTA BARBARA, CALIFORNIA
BALANCE SHEET
GOVERNMENTAL FUNDSJune 30, 2018 (in thousands)
Public Social BehavioralGeneral Roads Health Services Wellness
Assets and deferred outflows of resourcesAssets:Cash and investments (Note 3) 98,177$ 25,134$ 22,925$ 2,299$ 7,108$ Accounts receivable, net:Taxes 20,297 -- -- -- -- Licenses, permits, and franchises 712 -- -- -- -- Fines, forfeitures, and penalties 29 -- -- -- -- Use of money and property 563 89 85 30 64 Intergovernmental 12,891 1,376 4,422 15,062 6,609 Charges for services 1,680 663 1,678 -- 12,605 Other 870 -- -- 12 67
Due from other funds (Note 20) 1,841 -- -- -- -- Prepaid items 50 -- -- -- -- Other receivables 5,756 -- -- -- 8 Restricted cash and investments (Note 4) 18,389 -- -- -- -- Housing loans receivable -- -- -- -- -- Housing loans interest receivable -- -- -- -- --
Total assets 161,255 27,262 29,110 17,403 26,461
Deferred outflows of resources: (Note 8)Deferred social services -- -- -- 584 --
Total assets and deferred outflows of resources 161,255$ 27,262$ 29,110$ 17,987$ 26,461$
Liabilities, deferred inflows of resources, and fund balances
Liabilities:Accounts payable 7,414$ 1,841$ 830$ 344$ 6,329$ Salaries and benefits payable 10,010 495 2,094 2,760 1,631 Other payables 81 52 408 6 6,279 Advances from grantors and third parties (Note 9) 1,261 6,217 -- 9,428 227 Unearned revenue 1,582 -- -- -- -- Due to other funds (Note 20) 1,329 -- -- 21 425 Customer deposits payable 9,703 165 -- -- --
Total liabilities 31,380 8,770 3,332 12,559 14,891
Deferred inflows of resources: (Note 17)Deferred housing loan payments -- -- -- -- -- Deferred miscellaneous unavailable revenue -- -- -- -- 294
Total deferred inflows of resources -- -- -- -- 294
Fund balances (Note 18):Nonspendable 11,977 -- -- -- -- Restricted 38,002 18,492 19,006 3,644 11,276 Committed 69,305 -- 6,772 1,784 -- Unassigned 10,591 -- -- -- --
Total fund balances 129,875 18,492 25,778 5,428 11,276 Total liabilities, deferred inflows of resources, and
fund balances 161,255$ 27,262$ 29,110$ 17,987$ 26,461$
The notes to the financial statements are an integral part of this statement.
34

Flood Fire Other TotalControl Affordable Protection Capital Governmental GovernmentalDistrict Housing District Projects Funds Funds
Assets and deferred outflows of resourcesAssets:
66,456$ 8,135$ 15,016$ 25,629$ 24,545$ 295,424$ Cash and investments (Note 3)Accounts receivable, net:
-- -- -- -- -- 20,297 Taxes-- -- -- -- -- 712 Licenses, permits, and franchises-- -- -- -- 291 320 Fines, forfeitures, and penalties
251 31 67 47 87 1,314 Use of money and property-- 423 161 10,463 1,142 52,549 Intergovernmental
23 -- 13,288 -- 389 30,326 Charges for services-- 319 266 -- -- 1,534 Other-- -- -- 12 1,317 3,170 Due from other funds (Note 20)-- -- -- -- -- 50 Prepaid items
151 -- 1,479 -- 80 7,474 Other receivables-- 1,991 -- -- 1,174 21,554 Restricted cash and investments (Note 4)-- 38,495 -- -- -- 38,495 Housing loans receivable-- 8,613 -- -- -- 8,613 Housing loans interest receivable
66,881 58,007 30,277 36,151 29,025 481,832 Total assets
Deferred outflows of resources: (Note 8)-- -- -- -- -- 584 Deferred social services
66,881$ 58,007$ 30,277$ 36,151$ 29,025$ 482,416$ Total assets and deferred outflows of resources
Liabilities, deferred inflows of resources, and fund
balances
Liabilities:1,752$ 373$ 593$ 7,721$ 806$ 28,003$ Accounts payable
195 18 2,082 -- 394 19,679 Salaries and benefits payable279 -- -- 235 94 7,434 Other payables
-- 2,485 1,360 6,921 260 28,159 Advances from grantors and third parties (Note 9)
-- -- -- -- -- 1,582 Unearned revenue-- -- -- -- 1,395 3,170 Due to other funds (Note 20)-- -- -- -- (2) 9,866 Customer deposits payable
2,226 2,876 4,035 14,877 2,947 97,893 Total liabilities
Deferred inflows of resources: (Note 17)-- 47,108 -- -- -- 47,108 Deferred housing loan payments-- -- 494 -- -- 788 Deferred miscellaneous unavailable revenue-- 47,108 494 -- -- 47,896 Total deferred inflows of resources
Fund balances (Note 18):155 -- 1,479 -- 80 13,691 Nonspendable
64,500 8,023 24,269 1,616 24,834 213,662 Restricted-- -- -- 19,658 1,164 98,683 Committed-- -- -- -- -- 10,591 Unassigned
64,655 8,023 25,748 21,274 26,078 336,627 Total fund balances
66,881$ 58,007$ 30,277$ 36,151$ 29,025$ 482,416$
Total liabilities, deferred inflows of resources, and
fund balances
Amounts reported for governmental activities in the Statement of Net Position are
different because (Note 3):
Total fund balances ‐ governmental funds 336,627$
Capital assets used in governmental activities are not current financial resources
and, therefore, are not reported in the Balance Sheet. 735,737 Note receivable for governmental activities from the RDA Successor Agency
private‐purpose trust fund. 11,825 Other receivable not due in the current period is not a current financial resource,
therefore, it is not reported in the Balance Sheet. 1,862 Deferred outflows of resources reported in the Statement of Net Position. 341,595 Long‐term liabilities are not due and payable in the current period and, therefore,
are not reported in the Balance Sheet. (1,035,917) Accrued interest on long‐term debt. (192) Other long‐term assets are not available to pay for current period expenditures and,
therefore, are deferred in the governmental funds and recognized as revenue in the
Statement of Activities. 47,896 Deferred inflows of resources reported in the Statement of Net Position. (95,672) Internal Service Funds are used by management to charge the costs of fleet
management, information technology, risk management, communications, and
utility services to individual funds. The assets and liabilities of the Internal Service
Funds are included in the governmental activities in the Statement of Net Position. 56,357 Adjustment for Internal Service Funds are necessary to "close" those funds by charging
additional amounts to participating business‐type activities to completely cover
the Internal Service Funds' costs for the year. 526
Net position of governmental activities 400,644$
35
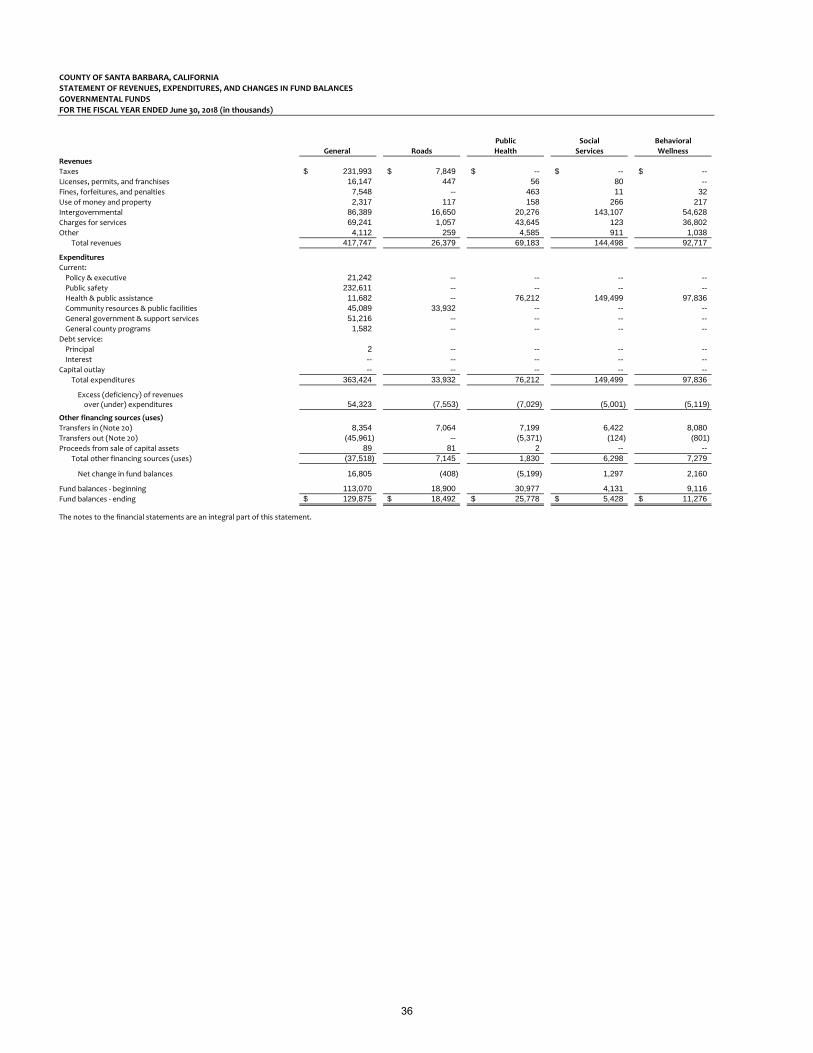
COUNTY OF SANTA BARBARA, CALIFORNIA
STATEMENT OF REVENUES, EXPENDITURES, AND CHANGES IN FUND BALANCES
GOVERNMENTAL FUNDS
FOR THE FISCAL YEAR ENDED June 30, 2018 (in thousands)
Public Social Behavioral
General Roads Health Services Wellness
Revenues
Taxes 231,993$ 7,849$ --$ --$ --$ Licenses, permits, and franchises 16,147 447 56 80 -- Fines, forfeitures, and penalties 7,548 -- 463 11 32 Use of money and property 2,317 117 158 266 217 Intergovernmental 86,389 16,650 20,276 143,107 54,628 Charges for services 69,241 1,057 43,645 123 36,802 Other 4,112 259 4,585 911 1,038
Total revenues 417,747 26,379 69,183 144,498 92,717
Expenditures
Current:
Policy & executive 21,242 -- -- -- -- Public safety 232,611 -- -- -- -- Health & public assistance 11,682 -- 76,212 149,499 97,836 Community resources & public facilities 45,089 33,932 -- -- -- General government & support services 51,216 -- -- -- -- General county programs 1,582 -- -- -- --
Debt service:
Principal 2 -- -- -- -- Interest -- -- -- -- --
Capital outlay -- -- -- -- -- Total expenditures 363,424 33,932 76,212 149,499 97,836
Excess (deficiency) of revenuesover (under) expenditures 54,323 (7,553) (7,029) (5,001) (5,119)
Other financing sources (uses)
Transfers in (Note 20) 8,354 7,064 7,199 6,422 8,080 Transfers out (Note 20) (45,961) -- (5,371) (124) (801) Proceeds from sale of capital assets 89 81 2 -- --
Total other financing sources (uses) (37,518) 7,145 1,830 6,298 7,279
Net change in fund balances 16,805 (408) (5,199) 1,297 2,160
Fund balances ‐ beginning 113,070 18,900 30,977 4,131 9,116 Fund balances ‐ ending 129,875$ 18,492$ 25,778$ 5,428$ 11,276$
The notes to the financial statements are an integral part of this statement.
36

Flood Fire Other Total
Control Affordable Protection Capital Governmental Governmental
District Housing District Projects Funds Funds
Revenues
11,584$ --$ 52,928$ --$ 5,629$ 309,983$ Taxes
-- -- 20 -- 8 16,758 Licenses, permits, and franchises
76 -- 337 -- 2,814 11,281 Fines, forfeitures, and penalties
426 47 123 21 632 4,324 Use of money and property
1,111 1,718 1,524 35,943 21,287 382,633 Intergovernmental
3,767 665 29,197 132 4,984 189,613 Charges for services
8 2,004 503 186 2,649 16,255 Other
16,972 4,434 84,632 36,282 38,003 930,847 Total revenues
Expenditures
Current:
-- -- -- -- -- 21,242 Policy & executive
-- -- 80,538 1 16,023 329,173 Public safety
-- -- -- -- 18,012 353,241 Health & public assistance
20,594 3,373 -- -- 5,573 108,561 Community resources & public facilities
-- -- -- -- 2,347 53,563 General government & support services
-- -- -- -- 8 1,590 General county programs
Debt service:
-- -- -- -- 3,949 3,951 Principal
-- -- -- -- 1,889 1,889 Interest
-- -- -- 39,755 -- 39,755 Capital outlay
20,594 3,373 80,538 39,756 47,801 912,965 Total expenditures
Excess (deficiency) of revenues(3,622) 1,061 4,094 (3,474) (9,798) 17,882 over (under) expenditures
Other financing sources (uses)
34 475 550 3,109 15,795 57,082 Transfers in (Note 20)
-- (879) (3,397) -- (3,136) (59,669) Transfers out (Note 20)
20 -- 82 -- 9 283 Proceeds from sale of capital assets
54 (404) (2,765) 3,109 12,668 (2,304) Total other financing sources (uses)
(3,568) 657 1,329 (365) 2,870 15,578 Net change in fund balances
68,223 7,366 24,419 21,639 23,208 321,049 Fund balances ‐ beginning
64,655$ 8,023$ 25,748$ 21,274$ 26,078$ 336,627$ Fund balances ‐ ending
Amounts reported for governmental activities in the Statement of Activities are different because:
Net change in fund balances ‐ governmental funds 15,578$ Capital assets:
The acquisition of capital assets uses current financial resources but has no effect on net position. 56,309 The cost of capital assets is allocated over their estimated useful lives and reported as (19,340) depreciation/amortization expense in the Statement of Activities.
Proceeds from the sale of capital assets provide current financial resources but have no effect on net position. (283) Net gain on the disposal of capital assets does not affect current financial resources but increases net position. 283 Long‐term debt:
Principal payments on long‐term debt use current financial resources but have no effect on net position. 3,951 Measurement focus:
Revenues in the Statement of Activities that do not provide current financial resources are not reported as 1,899 revenues in the governmental funds.
Some expenses reported in the Statement of Activities do not require the use of current financial resources and, therefore, are not reported as expenditures in governmental funds:
Change in interest payable liability 15 Change in compensated absences liability (589) Change in estimated litigation liability (809) Change in accrued other postemployment benefits (OPEB) liability 2,099 Change in accrued net pension liability (37,832) Amortization of bond premiums/discounts and issuance costs (9) Internal service funds:
Internal service funds are used by management to charge the costs of information technology,
fleet management, risk management, communication services, and utilities to individual funds.
The net revenue of internal service funds is reported within governmental activities. 4,457
Change in net position of governmental activities 25,729$
37

COUNTY OF SANTA BARBARA, CALIFORNIA
STATEMENT OF NET POSITION
PROPRIETARY FUNDS
June 30, 2018 (in thousands)
Governmental
Enterprise Funds Activities‐
Internal
Resource Laguna Service
Recovery Sanitation Total Funds
Assets
Current assets:
Cash and investments (Note 3) 17,649$ 36,931$ 54,580$ 58,931$ Accounts receivable, net:
Licenses, permits, and franchises 2,547 -- 2,547 -- Use of money and property 202 139 341 207 Intergovernmental 36 -- 36 61 Charges for services 2,487 15 2,502 57 Other -- 2 2 --
Inventories 149 26 175 290 Total current assets 23,070 37,113 60,183 59,546
Noncurrent assets:
Other receivables (Note 5) 951 17 968 210 Restricted cash and investments (Note 4) 21,187 -- 21,187 10 Capital assets, not being depreciated/amortized (Note 6) 15,439 7,828 23,267 -- Capital assets, net of accumulated depreciation/amortization (Note 6) 43,183 25,438 68,621 32,169
Total noncurrent assets 80,760 33,283 114,043 32,389 Total assets 103,830 70,396 174,226 91,935
Deferred outflows of resources (Note 8)
Deferred pensions 4,889 1,237 6,126 4,975 Deferred OPEB 228 52 280 222
Total deferred outflows of resources 5,117 1,289 6,406 5,197
Liabilities
Current liabilities:
Accounts payable 1,712 131 1,843 1,051 Salaries and benefits payable 326 83 409 338 Interest payable 18 21 39 -- Other payables 1 -- 1 -- Customer deposits payable 103 1 104 -- Compensated absences (Note 10) 558 121 679 596 Certificates of participation payable (Note 12) 806 -- 806 -- Bonds and notes payable (Note 13) -- 804 804 345 Liability for self‐insurance claims (Note 14) -- -- -- 5,972 Landfill closure/postclosure care costs (Note 16) 1,018 -- 1,018 --
Total current liabilities 4,542 1,161 5,703 8,302
Noncurrent liabilities:
Compensated absences (Note 10) -- -- -- 146 Certificates of participation payable, net (Note 12) 2,960 -- 2,960 -- Bonds and notes payable (Note 13) -- 4,335 4,335 2,890 Liability for self‐insurance claims (Note 14) -- -- -- 13,681 Landfill closure/postclosure care costs (Note 16) 29,245 -- 29,245 -- Net pension liability (Note 22) 12,548 3,174 15,722 12,765 Net OPEB liability (Note 23) 2,185 493 2,678 2,130
Total noncurrent liabilities 46,938 8,002 54,940 31,612 Total liabilities 51,480 9,163 60,643 39,914
Deferred inflows of resources (Note 17)
Deferred pensions 847 214 1,061 861 Total deferred inflows of resources 847 214 1,061 861
Net position
Net investment in capital assets 55,637 28,127 83,764 28,936 Unrestricted 983 34,181 35,164 27,421
Total net position 56,620$ 62,308$ 118,928 56,357$
Adjustment to reflect the allocation of the internal service funds' cumulative net loss (526) Net position of business‐type activities 118,402$
The notes to the financial statements are an integral part of this statement.
Business‐type Activities ‐
38
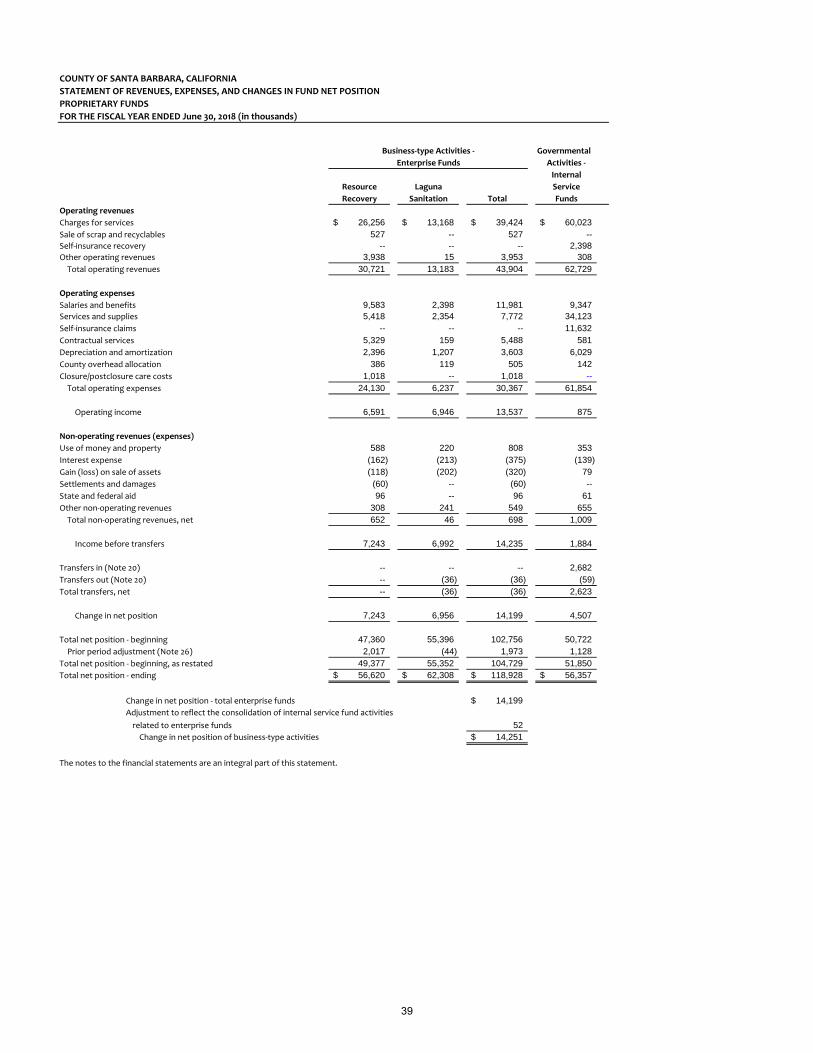
COUNTY OF SANTA BARBARA, CALIFORNIA
STATEMENT OF REVENUES, EXPENSES, AND CHANGES IN FUND NET POSITION
PROPRIETARY FUNDS
FOR THE FISCAL YEAR ENDED June 30, 2018 (in thousands)
Governmental
Enterprise Funds Activities ‐
Internal
Resource Laguna Service
Recovery Sanitation Total Funds
Operating revenues
Charges for services 26,256$ 13,168$ 39,424$ 60,023$ Sale of scrap and recyclables 527 -- 527 -- Self‐insurance recovery -- -- -- 2,398 Other operating revenues 3,938 15 3,953 308 Total operating revenues 30,721 13,183 43,904 62,729
Operating expenses
Salaries and benefits 9,583 2,398 11,981 9,347 Services and supplies 5,418 2,354 7,772 34,123 Self‐insurance claims -- -- -- 11,632 Contractual services 5,329 159 5,488 581 Depreciation and amortization 2,396 1,207 3,603 6,029 County overhead allocation 386 119 505 142 Closure/postclosure care costs 1,018 -- 1,018 -- Total operating expenses 24,130 6,237 30,367 61,854
Operating income 6,591 6,946 13,537 875
Non‐operating revenues (expenses)
Use of money and property 588 220 808 353 Interest expense (162) (213) (375) (139) Gain (loss) on sale of assets (118) (202) (320) 79 Settlements and damages (60) -- (60) -- State and federal aid 96 -- 96 61 Other non‐operating revenues 308 241 549 655 Total non‐operating revenues, net 652 46 698 1,009
Income before transfers 7,243 6,992 14,235 1,884
Transfers in (Note 20) -- -- -- 2,682 Transfers out (Note 20) -- (36) (36) (59) Total transfers, net -- (36) (36) 2,623
Change in net position 7,243 6,956 14,199 4,507
Total net position ‐ beginning 47,360 55,396 102,756 50,722 Prior period adjustment (Note 26) 2,017 (44) 1,973 1,128
Total net position ‐ beginning, as restated 49,377 55,352 104,729 51,850 Total net position ‐ ending 56,620$ 62,308$ 118,928$ 56,357$
Change in net position ‐ total enterprise funds 14,199$ Adjustment to reflect the consolidation of internal service fund activities
related to enterprise funds 52 Change in net position of business‐type activities 14,251$
The notes to the financial statements are an integral part of this statement.
Business‐type Activities ‐
39
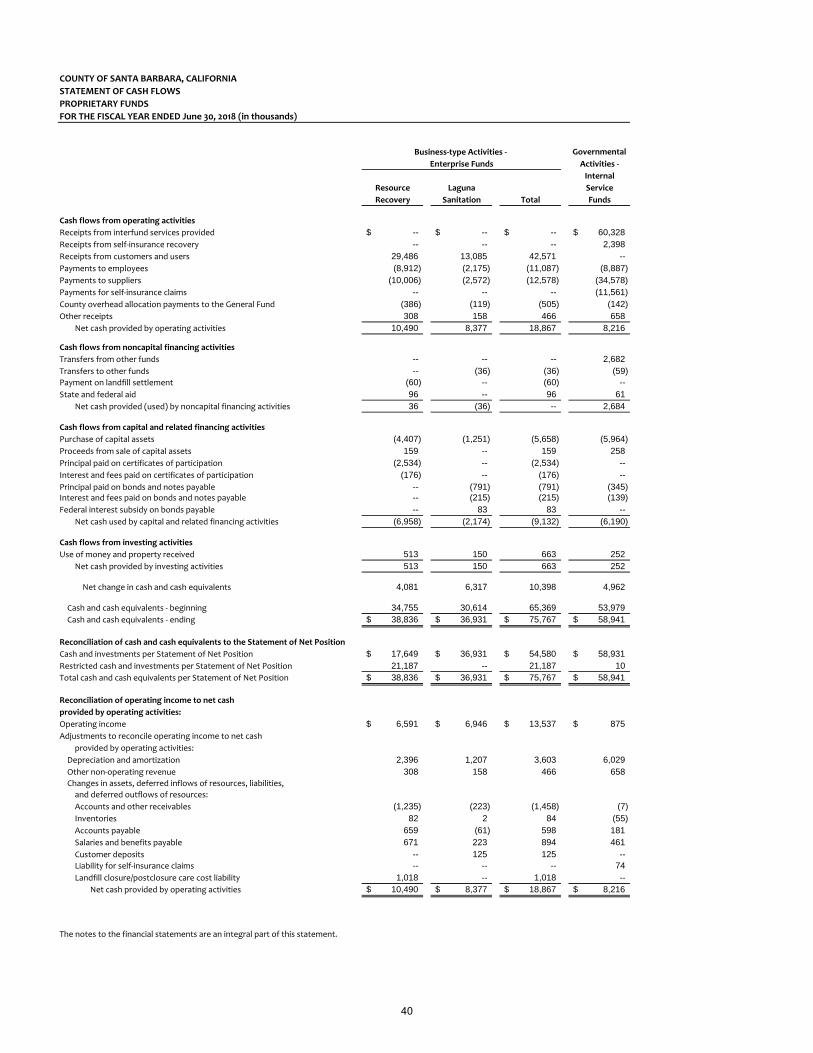
COUNTY OF SANTA BARBARA, CALIFORNIA
STATEMENT OF CASH FLOWS
PROPRIETARY FUNDS
FOR THE FISCAL YEAR ENDED June 30, 2018 (in thousands)
Governmental
Enterprise Funds Activities ‐
Internal
Resource Laguna Service
Recovery Sanitation Total Funds
Cash flows from operating activities
Receipts from interfund services provided --$ --$ --$ 60,328$ Receipts from self‐insurance recovery -- -- -- 2,398 Receipts from customers and users 29,486 13,085 42,571 -- Payments to employees (8,912) (2,175) (11,087) (8,887) Payments to suppliers (10,006) (2,572) (12,578) (34,578) Payments for self‐insurance claims -- -- -- (11,561) County overhead allocation payments to the General Fund (386) (119) (505) (142) Other receipts 308 158 466 658
Net cash provided by operating activities 10,490 8,377 18,867 8,216
Cash flows from noncapital financing activities
Transfers from other funds -- -- -- 2,682 Transfers to other funds -- (36) (36) (59) Payment on landfill settlement (60) -- (60) -- State and federal aid 96 -- 96 61
Net cash provided (used) by noncapital financing activities 36 (36) -- 2,684
Cash flows from capital and related financing activities
Purchase of capital assets (4,407) (1,251) (5,658) (5,964) Proceeds from sale of capital assets 159 -- 159 258 Principal paid on certificates of participation (2,534) -- (2,534) -- Interest and fees paid on certificates of participation (176) -- (176) -- Principal paid on bonds and notes payable -- (791) (791) (345) Interest and fees paid on bonds and notes payable -- (215) (215) (139) Federal interest subsidy on bonds payable -- 83 83 --
Net cash used by capital and related financing activities (6,958) (2,174) (9,132) (6,190)
Cash flows from investing activities
Use of money and property received 513 150 663 252 Net cash provided by investing activities 513 150 663 252
Net change in cash and cash equivalents 4,081 6,317 10,398 4,962
Cash and cash equivalents ‐ beginning 34,755 30,614 65,369 53,979 Cash and cash equivalents ‐ ending 38,836$ 36,931$ 75,767$ 58,941$
Reconciliation of cash and cash equivalents to the Statement of Net Position
Cash and investments per Statement of Net Position 17,649$ 36,931$ 54,580$ 58,931$ Restricted cash and investments per Statement of Net Position 21,187 -- 21,187 10 Total cash and cash equivalents per Statement of Net Position 38,836$ 36,931$ 75,767$ 58,941$
Reconciliation of operating income to net cash
provided by operating activities:
Operating income 6,591$ 6,946$ 13,537$ 875$ Adjustments to reconcile operating income to net cash
provided by operating activities:
Depreciation and amortization 2,396 1,207 3,603 6,029 Other non‐operating revenue 308 158 466 658 Changes in assets, deferred inflows of resources, liabilities,
and deferred outflows of resources:
Accounts and other receivables (1,235) (223) (1,458) (7) Inventories 82 2 84 (55) Accounts payable 659 (61) 598 181 Salaries and benefits payable 671 223 894 461 Customer deposits -- 125 125 -- Liability for self‐insurance claims -- -- -- 74 Landfill closure/postclosure care cost liability 1,018 -- 1,018 --
Net cash provided by operating activities 10,490$ 8,377$ 18,867$ 8,216$
The notes to the financial statements are an integral part of this statement.
Business‐type Activities ‐
40

COUNTY OF SANTA BARBARA, CALIFORNIA
STATEMENT OF FIDUCIARY NET POSITION
FIDUCIARY FUNDS
June 30, 2018 (in thousands)
Investment Private‐purpose Agency
Trust Fund Trust Fund Funds
Assets
Cash and investments (Note 3) 937,938$ 1,332$ 82,011$ Interest receivable 3,471 3 574 Restricted cash and investments (Note 4) -- 1,436 -- Total assets 941,409 2,771 82,585$
Liabilities
Accounts payable -- -- 10,850$ Funds held as agent for others -- -- 71,735 Note payable -- 11,825 -- Total liabilities -- 11,825 82,585$
Net position
Held in trust for:
External pool participants 941,409 -- Redevelopment agency dissolution -- (9,054) Net position held in trust 941,409$ (9,054)$
The notes to the financial statements are an integral part of this statement.
41
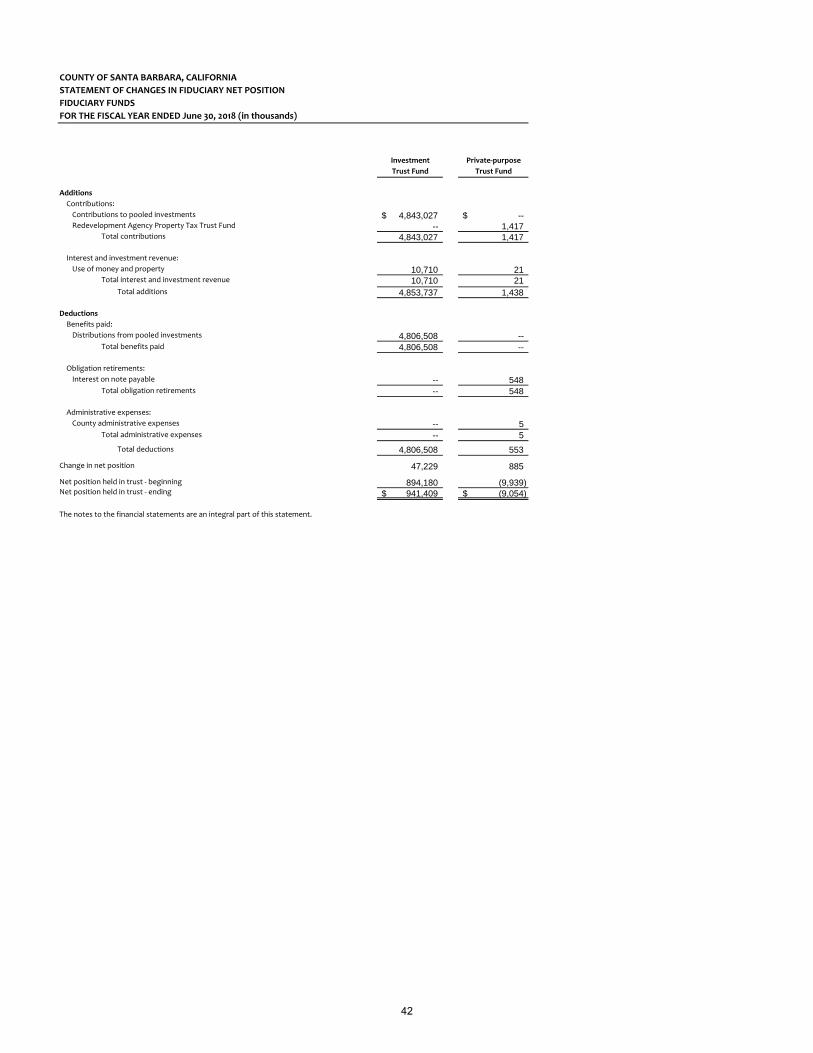
COUNTY OF SANTA BARBARA, CALIFORNIA
STATEMENT OF CHANGES IN FIDUCIARY NET POSITION
FIDUCIARY FUNDS
FOR THE FISCAL YEAR ENDED June 30, 2018 (in thousands)
Investment Private‐purpose
Trust Fund Trust Fund
Additions
Contributions:
Contributions to pooled investments 4,843,027$ --$ Redevelopment Agency Property Tax Trust Fund -- 1,417
Total contributions 4,843,027 1,417
Interest and investment revenue:
Use of money and property 10,710 21 Total interest and investment revenue 10,710 21
Total additions 4,853,737 1,438
Deductions
Benefits paid:
Distributions from pooled investments 4,806,508 -- Total benefits paid 4,806,508 --
Obligation retirements:
Interest on note payable -- 548 Total obligation retirements -- 548
Administrative expenses:
County administrative expenses -- 5 Total administrative expenses -- 5
Total deductions 4,806,508 553
Change in net position 47,229 885
Net position held in trust ‐ beginning 894,180 (9,939) Net position held in trust ‐ ending 941,409$ (9,054)$
The notes to the financial statements are an integral part of this statement.
42

Notes to the Financial Statements
43
COUNTY OF SANTA BARBARA | COMPREHENSIVE ANNUAL FINANCIAL REPORT FISCAL YEAR ENDED JUNE 30, 2018
NOTES TO THE FINANCIAL STATEMENTS ‐ TABLE OF CONTENTS
Table of Contents – Notes to the Financial Statements Page
Reporting Entity and Accounting Policies
Note 1 – Summary of Significant Accounting Policies ........................................................................................... 46
Statement Reconciliation
Note 2 – Reconciliation of Governmentwide and Fund Financial Statements ..................................................... 60
Detailed Notes on All Funds
Note 3 – Cash and Investments .............................................................................................................................. 61 Note 4 – Restricted Cash and Investments ............................................................................................................ 67 Note 5 – Receivables ............................................................................................................................................... 68 Note 6 – Capital Assets ........................................................................................................................................... 69 Note 7 – Service Concession Arrangements (SCA) ................................................................................................ 72 Note 8 – Deferred Outflows of Resources ............................................................................................................ 76 Note 9 – Advances from Grantors and Third Parties ............................................................................................. 77 Note 10 – Long‐term Liabilities ............................................................................................................................... 78 Note 11 – Leases ....................................................................................................................................................... 80 Note 12 – Certificates of Participation (COP) ......................................................................................................... 82 Note 13 – Bonds and Notes Payable ....................................................................................................................... 83 Note 14 – Self‐insurance .......................................................................................................................................... 85 Note 15 – Commitments and Contingencies .......................................................................................................... 87 Note 16 – Landfill Closure and Postclosure Care ................................................................................................... 88 Note 17 – Deferred Inflows of Resources .............................................................................................................. 90 Note 18 – Fund Balances ......................................................................................................................................... 91 Note 19 – Restricted Component of Net Position ................................................................................................. 93 Note 20 – Interfund Transactions ........................................................................................................................... 94 Note 21 – Tax Abatements ...................................................................................................................................... 96
Other Information
Note 22 – Pensions .................................................................................................................................................. 97 Note 23 – Other Postemployment Benefits (OPEB) .............................................................................................. 103 Note 24 – Deferred Compensation Plans ............................................................................................................... 108 Note 25 – Voluntary Termination Benefits ............................................................................................................. 109 Note 26 – Prior Period Adjustments ....................................................................................................................... 109
44

45

COUNTY OF SANTA BARBARA | COMPREHENSIVE ANNUAL FINANCIAL REPORT FISCAL YEAR ENDED JUNE 30,2018
NOTES TO THE FINANCIAL STATEMENTSIN THOUSANDS
1. Summary of Significant Accounting Policies The Reporting Entity The County of Santa Barbara (County), which was established by an act of the Legislature on February 18, 1850, is a legal subdivision of the State of California charged with governmental powers. The County’s powers are exercised through a five member Board of Supervisors (Board) which, as the governing body of the County, is responsible for the legislative and executive control of the County. As required by generally accepted accounting principles (GAAP) in the United States of America, the accompanying financial statements present the activities of the County (the primary government) and its component units. The component units discussed below are included in the County’s reporting entity because of the significance of their operational or financial relationships with the County.
Discrete Component Unit The First 5 Children and Families Commission (Commission) was established by the California Children and Families Act of 1998 (Proposition 10). The Commission invests tobacco tax revenues in programs that improve the lives of children prenatal through age 5 and their families. The Commission is governed by a nine member Board of Commissioners, appointed by the County Board. The Board of Commissioners, as the governing body of the Commission, is responsible for the operation of the Commission. The Commission is discretely presented because its board is not substantively the same as the County's. A separately issued financial report can be obtained online at http://first5santabarbaracounty.org/ or by writing to: First 5 Children and Families Commission, 5385 Hollister Avenue, Building 10, Suite 110, Goleta, CA 93111. Blended Component Units While each of these component units is legally separate from the County, the County is financially accountable for these entities. Financial accountability is primarily demonstrated by the County’s Board acting as, or appointing, the governing board for each of the component units and its ability to impose its will. Because of their relationship with the County and the nature of their operations, component units are, in substance, part of the County’s operations and, accordingly, the activities of these component units are combined, or blended, with the activities of the County for purposes of reporting in the accompanying basic financial statements. Additional detailed information of the County’s component units can be obtained from the County Auditor‐Controller’s office located at 105 East Anapamu Street, Room 303, Santa Barbara, CA 93101. Descriptions of the County’s blended component units are as follows:
Component Unit
Included in the Reporting Entity Because: Separate Financial Statements
County Service Areas: established to provide specific services to distinct geographical areas within the County. These services include street lighting, open space maintenance, library, community sewer sanitation and maintenance, and road maintenance. Revenues consist primarily of property taxes and benefit assessments.
1) Unit’s board is the same as the Board and 2) County Management has operational responsibility
Not available
46

COUNTY OF SANTA BARBARA | COMPREHENSIVE ANNUAL FINANCIAL REPORT FISCAL YEAR ENDED JUNE 30,2018
NOTES TO THE FINANCIAL STATEMENTSIN THOUSANDS
Public and Educational Access: established to receive grant revenue from the local cable television franchisee. The primary objectives and purposes of the fund are the support of educational and public information through programs aimed at expanding public access and educational access to telecommunication services.
1) Unit’s board is the same as the Board and 2) County Management has operational responsibility
Not available
Santa Barbara County Fire Protection District: established to provide a full range of fire services to most of the unincorporated territory of Santa Barbara County; the cities of Buellton, Solvang, and Goleta; and private lands within the National Forest. Revenues consist primarily of property taxes.
1) Unit’s board is the same as the Board and 2) County Management has operational responsibility
Not available
Flood Control and Water Conservation Districts: established to control flood and storm waters and to conserve such waters for beneficial public use. Revenues consist primarily of property taxes and aid from other governmental units.
1) Unit’s board is the same as the Board and 2) County Management has operational responsibility
Not available
Lighting Districts: established to provide operation and maintenance of streetlights in certain areas of the County. Revenues consist primarily of property taxes and benefit assessments.
1) Unit’s board is the same as the Board and 2) County Management has operational responsibility
Not available
Laguna County Sanitation District: established to provide water and sewage treatment services to users. The costs of operating this district are charged to the users in the form of water charges and sewer fees.
1) Unit’s board is the same as the Board and 2) County Management has operational responsibility
Not available
Community Facilities Districts: established to allow for financing of public improvements and services. The services and improvements that can be financed include streets, sewer systems and other basic infrastructure, police protection, fire protection, ambulance services, schools, parks, libraries, museums, and other cultural facilities. Revenues consist primarily of Mello‐Roos property taxes.
1) Unit’s board is the same as the Board and 2) County Management has operational responsibility
Not available
Sandyland Seawall Maintenance District: established to provide for maintenance of a seawall constructed in the Sandyland Cove area. Revenues consist primarily of benefit assessments levied against those properties adjacent to that beachfront area.
1) Unit’s board is the same as the Board and 2) County Management has operational responsibility
Not available
47

COUNTY OF SANTA BARBARA | COMPREHENSIVE ANNUAL FINANCIAL REPORT FISCAL YEAR ENDED JUNE 30,2018
NOTES TO THE FINANCIAL STATEMENTSIN THOUSANDS
Water Agency: established to prepare investigations and reports on the County's water requirements, project development, and importation of water from the State Water Project. The Water Agency provides technical assistance to County departments, water districts, and the public relative to ground water availability and water‐well locations and design. The Water Agency also administers the Cachuma Project and Twitchell Project contracts with the U.S. Bureau of Reclamation.
1) Unit’s board is the same as the Board and 2) County Management has operational responsibility
Not available
In‐Home Supportive Services Public Authority (IHSS): established to act as the employer of record for IHSS individual providers. As an administrative unit, IHSS carries out functions prescribed in Welfare & Institutions Code Section 12301.6. Those functions include a provider screening process, a registry that will match eligible providers and consumers, and collective bargaining with providers and their representatives. IHSS also offers access to training for providers and consumers while continuing to allow for consumer choice in the selection of providers.
1) Unit’s board is the same as the Board and 2) County Management has operational responsibility
Not available
Santa Barbara County Finance Corporation: established on July 28, 1983, this corporation is a nonprofit public benefit corporation and, in general, its purpose is to: purchase, lease or otherwise acquire real property; construct, install or acquire public improvements; operate, maintain, repair or improve real or personal property; and borrow money and become indebted for the purpose of acquiring and improving such property. The corporation facilitates financing for the County and other public entities.
1) Unit provides services almost entirely to the County
Not available
The accompanying financial statements include an Investment Trust Fund that holds assets of numerous self‐governed school and special districts for which the County Treasurer acts as custodian. The financial reporting for these governmental entities, which are independent of the County, is limited to the total amount of cash and investments, and other assets, and the related fiduciary responsibility of the County for disbursement of these assets. The County Auditor‐Controller makes disbursements upon the request of the responsible school or special district officers. Activities of the school and special districts are administered by separate boards and are independent of the County Board. The Board has no effective authority to govern, manage, approve budgets, assume financial accountability, establish revenue limits, or to appropriate surplus funds available in these entities. The accompanying financial statements also include a statutorily required Private‐Purpose Trust Fund for the Santa Barbara County Redevelopment Successor Agency (Successor Agency). The Successor Agency was created to serve, in a fiduciary capacity, as custodian for the assets and to wind down the affairs of the former Redevelopment Agency (RDA). The Successor Agency operates under the auspices of a legislatively formed oversight board who has authority over its financial affairs and supervises its operations and timely dissolution.
48

COUNTY OF SANTA BARBARA | COMPREHENSIVE ANNUAL FINANCIAL REPORT FISCAL YEAR ENDED JUNE 30,2018
NOTES TO THE FINANCIAL STATEMENTSIN THOUSANDS
Its assets are held in trust for the benefit of the taxing entities within the former RDA boundaries and as such are not available for County use.
New Accounting Pronouncements The following Governmental Accounting Standards Board (GASB) Statements have been implemented in the current financial statements:
Statement No. 75 "Accounting and Financial
Reporting for Postemployment
Benefits Other Than Pensions"
The provisions of this statement are effective for periods
beginning after June 15, 2017. (FY 17/18)
Statement No. 81 "Irrevocable Split‐Interest
Agreements"
The requirements of this statement are effective for periods
beginning after December 15, 2016. (FY 17/18)
Statement No. 85 "Omnibus 2017" The requirements of this statement are effective for periods
beginning after June 15, 2017. (FY 17/18)
Statement No. 86 "Certain Debt Extinguishment
Issues"
The requirements of this statement are effective for periods
beginning after June 15, 2017. (FY 17/18)
Financial Statements In accordance with GASB Statement No. 34, “Basic Financial Statements and Management’s Discussion and Analysis for State and Local Governments,” the financial statements consist of the following:
Governmentwide financial statements,
Fund financial statements, and
Notes to the financial statements. The governmentwide financial statements consist of the Statement of Net Position and the Statement of Activities and report information on all of the nonfiduciary activities of the primary government and its component units. All internal balances in the Statement of Net Position have been eliminated, with the exception of those representing balances between the governmental activities and the business‐type activities, which are presented as internal balances and eliminated in the total government column. The Statement of Activities presents function revenue and expenses of governmental activities and business‐type activities. Governmental activities, which normally are supported by taxes and intergovernmental revenues, are reported separately from business‐type activities, which rely to a significant extent on fees and charges for support. In the Statement of Activities, internal service funds’ revenue and expenses related to interfund services have been eliminated. Revenue and expenses related to services provided to external customers have not been eliminated and are presented within governmental activities. As a general rule, interfund activities (e.g., interfund transfers and interfund reimbursements) have been eliminated in the governmentwide Statement of Activities. Exceptions to the general rule are interfund services provided and used between functions, such as mental health services provided to certain inmates at the County jail. Elimination of these interfund activities would distort the direct costs and program revenues reported for the various functions concerned.
49

COUNTY OF SANTA BARBARA | COMPREHENSIVE ANNUAL FINANCIAL REPORT FISCAL YEAR ENDED JUNE 30,2018
NOTES TO THE FINANCIAL STATEMENTSIN THOUSANDS
The governmentwide financial statements distinguish functions of the County that are principally supported by taxes and intergovernmental revenues (governmental activities) from other functions that are intended to recover all or a significant portion of their costs through user fees and charges (business‐type activities). The governmental activities of the County include policy and executive, public safety, health and public assistance, community resources and public facilities, general government and support services, and general County programs. The business‐type activities of the County include resource recovery and waste management and sanitation operations.
The Statement of Activities demonstrates the degree to which the direct and indirect expenses of a given function or segment are offset by program revenues. Direct expenses are those that are clearly identifiable with a specific function or segment. Indirect expenses are allocated based on the annual Countywide Cost Allocation Plan which allocates the cost of central service departments to service user departments. Costs allocated in the Cost Allocation Plan include administrative and support costs such as budget preparation and oversight, County counsel, landscaping, payroll, utilities, and facilities maintenance. Program revenues include (1) charges to customers or applicants who purchase, use, or directly benefit from goods, services, or privileges provided by a given function or segment, and (2) grants and contributions, including special assessments, that are restricted to meeting the operational or capital requirements of a particular function or segment. Taxes and other items properly excluded from program revenues are reported as general revenues. Separate fund financial statements are provided for governmental funds, proprietary funds, and fiduciary funds, even though the latter are excluded from the governmentwide financial statements. Major individual governmental funds and major individual enterprise funds are reported as separate columns in the fund financial statements. Measurement Focus, Basis of Accounting, and Financial Statement Presentation The governmentwide financial statements are reported using the economic resources measurement focus and the accrual basis of accounting, as are the proprietary funds and fiduciary funds’ financial statements, with the exception of agency funds, which have no measurement focus. Revenues are recorded when earned and expenses are recorded when a liability is incurred, regardless of the timing of related cash flows. Property taxes are recognized as revenues in the year for which they are levied. Grants and similar items are recognized as a deferred inflow of resources as soon as all eligibility requirements have been met, except for the timing requirement. Governmental funds financial statements are reported using the current financial resources measurement focus and the modified accrual basis of accounting. Revenues are recognized as soon as they are both measurable and available. Revenues are considered to be available when they are collectible within the current period or soon enough thereafter to pay liabilities of the current period. The County, in general, considers revenues available if they are collected within 180 days after fiscal year‐end, except for property taxes, which the County considers available if they are collected within 60 days after fiscal year‐end. Grants, Medi‐Cal reimbursements and similar items are recognized as revenue as soon as all eligibility requirements have been met. Expenditures that meet accrual criteria are recorded when the related fund liability is incurred, except for unmatured interest on general long‐term debt which is recognized when due, and certain compensated absences, and claims and judgments which are recognized when payment is due. For the governmental funds financial statements, the County considers all revenues susceptible to accrual and recognizes revenue if the accrual criteria are met. Specifically, sales taxes, franchise taxes, licenses, interest, special assessments, charges for services and other miscellaneous revenue are all considered to be susceptible to accrual, and have been recognized as revenue in the current fiscal period. Entitlements and shared revenues are recorded at the time of receipt or earlier if the susceptible to accrual criteria are met. All expenditure‐driven grants are recorded at the time of receipt or earlier. If qualifying expenditures have been incurred and all other eligibility requirements have been met, expenditure‐driven grants are recognized as revenue. When all eligibility
50
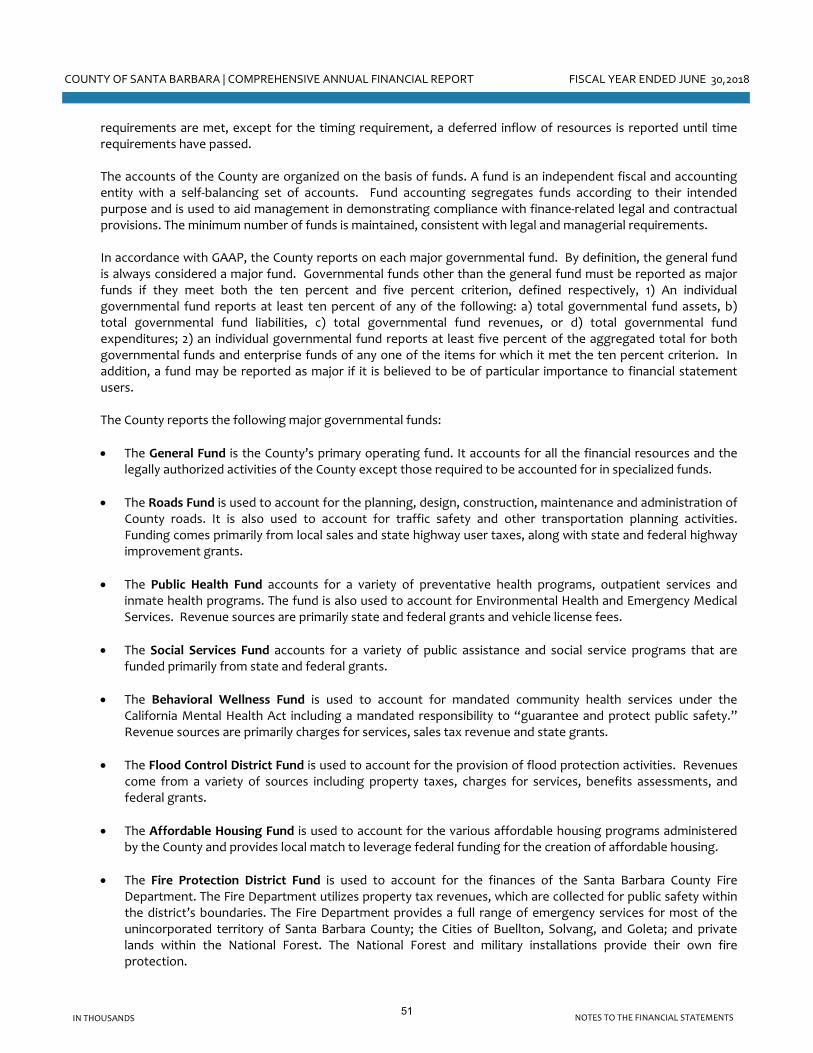
COUNTY OF SANTA BARBARA | COMPREHENSIVE ANNUAL FINANCIAL REPORT FISCAL YEAR ENDED JUNE 30,2018
NOTES TO THE FINANCIAL STATEMENTSIN THOUSANDS
requirements are met, except for the timing requirement, a deferred inflow of resources is reported until time requirements have passed. The accounts of the County are organized on the basis of funds. A fund is an independent fiscal and accounting entity with a self‐balancing set of accounts. Fund accounting segregates funds according to their intended purpose and is used to aid management in demonstrating compliance with finance‐related legal and contractual provisions. The minimum number of funds is maintained, consistent with legal and managerial requirements. In accordance with GAAP, the County reports on each major governmental fund. By definition, the general fund is always considered a major fund. Governmental funds other than the general fund must be reported as major funds if they meet both the ten percent and five percent criterion, defined respectively, 1) An individual governmental fund reports at least ten percent of any of the following: a) total governmental fund assets, b) total governmental fund liabilities, c) total governmental fund revenues, or d) total governmental fund expenditures; 2) an individual governmental fund reports at least five percent of the aggregated total for both governmental funds and enterprise funds of any one of the items for which it met the ten percent criterion. In addition, a fund may be reported as major if it is believed to be of particular importance to financial statement users. The County reports the following major governmental funds:
The General Fund is the County’s primary operating fund. It accounts for all the financial resources and the legally authorized activities of the County except those required to be accounted for in specialized funds.
The Roads Fund is used to account for the planning, design, construction, maintenance and administration of County roads. It is also used to account for traffic safety and other transportation planning activities. Funding comes primarily from local sales and state highway user taxes, along with state and federal highway improvement grants.
The Public Health Fund accounts for a variety of preventative health programs, outpatient services and inmate health programs. The fund is also used to account for Environmental Health and Emergency Medical Services. Revenue sources are primarily state and federal grants and vehicle license fees.
The Social Services Fund accounts for a variety of public assistance and social service programs that are funded primarily from state and federal grants.
The Behavioral Wellness Fund is used to account for mandated community health services under the California Mental Health Act including a mandated responsibility to “guarantee and protect public safety.” Revenue sources are primarily charges for services, sales tax revenue and state grants.
The Flood Control District Fund is used to account for the provision of flood protection activities. Revenues come from a variety of sources including property taxes, charges for services, benefits assessments, and federal grants.
The Affordable Housing Fund is used to account for the various affordable housing programs administered by the County and provides local match to leverage federal funding for the creation of affordable housing.
The Fire Protection District Fund is used to account for the finances of the Santa Barbara County Fire Department. The Fire Department utilizes property tax revenues, which are collected for public safety within the district’s boundaries. The Fire Department provides a full range of emergency services for most of the unincorporated territory of Santa Barbara County; the Cities of Buellton, Solvang, and Goleta; and private lands within the National Forest. The National Forest and military installations provide their own fire protection.
51
COUNTY OF SANTA BARBARA | COMPREHENSIVE ANNUAL FINANCIAL REPORT FISCAL YEAR ENDED JUNE 30,2018
NOTES TO THE FINANCIAL STATEMENTSIN THOUSANDS
The Capital Projects Fund is used to account for financial resources used in constructing major facilities.
Proprietary funds distinguish operating revenues and expenses from non‐operating items. Operating revenues and expenses generally result from providing services and producing and delivering goods in connection with a proprietary fund’s principal ongoing operations. The principal operating revenues of the Resource Recovery and Laguna Sanitation enterprise funds and of the County’s internal service funds are charges to customers for sales and services. Operating expenses for enterprise funds and internal service funds include the cost of sales and services, administrative expenses, and depreciation/amortization on capital assets. All revenues and expenses not meeting this definition are reported as non‐operating revenues and expenses. The County reports the following proprietary funds:
The Resource Recovery and Waste Management Fund (Resource Recovery) accounts for the activities of refuse collection, disposal, landfill operations, and recycling programs.
The Laguna County Sanitation District Fund (Laguna Sanitation) accounts for the activities of sewer collection and sewage treatment in the Orcutt area.
Internal Service Funds account for vehicle operations, risk management, information technology, communications operations, and utilities operations that provide services to other departments or agencies of the County, or to other governments, on a cost reimbursement basis.
Fiduciary funds include all Trust and Agency funds, which account for assets held by the County as a trustee, or as an agent for individuals or other government units.
The County reports the following fiduciary funds:
The Investment Trust Fund accounts for the external portion of the County Treasurer’s investment pool, which commingles resources of legally separate local governments within the County in an investment portfolio for the benefit of all participants. These entities include school and community college districts, other special districts governed by local boards, and regional boards and authorities. The County separately maintains these entities’ money in 397 individual funds; these funds represent the assets, primarily cash and investments, and the related liability of the County to disburse these monies on demand.
The Private‐Purpose Trust Fund is a fiduciary fund type used by the County to report trust arrangements under which principal and income benefit other governments. This fund reports the assets, liabilities, and activities of the Santa Barbara County Redevelopment Successor Agency (Successor Agency).
Agency Funds are custodial in nature and do not involve measurement of results of operations. Such funds have no equity accounts since all assets are due to individuals or entities at some future time. These funds (including Clearing and Revolving Funds, Deposits Funds, Other Agency Funds, State and City Revenue Funds, and Tax Collection Funds) account for assets held by the County in an agency capacity for individuals or other government units. The County reports on 185 different agency funds.
Cash and Investments The County’s cash and cash equivalents for Statement of Cash Flows purposes are considered to be cash on hand, demand deposits, restricted cash, and investments held by the County Treasurer in a cash management investment pool (Pool). The County has stated required investments at fair value in the accompanying financial statements using the fair value measurement within the fair value hierarchy established by GAAP.
52

COUNTY OF SANTA BARBARA | COMPREHENSIVE ANNUAL FINANCIAL REPORT FISCAL YEAR ENDED JUNE 30,2018
NOTES TO THE FINANCIAL STATEMENTSIN THOUSANDS
The Pool is not registered as an investment company with the Securities and Exchange Commission (SEC) nor is it an SEC Rule 2a7‐like pool. California Government Code statutes and the County Treasury Oversight Committee set forth the various investment policies that the County Treasurer must follow. The Air Pollution Control District and the Santa Barbara County Association of Governments, as well as the public school districts, cemetery districts, fire protection districts, pest control districts, recreation and park districts, and resource conservation districts within the County are required by legal provisions to participate in the County’s investment pool. The deposits held for these districts are included in the Investment Trust Fund.
Accounts Receivable and Payable The County only accrues revenues at fiscal year‐end and accrues only those revenues it deems collectible; as such, the County has no allowance for uncollectible accounts. The County expects to collect all accounts receivable within one year. County policy requires that all revenues and expenditures greater than $5 be accrued at fiscal year‐end, while revenues and expenditures under $5 may be accrued at fiscal year‐end at the discretion of individual departments. The County levies, collects, and apportions property taxes for all taxing jurisdictions within the County including school and special districts. Article XIIIB of the State of California Constitution limits the property tax levy to support general government services of the various taxing jurisdictions to one dollar per 100 dollars of full cash value. Taxes levied to service voter‐approved debt are excluded from this limitation. Secured property taxes are levied in September of each year based upon the assessed valuation as of the previous January 1 (lien date). They are payable in two equal installments due on November 1 and February 1 and are considered delinquent with penalties after December 10 and April 10, respectively. Unsecured property taxes are due on the January 1 lien date and become delinquent with penalties after August 31. Since Fiscal Year (FY) 93‐94, the County has used an alternative property tax distribution method referred to as the “Teeter Plan.” This method allows for a 100% distribution of the current tax levy to California entities electing the alternative method, as compared to the previous method where only the current levy less any delinquent taxes was distributed. This results in the General Fund receiving distributions of approximately 50‐55% in December, 40‐45% in April and the remaining 5% in June of each year. This method also provides that all of the delinquent penalties and redemption penalties of the participating entity flow to the County’s General Fund. All County entities receiving property taxes were required by statute to participate once the alternative method was elected. All delinquent taxes are recorded as accounts receivable in the General Fund. At June 30, 2018, property taxes receivable of $20,297 are recorded in the General Fund. In addition, the Teeter Plan requires that a property tax loss reserve be maintained in an amount equal to 1% of the current year’s secured tax levy, which is shown as a nonspendable portion of fund balance in the General Fund (see Note 18).
Deferred Outflows and Inflows of Resources Pursuant to GASB Statement No. 63, “Financial Reporting of Deferred Outflows of Resources, Deferred Inflows of Resources, and Net Position,” and GASB Statement No. 65, “Items Previously Reported as Assets and Liabilities,” the County recognizes deferred outflows of resources and/or deferred inflows of resources in the government‐wide statement of net position, governmental funds balance sheets, and proprietary funds statement of net position. In addition to assets, the financial statements will sometimes report a separate section for deferred outflows of resources. Deferred outflows of resources represent a consumption of net position by the County that is applicable to a future reporting period and will not be recognized as an outflow of resources (expense/expenditures) until that time. Refer to Note 8 for a detailed listing of the deferred outflows of resources the County has recognized.
53

COUNTY OF SANTA BARBARA | COMPREHENSIVE ANNUAL FINANCIAL REPORT FISCAL YEAR ENDED JUNE 30,2018
NOTES TO THE FINANCIAL STATEMENTSIN THOUSANDS
In addition to liabilities, the financial statements will sometimes report a separate section for deferred inflows of resources. Deferred inflows of resources represent an acquisition of net position by the County that is applicable to a future reporting period and will not be recognized as an inflow of resources (revenue or a credit to expense) until that time. Refer to Note 17 for a detailed listing of the deferred inflows of resources the County has recognized. Interfund Receivables and Payables Transactions between funds that are representative of lending/borrowing arrangements outstanding at the end of the fiscal year are referred to as “advances to/from other funds” (i.e., the noncurrent portion of interfund loans). All other outstanding balances between funds are reported as “due to/from other funds.” Any residual balances outstanding between the governmental activities and business‐type activities are reported in the governmentwide financial statements as “internal balances.” In the governmental funds financial statements, advances between funds are offset by a corresponding nonspendable portion of fund balance to indicate that they are not available for appropriation and are not expendable available financial resources. Inventories and Prepaid Items Inventories for both governmental and proprietary funds, consisting principally of materials and supplies held for consumption, are valued at cost, approximating market value, using the first‐in, first‐out (FIFO) method. The costs of governmental funds inventories are recorded as expenditures when consumed, rather than when purchased. Certain payments to vendors reflect costs applicable to future accounting periods and are recorded as prepaid items in both the governmentwide and fund financial statements. The cost of prepaid items is recorded as expenditures/expenses when consumed rather than when purchased. The inventories and prepaid items recorded in the governmental funds do not reflect current appropriable resources and, thus, an equivalent portion of fund balance is reported as nonspendable.
Capital Assets Capital assets include land, land improvements, structures and improvements (e.g., office buildings and building improvements), equipment (e.g., vehicles, machinery and computers), infrastructure (e.g., roads, bridges, sidewalks, and similar items), and intangible assets (e.g., land easements and computer software). Pursuant to GASB Statement No. 60, “Accounting and Financial Reporting for Service Concession Arrangements,” the County also includes capital assets held by Service Concession Arrangements (SCA). Capital assets are reported in the applicable governmental or business‐type activities columns in the governmentwide financial statements. If purchased or constructed, the capital assets are reported at historical or estimated historical cost. Capital assets received by the County in an SCA and donated capital assets, including works of art and historical treasures, are recorded at the estimated acquisition value at the date of donation. The costs of normal maintenance and repairs that do not add to the value of the asset or materially extend asset lives are not capitalized. The capitalization thresholds are $0 for land, $5 for equipment, and $100 for land improvements, buildings and improvements, infrastructure, and computer software.
54
COUNTY OF SANTA BARBARA | COMPREHENSIVE ANNUAL FINANCIAL REPORT FISCAL YEAR ENDED JUNE 30,2018
NOTES TO THE FINANCIAL STATEMENTSIN THOUSANDS
Capital assets, with the exception of non‐depreciable land, are depreciated/amortized using the straight‐line method over the following estimated useful lives:
Land improvements: Parking lots, sidewalks, outdoor lighting, landscaping, drainage and irrigation systems 5 to 50 years Buildings & improvements: Office buildings 20 to 100 years Building improvements 5 to 50 years Equipment: Automobiles and light trucks 5 to 10 years Construction and maintenance vehicles 5 to 20 years General machinery and office equipment 2 to 25 years Infrastructure: Pavement and traffic signals 15 to 30 years Bridges 40 to 75 years All other 20 to 99 years Intangible assets: Computer software 2 to 10 years
Outlays for capital assets and improvements are capitalized, as projects are constructed, in accordance with the County’s capitalization policy. Interest and indirect costs incurred during the construction phase of capital assets of proprietary funds are reflected in the capitalized value of the asset constructed. Depreciation/amortization expense is allocated to functions/programs and included as a direct expense in the Statement of Activities. Capital assets that are under construction or development and have not been completed are put into Work in Progress and are presented as a capital asset not being depreciated on the Statement of Net Position. Lease Obligations The County leases various assets under both operating and capital lease agreements. In the governmentwide and proprietary funds’ financial statements, capital leases and the related lease obligations are reported as liabilities in the applicable governmental activities or proprietary funds Statement of Net Position. Long-term Debt In the governmentwide and proprietary funds financial statements, long‐term debt and other long‐term obligations are reported as liabilities in the applicable governmental activities or proprietary funds Statement of Net Position. Bond premiums and discounts are amortized over the life of the bond and issuance costs are expensed in the year incurred. In the governmental funds financial statements, bond premiums, discounts, and issuance costs are recognized in the period issued. Bond proceeds are reported as other financing sources net of the applicable premium or discount. Issuance costs, even if withheld from the actual net proceeds received, are reported as debt service expenditures. Interest is reported as an expenditure in the period in which the related payment is made. The matured portion of long‐term debt (i.e., portion that has come due for payment) is reported as a liability in the fund financial statement of the related fund. Compensated Absences County policy permits employees to accumulate earned but unused vacation, holiday, and sick pay benefits. County policy states that unused sick leave shall not be cashed out at time of separation from service with the
55
COUNTY OF SANTA BARBARA | COMPREHENSIVE ANNUAL FINANCIAL REPORT FISCAL YEAR ENDED JUNE 30,2018
NOTES TO THE FINANCIAL STATEMENTSIN THOUSANDS
County; therefore, no liability for unpaid accumulated sick leave exists. Employees eligible for full retirement benefits, however, may convert their unused sick leave to up to one year’s service credit in determining their retirement benefits. All vacation and holiday pay is accrued when incurred in the governmentwide and proprietary funds’ financial statements. In the governmental funds financial statements, a liability for these amounts is reported only if they have matured, for example, as a result of employee resignations or retirements prior to year‐end, and payment of the liability is made subsequent to year‐end. This is in accordance with GASB Interpretation No. 6, “Recognition and Measurement of Certain Liabilities and Expenditures in Governmental Fund Financial Statements.” Pensions
In governmentwide financial statements, retirement plans (pensions) are required to be recognized and disclosed using the accrual basis of accounting (see Note 22 and the required supplementary information (RSI) section immediately following the Notes to Financial Statements), regardless of the amount recognized as pension expenditures on the governmental fund statements, which use the modified accrual basis of accounting.
In general, the County recognizes a net pension liability, which represents the County’s proportionate share of the excess of the total pension liability over the fiduciary net position of the pension reflected in the actuarial report provided by the Santa Barbara County Employees’ Retirement System (SBCERS). The net pension liability is measured as of the County’s prior fiscal year‐end. Changes in the net pension liability are recorded, in the period incurred, as pension expense or as deferred inflows of resources or deferred outflows of resources depending on the nature of the change. The changes in net pension liability that are recorded as deferred inflows of resources or deferred outflows of resources (that arise from changes in actuarial assumptions or other inputs and differences between expected or actual experience) are amortized over the weighted average remaining service life of all participants in the respective pension plan and are recorded as a component of pension expense beginning with the period in which they are incurred. For purposes of measuring the net pension liability and deferred outflows/inflows of resources relating to pensions and pension expense, information about the fiduciary net position of the County’s pension plan with SBCERS and additions to/deductions from the plan’s fiduciary net position have been determined on the same basis as they are reported by SBCERS. For this purpose, benefit payments (including refunds of employee contributions) are recognized when due and payable in accordance with the benefits’ terms. Investments are reported at fair value.
Projected earnings on pension investments are recognized as a component of pension expense. Differences between projected and actual investment earnings are reported as deferred inflows of resources or deferred outflows of resources and amortized as a component of pension expense on a closed basis over a five‐year period beginning with the period in which the difference occurred. Each subsequent year will incorporate an additional closed basis five‐year period of recognition. Other Postemployment Benefits (OPEB)
For purposes of measuring the net OPEB liability, deferred outflows of resources and deferred inflows of resources related to OPEB, and OPEB expense, information about the fiduciary net position of the County’s OPEB Plan (OPEB Plan) and additions to/deductions from the OPEB Plan’s fiduciary net position have been determined on the same basis as they are reported by Santa Barbara County Employees’ Retirement System (SBCERS). For this purpose, the OPEB Plan recognizes benefit payments when due and payable in accordance with the benefit terms. Investments are reported at fair value, except for money market investments and participating interest‐earning investment contracts that have a maturity at the time of purchase of one year or less, which are reported at cost.
56

COUNTY OF SANTA BARBARA | COMPREHENSIVE ANNUAL FINANCIAL REPORT FISCAL YEAR ENDED JUNE 30,2018
NOTES TO THE FINANCIAL STATEMENTSIN THOUSANDS
Fund Equity In the fund financial statements, in accordance with GASB Statement No. 54, “Fund Balance Reporting and Governmental Fund Type Definitions,” governmental funds report fund balance as nonspendable, restricted, committed, assigned or unassigned based primarily on the extent to which the County is bound to honor constraints on how specific amounts can be spent.
Nonspendable fund balance – amounts that cannot be spent because they are either (a) not spendable in form; or (b) legally or contractually required to be maintained intact.
Restricted fund balance – amounts with constraints placed on their use that are either (a) externally imposed by creditors, grantors, contributors, or laws or regulations of other governments; or (b) imposed by law through constitutional provisions or enabling legislation.
Committed fund balance – amounts that can only be used for specific purposes determined by formal action of the County’s highest level of decision‐making authority (the Board) and that remain binding unless removed in the same manner. The underlying action that imposed the limitation needs to occur no later than the close of the reporting period.
Assigned fund balance – amounts that are constrained by the County’s intent to be used for specific purposes. The intent can be established at either the highest level of decision‐making authority, or by a body or an official designated for that purpose. This is also the classification for residual funds in the County’s special revenue funds. As a result of limitations imposed by the California County Budget Act, this classification is currently not used by the County.
Unassigned fund balance – the residual classification for the County’s General Fund that includes amounts not contained in the other classifications. The General Fund should be the only fund that reports a positive unassigned fund balance amount. In other funds, if expenditures incurred for specific purposes exceed the amounts restricted, committed, or assigned to those purposes, it may be necessary to report a negative unassigned fund balance.
The Board establishes, modifies or rescinds fund balance commitments and assignments by passage of an ordinance or resolution (ordinances and resolutions are considered of equal authority with respect to fund balance). This is done through adoption of the budget and subsequent budget amendments that occur throughout the year. When both restricted and unrestricted resources are available for use, it is the County’s policy to use Restricted fund balance resources first, followed by the unrestricted resources in the Committed and Unassigned fund balances, as they are needed.
Fund Balance Policy The County believes that sound financial management principles require that sufficient funds be retained by the County to provide a stable financial base at all times. To retain this stable financial base, the County needs to maintain unrestricted fund balance in its County funds sufficient to fund cash flows of the County and to provide financial reserves for unanticipated expenditures and/or revenue shortfalls of an emergency nature. Committed and unassigned fund balances are considered unrestricted. The purpose of the County’s fund balance policy is to maintain a prudent level of financial resources to protect against reducing service levels or raising taxes and fees because of temporary revenue shortfalls or unpredicted one‐time expenditures. The County has adopted a policy to achieve and maintain unrestricted fund balance in the General Fund of 15% of operating revenue (approximately 60 days working capital) at the close of each fiscal year, consistent with the recommended level promulgated by the Government Finance Officers Association (GFOA).
57

COUNTY OF SANTA BARBARA | COMPREHENSIVE ANNUAL FINANCIAL REPORT FISCAL YEAR ENDED JUNE 30,2018
NOTES TO THE FINANCIAL STATEMENTSIN THOUSANDS
Additional detailed information, along with the complete Fund Balance Policy, can be obtained from the County Auditor‐Controller’s office located at 105 East Anapamu Street, Room 303, Santa Barbara, CA 93102.
Strategic Reserve Policy The County has established a separate committed fund balance account known as the Strategic Reserve. The target funding level for the Strategic Reserve is an amount equivalent to 8% of operating revenue (approximately 30 days working capital) for the General Fund. Funding for the Strategic Reserve is appropriated annually by the Board as part of the budget approval process. The purpose of the County’s Strategic Reserve is to:
1. Mitigate economic downturns that reduce County general revenue; 2. Mitigate state or federal budget actions that may reduce County revenue; 3. Maintain core service levels essential to public health, safety, and welfare; 4. Front‐fund or completely fund, if necessary, disaster costs or costs associated with emergencies. Only
those events that have been legally declared to be a disaster at the local, state, or federal level are eligible for funding from the Strategic Reserve; and
5. Absorb liability settlements in excess of available resources in the County’s committed litigation fund balance.
The monies in the Strategic Reserve are separate monies used only for the purposes stated above. The funds are used only to support the operating budget when general revenue increases less than 3% from the prior fiscal year. Any transfer of funds is approved by the Board and does not exceed the amount sufficient to balance the General Fund. Transfers require approval by 3/5 vote during budget hearings and 4/5 vote at all other times during the fiscal year in accordance with the County Budget Act. As of June 30, 2018, the County’s Strategic Reserve fund balance was $23,717. Use of Estimates The preparation of financial statements in conformity with GAAP requires management to make estimates and assumptions that affect the reported amounts of certain assets and liabilities, disclosures of contingent assets and liabilities at the date of the financial statements, and the reported amounts of revenues and expenditures during the reporting period. Actual results could differ from those estimates.
Reclassifications Certain prior year balances may have been reclassified in order to conform to current year presentation. These reclassifications had no effect upon reported net position.
58
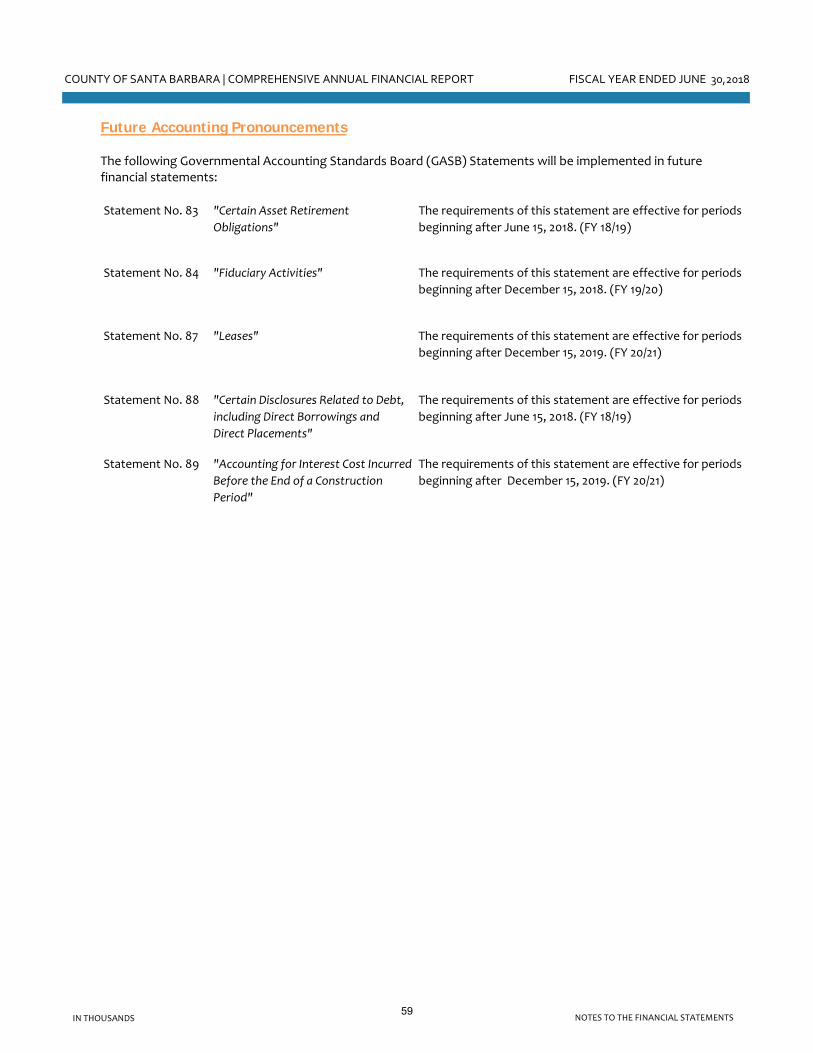
COUNTY OF SANTA BARBARA | COMPREHENSIVE ANNUAL FINANCIAL REPORT FISCAL YEAR ENDED JUNE 30,2018
NOTES TO THE FINANCIAL STATEMENTSIN THOUSANDS
Future Accounting Pronouncements
The following Governmental Accounting Standards Board (GASB) Statements will be implemented in future financial statements:
Statement No. 83 "Certain Asset Retirement
Obligations"
The requirements of this statement are effective for periods
beginning after June 15, 2018. (FY 18/19)
Statement No. 84 "Fiduciary Activities" The requirements of this statement are effective for periods
beginning after December 15, 2018. (FY 19/20)
Statement No. 87 "Leases" The requirements of this statement are effective for periods
beginning after December 15, 2019. (FY 20/21)
Statement No. 88 "Certain Disclosures Related to Debt,
including Direct Borrowings and
Direct Placements"
The requirements of this statement are effective for periods
beginning after June 15, 2018. (FY 18/19)
Statement No. 89 "Accounting for Interest Cost Incurred
Before the End of a Construction
Period"
The requirements of this statement are effective for periods
beginning after December 15, 2019. (FY 20/21)
59
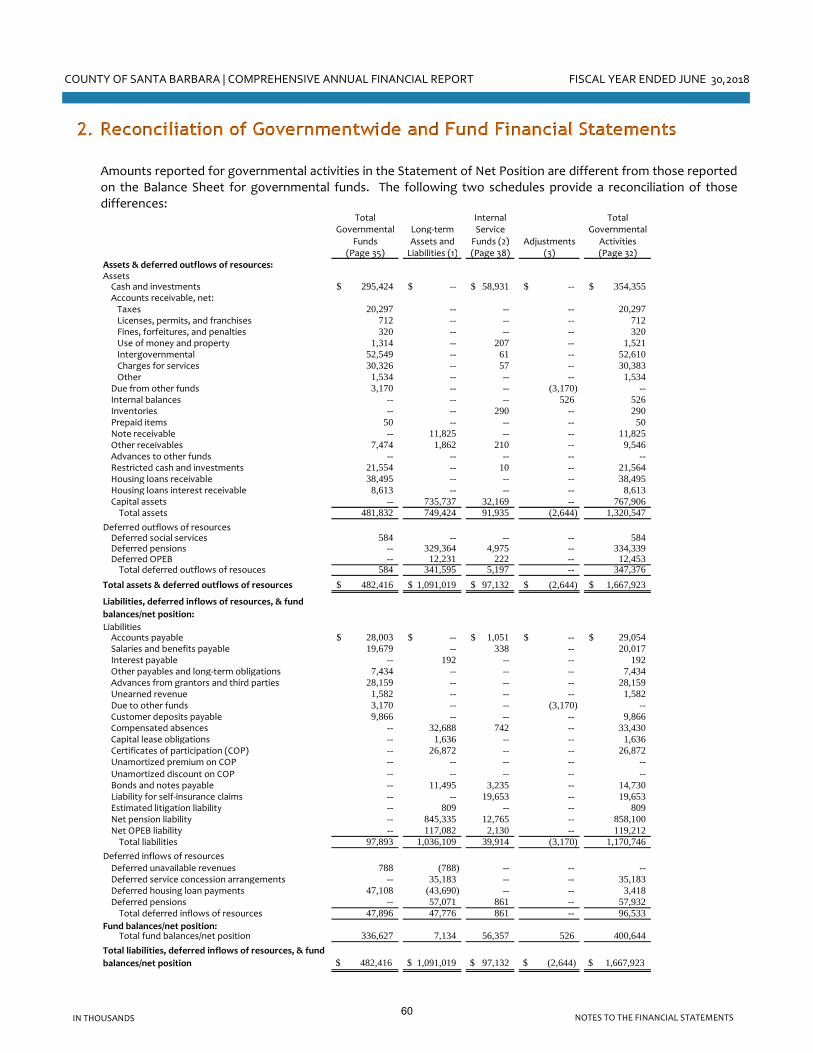
COUNTY OF SANTA BARBARA | COMPREHENSIVE ANNUAL FINANCIAL REPORT FISCAL YEAR ENDED JUNE 30,2018
NOTES TO THE FINANCIAL STATEMENTSIN THOUSANDS
2. Reconciliation of Governmentwide and Fund Financial Statements Amounts reported for governmental activities in the Statement of Net Position are different from those reported on the Balance Sheet for governmental funds. The following two schedules provide a reconciliation of those differences:
Total Internal TotalGovernmental Long‐term Service Governmental
Funds Assets and Funds (2) Adjustments Activities(Page 35) Liabilities (1) (Page 38) (3) (Page 32)
Assets & deferred outflows of resources:AssetsCash and investments 295,424$ --$ 58,931$ --$ 354,355$ Accounts receivable, net: Taxes 20,297 -- -- -- 20,297 Licenses, permits, and franchises 712 -- -- -- 712 Fines, forfeitures, and penalties 320 -- -- -- 320 Use of money and property 1,314 -- 207 -- 1,521 Intergovernmental 52,549 -- 61 -- 52,610 Charges for services 30,326 -- 57 -- 30,383 Other 1,534 -- -- -- 1,534 Due from other funds 3,170 -- -- (3,170) -- Internal balances -- -- -- 526 526 Inventories -- -- 290 -- 290 Prepaid items 50 -- -- -- 50 Note receivable -- 11,825 -- -- 11,825 Other receivables 7,474 1,862 210 -- 9,546 Advances to other funds -- -- -- -- -- Restricted cash and investments 21,554 -- 10 -- 21,564 Housing loans receivable 38,495 -- -- -- 38,495 Housing loans interest receivable 8,613 -- -- -- 8,613 Capital assets -- 735,737 32,169 -- 767,906 Total assets 481,832 749,424 91,935 (2,644) 1,320,547
Deferred outflows of resourcesDeferred social services 584 -- -- -- 584 Deferred pensions -- 329,364 4,975 -- 334,339 Deferred OPEB -- 12,231 222 -- 12,453 Total deferred outflows of resouces 584 341,595 5,197 -- 347,376
Total assets & deferred outflows of resources 482,416$ 1,091,019$ 97,132$ (2,644)$ 1,667,923$
Liabilities, deferred inflows of resources, & fund
balances/net position:
LiabilitiesAccounts payable 28,003$ --$ 1,051$ --$ 29,054$ Salaries and benefits payable 19,679 -- 338 -- 20,017 Interest payable -- 192 -- -- 192 Other payables and long‐term obligations 7,434 -- -- -- 7,434 Advances from grantors and third parties 28,159 -- -- -- 28,159 Unearned revenue 1,582 -- -- -- 1,582 Due to other funds 3,170 -- -- (3,170) -- Customer deposits payable 9,866 -- -- -- 9,866 Compensated absences -- 32,688 742 -- 33,430 Capital lease obligations -- 1,636 -- -- 1,636 Certificates of participation (COP) -- 26,872 -- -- 26,872 Unamortized premium on COP -- -- -- -- -- Unamortized discount on COP -- -- -- -- -- Bonds and notes payable -- 11,495 3,235 -- 14,730 Liability for self‐insurance claims -- -- 19,653 -- 19,653 Estimated litigation liability -- 809 -- -- 809 Net pension liability -- 845,335 12,765 -- 858,100 Net OPEB liability -- 117,082 2,130 -- 119,212 Total liabilities 97,893 1,036,109 39,914 (3,170) 1,170,746
Deferred inflows of resourcesDeferred unavailable revenues 788 (788) -- -- -- Deferred service concession arrangements -- 35,183 -- -- 35,183 Deferred housing loan payments 47,108 (43,690) -- -- 3,418 Deferred pensions -- 57,071 861 -- 57,932 Total deferred inflows of resources 47,896 47,776 861 -- 96,533
Fund balances/net position:Total fund balances/net position 336,627 7,134 56,357 526 400,644
Total liabilities, deferred inflows of resources, & fund
balances/net position $ 482,416 $ 1,091,019 $ 97,132 $ (2,644) $ 1,667,923
60

COUNTY OF SANTA BARBARA | COMPREHENSIVE ANNUAL FINANCIAL REPORT FISCAL YEAR ENDED JUNE 30,2018
NOTES TO THE FINANCIAL STATEMENTSIN THOUSANDS
(1) Note receivable for governmental activities from the RDA Successor Agency Private‐Purpose Trust Fund. 11,825$
Other receivables 1,862 Capital assets used in governmental activities (excluding Internal Service Funds) are notcurrent financial resources and, therefore, are not reported in the Balance Sheet (Note 6). 735,737
Deferred outflows of resources reported in the Statement of Net Position (Note 8). 341,595 Long‐term liabilities are not due and payable in the current period and, therefore, are not reported in the Balance Sheet (Note 10):
Other payables and long‐term obligations -$ Compensated absences (excluding Internal Service Funds) (32,688) Capital lease obligations (excluding Internal Service Funds) (1,636) Certificates of participation (26,872) Bonds and notes payable (excluding Internal Service Funds) (11,495) Estimated liability for litigation (809) Net pension liability (excluding Internal Service Funds) (845,335) Net OPEB liability (excluding Internal Service Funds) (117,082) Total long‐term liabilities (1,035,917)
Accrued interest on long‐term debt (192) Other long‐term assets are not available to pay for current period expenditures and, therefore, are deferred in the funds and recognized as revenue in the Statement of Activities (Note 17). 47,896
Deferred inflows of resources (excluding Internal Service Funds) reported in the Statement of Net (95,672) Position (Note 17).
7,134$
(2) Internal Service Funds are used by management to charge the costs of information technology, reprographics and digital imaging services, vehicle operations and maintenance, risk management and insurance, communications and utility services to individual funds. The assets and liabilities of the Internal Service Funds are included in the governmental activities in the Statement of Net Position. 56,357$
(3) Adjustment for Internal Service Funds are necessary to "close" those funds by charging additional amounts to participating business‐type activities to completely cover the Internal Service Funds' costs for the year. Also included are immaterial rounding adjustments. 526$
3. Cash and Investments Cash and investments include the cash balances of substantially all funds, which are pooled and invested by the County Treasurer. The Santa Barbara County Treasury Pool (Pool) is not registered as an investment company with the Securities and Exchange Commission (SEC) nor is it an SEC Rule 2a7‐like pool.
Custodial Credit Risk Related to Deposits The custodial credit risk for deposits is the risk that, in the event of the failure of a depository financial institution, the Pool will not be able to recover deposits or will not be able to recover collateral securities that are in possession of an outside party. This risk is mitigated in that, of the County’s total bank balance, $250 is insured by the Federal Depository Insurance Corporation. The remaining $88,149 on deposit is collateralized with securities held by the pledging financial institution’s agent. Per Government Code Section 53652, the depository is required to maintain a market value of at least 110% of the pledged collateral. At June 30, 2018, the carrying amount of the Pool’s deposits was $95,191 and the corresponding bank balance was $88,399. The difference of $6,792 was principally due to deposits in transit.
61

COUNTY OF SANTA BARBARA | COMPREHENSIVE ANNUAL FINANCIAL REPORT FISCAL YEAR ENDED JUNE 30,2018
NOTES TO THE FINANCIAL STATEMENTSIN THOUSANDS
Investments Pursuant to Section 53646 of the Government Code, the County Treasurer prepares an Investment Policy Statement annually, presents it to the Treasury Oversight Committee (TOC) for review and to the Board of Supervisors for approval. After approval, the policy is forwarded to the California Debt and Investment Advisory Commission. The Investment Policy Statement provides the basis for the management of a prudent, conservative investment program. Public funds are invested to provide the maximum security of principal with secondary emphasis on achieving the highest return, while meeting daily cash flow needs. All investments are made in accordance with the Government Code and, in general, the Treasurer’s Investment Policy is more restrictive than state law. Types of securities in which the Treasurer may invest include U.S. Treasury and U.S. Government agency securities; state and/or local agency bonds, notes, warrants or certificates of indebtedness; bankers' acceptances; commercial paper; corporate notes; negotiable certificates of deposit; repurchase agreements; reverse repurchase agreements; securities lending; bank deposits; money market mutual funds; the State of California Local Agency Investment Fund (LAIF); and the investment pools managed by a Joint Powers Authority. As of June 30, 2018, all investments are in compliance with State law and with the investment policy. Investments are stated at fair value. Fair value is established quarterly based on quoted market prices received from the securities custodian. Fair value of investments held fluctuates with interest rates. The fair value of participants’ position in the Pool is the same as the value of the Pool shares. The value of participants’ equity withdrawn is based on the book value of the participants’ percentage participation at the date of such withdrawal. The Pool participates in LAIF and the California Asset Management Program (CAMP). Investments in the LAIF and CAMP are governed by state statutes and overseen by a five member Local Investment Advisory Board and a 7 member Board of Trustees, respectively. The California State Treasurer’s Office operates the LAIF. The LAIF is available for investment of funds administered by California local governments and special districts and is not registered with the SEC as an investment company. The enabling legislation for the LAIF is Section 16429.1 et seq. of the California Government Code. The Local Investment Advisory Board (LIAB) provides oversight for LAIF. CAMP is a California Joint Powers Authority established in 1989 to provide California public agencies with professional investment services. The CAMP Pool is a permitted investment for all local agencies under California Government Code Section 53601(p). The LAIF and CAMP operate and report to participants on an amortized cost basis. For both the LAIF and CAMP, the income, gains, and losses, net of administration fees, are allocated based upon the participant’s average daily balance. Deposits in the LAIF and CAMP are not insured or otherwise guaranteed by the State of California, and participants share proportionally in any realized gains or losses on investments. The fair value of the LAIF and CAMP investment pools are approximately equal to the value of the pool shares. Credit Risk and Concentration of Credit Risk Credit risk is the risk that an issuer or other counterparty to an investment will not fulfill its obligations. Concentration of credit risk is the risk of loss attributed to the magnitude of an investment in a single issuer. The Treasurer mitigates these risks by holding a diversified portfolio of high quality investments. The Treasurer’s Investment Policy sets specific parameters by type of investment to be met at the time of purchase. Commercial paper obligations and negotiable certificates of deposit shall be rated by at least two of the three major rating services at a minimum of F1 by Fitch, P‐1 by Moody’s and A‐1 by Standard & Poor’s (S&P).
62
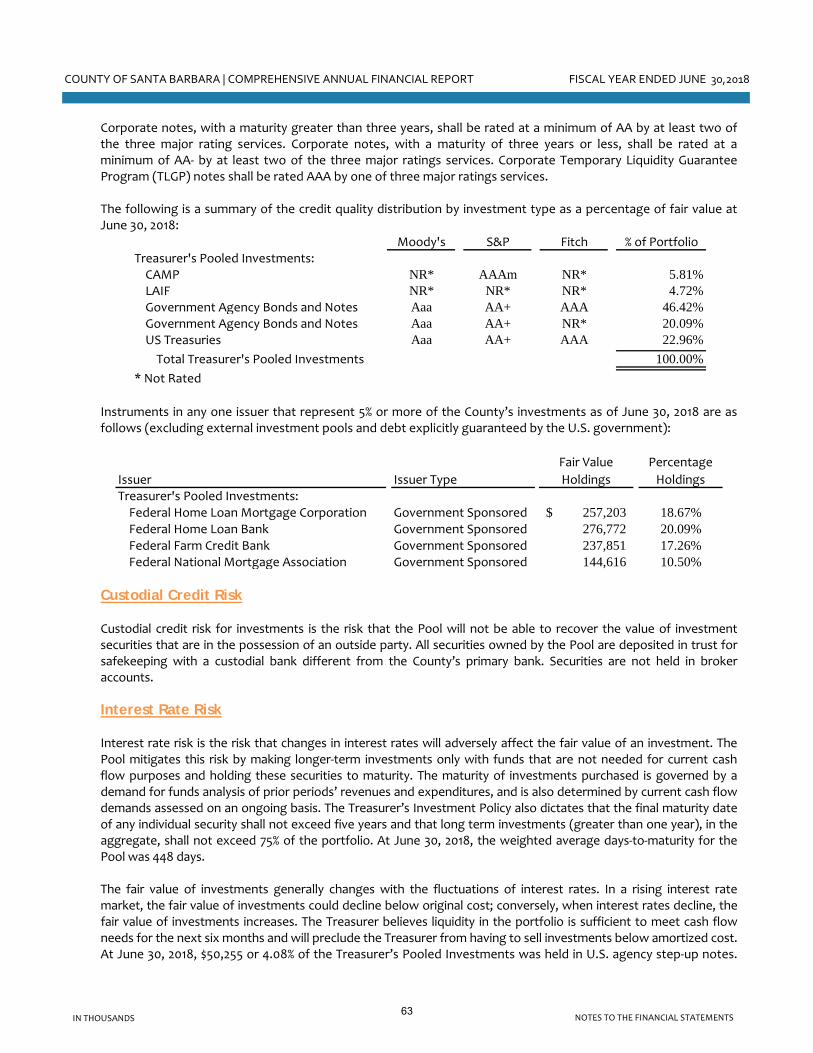
COUNTY OF SANTA BARBARA | COMPREHENSIVE ANNUAL FINANCIAL REPORT FISCAL YEAR ENDED JUNE 30,2018
NOTES TO THE FINANCIAL STATEMENTSIN THOUSANDS
Corporate notes, with a maturity greater than three years, shall be rated at a minimum of AA by at least two of the three major rating services. Corporate notes, with a maturity of three years or less, shall be rated at a minimum of AA‐ by at least two of the three major ratings services. Corporate Temporary Liquidity Guarantee Program (TLGP) notes shall be rated AAA by one of three major ratings services. The following is a summary of the credit quality distribution by investment type as a percentage of fair value at June 30, 2018:
Moody's S&P Fitch % of PortfolioTreasurer's Pooled Investments:CAMP NR* AAAm NR* 5.81%LAIF NR* NR* NR* 4.72%Government Agency Bonds and Notes Aaa AA+ AAA 46.42%Government Agency Bonds and Notes Aaa AA+ NR* 20.09%US Treasuries Aaa AA+ AAA 22.96%Total Treasurer's Pooled Investments 100.00%
* Not Rated Instruments in any one issuer that represent 5% or more of the County’s investments as of June 30, 2018 are as follows (excluding external investment pools and debt explicitly guaranteed by the U.S. government):
Issuer Issuer Type
Fair Value
Holdings
Percentage
HoldingsTreasurer's Pooled Investments:Federal Home Loan Mortgage Corporation Government Sponsored 257,203$ 18.67%Federal Home Loan Bank Government Sponsored 276,772 20.09%Federal Farm Credit Bank Government Sponsored 237,851 17.26%Federal National Mortgage Association Government Sponsored 144,616 10.50%
Custodial Credit Risk Custodial credit risk for investments is the risk that the Pool will not be able to recover the value of investment securities that are in the possession of an outside party. All securities owned by the Pool are deposited in trust for safekeeping with a custodial bank different from the County’s primary bank. Securities are not held in broker accounts. Interest Rate Risk Interest rate risk is the risk that changes in interest rates will adversely affect the fair value of an investment. The Pool mitigates this risk by making longer‐term investments only with funds that are not needed for current cash flow purposes and holding these securities to maturity. The maturity of investments purchased is governed by a demand for funds analysis of prior periods’ revenues and expenditures, and is also determined by current cash flow demands assessed on an ongoing basis. The Treasurer’s Investment Policy also dictates that the final maturity date of any individual security shall not exceed five years and that long term investments (greater than one year), in the aggregate, shall not exceed 75% of the portfolio. At June 30, 2018, the weighted average days‐to‐maturity for the Pool was 448 days. The fair value of investments generally changes with the fluctuations of interest rates. In a rising interest rate market, the fair value of investments could decline below original cost; conversely, when interest rates decline, the fair value of investments increases. The Treasurer believes liquidity in the portfolio is sufficient to meet cash flow needs for the next six months and will preclude the Treasurer from having to sell investments below amortized cost. At June 30, 2018, $50,255 or 4.08% of the Treasurer’s Pooled Investments was held in U.S. agency step‐up notes.
63
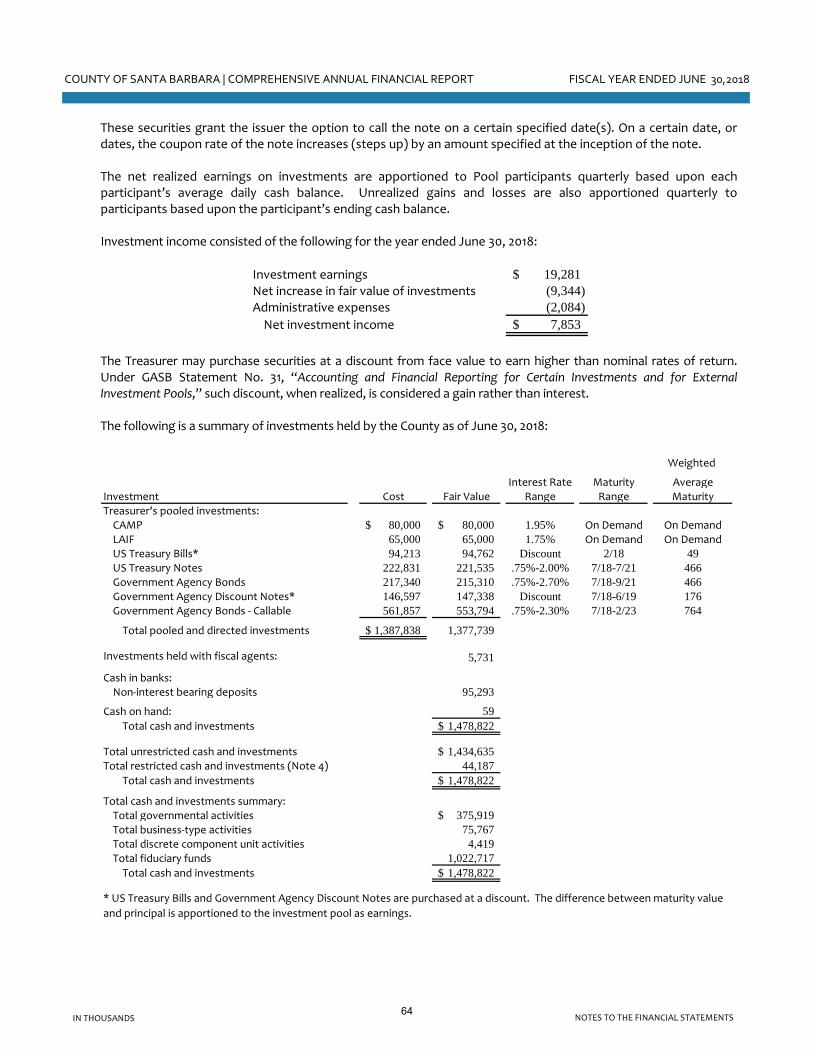
COUNTY OF SANTA BARBARA | COMPREHENSIVE ANNUAL FINANCIAL REPORT FISCAL YEAR ENDED JUNE 30,2018
NOTES TO THE FINANCIAL STATEMENTSIN THOUSANDS
These securities grant the issuer the option to call the note on a certain specified date(s). On a certain date, or dates, the coupon rate of the note increases (steps up) by an amount specified at the inception of the note. The net realized earnings on investments are apportioned to Pool participants quarterly based upon each participant’s average daily cash balance. Unrealized gains and losses are also apportioned quarterly to participants based upon the participant’s ending cash balance. Investment income consisted of the following for the year ended June 30, 2018:
Investment earnings 19,281$ Net increase in fair value of investments (9,344) Administrative expenses (2,084) Net investment income 7,853$
The Treasurer may purchase securities at a discount from face value to earn higher than nominal rates of return. Under GASB Statement No. 31, “Accounting and Financial Reporting for Certain Investments and for External Investment Pools,” such discount, when realized, is considered a gain rather than interest. The following is a summary of investments held by the County as of June 30, 2018:
Weighted
Interest Rate Maturity AverageInvestment Cost Fair Value Range Range MaturityTreasurer's pooled investments:CAMP 80,000$ 80,000$ 1.95% On Demand On DemandLAIF 65,000 65,000 1.75% On Demand On DemandUS Treasury Bills* 94,213 94,762 Discount 2/18 49US Treasury Notes 222,831 221,535 .75%-2.00% 7/18-7/21 466Government Agency Bonds 217,340 215,310 .75%-2.70% 7/18-9/21 466Government Agency Discount Notes* 146,597 147,338 Discount 7/18-6/19 176Government Agency Bonds ‐ Callable 561,857 553,794 .75%-2.30% 7/18-2/23 764
Total pooled and directed investments 1,387,838$ 1,377,739
Investments held with fiscal agents: 5,731
Cash in banks:Non‐interest bearing deposits 95,293
Cash on hand: 59 Total cash and investments 1,478,822$
Total unrestricted cash and investments 1,434,635$ Total restricted cash and investments (Note 4) 44,187
Total cash and investments 1,478,822$
Total cash and investments summary:Total governmental activities 375,919$ Total business‐type activities 75,767 Total discrete component unit activities 4,419 Total fiduciary funds 1,022,717 Total cash and investments 1,478,822$
* US Treasury Bills and Government Agency Discount Notes are purchased at a discount. The difference between maturity value
and principal is apportioned to the investment pool as earnings.
64

COUNTY OF SANTA BARBARA | COMPREHENSIVE ANNUAL FINANCIAL REPORT FISCAL YEAR ENDED JUNE 30,2018
NOTES TO THE FINANCIAL STATEMENTSIN THOUSANDS
The following is reconciliation between cash and investments and the Net Position of the Treasurer’s investment pool as of June 30, 2018:
Total cash and investments $ 1,478,822 Less: investments held with fiscal agents (5,731)Less: cash on hand (59)Less: purchase interest (102)Add: cash and investment interest receivable 4,838
$ 1,477,768
The following represents a condensed Statement of Net Position and Changes in Net Position for the Treasurer’s investment pool as of June 30, 2018:
$ 1,477,768
$ 539,830 937,938 $ 1,477,768
Net position held for pool participants, July 1, 2017 $ 1,409,567 68,201 $ 1,477,768
Equity of internal pool
Statement of Net PositionNet position held in trust
Net change in investments by pool Net position held for pool participants, June 30, 2018
Equity of external pool participants (voluntary and involuntary)Total equity
Statement of Changes in Net Position
Additional detailed information and/or separately issued financial statements of the County Treasurer’s Investment Pool can be obtained from the County Treasurer‐Tax Collector’s office located at 105 East Anapamu Street, Room 109, Santa Barbara, CA 93102.
65

COUNTY OF SANTA BARBARA | COMPREHENSIVE ANNUAL FINANCIAL REPORT FISCAL YEAR ENDED JUNE 30,2018
NOTES TO THE FINANCIAL STATEMENTSIN THOUSANDS
Fair Value Measurements The Pool categorizes its fair value measurements within the fair value hierarchy established by generally accepted accounting principles. These principles recognize a three‐tiered fair value hierarchy, as follows:
Level 1: Investments reflect prices quoted in active markets;
Level 2: Investments reflect prices that are based on a similar observable asset either directly or indirectly, which may include inputs in markets that are not considered to be active; and,
Level 3: Investments reflect prices based upon unobservable sources.
The Pool has the following recurring fair value measurements as of June 30, 2018:
Quoted Prices in
Active Markets
for Identical
Assets
Significant Other
Observable
Inputs
Significant
Unobservable
InputsInvestments by fair value level (Level 1) (Level 2) (Level 3)Debt securities
US Treasuries $ 316,297 $ 316,297 --$ --$ Government agency bonds 215,310 -- 215,310 -- Government agency discount notes 147,338 -- 147,338 -- Government agency bonds ‐ callable 553,794 -- 553,794 --
Total investments measured at fair value 1,232,739 $ 316,297 916,442$ --$ Investments measured at amortized cost
CAMP 80,000 LAIF 65,000
Total pooled and directed investments $ 1,377,739
Fair Value Measurements Using
66

COUNTY OF SANTA BARBARA | COMPREHENSIVE ANNUAL FINANCIAL REPORT FISCAL YEAR ENDED JUNE 30,2018
NOTES TO THE FINANCIAL STATEMENTSIN THOUSANDS
4. Restricted Cash and Investments Cash and investments at June 30, 2018 that are restricted by legal or contractual requirements are comprised of the following: Governmental Activities
General FundDeposits by various developers 9,437$ Property tax loss reserve 8,655 Court ordered restitution funds 265 Funds for disaster recovery 32 Total General Fund 18,389$
Major Governmental FundsEnergy efficiency loan loss reserve 1,991 Total major governmental funds 1,991
Nonmajor Governmental FundsDebt service reserves 1,174 Total nonmajor governmental funds 1,174
Internal Service FundsFunds for underground tank clean‐up 10 Total internal service funds 10 Total governmental activities 21,564
Business‐type Activities
Resource Recovery FundFunds for landfill site closure and maintenance costs (see Note 16) 18,327 Financial assurance for landfill corrective action (see Note 16) 2,027 Debt service reserves 777 Financial assurance for UCSB Hazardous Household Waste Center corrective action 56
Total Resource Recovery Fund 21,187
Total restricted cash and investments* 42,751$
*Governmental and Business‐type Activities do not include $1,436 of Fidicuary Private‐Purpose Trust Fund restricted cash
and investments.
67

COUNTY OF SANTA BARBARA | COMPREHENSIVE ANNUAL FINANCIAL REPORT FISCAL YEAR ENDED JUNE 30,2018
NOTES TO THE FINANCIAL STATEMENTSIN THOUSANDS
5. Receivables
GASB Statement No. 38, “Certain Financial Statement Note Disclosures,” requires disclosure of significant receivable balances not expected to be collected within one year of the date of the financial statements. The detail of receivable balances not expected to be collected within the next fiscal year is as follows: Note Receivable The County has recorded a note receivable for governmental activities from the RDA Successor Agency Private‐purpose Trust Fund. The total balance of the note receivable at June 30, 2018 is $11,825 and the amount not expected to be collected within the next fiscal year is $10,960. Housing Loans Receivable and Housing Loans Interest Receivable A total of $38,495 was recorded as housing loans receivable and a total of $8,613 was recorded as housing loans interest receivable at June 30, 2018. These represent low or no interest mortgage notes and related accrued interest to finance multi‐family and single family construction and rehabilitation projects, as well as homebuyer assistance for low income families, as part of the County’s affordable housing program. Loan terms range from 15 to 55 years with interest rates from 0% to 6%. Loans, with a total principal balance of $3,036, contain a forgiveness clause and more than likely will not be repaid back to the County. The County’s primary sources of funding for these loans come from grants from the federal HOME Investment Partnership (HOME) and Community Development Block Grant (CDBG) programs. The HOME and CDBG grants contain monitoring requirements to ensure grant compliance. These requirements are reflected in the loan agreements. Due to the terms of the loans, offsetting deferred inflows of resources of $47,108 have been established in the Governmental Funds Balance Sheet for the housing loan principal and interest payments. Additionally, offsetting deferred inflows of resources of $3,418 have been established in the Statement of Net Position for the principal and interest balance of loans with a forgiveness clause. Other Receivables The following amounts are included in other receivables on the governmental activities financial statements, and are not expected to be received within the next fiscal year:
$4,980 for impounded disputed property taxes; and
$200 deposit with the County’s workers’ compensation claims administrator. The business‐type activities financial statements include an amount of $951 in other receivables for other operating revenues earned in the current period that are not expected to be received within the next fiscal year.
68

COUNTY OF SANTA BARBARA | COMPREHENSIVE ANNUAL FINANCIAL REPORT FISCAL YEAR ENDED JUNE 30,2018
NOTES TO THE FINANCIAL STATEMENTSIN THOUSANDS
6. Capital Assets Capital asset activity for the year ended June 30, 2018 includes the following adjusted amounts:
Balance
July 1, 2017 Transfers & Balance*Restated Additions Deletions Adjustments, net June 30, 2018
Governmental activities:
Capital assets, non‐depreciable:Land 55,473$ --$ --$ --$ 55,473$ Land easements 53,133 -- -- -- 53,133 Service concession arrangements 40,482 374 -- -- 40,856 Work in progress 76,540 53,964 (21,808) -- 108,696 Total capital assets, non‐depreciable 225,628 54,338 (21,808) -- 258,158
Capital assets, depreciable/amortizable:Land improvements 29,524 -- -- -- 29,524 Structures and improvements 271,368 1,852 -- -- 273,220 Equipment and software 146,556 16,393 (7,336) -- 155,613 Infrastructure 388,377 12,063 -- -- 400,440 Total capital assets, depreciable/amortizable 835,825 30,308 (7,336) -- 858,797
Less accumulated depreciation/amortization for: Land improvements (8,456) (755) -- -- (9,211) Structures and improvements (116,252) (5,930) -- -- (122,182) Equipment and software (87,918) (12,731) 6,624 -- (94,025) Infrastructure (117,678) (5,953) -- -- (123,631) Total accumulated depreciation/amortization (330,304) (25,369) 6,624 -- (349,049)
Total capital assets, depreciable/amortizable, net 505,521 4,939 (712) -- 509,748
Sub‐total governmental activities 731,149 59,277 (22,520) -- 767,906
Business‐type activities:Capital assets, non‐depreciable:Land 15,654 -- -- -- 15,654 Work in progress 4,070 3,543 -- -- 7,613 Total capital assets, non‐depreciable 19,724 3,543 -- -- 23,267
Capital assets, depreciable/amortizable:Land improvements 680 -- (197) -- 483 Structures and improvements 10,644 561 (60) -- 11,145 Equipment and software 31,890 1,171 (2,222) -- 30,839 Infrastructure 73,720 474 (80) -- 74,114 Total capital assets, depreciable/amortizable 116,934 2,206 (2,559) -- 116,581
Less accumulated depreciation/amortization for:Land improvements (212) (11) -- -- (223) Structures and improvements (4,888) (275) 3 -- (5,160) Equipment and software (16,387) (1,754) 1,743 -- (16,398) Infrastructure (24,617) (1,563) 1 -- (26,179) Total accumulated depreciation/amortization (46,104) (3,603) 1,747 -- (47,960)
Total capital assets, depreciable/amortizable, net 70,830 (1,397) (812) -- 68,621
Sub‐total business‐type activities 90,554 2,146 (812) -- 91,888 Total capital assets, net 821,703$ 61,423$ (23,332)$ --$ 859,794$
First 5 Santa Barbara CountyComponent unit activities:Capital assets, depreciable/amortizable:Equipment and software 25$ --$ --$ --$ 25$
Less accumulated depreciation/amortization (22) (3) -- -- (25) Total capital assets, net 3$ (3)$ --$ --$ -$
*As restated for Structures and Improvements and Equipment (Note 26).
69
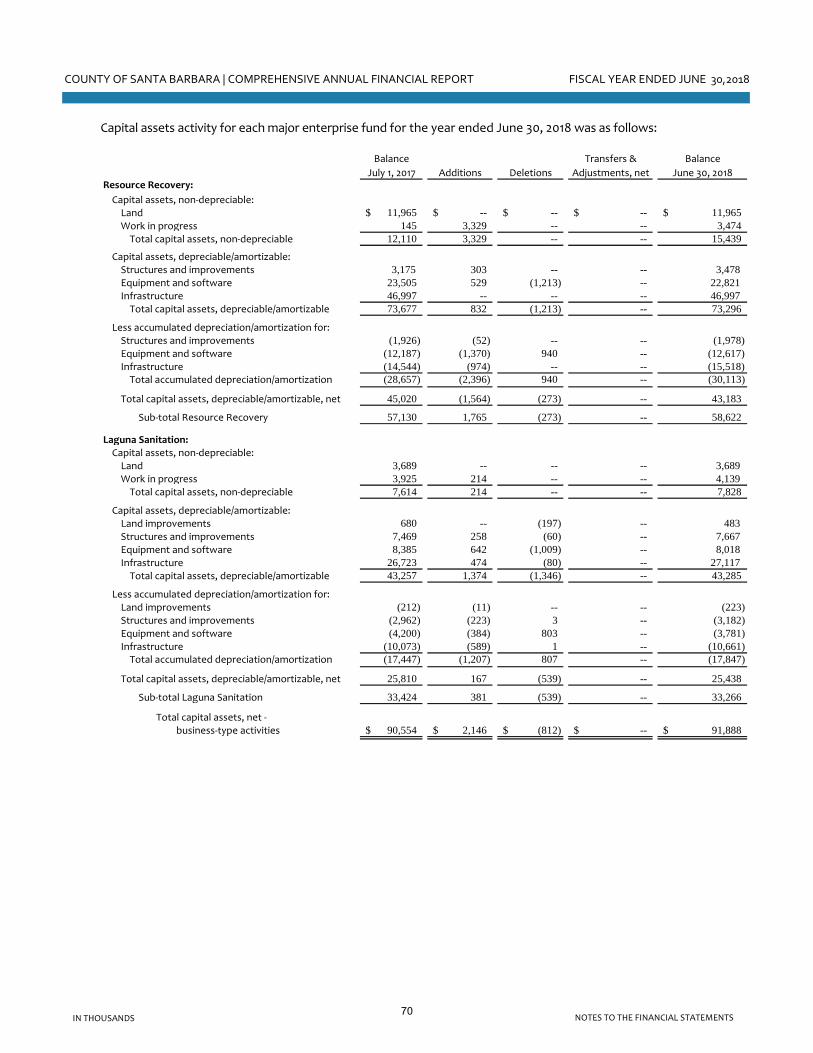
COUNTY OF SANTA BARBARA | COMPREHENSIVE ANNUAL FINANCIAL REPORT FISCAL YEAR ENDED JUNE 30,2018
NOTES TO THE FINANCIAL STATEMENTSIN THOUSANDS
Capital assets activity for each major enterprise fund for the year ended June 30, 2018 was as follows:
Balance Transfers & Balance
July 1, 2017 Additions Deletions Adjustments, net June 30, 2018Resource Recovery:
Capital assets, non‐depreciable:Land 11,965$ --$ --$ --$ 11,965$ Work in progress 145 3,329 -- -- 3,474 Total capital assets, non‐depreciable 12,110 3,329 -- -- 15,439
Capital assets, depreciable/amortizable:Structures and improvements 3,175 303 -- -- 3,478 Equipment and software 23,505 529 (1,213) -- 22,821 Infrastructure 46,997 -- -- -- 46,997 Total capital assets, depreciable/amortizable 73,677 832 (1,213) -- 73,296
Less accumulated depreciation/amortization for:Structures and improvements (1,926) (52) -- -- (1,978)Equipment and software (12,187) (1,370) 940 -- (12,617)Infrastructure (14,544) (974) -- -- (15,518)Total accumulated depreciation/amortization (28,657) (2,396) 940 -- (30,113)
Total capital assets, depreciable/amortizable, net 45,020 (1,564) (273) -- 43,183
Sub‐total Resource Recovery 57,130 1,765 (273) -- 58,622
Laguna Sanitation:Capital assets, non‐depreciable:Land 3,689 -- -- -- 3,689 Work in progress 3,925 214 -- -- 4,139 Total capital assets, non‐depreciable 7,614 214 -- -- 7,828
Capital assets, depreciable/amortizable:Land improvements 680 -- (197) -- 483 Structures and improvements 7,469 258 (60) -- 7,667 Equipment and software 8,385 642 (1,009) -- 8,018 Infrastructure 26,723 474 (80) -- 27,117 Total capital assets, depreciable/amortizable 43,257 1,374 (1,346) -- 43,285
Less accumulated depreciation/amortization for:Land improvements (212) (11) -- -- (223) Structures and improvements (2,962) (223) 3 -- (3,182) Equipment and software (4,200) (384) 803 -- (3,781) Infrastructure (10,073) (589) 1 -- (10,661) Total accumulated depreciation/amortization (17,447) (1,207) 807 -- (17,847)
Total capital assets, depreciable/amortizable, net 25,810 167 (539) -- 25,438
Sub‐total Laguna Sanitation 33,424 381 (539) -- 33,266
Total capital assets, net ‐ business‐type activities 90,554$ 2,146$ (812)$ --$ 91,888$
70
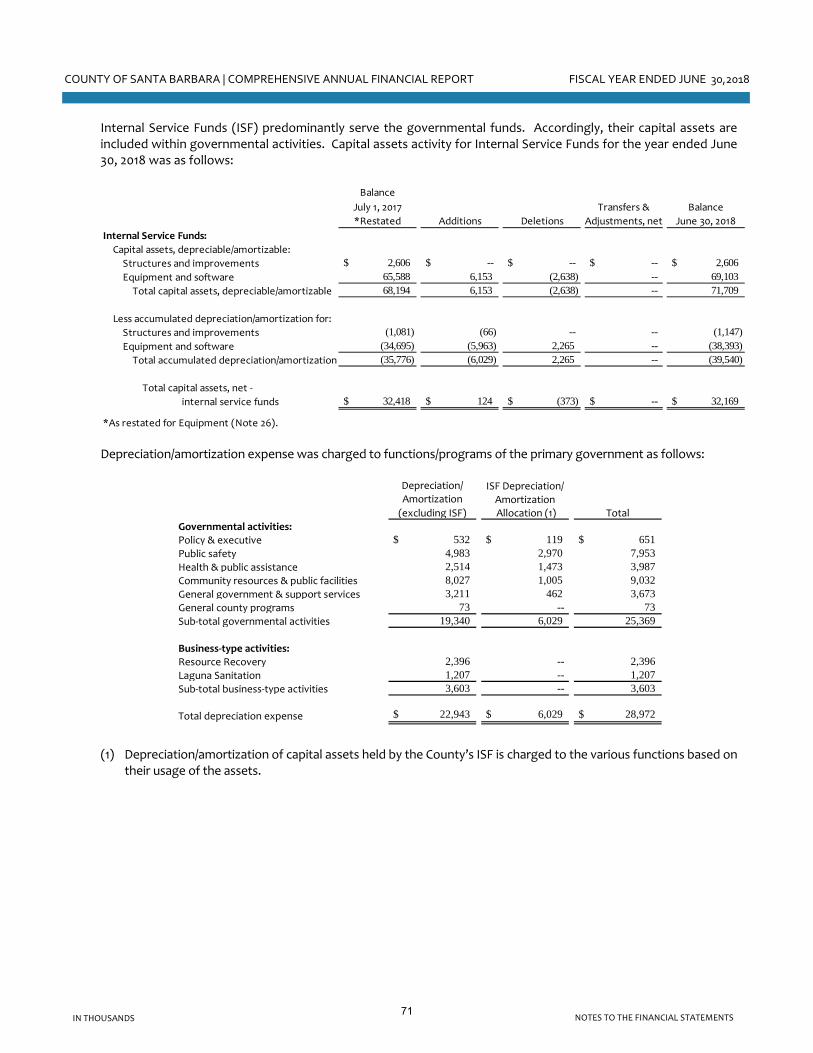
COUNTY OF SANTA BARBARA | COMPREHENSIVE ANNUAL FINANCIAL REPORT FISCAL YEAR ENDED JUNE 30,2018
NOTES TO THE FINANCIAL STATEMENTSIN THOUSANDS
Internal Service Funds (ISF) predominantly serve the governmental funds. Accordingly, their capital assets are included within governmental activities. Capital assets activity for Internal Service Funds for the year ended June 30, 2018 was as follows:
Balance
July 1, 2017 Transfers & Balance
*Restated Additions Deletions Adjustments, net June 30, 2018
Internal Service Funds:
Capital assets, depreciable/amortizable:
Structures and improvements $ 2,606 $ -- $ -- $ -- $ 2,606 Equipment and software 65,588 6,153 (2,638) -- 69,103
Total capital assets, depreciable/amortizable 68,194 6,153 (2,638) -- 71,709
Less accumulated depreciation/amortization for:
Structures and improvements (1,081) (66) -- -- (1,147)Equipment and software (34,695) (5,963) 2,265 -- (38,393)
Total accumulated depreciation/amortization (35,776) (6,029) 2,265 -- (39,540)
Total capital assets, net ‐
internal service funds $ 32,418 $ 124 $ (373) $ -- $ 32,169
*As restated for Equipment (Note 26).
Depreciation/amortization expense was charged to functions/programs of the primary government as follows:
Depreciation/ ISF Depreciation/Amortization Amortization(excluding ISF) Allocation (1) Total
Governmental activities:Policy & executive $ 532 $ 119 $ 651 Public safety 4,983 2,970 7,953 Health & public assistance 2,514 1,473 3,987 Community resources & public facilities 8,027 1,005 9,032 General government & support services 3,211 462 3,673 General county programs 73 -- 73 Sub‐total governmental activities 19,340 6,029 25,369
Business‐type activities:Resource Recovery 2,396 -- 2,396 Laguna Sanitation 1,207 -- 1,207 Sub‐total business‐type activities 3,603 -- 3,603
Total depreciation expense $ 22,943 $ 6,029 $ 28,972
(1) Depreciation/amortization of capital assets held by the County’s ISF is charged to the various functions based on
their usage of the assets.
71

COUNTY OF SANTA BARBARA | COMPREHENSIVE ANNUAL FINANCIAL REPORT FISCAL YEAR ENDED JUNE 30,2018
NOTES TO THE FINANCIAL STATEMENTSIN THOUSANDS
Work in progress at June 30, 2018 consists of the following projects for the primary government: Governmental activities:
Capital Outlay projects:North County jail 68,979$ Other projects (individually less than $500) 2,411
71,390$ Flood Control projects:
Mission Creek Corps project 22,271 Unit II Channel Improvements 2,700 Other projects (individually less than $500) 829
25,800 Roads projects:
Floridale Avenue bridge 1,710 Foothill Road Low Water Crossing replacement 1,422 Fernald Point bridge 922 Bonita School Road Bridge 902 Clark Avenue at 101 Interchange 603 Hollister and State Improvement 588 E. Mountain Low Water Crossing replacement 564 Union Valley Parkway Barrier Walls 503 Other projects (individually less than $500) 972
8,186
General Fund projects 793
Other Governmental FundsSanta Ynez Airport Athority improvement projects 2,336
Other projects (individually less than $500) 191 Sub‐total governmental activities 108,696
Business‐type activities:
Resource Recovery projects 3,474 Laguna Sanitation projects 4,139
Sub‐total business‐type activities 7,613 Total work in progress 116,309$
7. Service Concession Arrangements (SCA)
GASB Statement No. 60 (GASB 60), “Accounting and Financial Reporting for Service Concession Arrangements (SCA)” defines an SCA as a type of public‐private or public‐public partnership. As used in GASB 60, an SCA is an arrangement between a government (the transferor) and an operator in which all of the following criteria are met:
a. The transferor conveys to the operator the right and related obligation to provide public services
through the use and operation of a capital asset (referred to in the statement as a “facility”) in exchange for significant consideration, such as an up‐front payment, installment payments, a new facility, or improvements to an existing facility.
b. The operator collects and is compensated by fees from third parties. c. The transferor determines or has the ability to modify or approve what services the operator is required
to provide, to whom the operator is required to provide the services, and the prices or rates that can be charged for the services.
72

COUNTY OF SANTA BARBARA | COMPREHENSIVE ANNUAL FINANCIAL REPORT FISCAL YEAR ENDED JUNE 30,2018
NOTES TO THE FINANCIAL STATEMENTSIN THOUSANDS
The County has determined that the following arrangements meet the criteria set forth above (where the County is the transferor) and therefore included these SCAs in the County’s financial statements. GASB 60 also provides guidance on accounting treatment if the County were acting as an operator of another government’s facility. The County has determined that there are no incidences where the County would qualify as such an operator.
Boathouse Restaurant On February 1, 2008, the County entered into a 10‐year agreement (having options for a 10‐year extension and a subsequent 5‐year extension) with Santa Barbara Shellfish Company Incorporated (SB Shellfish), under which SB Shellfish will operate the Boathouse Restaurant, a walk‐up snack bar, and rent beach‐related equipment and supplies. On January 1, 2018, the 10‐year extension option was exercised and approved. Services are to be provided at reasonable rates. A summary of the important details, capital assets and the present value of installment payments pertaining to this SCA follows. Jalama Beach Store On January 1, 2008, the County entered into a 10‐year agreement (having an option for two 5‐year extensions) with Jalama Beach Store Incorporated (Jalama), under which Jalama has the right to the sell food and beverages (including beer and wine), kitchen supplies, camping supplies, housekeeping and other related supplies and conveniences; rent swimming and beach equipment & supplies; operate a restaurant and delicatessen; and rent vacation trailers. On January 1, 2018, the first 5‐year extension option was exercised and approved. Services are to be provided at reasonable rates. A summary of the important details, capital assets and the present value of installment payments pertaining to this SCA follows.
Beachside Restaurant On March 25, 1985, the County entered into a 37‐year agreement with Richhardy Corporation (Richhardy), under which Richhardy will have exclusive rights to operate and maintain a food and beverage business, fishing tackle and bait shop, and boat rental business. The County has the ability to review the rates Richhardy charges. A summary of the important details, capital assets, and the present value of installment payments pertaining to this SCA follows.
Cachuma Store and Marina On March 6, 2012, the County entered into a 10‐year agreement with Pyramid Enterprises, Incorporated (Pyramid), under which Pyramid will operate the Cachuma store and marina and sell gas. Services are to be provided at reasonable rates. The structures and related equipment pertaining to the SCA have been fully depreciated. A summary of the important details of this SCA follows.
Santa Barbara County Bowl On June 1, 2011, the County entered into a 45‐year agreement (having an option for a 25‐year extension) with the Santa Barbara County Bowl Foundation (Foundation), under which the Foundation will operate the outdoor amphitheater, maximizing access for community programs, stage events, musical performances, and other performing art events. Prices for merchandise, food, and beverages are to be comparable to prices charged at similar establishments; however, the Foundation sets ticket pricing. A portion of each ticket goes to the Santa Barbara Arts Commission with the remaining revenue used to run operations and maintain and improve facilities. A summary of the important details and the capital assets pertaining to this SCA follows.
73

COUNTY OF SANTA BARBARA | COMPREHENSIVE ANNUAL FINANCIAL REPORT FISCAL YEAR ENDED JUNE 30,2018
NOTES TO THE FINANCIAL STATEMENTSIN THOUSANDS
A summary of the important details for each SCA over the term of their agreements are as follows:
Date SCA
Entered
Into Term of SCA
Expiration of
SCA
Minimum
Installment
Payment (per
month) Revenue Sharing
Boathouse Restaurant 2/1/2008 10 yrs plus 10 yr extension
12/31/2027 16$ 10% gross sales; 1.47% on
income over $3.8 million
Jalama Beach Store 1/1/2008 10 yrs plus 5 yr extension
12/31/2022 3 8.5% of gross sales
Beachside Restaurant 3/25/1985 37 years 3/31/2022 2 6% of gross sales
Cachuma Store and Marina 3/6/2012 10 years 3/5/2022 -- 10% of marina gross sales; 7% of
store gross sales
Santa Barbara County Bowl 6/1/2011 45 years 5/31/2056 -- $0.50 per ticket sold up to
$50,000 per concert season
21$
Capital assets balances for each SCA for the year ended June 30, 2018 and over the term of the agreement are as follows:
Balance Additions/ BalanceJuly 1, 2017 Restatements June 30, 2018
Structures & Structure ImprovementsSanta Barbara County Bowl 36,973$ 374$ 37,347$ Boathouse Restaurant 1,698 -- 1,698 Beachside Restaurant 568 -- 568 Jalama Beach Store 55 -- 55 Sub‐total Structures & Structure Improvements 39,294 374 39,668
Land Santa Barbara County Bowl 1,188 -- 1,188 Sub‐total Land Improvements 1,188 -- 1,188
Total SCA Capital Asset Balance 40,482$ 374$ 40,856$
The deferred inflows of resources activity for each SCA for year ended June 30, 2018 was as follows:
74

COUNTY OF SANTA BARBARA | COMPREHENSIVE ANNUAL FINANCIAL REPORT FISCAL YEAR ENDED JUNE 30,2018
NOTES TO THE FINANCIAL STATEMENTSIN THOUSANDS
Balance Additions/ Deletions/ BalanceJuly 1, 2017 Restatements Amortization (1) June 30, 2018
SCA Capital Assets (1):Santa Barbara County Bowl $ 33,482 $ 374 $ (872) 32,984 Boathouse Restaurant 130 -- (13) 117 Beachside Restaurant 273 -- (59) 214 Jalama Beach Store 4 -- (1) 3 Sub‐total SCA capital assets 33,889 374 (945) 33,318
Present Value of Installment Payments (2):Boathouse Restaurant 92 1,730 (178) 1,644 Beachside Restaurant 83 -- (17) 66 Jalama Beach Store 17 172 (34) 155 Sub‐total present value of installment
payments 192 1,902 (229) 1,865 Total deferred inflows $ 34,081 $ 2,276 $ (1,174) $ 35,183
(1) Amortization is calculated using straight‐line method for the term of agreement for each SCA. (2) Installment payments present value is calculated using a discount rate of 2.1% for the term of agreement for
each SCA.
75
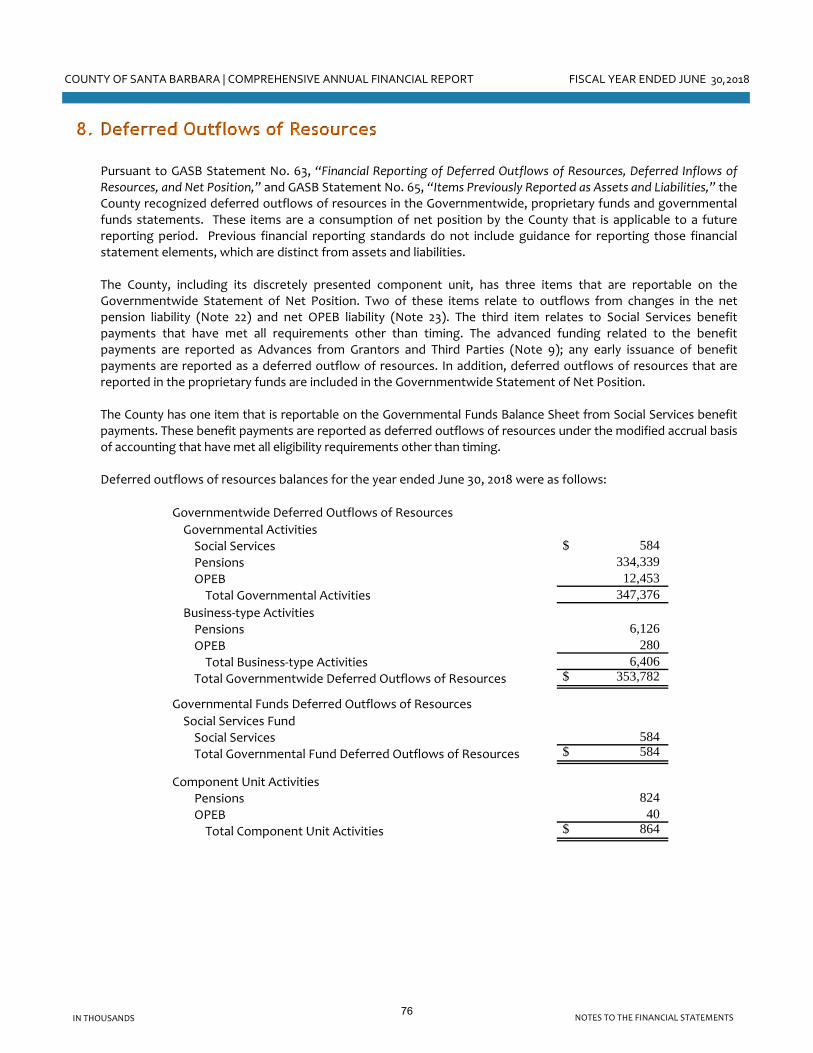
COUNTY OF SANTA BARBARA | COMPREHENSIVE ANNUAL FINANCIAL REPORT FISCAL YEAR ENDED JUNE 30,2018
NOTES TO THE FINANCIAL STATEMENTSIN THOUSANDS
8. Deferred Outflows of Resources
Pursuant to GASB Statement No. 63, “Financial Reporting of Deferred Outflows of Resources, Deferred Inflows of Resources, and Net Position,” and GASB Statement No. 65, “Items Previously Reported as Assets and Liabilities,” the County recognized deferred outflows of resources in the Governmentwide, proprietary funds and governmental funds statements. These items are a consumption of net position by the County that is applicable to a future reporting period. Previous financial reporting standards do not include guidance for reporting those financial statement elements, which are distinct from assets and liabilities. The County, including its discretely presented component unit, has three items that are reportable on the Governmentwide Statement of Net Position. Two of these items relate to outflows from changes in the net pension liability (Note 22) and net OPEB liability (Note 23). The third item relates to Social Services benefit payments that have met all requirements other than timing. The advanced funding related to the benefit payments are reported as Advances from Grantors and Third Parties (Note 9); any early issuance of benefit payments are reported as a deferred outflow of resources. In addition, deferred outflows of resources that are reported in the proprietary funds are included in the Governmentwide Statement of Net Position. The County has one item that is reportable on the Governmental Funds Balance Sheet from Social Services benefit payments. These benefit payments are reported as deferred outflows of resources under the modified accrual basis of accounting that have met all eligibility requirements other than timing. Deferred outflows of resources balances for the year ended June 30, 2018 were as follows:
Governmentwide Deferred Outflows of Resources
Governmental ActivitiesSocial Services $ 584 Pensions 334,339 OPEB 12,453 Total Governmental Activities 347,376
Business‐type ActivitiesPensions 6,126 OPEB 280 Total Business‐type Activities 6,406
Total Governmentwide Deferred Outflows of Resources $ 353,782
Governmental Funds Deferred Outflows of Resources
Social Services FundSocial Services 584 Total Governmental Fund Deferred Outflows of Resources $ 584
Component Unit ActivitiesPensions 824 OPEB 40 Total Component Unit Activities $ 864
76
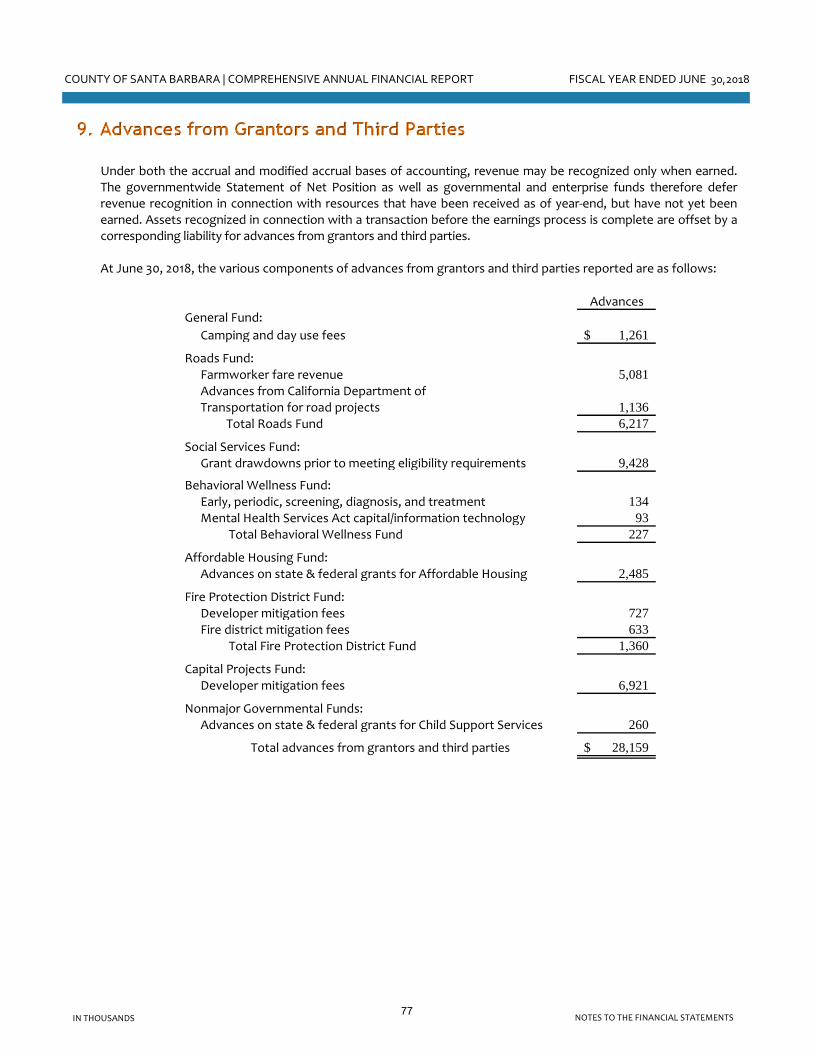
COUNTY OF SANTA BARBARA | COMPREHENSIVE ANNUAL FINANCIAL REPORT FISCAL YEAR ENDED JUNE 30,2018
NOTES TO THE FINANCIAL STATEMENTSIN THOUSANDS
9. Advances from Grantors and Third Parties Under both the accrual and modified accrual bases of accounting, revenue may be recognized only when earned. The governmentwide Statement of Net Position as well as governmental and enterprise funds therefore defer revenue recognition in connection with resources that have been received as of year‐end, but have not yet been earned. Assets recognized in connection with a transaction before the earnings process is complete are offset by a corresponding liability for advances from grantors and third parties. At June 30, 2018, the various components of advances from grantors and third parties reported are as follows:
AdvancesGeneral Fund:
Camping and day use fees 1,261$
Roads Fund:Farmworker fare revenue 5,081 Advances from California Department of Transportation for road projects 1,136
Total Roads Fund 6,217
Social Services Fund:Grant drawdowns prior to meeting eligibility requirements 9,428
Behavioral Wellness Fund:Early, periodic, screening, diagnosis, and treatment 134 Mental Health Services Act capital/information technology 93
Total Behavioral Wellness Fund 227
Affordable Housing Fund:Advances on state & federal grants for Affordable Housing 2,485
Fire Protection District Fund:Developer mitigation fees 727 Fire district mitigation fees 633
Total Fire Protection District Fund 1,360
Capital Projects Fund:Developer mitigation fees 6,921
Nonmajor Governmental Funds:Advances on state & federal grants for Child Support Services 260
Total advances from grantors and third parties 28,159$
77

COUNTY OF SANTA BARBARA | COMPREHENSIVE ANNUAL FINANCIAL REPORT FISCAL YEAR ENDED JUNE 30,2018
NOTES TO THE FINANCIAL STATEMENTSIN THOUSANDS
10. Long-Term Liabilities
Changes in Long-term Liabilities The long‐term liability activity for the year ended June 30, 2018 was as follows:
BalanceJuly 1, 2017 Balance Due Within
*Restated Additions Deletions June 30, 2018 One Year
Governmental activities:Compensated absences 32,853$ 31,548$ (30,971)$ 33,430$ 30,386$ Capital lease obligations 1,983 -- (347) 1,636 324 Certificates of participation (COP) 27,915 -- (935) 26,980 974 Unamortized premium on COP 5 -- (3) 2 -- Unamortized discount on COP (122) -- 12 (110) --
Other long‐term liabilities 1,069 738 (569) 1,238 -- Bonds and notes payable 17,745 -- (3,015) 14,730 3,075 Liability for self‐insurance claims 19,582 11,632 (11,561) 19,653 5,972 Estimated litigation liability -- 809 -- 809 -- Rebatable arbitrage earnings -- -- -- - -- Net pension liability 764,194 93,906 -- 858,100 -- Net OPEB liability 121,221 -- (2,009) 119,212 --
Sub‐total governmental activities 986,445 138,633 (49,398) 1,075,680 40,731
Business‐type activities:Compensated absences 701 689 (711) 679 679 Certificates of participation 4,528 -- (775) 3,753 806 Unamortized premium on COP 26 -- (13) 13 --
Bonds and notes payable 5,930 -- (791) 5,139 804 Landfill closure/postclosure care costs 29,245 3,143 (2,125) 30,263 1,018 Net pension liability 13,694 2,028 -- 15,722 -- Net OPEB liability 2,727 -- (49) 2,678 --
Sub‐total business‐type activities 56,851 5,860 (4,464) 58,247 3,307 Total long‐term liabilities 1,043,296$ 144,493$ (53,862)$ 1,133,927$ 44,038$
First 5 Santa Barbara CountyComponent unit activities:Compensated absences 94$ 92$ (100)$ 86$ 86$ Net pension liability 2,146 - (31) 2,115 -- Net OPEB liability 393 - (7) 386 --
Total long‐term liabilities 2,633$ 92$ (138)$ 2,587$ 86$
*The Net OPEB liability is a new long‐term liability in FY 17‐18 which replaced the OPEB obligation reported at June 30, 2017 as a
result of the implementation of GASB Statement No. 75. The prior year balance is the result of a prior period adjustment (Note 26).
78

COUNTY OF SANTA BARBARA | COMPREHENSIVE ANNUAL FINANCIAL REPORT FISCAL YEAR ENDED JUNE 30,2018
NOTES TO THE FINANCIAL STATEMENTSIN THOUSANDS
The long‐term liability activity for each major enterprise fund for the year ended June 30, 2018 was as follows:
Balance
July 1, 2017 Balance Due Within
*Restated Additions Deletions June 30, 2018 One YearResource Recovery:Certificates of participation $ 4,528 $ -- (775)$ $ 3,753 $ 806 Unamortized premium on COP 26 -- (13) 13 --
Compensated absences 573 546 (561) 558 558 Landfill closure/postclosure care costs 29,245 3,143 (2,125) 30,263 1,018 Net pension liability 10,993 1,555 -- 12,548 -- Net OPEB liability 2,228 -- (43) 2,185 --
Sub‐total Resource Recovery 47,593 5,244 (3,517) 49,320 2,382 Laguna Sanitation:Bonds and notes payable 5,930 -- (791) 5,139 804 Compensated absences 128 143 (150) 121 121 Net pension liability 2,701 473 -- 3,174 -- Net OPEB liability 499 -- (6) 493 --
Sub‐total Laguna Sanitation 9,258 616 (947) 8,927 925 Total long‐term liabilities ‐
business‐type activities 56,851$ 5,860$ (4,464)$ 58,247$ 3,307$
*The Net OPEB liability is a new long‐term liability in FY 17‐18 which replaced the OPEB obligation reported at June 30, 2017 as a
result of the implementation of GASB Statement No. 75. The prior year balance is the result of a prior period adjustment (Note 26).
In governmental activities, the liability for the majority of employee compensated absences, litigation, net OPEB, and net pension are liquidated by the General Fund. The self‐insurance claims liability is reported in the risk management and insurance internal service fund and will be liquated by that fund.
Internal Service Funds predominantly serve the governmental funds. Accordingly, their long‐term liabilities are included as part of the totals for governmental activities. The long‐term liability activity for the Internal Service Funds for the year ended June 30, 2018 was as follows:
Balance
July 1, 2017 Balance Due Within*Restated Additions Deletions June 30, 2018 One Year
Internal Service Funds:Compensated absences $ 749 $ 589 $ (596) $ 742 $ 596 Bonds and notes payable 3,580 -- (345) 3,235 345 Liability for self‐insurance claims 19,582 11,632 (11,561) 19,653 5,972 Net pension liability 11,506 1,259 -- 12,765 -- Net OPEB liability 2,156 -- (26) 2,130 -- Total long‐term liabilities ‐Internal Service Funds $ 37,573 $ 13,480 $ (12,528) $ 38,525 $ 6,913
*The Net OPEB liability is a new long‐term liability in FY 17‐18 which replaced the OPEB obligation reported at June 30,
2017 as a result of the implementation of GASB Statement No. 75. The prior year balance is the result of a prior period
adjustment (Note 26).
79
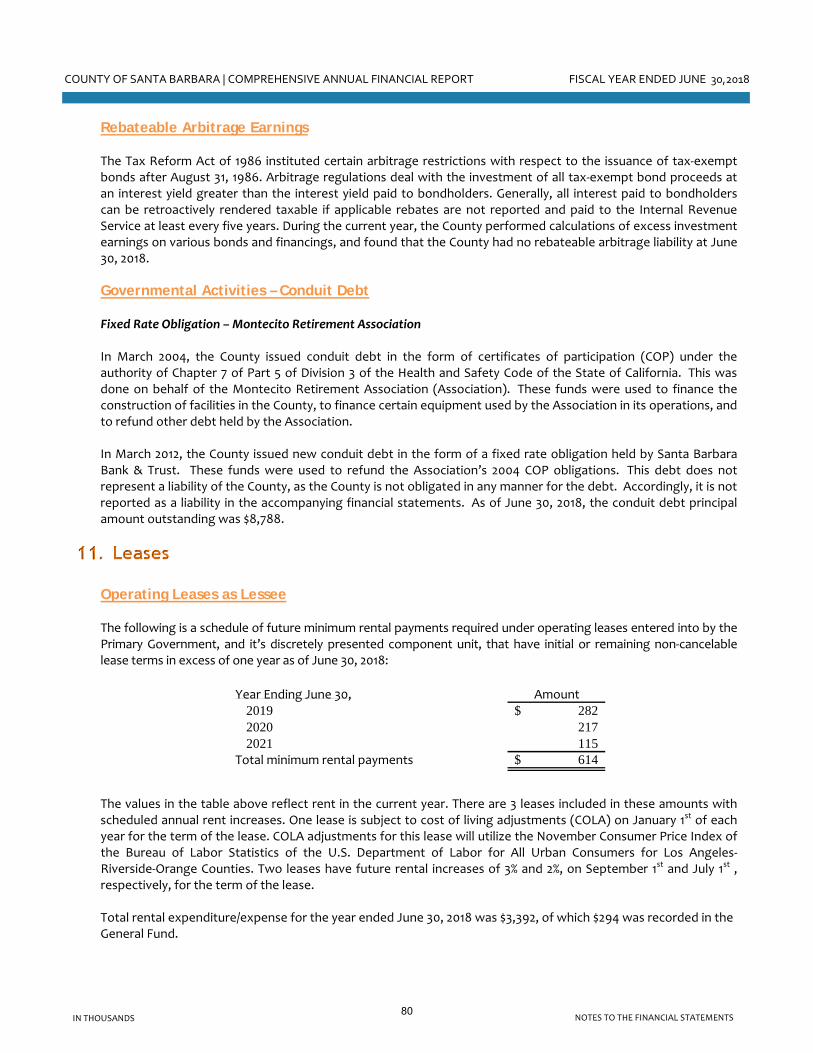
COUNTY OF SANTA BARBARA | COMPREHENSIVE ANNUAL FINANCIAL REPORT FISCAL YEAR ENDED JUNE 30,2018
NOTES TO THE FINANCIAL STATEMENTSIN THOUSANDS
Rebateable Arbitrage Earnings The Tax Reform Act of 1986 instituted certain arbitrage restrictions with respect to the issuance of tax‐exempt bonds after August 31, 1986. Arbitrage regulations deal with the investment of all tax‐exempt bond proceeds at an interest yield greater than the interest yield paid to bondholders. Generally, all interest paid to bondholders can be retroactively rendered taxable if applicable rebates are not reported and paid to the Internal Revenue Service at least every five years. During the current year, the County performed calculations of excess investment earnings on various bonds and financings, and found that the County had no rebateable arbitrage liability at June 30, 2018.
Governmental Activities – Conduit Debt Fixed Rate Obligation – Montecito Retirement Association In March 2004, the County issued conduit debt in the form of certificates of participation (COP) under the authority of Chapter 7 of Part 5 of Division 3 of the Health and Safety Code of the State of California. This was done on behalf of the Montecito Retirement Association (Association). These funds were used to finance the construction of facilities in the County, to finance certain equipment used by the Association in its operations, and to refund other debt held by the Association. In March 2012, the County issued new conduit debt in the form of a fixed rate obligation held by Santa Barbara Bank & Trust. These funds were used to refund the Association’s 2004 COP obligations. This debt does not represent a liability of the County, as the County is not obligated in any manner for the debt. Accordingly, it is not reported as a liability in the accompanying financial statements. As of June 30, 2018, the conduit debt principal amount outstanding was $8,788.
11. Leases
Operating Leases as Lessee The following is a schedule of future minimum rental payments required under operating leases entered into by the Primary Government, and it’s discretely presented component unit, that have initial or remaining non‐cancelable lease terms in excess of one year as of June 30, 2018:
Year Ending June 30, Amount2019 282$ 2020 217 2021 115
Total minimum rental payments 614$
The values in the table above reflect rent in the current year. There are 3 leases included in these amounts with scheduled annual rent increases. One lease is subject to cost of living adjustments (COLA) on January 1st of each year for the term of the lease. COLA adjustments for this lease will utilize the November Consumer Price Index of the Bureau of Labor Statistics of the U.S. Department of Labor for All Urban Consumers for Los Angeles‐Riverside‐Orange Counties. Two leases have future rental increases of 3% and 2%, on September 1st and July 1st , respectively, for the term of the lease. Total rental expenditure/expense for the year ended June 30, 2018 was $3,392, of which $294 was recorded in the General Fund.
80
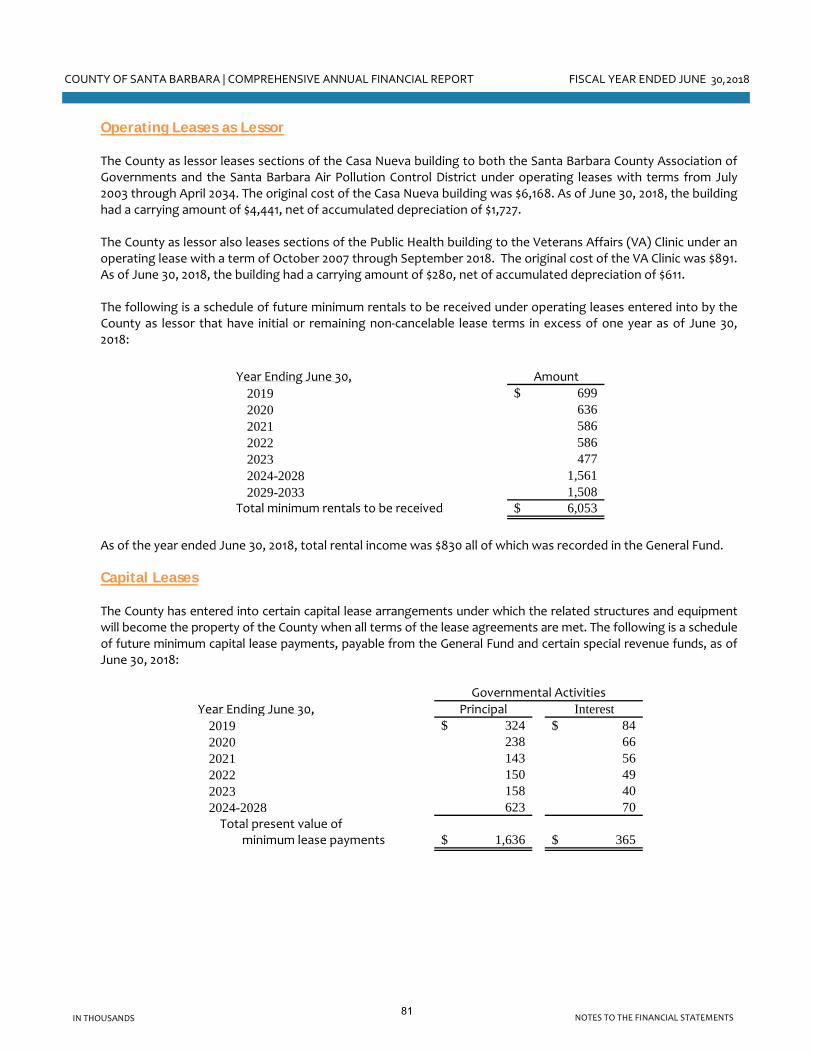
COUNTY OF SANTA BARBARA | COMPREHENSIVE ANNUAL FINANCIAL REPORT FISCAL YEAR ENDED JUNE 30,2018
NOTES TO THE FINANCIAL STATEMENTSIN THOUSANDS
Operating Leases as Lessor The County as lessor leases sections of the Casa Nueva building to both the Santa Barbara County Association of Governments and the Santa Barbara Air Pollution Control District under operating leases with terms from July 2003 through April 2034. The original cost of the Casa Nueva building was $6,168. As of June 30, 2018, the building had a carrying amount of $4,441, net of accumulated depreciation of $1,727. The County as lessor also leases sections of the Public Health building to the Veterans Affairs (VA) Clinic under an operating lease with a term of October 2007 through September 2018. The original cost of the VA Clinic was $891. As of June 30, 2018, the building had a carrying amount of $280, net of accumulated depreciation of $611.
The following is a schedule of future minimum rentals to be received under operating leases entered into by the County as lessor that have initial or remaining non‐cancelable lease terms in excess of one year as of June 30, 2018:
Year Ending June 30, Amount
2019 699$ 2020 636 2021 586 2022 586 2023 477 2024-2028 1,561 2029-2033 1,508
Total minimum rentals to be received 6,053$
As of the year ended June 30, 2018, total rental income was $830 all of which was recorded in the General Fund. Capital Leases The County has entered into certain capital lease arrangements under which the related structures and equipment will become the property of the County when all terms of the lease agreements are met. The following is a schedule of future minimum capital lease payments, payable from the General Fund and certain special revenue funds, as of June 30, 2018:
Year Ending June 30, Principal Interest2019 324$ 84$ 2020 238 66 2021 143 56 2022 150 49 2023 158 40 2024-2028 623 70 Total present value of
minimum lease payments 1,636$ 365$
Governmental Activities
81
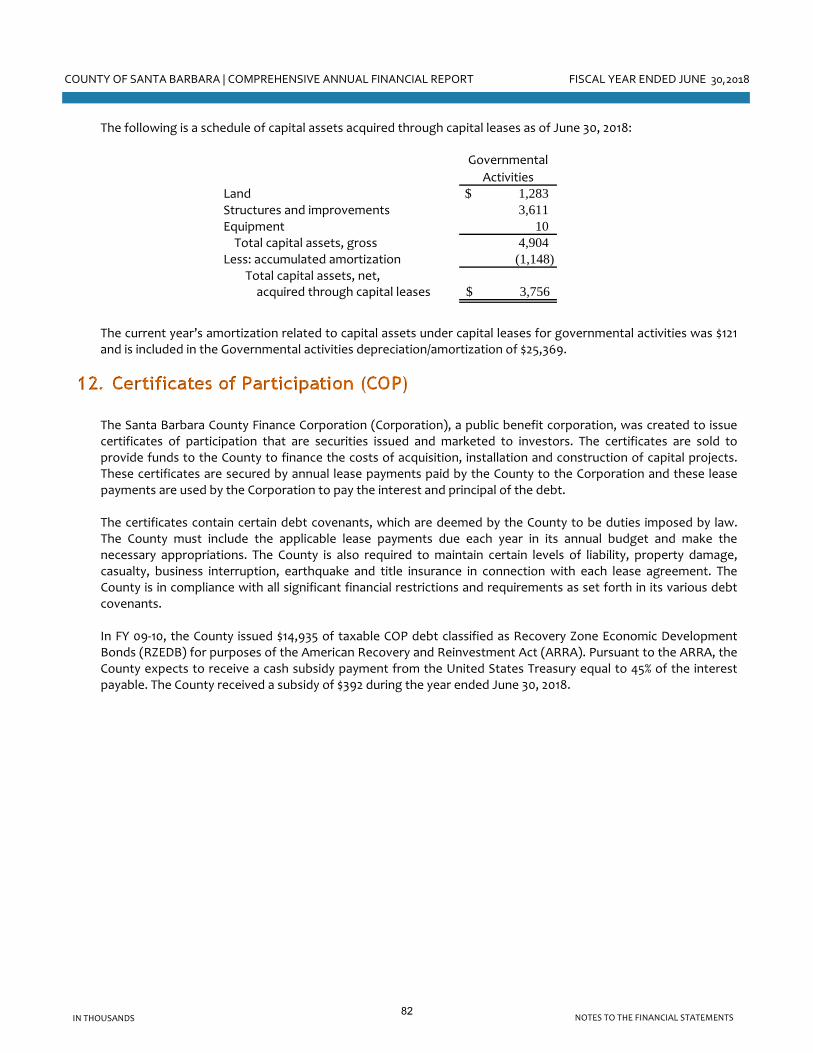
COUNTY OF SANTA BARBARA | COMPREHENSIVE ANNUAL FINANCIAL REPORT FISCAL YEAR ENDED JUNE 30,2018
NOTES TO THE FINANCIAL STATEMENTSIN THOUSANDS
The following is a schedule of capital assets acquired through capital leases as of June 30, 2018:
Governmental
ActivitiesLand $ 1,283 Structures and improvements 3,611 Equipment 10 Total capital assets, gross 4,904
Less: accumulated amortization (1,148)Total capital assets, net, acquired through capital leases 3,756$
The current year’s amortization related to capital assets under capital leases for governmental activities was $121 and is included in the Governmental activities depreciation/amortization of $25,369.
12. Certificates of Participation (COP)
The Santa Barbara County Finance Corporation (Corporation), a public benefit corporation, was created to issue certificates of participation that are securities issued and marketed to investors. The certificates are sold to provide funds to the County to finance the costs of acquisition, installation and construction of capital projects. These certificates are secured by annual lease payments paid by the County to the Corporation and these lease payments are used by the Corporation to pay the interest and principal of the debt. The certificates contain certain debt covenants, which are deemed by the County to be duties imposed by law. The County must include the applicable lease payments due each year in its annual budget and make the necessary appropriations. The County is also required to maintain certain levels of liability, property damage, casualty, business interruption, earthquake and title insurance in connection with each lease agreement. The County is in compliance with all significant financial restrictions and requirements as set forth in its various debt covenants. In FY 09‐10, the County issued $14,935 of taxable COP debt classified as Recovery Zone Economic Development Bonds (RZEDB) for purposes of the American Recovery and Reinvestment Act (ARRA). Pursuant to the ARRA, the County expects to receive a cash subsidy payment from the United States Treasury equal to 45% of the interest payable. The County received a subsidy of $392 during the year ended June 30, 2018.
82

COUNTY OF SANTA BARBARA | COMPREHENSIVE ANNUAL FINANCIAL REPORT FISCAL YEAR ENDED JUNE 30,2018
NOTES TO THE FINANCIAL STATEMENTSIN THOUSANDS
A summary of COP principal outstanding as of June 30, 2018 is as follows:
Interest
Rate %
Date of
Issue Maturity
Amount of
Original
Issue
Outstanding
as of
6/30/2018Governmental activities:2008 Capital Improvements 4.00-4.75 6/25/2008 12/1/2028 $ 17,000 $ 11,825 2010 Capital Improvements 3.00-5.00 6/10/2010 12/1/2019 884 220 2010 Capital Improvements ‐ RZEDB 6.22-6.25 6/10/2010 12/1/2040 14,935 14,935 Sub‐total governmental activities 32,819 26,980
Business‐type activities:2008 Capital Improvements 3.00-4.50 6/25/2008 12/1/2023 6,600 3,045 2010 Capital Improvements 3.00-5.00 6/10/2010 12/1/2019 2,821 708 Sub‐total business‐type activities 9,421 3,753
Total COP principal outstanding $ 42,240 $ 30,733
The following is a schedule of total COP debt service requirements to maturity as of June 30, 2018:
Year Ending June 30, Principal Interest Principal Interest
2019 $ 974 $ 1,454 $ 806 $ 145 2020 1,008 1,414 837 110 2021 1,430 1,358 495 81 2022 1,485 1,286 515 60 2023 1,545 1,209 540 37 2024-2028 8,763 4,757 560 13 2029-2033 4,815 2,766 -- -- 2034-2038 4,125 1,548 -- -- 2039-2043 2,835 270 -- -- Sub‐total 26,980 16,062 3,753 446
Unamortized premium 2 -- 13 -- Unamortized discount (110) -- -- -- Total COP debt, net $ 26,872 $ 16,062 $ 3,766 $ 446
Governmental Activities Business‐type Activities
13. Bonds and Notes Payable
Governmental Activities (Excluding Internal Service Funds) Bonds Payable On September 27, 2011, the County issued $16,945 of tax‐exempt bonds payable at an interest rate of 2.10%, and used the proceeds to refund the County’s 2001 COP debt. On December 17, 2014 the County issued $9,925 of private placement bonds at an interest rate of 2.33% and used the proceeds to refund the County’s 2005 COP debt.
83
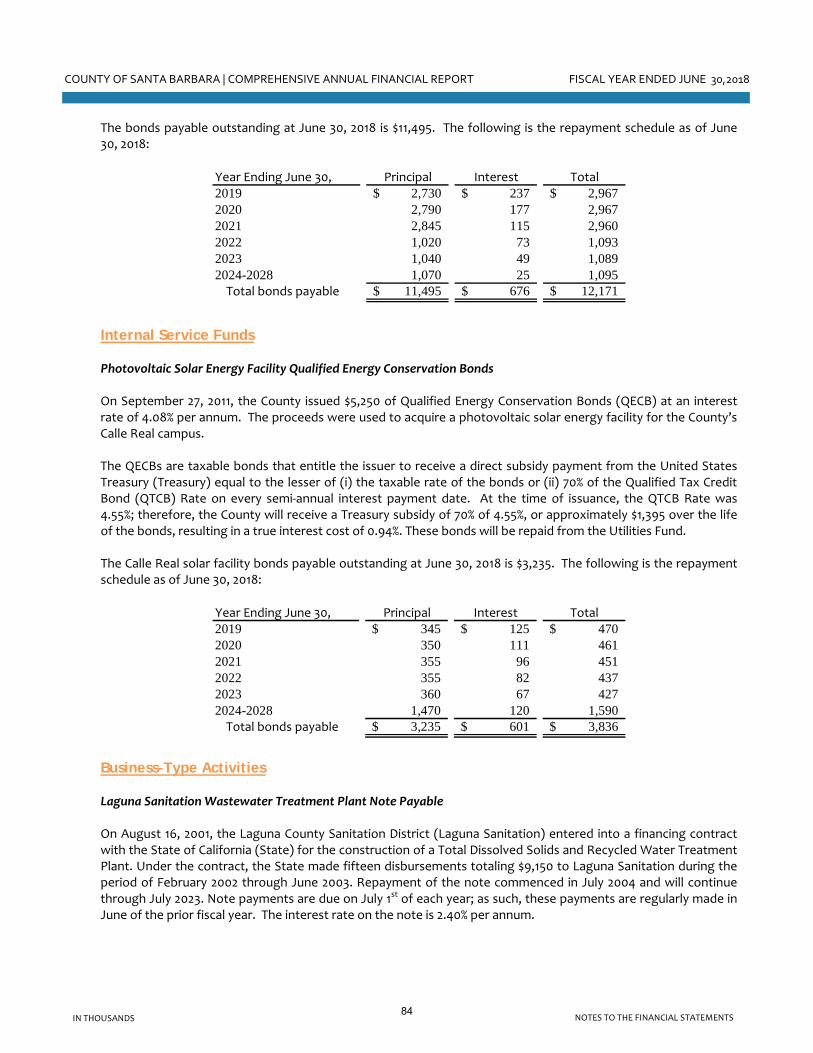
COUNTY OF SANTA BARBARA | COMPREHENSIVE ANNUAL FINANCIAL REPORT FISCAL YEAR ENDED JUNE 30,2018
NOTES TO THE FINANCIAL STATEMENTSIN THOUSANDS
The bonds payable outstanding at June 30, 2018 is $11,495. The following is the repayment schedule as of June 30, 2018:
Year Ending June 30, Principal Interest Total2019 2,730$ 237$ 2,967$ 2020 2,790 177 2,967 2021 2,845 115 2,960 2022 1,020 73 1,093 2023 1,040 49 1,089 2024-2028 1,070 25 1,095 Total bonds payable 11,495$ 676$ 12,171$
Internal Service Funds
Photovoltaic Solar Energy Facility Qualified Energy Conservation Bonds On September 27, 2011, the County issued $5,250 of Qualified Energy Conservation Bonds (QECB) at an interest rate of 4.08% per annum. The proceeds were used to acquire a photovoltaic solar energy facility for the County’s Calle Real campus. The QECBs are taxable bonds that entitle the issuer to receive a direct subsidy payment from the United States Treasury (Treasury) equal to the lesser of (i) the taxable rate of the bonds or (ii) 70% of the Qualified Tax Credit Bond (QTCB) Rate on every semi‐annual interest payment date. At the time of issuance, the QTCB Rate was 4.55%; therefore, the County will receive a Treasury subsidy of 70% of 4.55%, or approximately $1,395 over the life of the bonds, resulting in a true interest cost of 0.94%. These bonds will be repaid from the Utilities Fund.
The Calle Real solar facility bonds payable outstanding at June 30, 2018 is $3,235. The following is the repayment schedule as of June 30, 2018:
Year Ending June 30, Principal Interest Total2019 345$ 125$ 470$ 2020 350 111 461 2021 355 96 451 2022 355 82 437 2023 360 67 427 2024-2028 1,470 120 1,590 Total bonds payable 3,235$ 601$ 3,836$
Business-Type Activities Laguna Sanitation Wastewater Treatment Plant Note Payable On August 16, 2001, the Laguna County Sanitation District (Laguna Sanitation) entered into a financing contract with the State of California (State) for the construction of a Total Dissolved Solids and Recycled Water Treatment Plant. Under the contract, the State made fifteen disbursements totaling $9,150 to Laguna Sanitation during the period of February 2002 through June 2003. Repayment of the note commenced in July 2004 and will continue through July 2023. Note payments are due on July 1st of each year; as such, these payments are regularly made in June of the prior fiscal year. The interest rate on the note is 2.40% per annum.
84

COUNTY OF SANTA BARBARA | COMPREHENSIVE ANNUAL FINANCIAL REPORT FISCAL YEAR ENDED JUNE 30,2018
NOTES TO THE FINANCIAL STATEMENTSIN THOUSANDS
The note payable outstanding at June 30, 2018 is $2,773. The following is the repayment schedule as of June 30, 2018:
Year Ending June 30, Principal Interest Total
2019 $ 529 $ 67 $ 596 2020 541 54 595 2021 554 41 595 2022 568 28 596 2023 581 14 595 Total note payable $ 2,773 $ 204 $ 2,977
Laguna Sanitation Qualified Energy Conservation Bonds On May 25, 2011, the Laguna County Sanitation District (Laguna Sanitation) issued $4,170 of Qualified Energy Conservation Bonds (QECB) at an interest rate of 5.25% per annum. The proceeds were used to acquire a photovoltaic solar energy facility, which is projected to save Laguna Sanitation $12,000 in financing, operating and maintenance costs over a 30 year period. The QECBs are taxable bonds that entitle the issuer to receive a direct subsidy payment from the United States Treasury (Treasury) equal to the lesser of (i) the taxable rate of the bonds or (ii) 70% of the Qualified Tax Credit Bond (QTCB) Rate on every semi‐annual interest payment date. At the time of issuance, the QTCB Rate was 4.95%; therefore, the District will receive a Treasury subsidy of 70% of 4.95%, or $1,162 over the life of the bonds, resulting in a true interest cost of 1.97%. The Laguna Sanitation QECB bonds payable outstanding at June 30, 2018 is $2,366. The following is the repayment schedule as of June 30, 2018:
Year Ending June 30, Principal Interest Total
2019 $ 275 $ 121 $ 396 2020 280 106 386 2021 285 91 376 2022 295 76 371 2023 300 61 361 2024-2028 931 86 1,017 Total bonds payable $ 2,366 $ 541 $ 2,907
14. Self-insurance
The County is exposed to various risks of loss related to torts; theft of, damage to, and destruction of assets; errors and omissions; injuries to employees; natural disasters; and medical malpractice. For these risks, the County has chosen to establish risk management internal service funds where assets are set aside for claim settlements associated with such risks of loss up to certain limits. In addition, the County has established separate self‐insurance financing funds for unemployment claims and dental insurance benefits for employees and their dependents. For general liability, medical malpractice, and workers’ compensation claims, excess coverage is provided by the California State Association of Counties Excess Insurance Authority (Authority), a joint powers authority whose purpose is to develop and fund programs of excess insurance for its members, which include 95% of the counties in California and nearly 60% of the cities, as well as numerous school districts, special districts, housing authorities, fire districts, and other Joint Powers Authorities. A Board of Directors consisting of representatives from its
85

COUNTY OF SANTA BARBARA | COMPREHENSIVE ANNUAL FINANCIAL REPORT FISCAL YEAR ENDED JUNE 30,2018
NOTES TO THE FINANCIAL STATEMENTSIN THOUSANDS
members governs the Authority. The County’s aggregate annual premium, including property insurance, paid to the Authority for the year ended June 30, 2018, was $18,579. The Authority issues its own audited Comprehensive Annual Financial Report which can be obtained from the Authority located at 75 Iron Point Circle, Suite 200, Folsom, CA 95630. The Authority retains financial responsibility for risk management claims in excess of the County’s self‐insurance retention. Self‐insurance and Authority limits are as follows:
Self‐Insurance AuthorityType of Coverage Limit LimitGeneral Liability 500$ 35,000$ Medical Malpractice** --$ 25,000$ Workers’ Compensation* --$ Statutory
*Effective July 1, 2010, the County obtained first dollar Workers’ Compensation coverage through the Authority’s Primary Workers’ Compensation program. Claims for injuries prior to that date are covered under the Authority’s Excess Insurance program. **Effective October 1, 2014, the County obtained first dollar Medical Malpractice coverage through the Authority’s Primary Medical Malpractice program. Claims for injuries prior to that date are covered under the Authority’s Excess Insurance program.
The County purchases property insurance through the Authority from commercial insurance companies via a pool comprised of a majority of California counties and other California Public Agencies. The County is insured up to $600,000 for All Risk coverage, and up to $540,000 for Flood and Earthquake coverages. All property damage risks are covered on a per occurrence basis and insured at full replacement values up to the policy limits. Deductibles per occurrence are $10 for fire or other property damage, and $25 for flood. The earthquake deductible is 5% of total values per separate building per occurrence, subject to a $100 minimum. Settled claims have not exceeded insurance coverage in any of the past three fiscal years. The unpaid claims liabilities included in the risk management self‐insurance internal service funds are based on the results of actuarial studies and include amounts for claims incurred but not reported and adjustment expenses. Claims liabilities are calculated considering the effects of inflation, recent claim settlement trends including frequency and amount of pay‐outs, and other economic and social factors. General liability, workers’ compensation, and medical malpractice liabilities are carried at present value using a discount rate of 1%. It is the County’s practice to annually obtain full actuarial studies for general liability, medical malpractice, and workers’ compensation coverages. Premiums are charged to departments using various allocation methods that include actual costs, trends in claims experience, and payroll costs. Premiums charged annually are established such that, when added with cash reserves on hand, adequate resources are provided to meet liabilities as they come due.
Changes in the claims liability for all self‐insurance claims during the past two fiscal years are as follows:
Fiscal Year EndedJune 30, 2017 June 30, 2018
Unpaid claims, beginning of year $ 21,352 $ 19,582 Incurred claims 9,386 11,632 Claim payments (11,156) (11,561)Unpaid claims, end of year 19,582$ 19,653$
86

COUNTY OF SANTA BARBARA | COMPREHENSIVE ANNUAL FINANCIAL REPORT FISCAL YEAR ENDED JUNE 30,2018
NOTES TO THE FINANCIAL STATEMENTSIN THOUSANDS
15. Commitments and Contingencies
Litigation The County is subject to various lawsuits and claims involving public liability and other actions incidental to the ordinary course of County operations. To the extent the outcome of such litigation has been determined to result in probable financial loss to the County, a liability for litigation of $809, representing County Counsel’s best estimate of the ultimate loss, has been accrued in the governmentwide Statement of Net Position. The timing of the payment of these losses cannot presently be determined. A number of lawsuits and claims are pending against the County for which the financial loss to the County has been determined to be reasonably possible by County Counsel. These lawsuits include claims filed for inverse condemnation, tort liability, workers’ compensation, civil rights violation, breach of contract, land use disputes, and storm damage. These lawsuits are seeking damages in excess of $1,599. The County intends to vigorously defend itself against these lawsuits. The aggregate amount of the uninsured liabilities of the County and the timing of any anticipated payments which may result from such claims will not, in the opinion of County Counsel, significantly affect the financial condition of the County.
Grants The County recognizes as revenue grant monies received as reimbursement for costs incurred in certain federal and state programs it administers. Although the County’s federal grant programs are audited in accordance with the requirements of the U.S. Office of Management and Budget Uniform Guidance 2 CFR Part 200, these programs may be subject to financial and compliance audits by the reimbursing agencies. The amount, if any, of expenditures which may be disallowed by the granting agencies cannot be determined at this time, although the County expects such amounts, if any, to be immaterial, with the exception of the Behavioral Wellness Fund.
Behavioral Wellness Fund Counties provide mental health services to Medi‐Cal beneficiaries through a publicly or privately operated mental health managed care plan contracted with the State Department of Health Care Services (DHCS) and share in the financial risk. Each California County operates its own mental health plan for Medi‐Cal beneficiaries. The County, through the mental health plan, provides mental health services to adults and children directly and through Community Based Organizations (CBO). Mental Health Medi‐Cal claiming is a reimbursement system in which counties are provided an interim cash flow of State and Federal funding pending a three step process of reimbursement that includes filing a cost report, settlement of valid units of service and a cost report audit. Funding is made available through the Federal Medicaid entitlement program and California provides matching State and County funds. Claims are reimbursed based upon the appropriate Federal Medical Assistance Percentage (FMAP). This percentage represents the percentage of a claim for which the Federal government will pay Federal Financial Participation (FFP). Any amounts not provided by FFP must be matched by State or County funds. The year‐end reporting process is the culmination of the mental health financial and statistical data accumulation for the services provided within the relevant Fiscal Year. The County is required to submit a cost report to DHCS by December 31 for all services provided by County and CBO staff for a fiscal year ending June 30. The cost report serves as a basis for computing the year‐end settlement of approved service units and a settlement payment between DHCS and the County and is also the basic standardized record subject to audit. All year‐end settlements are considered interim settlements and are subject to audit by DHCS. The audit is required to be completed three years after the year‐end cost report is submitted and reconciled. Generally the cycle, from cost report submittal to final settlement, is not complete until five years after the initial cost report is filed by the County.
87
COUNTY OF SANTA BARBARA | COMPREHENSIVE ANNUAL FINANCIAL REPORT FISCAL YEAR ENDED JUNE 30,2018
NOTES TO THE FINANCIAL STATEMENTSIN THOUSANDS
In past years this cost report settlement and audit process resulted in significant settlements with the State Department of Mental Health and now its successor agency DHCS. The County currently estimates a potential liability exposure of up to $1.2 million for outstanding issues with the State of California. The settlement and payment of these liabilities could span a five to ten year period. These liabilities have been recorded as other long‐term liabilities payable in the Behavioral Wellness Fund.
Santa Barbara County Redevelopment Successor Agency In accordance with Assembly Bill (AB) 1X 26 and AB 1434, all redevelopment agencies in the State of California were dissolved and ceased to operate as legal entities as of February 1, 2012. It is reasonably possible that the State Department of Finance could invalidate any of the obligations reported on the Successor Agency’s Recognized Obligations Payment Schedule. The range of potential loss of revenue to pay these obligations is between $0 and $20,000 over the remaining life of the Successor Agency (11 years).
Contracts The County has entered into contracts to purchase goods and services from various vendors. Approximately $290,385 will be payable upon future performance under these contracts, including $86,945 in contracts for the Northern Branch Jail.
Federal and State Disaster Assistance On January 2, 2018, a presidential major disaster was declared for the areas affected by the Thomas Fire. On January 11, 2018, the declaration was expanded to include areas affected by the Montecito Debris Flows. The declaration made federal disaster assistance available to the State of California to supplement the County’s local recovery efforts. During FY 17‐18, the County incurred an estimated $32,200 of emergency response and disaster recovery costs for these events. While a portion of these costs may be eligible for State and Federal assistance, no awards were obligated to the County as of June 30, 2018 or through the date these financial statements were issued. Due to uncertainty in the amount of State and Federal awards that will be realized, no amounts have been recognized as of June 30, 2018.
16. Landfill Closure and Postclosure Care
The County owns and operates three landfill sites: Tajiguas, Foxen Canyon, and New Cuyama. Two of the three sites are closed ‐ New Cuyama closed in FY 95‐96; Foxen Canyon was converted to a transfer station in FY 03‐04 and subsequently closed in FY 08‐09. State and federal laws and regulations require the County to place a final cover on these landfill sites when they stop accepting waste and to perform certain maintenance and monitoring functions at each site for thirty years after closure. Although closure and postclosure care costs will be paid only near or after the date that the respective landfill stops accepting waste, the County reports a portion of these closure and postclosure care costs as an operating expense in each period based on landfill capacity used as of each Balance Sheet date.
88

COUNTY OF SANTA BARBARA | COMPREHENSIVE ANNUAL FINANCIAL REPORT FISCAL YEAR ENDED JUNE 30,2018
NOTES TO THE FINANCIAL STATEMENTSIN THOUSANDS
The $30,263 reported as landfill closure and postclosure care liability at June 30, 2018, represents the cumulative amount reported to date based on the estimated percentages of used capacity of the landfills as follows:
RemainingCapacity Remaining Postclosure
Landfill Used Years YearsTajiguas 86% 8 OpenFoxen Canyon 95% closed 21New Cuyama 100% closed 11
The County will recognize the remaining estimated cost of closure and postclosure care of $4,349 as the remaining estimated capacity is filled. These amounts are based on what it would cost to perform all remaining closure and postclosure care in 2018. The County expects to close the Tajiguas landfill in the year 2026. Actual cost may be higher due to inflation, changes in technology, or changes in regulations. The County is required by state and federal laws and regulations to make annual contributions and/or provide an alternative funding mechanism to finance closure and postclosure care. The County is in compliance with these requirements, and, at June 30, 2018, restricted cash and investments of $20,354 are held for these purposes. These are reported as restricted assets on the Balance Sheet (see Note 4). Restricted cash for closure, postclosure care, and corrective action financial assurances costs at June 30, 2018 is comprised of the following:
Landfill Closure Cost
Postclosure
Care Cost
Corrective
Action Cost
Total
Restricted
CashTajiguas $ 14,623 3,040$ 1,010$ $ 18,673 Foxen Canyon -- 545 298 843 New Cuyama -- 119 719 838
Total 14,623$ 3,704$ 2,027$ 20,354$
Additionally, the County has pledged revenues from future tipping fees generated at the Santa Barbara South Coast Transfer Station to fund a portion of the postclosure maintenance costs. The County expects that future inflation costs will be paid from interest earnings on these annual contributions. However, if interest earnings are inadequate or additional postclosure care requirements are determined (due to changes in technology or applicable laws or regulations, for example), these costs may need to be covered through landfill tip fees and/or added program fees to the municipal refuse rates paid by county residents.
89
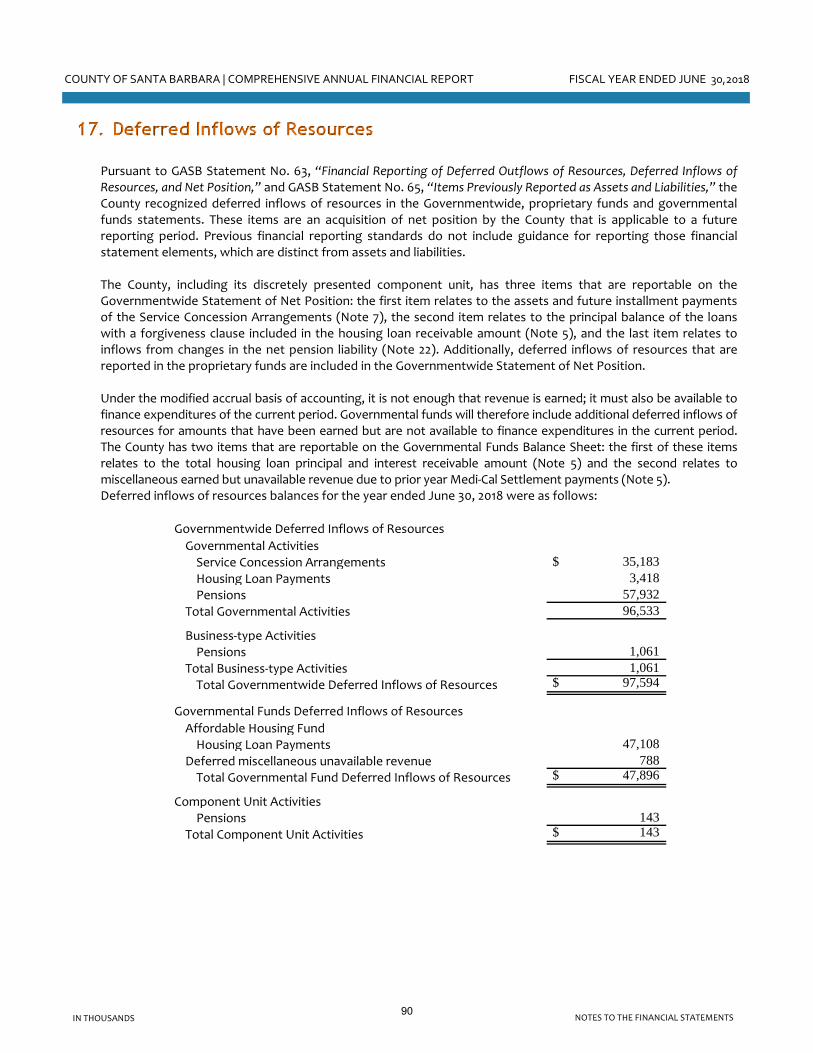
COUNTY OF SANTA BARBARA | COMPREHENSIVE ANNUAL FINANCIAL REPORT FISCAL YEAR ENDED JUNE 30,2018
NOTES TO THE FINANCIAL STATEMENTSIN THOUSANDS
17. Deferred Inflows of Resources Pursuant to GASB Statement No. 63, “Financial Reporting of Deferred Outflows of Resources, Deferred Inflows of Resources, and Net Position,” and GASB Statement No. 65, “Items Previously Reported as Assets and Liabilities,” the County recognized deferred inflows of resources in the Governmentwide, proprietary funds and governmental funds statements. These items are an acquisition of net position by the County that is applicable to a future reporting period. Previous financial reporting standards do not include guidance for reporting those financial statement elements, which are distinct from assets and liabilities. The County, including its discretely presented component unit, has three items that are reportable on the Governmentwide Statement of Net Position: the first item relates to the assets and future installment payments of the Service Concession Arrangements (Note 7), the second item relates to the principal balance of the loans with a forgiveness clause included in the housing loan receivable amount (Note 5), and the last item relates to inflows from changes in the net pension liability (Note 22). Additionally, deferred inflows of resources that are reported in the proprietary funds are included in the Governmentwide Statement of Net Position. Under the modified accrual basis of accounting, it is not enough that revenue is earned; it must also be available to finance expenditures of the current period. Governmental funds will therefore include additional deferred inflows of resources for amounts that have been earned but are not available to finance expenditures in the current period. The County has two items that are reportable on the Governmental Funds Balance Sheet: the first of these items relates to the total housing loan principal and interest receivable amount (Note 5) and the second relates to miscellaneous earned but unavailable revenue due to prior year Medi‐Cal Settlement payments (Note 5). Deferred inflows of resources balances for the year ended June 30, 2018 were as follows:
Governmentwide Deferred Inflows of Resources
Governmental ActivitiesService Concession Arrangements $ 35,183 Housing Loan Payments 3,418 Pensions 57,932
Total Governmental Activities 96,533
Business‐type ActivitiesPensions 1,061
Total Business‐type Activities 1,061 Total Governmentwide Deferred Inflows of Resources $ 97,594
Governmental Funds Deferred Inflows of Resources
Affordable Housing FundHousing Loan Payments 47,108
Deferred miscellaneous unavailable revenue 788 Total Governmental Fund Deferred Inflows of Resources $ 47,896
Component Unit ActivitiesPensions 143
Total Component Unit Activities $ 143
90
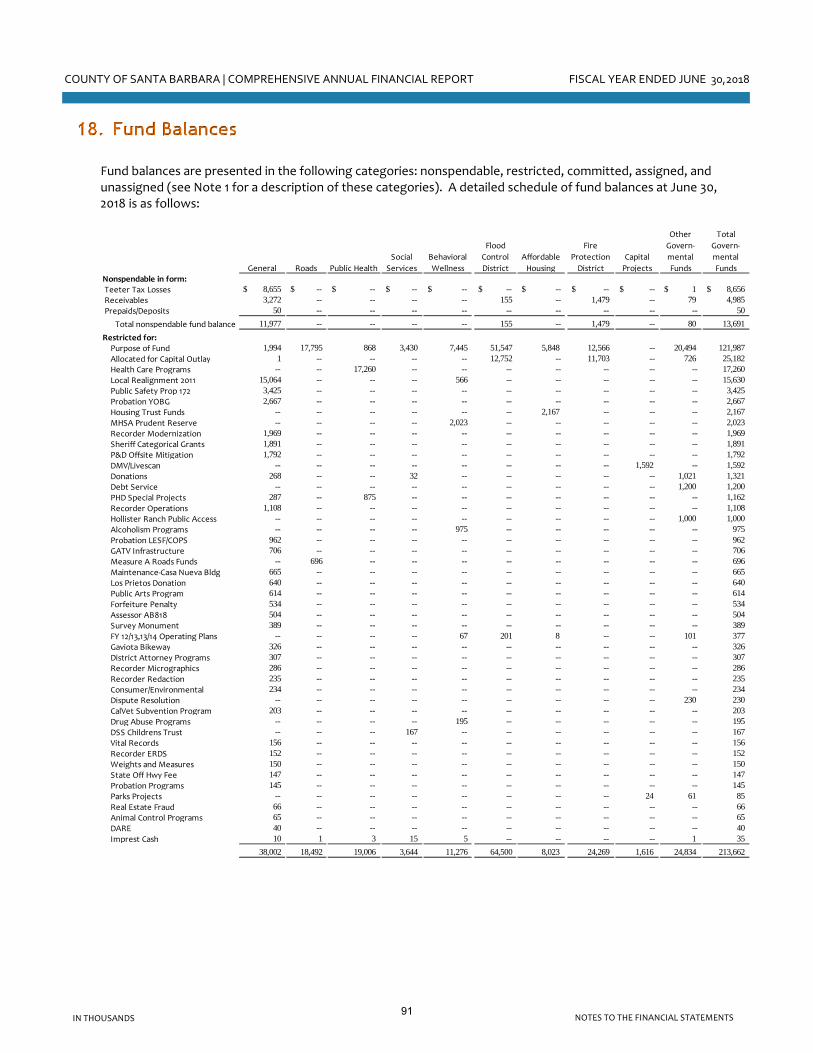
COUNTY OF SANTA BARBARA | COMPREHENSIVE ANNUAL FINANCIAL REPORT FISCAL YEAR ENDED JUNE 30,2018
NOTES TO THE FINANCIAL STATEMENTSIN THOUSANDS
18. Fund Balances
Fund balances are presented in the following categories: nonspendable, restricted, committed, assigned, and unassigned (see Note 1 for a description of these categories). A detailed schedule of fund balances at June 30, 2018 is as follows:
General Roads Public Health
Social
Services
Behavioral
Wellness
Flood
Control
District
Affordable
Housing
Fire
Protection
District
Capital
Projects
Other
Govern‐
mental
Funds
Total
Govern‐
mental
FundsNonspendable in form: Teeter Tax Losses $ 8,655 $ -- $ -- $ -- $ -- $ -- $ -- $ -- $ -- $ 1 $ 8,656 Receivables 3,272 -- -- -- -- 155 -- 1,479 -- 79 4,985 Prepaids/Deposits 50 -- -- -- -- -- -- -- -- -- 50
Total nonspendable fund balance 11,977 -- -- -- -- 155 -- 1,479 -- 80 13,691 Restricted for:
Purpose of Fund 1,994 17,795 868 3,430 7,445 51,547 5,848 12,566 -- 20,494 121,987 Allocated for Capital Outlay 1 -- -- -- -- 12,752 -- 11,703 -- 726 25,182 Health Care Programs -- -- 17,260 -- -- -- -- -- -- -- 17,260 Local Realignment 2011 15,064 -- -- -- 566 -- -- -- -- -- 15,630 Public Safety Prop 172 3,425 -- -- -- -- -- -- -- -- -- 3,425 Probation YOBG 2,667 -- -- -- -- -- -- -- -- -- 2,667 Housing Trust Funds -- -- -- -- -- -- 2,167 -- -- -- 2,167 MHSA Prudent Reserve -- -- -- -- 2,023 -- -- -- -- -- 2,023 Recorder Modernization 1,969 -- -- -- -- -- -- -- -- -- 1,969 Sheriff Categorical Grants 1,891 -- -- -- -- -- -- -- -- -- 1,891 P&D Offsite Mitigation 1,792 -- -- -- -- -- -- -- -- -- 1,792 DMV/Livescan -- -- -- -- -- -- -- -- 1,592 -- 1,592 Donations 268 -- -- 32 -- -- -- -- -- 1,021 1,321 Debt Service -- -- -- -- -- -- -- -- -- 1,200 1,200 PHD Special Projects 287 -- 875 -- -- -- -- -- -- -- 1,162 Recorder Operations 1,108 -- -- -- -- -- -- -- -- -- 1,108 Hollister Ranch Public Access -- -- -- -- -- -- -- -- -- 1,000 1,000 Alcoholism Programs -- -- -- -- 975 -- -- -- -- -- 975 Probation LESF/COPS 962 -- -- -- -- -- -- -- -- -- 962 GATV Infrastructure 706 -- -- -- -- -- -- -- -- -- 706 Measure A Roads Funds -- 696 -- -- -- -- -- -- -- -- 696 Maintenance‐Casa Nueva Bldg 665 -- -- -- -- -- -- -- -- -- 665 Los Prietos Donation 640 -- -- -- -- -- -- -- -- -- 640 Public Arts Program 614 -- -- -- -- -- -- -- -- -- 614 Forfeiture Penalty 534 -- -- -- -- -- -- -- -- -- 534 Assessor AB818 504 -- -- -- -- -- -- -- -- -- 504 Survey Monument 389 -- -- -- -- -- -- -- -- -- 389 FY 12/13,13/14 Operating Plans -- -- -- -- 67 201 8 -- -- 101 377 Gaviota Bikeway 326 -- -- -- -- -- -- -- -- -- 326 District Attorney Programs 307 -- -- -- -- -- -- -- -- -- 307 Recorder Micrographics 286 -- -- -- -- -- -- -- -- -- 286 Recorder Redaction 235 -- -- -- -- -- -- -- -- -- 235 Consumer/Environmental 234 -- -- -- -- -- -- -- -- -- 234 Dispute Resolution -- -- -- -- -- -- -- -- -- 230 230 CalVet Subvention Program 203 -- -- -- -- -- -- -- -- -- 203 Drug Abuse Programs -- -- -- -- 195 -- -- -- -- -- 195 DSS Childrens Trust -- -- -- 167 -- -- -- -- -- -- 167 Vital Records 156 -- -- -- -- -- -- -- -- -- 156 Recorder ERDS 152 -- -- -- -- -- -- -- -- -- 152 Weights and Measures 150 -- -- -- -- -- -- -- -- -- 150 State Off Hwy Fee 147 -- -- -- -- -- -- -- -- -- 147 Probation Programs 145 -- -- -- -- -- -- -- -- -- 145 Parks Projects -- -- -- -- -- -- -- -- 24 61 85 Real Estate Fraud 66 -- -- -- -- -- -- -- -- -- 66 Animal Control Programs 65 -- -- -- -- -- -- -- -- -- 65 DARE 40 -- -- -- -- -- -- -- -- -- 40 Imprest Cash 10 1 3 15 5 -- -- -- -- 1 35
38,002 18,492 19,006 3,644 11,276 64,500 8,023 24,269 1,616 24,834 213,662
91

COUNTY OF SANTA BARBARA | COMPREHENSIVE ANNUAL FINANCIAL REPORT FISCAL YEAR ENDED JUNE 30,2018
NOTES TO THE FINANCIAL STATEMENTSIN THOUSANDS
A detailed schedule of fund balances at June 30, 2018 continued:
General Roads Public Health
Social
Services
Behavioral
Wellness
Flood
Control
District
Affordable
Housing
Fire
Protection
District
Capital
Projects
Other
Govern‐
mental
Funds
Total
Govern‐
mental
FundsCommitted to:
Strategic Reserve 23,717 -- -- -- -- -- -- -- -- -- 23,717 Purpose of Fund 1,483 -- -- 1,784 -- -- -- -- 13,814 1,164 18,245 New Jail Operations 13,054 -- -- -- -- -- -- -- -- -- 13,054 Health Care Programs -- -- 6,768 -- -- -- -- -- -- -- 6,768 Litigation 4,439 -- -- -- -- -- -- -- -- -- 4,439 General Services Projects 1,301 -- -- -- -- -- -- -- 2,843 -- 4,144 Parks Projects 1,353 -- -- -- -- -- -- -- 2,193 -- 3,546 Emerging Issues 3,276 -- -- -- -- -- -- -- -- -- 3,276 Contingencies 2,005 -- -- -- -- -- -- -- -- -- 2,005 Program Stabilization 1,875 -- -- -- -- -- -- -- -- -- 1,875 Clerk Record Assessor Projects 1,795 -- -- -- -- -- -- -- -- -- 1,795 Auditor Systems Maint/Develop 1,765 -- -- -- -- -- -- -- -- -- 1,765 County Executive Programs 1,299 -- -- -- -- -- -- -- -- -- 1,299 Planning/Development Projects 1,290 -- -- -- -- -- -- -- -- -- 1,290 Sheriff Projects 431 -- -- -- -- -- -- -- 808 -- 1,239 Assr Prop Sys Maint/Develop 1,135 -- -- -- -- -- -- -- -- -- 1,135 Mental Health 924 -- -- -- -- -- -- -- -- -- 924 Elections Voting Equipment 916 -- -- -- -- -- -- -- -- -- 916 P&D Land Use System 905 -- -- -- -- -- -- -- -- -- 905 Treas Tax Collector Projects 809 -- -- -- -- -- -- -- -- -- 809 Human Resources Programs 774 -- -- -- -- -- -- -- -- -- 774 Assessment Appeals Support 715 -- -- -- -- -- -- -- -- -- 715 Accumulated Capital Outlay 700 -- -- -- -- -- -- -- -- -- 700 Tobacco Settlement 634 -- 4 -- -- -- -- -- -- -- 638 General County Programs 593 -- -- -- -- -- -- -- -- -- 593 Facilities Maintenance 506 -- -- -- -- -- -- -- -- -- 506 District Attorney Programs 492 -- -- -- -- -- -- -- -- -- 492 North County Jail Contingency 302 -- -- -- -- -- -- -- -- -- 302 Housing Programs 282 -- -- -- -- -- -- -- -- -- 282 Public Defender Programs 220 -- -- -- -- -- -- -- -- -- 220 Rental Maintenance 151 -- -- -- -- -- -- -- -- -- 151 Probation Programs 94 -- -- -- -- -- -- -- -- -- 94 Building & Safety Permitting 40 -- -- -- -- -- -- -- -- -- 40 Imprest Cash 22 -- -- -- -- -- -- -- -- -- 22 Maintenance Policy 18% 7 -- -- -- -- -- -- -- -- -- 7 Ag Commissioner Projects 1 -- -- -- -- -- -- -- -- -- 1
69,305 -- 6,772 1,784 -- -- -- -- 19,658 1,164 98,683
Unassigned fund balance: 10,591 -- -- -- -- -- -- -- -- -- 10,591
Total fund balances $ 129,875 $ 18,492 $ 25,778 $ 5,428 $ 11,276 $ 64,655 $ 8,023 $ 25,748 $ 21,274 $ 26,078 $ 336,627
92

COUNTY OF SANTA BARBARA | COMPREHENSIVE ANNUAL FINANCIAL REPORT FISCAL YEAR ENDED JUNE 30,2018
NOTES TO THE FINANCIAL STATEMENTSIN THOUSANDS
19. Restricted Component of Net Position
The restricted component of net position are assets that are subject to constraints either (1) externally imposed by creditors (such as debt covenants), grantors, contributors, or laws or regulations of other governments or (2) imposed by law through constitutional provisions or enabling legislation. The restricted component of net position at June 30, 2018 for governmental activities is as follows:
$ 716 716$
25,748 19,487
Sheriff 7,758 District Attorney 1,370
217 230
54,810
21,353 Behavioral Wellness 11,276
3,750 469
36,848
Restricted for Community Resources & Public Facilities: 64,654
Housing 51,713 18,492
Water Agency 8,109 County Service Areas 3,644 Other 2,304 Planning and Development 3,464 Parks 2,015
453 154,848
Restricted for General Government & Support Services: 4,410 834 203
5,447
14,623 2,729 1,021
18,373
position ‐ governmental activities 271,042$
Restricted for General County Programs:
Restricted for Policy and Executive:
County Executive Office
Total restricted component of net
Public and Educational AccessOther
Criminal Justice and Courthouse Construction
Restricted for Public Safety:
ProbationFire Protection District
Public Defender
Restricted for Health & Public Assistance:
Trial Courts
Child Support Services
Public Health
Social Services
General Services
Roads
Clerk‐Recorder‐Assessor
Other
Coastal Resources Enhancement
Flood Control District
Included in governmental activities restricted net position at June 30, 2018 is net position restricted by enabling legislation of $864.
93
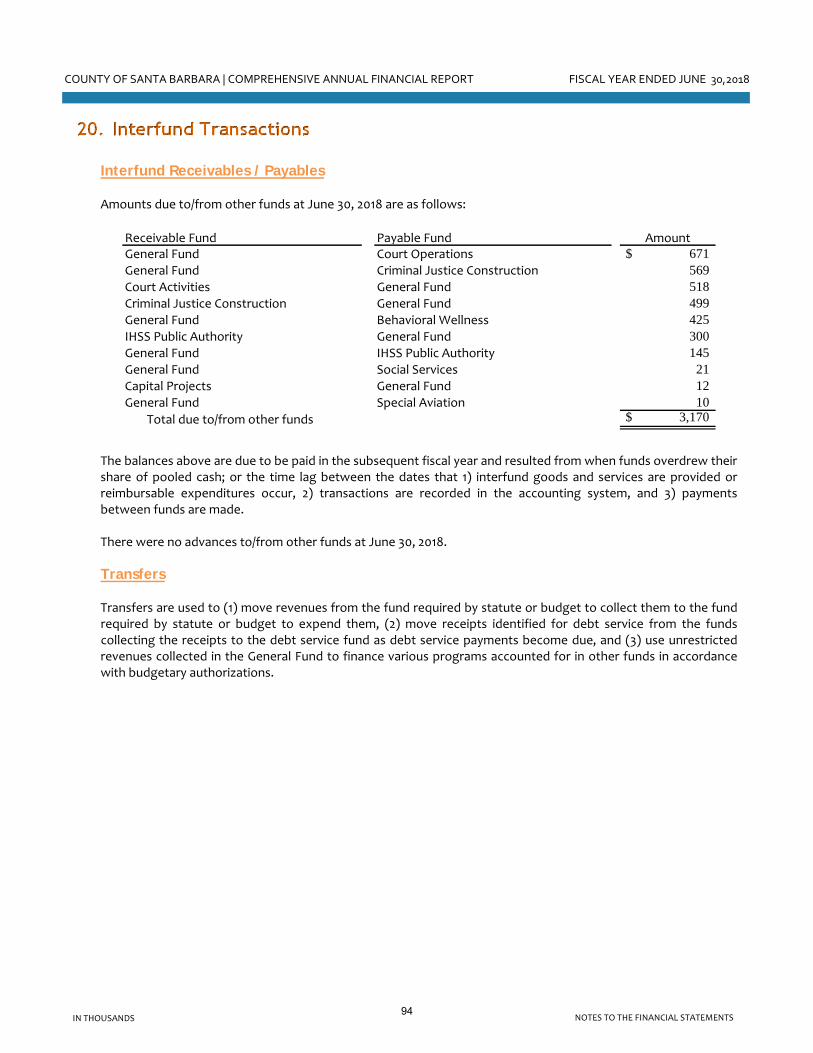
COUNTY OF SANTA BARBARA | COMPREHENSIVE ANNUAL FINANCIAL REPORT FISCAL YEAR ENDED JUNE 30,2018
NOTES TO THE FINANCIAL STATEMENTSIN THOUSANDS
20. Interfund Transactions
Interfund Receivables / Payables Amounts due to/from other funds at June 30, 2018 are as follows:
Receivable Fund Payable Fund AmountGeneral Fund Court Operations $ 671 General Fund Criminal Justice Construction 569 Court Activities General Fund 518 Criminal Justice Construction General Fund 499 General Fund Behavioral Wellness 425 IHSS Public Authority General Fund 300 General Fund IHSS Public Authority 145 General Fund Social Services 21 Capital Projects General Fund 12 General Fund Special Aviation 10
Total due to/from other funds $ 3,170
The balances above are due to be paid in the subsequent fiscal year and resulted from when funds overdrew their share of pooled cash; or the time lag between the dates that 1) interfund goods and services are provided or reimbursable expenditures occur, 2) transactions are recorded in the accounting system, and 3) payments between funds are made. There were no advances to/from other funds at June 30, 2018.
Transfers Transfers are used to (1) move revenues from the fund required by statute or budget to collect them to the fund required by statute or budget to expend them, (2) move receipts identified for debt service from the funds collecting the receipts to the debt service fund as debt service payments become due, and (3) use unrestricted revenues collected in the General Fund to finance various programs accounted for in other funds in accordance with budgetary authorizations.
94
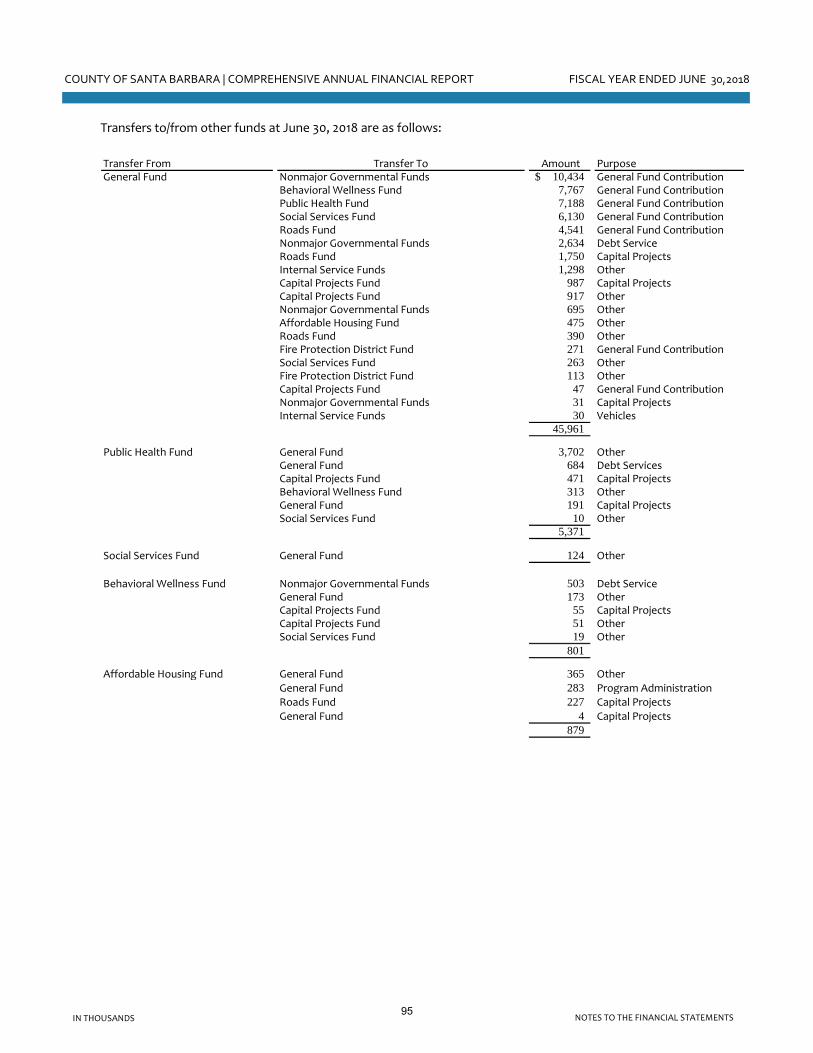
COUNTY OF SANTA BARBARA | COMPREHENSIVE ANNUAL FINANCIAL REPORT FISCAL YEAR ENDED JUNE 30,2018
NOTES TO THE FINANCIAL STATEMENTSIN THOUSANDS
Transfers to/from other funds at June 30, 2018 are as follows:
Transfer From Transfer To Amount PurposeGeneral Fund Nonmajor Governmental Funds 10,434$ General Fund Contribution
Behavioral Wellness Fund 7,767 General Fund ContributionPublic Health Fund 7,188 General Fund ContributionSocial Services Fund 6,130 General Fund ContributionRoads Fund 4,541 General Fund ContributionNonmajor Governmental Funds 2,634 Debt ServiceRoads Fund 1,750 Capital ProjectsInternal Service Funds 1,298 OtherCapital Projects Fund 987 Capital ProjectsCapital Projects Fund 917 OtherNonmajor Governmental Funds 695 OtherAffordable Housing Fund 475 OtherRoads Fund 390 OtherFire Protection District Fund 271 General Fund ContributionSocial Services Fund 263 OtherFire Protection District Fund 113 OtherCapital Projects Fund 47 General Fund ContributionNonmajor Governmental Funds 31 Capital ProjectsInternal Service Funds 30 Vehicles
45,961
Public Health Fund General Fund 3,702 OtherGeneral Fund 684 Debt ServicesCapital Projects Fund 471 Capital ProjectsBehavioral Wellness Fund 313 OtherGeneral Fund 191 Capital ProjectsSocial Services Fund 10 Other
5,371
Social Services Fund General Fund 124 Other
Behavioral Wellness Fund Nonmajor Governmental Funds 503 Debt ServiceGeneral Fund 173 OtherCapital Projects Fund 55 Capital ProjectsCapital Projects Fund 51 OtherSocial Services Fund 19 Other
801
Affordable Housing Fund General Fund 365 OtherGeneral Fund 283 Program AdministrationRoads Fund 227 Capital ProjectsGeneral Fund 4 Capital Projects
879
95

COUNTY OF SANTA BARBARA | COMPREHENSIVE ANNUAL FINANCIAL REPORT FISCAL YEAR ENDED JUNE 30,2018
NOTES TO THE FINANCIAL STATEMENTSIN THOUSANDS
Transfers to/from other funds at June 30, 2018 (continued):
Transfer From Transfer To Amount PurposeFire Protection District General Fund 1,791$ Other
Internal Service Funds 1,354 VehiclesNonmajor Governmental Funds 241 Debt ServicePublic Health Fund 11 Other
3,397
Nonmajor Governmental Funds Nonmajor Governmental Funds 1,241 Debt ServiceGeneral Fund 974 OtherCapital Projects Fund 422 Capital ProjectsRoads Fund 156 OtherFire Protection District Fund 124 OtherCapital Projects Fund 92 OtherFire Protection District Fund 42 Program AdministrationCapital Projects Fund 31 Program AdministrationFlood Control Districts Fund 29 OtherGeneral Fund 20 Program AdministrationFlood Control Districts Fund 5 Program Administration
3,136
Enterprise Funds Capital Projects Fund 36 Capital Projects
Internal Service Funds General Fund 43 VehiclesNonmajor Governmental Funds 16 Vehicles
59
Total transfers 59,764$
21. Tax Abatements
The County provides property tax abatements through the Agricultural Preserve Program. The program enrolls land in Williamson Act or Farmland Security Zone contracts whereby the land is enforceably restricted to agricultural, open space, or recreational uses in exchange for reduced property tax assessments. Participation in the program is voluntary. The Santa Barbara County Uniform Rules for Agricultural Preserves and Farmland Security Zones is the set of rules by which the County administers its Agricultural Preserve Program. The Agricultural Preserve Advisory Committee is responsible for administering the County's Agricultural Preserve Program. Under the provisions of these contracts, land parcels are assessed for property tax purposes at a rate consistent with their actual use, rather than potential market value of the property. The minimum contract term is ten years and automatically renews until a nonrenewal or cancellation process is initiated. Under the nonrenewal process, the annual tax assessment increases over a defined period of time until the assessment reflects the market value of the property. Under the cancellation process, a significant onetime cancellation fee is assessed based upon a certain percentage of the unrestricted, current fair market value of the property. No other commitments were made by the County as part of the Williamson Act or Farmland Security Zone contracts. For the fiscal year ended June 30, 2018, the Agricultural Preserve Program tax abatements were $3,830.
96
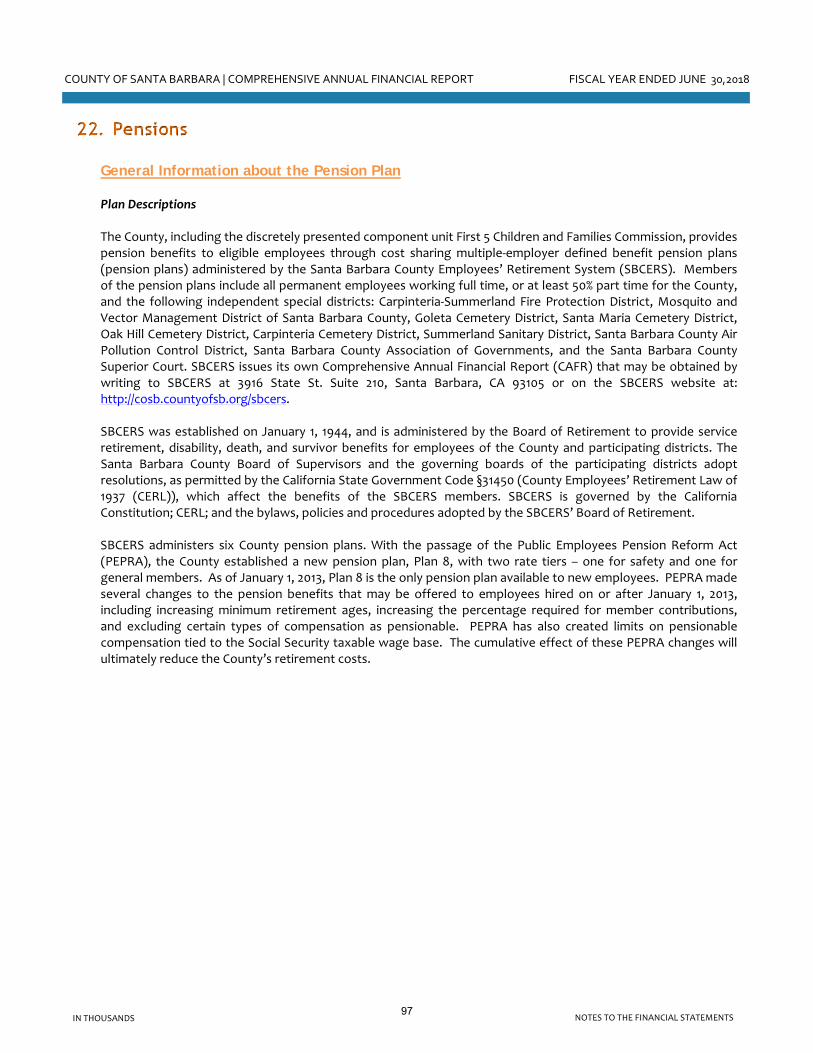
COUNTY OF SANTA BARBARA | COMPREHENSIVE ANNUAL FINANCIAL REPORT FISCAL YEAR ENDED JUNE 30,2018
NOTES TO THE FINANCIAL STATEMENTSIN THOUSANDS
22. Pensions General Information about the Pension Plan Plan Descriptions The County, including the discretely presented component unit First 5 Children and Families Commission, provides pension benefits to eligible employees through cost sharing multiple‐employer defined benefit pension plans (pension plans) administered by the Santa Barbara County Employees’ Retirement System (SBCERS). Members of the pension plans include all permanent employees working full time, or at least 50% part time for the County, and the following independent special districts: Carpinteria‐Summerland Fire Protection District, Mosquito and Vector Management District of Santa Barbara County, Goleta Cemetery District, Santa Maria Cemetery District, Oak Hill Cemetery District, Carpinteria Cemetery District, Summerland Sanitary District, Santa Barbara County Air Pollution Control District, Santa Barbara County Association of Governments, and the Santa Barbara County Superior Court. SBCERS issues its own Comprehensive Annual Financial Report (CAFR) that may be obtained by writing to SBCERS at 3916 State St. Suite 210, Santa Barbara, CA 93105 or on the SBCERS website at: http://cosb.countyofsb.org/sbcers. SBCERS was established on January 1, 1944, and is administered by the Board of Retirement to provide service retirement, disability, death, and survivor benefits for employees of the County and participating districts. The Santa Barbara County Board of Supervisors and the governing boards of the participating districts adopt resolutions, as permitted by the California State Government Code §31450 (County Employees’ Retirement Law of 1937 (CERL)), which affect the benefits of the SBCERS members. SBCERS is governed by the California Constitution; CERL; and the bylaws, policies and procedures adopted by the SBCERS’ Board of Retirement. SBCERS administers six County pension plans. With the passage of the Public Employees Pension Reform Act (PEPRA), the County established a new pension plan, Plan 8, with two rate tiers – one for safety and one for general members. As of January 1, 2013, Plan 8 is the only pension plan available to new employees. PEPRA made several changes to the pension benefits that may be offered to employees hired on or after January 1, 2013, including increasing minimum retirement ages, increasing the percentage required for member contributions, and excluding certain types of compensation as pensionable. PEPRA has also created limits on pensionable compensation tied to the Social Security taxable wage base. The cumulative effect of these PEPRA changes will ultimately reduce the County’s retirement costs.
97

COUNTY OF SANTA BARBARA | COMPREHENSIVE ANNUAL FINANCIAL REPORT FISCAL YEAR ENDED JUNE 30,2018
NOTES TO THE FINANCIAL STATEMENTSIN THOUSANDS
Summary of Plans and Eligible Participants
Open for New Enrollment:
General Plan 8 (PEPRA)
Safety Plan 8 (PEPRA)
Closed to New Enrollment:
General Plan 2
General Plan 5A
General Plan 5B
General Plan 5C
General Plan 7
Safety Plan 4A
Safety Plan 4B
Safety Plan 4C
Safety Plan 6A
Safety Plan 6B
General members hired on or after January 1, 2013.*
General employees hired before October 10, 1994, who did not elect to join General
Plan 2.
Members in certain bargaining units hired on or after October 10, 1994.
Members in certain bargaining units hired on or after October 10, 1994. Members in
those bargaining units transferred from Plan 5B on March 10, 2008.
County General employees hired on or after June 25, 2012 and other new non‐PEPRA
General hires for employers that have adopted Plan 7.
Safety members hired on or after January 1, 2013.*
Employees hired on or before June 30, 1999, who elected to join General Plan 2.
Once vested, Plan 2 members have a one‐time elction to defer accrued Plan 2
benefits and enter a contributory plan in effect at the time of election.
Contributions are based upon age at time of transfer.
*Employees who transfer from and are eligible for reciprocity with another public
employer will not be PEPRA members if their service in the reciprocal system was
under a pre‐PEPRA tier.
Some safety members hired before October 10, 1994.
Employees in certain bargaining units hired on or after October 10, 1994. Some
employees are in Safety Plan 4b without regard to hire date.
Members in certain bargaining units hired on or after October 10, 1994. All members
in certain bargaining units. Members in those bargaining units transferred from Plan
4B on July 3, 2006.
Members in certain bargaining units hired prior to October 10, 1994. Members in
those bargaining units transferred from Plan 4A on February 25, 2008.
Members in certain bargaining units hired on or after October 10, 1994. Members in
those bargaining units transferred from Plan 4B on February 25, 2008.
Benefits Provided All pension plans provide benefits, in accordance with CERL regulations, upon retirement, disability or death of members. Retirement benefits are based on years of service, final average compensation, and retirement age. Employees terminating before accruing 5 years (or 10 years for Plan 2) of retirement service credit (5 or 10‐year vesting) forfeit the right to receive retirement benefits unless they establish reciprocity with another public agency within the prescribed time period. Non‐vested employees who terminate service are entitled to withdraw their accumulated contributions plus accrued interest. Employees who terminate service after earning 5 years (or 10 years for Plan 2) of retirement service credit may leave their contributions on deposit and elect to take a deferred retirement. Differences between expected or actual experience for vested and non‐vested benefits may result in an increase or decrease to pension expense and net pension liability. Service related disability benefits are based upon final average compensation or retirement benefits (if eligible). Non‐service related disability benefits are based on 1) years of service and final average compensation or 2) retirement benefits (if eligible). General Plan 2 participants receive disability benefits through a long‐term
98

COUNTY OF SANTA BARBARA | COMPREHENSIVE ANNUAL FINANCIAL REPORT FISCAL YEAR ENDED JUNE 30,2018
NOTES TO THE FINANCIAL STATEMENTSIN THOUSANDS
insurance policy. Death benefits are based upon a variety of factors including whether the participant was retired or not. Annual cost‐of‐living adjustments (COLAs) after retirement are provided in all plans except General Plan 2. COLAs are granted to eligible retired members each April based upon the Bureau of Labor Statistics Average Consumer Price Index (CPI) for All Urban Consumers for the Los Angeles‐Riverside‐Orange County area as of the preceding January 1 and is subject to an annual maximum dependent upon the provisions of the pension plans. Detailed information about the retirement, disability or death benefit calculations and COLA maximums for each of the pension plans are available in the separately issued SBCERS CAFR. Contributions Per Article 16 of the Constitution of the State of California, contribution requirements of the active employees and the participating employers are established and may be amended by the SBCERS Board of Retirement. Depending upon the applicable plan, employees are required to contribute a certain percent of their annual pay. For each of the plans, the County’s contractually required contribution rate for the year ended June 30, 2018, was a specified percent of annual payroll, actuarially determined as an amount that, when combined with employee contributions, is expected to finance the costs of benefits earned by employees during the year. Additional amounts required to finance any unfunded accrued liability are the responsibility of the plan sponsors. Contributions to the pension plans from the County were $122,369 for the year ended June 30, 2018. Active members are plan members who are currently accruing benefits and/or paying contributions into the applicable plan. For the measurement date June 30, 2017, employer and employee contribution rates and active members for each plan are as follows:
Employer
Contribution Rates
Employee
Contribution Rates Active Members
General Plan 2 22.46% Non‐contributory 8
General Plan 5A 33.32% 2.93 - 6.07% 402
General Plan 5B 33.74% 5.86 - 12.15% 214
General Plan 5C 35.02% 2.84 - 6.05% 1356
General Plan 7 33.39% 2.36 - 5.04% 101
General Plan 8 26.46% 8.25% 995
Safety Plan 4A 55.22% 5.41 - 9.58% 30
Safety Plan 4B 54.35% 10.83 - 19.15% 8
Safety Plan 4C 54.11% 5.23 - 9.45% 317
Safety Plan 6A 62.66% 5.41 - 9.58% 56
Safety Plan 6B 62.01% 5.23 - 9.45% 280
Safety Plan 8 43.01% 14.46% 232
As a result of employee/employer negotiations in FY 2017‐18, members of certain plans and bargaining units will pay a portion of the employer contributions beginning in FY 18‐19. No net change is expected for combined pension contributions.
99

COUNTY OF SANTA BARBARA | COMPREHENSIVE ANNUAL FINANCIAL REPORT FISCAL YEAR ENDED JUNE 30,2018
NOTES TO THE FINANCIAL STATEMENTSIN THOUSANDS
Pension Liabilities, Pension Expense, and Deferred Outflows of Resources and Deferred Inflows of Resources Related to Pensions At June 30, 2018, the County, including its discretely presented component unit, reported a liability of $875,937 for its proportionate share of the net pension liability. The net pension liability was measured as of June 30, 2017 and the total pension liability used to calculate the net pension liability was determined by an actuarial valuation as of June 30, 2016, updated to June 30, 2017. The County’s proportion of the net pension liability was based on a projection of the County’s long‐term share of contributions to the pension plan relative to the projected contributions of all pension plan participants, actuarially determined. At June 30, 2017, the County’s proportion was 93.1085%, which was an increase of 0.3261% from its proportion measured as of June 30, 2016. For the year ended June 30, 2018, the County, including its discretely presented component unit, recognized pension expense of $161,502. Pension expense represents the change in the net pension liability during the measurement period, adjusted for actual contributions and the deferred recognition of changes in investment gain/loss, actuarial gain/loss, actuarial assumptions or method, and plan benefits. At June 30, 2018, the County, including its discretely presented component unit, reported deferred outflows of resources and deferred inflows of resources related to pensions from the following sources:
Deferred Outflows
of Resources
Deferred Inflows of
Resources
Differences between expected and actual experience --$ 59,136$
Changes in assumptions 160,771 --
Net difference between projected and actual earnings on
retirement plan investments55,060 --
Changes in proportion and differences between County
contributions and proportionate share of contributions3,089 --
County contributions subsequent to the measurement date 122,369 -- 341,289$ 59,136$
Deferred outflows of resources and deferred inflows of resources above represent the unamortized portion of changes to net pension liability to be recognized in future periods in a systematic and rational manner. $122,369 reported as deferred outflows of resources related to pensions resulting from County, and its discretely presented component unit, contributions subsequent to the measurement date will be recognized as a reduction of the net pension liability in the year ended June 30, 2019. Other amounts reported as deferred outflows of resources and deferred inflows of resources related to pensions will be recognized in pension expense as follows:
Year Ending June 30, Amount
2019 36,308$
2020 66,516
2021 40,186
2022 16,774 159,784$
100
COUNTY OF SANTA BARBARA | COMPREHENSIVE ANNUAL FINANCIAL REPORT FISCAL YEAR ENDED JUNE 30,2018
NOTES TO THE FINANCIAL STATEMENTSIN THOUSANDS
Actuarial Assumptions The total pension liability, measured as of June 30, 2017, was determined using the following actuarial assumptions. Total pension liability represents the portion of the actuarial present value of projected benefit payments attributable to past periods of service for current and inactive employees.
Increases in pay
Investment rate of return
Administrative expenses
Basic COLA
Post‐Retirement COLA
Post‐Retirement mortality
3.00% wage inflation component plus additional longevity and promotion
component based on employee classification and years of service
The cost of living as measured by the Consumer Price Index (CPI) will
increase at the rate of 2.75% per year.
Benefits are assumed to increase after retirement at the rate of 2.60% per
year for General Plans 5A, 5B, and 5C, and Safety Plans 4A, 4B, 4C, 6, and 8
(PEPRA); 1.9% per year for General Plans 7 and Plan 8 (PEPRA), and 0% per
year for General Plan 2.
Healthy Lives:
Mortality rates for retirees, beneficiaries, terminated vested, and reciprocals
are based on the sex distinct 2014 California Public Employees' Retirement
System (CalPERS) Healthy Annuitant Mortality Tables adjusted by 0.95 for
males and 0.90 for females, with Generational improvement using
Projection Scale MP‐2016 from a base year of 2009.
Non‐duty related mortality rates for active members are based on the sex
distinct 2014 CalPERS Pre‐retirement Non‐Industrial Mortality Table, with no
adjustment, with Generational improvement using Projection Scale MP‐2016
from a base year of 2009. Safety members are also subject to the CalPERS
Pre‐retirement Industrial Mortality Table for duty‐related deaths, with the
same Generational improvements applied.
Disabled Lives:
Mortality for disabled retirees are based on the CalPERS Industrial Disabled
Annuitant Mortality, with no adjustment (Safety only), CalPERS Non‐
Industrial Disabled Annuitant Mortality, with no adjustment (General only),
with Generational improvement using Projection Scale MP‐2016 from a base
7.0%, net of investment expense
Base of $5.1 million for the FYE 6/30/17 with 3.00% wage inflation increases
annually
The actuarial assumptions used in the June 30, 2016, updated to June 30, 2017 valuation, were based on the results of an actuarial experience study for the period July 1, 2013 through June 30, 2016. As a result of the June 30, 2016 actuarial experience study, a decrease in the discount rate, decreases in COLA and wage inflation assumptions, and revised mortality assumptions were utilized in the June 30, 2016 actuarial valuation to more closely reflect actual experience. The long‐term expected rate of return, measured as of June 30, 2017, on pension plan investments (7.0 percent) was determined using a building‐block method in which best‐estimate ranges of expected future real rates of return (expected returns, net of pension plan investment expense and inflation) are developed for each major asset class. These ranges are combined to produce the long‐term expected rate of return by weighting the expected future real rates of return by the target asset allocation percentage and by adding expected inflation.
101

COUNTY OF SANTA BARBARA | COMPREHENSIVE ANNUAL FINANCIAL REPORT FISCAL YEAR ENDED JUNE 30,2018
NOTES TO THE FINANCIAL STATEMENTSIN THOUSANDS
The target allocation and best estimates of arithmetic real rates of return for each major asset class are summarized in the following table:
Asset Class Target Allocation
Long‐term Expected Real
Rate of Return
Broad U.S. equity 19% 4.55%
Developed market non‐U.S. equity 11% 5.75%
Emerging markets equity 7% 8.25%
Core fixed income 17% 1.00%
Custom non‐core fixed income 11% 3.33%
Custom real return 15% 4.44%
Custom real estate 10% 5.02%
Private equity 10% 7.50%
Cash 0% -0.25%Total 100%
Discount Rate The discount rate used to measure the total pension liability was 7.0 percent. The projection of cash flows used to determine the discount rate assumed that employee contributions will be made at the current contribution rate and that contributions from the County will be made at contractually required rates, actuarially determined. Based on those assumptions, the pension fund’s fiduciary net position was projected to be available to make all projected future benefit payments of current active and inactive employees. In theory, the discount rate may differ from the long‐term expected rate of return discussed previously. However, based on the projected availability of the pension fund’s fiduciary net position, the discount rate is equal to the long‐term expected rate of return on pension plan investments, and was applied to all periods of projected benefit payments to determine the total pension liability. Sensitivity of the County’s Proportionate Share of the Net Pension Liability to Changes in the Discount Rate The following presents the County’s proportionate share of the net pension liability calculated using the discount rate of 7.0 percent, as well as what the County’s proportionate share of the net pension liability would be if it were calculated using a discount rate that is 1‐percentage point lower (6.0 percent) or 1‐percentage point higher (8.0 percent) than the current rate:
1%
Decrease
6.0%
Discount
Rate
7.0%
1%
Increase
8.0%County's proportionate share of the net
pension plan liability 1,376,117$ 875,937$ 467,993$
Pension fund fiduciary net position Detailed information about the pension fund’s fiduciary net position is available in the separately issued SBCERS CAFR.
102
COUNTY OF SANTA BARBARA | COMPREHENSIVE ANNUAL FINANCIAL REPORT FISCAL YEAR ENDED JUNE 30,2018
NOTES TO THE FINANCIAL STATEMENTSIN THOUSANDS
23. Other Postemployment Benefits (OPEB) General Information about the OPEB Plan
Plan Description The County’s agent multiple‐employer defined benefit postemployment healthcare plan (OPEB Plan) is administered by the Santa Barbara County Employees’ Retirement System (SBCERS). The OPEB plan is funded by the County and other plan sponsors, and is administered in accordance with §401(h) of the IRC. It was established on September 16, 2008, by the County Board of Supervisors who created a 401(h) Medical Trust. Also in 2008, an application for determination and a voluntary compliance plan was submitted to the Internal Revenue Service (IRS), and in October 2013, the IRS acted favorably on the application. SBCERS and its plan sponsors currently operate under the Voluntary Compliance Plan Statement and regulations adopted in 2013. Other employer OPEB plan sponsors include the Carpinteria‐Summerland Fire Protection District, Goleta Cemetery District, Santa Maria Cemetery District, Carpinteria Cemetery District, Summerland Sanitary District, Santa Barbara County Air Pollution Control District, Santa Barbara County Association of Governments, and the Santa Barbara County Superior Court. On June 26, 2012, the County closed the OPEB plan to new general employees, and on June 20, 2016, the OPEB plan was closed to new County Safety members. SBCERS issues its own Comprehensive Annual Financial Report which includes note disclosures and required supplementary information for the OPEB Plan. This may be obtained by writing to the Santa Barbara County Employees’ Retirement System at 3916 State St. Suite 210, Santa Barbara, CA 93105 or on the SBCERS website under the Comprehensive Annual Report Section http://cosb.countyofsb.org/sbcers. Benefits Provided The OPEB Plan offers healthcare, vision, and dental benefits to eligible County retirees and their dependents. Benefits are provided by third party providers. The County negotiates healthcare contracts with providers for both its active employees and the participating retired members of SBCERS. Retirees are offered the same health plans as active County employees, as well as enhanced senior plans for retirees on Medicare. Retiree premiums are rated separately from active County employees; as such, the County does not have a retiree premium implicit rate subsidy. Retirees who elect to participate in a County‐sponsored health insurance plan are eligible to receive an explicit subsidy for medical premiums funded by the County and other plan sponsors. The monthly subsidy is $15 per year of service. If the monthly premium for the health plan selected is less than $15 times the member’s years of service, the subsidy is limited to the entire premium. The health plans include coverage for eligible spouses and dependents. After the member’s death, a beneficiary is eligible to continue health plan coverage. The subsidy benefit will be equal to $15 per year of service times the survivor continuation percentage applicable for pension benefits. If a member is eligible for a disability retirement benefit, the member can receive a monthly health plan subsidy of $187 per month or a subsidy of $15 per month per year of service, whichever is greater. This subsidy is treated as a nontaxable amount to the disabled recipient. Retirees who choose not to participate in the County‐sponsored health insurance plan receive a monthly benefit of $4 per year of service. This benefit, known as a Healthcare Reimbursement Arrangement, reimburses qualified health care expenses through a health savings account.
103

COUNTY OF SANTA BARBARA | COMPREHENSIVE ANNUAL FINANCIAL REPORT FISCAL YEAR ENDED JUNE 30,2018
NOTES TO THE FINANCIAL STATEMENTSIN THOUSANDS
Employees Covered By Benefit Terms
At the OPEB liability measurement date of June 30, 2017, the following employees were covered by the benefit terms:
Inactive employees or beneficiaries currently receiving benefit payments 3,873 Inactive employees entitled to but not yet receiving benefit payments 859 Active employees 2,808
7,540
Contributions
On March 1, 2016, the County adopted a resolution approving an OPEB (401(h) Account) Funding Policy. This policy provides for funding the OPEB plan at 4% of Covered Payroll for the 401(a) Pension Plan (as opposed to the smaller covered payroll of the OPEB plan). This funding policy went into effect on July 1, 2016. Employees are not required to contribute to the plan. Net OPEB Liability At June 30, 2018, the County, including its discretely presented component unit, reported a net OPEB liability of $122,276. The net OPEB liability was measured as of June 30, 2017 and the total OPEB liability used to calculate the net OPEB liability was determined by an actuarial valuation as of June 30, 2016, updated to June 30, 2017.
104

COUNTY OF SANTA BARBARA | COMPREHENSIVE ANNUAL FINANCIAL REPORT FISCAL YEAR ENDED JUNE 30,2018
NOTES TO THE FINANCIAL STATEMENTSIN THOUSANDS
Actuarial Assumptions The total OPEB liability measured as of June 30, 2017 was determined using the following actuarial assumptions, applied to all periods included in the measurement, unless otherwise specified:
Salary increase rate
Investment rate of return 7.00%, net of investment expense
Healthcare cost trend rates
Future retiree plan election
Mortality rates
The Healthcare Cost Trend Rate is not applicable because the total cost of health
benefits is not valued. Only the monthly benefit provided is valued using the
assumption that no future increase will be granted to the amount.
55% ‐ monthly subsidy of $15 per year of service; 45% ‐ $4 cash benefit option
3% plus an additional longevity and promotion increase compounded based on
years of service
Healthy Lives:
Mortality rates for retirees, beneficiaries, terminated vested, and reciprocals are
based on the sex distinct CalPERS Healthy Annuitant Mortality Tables adjusted by
0.95 for males and 0.90 for females, with Generational improvement using
Projection Scale MP‐2016 from a base year of 2009. Non‐duty related morality rates
for active members are based on the sex distinct CalPERS Preretirement Non‐
Industrial Mortality Table, with no adjustment, with Generational improvement
using Projection Scale MP‐2016 from a base year of 2009. Safety members are also
subject to the CalPERS Preretirement Industrial Mortality Table for duty‐related
deaths, with the same Generational improvements applied.
Disabled Lives:
Mortality rates for disabled retirees are based on CalPERS Industrial Disabled
Annuitant Mortality, with no adjustment (Safety only), CalPERS Non‐Industrial
Disabled Annuitant Mortality, with no adjustment (General only), with Generational
improvement using Projection Scale MP‐2016 from a base year of 2009.
The actuarial assumptions used in the valuation as of June 30, 2016, updated to June 30, 2017, were based on 1) the demographic assumptions determined in the actuarial experience study of July 1, 2013 – June 30, 2016 for the Pension Plan, 2) implementation of the OPEB Funding Policy, and 3) current experience for OPEB Plan election by retirees. As the benefit for the OPEB plan is a fixed payment per year of service that is currently lower than the premiums paid for coverage, and is expected to remain so into the future, no age related costs are required to be developed. The OPEB assets are invested in the same commingled vehicles as the pension plan, but with a more simple asset allocation. It is expected that as the OPEB assets continue to grow, the asset allocation will shift to be more like that of the pension plan. Therefore, in the long run, we expect the OPEB plan to realize the same long‐term rate of return as the pension plan. The long‐term expected rate of return, measured as of June 30, 2017, on pension plan investments (7.0 %) was determined using a building‐block method in which best‐estimate ranges of expected future real rates of return (expected returns, net of pension plan investment expense and inflation) are developed for each major asset class. These ranges are combined to produce the long‐term expected rate of return by weighting the expected future real rates of return by the target asset allocation percentage and by adding expected inflation.
105

COUNTY OF SANTA BARBARA | COMPREHENSIVE ANNUAL FINANCIAL REPORT FISCAL YEAR ENDED JUNE 30,2018
NOTES TO THE FINANCIAL STATEMENTSIN THOUSANDS
The target allocation and best estimates of real rates of return for each major asset class are summarized in the following table:
Asset Class Target Allocation
Long‐term Expected Real
Rate of Return
Domestic equity 60% 4.6%Fixed income 40% 1.0%
Total 100%
Discount Rate
The discount rate used to measure the total OPEB liability was 7.0 percent. The projection of cash flows used to determine the discount rate assumed that County contributions will continue based upon the current OPEB (401(h) Account) Funding Policy. Based on those assumptions, the OPEB plan’s fiduciary net position was projected to be available to make projected future benefit payments for current members for all future years. Therefore, the long‐term expected rate of return on OPEB plan investments was applied to all periods of projected benefit payments to determine the total OPEB liability. Changes in the Net OPEB Liability The table below shows the changes in the total OPEB liability, the Plan Fiduciary Net Position (i.e. Fair value of Plan assets), and the net OPEB liability during the measurement period ending on June 30, 2017 for the County’s proportionate share, including its discretely presented component unit.
Increase (Decrease)
Total OPEB Liability
(a)
Plan Fiduciary
Net Position
(b)
Net OPEB
Liability
(a) ‐ (b)
Balances at 6/30/2017 131,214$ 6,877$ 124,337$
Changes for the year:
Service cost 1,856 ‐ 1,856
Interest 8,962 ‐ 8,962
Differences between
expected and actual
experience ‐ ‐ ‐
Contributions ‐ employer ‐ 12,642 (12,642)
Net investment income ‐ 589 (589)
Benefit payments (8,342) (8,342) ‐
Administrative expense ‐ (352) 352
Net changes 2,476 4,537 (2,061)
Balances at 6/30/2018 133,690$ 11,414$ 122,276$
106

COUNTY OF SANTA BARBARA | COMPREHENSIVE ANNUAL FINANCIAL REPORT FISCAL YEAR ENDED JUNE 30,2018
NOTES TO THE FINANCIAL STATEMENTSIN THOUSANDS
Sensitivity of the Net OPEB Liability to Changes in the Discount Rate
The following presents the net OPEB liability of the County, as well as what the County’s net OPEB liability would be if it were calculated using a discount rate that is 1‐percentage‐point lower (6.0 percent) or 1‐percentage point higher (8.0 percent) than the current discount rate:
1%
Decrease
6.0%
Discount
Rate
7.0%
1%
Increase
8.0%
Net OPEB liability (asset) 137,158$ 122,276$ 109,734$
OPEB plan fiduciary net position
Detailed information about the OPEB plan’s fiduciary net position is available in the separately issued SBCERS financial report.
OPEB Expense and Deferred Outflows of Resources and Deferred Inflows of Resources Related to OPEB
For the year ended June 30, 2018, the County, including its discretely presented component unit, recognized OPEB expense of $10,558. OPEB expense represents the change in the net OPEB liability during the measurement period, adjusted for actual contributions and the deferred recognition of changes in investment gain/loss, and actuarial assumptions or method. At June 30, 2018, the County, including its discretely presented component unit, reported deferred outflows of resources and deferred inflows of resources related to OPEB from the following sources:
Deferred Outflows of
Resources
Deferred Inflows of
Resources
Differences between expected and actual experience -$ -$
Changes in assumptions - -
Net difference between projected and actual earnings on
retirement plan investments
22 -
County contributions subsequent to the measurement date 12,751 -
12,773$ -$
Amounts reported as deferred outflows of resources and deferred inflows of resources related to OPEB will be recognized in OPEB expense as follows:
Year Ending June 30, Amount
2019 6$ 2020 6 2021 5 2022 5
22$
107

COUNTY OF SANTA BARBARA | COMPREHENSIVE ANNUAL FINANCIAL REPORT FISCAL YEAR ENDED JUNE 30,2018
NOTES TO THE FINANCIAL STATEMENTSIN THOUSANDS
24. Deferred Compensation Plans
Santa Barbara County Supplemental Retirement Plan The Santa Barbara County Supplemental Retirement Plan is an employer discretionary, defined contribution plan established and governed under Internal Revenue Code Section 401(a). Employer‐only annual contributions are calculated based upon a percentage of employee compensation under annual agreements with employee bargaining groups and unions. This plan is administered through a third‐party administrator, Empower Retirement, and is available to all employee groups. The County does not perform the investing function and has no fiduciary accountability for the plan. Thus, plan assets and any related liability to plan participants have been excluded from the County’s financial statements. The County’s actual contributions for the current year and the two preceding years are as follows:
Fiscal Year Ended Contributions6/30/2016 189$ 6/30/2017 195 6/30/2018 193
County of Santa Barbara Employee Contribution Deferred Compensation Plan The County offers to its employees an optional deferred compensation plan created in accordance with Section 457 of the Internal Revenue Code. This plan is available to substantially all employees and allows participants to defer a portion of their current income until future years, up to a maximum of $18,000 in whole dollars) during 2017 (calendar year), and $18,500 (in whole dollars) during 2018 (calendar year) so as to shelter such funds and earnings from state and federal taxation until withdrawal. The deferred compensation is not available to participants until termination, retirement, death, or unforeseeable emergency. This plan is administered through a third‐party administrator. The County does not perform the investing function and has no fiduciary accountability for the plan. Thus, plan assets and any related liability to plan participants have been excluded from the County’s financial statements.
County of Santa Barbara Social Security Compliance Deferred Compensation Plan The Social Security Compliance Deferred Compensation Plan is a supplemental retirement program utilized by the County in lieu of payments to Social Security (FICA), governed under Internal Revenue Code Sections 3121 and 457. Enrollment in this plan is mandatory for contract, extra‐help, seasonal and temporary employees. Employees enrolled in the regular SBCERS pension plans are not eligible for this plan. Based upon the employee’s gross compensation, the employee’s deferral, on a before‐tax basis, equals 6.0% and the County’s contribution equals 1.5% for a combined total of 7.5%. This plan is administered through a third‐party administrator and is available to all employee groups. The County does not perform the investing function and has no fiduciary accountability for the plan. Thus, plan assets and any related liability to plan participants have been excluded from the County’s financial statements.
108

COUNTY OF SANTA BARBARA | COMPREHENSIVE ANNUAL FINANCIAL REPORT FISCAL YEAR ENDED JUNE 30,2018
NOTES TO THE FINANCIAL STATEMENTSIN THOUSANDS
The County’s actual contributions for the current year and the two preceding years are as follows:
Fiscal Year Ended Contributions 6/30/2016 176$ 6/30/2017 165 6/30/2018 156
25. Voluntary Termination Benefits On March 20th, 2018, the Board approved a voluntary early separation incentive program (VESIP) for certain employees. The plan was offered, on a limited basis, from March 21st to April 2nd, to employees in SEIU ‐ Local 620 and Local 721, the Deputy Sheriff’s Association, the Engineers & Technicians Association, and unrepresented management and confidential employees below the department head level who met the following eligibility criteria:
Full time regular employee
Hired prior to January 2013
Not working in a hard to fill position as determined by the Department Head
Volunteered and signed release
Agreed to work until May 25, 2018 (unless earlier separation was in the best interest of the County as determined by the Department Head)
The VESIP application was subject to approval from the employee’s Department Head and the County Executive Officer (CEO). VESIP benefits were lump sum payments that were tiered based upon the years of consecutive service and type of position held with the County. Payments were as follows for non‐management positions: $20 for 5‐10 years, $26 for 11‐15 years, and $33 for service periods greater than 15 years. Management positions received $39 for 5 or more years of service. VESIP benefits were fully paid on June 14, 2018 and totaled $306 for 10 participants.
26. Prior Period Adjustments A prior period adjustment was made to the governmental, business‐type, and component unit activities’ beginning net positions to reflect the prior period costs related to the implementation of GASB Statement No. 75 “Accounting and Financial Reporting for Postemployment Benefits Other Than Pensions.” For governmental activities, an adjustment for $1,270 was made due to prior year structure improvements that should have been capitalized in the prior year. The adjustment of $1,240 was made for solar equipment that should have been capitalized in the prior period. For business‐type activities, an adjustment for $2,285 was made to increase net position for other operating revenues that should have been recognized in prior periods.
109
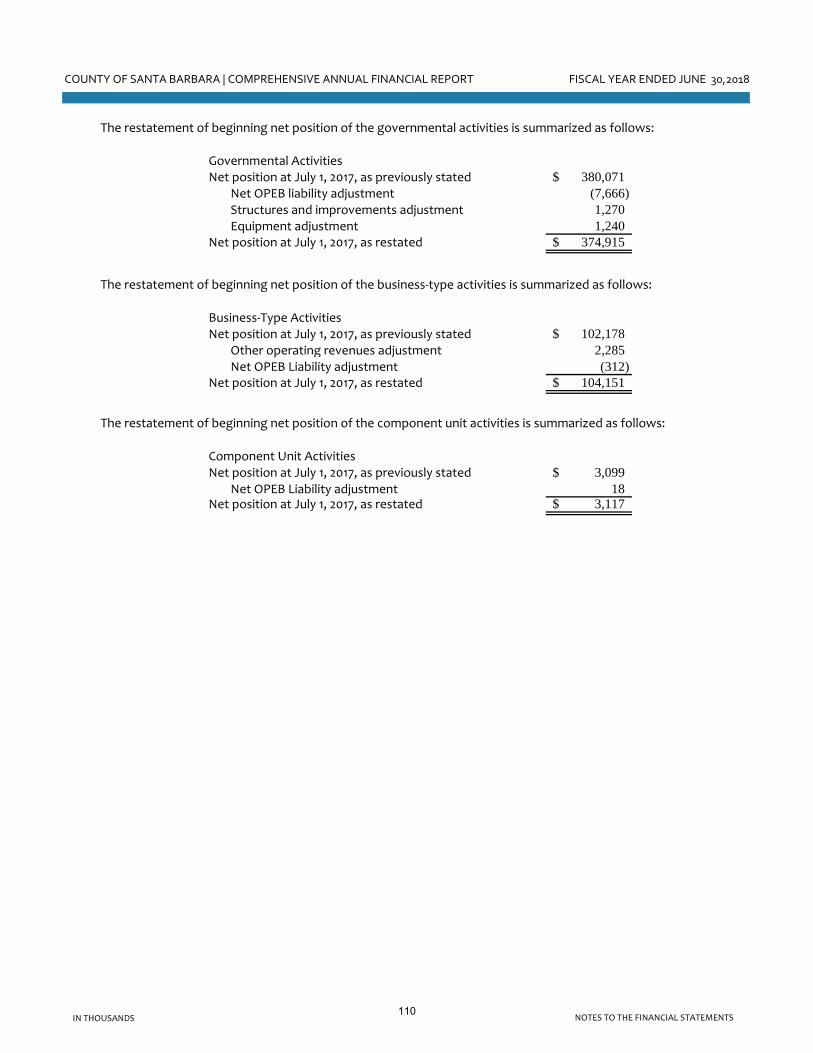
COUNTY OF SANTA BARBARA | COMPREHENSIVE ANNUAL FINANCIAL REPORT FISCAL YEAR ENDED JUNE 30,2018
NOTES TO THE FINANCIAL STATEMENTSIN THOUSANDS
The restatement of beginning net position of the governmental activities is summarized as follows:
Governmental ActivitiesNet position at July 1, 2017, as previously stated 380,071$
Net OPEB liability adjustment (7,666) Structures and improvements adjustment 1,270 Equipment adjustment 1,240
Net position at July 1, 2017, as restated 374,915$
The restatement of beginning net position of the business‐type activities is summarized as follows:
Business‐Type ActivitiesNet position at July 1, 2017, as previously stated 102,178$
Other operating revenues adjustment 2,285 Net OPEB Liability adjustment (312)
Net position at July 1, 2017, as restated 104,151$
The restatement of beginning net position of the component unit activities is summarized as follows:
Component Unit ActivitiesNet position at July 1, 2017, as previously stated 3,099$
Net OPEB Liability adjustment 18 Net position at July 1, 2017, as restated 3,117$
110
Required Supplementary Information
111
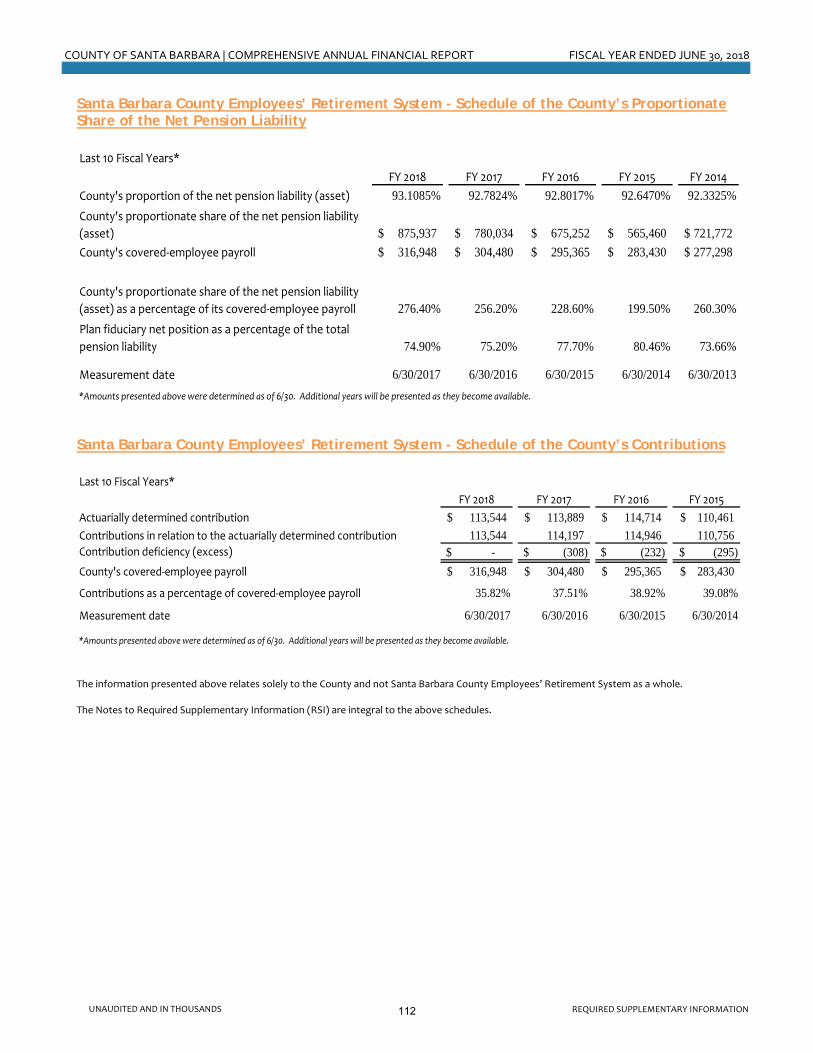
COUNTY OF SANTA BARBARA | COMPREHENSIVE ANNUAL FINANCIAL REPORT FISCAL YEAR ENDED JUNE 30, 2018
REQUIRED SUPPLEMENTARY INFORMATIONUNAUDITED AND IN THOUSANDS
Santa Barbara County Employees’ Retirement System - Schedule of the County’s Proportionate Share of the Net Pension Liability Last 10 Fiscal Years*
FY 2018 FY 2017 FY 2016 FY 2015 FY 2014
County's proportion of the net pension liability (asset) 93.1085% 92.7824% 92.8017% 92.6470% 92.3325%County's proportionate share of the net pension liability
(asset) 875,937$ 780,034$ 675,252$ 565,460$ 721,772$ County's covered‐employee payroll 316,948$ 304,480$ 295,365$ 283,430$ 277,298$
County's proportionate share of the net pension liability
(asset) as a percentage of its covered‐employee payroll 276.40% 256.20% 228.60% 199.50% 260.30%Plan fiduciary net position as a percentage of the total
pension liability 74.90% 75.20% 77.70% 80.46% 73.66%
Measurement date 6/30/2017 6/30/2016 6/30/2015 6/30/2014 6/30/2013*Amounts presented above were determined as of 6/30. Additional years will be presented as they become available.
Santa Barbara County Employees’ Retirement System - Schedule of the County’s Contributions Last 10 Fiscal Years*
FY 2018 FY 2017 FY 2016 FY 2015
Actuarially determined contribution 113,544$ 113,889$ 114,714$ 110,461$ Contributions in relation to the actuarially determined contribution 113,544 114,197 114,946 110,756 Contribution deficiency (excess) -$ (308)$ (232)$ (295)$ County's covered‐employee payroll 316,948$ 304,480$ 295,365$ 283,430$
Contributions as a percentage of covered‐employee payroll 35.82% 37.51% 38.92% 39.08%
Measurement date 6/30/2017 6/30/2016 6/30/2015 6/30/2014
*Amounts presented above were determined as of 6/30. Additional years will be presented as they become available.
The information presented above relates solely to the County and not Santa Barbara County Employees’ Retirement System as a whole. The Notes to Required Supplementary Information (RSI) are integral to the above schedules.
112

COUNTY OF SANTA BARBARA | COMPREHENSIVE ANNUAL FINANCIAL REPORT FISCAL YEAR ENDED JUNE 30, 2018
REQUIRED SUPPLEMENTARY INFORMATIONUNAUDITED AND IN THOUSANDS
Other Postemployment Benefits (OPEB) Plan - Schedule of Changes in the County’s Net OPEB Liability and Related Ratios
Last 10 Fiscal Years*
FY 2018
Total OPEB liability
Service cost 1,856$ Interest 8,962 Changes of benefit terms - Differences between expected and actual experience - Changes of assumptions - Benefit payments (8,342) Net change in total OPEB liability 2,476 Total OPEB liability ‐ beginning 131,214 Total OPEB liability ‐ ending (a) 133,690$
Plan fiduciary net position
Contributions ‐ employer 12,642$ Net investment income 589 Benefit payments (8,342) Administrative expense (352) Net change in plan fiduciary net position 4,537 Plan fiduciary net position ‐ beginning 6,877 Plan fiduciary net position ‐ ending (b) 11,414$ County's net OPEB liability ‐ ending (a) ‐ (b) 122,276$
Plan fiduciary net position as a percentage of the total OPEB liability 8.54%
Covered‐employee payroll 316,948$
County's net OPEB liability as a percentage of covered‐employee
payroll 38.58%
Measurement date 6/30/2017
*Amounts presented above were determined as of 6/30. Additional years will be presented as they become
available.
The information presented above relates solely to the County and not Santa Barbara County Employees’ Retirement System as a whole. The Notes to RSI are integral to the above schedules.
113

114

Governmental Funds – General and Major Special Revenue
115

116
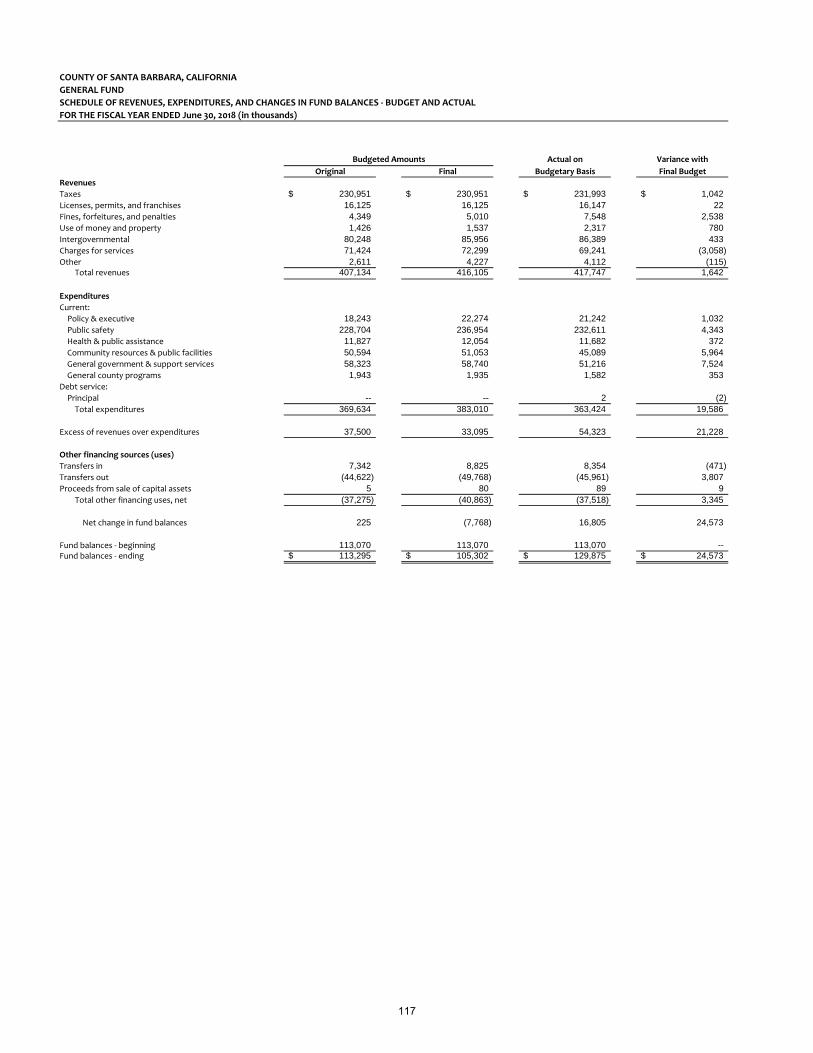
COUNTY OF SANTA BARBARA, CALIFORNIA
GENERAL FUND
SCHEDULE OF REVENUES, EXPENDITURES, AND CHANGES IN FUND BALANCES ‐ BUDGET AND ACTUAL
FOR THE FISCAL YEAR ENDED June 30, 2018 (in thousands)
Actual on Variance with
Original Final Budgetary Basis Final Budget
Revenues
Taxes 230,951$ 230,951$ 231,993$ 1,042$ Licenses, permits, and franchises 16,125 16,125 16,147 22 Fines, forfeitures, and penalties 4,349 5,010 7,548 2,538 Use of money and property 1,426 1,537 2,317 780 Intergovernmental 80,248 85,956 86,389 433 Charges for services 71,424 72,299 69,241 (3,058) Other 2,611 4,227 4,112 (115)
Total revenues 407,134 416,105 417,747 1,642
Expenditures
Current:
Policy & executive 18,243 22,274 21,242 1,032 Public safety 228,704 236,954 232,611 4,343 Health & public assistance 11,827 12,054 11,682 372 Community resources & public facilities 50,594 51,053 45,089 5,964 General government & support services 58,323 58,740 51,216 7,524 General county programs 1,943 1,935 1,582 353
Debt service:
Principal -- -- 2 (2) Total expenditures 369,634 383,010 363,424 19,586
Excess of revenues over expenditures 37,500 33,095 54,323 21,228
Other financing sources (uses)
Transfers in 7,342 8,825 8,354 (471) Transfers out (44,622) (49,768) (45,961) 3,807 Proceeds from sale of capital assets 5 80 89 9
Total other financing uses, net (37,275) (40,863) (37,518) 3,345
Net change in fund balances 225 (7,768) 16,805 24,573
Fund balances ‐ beginning 113,070 113,070 113,070 -- Fund balances ‐ ending 113,295$ 105,302$ 129,875$ 24,573$
Budgeted Amounts
117

COUNTY OF SANTA BARBARA, CALIFORNIA
ROADS SPECIAL REVENUE FUND
SCHEDULE OF REVENUES, EXPENDITURES, AND CHANGES IN FUND BALANCES ‐ BUDGET AND ACTUAL
FOR THE FISCAL YEAR ENDED June 30, 2018 (in thousands)
Actual on Variance with
Original Final Budgetary Basis Final Budget
Revenues
Taxes 7,523$ 7,587$ 7,849$ 262$ Licenses, permits, and franchises 335 335 447 112 Use of money and property 117 117 117 -- Intergovernmental 27,552 26,089 16,650 (9,439) Charges for services 4,914 5,940 4,366 (1,574) Other 95 217 259 42
Total revenues 40,536 40,285 29,688 (10,597)
Expenditures
Current:
Community resources & public facilities 48,574 51,492 37,241 14,251 Total expenditures 48,574 51,492 37,241 14,251
Deficiency of revenues under expenditures (8,038) (11,207) (7,553) 3,654
Other financing sources (uses)
Transfers in 7,609 10,411 9,617 (794) Transfers out (1,112) (2,930) (2,553) 377 Proceeds from sale of capital assets -- -- 81 81
Total other financing sources, net 6,497 7,481 7,145 (336)
Net change in fund balances (1,541) (3,726) (408) 3,318
Fund balances ‐ beginning 18,900 18,900 18,900 -- Fund balances ‐ ending 17,359$ 15,174$ 18,492$ 3,318$
Amounts reported in the GAAP Statement of Revenues, Expenditures, and Changes in Fund Balances ‐
Governmental Funds are different because:
Actual amounts (budgetary basis) Total Revenues from the budgetary comparison schedule 29,688$
(3,309)
26,379$
Actual amounts (budgetary basis) Total Expenditures from the budgetary comparison schedule 37,241$
(3,309)
33,932$
Actual amounts (budgetary basis) Total Other Financing Sources, Net 7,145$
(2,553)
2,553
7,145$
Transfers out resulting from transfers between the operating funds that are combined into a single special revenue
fund are eliminated for financial reporting purposes.
Total other financing sources, net on the Statement of Revenues, Expenditures, and Changes in Fund Balances ‐
Governmental Funds
Budgeted Amounts
Revenues resulting from transfers between the operating funds that are combined into a single special revenue fund
are eliminated for financial reporting purposes.
Total revenues as reported on the Statement of Revenues, Expenditures, and Changes in Fund Balances ‐
Governmental Funds
Expenditures resulting from transfers between the operating funds that are combined into a single special revenue
fund are eliminated for financial reporting purposes.
Total expenditures as reported on the Statement of Revenues, Expenditures, and Changes in Fund Balances ‐
Governmental Funds
Transfers in resulting from transfers between the operating funds that are combined into a single special revenue
fund are eliminated for financial reporting purposes.
118

COUNTY OF SANTA BARBARA, CALIFORNIA
PUBLIC HEALTH SPECIAL REVENUE FUND
SCHEDULE OF REVENUES, EXPENDITURES, AND CHANGES IN FUND BALANCES ‐ BUDGET AND ACTUAL
FOR THE FISCAL YEAR ENDED June 30, 2018 (in thousands)
Actual on Variance with
Original Final Budgetary Basis Final Budget
Revenues
Licenses, permits, and franchises 57$ 57$ 56$ (1)$ Fines, forfeitures, and penalties 530 530 463 (67) Use of money and property 192 249 158 (91) Intergovernmental 20,448 21,411 20,276 (1,135) Charges for services 42,240 42,945 43,660 715 Other 3,735 4,602 4,585 (17)
Total revenues 67,202 69,794 69,198 (596)
Expenditures
Current:
Health & public assistance 77,023 79,333 76,227 3,106 Total expenditures 77,023 79,333 76,227 3,106
Deficiency of revenues under expenditures (9,821) (9,539) (7,029) 2,510
Other financing sources (uses)
Transfers in 10,153 10,053 9,361 (692) Transfers out (7,929) (8,745) (7,533) 1,212 Proceeds from sale of capital assets -- -- 2 2
Total other financing sources, net 2,224 1,308 1,830 522
Net change in fund balances (7,597) (8,231) (5,199) 3,032
Fund balances ‐ beginning 30,977 30,977 30,977 -- Fund balances ‐ ending 23,380$ 22,746$ 25,778$ 3,032$
Amounts reported in the GAAP Statement of Revenues, Expenditures, and Changes in Fund Balances ‐
Governmental Funds are different because:
Actual amounts (budgetary basis) Total Revenues from the budgetary comparison schedule 69,198$
(15)
69,183$
Actual amounts (budgetary basis) Total Expenditures from the budgetary comparison schedule 76,227$
(15)
76,212$
Actual amounts (budgetary basis) Total Other Financing Sources, Net 1,830$
(2,162)
2,162
1,830$
Transfers in resulting from transfers between the operating funds that are combined into a single special revenue
fund are eliminated for financial reporting purposes.
Transfers out resulting from transfers between the operating funds that are combined into a single special revenue
fund are eliminated for financial reporting purposes.
Total other financing sources, net on the Statement of Revenues, Expenditures, and Changes in Fund Balances ‐
Governmental Funds
Budgeted Amounts
Revenues resulting from transfers between the operating funds that are combined into a single special revenue fund
are eliminated for financial reporting purposes.
Total revenues as reported on the Statement of Revenues, Expenditures, and Changes in Fund Balances ‐
Governmental Funds
Expenditures resulting from transfers between the operating funds that are combined into a single special revenue
fund are eliminated for financial reporting purposes.
Total expenditures as reported on the Statement of Revenues, Expenditures, and Changes in Fund Balances ‐
Governmental Funds
119
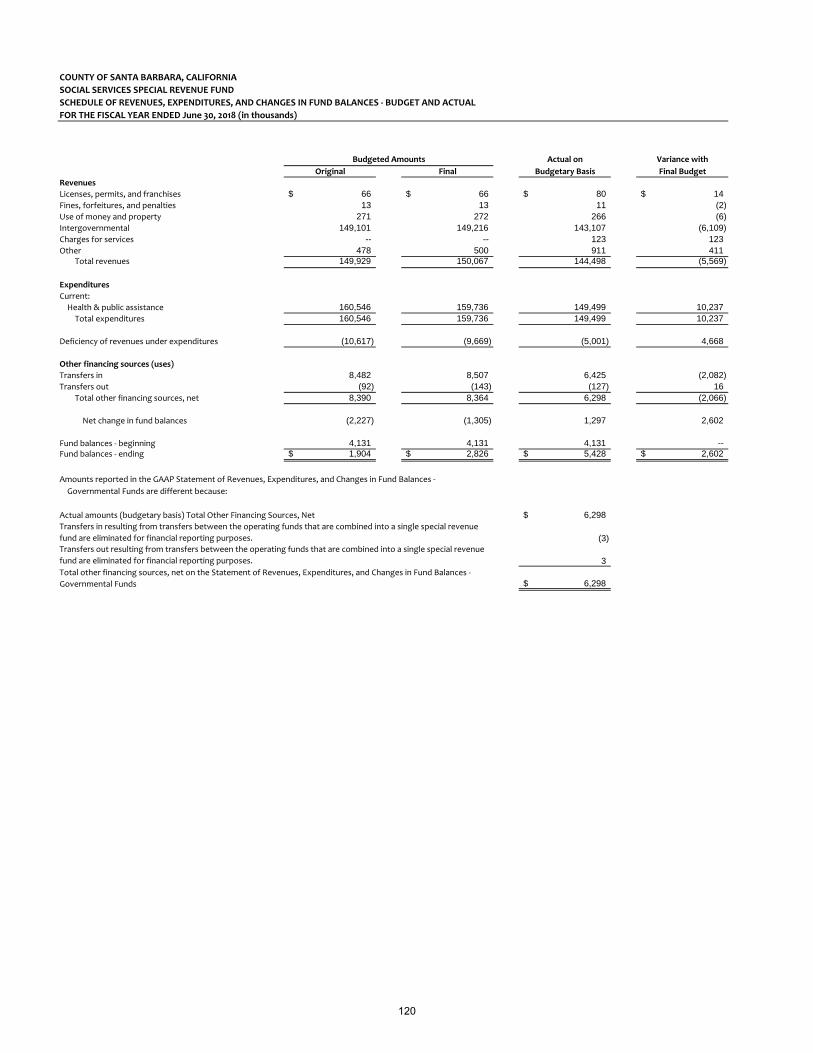
COUNTY OF SANTA BARBARA, CALIFORNIA
SOCIAL SERVICES SPECIAL REVENUE FUND
SCHEDULE OF REVENUES, EXPENDITURES, AND CHANGES IN FUND BALANCES ‐ BUDGET AND ACTUAL
FOR THE FISCAL YEAR ENDED June 30, 2018 (in thousands)
Actual on Variance with
Original Final Budgetary Basis Final Budget
Revenues
Licenses, permits, and franchises 66$ 66$ 80$ 14$ Fines, forfeitures, and penalties 13 13 11 (2) Use of money and property 271 272 266 (6) Intergovernmental 149,101 149,216 143,107 (6,109) Charges for services -- -- 123 123 Other 478 500 911 411
Total revenues 149,929 150,067 144,498 (5,569)
Expenditures
Current:
Health & public assistance 160,546 159,736 149,499 10,237 Total expenditures 160,546 159,736 149,499 10,237
Deficiency of revenues under expenditures (10,617) (9,669) (5,001) 4,668
Other financing sources (uses)
Transfers in 8,482 8,507 6,425 (2,082) Transfers out (92) (143) (127) 16
Total other financing sources, net 8,390 8,364 6,298 (2,066)
Net change in fund balances (2,227) (1,305) 1,297 2,602
Fund balances ‐ beginning 4,131 4,131 4,131 -- Fund balances ‐ ending 1,904$ 2,826$ 5,428$ 2,602$
Amounts reported in the GAAP Statement of Revenues, Expenditures, and Changes in Fund Balances ‐
Governmental Funds are different because:
Actual amounts (budgetary basis) Total Other Financing Sources, Net 6,298$
(3)
3
6,298$
Transfers in resulting from transfers between the operating funds that are combined into a single special revenue
fund are eliminated for financial reporting purposes.
Transfers out resulting from transfers between the operating funds that are combined into a single special revenue
fund are eliminated for financial reporting purposes.
Total other financing sources, net on the Statement of Revenues, Expenditures, and Changes in Fund Balances ‐
Governmental Funds
Budgeted Amounts
120
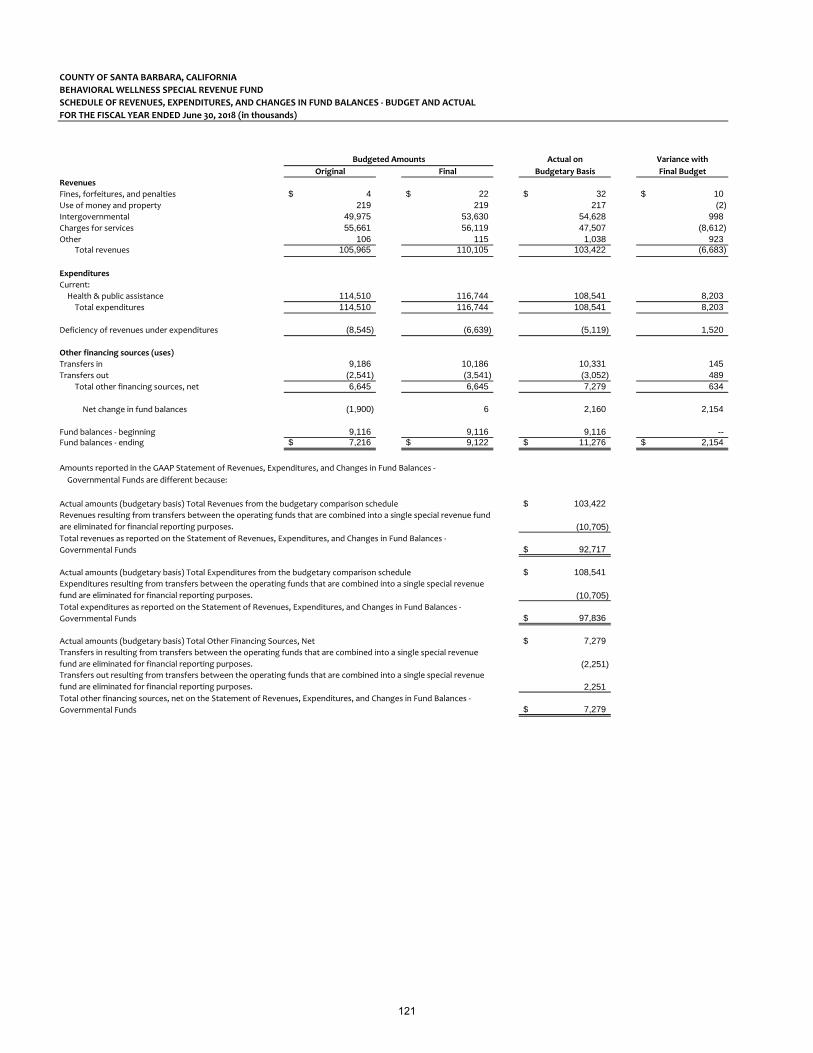
COUNTY OF SANTA BARBARA, CALIFORNIA
BEHAVIORAL WELLNESS SPECIAL REVENUE FUND
SCHEDULE OF REVENUES, EXPENDITURES, AND CHANGES IN FUND BALANCES ‐ BUDGET AND ACTUAL
FOR THE FISCAL YEAR ENDED June 30, 2018 (in thousands)
Actual on Variance with
Original Final Budgetary Basis Final Budget
Revenues
Fines, forfeitures, and penalties 4$ 22$ 32$ 10$ Use of money and property 219 219 217 (2) Intergovernmental 49,975 53,630 54,628 998 Charges for services 55,661 56,119 47,507 (8,612) Other 106 115 1,038 923
Total revenues 105,965 110,105 103,422 (6,683)
Expenditures
Current:
Health & public assistance 114,510 116,744 108,541 8,203 Total expenditures 114,510 116,744 108,541 8,203
Deficiency of revenues under expenditures (8,545) (6,639) (5,119) 1,520
Other financing sources (uses)
Transfers in 9,186 10,186 10,331 145 Transfers out (2,541) (3,541) (3,052) 489
Total other financing sources, net 6,645 6,645 7,279 634
Net change in fund balances (1,900) 6 2,160 2,154
Fund balances ‐ beginning 9,116 9,116 9,116 -- Fund balances ‐ ending 7,216$ 9,122$ 11,276$ 2,154$
Amounts reported in the GAAP Statement of Revenues, Expenditures, and Changes in Fund Balances ‐
Governmental Funds are different because:
Actual amounts (budgetary basis) Total Revenues from the budgetary comparison schedule 103,422$
(10,705)
92,717$
Actual amounts (budgetary basis) Total Expenditures from the budgetary comparison schedule 108,541$
(10,705)
97,836$
Actual amounts (budgetary basis) Total Other Financing Sources, Net 7,279$
(2,251)
2,251
7,279$
Transfers in resulting from transfers between the operating funds that are combined into a single special revenue
fund are eliminated for financial reporting purposes.
Transfers out resulting from transfers between the operating funds that are combined into a single special revenue
fund are eliminated for financial reporting purposes.
Total other financing sources, net on the Statement of Revenues, Expenditures, and Changes in Fund Balances ‐
Governmental Funds
Budgeted Amounts
Revenues resulting from transfers between the operating funds that are combined into a single special revenue fund
are eliminated for financial reporting purposes.
Total revenues as reported on the Statement of Revenues, Expenditures, and Changes in Fund Balances ‐
Governmental Funds
Expenditures resulting from transfers between the operating funds that are combined into a single special revenue
fund are eliminated for financial reporting purposes.
Total expenditures as reported on the Statement of Revenues, Expenditures, and Changes in Fund Balances ‐
Governmental Funds
121
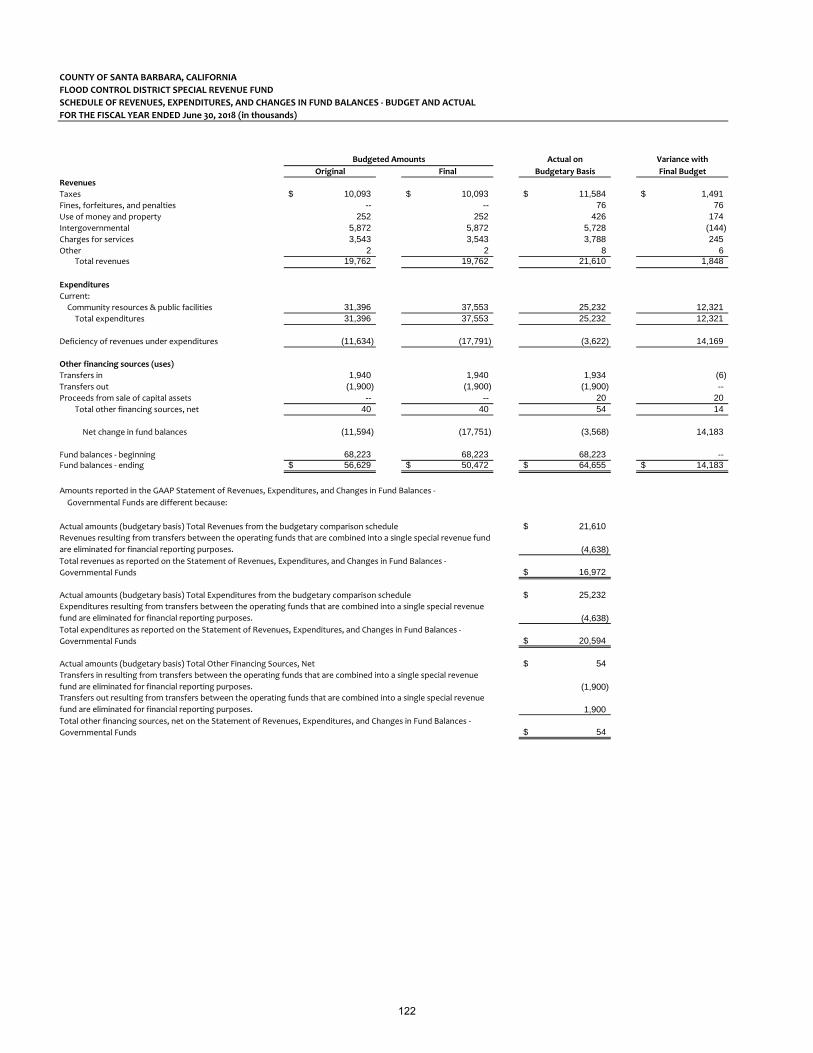
COUNTY OF SANTA BARBARA, CALIFORNIA
FLOOD CONTROL DISTRICT SPECIAL REVENUE FUND
SCHEDULE OF REVENUES, EXPENDITURES, AND CHANGES IN FUND BALANCES ‐ BUDGET AND ACTUAL
FOR THE FISCAL YEAR ENDED June 30, 2018 (in thousands)
Actual on Variance with
Original Final Budgetary Basis Final Budget
Revenues
Taxes 10,093$ 10,093$ 11,584$ 1,491$ Fines, forfeitures, and penalties -- -- 76 76 Use of money and property 252 252 426 174 Intergovernmental 5,872 5,872 5,728 (144) Charges for services 3,543 3,543 3,788 245 Other 2 2 8 6
Total revenues 19,762 19,762 21,610 1,848
Expenditures
Current:
Community resources & public facilities 31,396 37,553 25,232 12,321 Total expenditures 31,396 37,553 25,232 12,321
Deficiency of revenues under expenditures (11,634) (17,791) (3,622) 14,169
Other financing sources (uses)
Transfers in 1,940 1,940 1,934 (6) Transfers out (1,900) (1,900) (1,900) -- Proceeds from sale of capital assets -- -- 20 20
Total other financing sources, net 40 40 54 14
Net change in fund balances (11,594) (17,751) (3,568) 14,183
Fund balances ‐ beginning 68,223 68,223 68,223 -- Fund balances ‐ ending 56,629$ 50,472$ 64,655$ 14,183$
Amounts reported in the GAAP Statement of Revenues, Expenditures, and Changes in Fund Balances ‐
Governmental Funds are different because:
Actual amounts (budgetary basis) Total Revenues from the budgetary comparison schedule 21,610$
(4,638)
16,972$
Actual amounts (budgetary basis) Total Expenditures from the budgetary comparison schedule 25,232$
(4,638)
20,594$
Actual amounts (budgetary basis) Total Other Financing Sources, Net 54$
(1,900)
1,900
54$
Transfers in resulting from transfers between the operating funds that are combined into a single special revenue
fund are eliminated for financial reporting purposes.
Transfers out resulting from transfers between the operating funds that are combined into a single special revenue
fund are eliminated for financial reporting purposes.
Total other financing sources, net on the Statement of Revenues, Expenditures, and Changes in Fund Balances ‐
Governmental Funds
Budgeted Amounts
Revenues resulting from transfers between the operating funds that are combined into a single special revenue fund
are eliminated for financial reporting purposes.
Total revenues as reported on the Statement of Revenues, Expenditures, and Changes in Fund Balances ‐
Governmental Funds
Expenditures resulting from transfers between the operating funds that are combined into a single special revenue
fund are eliminated for financial reporting purposes.
Total expenditures as reported on the Statement of Revenues, Expenditures, and Changes in Fund Balances ‐
Governmental Funds
122
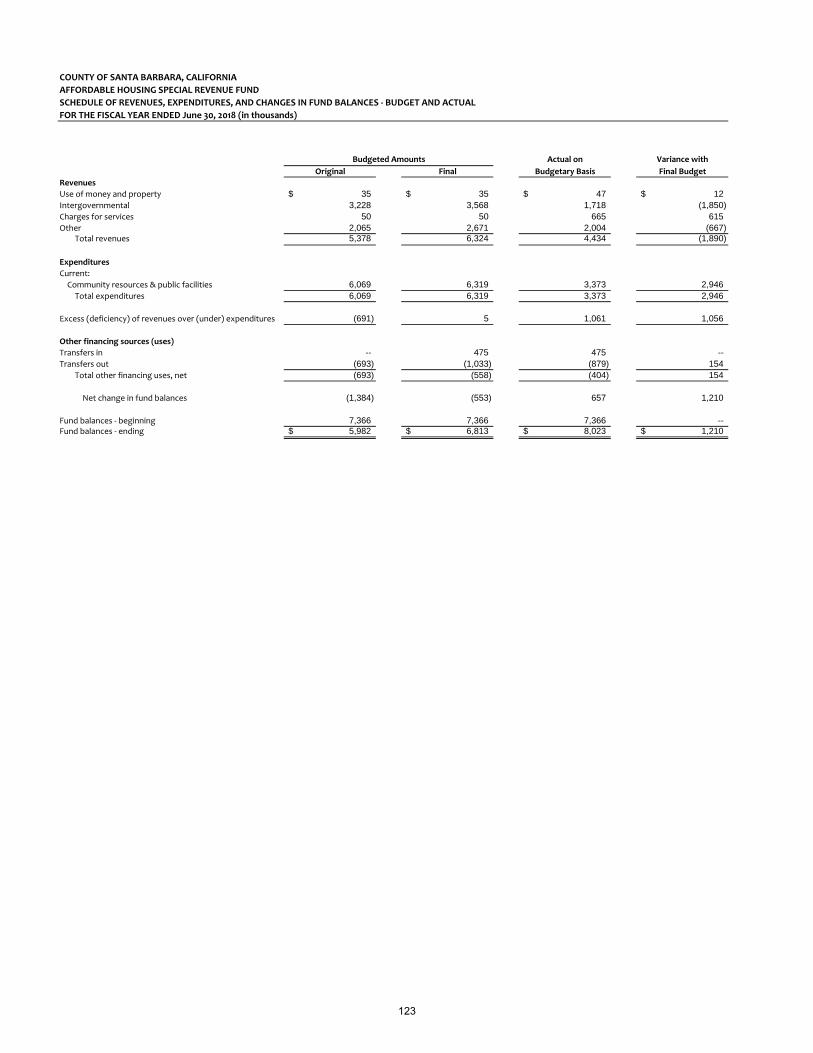
COUNTY OF SANTA BARBARA, CALIFORNIA
AFFORDABLE HOUSING SPECIAL REVENUE FUND
SCHEDULE OF REVENUES, EXPENDITURES, AND CHANGES IN FUND BALANCES ‐ BUDGET AND ACTUAL
FOR THE FISCAL YEAR ENDED June 30, 2018 (in thousands)
Actual on Variance with
Original Final Budgetary Basis Final Budget
Revenues
Use of money and property 35$ 35$ 47$ 12$ Intergovernmental 3,228 3,568 1,718 (1,850) Charges for services 50 50 665 615 Other 2,065 2,671 2,004 (667)
Total revenues 5,378 6,324 4,434 (1,890)
Expenditures
Current:
Community resources & public facilities 6,069 6,319 3,373 2,946 Total expenditures 6,069 6,319 3,373 2,946
Excess (deficiency) of revenues over (under) expenditures (691) 5 1,061 1,056
Other financing sources (uses)
Transfers in -- 475 475 -- Transfers out (693) (1,033) (879) 154
Total other financing uses, net (693) (558) (404) 154
Net change in fund balances (1,384) (553) 657 1,210
Fund balances ‐ beginning 7,366 7,366 7,366 -- Fund balances ‐ ending 5,982$ 6,813$ 8,023$ 1,210$
Budgeted Amounts
123
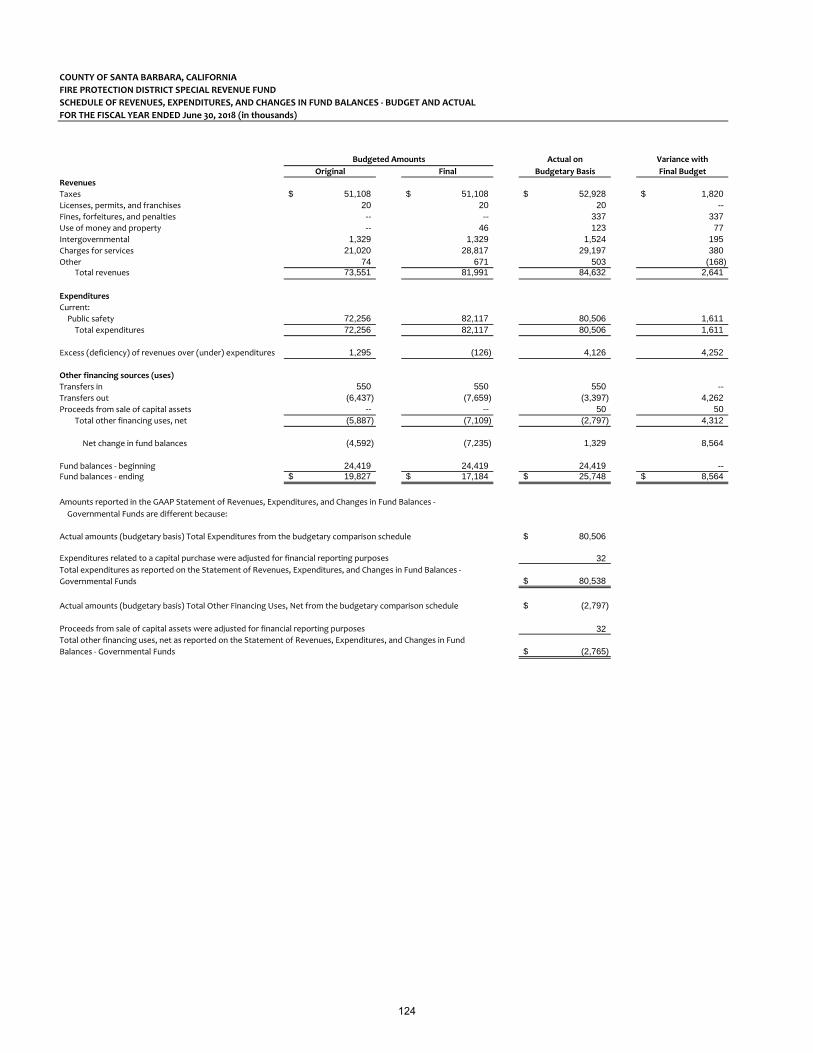
COUNTY OF SANTA BARBARA, CALIFORNIA
FIRE PROTECTION DISTRICT SPECIAL REVENUE FUND
SCHEDULE OF REVENUES, EXPENDITURES, AND CHANGES IN FUND BALANCES ‐ BUDGET AND ACTUAL
FOR THE FISCAL YEAR ENDED June 30, 2018 (in thousands)
Actual on Variance with
Original Final Budgetary Basis Final Budget
Revenues
Taxes 51,108$ 51,108$ 52,928$ 1,820$ Licenses, permits, and franchises 20 20 20 -- Fines, forfeitures, and penalties -- -- 337 337 Use of money and property -- 46 123 77 Intergovernmental 1,329 1,329 1,524 195 Charges for services 21,020 28,817 29,197 380 Other 74 671 503 (168)
Total revenues 73,551 81,991 84,632 2,641
Expenditures
Current:
Public safety 72,256 82,117 80,506 1,611 Total expenditures 72,256 82,117 80,506 1,611
Excess (deficiency) of revenues over (under) expenditures 1,295 (126) 4,126 4,252
Other financing sources (uses)
Transfers in 550 550 550 -- Transfers out (6,437) (7,659) (3,397) 4,262 Proceeds from sale of capital assets -- -- 50 50
Total other financing uses, net (5,887) (7,109) (2,797) 4,312
Net change in fund balances (4,592) (7,235) 1,329 8,564
Fund balances ‐ beginning 24,419 24,419 24,419 -- Fund balances ‐ ending 19,827$ 17,184$ 25,748$ 8,564$
Amounts reported in the GAAP Statement of Revenues, Expenditures, and Changes in Fund Balances ‐
Governmental Funds are different because:
Actual amounts (budgetary basis) Total Expenditures from the budgetary comparison schedule 80,506$
32
80,538$
Actual amounts (budgetary basis) Total Other Financing Uses, Net from the budgetary comparison schedule (2,797)$
32
(2,765)$
Proceeds from sale of capital assets were adjusted for financial reporting purposes
Budgeted Amounts
Expenditures related to a capital purchase were adjusted for financial reporting purposes
Total expenditures as reported on the Statement of Revenues, Expenditures, and Changes in Fund Balances ‐
Governmental Funds
Total other financing uses, net as reported on the Statement of Revenues, Expenditures, and Changes in Fund
Balances ‐ Governmental Funds
124

COUNTY OF SANTA BARBARA | COMPREHENSIVE ANNUAL FINANCIAL REPORT FISCAL YEAR ENDED JUNE 30, 2018
REQUIRED SUPPLEMENTARY INFORMATIONUNAUDITED AND IN THOUSANDS
Notes to Required Supplementary Information Santa Barbara County’s Retirement System Changes of assumptions. Amounts reported in FY 2017 reflect a decrease in the discount rate, decreases in cost of living adjustment (COLA) and wage inflation assumptions, and revised mortality assumptions to more closely reflect actual experience. Other Postemployment Benefits (OPEB) Plan Beginning in FY 2014, the County adopted an OPEB funding rate based upon pensionable payroll. The funding rates were 3.5% for FY 2015 and 3.75% for FY 2016. Effective July 1, 2016, the County OPEB (401(h) Account) Funding Policy adopted an ongoing rate of 4% of covered payroll for the 401(a) Pension Plan. Budgetary Compliance
The County is legally required to adopt an annual budget and adhere to the provisions of the California Government Code (Sections 29000 – 29144 and 30200), commonly known as the County Budget Act. Budgets are adopted for the general, special revenue, debt service and capital projects funds. Budgets are prepared on the modified accrual basis of accounting consistent with generally accepted accounting principles (GAAP). The Board annually conducts a public hearing for the discussion of a recommended budget. At the conclusion of the hearings, statutorily no later than October 2, the Board of Supervisors (Board) adopts the final budget including revisions by resolution. However, it has been the County’s practice to adopt the budget prior to the start of the fiscal year. The Board also adopts subsequent revisions that occur throughout the year. All annual appropriations lapse at fiscal year‐end. The legal level of budgetary control (i.e., the level at which expenditures may not legally exceed appropriations) is maintained at the fund, department, and object level with more stringent control over capital assets, and fund balance accounts which are controlled at the line item level. Except for payroll, the County’s financial system does not process payments and disbursements when over‐expenditure of object levels would result. For capital asset and fund balance transactions, payments are not processed if over‐expenditure at the line item would result. Presentation of the basic financial statements at the legal level is not feasible due to excessive length; therefore, the budget and actual statements have been aggregated by function. The County prepares a separate Final Budget document that demonstrates legal compliance with budgetary control. This document is made available to the public on the County’s website, or can be obtained from the Auditor‐Controller’s office. For the year ended June 30, 2018, no instances existed in which expenditures exceeded appropriations. The Board must approve amendments or transfers of appropriations between funds or departments, as well as items related to capital assets, and fund balance accounts. Supplemental appropriations necessary and normally financed by unanticipated revenues during the year must also be approved by the Board. Finally, the Chief Executive Officer (CEO) approves amendments or transfers of appropriations between object levels within the same department, unless related to capital or fund balance in which case Board approval is required. Any deficiency caused by expenditures and other financing uses being greater than revenues and other financing sources is financed by beginning available fund balances as provided for in the County Budget Act.
125

126

Other Supplementary Information
127

128
Other Major Governmental Fund
129

COUNTY OF SANTA BARBARA, CALIFORNIA
CAPITAL PROJECTS FUND
SCHEDULE OF REVENUES, EXPENDITURES, AND CHANGES IN FUND BALANCES ‐ BUDGET AND ACTUAL
FOR THE FISCAL YEAR ENDED June 30, 2018 (in thousands)
Actual on Variance with
Original Final Budgetary Basis Final Budget
Revenues
Use of money and property 5$ 22$ 21$ (1)$ Intergovernmental 64,728 35,670 35,943 273 Charges for services 10 1,026 132 (894) Other 155 155 186 31
Total revenues 64,898 36,873 36,282 (591)
Expenditures
Capital outlay 81,449 49,783 39,756 10,027 Total expenditures 81,449 49,783 39,756 10,027
Deficiency of revenues under expenditures (16,551) (12,910) (3,474) 9,436
Other financing sources (uses)
Transfers in 6,062 9,798 3,109 (6,689) Transfers out -- (362) -- 362
Total other financing sources, net 6,062 9,436 3,109 (6,327)
Net change in fund balances (10,489) (3,474) (365) 3,109
Fund balances ‐ beginning 21,639 21,639 21,639 -- Fund balances ‐ ending 11,150$ 18,165$ 21,274$ 3,109$
Budgeted Amounts
130

Nonmajor Governmental Funds
131

COUNTY OF SANTA BARBARA | COMPREHENSIVE ANNUAL FINANCIAL REPORT FISCAL YEAR ENDED JUNE 30, 2018
NONMAJOR GOVERNMENTAL FUNDS
Nonmajor governmental funds are funds that do not meet the definition of a major fund, as described in the glossary. The following funds are presented as nonmajor funds in the CAFR:
Special Revenue Funds Special Revenue Funds are established to finance particular governmental activities and are financed by specific taxes or other revenues. Such funds are authorized by statutory provisions to pay for certain activities of a continuing nature. Included in the Special Revenue classification are the following funds: Fish and Game The Fish and Game Fund is used to account for fines and forfeitures received under Section 13003 of the State of California Fish and Game Code and for other revenues and expenditures for the propagation and conservation of fish and game. The Board of Supervisors authorizes expenditures on advice of the Fish and Game Commission. Petroleum The Petroleum Fund, established pursuant to Chapter 25 of the County Code, is used to account for the revenues and expenditures associated with administering the Petroleum Ordinance. The Petroleum Ordinance regulates the issuing of oil well drilling permits. It also regulates drilling, operating and abandoning petroleum wells, pipelines, tanks and associated petroleum equipment for prevention of erosion, pollution and fire hazards and for safety controls. Public and Educational Access The fund for Public and Educational Access was established in December 2001 by the Board of Supervisors to receive grant revenue from the local cable television franchisee. The primary objectives and purposes of the fund are the support of education and public information through programs aimed at expanding public access and educational access to telecommunication services. Special Aviation The Special Aviation Fund is used to account for activity related to the Santa Ynez Airport. It is funded primarily by state and federal grants for airport improvements.
In-Home Supportive Services (IHSS) Public Authority The In-Home Supportive Services Public Authority Fund was established by the Board of Supervisors to act as the employer of record for IHSS individual providers. As an administrative unit, it carries out functions prescribed in Welfare & Institutions Code Section 12301.6. Those functions include a provider screening process, a registry that will match eligible providers and consumers, and collective bargaining with providers and their representatives. IHSS also offers access to training for providers and consumers while continuing to allow for consumer choice in the selection of providers.
Child Support Services AB 196, AB 150, and SB 542 established the Child Support Services Fund during FY 00-01 to provide separate fund accountability as required. These legislative bills mandated that all Family Support Divisions located in the District Attorney’s Offices become separate and independent departments. Child Support Services establishes paternity, obtains and enforces court orders for child support, collects and distributes payments, and provides community outreach about those services for the benefit of minor children.
Fishermen Assistance This column combines the following individual County funds:
Fisheries Enhancement The Fisheries Enhancement Fund (FEF) was established to mitigate impacts to the commercial fishing industry from offshore oil and gas development. Impact fees paid by offshore energy producers, pursuant to permit conditions, supports the FEF. In early 1993, the Planning Commission approved a supplemental needs assessment that, pursuant to Board of Supervisors adopted FEF Guidelines, recommends specific projects to be pursued for FEF awards.
132

COUNTY OF SANTA BARBARA | COMPREHENSIVE ANNUAL FINANCIAL REPORT FISCAL YEAR ENDED JUNE 30, 2018
NONMAJOR GOVERNMENTAL FUNDS
Local Fishermen’s Contingency The Local Fishermen's Contingency Fund is financed by County permit conditions placed upon energy projects to mitigate impacts to the commercial fishing industry. The intent of the fund is to provide an interest-free loan program to fishermen awaiting payment of claims from the Federal Fishermen's Contingency Fund. The claims are for damage or loss resulting from outer continental shelf development or production, and to reimburse fishermen for damage or loss of gear, not covered under the federal fund, which occurs in state waters because of federal or state oil and gas development, or because of oil production activities such as transport.
Coastal Resources Enhancement The Coastal Resources Enhancement Fund was established on May 10, 1988 to account for revenues received from offshore oil and gas projects pursuant to permit conditions, and expanded by the Board of Supervisors to projects that mitigate impacts to coastal recreation, aesthetics, tourism, and/or sensitive environmental resources. Court Activities AB 2544 in FY 94-95 established the Court Activities Fund to account for the state’s portion of Trial Court Funding. AB 233, adopted in FY 97-98, transferred state funding out of the County entity. This fund represents the portion of Trial Court Operations under the County’s control. Criminal Justice Construction The Criminal Justice Construction Fund was established to account for state authorized surcharges on criminal fines, which are statutorily designated for the establishment of adequate criminal justice facilities in the County.
Courthouse Construction The Courthouse Construction Fund was established to account for state authorized surcharges on fines for non-parking and other criminal cases, which are statutorily designated for renovation and/or construction of courtroom facilities.
Inmate Welfare The Inmate Welfare Fund was established pursuant to Penal Code Section 4025 to account for profits from the County jail store and any money attributable to the use of pay telephones. The funds are expended primarily for the benefit, education, and welfare of the inmates confined within the jail.
Special Districts Under the Board of Supervisors Separate special districts have been established for the purpose of providing specific services to distinct geographical areas within the County. Those special districts that are under the jurisdiction of the Board of Supervisors are included within the Special Revenue Fund classification. These are financed principally from property taxes and benefit assessments, and are comprised of the following:
County Service Areas (CSAs) This column combines the following individual County funds:
County Service Area #3 This service area serves part of the Goleta Valley, providing extended park and open space acquisition and maintenance, enhanced library services and street lighting. It provides 1,430 streetlights and maintains approximately 535 acres of open space and 148 acres of parks. This fund also made payments for the Goleta Valley Community Center and the Santa Barbara Shores property prior to the transfer of these assets to the City of Goleta. County Service Area #4 This service area is located north of the City of Lompoc and serves the communities of Mission Hills and Vandenberg Village. It maintains approximately 52 acres of open space.
133

COUNTY OF SANTA BARBARA | COMPREHENSIVE ANNUAL FINANCIAL REPORT FISCAL YEAR ENDED JUNE 30, 2018
NONMAJOR GOVERNMENTAL FUNDS
County Service Area #5 This service area serves the Orcutt area south of Santa Maria, providing extended park and open space activities. Extending from Waller Park, to just south of Rice Ranch Road, CSA #5 encompasses approximately 68 acres of parkland (Waller Park) and 11 acres of open space. County Service Area #11 This service area embraces the unincorporated urbanized area of Carpinteria Valley and Summerland. The service area provides the community with parks and 77 streetlights. County Service Area #12 – Mission Canyon Sewer Service Charge This service area was established for the purpose of assessing property owners for the ongoing maintenance of the sewer system and septic tank inspection services for those properties in the prohibition area, but not on public sewers. A separate assessment is charged to properties remaining on septic systems in order to provide septic performance tracking.
County Service Area #31 This service area embraces the unincorporated community of Isla Vista, located west of the University of California at Santa Barbara, and provides 277 streetlights; installation, maintenance and repair of sidewalks, curbs and gutters and planting, along with maintenance and care of street trees.
County Service Area #41 This service area was established to assess property owners of the Rancho Santa Rita Subdivision, located outside the City of Lompoc, for road repairs, maintenance and improvements.
Community Facilities Districts (CFDs) This column combines the following individual County funds:
Orcutt Community Facilities District In October 2002, qualified landowners approved the formation of a CFD within the Orcutt Planning Area, located south of the City of Santa Maria. The CFD levied a special tax that may be used to finance infrastructure construction, fire and sheriff protection services, maintenance of parks, parkways and open space, and flood and storm protection services.
Providence Landing Community Facilities District This Mello-Roos district encompasses the Providence Landing subdivision in South Vandenberg Village and provides funding for the maintenance of a public park.
Lighting Districts This column combines the following individual County funds:
Mission Lighting District This district provides 19 streetlights in the unincorporated area of Mission Canyon, located east of the City of Santa Barbara, and is financed by property taxes and benefit assessments. North County Lighting District Casmalia, Los Alamos, and Orcutt Lighting Districts and the lighting function of CSA #4 and CSA #5 were consolidated in FY 94-95 to form the North County Lighting District which provides 2,764 streetlights in the North County. This district is financed by property taxes and benefit assessments.
Sandyland Seawall Maintenance District This district provides for the maintenance of a seawall constructed in the Sandyland Cove area, and is financed through benefit assessments levied against those properties adjacent to that beachfront area.
134
COUNTY OF SANTA BARBARA | COMPREHENSIVE ANNUAL FINANCIAL REPORT FISCAL YEAR ENDED JUNE 30, 2018
NONMAJOR GOVERNMENTAL FUNDS
Water Agency This agency prepares investigations and reports on the County's water requirements, project development, and efficient use of water. The agency provides technical assistance to other County departments, water districts, and the public concerning water availability and water well locations and design. The agency also administers the Cachuma Project and Twitchell Dam Project contracts with the U.S. Bureau of Reclamation. It is funded primarily by state grants and property tax revenue.
Debt Service Funds Debt Service Funds are used to account for the accumulation of resources for, and the payment of, general long-term debt.
Santa Barbara County Finance Corporation The Santa Barbara County Finance Corporation Debt Service Fund accounts for the accumulation of resources for, and payment of, principal and interest incurred from the sale of Certificates of Participation and other municipal debt that is issued to finance various County capital projects.
135
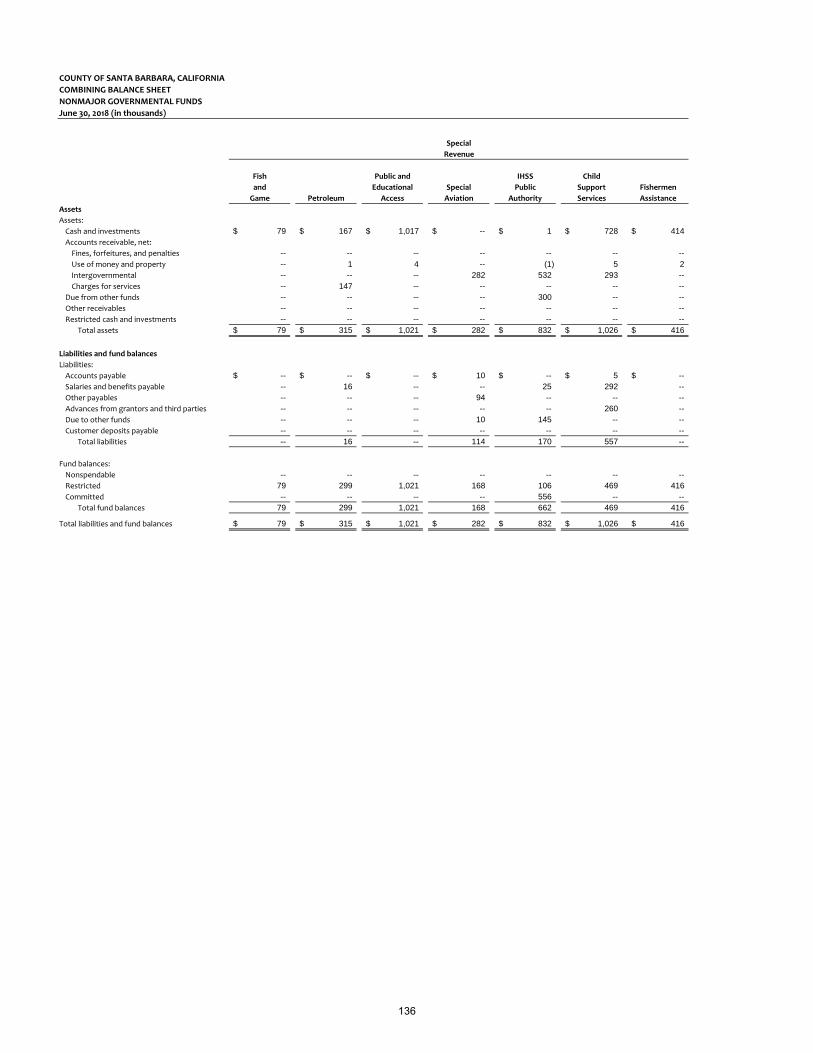
COUNTY OF SANTA BARBARA, CALIFORNIA
COMBINING BALANCE SHEET
NONMAJOR GOVERNMENTAL FUNDS
June 30, 2018 (in thousands)
Fish Public and IHSS Child
and Educational Special Public Support Fishermen
Game Petroleum Access Aviation Authority Services Assistance
Assets
Assets:
Cash and investments 79$ 167$ 1,017$ --$ 1$ 728$ 414$ Accounts receivable, net:
Fines, forfeitures, and penalties -- -- -- -- -- -- -- Use of money and property -- 1 4 -- (1) 5 2 Intergovernmental -- -- -- 282 532 293 -- Charges for services -- 147 -- -- -- -- --
Due from other funds -- -- -- -- 300 -- -- Other receivables -- -- -- -- -- -- -- Restricted cash and investments -- -- -- -- -- -- --
Total assets 79$ 315$ 1,021$ 282$ 832$ 1,026$ 416$
Liabilities and fund balances
Liabilities:
Accounts payable --$ --$ --$ 10$ --$ 5$ --$ Salaries and benefits payable -- 16 -- -- 25 292 -- Other payables -- -- -- 94 -- -- -- Advances from grantors and third parties -- -- -- -- -- 260 -- Due to other funds -- -- -- 10 145 -- -- Customer deposits payable -- -- -- -- -- -- --
Total liabilities -- 16 -- 114 170 557 --
Fund balances:
Nonspendable -- -- -- -- -- -- -- Restricted 79 299 1,021 168 106 469 416 Committed -- -- -- -- 556 -- --
Total fund balances 79 299 1,021 168 662 469 416
Total liabilities and fund balances 79$ 315$ 1,021$ 282$ 832$ 1,026$ 416$
Special
Revenue
136

Coastal Criminal County Community
Resources Court Justice Courthouse Inmate Service Facilites
Enhancement Activities Construction Construction Welfare Areas Districts
Assets
Assets:
2,007$ 318$ --$ 2,646$ 2,323$ 4,041$ 744$ Cash and investments
Accounts receivable, net:
-- 145 73 73 -- -- -- Fines, forfeitures, and penalties
8 (3) (3) 10 8 16 3 Use of money and property
-- -- -- -- -- -- -- Intergovernmental
-- 236 -- -- -- -- -- Charges for services
-- 518 499 -- -- -- -- Due from other funds
-- -- -- -- -- 13 -- Other receivables
-- -- -- -- -- -- -- Restricted cash and investments
2,015$ 1,214$ 569$ 2,729$ 2,331$ 4,070$ 747$ Total assets
Liabilities and fund balances
Liabilities:
--$ 242$ --$ --$ 118$ 211$ --$ Accounts payable
-- -- -- -- 16 -- -- Salaries and benefits payable
-- -- -- -- -- -- -- Other payables
-- -- -- -- -- -- -- Advances from grantors and third parties
-- 671 569 -- -- -- -- Due to other funds
-- -- -- -- -- -- -- Customer deposits payable
-- 913 569 -- 134 211 -- Total liabilities
Fund balances:
-- -- -- -- -- 13 -- Nonspendable
2,015 230 -- 2,729 2,197 3,846 747 Restricted
-- 71 -- -- -- -- -- Committed
2,015 301 -- 2,729 2,197 3,859 747 Total fund balances
2,015$ 1,214$ 569$ 2,729$ 2,331$ 4,070$ 747$ Total liabilities and fund balances
Special
Revenue
137

COUNTY OF SANTA BARBARA, CALIFORNIA
COMBINING BALANCE SHEET (Continued)
NONMAJOR GOVERNMENTAL FUNDS
June 30, 2018 (in thousands)
Debt
Service
Sandyland Santa Total
Seawall Special Barbara Nonmajor
Lighting Maintenance Water Revenue County Finance Governmental
Districts District Agency Total Corporation Funds
Assets
Assets:
Cash and investments 438$ 763$ 8,731$ 24,417$ 128$ 24,545$ Accounts receivable, net:
Fines, forfeitures, and penalties -- -- -- 291 -- 291 Use of money and property 2 3 32 87 -- 87 Intergovernmental -- -- 35 1,142 -- 1,142 Charges for services -- -- 6 389 -- 389
Due from other funds -- -- -- 1,317 -- 1,317 Other receivables 6 -- 61 80 -- 80 Restricted cash and investments -- -- -- -- 1,174 1,174
Total assets 446$ 766$ 8,865$ 27,723$ 1,302$ 29,025$
Liabilities and fund balances
Liabilities:
Accounts payable 44$ --$ 176$ 806$ --$ 806$ Salaries and benefits payable -- -- 45 394 -- 394 Other payables -- -- -- 94 -- 94 Advances from grantors and third parties -- -- -- 260 -- 260 Due to other funds -- -- -- 1,395 -- 1,395 Customer deposits payable -- -- (2) (2) -- (2)
Total liabilities 44 -- 219 2,947 -- 2,947
Fund balances:
Nonspendable 6 -- 61 80 -- 80 Restricted 396 766 8,048 23,532 1,302 24,834 Committed -- -- 537 1,164 -- 1,164
Total fund balances 402 766 8,646 24,776 1,302 26,078
Total liabilities and fund balances 446$ 766$ 8,865$ 27,723$ 1,302$ 29,025$
Special
Revenue
138

139
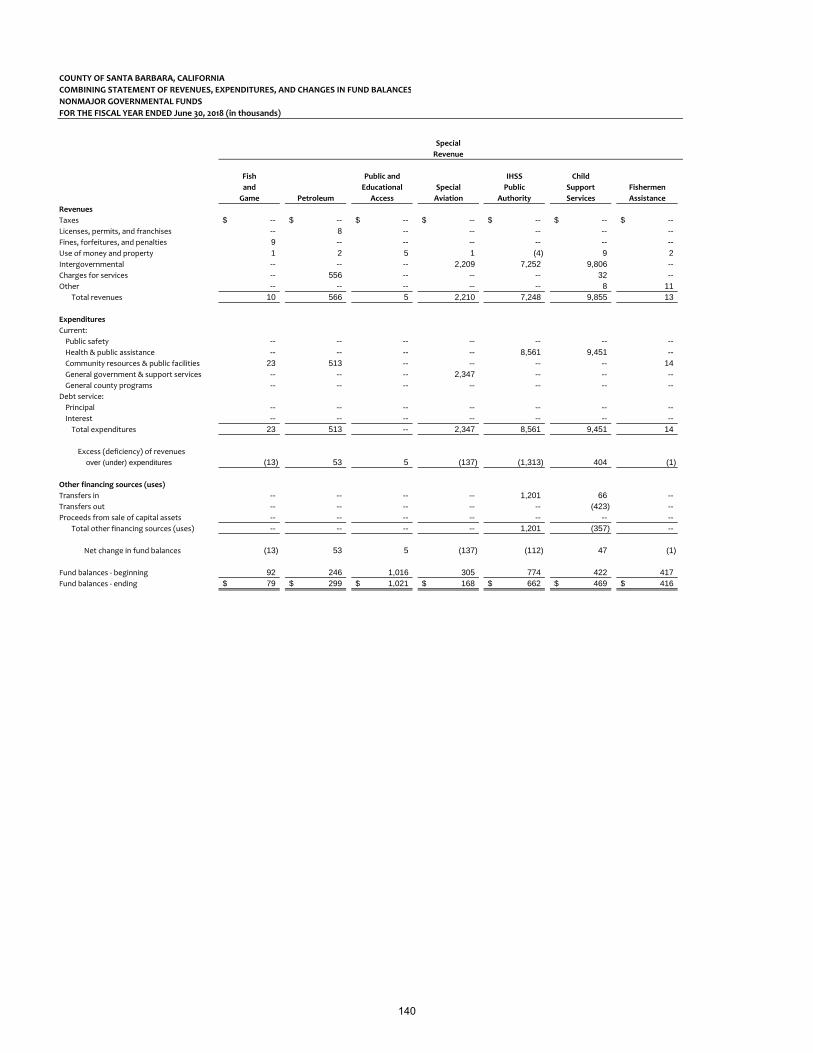
COUNTY OF SANTA BARBARA, CALIFORNIA
COMBINING STATEMENT OF REVENUES, EXPENDITURES, AND CHANGES IN FUND BALANCES
NONMAJOR GOVERNMENTAL FUNDS
FOR THE FISCAL YEAR ENDED June 30, 2018 (in thousands)
Fish Public and IHSS Child
and Educational Special Public Support Fishermen
Game Petroleum Access Aviation Authority Services Assistance
Revenues
Taxes --$ --$ --$ --$ --$ --$ --$ Licenses, permits, and franchises -- 8 -- -- -- -- -- Fines, forfeitures, and penalties 9 -- -- -- -- -- -- Use of money and property 1 2 5 1 (4) 9 2 Intergovernmental -- -- -- 2,209 7,252 9,806 -- Charges for services -- 556 -- -- -- 32 -- Other -- -- -- -- -- 8 11
Total revenues 10 566 5 2,210 7,248 9,855 13
Expenditures
Current:
Public safety -- -- -- -- -- -- -- Health & public assistance -- -- -- -- 8,561 9,451 -- Community resources & public facilities 23 513 -- -- -- -- 14 General government & support services -- -- -- 2,347 -- -- -- General county programs -- -- -- -- -- -- --
Debt service:
Principal -- -- -- -- -- -- -- Interest -- -- -- -- -- -- -- Total expenditures 23 513 -- 2,347 8,561 9,451 14
Excess (deficiency) of revenues
over (under) expenditures (13) 53 5 (137) (1,313) 404 (1)
Other financing sources (uses)
Transfers in -- -- -- -- 1,201 66 -- Transfers out -- -- -- -- -- (423) -- Proceeds from sale of capital assets -- -- -- -- -- -- --
Total other financing sources (uses) -- -- -- -- 1,201 (357) --
Net change in fund balances (13) 53 5 (137) (112) 47 (1)
Fund balances ‐ beginning 92 246 1,016 305 774 422 417 Fund balances ‐ ending 79$ 299$ 1,021$ 168$ 662$ 469$ 416$
Special
Revenue
140

Coastal Criminal County Community
Resources Court Justice Courthouse Inmate Service Facilities
Enhancement Activities Construction Construction Welfare Areas Districts
Revenues
--$ --$ --$ --$ --$ 1,455$ 635$ Taxes
-- -- -- -- -- -- -- Licenses, permits, and franchises
-- 1,412 680 680 -- 8 -- Fines, forfeitures, and penalties
10 16 (8) 13 500 26 4 Use of money and property
-- -- -- -- -- 6 -- Intergovernmental
-- 2,979 -- -- -- 513 -- Charges for services
449 990 -- -- 1,132 -- -- Other
459 5,397 672 693 1,632 2,008 639 Total revenues
Expenditures
Current:
-- 14,552 -- -- 1,471 -- -- Public safety
-- -- -- -- -- -- -- Health & public assistance
67 -- -- -- -- 755 192 Community resources & public facilities
-- -- -- -- -- -- -- General government & support services
-- -- -- -- -- -- -- General county programs
Debt service:
-- -- -- -- -- -- -- Principal
-- -- -- -- -- -- -- Interest
67 14,552 -- -- 1,471 755 192 Total expenditures
Excess (deficiency) of revenues
392 (9,155) 672 693 161 1,253 447 over (under) expenditures
Other financing sources (uses)
-- 9,136 346 -- -- -- -- Transfers in
-- -- (1,018) (223) -- (1,053) (372) Transfers out
-- -- -- -- -- -- -- Proceeds from sale of capital assets
-- 9,136 (672) (223) -- (1,053) (372) Total other financing sources (uses)
392 (19) -- 470 161 200 75 Net change in fund balances
1,623 320 -- 2,259 2,036 3,659 672 Fund balances ‐ beginning
2,015$ 301$ --$ 2,729$ 2,197$ 3,859$ 747$ Fund balances ‐ ending
Special
Revenue
141
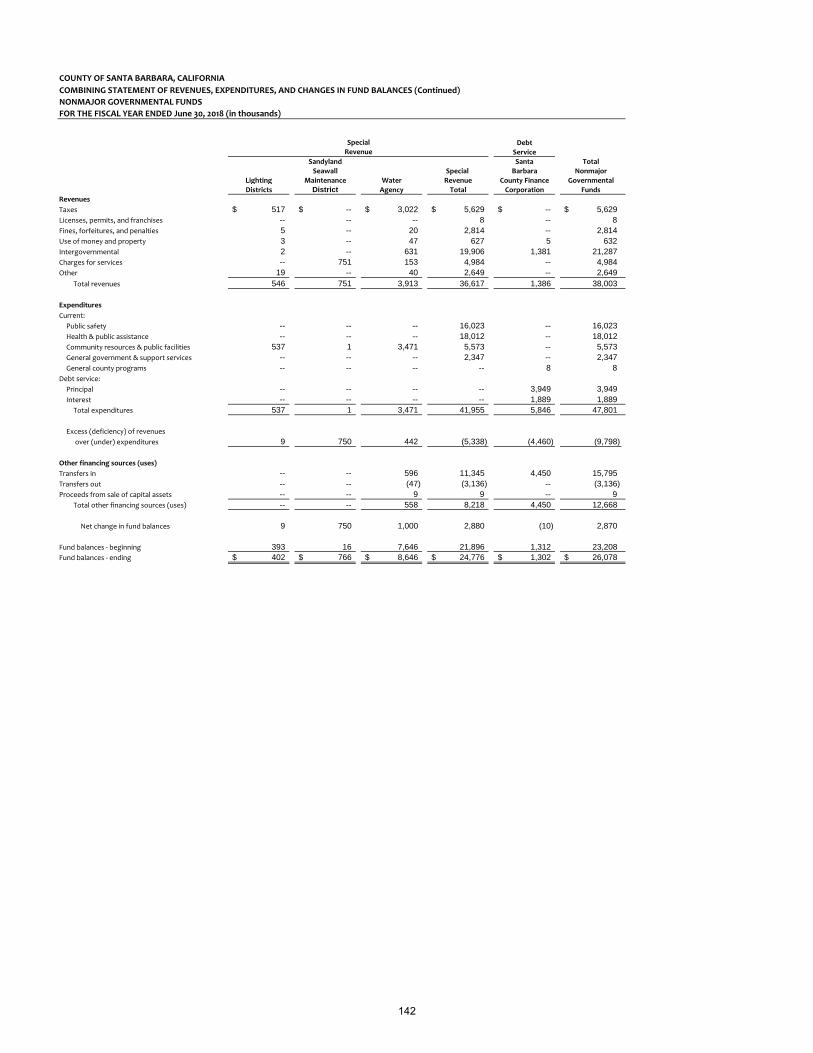
COUNTY OF SANTA BARBARA, CALIFORNIA
COMBINING STATEMENT OF REVENUES, EXPENDITURES, AND CHANGES IN FUND BALANCES (Continued)
NONMAJOR GOVERNMENTAL FUNDS
FOR THE FISCAL YEAR ENDED June 30, 2018 (in thousands)
Debt
Service
Sandyland Santa Total
Seawall Special Barbara Nonmajor
Lighting Maintenance Water Revenue County Finance Governmental
Districts District Agency Total Corporation Funds
Revenues
Taxes 517$ --$ 3,022$ 5,629$ --$ 5,629$ Licenses, permits, and franchises -- -- -- 8 -- 8 Fines, forfeitures, and penalties 5 -- 20 2,814 -- 2,814 Use of money and property 3 -- 47 627 5 632 Intergovernmental 2 -- 631 19,906 1,381 21,287 Charges for services -- 751 153 4,984 -- 4,984 Other 19 -- 40 2,649 -- 2,649
Total revenues 546 751 3,913 36,617 1,386 38,003
Expenditures
Current:
Public safety -- -- -- 16,023 -- 16,023 Health & public assistance -- -- -- 18,012 -- 18,012 Community resources & public facilities 537 1 3,471 5,573 -- 5,573 General government & support services -- -- -- 2,347 -- 2,347 General county programs -- -- -- -- 8 8
Debt service:
Principal -- -- -- -- 3,949 3,949 Interest -- -- -- -- 1,889 1,889
Total expenditures 537 1 3,471 41,955 5,846 47,801
Excess (deficiency) of revenues
over (under) expenditures 9 750 442 (5,338) (4,460) (9,798)
Other financing sources (uses)
Transfers in -- -- 596 11,345 4,450 15,795 Transfers out -- -- (47) (3,136) -- (3,136) Proceeds from sale of capital assets -- -- 9 9 -- 9
Total other financing sources (uses) -- -- 558 8,218 4,450 12,668
Net change in fund balances 9 750 1,000 2,880 (10) 2,870
Fund balances ‐ beginning 393 16 7,646 21,896 1,312 23,208 Fund balances ‐ ending 402$ 766$ 8,646$ 24,776$ 1,302$ 26,078$
Special
Revenue
142

143

COUNTY OF SANTA BARBARA, CALIFORNIA
FISH AND GAME SPECIAL REVENUE FUND
SCHEDULE OF REVENUES, EXPENDITURES, AND CHANGES IN FUND BALANCES ‐ BUDGET AND ACTUAL
FOR THE FISCAL YEAR ENDED June 30, 2018 (in thousands)
Actual on Variance with
Original Final Budgetary Basis Final Budget
Revenues
Fines, forfeitures, and penalties 11$ 11$ 9$ (2)$ Use of money and property -- -- 1 1
Total revenues 11 11 10 (1)
Expenditures
Current:
Community resources & public facilities 27 27 23 4 Total expenditures 27 27 23 4
Deficiency of revenues under expenditures (16) (16) (13) 3
Net change in fund balances (16) (16) (13) 3
Fund balances ‐ beginning 92 92 92 -- Fund balances ‐ ending 76$ 76$ 79$ 3$
Budgeted Amounts
144

COUNTY OF SANTA BARBARA, CALIFORNIA
PETROLEUM SPECIAL REVENUE FUND
SCHEDULE OF REVENUES, EXPENDITURES, AND CHANGES IN FUND BALANCES ‐ BUDGET AND ACTUAL
FOR THE FISCAL YEAR ENDED June 30, 2018 (in thousands)
Actual on Variance with
Original Final Budgetary Basis Final Budget
Revenues
Licenses, permits, and franchises 50$ 50$ 8$ (42)$ Use of money and property 2 2 2 -- Charges for services 605 605 556 (49)
Total revenues 657 657 566 (91)
Expenditures
Current:
Community resources & public facilities 656 646 513 133 Total expenditures 656 646 513 133
Excess of revenues over expenditures 1 11 53 42
Net change in fund balances 1 11 53 42
Fund balances ‐ beginning 246 246 246 -- Fund balances ‐ ending 247$ 257$ 299$ 42$
Budgeted Amounts
145
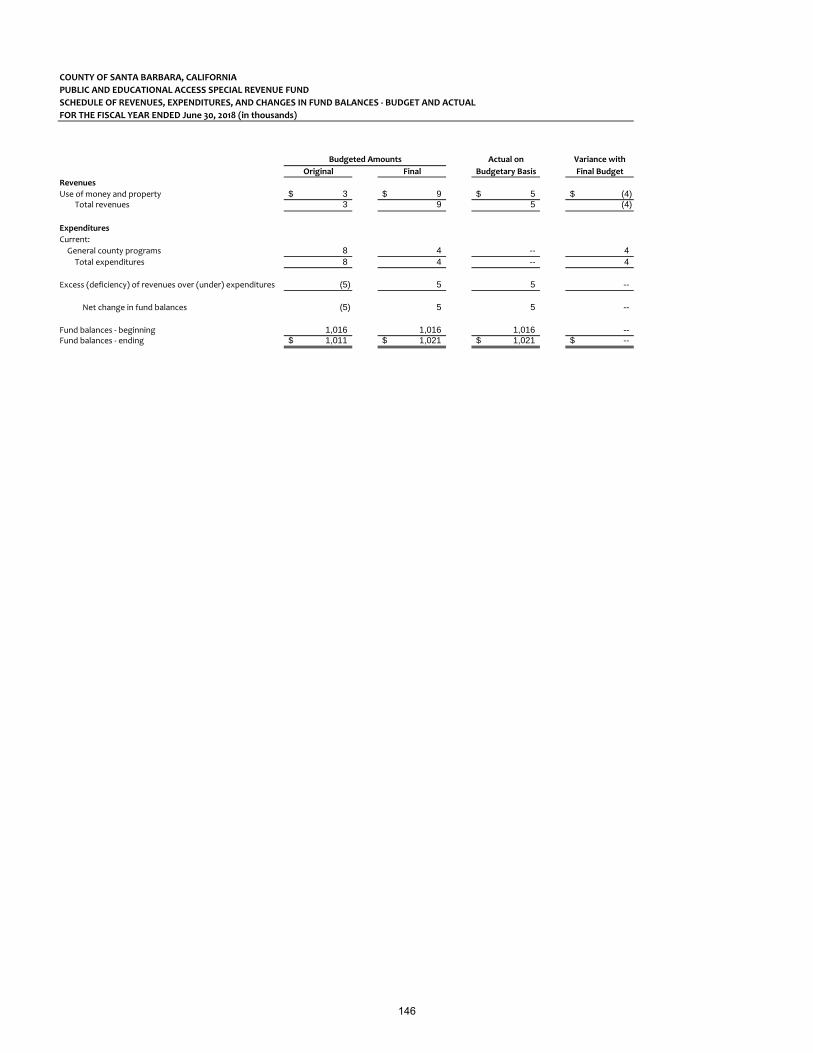
COUNTY OF SANTA BARBARA, CALIFORNIA
PUBLIC AND EDUCATIONAL ACCESS SPECIAL REVENUE FUND
SCHEDULE OF REVENUES, EXPENDITURES, AND CHANGES IN FUND BALANCES ‐ BUDGET AND ACTUAL
FOR THE FISCAL YEAR ENDED June 30, 2018 (in thousands)
Actual on Variance with
Original Final Budgetary Basis Final Budget
Revenues
Use of money and property 3$ 9$ 5$ (4)$ Total revenues 3 9 5 (4)
Expenditures
Current:
General county programs 8 4 -- 4 Total expenditures 8 4 -- 4
Excess (deficiency) of revenues over (under) expenditures (5) 5 5 --
Net change in fund balances (5) 5 5 --
Fund balances ‐ beginning 1,016 1,016 1,016 -- Fund balances ‐ ending 1,011$ 1,021$ 1,021$ --$
Budgeted Amounts
146

COUNTY OF SANTA BARBARA, CALIFORNIA
SPECIAL AVIATION SPECIAL REVENUE FUND
SCHEDULE OF REVENUES, EXPENDITURES, AND CHANGES IN FUND BALANCES ‐ BUDGET AND ACTUAL
FOR THE FISCAL YEAR ENDED June 30, 2018 (in thousands)
Actual on Variance with
Original Final Budgetary Basis Final Budget
Revenues
Use of money and property --$ --$ 1$ 1$ Intergovernmental 1,153 2,405 2,209 (196)
Total revenues 1,153 2,405 2,210 (195)
Expenditures
Current:
General government & support services 1,220 2,618 2,347 271 Total expenditures 1,220 2,618 2,347 271
Deficiency of revenues under expenditures (67) (213) (137) 76
Net change in fund balances (67) (213) (137) 76
Fund balances ‐ beginning 305 305 305 -- Fund balances ‐ ending 238$ 92$ 168$ 76$
Budgeted Amounts
147

COUNTY OF SANTA BARBARA, CALIFORNIA
IN‐HOME SUPPORTIVE SERVICES (IHSS) PUBLIC AUTHORITY SPECIAL REVENUE FUND
SCHEDULE OF REVENUES, EXPENDITURES, AND CHANGES IN FUND BALANCES ‐ BUDGET AND ACTUAL
FOR THE FISCAL YEAR ENDED June 30, 2018 (in thousands)
Actual on Variance with
Original Final Budgetary Basis Final Budget
Revenues
Use of money and property --$ --$ (4)$ (4)$ Intergovernmental 6,322 6,648 7,252 604
Total revenues 6,322 6,648 7,248 600
Expenditures
Current:
Health & public assistance 8,286 8,613 8,561 52 Total expenditures 8,286 8,613 8,561 52
Deficiency of revenues under expenditures (1,964) (1,965) (1,313) 652
Other financing sources
Transfers in 1,201 1,201 1,201 -- Total other financing sources 1,201 1,201 1,201 --
Net change in fund balances (763) (764) (112) 652
Fund balances ‐ beginning 774 774 774 -- Fund balances ‐ ending 11$ 10$ 662$ 652$
Budgeted Amounts
148

COUNTY OF SANTA BARBARA, CALIFORNIA
CHILD SUPPORT SERVICES SPECIAL REVENUE FUND
SCHEDULE OF REVENUES, EXPENDITURES, AND CHANGES IN FUND BALANCES ‐ BUDGET AND ACTUAL
FOR THE FISCAL YEAR ENDED June 30, 2018 (in thousands)
Actual on Variance with
Original Final Budgetary Basis Final Budget
Revenues
Use of money and property 3$ 3$ 9$ 6$ Intergovernmental 9,531 9,825 9,806 (19) Charges for services -- -- 32 32 Other -- -- 8 8
Total revenues 9,534 9,828 9,855 27
Expenditures
Current:
Health & public assistance 9,584 9,540 9,451 89 Total expenditures 9,584 9,540 9,451 89
Excess (deficiency) of revenues over (under) expenditures (50) 288 404 116
Other financing sources (uses)
Transfers in 50 66 66 -- Transfers out -- (450) (423) 27
Total other financing sources (uses) 50 (384) (357) 27
Net change in fund balances -- (96) 47 143
Fund balances ‐ beginning 422 422 422 -- Fund balances ‐ ending 422$ 326$ 469$ 143$
Budgeted Amounts
149

COUNTY OF SANTA BARBARA, CALIFORNIA
FISHERMEN ASSISTANCE SPECIAL REVENUE FUND
SCHEDULE OF REVENUES, EXPENDITURES, AND CHANGES IN FUND BALANCES ‐ BUDGET AND ACTUAL
FOR THE FISCAL YEAR ENDED June 30, 2018 (in thousands)
Actual on Variance with
Original Final Budgetary Basis Final Budget
Revenues
Use of money and property 2$ 2$ 2$ --$ Other 10 10 11 1
Total revenues 12 12 13 1
Expenditures
Current:
Community resources & public facilities 30 30 14 16 Total expenditures 30 30 14 16
Deficiency of revenues under expenditures (18) (18) (1) 17
Net change in fund balances (18) (18) (1) 17
Fund balances ‐ beginning 417 417 417 -- Fund balances ‐ ending 399$ 399$ 416$ 17$
Budgeted Amounts
150

COUNTY OF SANTA BARBARA, CALIFORNIA
COASTAL RESOURCES ENHANCEMENT SPECIAL REVENUE FUND
SCHEDULE OF REVENUES, EXPENDITURES, AND CHANGES IN FUND BALANCES ‐ BUDGET AND ACTUAL
FOR THE FISCAL YEAR ENDED June 30, 2018 (in thousands)
Actual on Variance with
Original Final Budgetary Basis Final Budget
Revenues
Use of money and property 5$ 5$ 10$ 5$ Other 415 415 449 34
Total revenues 420 420 459 39
Expenditures
Current:
Community resources & public facilities 868 688 67 621 Total expenditures 868 688 67 621
Excess (deficiency) of revenues over (under) expenditures (448) (268) 392 660
Net change in fund balances (448) (268) 392 660
Fund balances ‐ beginning 1,623 1,623 1,623 -- Fund balances ‐ ending 1,175$ 1,355$ 2,015$ 660$
Budgeted Amounts
151
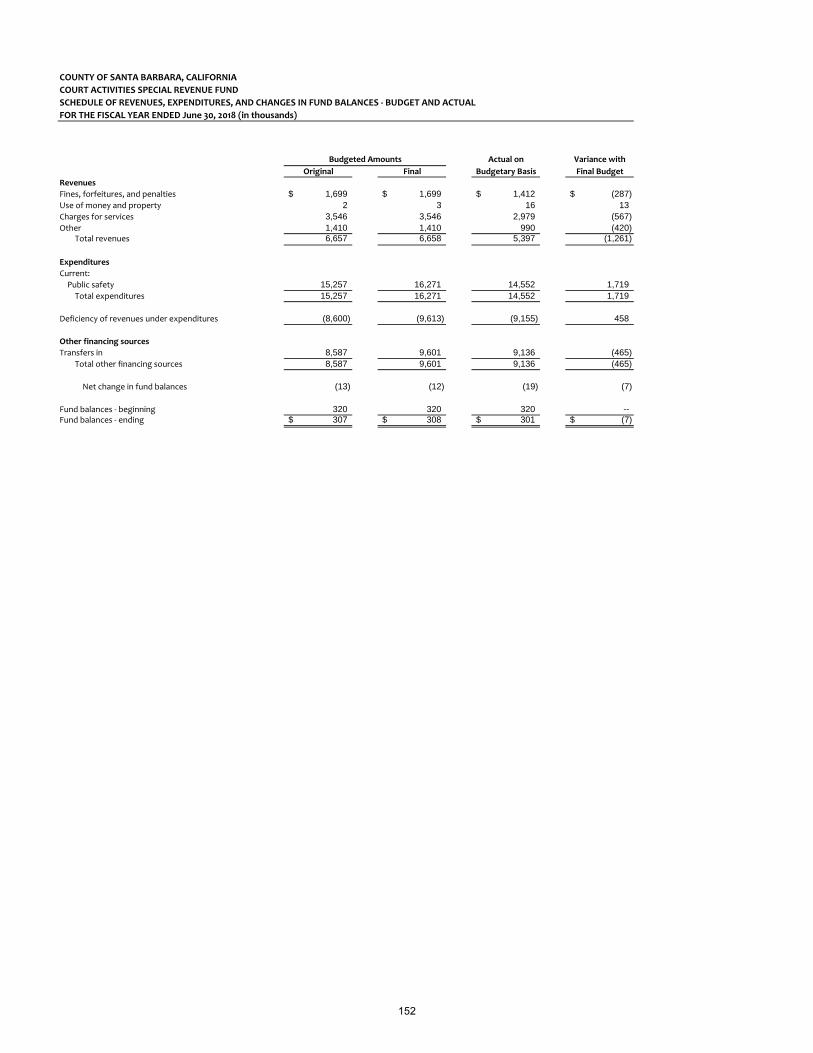
COUNTY OF SANTA BARBARA, CALIFORNIA
COURT ACTIVITIES SPECIAL REVENUE FUND
SCHEDULE OF REVENUES, EXPENDITURES, AND CHANGES IN FUND BALANCES ‐ BUDGET AND ACTUAL
FOR THE FISCAL YEAR ENDED June 30, 2018 (in thousands)
Actual on Variance with
Original Final Budgetary Basis Final Budget
Revenues
Fines, forfeitures, and penalties 1,699$ 1,699$ 1,412$ (287)$ Use of money and property 2 3 16 13 Charges for services 3,546 3,546 2,979 (567) Other 1,410 1,410 990 (420)
Total revenues 6,657 6,658 5,397 (1,261)
Expenditures
Current:
Public safety 15,257 16,271 14,552 1,719 Total expenditures 15,257 16,271 14,552 1,719
Deficiency of revenues under expenditures (8,600) (9,613) (9,155) 458
Other financing sources
Transfers in 8,587 9,601 9,136 (465) Total other financing sources 8,587 9,601 9,136 (465)
Net change in fund balances (13) (12) (19) (7)
Fund balances ‐ beginning 320 320 320 -- Fund balances ‐ ending 307$ 308$ 301$ (7)$
Budgeted Amounts
152

COUNTY OF SANTA BARBARA, CALIFORNIA
CRIMINAL JUSTICE CONSTRUCTION SPECIAL REVENUE FUND
SCHEDULE OF REVENUES, EXPENDITURES, AND CHANGES IN FUND BALANCES ‐ BUDGET AND ACTUAL
FOR THE FISCAL YEAR ENDED June 30, 2018 (in thousands)
Actual on Variance with
Original Final Budgetary Basis Final Budget
Revenues
Fines, forfeitures, and penalties 850$ 850$ 680$ (170)$ Use of money and property -- -- (8) (8)
Total revenues 850 850 672 (178)
Expenditures
Total expenditures -- -- -- --
Excess of revenues over expenditures 850 850 672 (178)
Other financing sources (uses)
Transfers in 169 346 346 -- Transfers out (1,019) (1,019) (1,018) 1
Total other financing uses, net (850) (673) (672) 1
Net change in fund balances -- 177 -- (177)
Fund balances ‐ beginning -- -- -- -- Fund balances ‐ ending --$ 177$ --$ (177)$
Budgeted Amounts
153
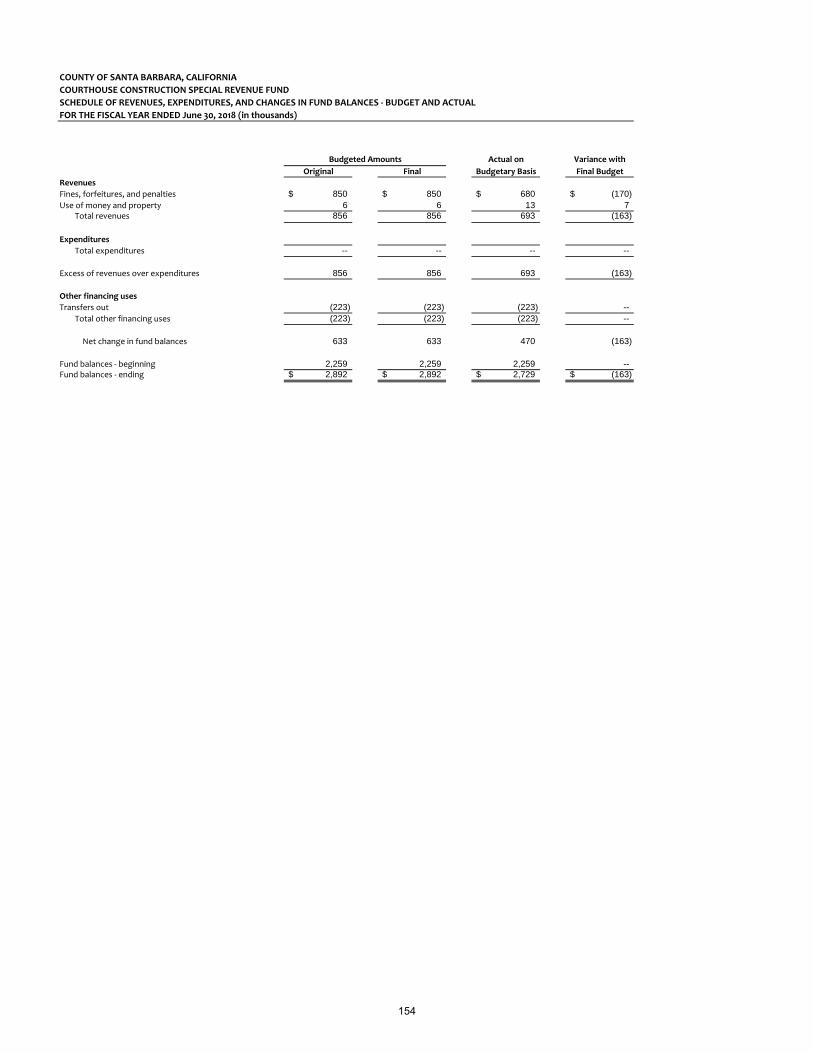
COUNTY OF SANTA BARBARA, CALIFORNIA
COURTHOUSE CONSTRUCTION SPECIAL REVENUE FUND
SCHEDULE OF REVENUES, EXPENDITURES, AND CHANGES IN FUND BALANCES ‐ BUDGET AND ACTUAL
FOR THE FISCAL YEAR ENDED June 30, 2018 (in thousands)
Actual on Variance with
Original Final Budgetary Basis Final Budget
Revenues
Fines, forfeitures, and penalties 850$ 850$ 680$ (170)$ Use of money and property 6 6 13 7
Total revenues 856 856 693 (163)
Expenditures
Total expenditures -- -- -- --
Excess of revenues over expenditures 856 856 693 (163)
Other financing uses
Transfers out (223) (223) (223) -- Total other financing uses (223) (223) (223) --
Net change in fund balances 633 633 470 (163)
Fund balances ‐ beginning 2,259 2,259 2,259 -- Fund balances ‐ ending 2,892$ 2,892$ 2,729$ (163)$
Budgeted Amounts
154

COUNTY OF SANTA BARBARA, CALIFORNIA
INMATE WELFARE SPECIAL REVENUE FUND
SCHEDULE OF REVENUES, EXPENDITURES, AND CHANGES IN FUND BALANCES ‐ BUDGET AND ACTUAL
FOR THE FISCAL YEAR ENDED June 30, 2018 (in thousands)
Actual on Variance with
Original Final Budgetary Basis Final Budget
Revenues
Use of money and property 528$ 528$ 500$ (28)$ Other 1,290 1,290 1,132 (158)
Total revenues 1,818 1,818 1,632 (186)
Expenditures
Current:
Public safety 1,909 1,917 1,471 446 Total expenditures 1,909 1,917 1,471 446
Excess (deficiency) of revenues over (under) expenditures (91) (99) 161 260
Other financing sources
Proceeds from sale of capital assets -- 1 -- (1) Total other financing sources -- 1 -- (1)
Net change in fund balances (91) (98) 161 259
Fund balances ‐ beginning 2,036 2,036 2,036 -- Fund balances ‐ ending 1,945$ 1,938$ 2,197$ 259$
Budgeted Amounts
155

COUNTY OF SANTA BARBARA, CALIFORNIA
COUNTY SERVICE AREAS SPECIAL REVENUE FUND
SCHEDULE OF REVENUES, EXPENDITURES, AND CHANGES IN FUND BALANCES ‐ BUDGET AND ACTUAL
FOR THE FISCAL YEAR ENDED June 30, 2018 (in thousands)
Actual on Variance with
Original Final Budgetary Basis Final Budget
Revenues
Taxes 1,405$ 1,405$ 1,455$ 50$ Fines, forfeitures, and penalties -- -- 8 8 Use of money and property 13 13 26 13 Intergovernmental 6 6 6 -- Charges for services 513 513 513 --
Total revenues 1,937 1,937 2,008 71
Expenditures
Current:
Community resources & public facilities 1,006 981 755 226 Total expenditures 1,006 981 755 226
Excess of revenues over expenditures 931 956 1,253 297
Other financing uses
Transfers out (741) (1,665) (1,053) 612 Total other financing uses (741) (1,665) (1,053) 612
Net change in fund balances 190 (709) 200 909
Fund balances ‐ beginning 3,659 3,659 3,659 -- Fund balances ‐ ending 3,849$ 2,950$ 3,859$ 909$
Budgeted Amounts
156

COUNTY OF SANTA BARBARA, CALIFORNIA
COMMUNITY FACILITIES DISTRICTS SPECIAL REVENUE FUND
SCHEDULE OF REVENUES, EXPENDITURES, AND CHANGES IN FUND BALANCES ‐ BUDGET AND ACTUAL
FOR THE FISCAL YEAR ENDED June 30, 2018 (in thousands)
Actual on Variance with
Original Final Budgetary Basis Final Budget
Revenues
Taxes 560$ 635$ 635$ --$ Use of money and property 2 2 4 2
Total revenues 562 637 639 2
Expenditures
Current:
Community resources & public facilities 205 205 192 13 Total expenditures 205 205 192 13
Excess of revenues over expenditures 357 432 447 15
Other financing uses
Transfers out (377) (377) (372) 5 Total other financing uses (377) (377) (372) 5
Net change in fund balances (20) 55 75 20
Fund balances ‐ beginning 672 672 672 -- Fund balances ‐ ending 652$ 727$ 747$ 20$
Budgeted Amounts
157

COUNTY OF SANTA BARBARA, CALIFORNIA
LIGHTING DISTRICTS SPECIAL REVENUE FUND
SCHEDULE OF REVENUES, EXPENDITURES, AND CHANGES IN FUND BALANCES ‐ BUDGET AND ACTUAL
FOR THE FISCAL YEAR ENDED June 30, 2018 (in thousands)
Actual on Variance with
Original Final Budgetary Basis Final Budget
Revenues
Taxes 492$ 492$ 517$ 25$ Fines, forfeitures, and penalties -- -- 5 5 Use of money and property 2 2 3 1 Intergovernmental 2 2 2 -- Other -- -- 19 19
Total revenues 496 496 546 50
Expenditures
Current:
Community resources & public facilities 530 562 537 25 Total expenditures 530 562 537 25
Excess (deficiency) of revenues over (under) expenditures (34) (66) 9 75
Net change in fund balances (34) (66) 9 75
Fund balances ‐ beginning 393 393 393 -- Fund balances ‐ ending 359$ 327$ 402$ 75$
Budgeted Amounts
158
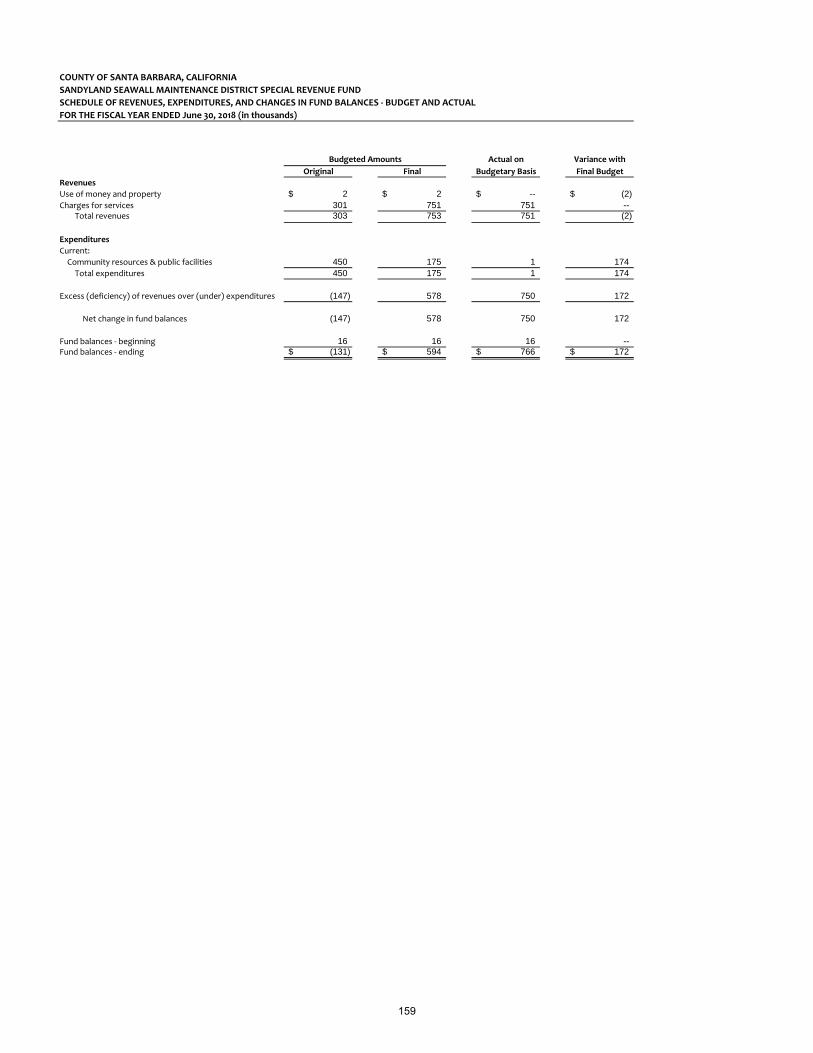
COUNTY OF SANTA BARBARA, CALIFORNIA
SANDYLAND SEAWALL MAINTENANCE DISTRICT SPECIAL REVENUE FUND
SCHEDULE OF REVENUES, EXPENDITURES, AND CHANGES IN FUND BALANCES ‐ BUDGET AND ACTUAL
FOR THE FISCAL YEAR ENDED June 30, 2018 (in thousands)
Actual on Variance with
Original Final Budgetary Basis Final Budget
Revenues
Use of money and property 2$ 2$ --$ (2)$ Charges for services 301 751 751 --
Total revenues 303 753 751 (2)
Expenditures
Current:
Community resources & public facilities 450 175 1 174 Total expenditures 450 175 1 174
Excess (deficiency) of revenues over (under) expenditures (147) 578 750 172
Net change in fund balances (147) 578 750 172
Fund balances ‐ beginning 16 16 16 -- Fund balances ‐ ending (131)$ 594$ 766$ 172$
Budgeted Amounts
159
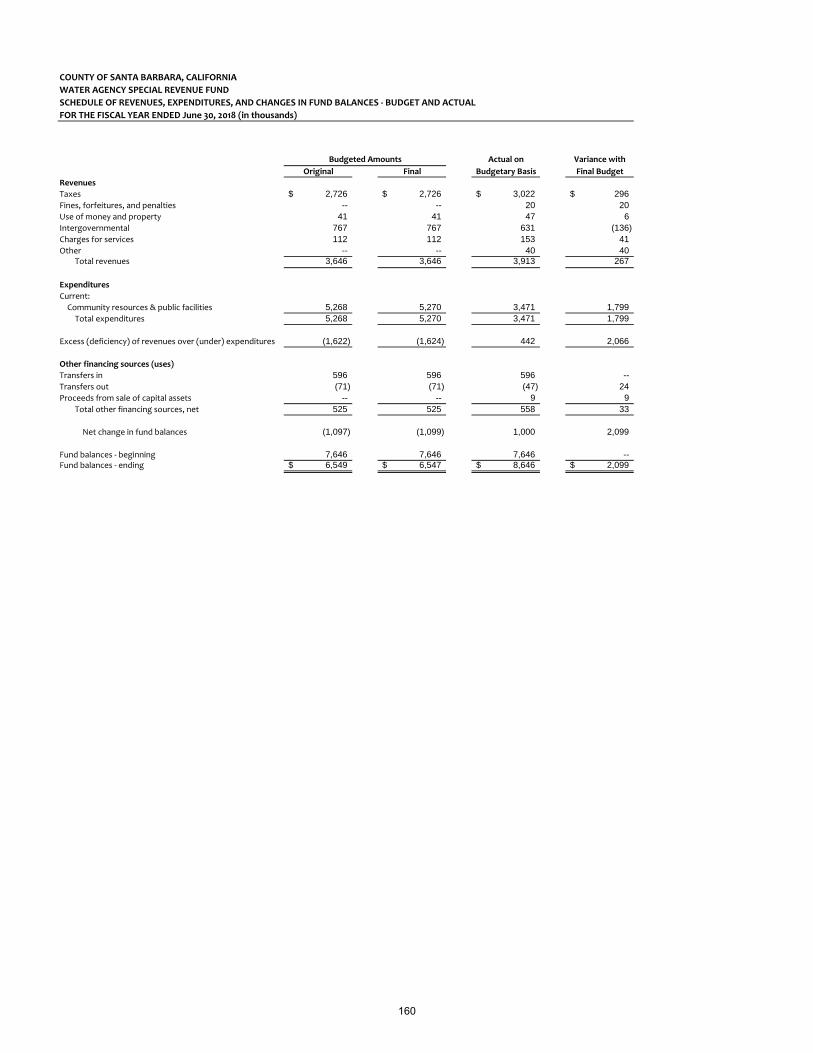
COUNTY OF SANTA BARBARA, CALIFORNIA
WATER AGENCY SPECIAL REVENUE FUND
SCHEDULE OF REVENUES, EXPENDITURES, AND CHANGES IN FUND BALANCES ‐ BUDGET AND ACTUAL
FOR THE FISCAL YEAR ENDED June 30, 2018 (in thousands)
Actual on Variance with
Original Final Budgetary Basis Final Budget
Revenues
Taxes 2,726$ 2,726$ 3,022$ 296$ Fines, forfeitures, and penalties -- -- 20 20 Use of money and property 41 41 47 6 Intergovernmental 767 767 631 (136) Charges for services 112 112 153 41 Other -- -- 40 40
Total revenues 3,646 3,646 3,913 267
Expenditures
Current:
Community resources & public facilities 5,268 5,270 3,471 1,799 Total expenditures 5,268 5,270 3,471 1,799
Excess (deficiency) of revenues over (under) expenditures (1,622) (1,624) 442 2,066
Other financing sources (uses)
Transfers in 596 596 596 -- Transfers out (71) (71) (47) 24 Proceeds from sale of capital assets -- -- 9 9
Total other financing sources, net 525 525 558 33
Net change in fund balances (1,097) (1,099) 1,000 2,099
Fund balances ‐ beginning 7,646 7,646 7,646 -- Fund balances ‐ ending 6,549$ 6,547$ 8,646$ 2,099$
Budgeted Amounts
160
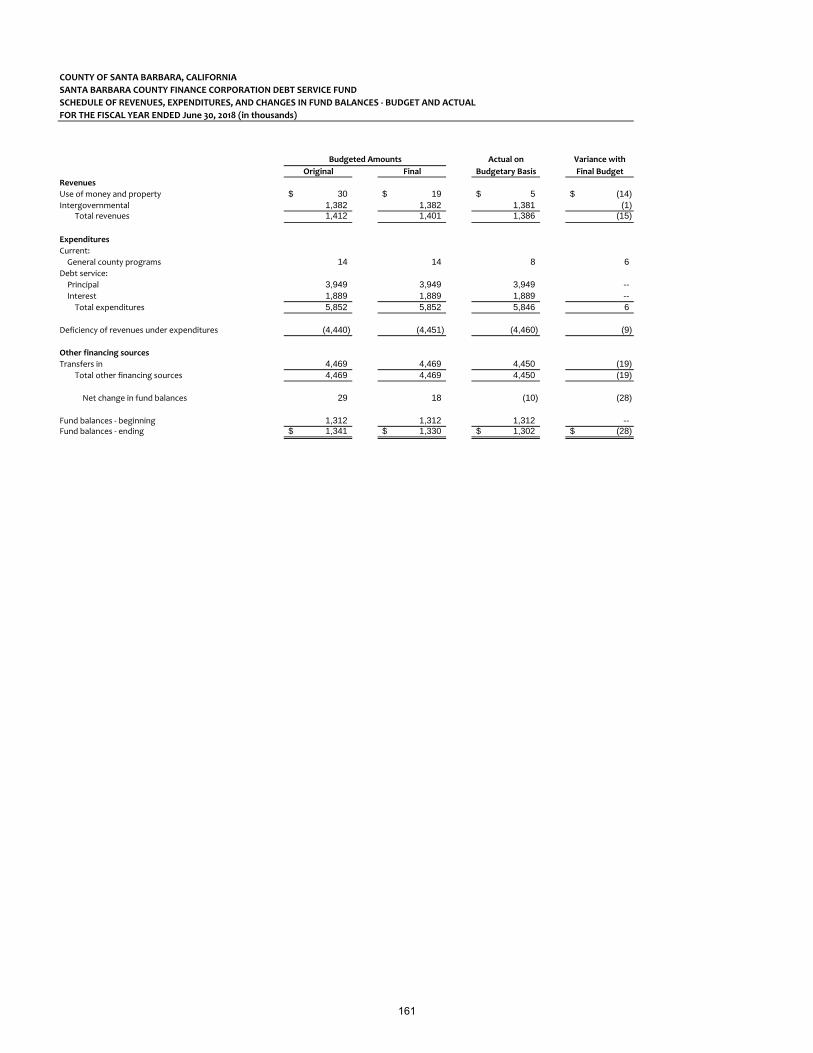
COUNTY OF SANTA BARBARA, CALIFORNIA
SANTA BARBARA COUNTY FINANCE CORPORATION DEBT SERVICE FUND
SCHEDULE OF REVENUES, EXPENDITURES, AND CHANGES IN FUND BALANCES ‐ BUDGET AND ACTUAL
FOR THE FISCAL YEAR ENDED June 30, 2018 (in thousands)
Actual on Variance with
Original Final Budgetary Basis Final Budget
Revenues
Use of money and property 30$ 19$ 5$ (14)$ Intergovernmental 1,382 1,382 1,381 (1)
Total revenues 1,412 1,401 1,386 (15)
Expenditures
Current:
General county programs 14 14 8 6 Debt service:
Principal 3,949 3,949 3,949 -- Interest 1,889 1,889 1,889 -- Total expenditures 5,852 5,852 5,846 6
Deficiency of revenues under expenditures (4,440) (4,451) (4,460) (9)
Other financing sources
Transfers in 4,469 4,469 4,450 (19) Total other financing sources 4,469 4,469 4,450 (19)
Net change in fund balances 29 18 (10) (28)
Fund balances ‐ beginning 1,312 1,312 1,312 -- Fund balances ‐ ending 1,341$ 1,330$ 1,302$ (28)$
Budgeted Amounts
161

162
Internal Service Funds
163

COUNTY OF SANTA BARBARA | COMPREHENSIVE ANNUAL FINANCIAL REPORT FISCAL YEAR ENDED JUNE 30, 2018
INTERNAL SERVICE FUNDS
Internal Service Funds Internal Service Funds are established to account for services furnished to the County and various other governmental agencies. They are exempt from legal compliance for budgetary control and follow commercial accounting principles for a determination of operating, rather than budgetary, results. Their major source of revenue consists of charges to user departments for services rendered. These charges are based upon standard rates calculated on an estimated cost recovery basis. A more detailed description of the funds established and used by the County follows:
Information Technology Services This fund provides enterprise information technology services to County departments and various other governmental agencies. Four lines of service are supported: Network and Security, Infrastructure, Desktop Support, and Enterprise Applications. Costs are allocated to all users based upon utilization factors for each service and are designed to recover costs of each system. Profits or losses are carried forward and used to adjust allocations in subsequent years. Costs of operating the fund include personnel, supplies, utilities, maintenance, and depreciation of equipment.
Vehicle Operations and Maintenance This fund provides for the maintenance, servicing and repair of County vehicles. Rental rates, which include the cost of gas, oil, maintenance, replacement of equipment and personnel costs, are charged to the user department to support the vehicle program. Vehicles are replaced based on mileage and age criteria which varies per class of vehicle; new additions to the vehicle fleet are provided through the Garage Equipment and Motor Pool budgets of the General Fund and through contributions from other funds.
Risk Management and Insurance This column combines the County's five self-insurance funds: Dental, Unemployment, Workers' Compensation, General Liability, and Medical Malpractice.
Dental Self-Insurance This fund provides for the payment of dental expenses incurred by County employees, eligible dependents and retirees who are part of the self-funded plan. This fund does not account for employees or retirees on the Dental Net, Prudential or Firefighter health plans. Professional administrators process all claims and make payments to claimants based on a payment schedule of medical and dental benefits. The fund reimburses the claims administrator for the payment of claims plus a fee for administration and participation in a prescription drug program. Additionally, the County contracts with a preferred provider organization for reduced fees from member dental service providers, physicians, and other specialists. The County contributes towards the cost of employee coverage through departmental budgets; the employee pays any remaining employee or dependent coverage.
Unemployment Self-Insurance State law requires the County to maintain unemployment insurance. The County has elected to be self-insured and has established this fund for the payment of unemployment insurance claims by County employees, which have been processed and approved by the State Employment Development Department. Each department has been charged a percentage of its gross payroll for the establishment of a general reserve for this program and to provide for claim payments.
Workers’ Compensation Self-Insurance This fund provides for investigation services, temporary disability and medical payments, excess insurance, permanent disability awards, administrative services, litigation costs, and safety services. Premiums based on employee worker classifications are charged to each department to maintain actuarially recommended reserves for claims proportionate to current industry rates applicable to job functions.
General Liability Self-Insurance This fund provides for payment of self-insured general liability and automobile liability claims, excess insurance, claims adjusting services, litigation costs, and administrative services. Contributions are made by participating County departments and funds based on past claims experience and appropriate risk factors.
164

COUNTY OF SANTA BARBARA | COMPREHENSIVE ANNUAL FINANCIAL REPORT FISCAL YEAR ENDED JUNE 30, 2018
INTERNAL SERVICE FUNDS
Medical Malpractice Self-Insurance This fund provides for the payment of self-insured medical malpractice and general liability claims, excess insurance, claim investigation services, and litigation costs. Contributions are made by covered participating County departments and are based on allocation of expenses by past claims experience and appropriate risk factor.
Communications Services This fund provides communication services to County departments and various other governmental agencies. Telephone, Radio and Audio-Visual Systems are maintained. Costs are billed from a standard price schedule which is periodically adjusted to reflect cost changes and are designed to recover costs of each system. Profits or losses are carried forward and used to adjust allocations in subsequent years. Costs of operating the fund include personnel, supplies, utilities, maintenance, and depreciation of equipment.
Utilities This fund provides for payment of County-wide utility costs. Utility costs are allocated to various County departments based on their energy consumption. Charging County departments for their energy usage fosters awareness and accountability related to energy costs and savings.
165

COUNTY OF SANTA BARBARA, CALIFORNIA
INTERNAL SERVICE FUNDS
COMBINING STATEMENT OF NET POSITION
June 30, 2018 (in thousands)
Vehicle Risk
Information Operations Management Communi‐
Technology and and cations
Services Maintenance Insurance Services Utilities Total
Assets
Current assets:
Cash and investments (Note 3) 6,613$ 19,111$ 22,581$ 9,069$ 1,557$ 58,931$ Accounts receivable, net:
Use of money and property 29 68 75 29 6 207 Intergovernmental 31 14 3 13 -- 61 Charges for services 2 4 36 1 14 57
Inventories -- 180 -- 110 -- 290 Total current assets 6,675 19,377 22,695 9,222 1,577 59,546
Noncurrent assets:
Other receivables -- -- 210 -- -- 210 Restricted cash and investments (Note 4) -- 10 -- -- -- 10 Capital assets, net of
accumulated depreciation/amortization (Note 6) 3,403 21,264 3 3,802 3,697 32,169 Total noncurrent assets 3,403 21,274 213 3,802 3,697 32,389 Total assets 10,078 40,651 22,908 13,024 5,274 91,935
Deferred outflows of resources
Deferred pensions 2,374 1,161 530 711 199 4,975 Deferred OPEB 106 47 23 35 11 222
Total deferred outflows of resources 2,480 1,208 553 746 210 5,197
Liabilities
Current liabilities:
Accounts payable 57 213 717 45 19 1,051 Salaries and benefits payable 157 80 36 52 13 338 Compensated absences (Note 10) 315 143 44 78 16 596 Notes payable (Note 13) -- -- -- -- 345 345 Liability for self‐insurance claims -- -- 5,972 -- -- 5,972
Total current liabilities 529 436 6,769 175 393 8,302
Noncurrent liabilities:
Compensated absences (Note 10) 10 31 63 20 22 146 Notes payable (Note 13) -- -- -- -- 2,890 2,890 Liability for self‐insurance claims -- -- 13,681 -- -- 13,681 Net pension liability (Note 22) 6,093 2,980 1,359 1,824 509 12,765 Net OPEB liability (Note 23) 1,014 449 221 337 109 2,130
Total noncurrent liabilities 7,117 3,460 15,324 2,181 3,530 31,612 Total liabilities 7,646 3,896 22,093 2,356 3,923 39,914
Deferred inflows of resources
Deferred pensions (Note 17) 411 201 92 123 34 861 Total deferred inflows of resources 411 201 92 123 34 861
Net position
Net investment in capital assets 3,403 21,264 4 3,802 463 28,936 Unrestricted 1,098 16,498 1,272 7,489 1,064 27,421
Total net position 4,501$ 37,762$ 1,276$ 11,291$ 1,527$ 56,357$
166

COUNTY OF SANTA BARBARA, CALIFORNIA
INTERNAL SERVICE FUNDS
COMBINING STATEMENT OF REVENUES, EXPENSES, AND CHANGES IN FUND NET POSITION
FOR THE FISCAL YEAR ENDED June 30, 2018 (in thousands)
Vehicle Risk
Information Operations Management Communi‐
Technology and and cations
Services Maintenance Insurance Services Utilities Total
Operating revenues
Charges for services 8,314$ 12,504$ 29,416$ 4,077$ 5,712$ 60,023$ Self‐insurance recovery -- -- 2,398 -- -- 2,398 Other operating revenues 132 69 57 16 34 308 Total operating revenues 8,446 12,573 31,871 4,093 5,746 62,729
Operating expenses
Salaries and benefits 4,399 2,073 1,049 1,453 373 9,347 Services and supplies 2,291 5,192 19,079 2,052 5,509 34,123 Self‐insurance claims -- -- 11,632 -- -- 11,632 Contractual services 16 32 214 296 23 581 Depreciation and amortization 1,298 3,690 1 667 373 6,029 County overhead allocation 242 103 (297) 84 10 142 Total operating expenses 8,246 11,090 31,678 4,552 6,288 61,854
Operating income (loss) 200 1,483 193 (459) (542) 875
Non‐operating revenues (expenses)
Use of money and property 44 92 36 172 9 353 Interest expense -- -- -- -- (139) (139) Gain on sale of capital assets -- 75 -- 4 -- 79 State and federal aid 31 14 3 13 -- 61 Other non‐operating revenues 5 10 48 18 574 655 Total non‐operating revenues (expenses) 80 191 87 207 444 1,009
Income (loss) before transfers 280 1,674 280 (252) (98) 1,884
Transfers in -- 1,384 -- 1,298 -- 2,682 Transfers out -- (59) -- -- -- (59) Total transfers in, net -- 1,325 -- 1,298 -- 2,623
Change in net position 280 2,999 280 1,046 (98) 4,507
Total net position ‐ beginning 4,306 34,728 952 10,286 450 50,722 Prior period adjustment (Note 26) (85) 35 44 (41) 1,175 1,128
Total net position ‐ beginning, as restated 4,221 34,763 996 10,245 1,625 51,850 Total net position ‐ ending 4,501$ 37,762$ 1,276$ 11,291$ 1,527$ 56,357$
167
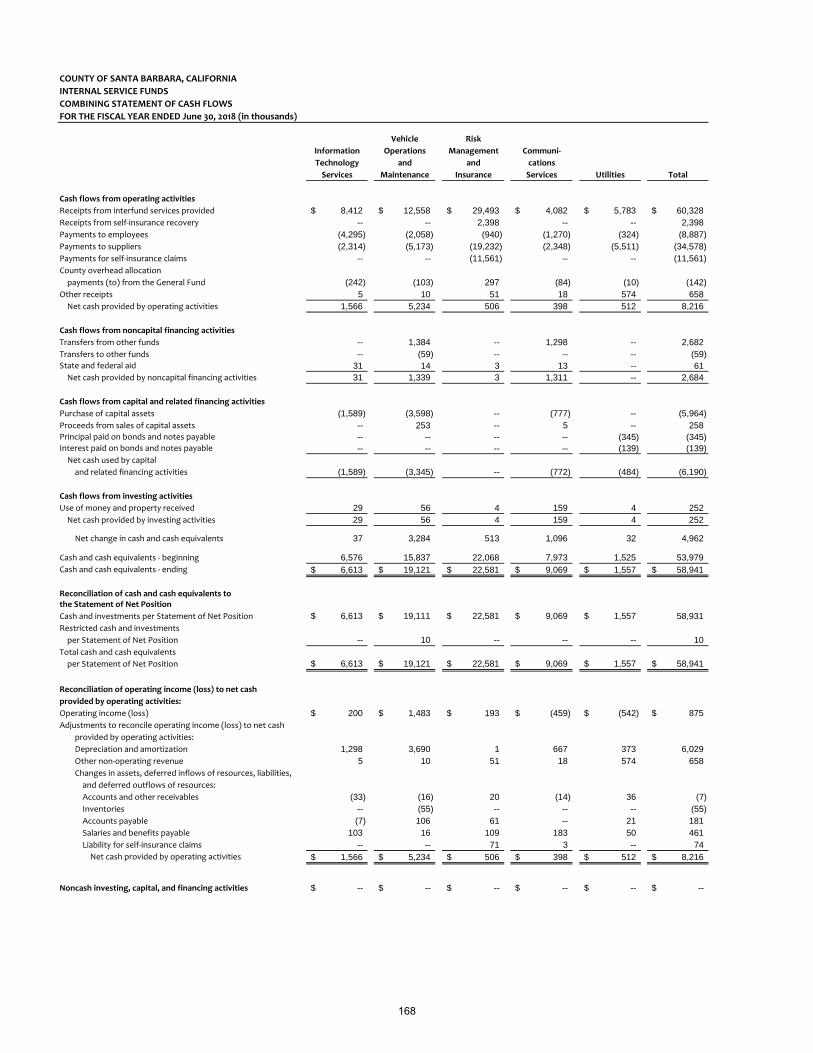
COUNTY OF SANTA BARBARA, CALIFORNIA
INTERNAL SERVICE FUNDS
COMBINING STATEMENT OF CASH FLOWS
FOR THE FISCAL YEAR ENDED June 30, 2018 (in thousands)
Vehicle Risk
Information Operations Management Communi‐
Technology and and cations
Services Maintenance Insurance Services Utilities Total
Cash flows from operating activities
Receipts from interfund services provided 8,412$ 12,558$ 29,493$ 4,082$ 5,783$ 60,328$ Receipts from self‐insurance recovery -- -- 2,398 -- -- 2,398 Payments to employees (4,295) (2,058) (940) (1,270) (324) (8,887) Payments to suppliers (2,314) (5,173) (19,232) (2,348) (5,511) (34,578) Payments for self‐insurance claims -- -- (11,561) -- -- (11,561) County overhead allocation
payments (to) from the General Fund (242) (103) 297 (84) (10) (142) Other receipts 5 10 51 18 574 658 Net cash provided by operating activities 1,566 5,234 506 398 512 8,216
Cash flows from noncapital financing activities
Transfers from other funds -- 1,384 -- 1,298 -- 2,682 Transfers to other funds -- (59) -- -- -- (59) State and federal aid 31 14 3 13 -- 61 Net cash provided by noncapital financing activities 31 1,339 3 1,311 -- 2,684
Cash flows from capital and related financing activities
Purchase of capital assets (1,589) (3,598) -- (777) -- (5,964) Proceeds from sales of capital assets -- 253 -- 5 -- 258 Principal paid on bonds and notes payable -- -- -- -- (345) (345) Interest paid on bonds and notes payable -- -- -- -- (139) (139) Net cash used by capital
and related financing activities (1,589) (3,345) -- (772) (484) (6,190)
Cash flows from investing activities
Use of money and property received 29 56 4 159 4 252 Net cash provided by investing activities 29 56 4 159 4 252
Net change in cash and cash equivalents 37 3,284 513 1,096 32 4,962
Cash and cash equivalents ‐ beginning 6,576 15,837 22,068 7,973 1,525 53,979 Cash and cash equivalents ‐ ending 6,613$ 19,121$ 22,581$ 9,069$ 1,557$ 58,941$
Reconciliation of cash and cash equivalents to the Statement of Net Position
Cash and investments per Statement of Net Position 6,613$ 19,111$ 22,581$ 9,069$ 1,557$ 58,931 Restricted cash and investments
per Statement of Net Position -- 10 -- -- -- 10 Total cash and cash equivalents
per Statement of Net Position 6,613$ 19,121$ 22,581$ 9,069$ 1,557$ 58,941$
Reconciliation of operating income (loss) to net cash
provided by operating activities:
Operating income (loss) 200$ 1,483$ 193$ (459)$ (542)$ 875$ Adjustments to reconcile operating income (loss) to net cash
provided by operating activities:
Depreciation and amortization 1,298 3,690 1 667 373 6,029 Other non‐operating revenue 5 10 51 18 574 658 Changes in assets, deferred inflows of resources, liabilities,
and deferred outflows of resources:
Accounts and other receivables (33) (16) 20 (14) 36 (7) Inventories -- (55) -- -- -- (55) Accounts payable (7) 106 61 -- 21 181 Salaries and benefits payable 103 16 109 183 50 461 Liability for self‐insurance claims -- -- 71 3 -- 74 Net cash provided by operating activities 1,566$ 5,234$ 506$ 398$ 512$ 8,216$
Noncash investing, capital, and financing activities --$ --$ --$ --$ --$ --$
168

Agency Funds
169
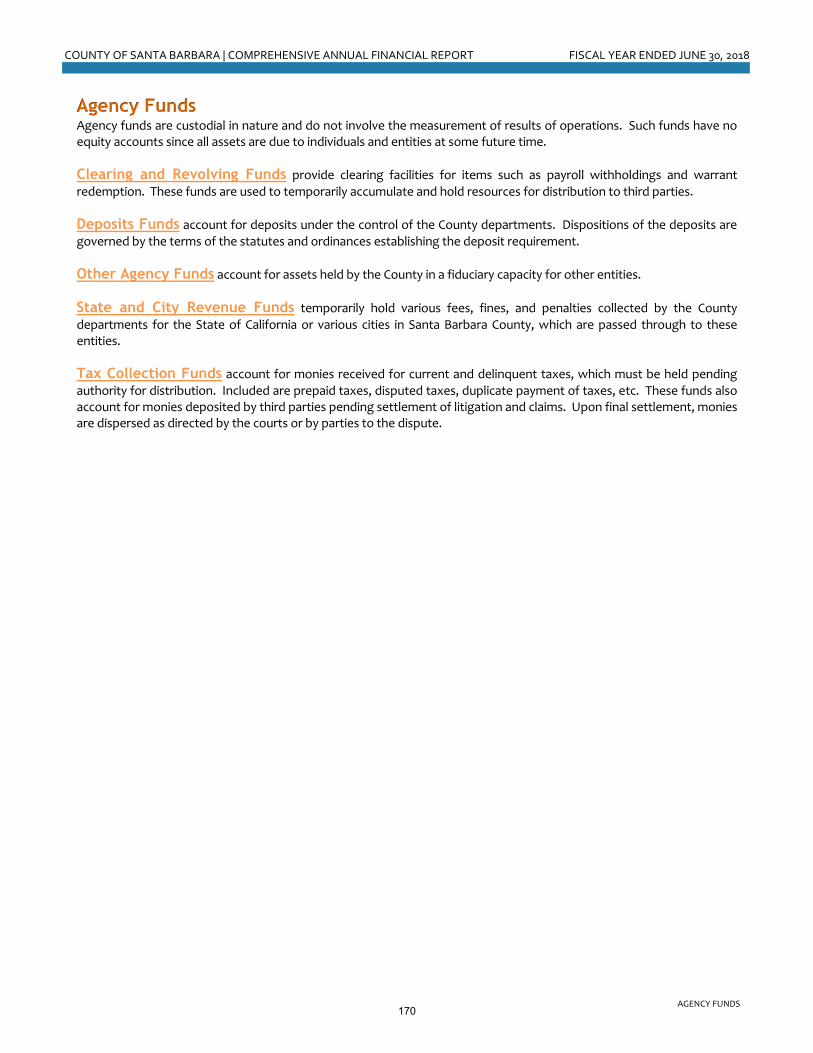
COUNTY OF SANTA BARBARA | COMPREHENSIVE ANNUAL FINANCIAL REPORT FISCAL YEAR ENDED JUNE 30, 2018
AGENCY FUNDS
Agency Funds Agency funds are custodial in nature and do not involve the measurement of results of operations. Such funds have no equity accounts since all assets are due to individuals and entities at some future time.
Clearing and Revolving Funds provide clearing facilities for items such as payroll withholdings and warrant redemption. These funds are used to temporarily accumulate and hold resources for distribution to third parties.
Deposits Funds account for deposits under the control of the County departments. Dispositions of the deposits are governed by the terms of the statutes and ordinances establishing the deposit requirement.
Other Agency Funds account for assets held by the County in a fiduciary capacity for other entities.
State and City Revenue Funds temporarily hold various fees, fines, and penalties collected by the County departments for the State of California or various cities in Santa Barbara County, which are passed through to these entities.
Tax Collection Funds account for monies received for current and delinquent taxes, which must be held pending authority for distribution. Included are prepaid taxes, disputed taxes, duplicate payment of taxes, etc. These funds also account for monies deposited by third parties pending settlement of litigation and claims. Upon final settlement, monies are dispersed as directed by the courts or by parties to the dispute.
170
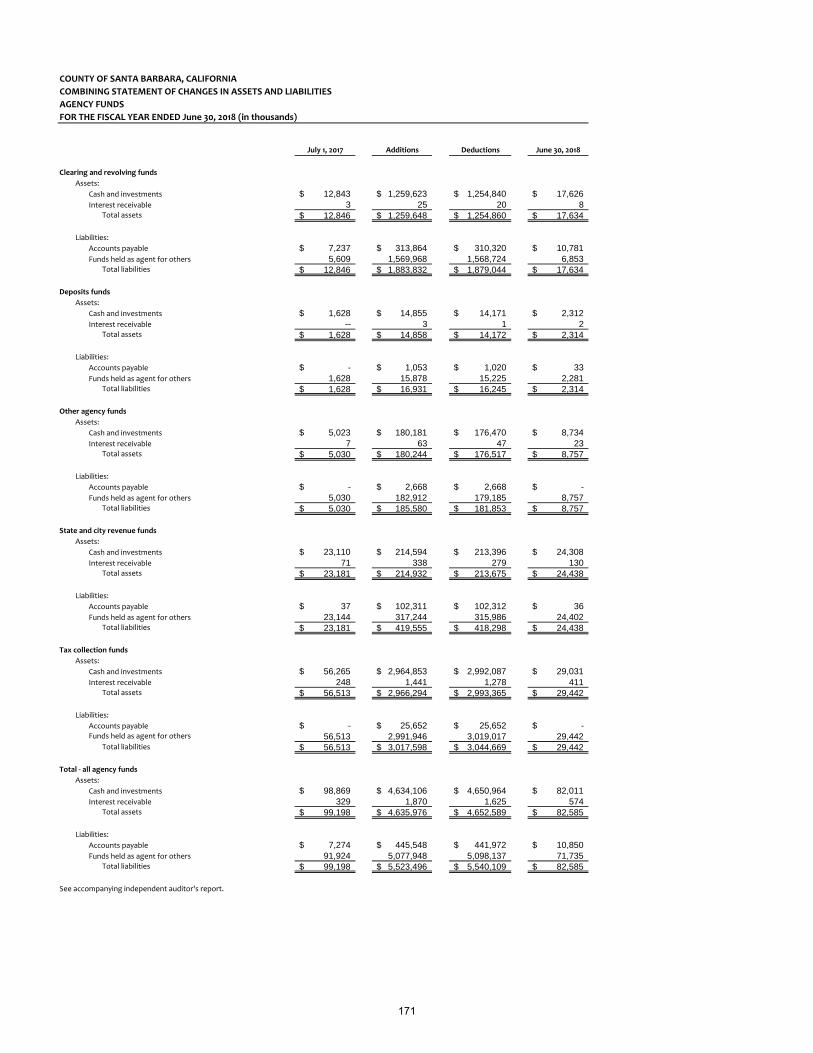
COUNTY OF SANTA BARBARA, CALIFORNIA
COMBINING STATEMENT OF CHANGES IN ASSETS AND LIABILITIES
AGENCY FUNDS
FOR THE FISCAL YEAR ENDED June 30, 2018 (in thousands)
July 1, 2017 Additions Deductions June 30, 2018
Clearing and revolving funds
Assets:
Cash and investments 12,843$ 1,259,623$ 1,254,840$ 17,626$ Interest receivable 3 25 20 8
Total assets 12,846$ 1,259,648$ 1,254,860$ 17,634$
Liabilities:
Accounts payable 7,237$ 313,864$ 310,320$ 10,781$ Funds held as agent for others 5,609 1,569,968 1,568,724 6,853
Total liabilities 12,846$ 1,883,832$ 1,879,044$ 17,634$
Deposits funds
Assets:
Cash and investments 1,628$ 14,855$ 14,171$ 2,312$ Interest receivable -- 3 1 2
Total assets 1,628$ 14,858$ 14,172$ 2,314$
Liabilities:
Accounts payable -$ 1,053$ 1,020$ 33$ Funds held as agent for others 1,628 15,878 15,225 2,281
Total liabilities 1,628$ 16,931$ 16,245$ 2,314$
Other agency funds
Assets:
Cash and investments 5,023$ 180,181$ 176,470$ 8,734$ Interest receivable 7 63 47 23
Total assets 5,030$ 180,244$ 176,517$ 8,757$
Liabilities:
Accounts payable -$ 2,668$ 2,668$ -$ Funds held as agent for others 5,030 182,912 179,185 8,757
Total liabilities 5,030$ 185,580$ 181,853$ 8,757$
State and city revenue funds
Assets:
Cash and investments 23,110$ 214,594$ 213,396$ 24,308$ Interest receivable 71 338 279 130
Total assets 23,181$ 214,932$ 213,675$ 24,438$
Liabilities:
Accounts payable 37$ 102,311$ 102,312$ 36$ Funds held as agent for others 23,144 317,244 315,986 24,402
Total liabilities 23,181$ 419,555$ 418,298$ 24,438$
Tax collection funds
Assets:
Cash and investments 56,265$ 2,964,853$ 2,992,087$ 29,031$ Interest receivable 248 1,441 1,278 411
Total assets 56,513$ 2,966,294$ 2,993,365$ 29,442$
Liabilities:
Accounts payable -$ 25,652$ 25,652$ -$ Funds held as agent for others 56,513 2,991,946 3,019,017 29,442
Total liabilities 56,513$ 3,017,598$ 3,044,669$ 29,442$
Total ‐ all agency funds
Assets:
Cash and investments 98,869$ 4,634,106$ 4,650,964$ 82,011$ Interest receivable 329 1,870 1,625 574
Total assets 99,198$ 4,635,976$ 4,652,589$ 82,585$
Liabilities:
Accounts payable 7,274$ 445,548$ 441,972$ 10,850$ Funds held as agent for others 91,924 5,077,948 5,098,137 71,735
Total liabilities 99,198$ 5,523,496$ 5,540,109$ 82,585$
See accompanying independent auditor's report.
171

172

Sta
tistical S
ectio
n
Statistical Section


COUNTY OF SANTA BARBARA | COMPREHENSIVE ANNUAL FINANCIAL REPORT FISCAL YEAR ENDED JUNE 30, 2018
STATISTICAL SECTION ‐ TABLE OF CONTENTS
The information in this section is not covered by the Independent Auditor’s Report, but is presented as supplemental data for the benefit of the readers of the Comprehensive Annual Financial Report. The objectives of statistical section information are to provide financial statement users with additional historical perspective, context, and detail to assist in using the information in the financial statements, notes to financial statements, and required supplementary information to understand and assess the County’s economic condition.
Table of Contents – Statistical Section Page
Financial Trends 174
These schedules contain trend information to help the reader understand how the County’s financial performance and well‐being have changed over time.
Revenue Capacity 178
These schedules contain trend information to help the reader assess the County’s most significant local revenue source, the property tax.
Debt Capacity 182
These schedules present information to help the reader assess the affordability of the County’s current levels of outstanding debt and the County’s ability to issue additional debt in the future.
Demographic and Economic Information 185
These schedules offer demographic and economic indicators to help the reader understand the socioeconomic environment within which the County’s financial activities take place.
Operating Information 187
These schedules contain service and infrastructure data to help the reader understand how the information in the County’s financial report relates to the services the County provides and the activities it performs.
Sources: Unless otherwise noted, the information in these schedules is derived from the Comprehensive Annual Financial Reports for the relevant year.
173

COUNTY OF SANTA BARBARA, CALIFORNIANET POSITION BY CATEGORY (UNAUDITED)LAST TEN FISCAL YEARS (in thousands)(accrual basis of accounting)
2008‐09 2009‐10 2010‐11 2011‐12 2012‐13 2013‐14 2014‐15 2015‐16 2016‐17 2017‐18
Governmental activities
Net investment in capital assets 451,648$ 466,916$ 480,240$ 493,753$ 511,144$ 578,314$ 588,989$ 612,548$ 648,420$ 692,549$ Restricted for:
Policy & executive -- -- -- -- -- -- -- -- 436 716 Public safety 9,137 12,189 9,717 14,438 19,594 24,107 28,640 38,927 49,093 54,810 Health & public assistance 25,118 32,943 42,328 33,627 33,734 31,005 37,477 35,910 36,411 36,848 Community resources & public facilities 95,946 101,591 106,691 95,892 97,710 103,497 152,739 149,668 154,523 154,848 General government & support services 7,594 5,483 4,523 5,240 3,886 4,951 4,960 5,242 5,804 5,447 General county programs 9,150 15,009 15,271 15,957 14,959 15,596 12,736 16,232 18,352 18,373 Debt service -- -- -- -- -- -- -- -- -- --
Unrestricted 54,439 32,215 16,708 37,170 30,976 62,497 (551,588) (529,641) (532,968) (562,947) Total governmental activities net position 653,032$ 666,346$ 675,478$ 696,077$ 712,003$ 819,967$ 273,953$ 328,886$ 380,071$ 400,644$
Business‐type activities
Net investment in capital assets 57,338$ 59,750$ 60,029$ 64,943$ 65,806$ 70,562$ 73,988$ 78,188$ 80,852$ 83,764$ Restricted for:
Debt service -- -- -- -- -- -- -- -- -- -- Unrestricted 9,560 10,851 12,353 16,606 21,648 25,191 14,062 19,888 21,326 34,638
Total business‐type activities net position 66,898$ 70,601$ 72,382$ 81,549$ 87,454$ 95,753$ 88,050$ 98,076$ 102,178$ 118,402$
Primary government
Net investment in capital assets 508,986$ 526,666$ 540,269$ 558,696$ 576,950$ 648,876$ 662,977$ 690,736$ 729,272$ 776,313$ Restricted for:
Policy & executive -- -- -- -- -- -- -- -- 436 716 Public safety 9,137 12,189 9,717 14,438 19,594 24,107 28,640 38,927 49,093 54,810 Health & public assistance 25,118 32,943 42,328 33,627 33,734 31,005 37,477 35,910 36,411 36,848 Community resources & public facilities 95,946 101,591 106,691 95,892 97,710 103,497 152,739 149,668 154,523 154,848 General government & support services 7,594 5,483 4,523 5,240 3,886 4,951 4,960 5,242 5,804 5,447 General county programs 9,150 15,009 15,271 15,957 14,959 15,596 12,736 16,232 18,352 18,373 Debt service -- -- -- -- -- -- -- -- -- --
Unrestricted 63,999 43,066 29,061 53,776 52,624 87,688 (537,526) (509,753) (511,642) (528,309) Total primary government net position 719,930$ 736,947$ 747,860$ 777,626$ 799,457$ 915,720$ 362,003$ 426,962$ 482,249$ 519,046$
174
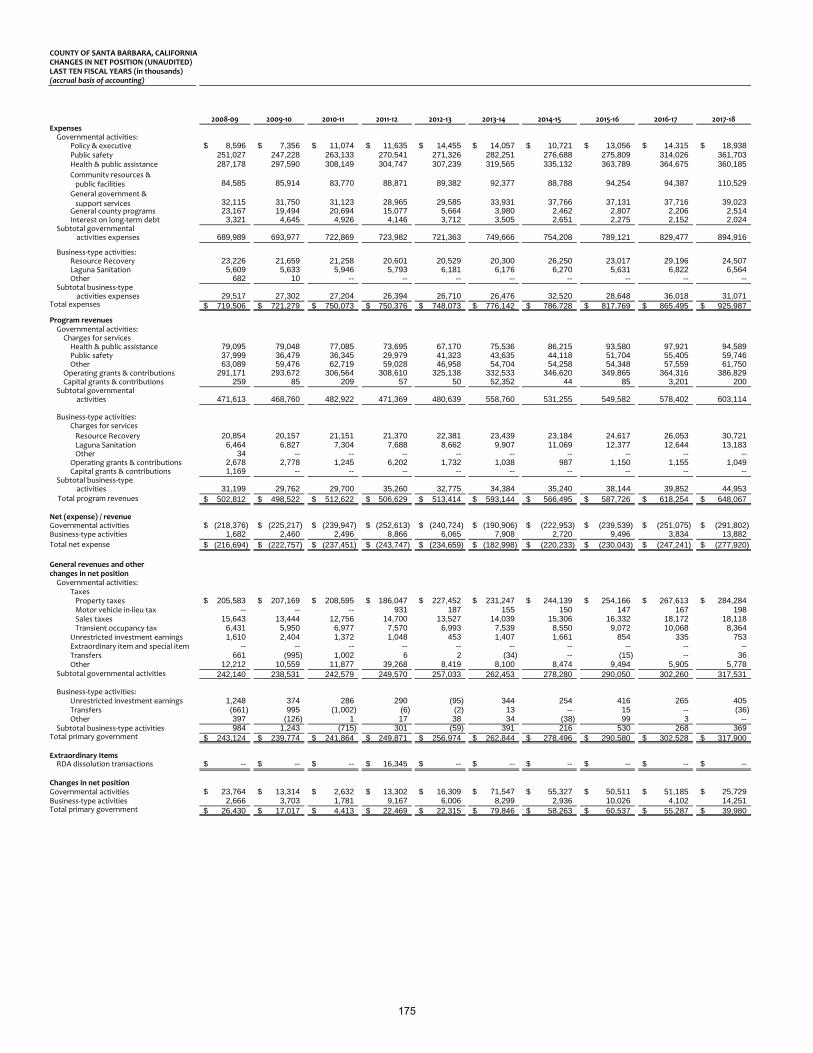
COUNTY OF SANTA BARBARA, CALIFORNIACHANGES IN NET POSITION (UNAUDITED)LAST TEN FISCAL YEARS (in thousands)(accrual basis of accounting)
2008‐09 2009‐10 2010‐11 2011‐12 2012‐13 2013‐14 2014‐15 2015‐16 2016‐17 2017‐18Expenses Governmental activities:
Policy & executive 8,596$ 7,356$ 11,074$ 11,635$ 14,455$ 14,057$ 10,721$ 13,056$ 14,315$ 18,938$ Public safety 251,027 247,228 263,133 270,541 271,326 282,251 276,688 275,809 314,026 361,703 Health & public assistance 287,178 297,590 308,149 304,747 307,239 319,565 335,132 363,789 364,675 360,185 Community resources &public facilities 84,585 85,914 83,770 88,871 89,382 92,377 88,788 94,254 94,387 110,529
General government &support services 32,115 31,750 31,123 28,965 29,585 33,931 37,766 37,131 37,716 39,023
General county programs 23,167 19,494 20,694 15,077 5,664 3,980 2,462 2,807 2,206 2,514 Interest on long‐term debt 3,321 4,645 4,926 4,146 3,712 3,505 2,651 2,275 2,152 2,024
Subtotal governmental activities expenses 689,989 693,977 722,869 723,982 721,363 749,666 754,208 789,121 829,477 894,916
Business‐type activities:Resource Recovery 23,226 21,659 21,258 20,601 20,529 20,300 26,250 23,017 29,196 24,507 Laguna Sanitation 5,609 5,633 5,946 5,793 6,181 6,176 6,270 5,631 6,822 6,564 Other 682 10 -- -- -- -- -- -- -- --
Subtotal business‐type activities expenses 29,517 27,302 27,204 26,394 26,710 26,476 32,520 28,648 36,018 31,071
Total expenses 719,506$ 721,279$ 750,073$ 750,376$ 748,073$ 776,142$ 786,728$ 817,769$ 865,495$ 925,987$
Program revenues Governmental activities:Charges for servicesHealth & public assistance 79,095 79,048 77,085 73,695 67,170 75,536 86,215 93,580 97,921 94,589 Public safety 37,999 36,479 36,345 29,979 41,323 43,635 44,118 51,704 55,405 59,746 Other 63,089 59,476 62,719 59,028 46,958 54,704 54,258 54,348 57,559 61,750
Operating grants & contributions 291,171 293,672 306,564 308,610 325,138 332,533 346,620 349,865 364,316 386,829 Capital grants & contributions 259 85 209 57 50 52,352 44 85 3,201 200
Subtotal governmentalactivities 471,613 468,760 482,922 471,369 480,639 558,760 531,255 549,582 578,402 603,114
Business‐type activities:Charges for services
Resource Recovery 20,854 20,157 21,151 21,370 22,381 23,439 23,184 24,617 26,053 30,721 Laguna Sanitation 6,464 6,827 7,304 7,688 8,662 9,907 11,069 12,377 12,644 13,183 Other 34 -- -- -- -- -- -- -- -- --
Operating grants & contributions 2,678 2,778 1,245 6,202 1,732 1,038 987 1,150 1,155 1,049 Capital grants & contributions 1,169 -- -- -- -- -- -- -- -- --
Subtotal business‐typeactivities 31,199 29,762 29,700 35,260 32,775 34,384 35,240 38,144 39,852 44,953
Total program revenues 502,812$ 498,522$ 512,622$ 506,629$ 513,414$ 593,144$ 566,495$ 587,726$ 618,254$ 648,067$
Net (expense) / revenueGovernmental activities (218,376)$ (225,217)$ (239,947)$ (252,613)$ (240,724)$ (190,906)$ (222,953)$ (239,539)$ (251,075)$ (291,802)$ Business‐type activities 1,682 2,460 2,496 8,866 6,065 7,908 2,720 9,496 3,834 13,882 Total net expense (216,694)$ (222,757)$ (237,451)$ (243,747)$ (234,659)$ (182,998)$ (220,233)$ (230,043)$ (247,241)$ (277,920)$
General revenues and other changes in net positionGovernmental activities:
TaxesProperty taxes 205,583$ 207,169$ 208,595$ 186,047$ 227,452$ 231,247$ 244,139$ 254,166$ 267,613$ 284,284$ Motor vehicle in‐lieu tax -- -- -- 931 187 155 150 147 167 198 Sales taxes 15,643 13,444 12,756 14,700 13,527 14,039 15,306 16,332 18,172 18,118 Transient occupancy tax 6,431 5,950 6,977 7,570 6,993 7,539 8,550 9,072 10,068 8,364
Unrestricted investment earnings 1,610 2,404 1,372 1,048 453 1,407 1,661 854 335 753 Extraordinary item and special item -- -- -- -- -- -- -- -- -- -- Transfers 661 (995) 1,002 6 2 (34) -- (15) -- 36 Other 12,212 10,559 11,877 39,268 8,419 8,100 8,474 9,494 5,905 5,778
Subtotal governmental activities 242,140 238,531 242,579 249,570 257,033 262,453 278,280 290,050 302,260 317,531
Business‐type activities:Unrestricted investment earnings 1,248 374 286 290 (95) 344 254 416 265 405 Transfers (661) 995 (1,002) (6) (2) 13 -- 15 -- (36) Other 397 (126) 1 17 38 34 (38) 99 3 --
Subtotal business‐type activities 984 1,243 (715) 301 (59) 391 216 530 268 369 Total primary government 243,124$ 239,774$ 241,864$ 249,871$ 256,974$ 262,844$ 278,496$ 290,580$ 302,528$ 317,900$
Extraordinary ItemsRDA dissolution transactions --$ --$ --$ 16,345$ --$ --$ --$ --$ --$ --$
Changes in net positionGovernmental activities 23,764$ 13,314$ 2,632$ 13,302$ 16,309$ 71,547$ 55,327$ 50,511$ 51,185$ 25,729$ Business‐type activities 2,666 3,703 1,781 9,167 6,006 8,299 2,936 10,026 4,102 14,251 Total primary government 26,430$ 17,017$ 4,413$ 22,469$ 22,315$ 79,846$ 58,263$ 60,537$ 55,287$ 39,980$
175
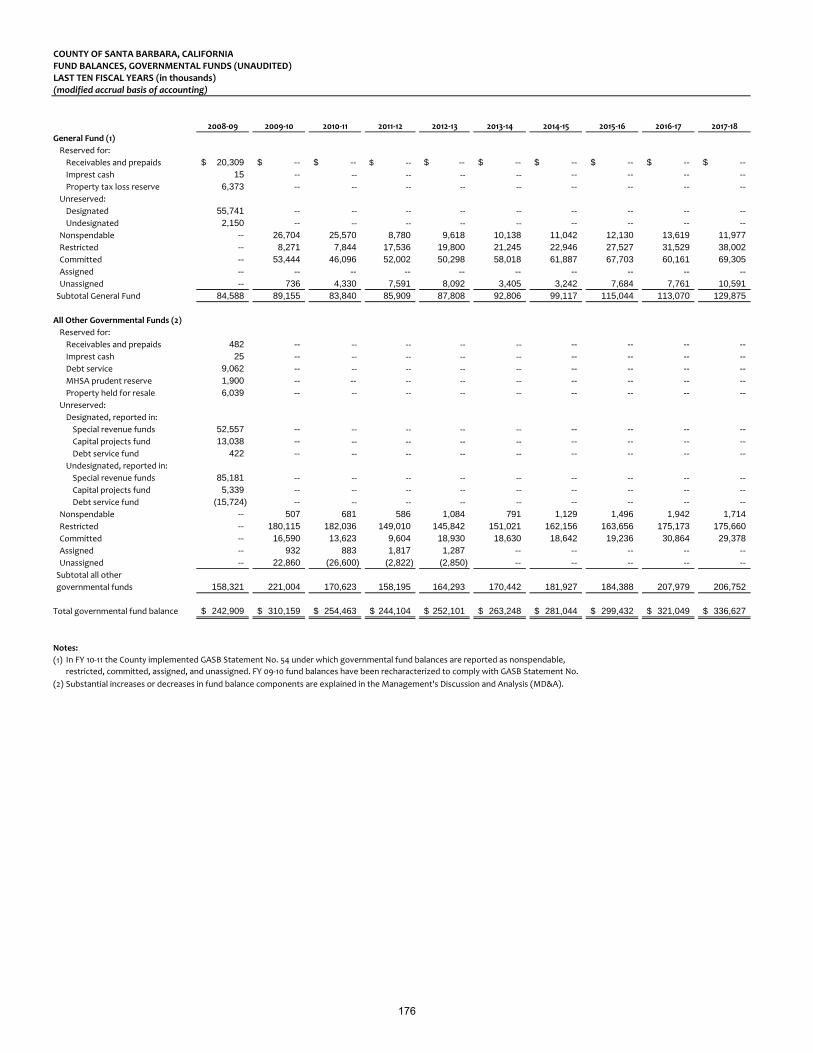
COUNTY OF SANTA BARBARA, CALIFORNIAFUND BALANCES, GOVERNMENTAL FUNDS (UNAUDITED)LAST TEN FISCAL YEARS (in thousands)(modified accrual basis of accounting)
2008‐09 2009‐10 2010‐11 2011‐12 2012‐13 2013‐14 2014‐15 2015‐16 2016‐17 2017‐18
General Fund (1)
Reserved for:
Receivables and prepaids 20,309$ --$ --$ --$ --$ --$ --$ --$ --$ --$ Imprest cash 15 -- -- -- -- -- -- -- -- -- Property tax loss reserve 6,373 -- -- -- -- -- -- -- -- --
Unreserved:
Designated 55,741 -- -- -- -- -- -- -- -- -- Undesignated 2,150 -- -- -- -- -- -- -- -- --
Nonspendable -- 26,704 25,570 8,780 9,618 10,138 11,042 12,130 13,619 11,977 Restricted -- 8,271 7,844 17,536 19,800 21,245 22,946 27,527 31,529 38,002 Committed -- 53,444 46,096 52,002 50,298 58,018 61,887 67,703 60,161 69,305 Assigned -- -- -- -- -- -- -- -- -- -- Unassigned -- 736 4,330 7,591 8,092 3,405 3,242 7,684 7,761 10,591 Subtotal General Fund 84,588 89,155 83,840 85,909 87,808 92,806 99,117 115,044 113,070 129,875
All Other Governmental Funds (2)
Reserved for:
Receivables and prepaids 482 -- -- -- -- -- -- -- -- -- Imprest cash 25 -- -- -- -- -- -- -- -- -- Debt service 9,062 -- -- -- -- -- -- -- -- -- MHSA prudent reserve 1,900 -- -- -- -- -- -- -- -- -- Property held for resale 6,039 -- -- -- -- -- -- -- -- --
Unreserved:
Designated, reported in:
Special revenue funds 52,557 -- -- -- -- -- -- -- -- -- Capital projects fund 13,038 -- -- -- -- -- -- -- -- -- Debt service fund 422 -- -- -- -- -- -- -- -- --
Undesignated, reported in:
Special revenue funds 85,181 -- -- -- -- -- -- -- -- -- Capital projects fund 5,339 -- -- -- -- -- -- -- -- -- Debt service fund (15,724) -- -- -- -- -- -- -- -- --
Nonspendable -- 507 681 586 1,084 791 1,129 1,496 1,942 1,714 Restricted -- 180,115 182,036 149,010 145,842 151,021 162,156 163,656 175,173 175,660 Committed -- 16,590 13,623 9,604 18,930 18,630 18,642 19,236 30,864 29,378 Assigned -- 932 883 1,817 1,287 -- -- -- -- -- Unassigned -- 22,860 (26,600) (2,822) (2,850) -- -- -- -- -- Subtotal all other
governmental funds 158,321 221,004 170,623 158,195 164,293 170,442 181,927 184,388 207,979 206,752
Total governmental fund balance 242,909$ 310,159$ 254,463$ 244,104$ 252,101$ 263,248$ 281,044$ 299,432$ 321,049$ 336,627$
Notes:
(1)
(2)
In FY 10‐11 the County implemented GASB Statement No. 54 under which governmental fund balances are reported as nonspendable,
restricted, committed, assigned, and unassigned. FY 09‐10 fund balances have been recharacterized to comply with GASB Statement No.
Substantial increases or decreases in fund balance components are explained in the Management's Discussion and Analysis (MD&A).
176

COUNTY OF SANTA BARBARA, CALIFORNIACHANGES IN FUND BALANCES, GOVERNMENTAL FUNDS (UNAUDITED)LAST TEN FISCAL YEARS (in thousands)(modified accrual basis of accounting)
2008‐09 2009‐10 2010‐11 2011‐12 2012‐13 2013‐14 2014‐15 2015‐16 2016‐17 2017‐18
Revenues (by source)
Taxes 232,781$ 231,648$ 234,354$ 241,142$ 249,414$ 254,177$ 269,412$ 281,279$ 295,066$ 309,983$ Licenses, permits, and franchises 13,643 13,223 12,639 12,966 14,011 14,030 13,660 14,282 14,221 16,758 Fines, forfeitures, and penalties 13,218 13,527 13,299 10,990 9,582 10,883 9,581 9,160 9,141 11,281 Use of money and property 8,739 6,121 4,582 4,307 2,321 4,995 4,902 4,809 3,332 4,324 Intergovernmental 286,846 290,440 304,347 306,609 321,765 380,785 340,807 345,428 361,392 382,633 Charges for services 163,332 162,525 164,630 139,685 135,625 141,839 161,637 181,022 189,834 189,613 Other 16,614 17,046 22,872 25,920 19,582 20,804 19,033 16,149 16,177 16,255
Total revenues 735,173 734,530 756,723 741,619 752,300 827,513 819,032 852,129 889,163 930,847
Expenditures (by function)
Policy & executive 13,971 13,266 15,661 15,172 15,349 15,408 15,563 16,484 16,585 21,242 Public safety 237,160 233,156 248,359 250,145 259,968 270,605 281,211 288,174 303,151 329,172 Health & public assistance 287,110 298,239 307,900 300,536 304,982 317,322 343,584 351,911 361,796 353,241 Community resources & public facilities 106,471 100,047 97,672 97,130 100,838 145,572 93,443 106,380 99,463 108,561 General government & support services 50,736 48,818 47,073 42,643 43,691 44,194 47,357 50,104 52,597 53,563 General county programs 22,822 18,449 18,957 12,287 5,091 8,199 3,190 2,679 2,167 1,590 Debt service
Principal 6,230 7,506 5,621 23,749 4,133 4,502 15,318 3,764 3,874 3,951 Interest 3,324 4,637 4,918 4,183 3,518 3,308 2,516 2,111 2,002 1,889
Capital outlay 7,017 8,639 18,094 15,795 7,290 7,079 8,353 6,229 24,983 39,756 Total expenditures 734,841 732,757 764,255 761,640 744,860 816,189 810,535 827,836 866,618 912,965
Excess (deficiency) of revenues
over (under) expenditures 332 1,773 (7,532) (20,021) 7,440 11,324 8,497 24,293 22,545 17,882
Other financing sources (uses)
Transfers in 139,021 146,179 88,586 96,986 86,395 49,715 60,305 54,535 68,603 57,082 Transfers out (138,722) (146,991) (91,204) (96,912) (86,338) (49,965) (61,278) (55,935) (69,673) (59,669) Proceeds from sale of capital assets 147 52 174 220 500 73 347 205 142 283 Long‐term debt issued -- 20,387 -- 16,957 -- -- 9,925 10 -- -- Long‐term receivable collected -- -- -- 356 -- -- -- -- -- -- Issuance discount on long‐term debt -- (148) -- -- -- -- -- -- -- -- Issuance premium on long‐term debt -- 278 -- -- -- -- -- -- -- --
Total other financing sources (uses) 446 19,757 (2,444) 17,607 557 (177) 9,299 (1,185) (928) (2,304)
Extraordinary Items
RDA dissolution transactions -- -- -- (13,092) -- -- -- -- -- --
Net change in fund balance 778$ 21,530$ (9,976)$ (2,414)$ 7,997$ 11,147$ 17,796$ 23,108$ 21,617$ 15,578$
Debt service as a percentage
of noncapital expenditures (1): 1.35% 1.71% 1.44% 3.84% 1.07% 1.06% 2.27% 0.74% 0.71% 0.68%
2008‐09 2009‐10 2010‐11 2011‐12 2012‐13 2013‐14 2014‐15 2015‐16 2016‐17 2017‐18
Expenditures (2)
General government 64,020$ 62,761$ 64,450$ 48,395$ 64,886$ 65,289$ 64,462$ 68,216$ 74,054$ 74,874$ Public protection 299,802 288,599 296,982 303,442 302,982 316,926 328,238 336,139 353,536 386,355 Public ways and facilities 32,301 32,111 32,489 35,540 29,814 28,226 25,750 30,620 23,720 29,672 Health and sanitation 155,148 157,155 157,961 157,298 155,560 157,460 171,631 173,590 180,615 180,185 Public assistance 130,962 138,166 145,085 138,397 139,800 148,702 159,753 165,569 166,155 158,593 Education 3,223 3,289 3,410 2,734 3,199 3,128 3,132 3,568 3,800 4,097 Recreational and cultural services 11,232 12,899 11,089 10,866 10,504 11,422 12,811 14,237 14,022 16,306 Debt service 9,555 12,144 10,539 27,933 7,651 7,809 17,834 5,875 5,876 5,840 Capital outlay 28,598 25,633 42,250 37,035 30,464 77,227 26,924 30,021 44,840 57,043
Total expenditures 734,841$ 732,757$ 764,255$ 761,640$ 744,860$ 816,189$ 810,535$ 827,835$ 866,618$ 912,965$
Notes:
(1) In FY 16‐17 the calculation for debt service as a percentage of noncapital expenditures was revised to include the appropriate amounts. This change impacted all years reported.
(2) By State Controller function.
177
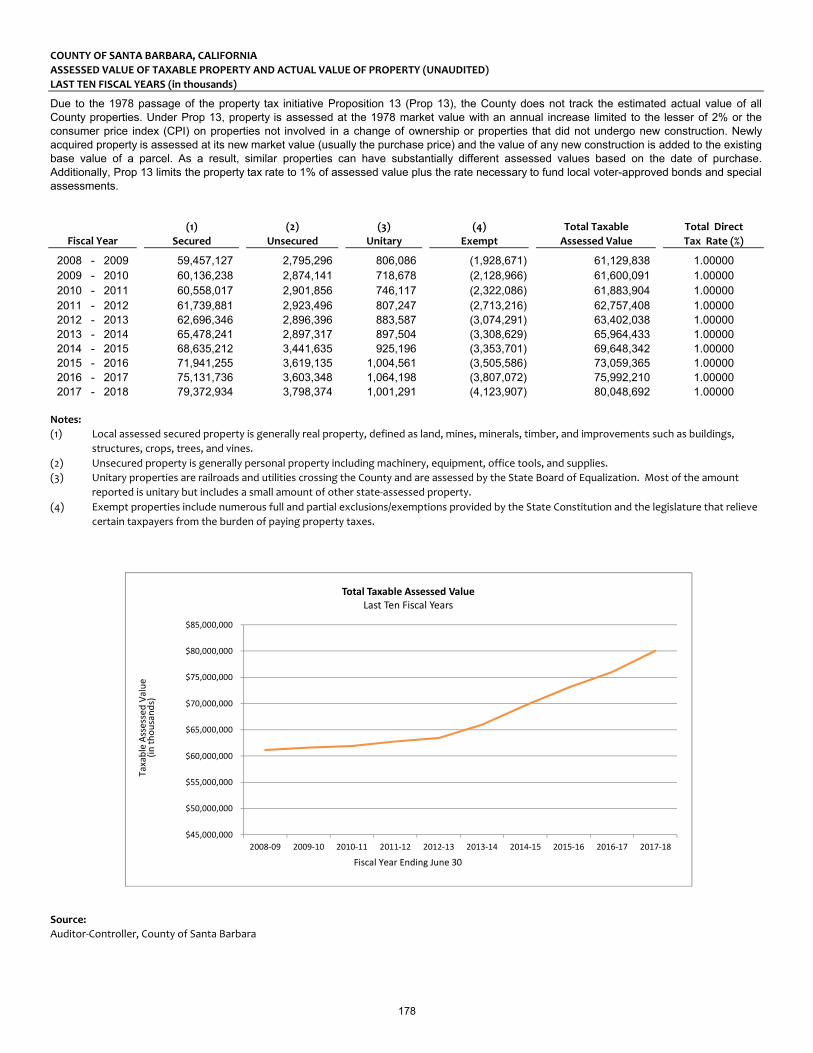
COUNTY OF SANTA BARBARA, CALIFORNIAASSESSED VALUE OF TAXABLE PROPERTY AND ACTUAL VALUE OF PROPERTY (UNAUDITED)LAST TEN FISCAL YEARS (in thousands)
(1) (2) (3) (4) Total Taxable Total DirectSecured Unsecured Unitary Exempt Assessed Value Tax Rate (%)
2008 - 2009 59,457,127 2,795,296 806,086 (1,928,671) 61,129,838 1.000002009 - 2010 60,136,238 2,874,141 718,678 (2,128,966) 61,600,091 1.000002010 - 2011 60,558,017 2,901,856 746,117 (2,322,086) 61,883,904 1.000002011 - 2012 61,739,881 2,923,496 807,247 (2,713,216) 62,757,408 1.000002012 - 2013 62,696,346 2,896,396 883,587 (3,074,291) 63,402,038 1.000002013 - 2014 65,478,241 2,897,317 897,504 (3,308,629) 65,964,433 1.000002014 - 2015 68,635,212 3,441,635 925,196 (3,353,701) 69,648,342 1.000002015 - 2016 71,941,255 3,619,135 1,004,561 (3,505,586) 73,059,365 1.000002016 - 2017 75,131,736 3,603,348 1,064,198 (3,807,072) 75,992,210 1.000002017 - 2018 79,372,934 3,798,374 1,001,291 (4,123,907) 80,048,692 1.00000
Notes:
(2) Unsecured property is generally personal property including machinery, equipment, office tools, and supplies.
Source:Auditor-Controller, County of Santa Barbara
Due to the 1978 passage of the property tax initiative Proposition 13 (Prop 13), the County does not track the estimated actual value of allCounty properties. Under Prop 13, property is assessed at the 1978 market value with an annual increase limited to the lesser of 2% or theconsumer price index (CPI) on properties not involved in a change of ownership or properties that did not undergo new construction. Newlyacquired property is assessed at its new market value (usually the purchase price) and the value of any new construction is added to the existingbase value of a parcel. As a result, similar properties can have substantially different assessed values based on the date of purchase.Additionally, Prop 13 limits the property tax rate to 1% of assessed value plus the rate necessary to fund local voter-approved bonds and specialassessments.
Fiscal Year
Unitary properties are railroads and utilities crossing the County and are assessed by the State Board of Equalization. Most of the amount reported is unitary but includes a small amount of other state-assessed property.
(3)
Local assessed secured property is generally real property, defined as land, mines, minerals, timber, and improvements such as buildings, structures, crops, trees, and vines.
Exempt properties include numerous full and partial exclusions/exemptions provided by the State Constitution and the legislature that relieve certain taxpayers from the burden of paying property taxes.
(4)
(1)
$45,000,000
$50,000,000
$55,000,000
$60,000,000
$65,000,000
$70,000,000
$75,000,000
$80,000,000
$85,000,000
2008-09 2009-10 2010-11 2011-12 2012-13 2013-14 2014-15 2015-16 2016-17 2017-18
Total Taxable Assessed ValueLast Ten Fiscal Years
Fiscal Year Ending June 30
Taxa
ble
Asse
ssed
Valu
e(in
thou
sand
s)
178
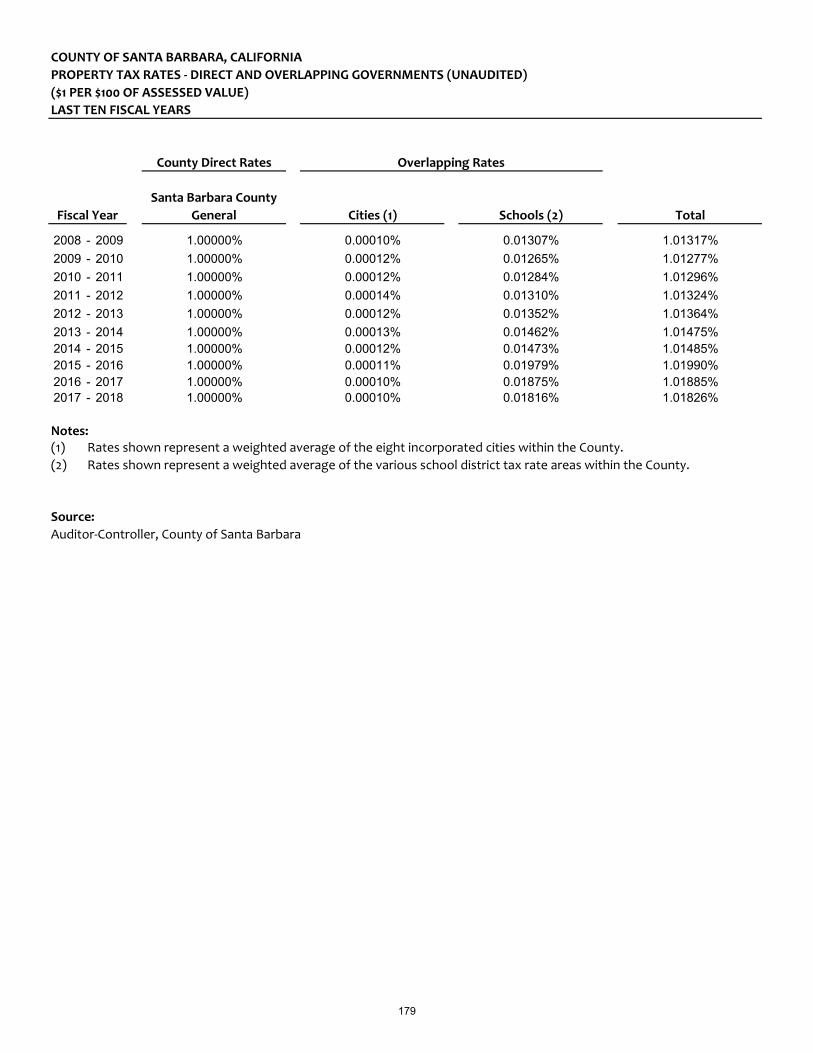
COUNTY OF SANTA BARBARA, CALIFORNIAPROPERTY TAX RATES - DIRECT AND OVERLAPPING GOVERNMENTS (UNAUDITED)($1 PER $100 OF ASSESSED VALUE)LAST TEN FISCAL YEARS
County Direct Rates
Cities (1) Schools (2) Total
2008 - 2009 1.00000% 0.00010% 0.01307% 1.01317%2009 - 2010 1.00000% 0.00012% 0.01265% 1.01277%2010 - 2011 1.00000% 0.00012% 0.01284% 1.01296%2011 - 2012 1.00000% 0.00014% 0.01310% 1.01324%2012 - 2013 1.00000% 0.00012% 0.01352% 1.01364%2013 - 2014 1.00000% 0.00013% 0.01462% 1.01475%2014 - 2015 1.00000% 0.00012% 0.01473% 1.01485%2015 - 2016 1.00000% 0.00011% 0.01979% 1.01990%2016 - 2017 1.00000% 0.00010% 0.01875% 1.01885%2017 - 2018 1.00000% 0.00010% 0.01816% 1.01826%
Notes: (1)(2) Rates shown represent a weighted average of the various school district tax rate areas within the County.
Source:Auditor-Controller, County of Santa Barbara
Santa Barbara County General
Overlapping Rates
Fiscal Year
Rates shown represent a weighted average of the eight incorporated cities within the County.
179

COUNTY OF SANTA BARBARA, CALIFORNIAPRINCIPAL PROPERTY TAXPAYERS (UNAUDITED)June 30, 2018 AND June 30, 2009 (in thousands)
June 30, 2018:
Type of Business
(1)Net Assessed
Secured Property Value
Percentage of
Total Net Assessed Value
(2)Total Secured
Tax Levy Fiscal Year 2017-18
Percentage of Total Secured Tax
Levy Fiscal Year 2017-18
Southern California Edison Co. Utility 293,372$ 0.37% 3,619$ 0.48%United Launch Alliance LLC Aerospace 292,098 0.36% 3,427 0.45%1260 BB Property, LLC (Biltmore) Hotel 219,475 0.27% 2,874 0.38%Southern California Gas Company Utility 217,778 0.27% 2,689 0.35%BRS Investment Properties, LLC (Bacara) Hotel 207,279 0.26% 2,306 0.30%Pacific Gas & Electric Co. Utility 179,582 0.22% 2,216 0.29%Windset Farms California, Inc Agriculture 170,705 0.21% 1,932 0.25%Space Exploration Technologies Corp Aerospace 166,632 0.21% 1,955 0.26%Fairway BB Property, LLC Residential Estate 157,513 0.20% 1,633 0.22%Regency Tropicana LLC Residential Units 148,355 0.19% 1,668 0.22%
Ten largest taxpayers 2,052,789 2.56% 24,319 3.20%All other taxpayers 77,995,903 97.44% 735,033 96.80%
Total 80,048,692$ 100.00% 759,352$ 100.00%
June 30, 2009:
Type of Business
(1)Net Assessed
Secured Property Value
Percentage of Total Net
Assessed Value
(2)Total Secured Tax
Levy Fiscal Year 2007-08
Percentage of Total Secured Tax Levy
Fiscal Year 2007-08
Exxon Corporation Petroleum & Gas 351,592$ 0.58% 3,609$ 0.62%Verizon California Inc. Utility 211,803 0.35% 2,417 0.42%Southern California Gas Company Utility 134,386 0.22% 1,531 0.26%Pacific Offshore Pipeline Co. 116,709 0.19% 1,196 0.21%Tara Ii Llc Residental Estates 89,138 0.15% 914 0.16%Essex Portfolio Lp Residental Estates 59,402 0.10% 695 0.12%Raytheon Company Manufacturing 51,643 0.08% 598 0.10%Pini Dario Residental Units 47,055 0.08% 499 0.09%Venoco Inc Petroleum & Gas 43,642 0.07% 453 0.08%Colombo Paul Residental Estates 39,179 0.06% 407 0.07%
Ten largest taxpayers 1,144,549 1.88% 12,319 2.13%All other taxpayers 59,985,289 98.12% 565,530 97.87%
Total 61,129,838$ 100.00% 577,849$ 100.00%
Notes:(1) Net Assessed Secured amounts include Secured & Unitary less exemptions.
(2) Includes 1%, bonds, fixed charges, late penalties and costs (Only Secured & Unitary Tax Levy amounts).
Source:County of Santa Barbara Treasurer / Tax Collector
In accordance with GASB Statement No. 44, the following tables present information for the County's principal property taxpayers as of June 30, 2018 and June 30, 2009
Taxpayers
Taxpayers
Petroleum & Gas
See "Assessed Value of Taxable Property and Actual Value of Property" schedule for total assessed value.
180

COUNTY OF SANTA BARBARA, CALIFORNIAPROPERTY TAX LEVIES and COLLECTIONS (UNAUDITED)LAST TEN FISCAL YEARS (in thousands)
Collections(2) in
(1) SubsequentTaxes Levied Amount % of Levy Years Amount % of Levy
2008 - 2009 577,849$ 561,907$ 97.24% 15,842$ 577,749$ 99.98%2009 - 2010 580,532 566,808 97.64% 13,536 580,344 99.97%2010 - 2011 579,901 573,537 98.90% 6,094 579,631 99.95%2011 - 2012 590,345 583,214 98.79% 6,847 590,061 99.95%2012 - 2013 599,416 593,841 99.07% 5,170 599,011 99.93%2013 - 2014 626,258 621,794 99.29% 3,853 625,647 99.90%2014 - 2015 658,542 653,778 99.28% 1,474 655,252 99.50%2015 - 2016 690,326 684,131 99.10% -- 684,131 99.10%2016 - 2017 720,855 714,505 99.12% -- 714,505 99.12%2017 - 2018 759,352 751,947 99.02% -- 751,947 99.02%
Notes:(1) Secured and Unitary tax levy for the County itself, school districts, cities, and special districts under the supervision of their own governing boards.(2) Included are amounts collected by the County on behalf of itself, school districts, cities, and special districts under the supervision of their own governing boards.
Source:Auditor-Controller, County of Santa Barbara
Total Collections to DateFiscal Year
Collections Within the Fiscal Year of the Levy
181
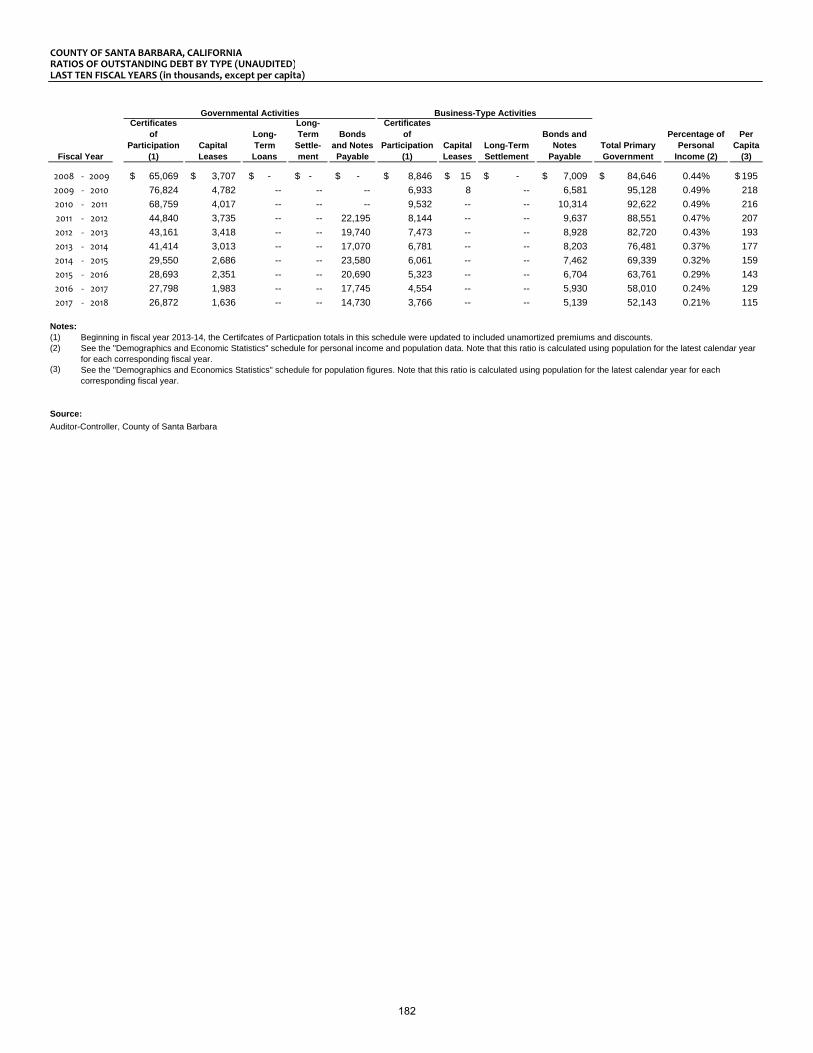
COUNTY OF SANTA BARBARA, CALIFORNIARATIOS OF OUTSTANDING DEBT BY TYPE (UNAUDITED)LAST TEN FISCAL YEARS (in thousands, except per capita)
Certificates of
Participation (1)
Capital Leases
Long-Term Loans
Long- Term
Settle-ment
Bonds and Notes Payable
Certificates of
Participation (1)
Capital Leases
Long-Term Settlement
Bonds and Notes
PayableTotal Primary Government
Percentage of Personal
Income (2)
Per Capita
(3)
2008 ‐ 2009 65,069$ 3,707$ -$ -$ -$ 8,846$ 15$ -$ 7,009$ 84,646$ 0.44% 195$
2009 ‐ 2010 76,824 4,782 -- -- -- 6,933 8 -- 6,581 95,128 0.49% 218
2010 ‐ 2011 68,759 4,017 -- -- -- 9,532 -- -- 10,314 92,622 0.49% 216
2011 ‐ 2012 44,840 3,735 -- -- 22,195 8,144 -- -- 9,637 88,551 0.47% 207
2012 ‐ 2013 43,161 3,418 -- -- 19,740 7,473 -- -- 8,928 82,720 0.43% 193
2013 ‐ 2014 41,414 3,013 -- -- 17,070 6,781 -- -- 8,203 76,481 0.37% 177
2014 ‐ 2015 29,550 2,686 -- -- 23,580 6,061 -- -- 7,462 69,339 0.32% 159
2015 ‐ 2016 28,693 2,351 -- -- 20,690 5,323 -- -- 6,704 63,761 0.29% 143
2016 ‐ 2017 27,798 1,983 -- -- 17,745 4,554 -- -- 5,930 58,010 0.24% 129
2017 ‐ 2018 26,872 1,636 -- -- 14,730 3,766 -- -- 5,139 52,143 0.21% 115
Notes:(1)(2)
(3)
Source:
Auditor-Controller, County of Santa Barbara
Business-Type ActivitiesGovernmental Activities
Fiscal Year
See the "Demographics and Economic Statistics" schedule for personal income and population data. Note that this ratio is calculated using population for the latest calendar year for each corresponding fiscal year.See the "Demographics and Economics Statistics" schedule for population figures. Note that this ratio is calculated using population for the latest calendar year for each corresponding fiscal year.
Beginning in fiscal year 2013-14, the Certifcates of Particpation totals in this schedule were updated to included unamortized premiums and discounts.
182

COUNTY OF SANTA BARBARA, CALIFORNIA
COMPUTATION OF LEGAL DEBT MARGIN (UNAUDITED)
LAST TEN FISCAL YEARS (in thousands)
(1)
Assessed Value
(2)
Legal Debt Limit
Total Net
Applicable Debt
(3)
Legal Debt
Margin
Legal Debt
Margin / Debt
Limit
2008 - 2009 61,129,838 764,123 -- 764,123 100%
2009 - 2010 61,600,091 770,001 -- 770,001 100%
2010 - 2011 61,883,904 773,549 -- 773,549 100%
2011 - 2012 62,757,408 784,468 -- 784,468 100%
2012 - 2013 63,402,039 792,525 -- 792,525 100%
2013 - 2014 65,964,432 824,555 -- 824,555 100%
2014 - 2015 69,453,967 868,175 -- 868,175 100%
2015 - 2016 73,059,365 913,242 -- 913,242 100%
2016 - 2017 75,992,210 949,903 -- 949,903 100%
2017 - 2018 80,048,692 1,000,609 -- 1,000,609 100%
Notes: ‐‐
(1)
(2)
(3)
Source:
Auditor‐Controller, County of Santa Barbara
The legal debt margin is the County's available borrowing authority under state finance statutes and is
calculated by subtracting the debt applicable to the legal debt limit from the legal debt limit.
Assessed Value does not include tax exempt property. Property value data can be found in the "Assessed
Value of Taxable Property and Actual Value of Property" schedule.
Fiscal Year
California Government Code Section 29909 read in conjunction with Revenue and Taxation Code Section 135
imposes a legal debt limitation for General Obligation Bond indebtedness to 1.25% of the total full cash
valuation.
183
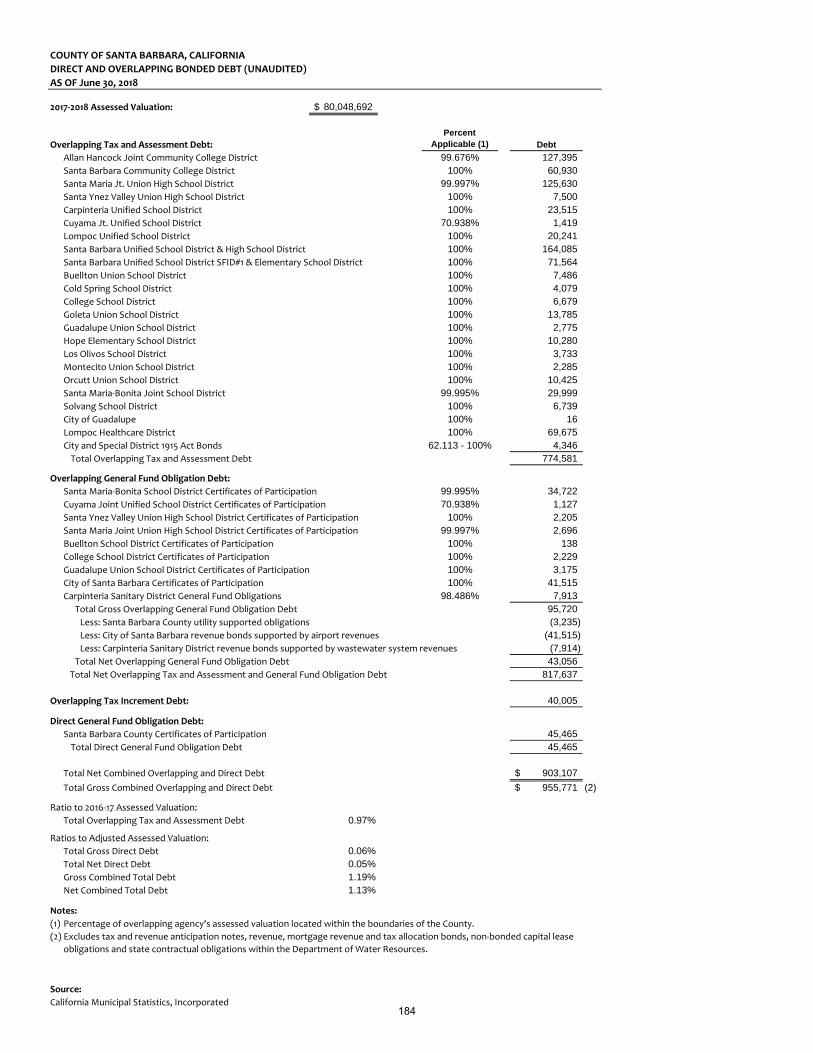
COUNTY OF SANTA BARBARA, CALIFORNIA
DIRECT AND OVERLAPPING BONDED DEBT (UNAUDITED)
AS OF June 30, 2018
2017‐2018 Assessed Valuation: 80,048,692$
Overlapping Tax and Assessment Debt:Percent
Applicable (1) Debt
Allan Hancock Joint Community College District 99.676% 127,395 Santa Barbara Community College District 100% 60,930 Santa Maria Jt. Union High School District 99.997% 125,630 Santa Ynez Valley Union High School District 100% 7,500 Carpinteria Unified School District 100% 23,515 Cuyama Jt. Unified School District 70.938% 1,419 Lompoc Unified School District 100% 20,241 Santa Barbara Unified School District & High School District 100% 164,085 Santa Barbara Unified School District SFID#1 & Elementary School District 100% 71,564 Buellton Union School District 100% 7,486 Cold Spring School District 100% 4,079 College School District 100% 6,679 Goleta Union School District 100% 13,785 Guadalupe Union School District 100% 2,775 Hope Elementary School District 100% 10,280 Los Olivos School District 100% 3,733 Montecito Union School District 100% 2,285 Orcutt Union School District 100% 10,425 Santa Maria‐Bonita Joint School District 99.995% 29,999 Solvang School District 100% 6,739 City of Guadalupe 100% 16 Lompoc Healthcare District 100% 69,675 City and Special District 1915 Act Bonds 62.113 - 100% 4,346 Total Overlapping Tax and Assessment Debt 774,581
Overlapping General Fund Obligation Debt:
Santa Maria‐Bonita School District Certificates of Participation 99.995% 34,722 Cuyama Joint Unified School District Certificates of Participation 70.938% 1,127 Santa Ynez Valley Union High School District Certificates of Participation 100% 2,205 Santa Maria Joint Union High School District Certificates of Participation 99.997% 2,696 Buellton School District Certificates of Participation 100% 138 College School District Certificates of Participation 100% 2,229 Guadalupe Union School District Certificates of Participation 100% 3,175 City of Santa Barbara Certificates of Participation 100% 41,515 Carpinteria Sanitary District General Fund Obligations 98.486% 7,913 Total Gross Overlapping General Fund Obligation Debt 95,720 Less: Santa Barbara County utility supported obligations (3,235) Less: City of Santa Barbara revenue bonds supported by airport revenues (41,515) Less: Carpinteria Sanitary District revenue bonds supported by wastewater system revenues (7,914)
Total Net Overlapping General Fund Obligation Debt 43,056 Total Net Overlapping Tax and Assessment and General Fund Obligation Debt 817,637
Overlapping Tax Increment Debt: 40,005
Direct General Fund Obligation Debt:
Santa Barbara County Certificates of Participation 45,465 Total Direct General Fund Obligation Debt 45,465
Total Net Combined Overlapping and Direct Debt 903,107$
Total Gross Combined Overlapping and Direct Debt 955,771$ (2)
Ratio to 2016‐17 Assessed Valuation:
Total Overlapping Tax and Assessment Debt 0.97%
Ratios to Adjusted Assessed Valuation:
Total Gross Direct Debt 0.06%Total Net Direct Debt 0.05%Gross Combined Total Debt 1.19%Net Combined Total Debt 1.13%
Notes:
(1) Percentage of overlapping agency's assessed valuation located within the boundaries of the County.
(2)
Source:
California Municipal Statistics, Incorporated
Excludes tax and revenue anticipation notes, revenue, mortgage revenue and tax allocation bonds, non‐bonded capital lease
obligations and state contractual obligations within the Department of Water Resources.
184

COUNTY OF SANTA BARBARA, CALIFORNIADEMOGRAPHICS AND ECONOMIC STATISTICS (UNAUDITED)LAST FISCAL TEN YEARS (in thousands)
(3),(4) Per Capita (5) (6)(1) (2) Personal Personal School Unemployment
Year Population Income Income Enrollment Rate
2009 431 18,100,000$ 42.0 66 8.2%2010 434 18,600,000 42.9 66 8.8%2011 426 19,000,000 44.6 66 8.9%2012 427 19,000,000 44.5 66 7.9%2013 429 19,300,000 45.0 66 6.3%2014 433 20,600,000 47.6 67 5.4%2015 437 21,700,000 49.7 68 4.7%2016 447 22,300,000 49.9 69 4.9%2017 451 24,200,000 53.7 69 4.3%2018 453 25,000,000 55.2 70 3.9%
Detail of estimated population, as of January 1, 2018 (whole numbers):
(2) Incorporated CitiesBuellton 5,291Carpinteria 13,704Goleta 31,949Guadalupe 7,604Lompoc 43,599Santa Barbara 94,807Santa Maria 108,470Solvang 5,771
Total of Incorporated Cities 311,195Total of Unincorporated Areas 142,262
Total Population 453,457
Notes:(1) Calendar year(2) Population as of January 1(3) Estimated amounts
Sources:(2) California Department of Finance(4) Bureau of Economic Analysis(5) California Department of Education(6) Employment Development Department Research Center
185

COUNTY OF SANTA BARBARA, CALIFORNIA
PRINCIPAL EMPLOYERS (UNAUDITED)
June 30, 2018 AND June 30, 2009
Percent of
Total County
Company or Organization Type of Business Jobs (1) Employment
University of California, Santa Barbara Education 4,325 2.10%County of Santa Barbara Government 4,213 2.05%Cottage Health Organization Health 3,606 1.75%Vandenberg Air Force Base Defense 2,500 1.22%Santa Maria‐Bonita School District Education 2,120 1.03%Chumash Casino Resort Recreation/Hospitality 2,000 0.97%Allan Hancock College Education 1,480 0.72%Santa Barbara Unified School District Education 1,400 0.68%Zodiac Aerospace Manufacturer 1,200 0.59%Santa Barbara City College Education 1,193 0.58%
Total ten largest 24,037 11.69%Total all other 181,645 88.31%
Total companies or organizations 205,682 100.00%
Percent of
Total County
Company or Organization Type of Business Jobs (2) Employment
Vandenberg Air Force Base Defense 6,386 3.37%University of California, Santa Barbara Education 5,161 2.72%County of Santa Barbara Government 4,026 2.12%Santa Barbara Cottage Hospital Health 2,900 1.53%Santa Barbara School District Admin. Education 2,588 1.36%Santa Barbara City College Education 2,444 1.29%Santa Maria‐Bonita School District Education 1,686 0.89%City of Santa Barbara Government 1,687 0.89%Chumash Casino Resort Recreation/Hospitality 1,622 0.85%Raytheon Electronic Systems Defense Contractor 1,500 0.79%
Total ten largest 30,000 15.81%Total all other 159,700 84.19%
Total companies or organizations 189,700 100.00%
Sources:
(1) Pacific Coast Business Times "Book of Lists." ‐ Beginning in FY 17‐18, this is a new source for this information.
(2) County of Santa Barbara CAFR FY 08‐09
June 30, 2018
June 30, 2009
186

COUNTY OF SANTA BARBARA, CALIFORNIA
COUNTY EMPLOYEES BY FUNCTION/PROGRAM (UNAUDITED)
LAST TEN FISCAL YEARS
2008‐09 2009‐10 2010‐11 2011‐12 2012‐13 2013‐14 2014‐15 2015‐16 2016‐17 2017‐18
Paid employees (1)
Policy & executive 91 85 93 92 94 96 99 105 103 106 Public safety 1,617 1,556 1,524 1,455 1,467 1,478 1,498 1,521 1,540 1,540 Health & public assistance 1,654 1,765 1,779 1,634 1,732 1,799 1,926 1,973 1,961 1,806 Community resources
& public facilities 476 451 432 416 419 424 419 424 443 442 General government
& support services 437 410 385 343 334 334 350 359 361 348 General county programs 31 30 15 17 6 5 3 6 6 5 Resource Recovery 91 85 83 81 79 83 81 77 80 77 Laguna Sanitation 16 16 16 16 16 16 16 15 16 17
Total County employees 4,413 4,398 4,327 4,054 4,147 4,235 4,392 4,480 4,510 4,341
Actual full‐time equivalent employees (2)
Policy & executive 83 79 86 85 88 88 91 94 93 93 Public safety 1,561 1,500 1,455 1,390 1,386 1,394 1,415 1,433 1,448 1,452 Health & public assistance 1,573 1,633 1,637 1,548 1,608 1,679 1,796 1,841 1,842 1,697 Community resources
& public facilities 445 421 404 391 389 392 382 389 402 402 General government
& support services 414 392 369 328 315 313 326 335 339 325 General county programs 30 29 14 13 -- -- 1 1 1 1 Resource Recovery 86 80 78 76 74 78 77 74 77 74 Laguna Sanitation 16 16 16 16 16 16 15 15 16 17
Total County employees 4,208 4,150 4,059 3,847 3,876 3,960 4,103 4,182 4,218 4,061
Note:
(1)
(2)
Source:Santa Barbara County payroll records as of June 30.
Paid employees: Count of employees paid, including terminated employees. Employees with more than one job will be counted once for each job for which the employee was paid.
Actual full-time equivalent employees: Count of number of full-time equivalents paid. For full-time and part-time, the full-time equivalent (FTE) used is from the employee's assigned work schedule. For extra help and contractors, the FTE is calculated as the number of hours worked this pay period divided by 80.
3,600
3,700
3,800
3,900
4,000
4,100
4,200
4,300
2008‐09 2009‐10 2010‐11 2011‐12 2012‐13 2013‐14 2014‐15 2015‐16 2016‐17 2017‐18
Total Full‐Time Equivalent Employees
Last Ten Fiscal Years
Full‐Time Equivalen
t Em
ployees
Fiscal Year Ending June 30
187

COUNTY OF SANTA BARBARA, CALIFORNIA
OPERATING INDICATORS BY FUNCTION/PROGRAM (UNAUDITED)
LAST TEN FISCAL YEARS
2008‐09 2009‐10 2010‐11 2011‐12 2012‐13 2013‐14 2014‐15 2015‐16 2016‐17 2017‐18
Function/Program
Public safety
Other:
Filed felonies‐District Attorney 2,610 2,482 2,462 2,741 2,979 3,176 2,499 2,898 2,835 2,659Filed misdemeanors‐District Attorney 14,608 14,633 13,264 10,983 10,022 9,838 11,347 12,355 12,404 11,124Public Defender's total new caseload 21,859 23,056 23,563 21,642 18,963 20,973 23,391 24,024 23,414 24,014Fire emergency responses 11,392 11,278 11,512 12,714 13,989 13,842 13,927 14,307 15,123 15,763
Sheriff:
Total miles patrolled 1,563,910 1,530,054 1,519,651 1,447,978 1,230,191 1,477,038 1,413,902 1,439,005 1,413,060 1,454,032Processed and booked adult offenders 17,992 18,319 17,552 15,763 16,677 16,780 17,117 17,744 15,623 14,130
Probation:
Juvenile referrals processed 5,880 5,431 4,978 4,122 3,449 3,070 3,313 3,371 3,150 2,964Adult and Juvenile cases supervised 10,509 10,808 9,480 8,364 8,321 8,331 8,196 8,114 8,112 7,358Institutional care for minors 68,286 67,861 65,313 58,923 52,268 38,763 34,894 37,372 34,214 26,695Submit written reports to courts on Adults 5,832 4,941 5,544 5,146 6,582 6,628 6,838 6,856 7,337 6,763
Health & public assistance
ADMHS clients served 13,637 14,785 12,063 11,825 12,313 12,647 13,936 14,653 15,344 13,004Established orders for child support 14,630 14,800 13,648 12,963 12,565 11,922 11,544 11,452 11,317 11,270Assistance claims paid to eligible recipients 71,249 77,966 80,025 76,762 72,678 70,924 99,513 99,597 97,127 91,623Patient encounters at Public Health clinics 134,450 136,867 131,489 120,540 120,700 114,000 111,000 107,000 115,000 111,000
Community resources & public facilitiesBuilding inspections 21,523 19,159 19,450 19,736 20,689 23,752 22,431 22,583 21,804 24,230Enhanced or maintained road lanes (miles) 100 195 96 81 67 82 73 24 23 21Flood control work requests (1) 180 195 90 95 -- -- -- -- -- --
General government & support servicesClerk‐Recorder‐Assessor
Recorded documents & vital copies issued 107,073 108,178 117,932 119,522 135,053 103,060 102,694 110,846 110,089 95,912
Resource Recovery
Waste recycled (tons per month) 7,074 6,576 7,312 7,824 7,043 7,244 6,792 5,084 5,241 5,825Landfill waste disposal (tons per month) 17,099 15,626 14,614 13,891 14,607 14,894 15,163 16,690 17,172 19,050
Note:
(1) Beginning in FY 12‐13 Public Works no longer tracks flood control work requests.
Sources:
Various Department Personnel, County of Santa Barbara
188

COUNTY OF SANTA BARBARA, CALIFORNIA
CAPITAL ASSETS AND INFRASTRUCTURE STATISTICS BY FUNCTION/PROGRAM (UNAUDITED)
LAST TEN FISCAL YEARS
2008‐09 2009‐10 2010‐11 2011‐12 2012‐13 2013‐14 2014‐15 2015‐16 2016‐17 2017‐18
Function/Program
Policy & executive
Buildings Occupied with general government and support services
Public safety
Court buildings 7 7 7 7 7 7 7 7 7 7 Other buildings 5 5 5 5 5 5 5 5 5 5 Fire stations 16 16 16 16 16 16 16 16 16 16 Fire trucks 43 42 42 42 42 42 42 41 41 43 Ambulances 4 4 4 6 6 6 6 6 6 6 Sheriff sub stations 3 3 4 4 4 4 4 4 4 4 Patrol units 49 49 49 49 49 49 52 52 60 60 Aircrafts 5 6 6 6 6 6 6 6 6 6 Jail and detention facilities 6 6 6 6 6 6 6 6 6 6 Administration buildings 9 9 9 9 9 9 9 9 9 9
Health & public assistance
Clinics 7 7 7 7 7 7 7 9 9 9 Administration buildings 5 5 5 5 5 5 5 5 5 5
Community resources & public facilities
Public parks & open space acreage 2,469 2,469 1,798 2,027 2,122 2,122 2,122 2,122 2,122 2,122 Day use & camping parks 22 23 25 26 26 26 26 26 26 26 Open space areas (County developed) 17 18 42 43 45 45 45 45 45 45 Outdoor events center 1 1 1 1 1 1 1 1 1 1 Veterans buildings 3 3 3 3 3 3 3 3 3 3 Seawalls 2 2 2 2 2 2 2 2 2 2 Road lane miles 1,685 1,685 1,685 1,670 1,671 1,671 1,671 1,671 1,651 1,650 Bridges 112 112 113 113 115 115 115 115 115 118 Traffic signals 26 26 26 43 44 44 44 44 44 43 Roads heavy equipment 49 51 51 51 43 43 43 43 43 48 Sanitary sewers (miles of collection) 121 121 121 121 129 129 129 129 129 129 Treatment capacity (million gallons per day) 4 4 4 4 4 4 4 4 4 4 Resource Recovery heavy equipment 82 84 73 78 72 69 57 58 59 71
General government & support services
Buildings 5 5 5 7 7 7 7 7 7 7
Notes:
Buildings include those that are capitalized but exclude real property that is leased.
Sources:
Various Department Personnel, County of Santa Barbara
189

190

Glo
ssary
Glossary

COUNTY OF SANTA BARBARA | COMPREHENSIVE ANNUAL FINANCIAL REPORT FISCAL YEAR ENDED JUNE 30, 2018
GLOSSARY
ACCOUNTS PAYABLE ‐ A short‐term liability account reflecting amounts owed to private persons or organizations for goods and services received by a government. ACCOUNTS RECEIVABLE ‐ An asset account reflecting amounts due from private persons or organizations for goods and services furnished by a government (but not including amounts due from other funds or other governments). ACCRUAL BASIS OF ACCOUNTING ‐ The recording of the financial effects of a government of transactions and other events and circumstances that have cash consequences for the government in the periods in which those transactions, events, and circumstances occur, rather than only in the periods in which cash is received or paid by the government. ACCUMULATED DEPRECIATION ‐ A contra‐asset account used to report the accumulation of periodic credits to reflect the expiration of the estimated service life of capital assets. ACTIVE EMPLOYEES ‐ Individuals employed at the end of the reporting or measurement period, as applicable. ACTUARIAL PRESENT VALUE OF PROJECTED BENEFIT PAYMENTS ‐ Projected benefit payments discounted to reflect the expected effects of the time value (present value) of money and the probabilities of payment. ACTUARIAL VALUATION ‐ The determination, as of a point in time (the actuarial valuation date), of the service cost, total pension liability or total OPEB liability, and related actuarial present value of projected benefit payments for pensions or OPEB performed in conformity with Actuarial Standards of Practice unless otherwise specified by the GASB. ACTUARIAL VALUATION DATE ‐ The date as of which an actuarial valuation is performed. ACTUARIALLY DETERMINED CONTRIBUTION ‐ A target or recommended contribution to either a defined benefit pension plan or a defined benefit OPEB plan for the reporting period, determined in conformity with Actuarial Standards of Practice based on the most recent measurement available when the contribution for the reporting period was adopted. ADVANCE FROM OTHER FUNDS ‐ A liability account used to record noncurrent portions of a long‐term loan from one fund to another fund within the same reporting entity. See DUE TO OTHER FUNDS and INTERFUND RECEIVABLE/PAYABLE. ADVANCE TO OTHER FUNDS ‐ An asset account used to record noncurrent portions of a long‐term loan from one fund to another fund within the same reporting entity. See DUE FROM OTHER FUNDS and INTERFUND RECEIVABLE/PAYABLE. AGENCY FUND ‐ A fund normally used to account for assets held by a government as an agent for individuals, private organizations, or other governments and/or other funds. AGENT MULTIPLE‐EMPLOYER PLAN ‐ A multiple‐employer defined benefit OPEB plan that is administered through a trust that meets the criteria of GASB Statement No. 75 and in which OPEB plan assets are pooled for investment purposes but separate accounts are maintained for each individual employer so that each employer’s share of the pooled assets is legally available to pay the benefits of only its employees. AMORTIZATION ‐ The portion of the cost of a limited‐life or intangible asset charged as an expense during a particular period. The reduction of debt by regular payments of principal and interest sufficient to retire the debt by maturity. ANNUAL OPEB COST ‐ An accrual‐basis measure of the periodic cost of an employer’s participation in a defined benefit OPEB plan. ANNUAL REQUIRED CONTRIBUTIONS (ARC) ‐ Term used in connection with other postemployment benefit plans to describe the amount an employer must contribute in a given year.
APPROPRIATION ‐ A legal authorization granted by a legislative body to make expenditures and to incur obligations for specific purposes. An appropriation usually is limited in amount and time it may be expended. ASSESSED VALUATION ‐ A valuation set upon real estate or other property by a government as a basis for levying taxes. ASSIGNED FUND BALANCE ‐ Amounts that are constrained by the County’s intent to be used for specific purposes. The intent can be established at either the highest level of decision‐making authority, or by a body or an official designated for that purpose. This is also the classification for residual funds in the County’s special revenue funds. AUDITOR’S REPORT ‐ In the context of a financial audit, a statement by the auditor describing the scope of the audit and the auditing standards applied in the examination, and setting forth the auditor's opinion on the fairness of presentation of the financial information in conformity with GAAP or some other comprehensive basis of accounting. BALANCE SHEET ‐ The financial statement disclosing the assets, liabilities, and equity of an entity at a specified date in conformity with GAAP. BASIC FINANCIAL STATEMENTS (BFS) ‐ The minimum combination of financial statements and note disclosures required for fair presentation in conformity with GAAP. Basic financial statements have three components: governmentwide financial statements, fund financial statements, and notes to the financial statements. BASIS OF ACCOUNTING ‐ A term used to refer to when revenues, expenditures, expenses, and transfers, and the related assets and liabilities, are recognized in the accounts and reported in the financial statements. Specifically, it relates to the timing of the measurements made, regardless of the nature of the measurement, on either the cash or the accrual method. BENEFICIAL INTEREST ‐ The right to a portion of the benefits from donated resources pursuant to a split‐interest agreement in which the donor enters into a trust or other legally enforceable agreement with characteristics that are equivalent to a split‐interest agreement and transfers the resources to an intermediary. BUDGET ‐ A plan of financial operation embodying an estimate of proposed expenditures for a given period and the proposed means of financing them. Used without any modifier, the term usually indicates a financial plan for a single fiscal year. The term "budget" is used in two senses in practice. Sometimes it designates the financial plan presented to the appropriating governing body for adoption, and sometimes, the plan finally approved by that body. BUDGETARY CONTROL ‐ The control or management of a government or enterprise in accordance with an approved budget to keep expenditures within the limitations of available appropriations and available revenues. BUSINESS‐TYPE ACTIVITIES ‐ One of two classes of activities reported in the governmentwide financial statements. Business‐type activities are financed in whole or in part by fees charged to external parties for goods and services. These activities are usually reported in enterprise funds. CAPITAL ASSETS ‐ Long‐lived assets obtained or controlled as a result of past transactions, events, or circumstances. Capital assets include equipment, buildings, and improvements other than buildings; land; infrastructure; and intangible assets. In the private sector, these assets are referred to most often as property, plant and equipment, and intangible assets. CAPITAL EXPENDITURES ‐ Expenditures resulting in the acquisition of or addition to the government's general capital assets. CAPITALIZATION POLICY ‐ The criteria used by a government to determine which outlays should be reported as capital assets.
191
COUNTY OF SANTA BARBARA | COMPREHENSIVE ANNUAL FINANCIAL REPORT FISCAL YEAR ENDED JUNE 30, 2018
GLOSSARY
CAPITAL LEASE ‐ An agreement that conveys the right to use property, plant, or equipment, usually for a stated period of time. See LEASE‐PURCHASE AGREEMENTS. CAPITAL PROJECTS FUND ‐ A fund created to account for financial resources to be used for the acquisition or construction of major capital facilities (other than those financed by proprietary funds and trust funds). CASH BASIS OF ACCOUNTING ‐ A basis of accounting under which transactions are recognized only when cash is received or disbursed. CASH WITH FISCAL AGENT ‐ An asset account reflecting deposits with fiscal agents, such as commercial banks, for the payment of bond principal and interest. CERTIFICATE OF ACHIEVEMENT FOR EXCELLENCE IN FINANCIAL REPORTING PROGRAM ‐ A voluntary program administered by the GFOA to encourage governments to publish efficiently organized and easily readable CAFRs/Component Unit Financial Reports (CUFRs) and to provide technical assistance and peer recognition to the finance officers preparing them. CHANGE IN THE FAIR VALUE OF INVESTMENTS ‐ The difference between the fair value of investments at the beginning of the year and at the end of the year, taking into consideration investment purchases, sales, and redemptions. CLOSED AMORTIZATION PERIOD ‐ Term used in connection with the unfunded actuarial accrued liability associated with defined benefit pension and other postemployment benefit plans. A specific number of years that is counted from one date and, therefore, declines to zero with the passage of time. For example, if the amortization period is initially 30 years on a closed basis, 29 years remain after the first year, 28 years after the second year, and so forth. COLLECTIVE DEFERRED OUTFLOWS OF RESOURCES AND DEFERRED INFLOWS OF RESOURCES RELATED TO PENSIONS AND OPEB ‐ Deferred outflows of resources and deferred inflows of resources related to pensions or OPEB arising from certain changes in the collective net pension liability or the collective net OPEB liability. COLLECTIVE NET PENSION OR OPEB LIABILITY ‐ The net pension or OPEB liability for benefits provided through (1) a cost‐sharing pension or OPEB plan or (2) a single‐employer or agent pension or OPEB plan in circumstances in which there is a special funding situation. COLLECTIVE PENSION OR OPEB EXPENSE – Pension or OPEB expense arising from certain changes in the collective net pension or OPEB liability. COLLECTIVE TOTAL PENSION LIABILITY ‐ The total pension liability for benefits provided through (a) a pension or plan that is used to provide pensions to the employees of a primary government and its component units or (b) a pension plan in circumstances in which there is a special funding situation. COMMITTED FUND BALANCE ‐ Amounts that can only be used for specific purposes determined by formal action of the County’s highest level of decision‐making authority (the Board of Supervisors) and that remain binding unless removed in the same manner. The underlying action that imposed the limitation needs to occur no later than the close of the reporting period. COMPENSATED ABSENCES ‐ Absences, such as vacation, illness, and holidays, for which it is expected employees will be paid. The term does not encompass severance or termination pay, postretirement benefits, deferred compensation, or other long‐term fringe benefits, such as group insurance and long‐term disability pay. COMPREHENSIVE ANNUAL FINANCIAL REPORT (CAFR) ‐ A CAFR is a financial report that encompasses all funds and component units of the government. It contains (a) the basic financial statements and required supplementary information, (b) combining statements to support columns in the basic financial statements that aggregate information from more than one fund or component unit, and (c) individual fund statements as needed. It is the governmental unit’s official annual
report and it also contains introductory information, schedules necessary to demonstrate compliance with finance‐related legal and contractual provisions, and statistical data. CONTINGENT LIABILITY ‐ Items that may become liabilities as a result of conditions undetermined at a given date, such as guarantees, pending lawsuits, judgments under appeal, unsettled disputed claims, unfilled purchase orders, and uncompleted contracts. Contingent liabilities should be disclosed within the financial statements (including the notes) when there is a reasonable possibility a loss may have been incurred. Guarantees, however, should be disclosed even though the possibility of loss may be remote. CONTRIBUTION DEFICIENCIES ‐ The difference between the annual required contributions (ARC) of the employer(s), and the employer’s actual contributions in relation to the ARC. CONTRIBUTIONS ‐ Additions to a pension or OPEB plan’s fiduciary net position for amounts from employers, nonemployer contributing entities (for example, state government contributions to a local government pension plan), or employees. Contributions can result from cash receipts by the pension or OPEB plan or from recognition by the pension or OPEB plan of a receivable from one of these sources. COST‐OF‐LIVING ADJUSTMENTS ‐ Postemployment benefit changes intended to adjust benefit payments for the effects of inflation. COST‐SHARING MULTIPLE‐EMPLOYER DEFINED BENEFIT PENSION PLAN (COST‐SHARING PENSION PLAN) ‐ A multiple‐employer defined benefit pension plan in which the pension obligations to the employees of more than one employer are pooled and pension plan assets can be used to pay the benefits of the employees of any employer that provides pensions through the pension plan. COVERED PAYROLL ‐ Term used in connection with defined benefit pension and other postemployment benefit plans to describe all elements of annual compensation paid to active employees on which contributions to a plan are based. CURRENT FINANCIAL RESOURCES MEASUREMENT FOCUS ‐ Measurement focus according to which the aim of a set of financial statements is to report the near‐term (current) inflows, outflows, and balances of expendable (spendable) financial resources. The current financial resources measurement focus is unique to accounting and financial reporting for state and local governments and is used solely for reporting the financial position and results of operations of governmental funds. DEBT ‐ An obligation resulting from the borrowing of money or from the purchase of goods and services. Debts of governments include bonds, time warrants, and notes. DEBT SERVICE FUND ‐ A fund established to account for the accumulation of resources for, and the payment of, general long‐term debt principal and interest. DEFERRED CHARGES ‐ Expenditures that are not chargeable to the fiscal period in which they were made but that are carried as an asset on the balance sheet, pending amortization or other disposition (e.g., bond issuance costs). Deferred charges differ from prepaid items in that they usually extend over a long period of time (more than five years) and are not regularly recurring costs of operation. DEFICIT ‐ (1) The excess of the liabilities of a fund over its assets. (2) The excess of expenditures over revenues during an accounting period or, in the case of proprietary funds, the excess of expenses over revenues during an accounting period. DEFINED BENEFIT OPEB ‐ OPEB for which the benefits that the employee will receive at or after separation from employment are defined by the benefit terms. The OPEB may be stated as (a) a specified dollar amount; (b) an amount that is calculated based on one or more factors such as age, years of service, and compensation; or (c) a type or level of coverage such as prescription drug coverage or a percentage of health insurance premiums.
192

COUNTY OF SANTA BARBARA | COMPREHENSIVE ANNUAL FINANCIAL REPORT FISCAL YEAR ENDED JUNE 30, 2018
GLOSSARY
DEFINED BENEFIT OPEB PLAN – OPEB plans that are used to provide defined benefit OPEB. DEFINED BENEFIT PENSION PLAN ‐ Pension plans that are used to provide defined benefit pensions. DEFINED BENEFIT PENSIONS ‐ Pensions for which the income or other benefits that the employee will receive at or after separation from employment are defined by the benefit terms. The pensions may be stated as a specified dollar amount or as an amount that is calculated based on one or more factors such as age, years of service, and compensation. DEPRECIATION ‐ (1) Expiration in the service life of capital assets, other than wasting assets, attributable to wear and tear, deterioration, action of the physical elements, inadequacy, and obsolescence. (2) The portion of the cost of a capital asset, other than a wasting asset, charged as an expense during a particular period. In accounting for depreciation, the cost of a capital asset, less any salvage value, is prorated over the estimated service life of such an asset, and each period is charged with a portion of such cost. Through this process, the entire cost of the asset is ultimately charged off as an expense. DISCOUNT RATE ‐ A yield or index rate for 20‐year, tax‐exempt general obligation municipal bonds with an average rating of AA/Aa or higher (or equivalent quality on another rating scale). DUE FROM OTHER FUNDS ‐ An asset account reflecting amounts owed to a particular fund by another fund for goods sold or services rendered. This account includes only short‐term obligations on open account, not interfund loans. DUE TO OTHER FUNDS ‐ A liability account reflecting amounts owed by a particular fund to another fund for goods sold or services rendered. This account includes only short‐term obligations on open account, not interfund loans. ECONOMIC RESOURCES MEASUREMENT FOCUS ‐ Measurement focus under which the aim of a set of financial statements is to report all inflows, outflows, and balances affecting or reflecting an entity’s net position. The economic resources measurement focus is used for proprietary and fiduciary funds, as well as for governmentwide financial reporting. It is also used by business enterprises in the private sector. EMPLOYER’S CONTRIBUTIONS ‐ Contributions made in relation to the annual required contributions of the employer (ARC). An employer has made a contribution in relation to the ARC if the employer has (a) made payments of benefits directly to or on behalf of a retiree or beneficiary, (b) made premium payments to an insurer, or (c) irrevocably transferred assets to a trust, or equivalent arrangement, in which plan assets are dedicated to providing benefits to retirees and their beneficiaries in accordance with the terms of the plan and are legally protected from creditors of the employer(s) or plan administrator. ENCUMBRANCES ‐ Commitments related to unperformed (executory) contracts for goods or services. Used in budgeting, encumbrances are not GAAP expenditures or liabilities, but represent the estimated amount of expenditures ultimately to result if unperformed contracts in process are completed. ENTERPRISE FUND ‐ Proprietary fund type used to report an activity for which a fee is charged to external users for goods and services. ENTRY AGE ACTUARIAL COST METHOD ‐ A method under which the actuarial present value of the projected benefits of each individual included in an actuarial valuation is allocated on a level basis over the earnings or service of the individual between entry age and assumed exit age(s). The portion of this actuarial present value allocated to a valuation year is called the normal cost. The portion of this actuarial present value not provided for at a valuation date by the actuarial present value of future normal costs is called the actuarial accrued liability. EXCHANGE‐LIKE TRANSACTION ‐ Transaction in which there is an identifiable exchange between the reporting government and another party, but the values exchanged may not be quite equal or the direct
benefits of the exchange may not be exclusively for the parties to the exchange. EXPENDITURES ‐ Decreases in net financial resources. Expenditures include current operating expenses requiring the present or future use of net current assets, debt service, and capital outlays, and intergovernmental grants, entitlement, and shared revenues. EXPENDITURE‐DRIVEN GRANTS ‐ Government‐mandated or voluntary non‐exchange transactions in which expenditure is the prime factor for determining eligibility. Also referred to as reimbursement grants. EXPENSES ‐ Outflows or other using up of assets or incurrence of liabilities (or a combination of both) from delivering or producing goods, rendering services, or carrying out other activities that constitute the entity's ongoing major or central operations. EXTERNAL AUDITORS ‐ Independent auditors typically engaged to conduct an audit of a government’s financial statements. EXTERNAL INVESTMENT POOL ‐ An arrangement that commingles (pools) the moneys of more than one legally separate entity and invests, on the participants’ behalf, in an investment portfolio; one or more of the participants is not part of the sponsor’s reporting entity. An external investment pool can be sponsored by an individual government, jointly by more than one government, or by a nongovernmental entity. An investment pool that is sponsored by an individual state or local government is an external investment pool if it includes participation by a legally separate entity that is not part of the same reporting entity as the sponsoring government. If a government‐sponsored pool includes only the primary government and its component units, it is an internal investment pool and not an external investment pool. FAIR VALUE ‐ The amount at which a financial instrument could be exchanged in a current transaction between willing parties, other than in a forced or liquidation sale. FIDUCIARY FUNDS ‐ The trust and agency funds used to account for assets held by a government unit in a trustee capacity or as an agent for individuals, private organizations, other government units, and/or other funds. FINANCIAL RESOURCES ‐ Resources that are or will become available for spending. Financial resources include cash and resources ordinarily expected to be converted to cash (e.g., receivables or investments). Financial resources may also include inventories and prepaids (because they obviate the need to expend current available resources). FISCAL AGENT ‐ A fiduciary agent, usually a bank or county treasurer, who performs the function of paying debt principal and interest when due. FUND ‐ A fiscal and accounting entity with a self‐balancing set of accounts in which cash and other financial resources, all related liabilities and residual equities, or balances, and changes therein, are recorded and segregated to carry on specific activities or attain certain objectives in accordance with special regulations, restrictions, or limitations. FUND BALANCE ‐ The difference between fund assets and fund liabilities of governmental and similar trust funds. FUND FINANCIAL STATEMENTS ‐ Basic financial statements presented on the basis of funds. Term used in contrast with governmentwide financial statements. FUND TYPE ‐ Any one of seven categories into which all funds are classified in governmental accounting. The seven fund types are: general, special revenue, debt service, capital projects, enterprise, internal service, and trust and agency. FUNDING POLICY ‐ The program for the amounts and timing of contributions to be made by plan members, employer(s), and other contributing entities (for example, state government contributions to a local government plan) to provide the benefits specified by an OPEB plan.
193
COUNTY OF SANTA BARBARA | COMPREHENSIVE ANNUAL FINANCIAL REPORT FISCAL YEAR ENDED JUNE 30, 2018
GLOSSARY
GENERAL FUND ‐ The general fund is one of five governmental fund types and typically serves as the chief operating fund of the government. The general fund is used to account for all financial resources except those required to be accounted for in another fund. GENERAL REVENUES ‐ All revenues that are not required to be reported as program revenues. All taxes, even those that are levied for a specific purpose, are general revenues and should be reported by type of tax (e.g., property tax, sales tax, and transient occupancy tax). All other nontax revenues (including interest, grants, and contributions) that do not meet the criteria to be reported as program revenues should also be reported as general revenues. GENERALLY ACCEPTED ACCOUNTING PRINCIPLES (GAAP) ‐ The conventions, rules, and procedures that serve as the norm for the fair presentation of financial statements. The various sources of GAAP for state and local governments are set forth by Statement of Accounting Standards (SAS) No. 69, The Meaning of “Present Fairly in Conformity with Generally Accepted Accounting Principles” in the Independent Auditor’s Report. GOVERNMENT FINANCE OFFICERS ASSOCIATION (GFOA) ‐ An association of public finance professionals founded in 1906 as the Municipal Finance Officers Association. The GFOA has played a major role in the development and promotion of GAAP for state and local governments since its inception and has sponsored the Certificate of Achievement for Excellence in Financial Reporting Program since 1946. GOVERNMENTAL ACCOUNTING ‐ The composite activity of analyzing, recording, summarizing, reporting, and interpreting the financial transactions of governments. GOVERNMENTAL ACCOUNTING STANDARDS BOARD (GASB) ‐ The ultimate authoritative accounting and financial reporting standard‐setting body for state and local governments. The GASB was established in June 1984 to replace the National Council on Governmental Accounting (NCGA). GOVERNMENTAL ACTIVITIES ‐ Activities generally financed through taxes, intergovernmental revenues, and other non‐exchange revenues. These activities are usually reported in governmental funds and internal service funds. GOVERNMENTAL FUNDS ‐ Funds generally used to account for tax‐supported activities. The five different types of governmental funds are as follows: the general fund, special revenue funds, debt service funds, capital projects funds, and permanent funds. GOVERNMENTWIDE FINANCIAL STATEMENTS ‐ Financial statements that incorporate all of a government’s governmental and business‐type activities, as well as its non‐fiduciary component units. There are two basic governmentwide financial statements: the statement of net position and the statement of activities. Both basic governmental financial statements are presented using the economic resources measurement focus and the accrual basis of accounting. HEALTHCARE COST TREND RATES ‐ The rates of change in per capita health claims costs over time as a result of factors such as medical inflation, utilization of healthcare services, plan design, and technological developments. IMPROVEMENT ‐ An addition made to, or change made in, a capital asset, other than maintenance, to prolong its life or to increase its efficiency or capacity. The cost of the addition or change is added to the book value of the asset. INACTIVE EMPLOYEES ‐ Terminated individuals that have accumulated benefits but are not yet receiving them, and retirees or their beneficiaries currently receiving benefits. INDIRECT EXPENSES ‐ Expenses that cannot be specifically associated with a given service, program, or department and thus, cannot be clearly associated with a particular functional category.
INFRASTRUCTURE ‐ Long‐lived capital assets that normally are stationary in nature and normally can be preserved for a significantly greater number of years than most capital assets. Examples of infrastructure assets include roads, bridges, tunnels, drainage systems, water and sewer systems, dams, and lighting systems. INTERFUND RECEIVABLE/PAYABLE ‐ Short‐term loans made by one fund to another, or the current portion of an advance to or from another fund. INTERFUND TRANSFERS ‐ Flow of assets (such as cash or goods) between funds and blended component units of the primary government without equivalent flows of assets in return and without a requirement for payment. INTERMEDIARY ‐ The trustee, fiscal agent, government, or any other legal or natural person that is holding and administering donated resources pursuant to a split‐interest agreement. An intermediary is not required to be a third party. INTERNAL SERVICE FUND ‐ A fund used to account for the financing of goods or services provided by one department or agency to other departments or agencies of a government, or to other governments, on a cost‐reimbursement basis. IRREVOCABLE SPLIT‐INTEREST AGREEMENT ‐ A split‐interest agreement in which the donor has not reserved, or conferred to another person, the right to terminate the agreement at will and have the assets returned to the donor or a third party. JOINT VENTURE ‐ A legal entity or other contractual arrangement in which a government participates as a separate and specific activity for the benefit of the public or service recipients and in which the government retains an ongoing financial interest. LAPSE ‐ As applied to appropriations, the automatic termination of an appropriation. Except for indeterminate appropriations and continuing appropriations, an appropriation is made for a certain period of time. At the end of this period, any unexpended or unencumbered balance thereof lapses, unless otherwise provided by law. LEAD INTEREST ‐ A type of beneficial interest that confers the right to receive all or a portion of the benefits of resources during the term of a split‐interest agreement. LEASE‐PURCHASE AGREEMENTS ‐ Contractual agreements that are termed leases, but that in substance are purchase contracts. LEGAL LEVEL OF BUDGETARY CONTROL ‐ The level at which spending in excess of budgeted amounts would be a violation of law. LEVEL OF BUDGETARY CONTROL ‐ The level at which a government’s management may not reallocate resources without special approval from the legislative body. LEVEL PERCENTAGE OF PROJECTED PAYROLL AMORTIZATION METHOD ‐ Amortization payments are calculated so that they are a constant percentage of the projected payroll of active plan members over a given number of years. The dollar amount of the payments generally will increase over time as payroll increases due to inflation; in dollars adjusted for inflation, the payments can be expected to remain level. LIABILITIES ‐ Probable future sacrifices of economic benefits, arising from present obligations of a particular entity to transfer assets or provide services to other entities in the future as a result of past transactions or events. LIFE‐CONTINGENT TERM ‐ A term specifying that the termination of a split‐interest agreement is contingent upon the occurrence of a specified event, commonly the death of either the donor or other lead interest beneficiary.
194
COUNTY OF SANTA BARBARA | COMPREHENSIVE ANNUAL FINANCIAL REPORT FISCAL YEAR ENDED JUNE 30, 2018
GLOSSARY
LOANS RECEIVABLE ‐ An asset account reflecting amounts loaned to individuals or organizations external to a government, including notes taken as security for such loans. Loans to other funds and governments should be recorded and reported separately. MAJOR FUND ‐ A governmental fund or enterprise fund reported as a separate column in the basic fund financial statements. The general fund is always a major fund. Otherwise, major funds are funds whose revenues/expenditures, assets, or liabilities are at least 10 percent of corresponding totals for all governmental or enterprise funds and at least 5 percent of the aggregate amount for all governmental and enterprise funds for the same item. Any other governmental or enterprise fund may be reported as a major fund if the government’s officials believe that fund is particularly important to financial statement users. MANAGEMENT’S DISCUSSION AND ANALYSIS (MD&A) ‐ A component of required supplementary information used to introduce the basic financial statements and to provide an analytical overview of the government’s financial activities. MEASUREMENT FOCUS ‐ A way of presenting an entity’s financial performance and position by considering which resources are measured (financial or economic) and when the effects of transactions or events involving those resources are recognized (the basis of accounting). The measurement focus of governmentwide financial statements, proprietary fund financial statements, and fiduciary fund financial statements is economic resources. The measurement focus of governmental fund financial statements is current financial resources. MEASUREMENT PERIOD ‐ The period between the prior and the current measurement dates. MODIFIED ACCRUAL BASIS OF ACCOUNTING ‐ The accrual basis of accounting adapted to the governmental fund‐type measurement focus. Under it, revenues and other financial resource increments (e.g., bond issue proceeds) are recognized when they become susceptible to accrual, that is when they become both "measurable" and "available to finance expenditures of the current period." "Available" means collectible in the current period or soon enough thereafter to be used to pay liabilities of the current period. Generally, expenditures are recognized when the fund liability is incurred. All governmental funds, expendable trust funds and agency funds are accounted for using the modified accrual basis of accounting. MULTIPLE‐EMPLOYER DEFINED BENEFIT PENSION PLAN ‐ A defined benefit pension plan that is used to provide pensions to the employees of more than one employer. NET INVESTMENT IN CAPITAL ASSETS ‐ One of three components of net position that must be reported in both governmentwide and proprietary fund financial statements. Related debt, for this purpose, includes the outstanding balances of any bonds, mortgages, notes, or other borrowings that are attributable to the acquisition, construction, or improvement of capital assets of the government. NET OPEB LIABILITY ‐ The liability of employers and nonemployer contributing entities to employees for benefits provided through a defined benefit OPEB plan that is administered through a trust that meets the criteria of GASB Statement No. 75. NET PENSION LIABILITY ‐ The liability of employers and nonemployer contributing entities to employees for benefits provided through a defined benefit pension plan. NONSPENDABLE FUND BALANCE ‐ Amounts that cannot be spent because they are either (a) not spendable in form or (b) legally or contractually required to be maintained intact. OTHER FINANCING SOURCES ‐ An increase in current financial resources that is reported separately from revenues to avoid distorting revenue trends. The use of the other financing sources category is limited to items so classified by GAAP.
OTHER FINANCING USES ‐ A decrease in current financial resources that is reported separately from expenditures to avoid distorting expenditure trends. The use of other financing uses category is limited to items so classified by GAAP. OTHER POSTEMPLOYMENT BENEFITS (OPEB) ‐ Benefits other than retirement income (such as death benefits, life insurance, disability, and long‐term care) that are paid in the period after employment and that are provided separately from a pension plan, as well as postemployment healthcare benefits paid in the period after employment (if any), regardless of the manner in which they are provided. Other postemployment benefits do not include termination benefits or termination payments for sick leave. OPEB PLANS ‐ Arrangements through which OPEB is determined, assets dedicated for OPEB (if any) are accumulated and managed, and benefits are paid as they come due. OVERLAPPING DEBT ‐ The proportionate share that property within a government must bear of the debts of all local governments located wholly or in part within the geographic boundaries of the reporting government. Except for special assessment debt, the amount of debt of each unit applicable to the reporting unit is arrived at by (1) determining what percentage of the total assessed value of the overlapping jurisdiction lies within the limits of the reporting unit, and (2) applying this percentage to the total debt of the overlapping jurisdiction. Special assessment debt is allocated on the basis of the ratio of assessment receivable in each jurisdiction, which will be used wholly or in part to pay off the debt, to total assessments receivable, which will be used wholly or in part for this purpose. PAY‐AS‐YOU‐GO ‐ a method of financing a pension plan under which the contributions to the plan are generally made at about the same time and in about the same amount as benefit payments and expenses becoming due. PAYROLL GROWTH RATE ‐ an actuarial assumption with respect to future increases in total covered payroll attributable to inflation; used in applying the level percentage of projected payroll amortization method. PENSION BENEFITS ‐ Retirement income and all other benefits, including disability benefits, death benefits, life insurance, and other ancillary benefits, except healthcare benefits, that are provided through a defined benefit pension plan to plan members and beneficiaries after termination of employment or after retirement. Postemployment healthcare benefits are considered other postemployment benefits, whether they are provided through a defined benefit pension plan or another type of plan. PENSION PLANS ‐ Arrangements through which pensions are determined, assets dedicated for pensions are accumulated and managed, and benefits are paid as they come due. PENSIONS ‐ Retirement income and, if provided through a pension plan, postemployment benefits other than retirement income (such as death benefits, life insurance, and disability benefits). Pensions do not include postemployment healthcare benefits and termination benefits. PERIOD‐CERTAIN TERM ‐ A term specifying that the termination of a split‐interest agreement occurs after a specified period. (For example, a number of years.) PLAN MEMBERS ‐ Individuals that are covered under the terms of a pension or OPEB plan. Plan members generally include (a) employees in active service (active plan members) and (b) terminated employees who have accumulated benefits but are not yet receiving them and retirees or their beneficiaries currently receiving benefits (inactive plan members). POSTEMPLOYMENT – The period after employment. POSTEMPLOYMENT BENEFIT CHANGES ‐ Adjustments to the pension or OPEB of an inactive employee.
195
COUNTY OF SANTA BARBARA | COMPREHENSIVE ANNUAL FINANCIAL REPORT FISCAL YEAR ENDED JUNE 30, 2018
GLOSSARY
POSTEMPLOYMENT HEALTHCARE BENEFITS ‐ Medical, dental, vision, and other health‐related benefits paid subsequent to the termination of employment. PROJECTED BENEFIT PAYMENTS ‐ All benefits estimated to be payable through the pension or OPEB plan to current active and inactive employees as a result of their past service and their expected future service. PROGRAM REVENUES ‐ Term used in connection with the governmentwide statement of activities. Revenues that derive directly from the program itself or from parties outside the reporting government’s taxpayers or citizenry, as a whole; they reduce the net cost of the function to be financed from the government’s general revenues. PROJECTED BENEFIT PAYMENTS ‐ All benefits estimated to be payable through the pension plan to current active and inactive employees as a result of their past service and their expected future service. PROPRIETARY FUNDS ‐ Funds that focus on the determination of operating income, changes in net position (or cost recovery), financial position, and cash flows. There are two different types of proprietary funds: enterprise funds and internal service funds. REAL RATE OF RETURN ‐ The rate of return on an investment after adjustment to eliminate inflation. REBATABLE ARBITRAGE ‐ A term used in connection with the reinvestment of the proceeds of tax‐exempt debt. A requirement to remit to the federal government interest revenue in excess of interest costs when the proceeds from the sale of tax‐exempt securities are reinvested in a taxable money market instrument with a materially higher yield. REMAINDER INTEREST ‐ A type of beneficial interest that confers the right to receive all or a portion of the resources remaining at the end of a split‐interest agreement’s term. REPORTING ENTITY ‐ The oversight unit and all of its component units, if any, that are combined in the CAFR/BFS. REQUIRED SUPPLEMENTARY INFORMATION ‐ Consists of statements, schedules, statistical data, or other information that according to the GASB is necessary to supplement, although not required to be a part of, the basic financial statements. RESTRICTED ASSETS ‐ Assets whose use is subject to constraints that are either (a) externally imposed by creditors (such as through debt covenants), grantors, contributors, or laws or regulations of other governments or (b) imposed by law through constitutional provisions or enabling legislation. RESTRICTED FUND BALANCE ‐ Amounts with constraints placed on their use that are either (a) externally imposed by creditors, grantors, contributors, or laws or regulations of other governments or (b) imposed by law through constitutional provisions or enabling legislation. RESTRICTED NET POSITION ‐ A component of net position calculated by reducing the carrying value of restricted assets by the amount of any related debt outstanding. RETAINED EARNINGS ‐ An equity account reflecting the accumulated earnings of an enterprise or internal service fund. REVENUE BONDS ‐ Bonds whose principal and interest are payable exclusively from earnings of an enterprise fund. In addition to a pledge of revenues, such bonds sometimes contain a mortgage on the enterprise fund's property. RISK MANAGEMENT ‐ All the ways and means used to avoid accidental loss or to reduce its consequences if it does occur.
SELF‐INSURANCE ‐ A term often used to describe the retention by an entity of a risk of loss arising out of the ownership of property or from some other cause, instead of transferring that risk to an independent third party through the purchase of an insurance policy. It is sometimes accompanied by the setting aside of assets to fund any related losses. Because no insurance is involved, the term self‐insurance is a misnomer. SERVICE COSTS ‐ The portions of the actuarial present value of projected benefit payments that are attributed to valuation years. SERVICE LIFE – The average remaining years of service of all members of the retirement plan (both current employees and retirees). SINGLE AUDIT ‐ An audit performed in accordance with Title 2 U.S. Code of Federal Regulations. The Single Audit allows or requires governments (depending on the amount of federal assistance received) to have one audit performed to meet the needs of all federal agencies. SPECIAL DISTRICT ‐ An independent unit of local government organized to perform a single government function or a restricted number of related functions. Special districts usually have the power to incur debt and levy taxes; however, certain types of special districts are entirely dependent upon enterprise earnings and cannot impose taxes. Examples of special districts are water districts, drainage districts, flood control districts, hospital districts, fire protection districts, cemetery districts, transit authorities, port authorities, and electric power authorities. SPECIAL REVENUE FUND ‐ A fund used to account for the proceeds of specific revenue sources (other than expendable trusts or major capital projects) that are legally restricted to expenditure for specified purposes. SPLIT‐INTEREST AGREEMENT ‐ An agreement in which the donor enters into a trust or other legally enforceable agreement (with characteristics that are equivalent to a split‐interest agreement) under which the donor transfers resources to an intermediary to administer for the benefit of at least two beneficiaries, one of which could be a government. SUBSTANTIVE PLAN ‐ Terms of an OPEB plan as understood by the employer(s) and plan members. TAX AND REVENUE ANTICIPATION NOTES (TRAN) ‐ Notes issued in anticipation of the collection of taxes and revenues, usually retirable only from tax collections, and frequently only from the proceeds of the tax and revenue levy whose collection they anticipate. TERMINATION BENEFITS‐ Inducements offered by employers to active employees to hasten the termination of services, or payments made in consequence of the early termination of services. Termination benefits include early‐retirement incentives, severance benefits, and other termination‐related benefits. TOTAL PENSION LIABILITY ‐ The portion of the actuarial present value of projected benefit payments that is attributed to past periods of employee service. TRUST FUNDS ‐ Funds used to account for assets held by a government in a trustee capacity for individuals, private organizations, other governments, and/or other funds. UNASSIGNED FUND BALANCE – The residual classification for the County’s General Fund that includes amounts not contained in the other classifications. In other funds, the unassigned classification is used only if expenditures incurred for specific purposes exceed the amounts restricted, committed, or assigned to those purposes. UNCONDITIONAL BENEFIT ‐ A right belonging to the government that cannot be taken away without the government’s consent, such as an unconditional beneficial interest.
196

COUNTY OF SANTA BARBARA | COMPREHENSIVE ANNUAL FINANCIAL REPORT FISCAL YEAR ENDED JUNE 30, 2018
GLOSSARY
UNEARNED REVENUES ‐ Resource inflows that do not yet meet the criteria for revenue recognition. In governmental funds, earned amounts also are reported as unearned revenue until they are available to liquidate liabilities of the current period. UNMODIFIED OPINION ‐ An opinion rendered without reservation by the independent auditor that financial statements are fairly presented.
UNRESTRICTED NET POSITION ‐ That portion of net position that is neither restricted nor invested in capital assets (net of related debt). VARIANCE POWER ‐ The unilateral power to redirect the benefit of the transferred resources to another beneficiary, overriding the donor’s instructions. This transfer would occur without the approval of the donor, specified beneficiaries, or any other interested party.
197

198