county of erie, new york county of erie new york
TRANSCRIPT
COUNTY OF ERIE
NEW YORK
Comprehensive Annual Financial Report
For the Year Ended December 31, 2010
MARK C. POLONCARZ
Erie County Comptroller
COUNTY OF ERIE, NEW YORK
COMPREHENSIVE ANNUAL
FINANCIAL REPORT
For the Year Ended
December 31, 2010
Prepared By:
Erie County Comptroller's Office
MARK C. POLONCARZ
Erie County Comptroller

______________________________________________________________________________________________________________________________ COUNTY OF ERIE, NEW YORK
TABLE OF CONTENTS FOR THE YEAR ENDED DECEMBER 31, 2010
INTRODUCTORY SECTION
Page
Letter of Transmittal ................................................................................................................................... i-vi
Summary of Elected Officials .................................................................................................................... viii
Organizational Chart .................................................................................................................................... ix
GFOA Certificate of Achievement ................................................................................................................ x
FINANCIAL SECTION
Independent Auditors' Report ..................................................................................................................... 1-2
Management’s Discussion and Analysis .................................................................................................. 3-11
Basic Financial Statements:
Government-wide Financial Statements:
Statement of Net Assets .............................................................................................................. 14-15
Statement of Activities ................................................................................................................ 16-17
Fund Financial Statements:
Balance Sheet – Governmental Funds ............................................................................................. 18
Reconciliation of the Balance Sheet – Governmental Funds to the Statement of Net Assets .......... 19
Statement of Revenues, Expenditures and Changes in
Fund Balances – Governmental Funds ....................................................................................... 20
Reconciliation of the Statement of Revenues, Expenditures and Changes
in Fund Balances - Governmental Funds to the Statement of Activities ..................................... 21
Statement of Revenues, Expenditures and Changes in Fund Balances – Budget and Actual
(Non-GAAP Basis of Accounting) - General Fund .................................................................... 22
Statement of Net Assets – Proprietary Funds ................................................................................... 23
Statement of Revenues, Expenses and Changes in
Fund Net Assets – Proprietary Funds .......................................................................................... 24
Statement of Cash Flows – Proprietary Funds ............................................................................ 25-26
Statement of Fiduciary Net Assets – Fiduciary Fund ...................................................................... 27
Notes to the Financial Statements .................................................................................................... 28-77
Required Supplementary Information:
Schedule of Funding Progress – Other Post-Employment Benefits ...................................................... 80
Combining and Individual Fund Statements and Schedules:
Nonmajor Governmental Funds:
Combining Balance Sheet – Nonmajor Governmental Funds .................................................... 84-87
Combining Statement of Revenues, Expenditures and Changes
in Fund Balances – Nonmajor Governmental Funds ............................................................. 88-91
Schedules of Revenues, Expenditures and Changes in
Fund Balances – Budget and Actual (Non-GAAP Basis of Accounting):
Road Special Revenue Fund .................................................................................................. 92
Sewer Special Revenue Fund ................................................................................................. 93
Downtown Mall Special Revenue Fund ................................................................................. 94
E-911 Special Revenue Fund ................................................................................................. 95
Emergency Response Special Revenue Fund ......................................................................... 96
Debt Service Fund.................................................................................................................. 97
COUNTY OF ERIE, NEW YORK _______________________________________________________________________________________________________________________________
TABLE OF CONTENTS (Concluded) FOR THE YEAR ENDED DECEMBER 31, 2010
FINANCIAL SECTION (Concluded)
Page
Combining and Individual Fund Statements and Schedules: (Concluded)
Statement of Changes in Assets and Liabilities – Agency Fund ......................................................... 100
Library Component Unit:
Balance Sheet - Component Unit ................................................................................................... 102
Reconciliation of the Balance Sheet – Library Component Unit to the Statement of Net Assets .. 103
Statement of Revenues, Expenditures and Changes in Fund Balance – Library Component Unit 104
Reconciliation of the Statement of Revenues, Expenditures and Changes
in Fund Balance - Library Component Unit to the Statement of Activities. .............................. 105
Other Component Units:
Combining Statement of Net Assets – Other Component Units .................................................... 108
Combining Statement of Activities – Other Component Units ...................................................... 109
STATISTICAL SECTION
Net Assets by Component – Last Nine Fiscal Years .................................................................... 112-113
Changes in Net Assets - Last Nine Fiscal Years .......................................................................... 114-117
Fund Balances of Governmental Funds – Last Ten Fiscal Years ................................................ 118-119
Changes in Fund Balances of Governmental Funds – Last Ten Fiscal Years .............................. 120-121
Taxable Sales by Category – Last Ten Fiscal Years .................................................................... 122-123
Assessed and Equalized Full Value of Taxable Property – Last Ten Fiscal Years ...................... 124-125
Direct and Overlapping Property Tax Rates – Last Ten Fiscal Years ................................................. 126
Principal Taxpayers – Current Year and Nine Years Ago .................................................................. 127
Property Tax Levies and Collections – Last Ten Fiscal Years ..................................................... 128-129
Ratios of Outstanding Debt by Type – Last Ten Fiscal Years ............................................................ 130
Ratios of General Bonded Debt Outstanding – Last Ten Fiscal Years ............................................... 131
Legal Debt Margin Information – Last Ten Fiscal Years ............................................................ 132-133
Pledged-Revenue Coverage – Last Ten Fiscal Years ................................................................... 134-135
Direct and Overlapping Governmental Activities Debt – As of December 31, 2010 ......................... 136
Demographic and Economic Statistics – Last Ten Calendar Years .................................................... 137
Principal Employers – Current Year and Nine Years Ago .................................................................. 137
Full-time County Government Employees by Function – Last Seven Fiscal Years ..................... 138-139
Operating Indicators by Function/Program – Last Ten Fiscal Years ........................................... 140-141
Capital Asset Statistics by Function – Last Nine Fiscal Years ..................................................... 142-143
INTRODUCTORY SECTION
This section contains the following:
LETTER OF TRANSMITTAL
SUMMARY OF ELECTED OFFICIALS
ORGANIZATIONAL CHART
GFOA CERTIFICATE OF ACHIEVEMENT

ERIE COUNTY OFFICE BUILDING ● 95 FRANKLIN STREET, BUFFALO, NEW YORK 14202
TELEPHONE: (716) 858-8400 ● FAX: (716) 858-8507 ● INTERNET: www.erie.gov
County of Erie MARK C. POLONCARZ
COMPTROLLER
June 30, 2011 Erie County Legislature 92 Franklin Street, 4th Floor Buffalo, New York 14202 Honorable Christopher C. Collins Erie County Executive 95 Franklin Street, 16th Floor Buffalo, New York 14202 Dear Honorable Members and County Executive Collins:
The Comprehensive Annual Financial Report (“CAFR”) of the County of Erie, New
York, (the “County”) for the fiscal year ended December 31, 2010 is submitted in accordance
with the requirements of Section 1202 (i) of the Erie County Charter.
INTRODUCTION
This report was prepared by the Erie County Comptroller's Office in conformance with current accounting and financial reporting principles promulgated by the Governmental Accounting Standards Board (“GASB”) and the New York Office of the State Comptroller.
County management assumes full responsibility for the completeness and reliability of the information contained in this report, based upon a comprehensive framework of internal control that it has established for this purpose. Because the cost of internal control should not exceed anticipated benefits, the objective is to provide reasonable, rather than absolute, assurance that the financial statements are free of any material misstatements. The firm of Deloitte & Touche LLP, the County’s independent auditor, has issued an
unqualified (“clean”) opinion on the County’s financial statements for the year ended December
31, 2010. The independent auditor’s report is located at the front of the financial section of this report.
i
ii
MANAGEMENT’S DISCUSSION AND ANALYSIS
Management’s Discussion and Analysis (“MD&A”) immediately follows the independent
auditor’s report and provides a narrative introduction, overview, and analysis of the basic
financial statements. MD&A complements this letter of transmittal and should be read in conjunction with it.
PROFILE OF THE GOVERNMENT
Basic Information
The County is a metropolitan center covering 1,058 square miles that is located on the western border of New York State, adjacent to Lake Erie. Situated within the County are three cities, 25 towns, and 16 villages, including the City of Buffalo, which serves as the County seat, and is the State's second most populous and largest city. The County provides a variety of mandated and discretionary services and facilities to its residents covering the areas of culture, parks and recreation, social services, police, libraries, youth, health, senior services, roads, mental health, probation, corrections, emergency services, license bureau, and sanitary sewerage. Additionally, the County operates a community college.
The County is a major New York industrial and commercial center, and is favorably located relative to the markets of both the United States and Canada. Access to these markets is enhanced by the fact that the County is among the largest rail centers in the United States; that it is provided trucking services by numerous transcontinental, international and common carriers; and that it is a focal point of international water-borne transportation.
Subject to the New York State Constitution and Laws, the County operates pursuant to a County Charter (“Charter”) and Administrative Code. Additionally, various New York State laws
govern the County to the extent that such laws are applicable to counties operating under a charter form of government. The legislative power of the County is vested in a 15-member governing board known as the County Legislature (“Legislature”), each member of which is elected for a two-year term. Principal functions of the Legislature include adoption of the annual budget, levying of taxes, review and approval of budget modifications, adoption of local laws, and authorization of the incurrence of all County indebtedness. In addition to the members of the Legislature, there are five County-wide elected officials, each elected to four-year terms: County Executive, County Comptroller, County Clerk, District Attorney, and Sheriff. The County Comptroller serves as the County’s chief fiscal, accounting, reporting and auditing officer. Component Units
Consistent with criteria promulgated in the GASB Codification, the financial statement reporting entity includes the County of Erie, New York (the primary government) and its significant component units. The County’s component units are comprised of the Buffalo and Erie County Public Library; the Erie County Medical Center Corporation and its two component units Research for Health in Erie County, Inc. and ECMC Lifeline Foundation, Inc.; two component units of the Erie Community College proprietary fund, the Auxiliary Services Corporation of Erie Community College, Inc. and the Erie Community College Foundation, Inc.; the Erie County Fiscal Stability Authority (“ECFSA”); the Erie Tobacco Asset Securitization
iii
Corporation (“ETASC”); the Erie Tax Certificate Corporation (“ETCC”) and the Buffalo and Erie
County Industrial Land Development Corporation, Inc. (“ILDC”). Additional detailed information relating to the specific organizations and the manner of inclusion (discrete presentation or blending) in the reporting entity as component units, and the basis for making such determinations, are also discussed in Note I(A) to the financial statements. Erie County Fiscal Stability Authority
In July 2005, the New York State Legislature and Governor created the Erie County Fiscal Stability Authority (“ECFSA”) to monitor the County’s finances. Under the Erie County Fiscal
Stability Authority Act (“Act”), the legislation establishing the ECFSA, the County is required to develop and submit a Four Year Financial Plan to ECFSA for its approval. Under the Act, if the County fails to meet certain criteria, or if the County meets other criteria such as the County having “incurred a major operating funds deficit of one percent or more in the aggregate results of operations of such funds of the County during its fiscal year,” (§ 3959 of the Act) the ECFSA may
declare and enter into a “control period.” Under the Act, in a control period, the ECFSA may
engage in a number of actions including establishing a wage and/or hiring freeze, setting maximum levels of County spending and requiring its approval for any County borrowing. On November 3, 2006, citing deficiencies in the County’s 2007-2010 Four Year Financial Plan, ECFSA imposed a control period on Erie County, which continued until June 2009.
After more than six months in advisory status, the ECFSA threatened to return to a
control period in February 2010 due to concerns with the County’s 2010-2014 Four-Year Financial Plan and budget gaps that were projected to begin in 2011. However, on February 12, 2010, the ECFSA voted to remain in an advisory status. Also on that date, the County Executive reversed his position on borrowing for capital projects and announced that the ECFSA would conduct the borrowing on behalf of the County. This decision ensures the existence of the ECFSA through the 13-year duration of the bonds. Erie County’s 2010 Budget Under the Charter, the County Executive is required to submit his annual budget to the County Legislature by October 15th. In early October 2009, in association with the ECFSA-required Four Year Financial Plan, the County Executive presented his 2010 Tentative Budget to the legislature for review and action. On December 1, 2009, the County Legislature approved its 2010 Amended Budget. Subsequently, the County Executive vetoed a number of the legislature’s
amendments, many of which were overridden by the legislature on December 8, 2009. Despite the ECFSA declaring and entering into control periods for the County’s 2007,
2008 and 2009 fiscal years, the County ended each year with a surplus and a balanced budget. A General Fund surplus of $9.3 million was reported for the year-ended December 31, 2007, a $10.7 million surplus was reported for the year-ended December 31, 2008, and a $43.6 million surplus was reported for the year-ended December 31, 2009. With the ECFSA reverting to advisory status in 2009 and remaining in advisory status through Fiscal Year 2010, a surplus of $23.5 million for the year-ended December 31, 2010 was reported for the General Fund. The undesignated fund balance and total fund balance of the General Fund are $66.9 million and $125.3 million, respectively, as of December 31, 2010.
iv
ECONOMIC CONDITION AND OUTLOOK
Local Economy
Historically, the local economy was built on railroad commerce, steel manufacturing, automobile production, Great Lakes shipping and grain storage. However, following heavy job losses in the manufacturing sector in the 1970’s and early 1980s, the local economy has become
more diversified with growth in the financial, health and service sectors. This diversification has tended to cushion local impacts during economic downturns, but strengthening the local economic base and improving the local economy has been a gradual, sometimes sporadic, process ongoing since the mid-1980s.
After hovering around 5.0 percent for most of the decade (2001-2008), unemployment in Erie County dramatically increased through 2009 and into 2010 as a result of the worldwide recession. After peaking at 9.3 percent in January 2010, the County’s unemployment rate
continued to drop throughout the year ending at 7.9 percent in December 2010. Erie County’s
unemployment rate in 2010 averaged 8.2 percent as opposed to 8.6 percent statewide and 9.6 percent nationally (source: New York State Department of Labor, United States Bureau of Labor
Statistics). Erie County was less impacted by the dramatic inflation in real estate prices, one of the
contributing factors to the recession. In addition, the County’s foreclosure rate and number of
foreclosures is significantly less than the national and state averages and rates.
Erie County has increasingly become a center of bioinformatics and medical research which includes development at the University at Buffalo, Hauptman-Woodward Medical Research Institute, and Roswell Park Cancer Institute. Development of the Buffalo Niagara Medical Campus in downtown Buffalo has continued since its inception in 2001.
The financial activities sector has continued to have a strong presence in Erie County.
Already headquarters of M&T Bank, the County is also home to a major operations center for HSBC Bank USA and corporate operations facilities for Bank of America, Key Bank and Citigroup.
With respect to Erie County’s manufacturing sector, in 2010 General Motors announced
that the corporation will invest $425.0 million to upgrade its facility in the Town of Tonawanda to produce the next generation fuel-efficient, four-cylinder Ecotec engine. Overall, in spring and summer 2010 area manufacturers endured a slowdown in growth, culminating in an actual decline in business during September, which rebounded in October leading to accelerated growth in November. The growth in November hit a more than two-year high which pushed activity among manufacturers to its highest level since August 2008.
In 2010, construction or structural improvements were scheduled or completed on various
buildings in the City of Buffalo, including completion of the $7.0 million renovation to the Buffalo Niagara Convention Center (funded by the County), continued construction of the new 260,000 square foot Federal Court House at Niagara Square, and planned expansion of the new Embassy Suites Buffalo hotel in the Avant Building, that was previously converted from the former Dulski Federal Building.
v
For many years there has been an emphasis on enhancing the "quality of life" and on further developing the region's considerable cultural and recreational potential as another means of attracting and retaining investment and jobs. This includes the County’s significant financial
investment in recent years in the area’s cultural institutions, including Frank Lloyd Wright’s
Darwin Martin House, Graycliff Estate and Rowing Boathouse and the Buffalo and Erie County Zoological Gardens. The County continued to serve as a significant source of annual operational funding to dozens of local cultural agencies through 2010 though funding has been significantly cut for 2011. The County's waterfront along Lake Erie has been the focus of significant residential and commercial development including the development of parks, green spaces and pedestrian/bicycle trails. In December of 2010, Buffalo and Niagara University in Lewiston, NY hosted the I.I.H.F. World U20 Junior Hockey Championship. It was only the fifth time in the 35-year history of the world juniors that the United States has played host. Major Fiscal Impacts on the County in 2010
The resistance of the local economy to the worst effects of recessions, and the success of some local economic development activities has had a positive influence on the County's finances. While the cities in the County have experienced some stagnation or erosion of their property tax bases, overall the local tax base has continued to grow slowly. Starting in late 2008 and continuing in early 2009, reflecting national and regional trends, County sales tax receipts began to decline. However, in late 2009 through 2010, County sales tax revenues increased above the County’s adjusted budget projection and the County ended 2010 with a positive variance of 2.27
percent over 2009 and 2.19 percent over the 2010 Adopted Budget. The County believes that a significant positive component of this revenue stream is the influx of Canadian shoppers due to the strong Canadian dollar. In 2010, the County, like many counties across the country working through the lingering effects of the recession, continued to receive unexpected extraordinary financial assistance from the federal government. This financial aid, referred to as Federal Medical Assistance Percentage (“FMAP”) was channeled to the County via the State, and is related to the County’s expense for
Medicaid. In 2010, the County received $43.0 million in FMAP assistance, with the majority of this aid coming in the form of reduced mandatory weekly County Medicaid payments to New York State.
OTHER RELEVANT INFORMATION
Relevant Financial Policies The County Charter, amended by Local Law 3-2006, includes specific provisions for fund balance. The Charter requires the County to establish and maintain “a balance in all funds established in the budget equal to or greater than five percent of the amount contained in the budget of each fund in the immediately preceding fiscal year.” The Charter also provides for
limits and specific requirements governing the County’s use/appropriation of fund balance
including legislative approval and that the County may not appropriate fund balance below the five percent level.

vi
Monthly Accrual/Monitoring System
Since 1985, the County has maintained a Budget Monitoring System which compares budgetary estimates at the department and account level to fully accrued actual data on a monthly basis. The monitoring reports are used as a management tool during the fiscal year. All major variances are reconciled and, as appropriate, corrective measures are taken to ensure any projected deficit condition will be prevented or minimized. The County Administration is also required to submit monthly budget monitoring reports to the County Legislature. Independent Audit
Since 1975, it has been the County's policy to have an independent audit of its annual financial statements performed by a certified public accounting firm. The Charter provides for an independent Audit Committee that is responsible for recommending one or more specific firms to conduct annual audits of the County and the Erie Community College. The County has complied with the Charter’s requirement to have an independent audit performed and the auditors’ opinion
is provided in the Financial Section of this report.
AWARDS AND ACKNOWLEDGMENTS
The Government Finance Officers Association of the United States and Canada
(“GFOA”) awarded a Certificate of Achievement for Excellence in Financial Reporting to the County for its comprehensive annual financial report (“CAFR”) for the fiscal year ended
December 31, 2009. To be awarded a Certificate of Achievement, a government must publish a CAFR that is comprehensive, well organized and easy to read. This report must satisfy both generally accepted accounting principles and applicable legal requirements.
A Certificate of Achievement is valid for one year. We believe that our CAFR for fiscal
year 2010 continues to meet the Certificate of Achievement Program’s requirements and we will
submit it to the GFOA to determine its eligibility for another certificate.
The preparation of this report would not have been possible were it not for the efforts of the Comptroller's Office’s Accounting Division staff, other cooperating County departments, and
our independent auditor, Deloitte & Touche LLP. I would like to express my appreciation to all those who assisted and contributed to its preparation. Respectfully submitted, Mark C. Poloncarz, Esq. Erie County Comptroller MCP/nr
vii
viii
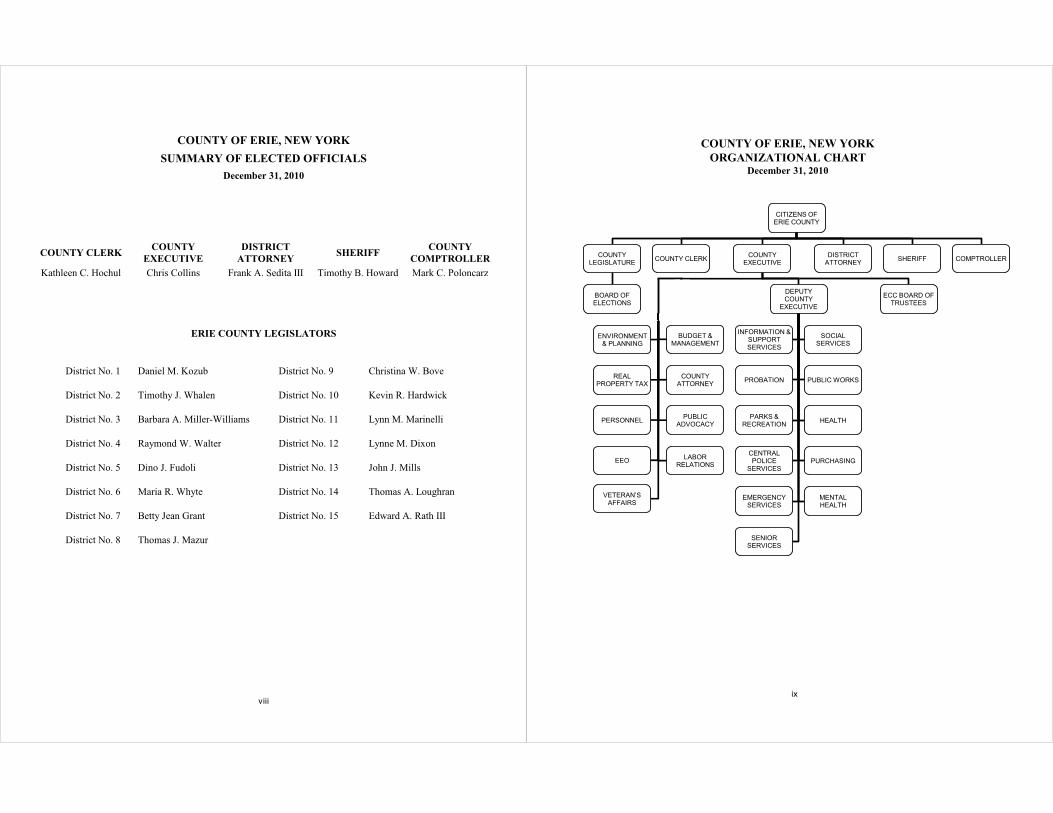
COUNTY OF ERIE, NEW YORK
SUMMARY OF ELECTED OFFICIALS December 31, 2010
COUNTY CLERK COUNTY
EXECUTIVE
DISTRICT
ATTORNEY SHERIFF
COUNTY
COMPTROLLER
Kathleen C. Hochul Chris Collins Frank A. Sedita III Timothy B. Howard Mark C. Poloncarz
ERIE COUNTY LEGISLATORS
District No. 1 Daniel M. Kozub District No. 9 Christina W. Bove
District No. 2 Timothy J. Whalen District No. 10 Kevin R. Hardwick
District No. 3 Barbara A. Miller-Williams District No. 11 Lynn M. Marinelli
District No. 4 Raymond W. Walter District No. 12 Lynne M. Dixon
District No. 5 Dino J. Fudoli District No. 13 John J. Mills
District No. 6 Maria R. Whyte District No. 14 Thomas A. Loughran
District No. 7 Betty Jean Grant District No. 15 Edward A. Rath III
District No. 8 Thomas J. Mazur
COUNTY OF ERIE, NEW YORK
ORGANIZATIONAL CHARTDecember 31, 2010
CITIZENS OF
ERIE COUNTY
COUNTY
LEGISLATURE
BOARD OF
ELECTIONS
COUNTY CLERKCOUNTY
EXECUTIVE
BUDGET &
MANAGEMENT
COUNTY
ATTORNEY
PUBLIC
ADVOCACY
LABOR
RELATIONS
PERSONNEL
REAL
PROPERTY TAX
EEO
ENVIRONMENT
& PLANNING
VETERAN’S
AFFAIRS
DEPUTY
COUNTY
EXECUTIVE
INFORMATION &
SUPPORT
SERVICES
SOCIAL
SERVICES
PROBATION PUBLIC WORKS
PARKS &
RECREATIONHEALTH
CENTRAL
POLICE
SERVICES
PURCHASING
EMERGENCY
SERVICES
MENTAL
HEALTH
SENIOR
SERVICES
ECC BOARD OF
TRUSTEES
DISTRICT
ATTORNEYSHERIFF COMPTROLLER
ix
x
FINANCIAL SECTION
This section contains the following:
INDEPENDENT AUDITORS' REPORT
MANAGEMENT’S DISCUSSION AND ANALYSIS
BASIC FINANCIAL STATEMENTS
REQUIRED SUPPLEMENTARY INFORMATION
COMBINING AND INDIVIDUAL FUND
STATEMENTS AND SCHEDULES
�
�
�
�
�
�
__________________________________________________________________________________________________________________________________________ COUNTY OF ERIE, NEW YORK • 3
MANAGEMENT’S DISCUSSION AND ANALYSIS December 31, 2010
(unaudited)
This section of the County of Erie, New York’s (the “County”) comprehensive annual financial report presents a discussion and analysis of the County’s financial performance during the year ended December 31, 2010, and incorporates financial information from the year ended December 31, 2009 for comparative analysis purposes. Please read it in conjunction with the County’s basic financial statements following this section. All amounts in this Management’s Discussion and Analysis, unless otherwise
indicated, are expressed in thousands of dollars.
FINANCIAL HIGHLIGHTS The County’s assets exceeded liabilities at the close of the 2010 fiscal year by $14,524 (net assets). This consists of $6,231 restricted for specific purposes (restricted net assets), $388,609 invested in capital assets, net of related debt, and a deficit in unrestricted net assets of $380,316 at December 31, 2010.
§ The primary government’s total net assets decreased by $12,760. Governmental activities decreased the County’s net assets by $9,016. Business type activities decreased the County’s net assets by $3,744.
§ As of December 31, 2010, the County’s governmental funds reported combined fund balances of $273,834, an increase of $135,719 in comparison to the prior year. Approximately 72.8% of the total combined governmental funds fund balance, $199,241, is available to meet the County’s current and future needs (unreserved fund balance).
§ At the end of the fiscal year, unreserved fund balance for the General Fund was $113,460 or 90.5% of the total General Fund fund balance of $125,313. Total unreserved designated General Fund fund balance was $46,556 at December 31, 2010.
§ The total bonded debt of the primary government increased by $129,176 or 18.4% during the 2010 fiscal year.
OVERVIEW OF THE FINANCIAL STATEMENTS This discussion and analysis serves as an introduction to the County’s basic financial statements. The County’s basic financial statements include three components: 1) Government-wide financial statements, 2) Fund financial statements, and 3) Notes to the financial statements. In addition to the basic financial statements, required supplementary information is included. Government-Wide Financial Statements are two statements designed to provide readers with a broad overview of County finances, in a manner similar to a private-sector business. The Statement of Net Assets presents information on all County assets and liabilities, with the difference between the two reported as net assets. Over time, increases or decreases in net assets may serve as a useful indicator of whether the financial position of the County is improving or deteriorating. The Statement of Activities presents information showing how net assets changed during the most recent fiscal year. All changes in net assets are reported as soon as the underlying event giving rise to the change occurs, regardless of the timing of related cash flows. Thus, revenues and expenses are reported in this statement for some items that will result in cash flows in future fiscal periods (e.g., uncollected taxes and earned but unused vacation leave). Both of these government-wide financial statements distinguish functions of the County that are principally supported by taxes and intergovernmental revenues (governmental
activities) from other functions that are intended to recover all or in part a portion of their costs through user fees and charges (business-type activities). The governmental activities of the County include general government, public safety, health, transportation, economic assistance and opportunity, culture and recreation, education, and home and community services. The business-type activities of the County include Erie Community College (“College”) and the Utilities Aggregation Fund. A fiscal year ending August 31 is mandated by New York State law for the College. Accordingly, financial information for the College is presented as of and for the fiscal year then ended. On July 12, 2005, the Governor of the State of New York signed legislation creating the Erie County Fiscal Stability Authority (“ECFSA”). The ECFSA began its work during 2005 in an advisory role and provides the County with financial oversight while
4 • COUNTY OF ERIE, NEW YORK _____________________________________________________________________________________________________________________________________
giving local leaders the ability to improve the County’s fiscal condition without further State intervention. The ECFSA is included as a governmental activity in the government-wide financial statements. On November 3, 2006, the ECFSA imposed a control period on the County empowering the ECFSA to operate with its maximum authorized compliment of control and oversight powers over County finances. On that date, the ECFSA also imposed a hiring freeze and a contract review process. The ECFSA reverted to an advisory status on June 2, 2009 and maintained its advisory status through the 2010 fiscal year. The government-wide financial statements include not only the County (i.e., the primary government) but also the legally separate Buffalo and Erie County Public Library (the “Library”), Erie County Medical Center Corporation (the “ECMCC”) and other component units. Financial information for these discretely presented component units of the County is reported separately from the financial information presented for the primary government itself. The Library does not issue separate financial statements.
Fund financial statements are groupings of related accounts that are used to maintain control over resources that have been segregated for specific activities or objectives. The County, like other state and local governments, uses fund accounting to ensure and demonstrate finance-related legal compliance. All funds of the County are divided into three categories: governmental funds, proprietary funds, and fiduciary funds.
Governmental funds are used to account for essentially the same functions reported as governmental activities in the government-wide financial statements. However, unlike the government-wide financial statements, governmental funds financial statements focus on near-term inflows and outflows of spendable resources, as well as on balances of spendable resources
available at the end of the fiscal year. Such information may be useful in evaluating a county’s near-term financing requirements. Because the focus of governmental funds is narrower than that of the government-wide financial statements, it is useful to compare the information presented for governmental funds with similar information presented for governmental activities in the government-wide financial statements. By doing so, readers may better understand the long-term impact of the government’s near-term financing decisions. Both the governmental funds Balance Sheet and the governmental funds Statement of Revenues, Expenditures and Changes in Fund Balances provide a reconciliation to facilitate this comparison between governmental funds
and governmental activities.
The County maintains fifteen (15) individual governmental funds. Additionally, the County reports the activities of its blended
component units within its governmental funds. Information is presented separately in the governmental funds balance sheet and in the governmental funds statement of revenues, expenditures and changes in fund balances for the General Fund and ECFSA blended component unit (reported as a major special revenue fund). Data from the other governmental funds and blended component units are combined into a single, aggregated presentation. The County adopts an annual appropriated budget for its General Fund. A budgetary comparison statement has been provided for the General Fund.
Proprietary funds - The County maintains one type of proprietary fund. Enterprise funds are used to report the same functions presented as business-type activities in the government-wide financial statements. The County uses enterprise funds to account for the College and the Utilities Aggregation Fund, which is used to account for the bulk purchase and resale of gas, oil, and electric utilities. Proprietary funds provide the same type of information as the government-wide financial statements, only in more detail. The College is considered to be a major proprietary fund of the County. Fiduciary funds are used to account for resources held for the benefit of parties outside the government. Fiduciary funds are not reflected in the government-wide financial statements because the resources of those funds are not available to support the County’s own programs. The County has one fiduciary fund, the Agency Fund, which is used to account for funds held by the County as agent for employee withholdings, guarantee and bid deposits, court funds, monies due to other governments, and other miscellaneous items. The accounting used for fiduciary funds is much like that used for proprietary funds.
Notes to the Financial Statements provide additional information that is essential to a full understanding of the data provided in the government-wide and fund financial statements. Other Information - In addition to the basic financial statements and accompanying notes, this report also presents certain required supplementary information concerning the County’s progress in funding its obligation to provide other post-employment benefits to its employees. Required supplementary information can be found immediately following the notes to the financial statements.
_______________________________________________________________________________________________________ COUNTY OF ERIE, NEW YORK • 5
The Combining and Individual Fund Financial Statements provide Combining Statements for non-major governmental funds; comparisons of budgetary and actual data for certain Special Revenue Funds and Debt Service Fund; Statement of Changes in Assets and Liabilities for the Agency Fund; Fund Financial statements for the discretely presented Library component unit; and Combining Statements for Other component units. They are presented immediately following the required supplementary information.
GOVERNMENT-WIDE FINANCIAL ANALYSIS
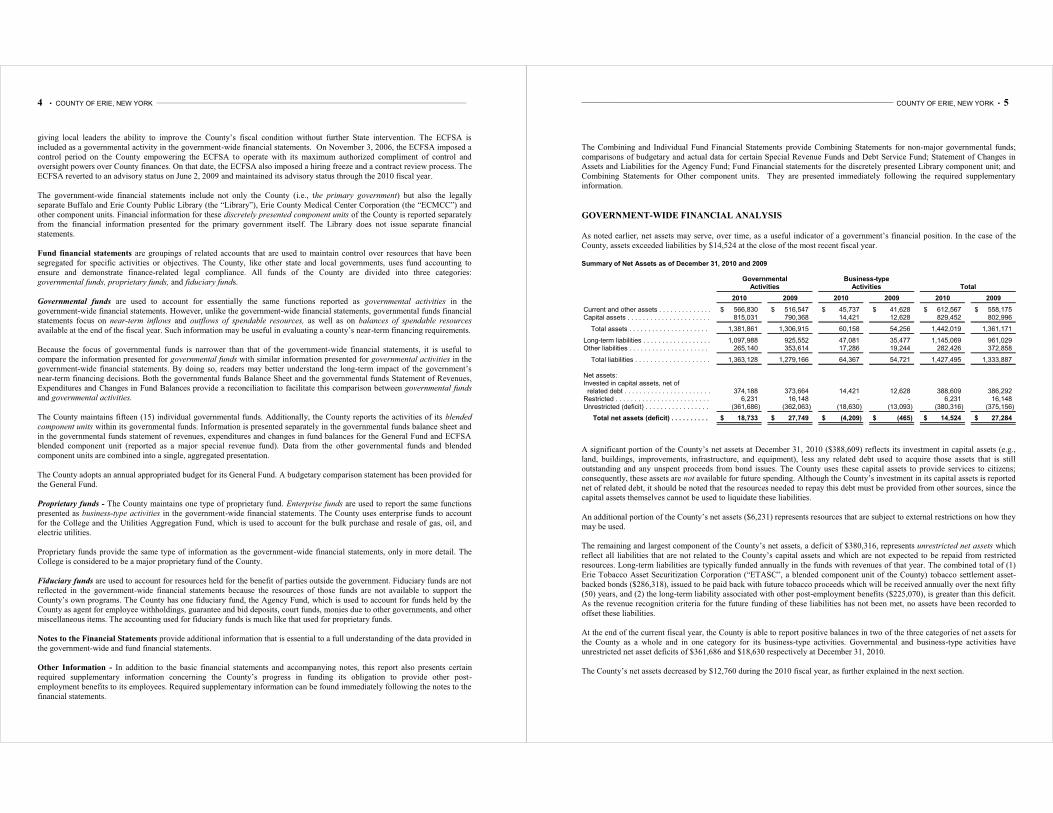
As noted earlier, net assets may serve, over time, as a useful indicator of a government’s financial position. In the case of the County, assets exceeded liabilities by $14,524 at the close of the most recent fiscal year. Summary of Net Assets as of December 31, 2010 and 2009
Governmental Business-typeActivities Activities Total
2010 2009 2010 2009 2010 2009
Current and other assets . . . . . . . . . . . . . . . . . . . . . . . . . . . . . . . . . . . . . . . 566,830$ 516,547$ 45,737$ 41,628$ 612,567$ 558,175$ Capital assets . . . . . . . . . . . . . . . . . . . . . . . . . . . . . . . . . . . . . . . 815,031 790,368 14,421 12,628 829,452 802,996
Total assets . . . . . . . . . . . . . . . . . . . . . . . . . . . . . . . . . . . . . . . 1,381,861 1,306,915 60,158 54,256 1,442,019 1,361,171
Long-term liabilities . . . . . . . . . . . . . . . . . . . . . . . . . . . . . . . . . . . . . . . 1,097,988 925,552 47,081 35,477 1,145,069 961,029 Other liabilities . . . . . . . . . . . . . . . . . . . . . . . . . . . . . . . . . . . . . . . 265,140 353,614 17,286 19,244 282,426 372,858
Total liabilities . . . . . . . . . . . . . . . . . . . . . . . . . . . . . . . . . . . . . . . 1,363,128 1,279,166 64,367 54,721 1,427,495 1,333,887
Net assets: Invested in capital assets, net of related debt . . . . . . . . . . . . . . . . . . . . . . . . . . . . . . . . . . . . . . . 374,188 373,664 14,421 12,628 388,609 386,292 Restricted . . . . . . . . . . . . . . . . . . . . . . . . . . . . . . . . . . . . . . . 6,231 16,148 - - 6,231 16,148 Unrestricted (deficit) . . . . . . . . . . . . . . . . . . . . . . . . . . . . . . . . . . . . . . . (361,686) (362,063) (18,630) (13,093) (380,316) (375,156)
Total net assets (deficit) . . . . . . . . . . . . . . . . . . . . . . . . . . . . . . . . . . . . . . . 18,733$ 27,749$ (4,209)$ (465)$ 14,524$ 27,284$
A significant portion of the County’s net assets at December 31, 2010 ($388,609) reflects its investment in capital assets (e.g., land, buildings, improvements, infrastructure, and equipment), less any related debt used to acquire those assets that is still outstanding and any unspent proceeds from bond issues. The County uses these capital assets to provide services to citizens; consequently, these assets are not available for future spending. Although the County’s investment in its capital assets is reported net of related debt, it should be noted that the resources needed to repay this debt must be provided from other sources, since the capital assets themselves cannot be used to liquidate these liabilities. An additional portion of the County’s net assets ($6,231) represents resources that are subject to external restrictions on how they may be used. The remaining and largest component of the County’s net assets, a deficit of $380,316, represents unrestricted net assets which reflect all liabilities that are not related to the County’s capital assets and which are not expected to be repaid from restricted resources. Long-term liabilities are typically funded annually in the funds with revenues of that year. The combined total of (1) Erie Tobacco Asset Securitization Corporation (“ETASC”, a blended component unit of the County) tobacco settlement asset-backed bonds ($286,318), issued to be paid back with future tobacco proceeds which will be received annually over the next fifty (50) years, and (2) the long-term liability associated with other post-employment benefits ($225,070), is greater than this deficit. As the revenue recognition criteria for the future funding of these liabilities has not been met, no assets have been recorded to offset these liabilities. At the end of the current fiscal year, the County is able to report positive balances in two of the three categories of net assets for the County as a whole and in one category for its business-type activities. Governmental and business-type activities have unrestricted net asset deficits of $361,686 and $18,630 respectively at December 31, 2010. The County’s net assets decreased by $12,760 during the 2010 fiscal year, as further explained in the next section.

6 • COUNTY OF ERIE, NEW YORK _____________________________________________________________________________________________________________________________________
The following table indicates the changes in net assets for governmental and business-type activities for the current and prior fiscal years:
Summary of Changes in Net Assets for the Year Ended December 31, 2010 and 2009
Governmental Business-typeActivities Activities Total
2010 2009 2010 2009 2010 2009Revenues: Program revenues: Charges for services . . . . . . . . . . . . . . . . . . . . . . . . . . . . . . . . . . . . . . . 74,808$ 82,748$ 59,949$ 58,297$ 134,757$ 141,045$ Operating grants and contributions . . . . . . . . . . . . . . . . . . . . . . . . . . . . . . . . . . . . . . . 456,029 468,793 7,412 6,790 463,441 475,583 Capital grants and contributions . . . . . . . . . . . . . . . . . . . . . . . . . . . . . . . . . . . . . . . 25,718 12,282 - - 25,718 12,282 General revenues: Property taxes . . . . . . . . . . . . . . . . . . . . . . . . . . . . . . . . . . . . . . . 257,749 251,224 - - 257,749 251,224 Sales and use taxes . . . . . . . . . . . . . . . . . . . . . . . . . . . . . . . . . . . . . . . 661,933 646,893 - - 661,933 646,893 Transfer taxes . . . . . . . . . . . . . . . . . . . . . . . . . . . . . . . . . . . . . . . 7,246 8,553 - - 7,246 8,553 Non-operating revenues: Federal, state and local appropriations . . . . . . . . . . . . . . . . . . . . . . . . . . . . . . . . . . . . . . . - - 72,463 63,255 72,463 63,255 Unrestricted interest earnings . . . . . . . . . . . . . . . . . . . . . . . . . . . . . . . . . . . . . . . 1,524 1,592 146 298 1,670 1,890 Miscellaneous and other . . . . . . . . . . . . . . . . . . . . . . . . . . . . . . . . . . . . . . . 14,622 8,628 - - 14,622 8,628
Total revenues . . . . . . . . . . . . . . . . . . . . . . . . . . . . . . . . . . . . . . . 1,499,629 1,480,713 139,970 128,640 1,639,599 1,609,353
Expenses: General government . . . . . . . . . . . . . . . . . . . . . . . . . . . . . . . . . . . . . . . 423,161 420,026 - - 423,161 420,026 Public safety . . . . . . . . . . . . . . . . . . . . . . . . . . . . . . . . . . . . . . . 141,543 122,888 - - 141,543 122,888 Health . . . . . . . . . . . . . . . . . . . . . . . . . . . . . . . . . . . . . . . 82,855 89,927 - - 82,855 89,927 Transportation . . . . . . . . . . . . . . . . . . . . . . . . . . . . . . . . . . . . . . . 72,615 62,673 - - 72,615 62,673 Economic assistance and opportunity . . . . . . . . . . . . . . . . . . . . . . . . . . . . . . . . . . . . . . . 579,927 567,035 - - 579,927 567,035 Culture and recreation . . . . . . . . . . . . . . . . . . . . . . . . . . . . . . . . . . . . . . . 24,567 23,754 - - 24,567 23,754 Education . . . . . . . . . . . . . . . . . . . . . . . . . . . . . . . . . . . . . . . 75,529 70,716 - - 75,529 70,716 Home and community service . . . . . . . . . . . . . . . . . . . . . . . . . . . . . . . . . . . . . . . 53,186 48,628 - - 53,186 48,628 Interest and fiscal charges . . . . . . . . . . . . . . . . . . . . . . . . . . . . . . . . . . . . . . . 37,833 39,511 - - 37,833 39,511 College . . . . . . . . . . . . . . . . . . . . . . . . . . . . . . . . . . . . . . . - - 132,556 123,988 132,556 123,988 Purchase and resale of utilities . . . . . . . . . . . . . . . . . . . . . . . . . . . . . . . . . . . . . . . - - 28,587 27,490 28,587 27,490
Total expenses . . . . . . . . . . . . . . . . . . . . . . . . . . . . . . . . . . . . . . . 1,491,216 1,445,158 161,143 151,478 1,652,359 1,596,636
Excess (deficiency) before transfers . . . . . . . . . . . . . . . . . . . . . . . . . . . . . . . . . . . . . . . 8,413 35,555 (21,173) (22,838) (12,760) 12,717
Transfers . . . . . . . . . . . . . . . . . . . . . . . . . . . . . . . . . . . . . . . (17,429) (17,221) 17,429 17,221 - -
Change in net assets . . . . . . . . . . . . . . . . . . . . . . . . . . . . . . . . . . . . . . . (9,016) 18,334 (3,744) (5,617) (12,760) 12,717 Net assets (deficit) - beginning 27,749 9,415 (465) 5,152 27,284 14,567
Net assets (deficit) - ending . . . . . . . . . . . . . . . . . . . . . . . . . . . . . . . . . . . . . . . 18,733$ 27,749$ (4,209)$ (465)$ 14,524$ 27,284$
_______________________________________________________________________________________________________ COUNTY OF ERIE, NEW YORK • 7
Governmental activities Governmental activities decreased the County’s net assets by $9,016. Revenues and expenses increased by $18,916 (1.3%) and $46,058 (3.2%), respectively, and net transfers out increased $208 (1.2%) from 2009 to 2010. Key elements of this increase are as follows:
§ The $15,040 (2.3%) increase in the sales and use taxes category was primarily the result of taxable sales growth due in part to Canadian consumers taking advantage of the stronger Canadian dollar. Rising fuel prices commencing in the fall of 2010 also added to this growth.
§ Revenue from property taxes increased by $6,525 (2.6%). Increases to the total tax levy ($9,108) mainly for assessment growth, accounted for the increase.
§ Transfer tax revenues decreased $1,307 (15.3%) compared to 2009 as a result of reduced real property sales. Federal homebuyer tax credits expired in April 2010 which contributed to this decline.
§ Miscellaneous and other revenues grew by $5,994 (69.5%) primarily due to reimbursement of demolition costs ($1,113) for the future construction of new facilities and an excess operating credit ($4,704) both received from ECMCC.
§ Capital grants and contributions increased $13,436 during the year as a result of increased Federal and State aid for road and bridge projects ($9,221) and increased State aid for other building improvements and land development ($4,619).
§ Operating grants and contributions deceased $12,764 (2.7%) during the year. Decreases in State aid for social services programs ($11,559), mental health programs ($4,755) and ECFSA efficiency grants ($3,744), coupled with a decrease in ETASC tobacco revenues ($3,497), were offset by increased program funding from the federal government including Federal Medicaid Assistance Percentage ($3,792) and various social services programs ($2,240) and increases in State aid for the special needs preschool program ($4,888).
§ Public safety expenses increased by $18,655 or 15.2% primarily as a result of increases in salaries ($2,129), overtime ($4,035), retirement charges due to a one-time full payment of charges previously amortized and a contribution rate increase mandated by the State ($6,521), other fringe benefits ($2,384) and contractual services ($1,431).
§ Economic assistance and opportunity expense increased by $12,892 (2.3%) chiefly due to increases in salaries and fringe benefits ($9,898) and capital asset acquisitions below established capitalization thresholds ($3,560).
§ Transportation expenses increased $9,942 (15.9%) mainly as a result of increases in expenditures for road and bridge maintenance projects and flood damage repair and cleanup ($8,576) and depreciation ($658).
Business-type activities Business-type activities decreased the County’s net assets by $3,744 in the 2010 fiscal year compared to a decrease of $5,617 in 2009. The College generated decreases in net assets of $3,962 and $5,561 for the years ended August 31, 2010 and 2009, respectively. The operating loss at August 31, 2010 was greater than the operating loss at August 31, 2009 by $7,671 as operating revenues generated increased $903 and operating expenses increased $8,574. Revenues generated during the fiscal year ended August 31, 2010 for student tuition and fees increased as a result of an increased enrollment. An increase in Pell scholarships awarded to students, and collectively bargained salary and wage increases, make up much of the expense increase. The County sponsorship share of support to the College for the College’s fiscal year ended August 31, 2010 was $17,429 and is reported as a 2010 operating transfer to the College from the County’s General ($15,629) and Special Capital ($1,800) funds.
FINANCIAL ANALYSIS OF THE COUNTY’S FUNDS As noted earlier, the County uses fund accounting to ensure and demonstrate compliance with finance-related legal requirements. Governmental funds - The general government functions are contained in the General, Special Revenue, Debt Service, and Capital Projects Funds. The focus of the County’s governmental funds is to provide information on near-term inflows, outflows, and balances of spendable resources. Such information is useful in assessing the County’s financing requirements. In particular, unreserved fund balance may serve as a useful measure of a government’s net resources available for spending at the end of the fiscal year. At December 31, 2010, the County’s governmental funds reported combined fund balances of $273,834 which is an increase of $135,719 in comparison with the prior year. Approximately 72.8% of the combined fund balances ($199,241)
8 • COUNTY OF ERIE, NEW YORK _____________________________________________________________________________________________________________________________________
constitutes unreserved fund balance, which is available to meet the County’s current and future operational and capital needs. The remainder of fund balance is reserved to indicate that it is not available for new spending because it has already been committed (1) to liquidate contracts and purchase orders of the prior period ($34,741); (2) to pay debt service ($28,288); (3) to reflect prepaid items and loans that are long-term in nature and thus do not represent available spendable resources ($10,209); and (4) for a variety of other restricted purposes ($1,355). Following is a discussion of the significant balances and operations of selected funds. § General Fund – The General Fund is the chief operating fund of the County. At December 31, 2010, unreserved fund
balance of the General Fund was $113,460 while total fund balance was $125,313. As a measure of the General Fund’s liquidity, it is useful to compare both unreserved fund balance and total fund balance to total fund expenditures. Unreserved fund balance represents 9.3% of total expenditures (excluding other financing uses), while total fund balance represents 10.2% of that same amount.
Fund balance in the County’s General Fund increased by $23,475 during the 2010 fiscal year compared to 2009 when the General Fund experienced an increase of $43,647.
§ ECFSA General Fund – Short-term debt, specifically bond anticipation notes (“BANs”) decreased by $122,665. This represents reductions in BANs that matured in 2010 ($102,675) that were re-financed by the issuance of general obligation bonds, reported in the ECFSA Debt Service Fund, and BANs needed to meet the County’s short-term cash flow needs during 2010 ($19,990). Interest and fiscal charges increased by $2,437.
§ Road Special Revenue Fund – The 2010 General Fund subsidy to this fund decreased by $3,241 from the 2009 amount,
when in that year, additional transfers were made to alleviate a 2008 deficit fund balance. § Emergency Response Special Revenue Fund – The ending 2010 fund balance of $1,414 was comprised entirely of the
receipt of final reimbursements for damage related to a major snowstorm that occurred in October, 2006. § Debt Service Fund – The Debt Service Fund has a total fund balance of $8,324 which is reserved solely for the purpose of
payment of future debt service. The net decrease in fund balance during the current year of $4,212 was due primarily to the appropriation of prior year ending fund balance in the amount of $4,998.
§ ECFSA Debt Service Fund – This fund was established during 2010 as a result of the ECFSA issuing long-term general
obligation bonds on behalf of the County. At year-end, the ECFSA held County cash in the amount of $9,420 that was accumulated by intercepting and withholding the County’s sales tax receipts from New York State. These monies will be used for future debt service payments.
§ Capital Projects Funds – The County maintains six (6) capital projects funds which account for the construction and re-
construction of general public improvements. At the end of the 2010 fiscal year, the total fund balances amounted to $92,476 of which $26,381 was encumbered for contracts underway, $669 was designated for future construction projects at ECMCC, and $65,426 was undesignated and unreserved.
All capital project funds reported positive fund balances at December 31, 2010. Proceeds from the issuance of general obligation bonds on May 18, 2010 in the amount of $157,995 transferred in from ECFSA remediated prior year deficit fund balances in the General Government Buildings, Equipment and Improvements Fund ($1,816), Highways, Roads, Bridges and Equipment Capital Projects Fund ($21,115) and Special Capital Projects Fund ($6,218). During 2010, the County’s capital outlay increased in the General Government Buildings, Equipment and Improvements Fund ($23,355), Highways, Roads, Bridges and Equipment Capital Projects Fund ($8,138) and Sewers, Facilities, Equipment and Improvements Fund ($2,773), and decreased in the Special Capital Projects Fund ($487) and ECMCC Capital Projects Fund ($220).
_______________________________________________________________________________________________________ COUNTY OF ERIE, NEW YORK • 9
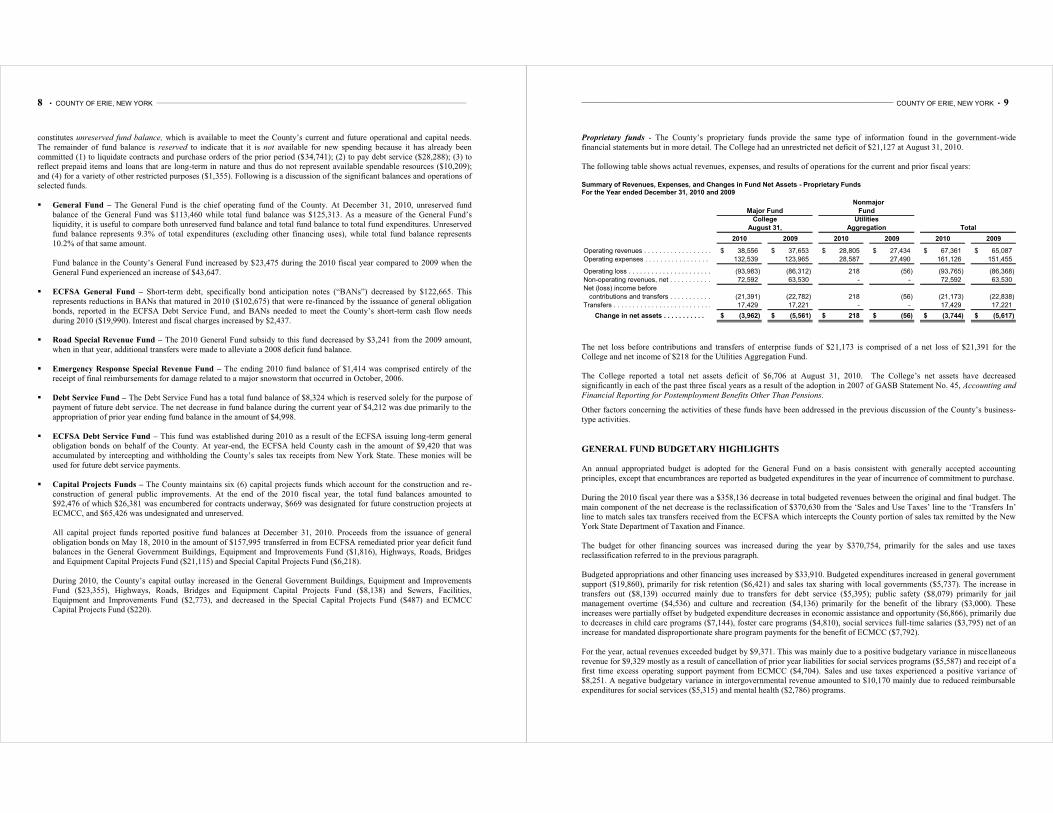
Proprietary funds - The County’s proprietary funds provide the same type of information found in the government-wide financial statements but in more detail. The College had an unrestricted net deficit of $21,127 at August 31, 2010.
The following table shows actual revenues, expenses, and results of operations for the current and prior fiscal years:
Summary of Revenues, Expenses, and Changes in Fund Net Assets - Proprietary Funds For the Year ended December 31, 2010 and 2009
2010 2009 2010 2009 2010 2009
Operating revenues . . . . . . . . . . . . . . . . . . . . . . . . . . . . . . . . . . . . . . . 38,556$ 37,653$ 28,805$ 27,434$ 67,361$ 65,087$
Operating expenses . . . . . . . . . . . . . . . . . . . . . . . . . . . . . . . . . . . . . . . 132,539 123,965 28,587 27,490 161,126 151,455
Operating loss . . . . . . . . . . . . . . . . . . . . . . . . . . . . . . . . . . . . . . . (93,983) (86,312) 218 (56) (93,765) (86,368)
Non-operating revenues, net . . . . . . . . . . . . . . . . . . . . . . . . . . . . . . . . . . . . . . . 72,592 63,530 - - 72,592 63,530
Net (loss) income before
contributions and transfers . . . . . . . . . . . . . . . . . . . . . . . . . . . . . . . . . . . . . . . (21,391) (22,782) 218 (56) (21,173) (22,838)
Transfers . . . . . . . . . . . . . . . . . . . . . . . . . . . . . . . . . . . . . . . 17,429 17,221 - - 17,429 17,221
(3,962)$ (5,561)$ 218$ (56)$ (3,744)$ (5,617)$
Nonmajor
Fund
Utilities
Aggregation
Change in net assets . . . . . . . . . . . . . . . . . . . . . . . . . . . . . . . . . . . . . . .
Total
Major Fund
College
August 31,
The net loss before contributions and transfers of enterprise funds of $21,173 is comprised of a net loss of $21,391 for the College and net income of $218 for the Utilities Aggregation Fund. The College reported a total net assets deficit of $6,706 at August 31, 2010. The College’s net assets have decreased significantly in each of the past three fiscal years as a result of the adoption in 2007 of GASB Statement No. 45, Accounting and
Financial Reporting for Postemployment Benefits Other Than Pensions.
Other factors concerning the activities of these funds have been addressed in the previous discussion of the County’s business-type activities.
GENERAL FUND BUDGETARY HIGHLIGHTS
An annual appropriated budget is adopted for the General Fund on a basis consistent with generally accepted accounting principles, except that encumbrances are reported as budgeted expenditures in the year of incurrence of commitment to purchase. During the 2010 fiscal year there was a $358,136 decrease in total budgeted revenues between the original and final budget. The main component of the net decrease is the reclassification of $370,630 from the ‘Sales and Use Taxes’ line to the ‘Transfers In’ line to match sales tax transfers received from the ECFSA which intercepts the County portion of sales tax remitted by the New York State Department of Taxation and Finance. The budget for other financing sources was increased during the year by $370,754, primarily for the sales and use taxes reclassification referred to in the previous paragraph. Budgeted appropriations and other financing uses increased by $33,910. Budgeted expenditures increased in general government support ($19,860), primarily for risk retention ($6,421) and sales tax sharing with local governments ($5,737). The increase in transfers out ($8,139) occurred mainly due to transfers for debt service ($5,395); public safety ($8,079) primarily for jail management overtime ($4,536) and culture and recreation ($4,136) primarily for the benefit of the library ($3,000). These increases were partially offset by budgeted expenditure decreases in economic assistance and opportunity ($6,866), primarily due to decreases in child care programs ($7,144), foster care programs ($4,810), social services full-time salaries ($3,795) net of an increase for mandated disproportionate share program payments for the benefit of ECMCC ($7,792). For the year, actual revenues exceeded budget by $9,371. This was mainly due to a positive budgetary variance in miscellaneous revenue for $9,329 mostly as a result of cancellation of prior year liabilities for social services programs ($5,587) and receipt of a first time excess operating support payment from ECMCC ($4,704). Sales and use taxes experienced a positive variance of $8,251. A negative budgetary variance in intergovernmental revenue amounted to $10,170 mainly due to reduced reimbursable expenditures for social services ($5,315) and mental health ($2,786) programs.
10 • COUNTY OF ERIE, NEW YORK _____________________________________________________________________________________________________________________________________
Actual expenditures were less than budget by $34,616 primarily due to savings in various categories as follows: general government support ($14,169), principally for risk retention expenditures ($5,315) and fringe benefits ($2,036); economic assistance and opportunity ($8,951), mainly for social services programs and health ($6,247) chiefly for mental health programs. The total favorable budget to actual variance for the year amounted to $45,627.
CAPITAL ASSETS AND DEBT ADMINISTRATION
Capital Assets
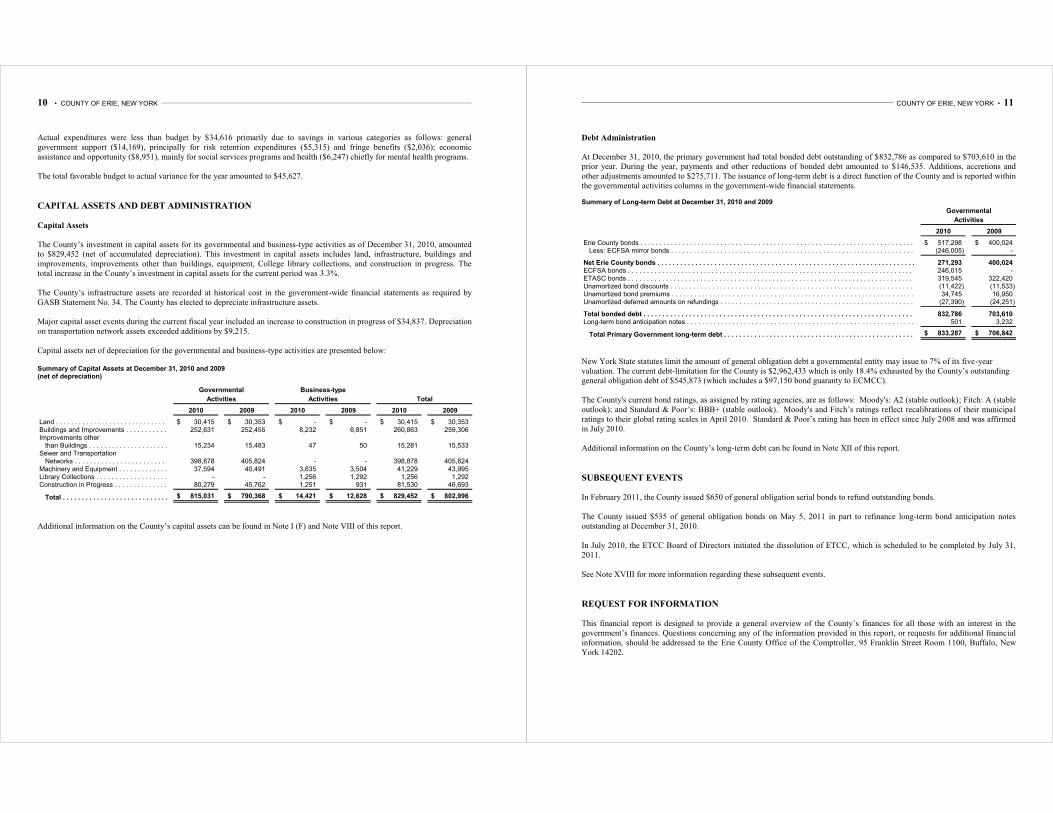
The County’s investment in capital assets for its governmental and business-type activities as of December 31, 2010, amounted to $829,452 (net of accumulated depreciation). This investment in capital assets includes land, infrastructure, buildings and improvements, improvements other than buildings, equipment, College library collections, and construction in progress. The total increase in the County’s investment in capital assets for the current period was 3.3%.
The County’s infrastructure assets are recorded at historical cost in the government-wide financial statements as required by GASB Statement No. 34. The County has elected to depreciate infrastructure assets. Major capital asset events during the current fiscal year included an increase to construction in progress of $34,837. Depreciation on transportation network assets exceeded additions by $9,215. Capital assets net of depreciation for the governmental and business-type activities are presented below: Summary of Capital Assets at December 31, 2010 and 2009 (net of depreciation)
Governmental Business-type
Activities Activities Total
2010 2009 2010 2009 2010 2009
Land . . . . . . . . . . . . . . . . . . . . . . . . . . . . . . . . . . . . . . . 30,415$ 30,353$ -$ -$ 30,415$ 30,353$ Buildings and Improvements . . . . . . . . . . . . . . . . . . . . . . . . . . . . . . . . . . . . . . . 252,631 252,455 8,232 6,851 260,863 259,306 Improvements other than Buildings . . . . . . . . . . . . . . . . . . . . . . . . . . . . . . . . . . . . . . . 15,234 15,483 47 50 15,281 15,533 Sewer and Transportation Networks . . . . . . . . . . . . . . . . . . . . . . . . . . . . . . . . . . . . . . . 398,878 405,824 - - 398,878 405,824 Machinery and Equipment . . . . . . . . . . . . . . . . . . . . . . . . . . . . . . . . . . . . . . . 37,594 40,491 3,635 3,504 41,229 43,995 Library Collections . . . . . . . . . . . . . . . . . . . . . . . . . . . . . . . . . . . . . . . - - 1,256 1,292 1,256 1,292 Construction in Progress . . . . . . . . . . . . . . . . . . . . . . . . . . . . . . . . . . . . . . . 80,279 45,762 1,251 931 81,530 46,693
Total . . . . . . . . . . . . . . . . . . . . . . . . . . . . . . . . . . . . . . . 815,031$ 790,368$ 14,421$ 12,628$ 829,452$ 802,996$
Additional information on the County’s capital assets can be found in Note I (F) and Note VIII of this report.
_______________________________________________________________________________________________________ COUNTY OF ERIE, NEW YORK • 11
Debt Administration
At December 31, 2010, the primary government had total bonded debt outstanding of $832,786 as compared to $703,610 in the prior year. During the year, payments and other reductions of bonded debt amounted to $146,535. Additions, accretions and other adjustments amounted to $275,711. The issuance of long-term debt is a direct function of the County and is reported within the governmental activities columns in the government-wide financial statements. Summary of Long-term Debt at December 31, 2010 and 2009
Governmental
Activities
2010 2009
Erie County bonds . . . . . . . . . . . . . . . . . . . . . . . . . . . . . . . . . . . . . . . . . . . . . . . . . . . . . . . . . . . . . . . . . . . . . . . . . . . .x 517,298$ 400,024$ Less: ECFSA mirror bonds . . . . . . . . . . . . . . . . . . . . . . . . . . . . . . . . . . . . . . . . . . . . . . . . . . . . . . . . . . . . . . . . . . . .x (246,005) -
x
Net Erie County bonds . . . . . . . . . . . . . . . . . . . . . . . . . . . . . . . . . . . . . . . . . . . . . . . . . . . . . . . . . . . . . . . . . . . . . . . . . .x 271,293 400,024 ECFSA bonds . . . . . . . . . . . . . . . . . . . . . . . . . . . . . . . . . . . . . . . . . . . . . . . . . . . . . . . . . . . . . . . . . . . . . . . . . . . . . .x 246,015 - ETASC bonds . . . . . . . . . . . . . . . . . . . . . . . . . . . . . . . . . . . . . . . . . . . . . . . . . . . . . . . . . . . . . . . . . . . . . . . . . . . . . . . . . . . . . . . . . . . . . . . . . . . . . . . . . .x 319,545 322,420 Unamortized bond discounts . . . . . . . . . . . . . . . . . . . . . . . . . . . . . . . . . . . . . . . . . . . . . . . . . . . . . . . . . . . . . . . . . . . . . . . . . . . . . . . . . . . . . . . x (11,422) (11,533) Unamortized bond premiums . . . . . . . . . . . . . . . . . . . . . . . . . . . . . . . . . . . . . . . . . . . . . . . . . . . . . . . . . . . . . . . . . . . . . . . . . . . . . . . . . . . . . . . . . x 34,745 16,950 Unamortized deferred amounts on refundings . . . . . . . . . . . . . . . . . . . . . . . . . . . . . . . . . . . . . . . . . . . . . . . . . . . . . . . . . . . . . . . . . . . . . . . . . . . . . . . . . . . . . . . . . x (27,390) (24,251)
Total bonded debt . . . . . . . . . . . . . . . . . . . . . . . . . . . . . . . . . . . . . . . . . . . . . . . . . . . . . . . . . . . . . . . . . . . . . . . . . . . . . . . . . . . . . . . . . . . . . . . . . . . . . . . . . .x 832,786 703,610 Long-term bond anticipation notes . . . . . . . . . . . . . . . . . . . . . . . . . . . . . . . . . . . . . . . . . . . . . . . . . . . . . . . . . . . . . . . . . . . . . . . . . . . . . . . . . . . . . . . . . . . . . . . . . . . . . . . . . .x 501 3,232
x
Total Primary Government long-term debt . . . . . . . . . . . . . . . . . . . . . . . . . . . . . . . . . . . . . . . . . . . . . . . . . . . . . . . . . . . . . . . . . . . . . . . . . . . . . . . . . . . . . . . . . . . .x 833,287$ 706,842$
New York State statutes limit the amount of general obligation debt a governmental entity may issue to 7% of its five-year valuation. The current debt-limitation for the County is $2,962,433 which is only 18.4% exhausted by the County’s outstanding general obligation debt of $545,873 (which includes a $97,150 bond guaranty to ECMCC). The County's current bond ratings, as assigned by rating agencies, are as follows: Moody's: A2 (stable outlook); Fitch: A (stable outlook); and Standard & Poor’s: BBB+ (stable outlook). Moody's and Fitch’s ratings reflect recalibrations of their municipal ratings to their global rating scales in April 2010. Standard & Poor’s rating has been in effect since July 2008 and was affirmed in July 2010. Additional information on the County’s long-term debt can be found in Note XII of this report.
SUBSEQUENT EVENTS
In February 2011, the County issued $650 of general obligation serial bonds to refund outstanding bonds. The County issued $535 of general obligation bonds on May 5, 2011 in part to refinance long-term bond anticipation notes outstanding at December 31, 2010. In July 2010, the ETCC Board of Directors initiated the dissolution of ETCC, which is scheduled to be completed by July 31, 2011. See Note XVIII for more information regarding these subsequent events.
REQUEST FOR INFORMATION This financial report is designed to provide a general overview of the County’s finances for all those with an interest in the government’s finances. Questions concerning any of the information provided in this report, or requests for additional financial information, should be addressed to the Erie County Office of the Comptroller, 95 Franklin Street Room 1100, Buffalo, New York 14202.

12 • COUNTY OF ERIE, NEW YORK _____________________________________________________________________________________________________________________________________
______________________________________________________________________________________________________ COUNTY OF ERIE, NEW YORK • 13
BASIC FINANCIAL STATEMENTS
These basic financial statements include the financial statements and related notes of the
reporting entity that are essential to fair presentation of financial position and results of
operations. The reporting entity includes the primary government and its discretely
presented component units.
14 • COUNTY OF ERIE, NEW YORK _____________________________________________________________________________________________________________________________________
See accompanying notes to the financial statements.
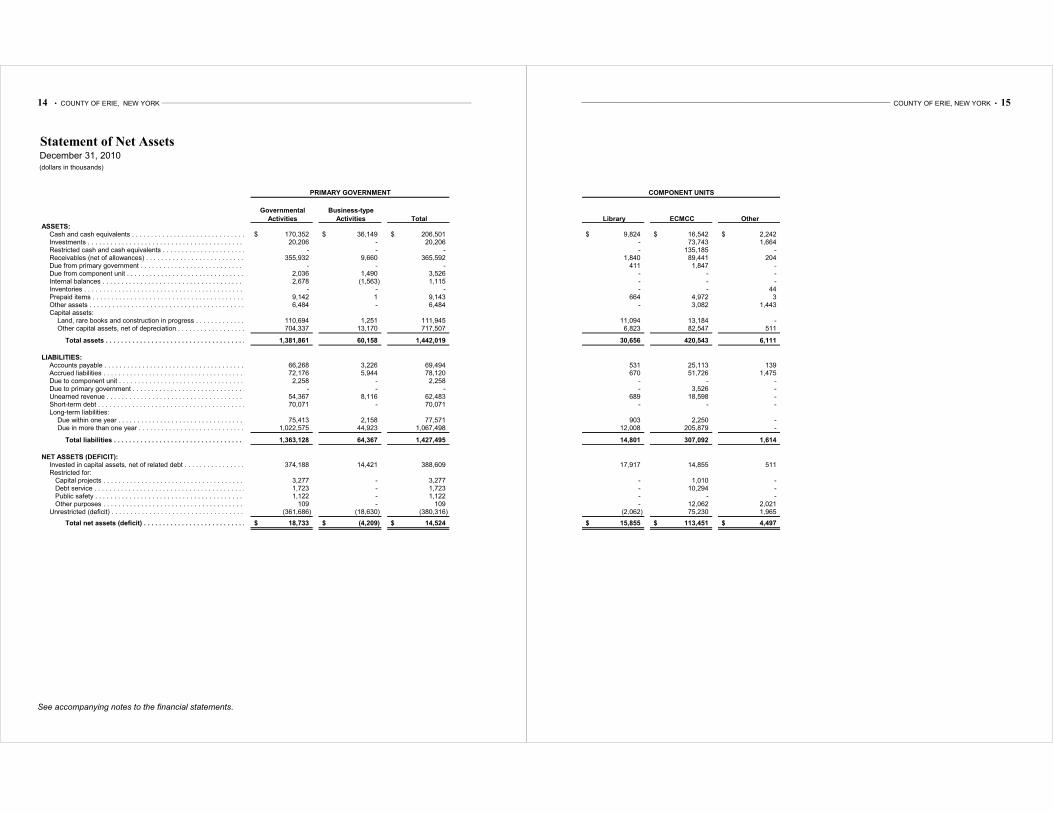
Statement of Net AssetsDecember 31, 2010(dollars in thousands)
Governmental Business-type
Activities Activities Total ASSETS:
Cash and cash equivalents . . . . . . . . . . . . . . . . . . . . . . . . . . . . . . . . . . . . . . . . . . . . . . . . . . .x 170,352$ 36,149$ 206,501$ Investments . . . . . . . . . . . . . . . . . . . . . . . . . . . . . . . . . . . . . . . . . . . . . . . . . . . . . . . . . .x 20,206 - 20,206 Restricted cash and cash equivalents . . . . . . . . . . . . . . . . . . . . . . . . . . . . . . . . . .. . . . . . . . . . . .x - - - Receivables (net of allowances) . . . . . . . . . . . . . . . . . . . . . . . . . . . . . . . . . .. . . . . . . . . . . . . . x 355,932 9,660 365,592 Due from primary government . . . . . . . . . . . . . . . . . . . . . . . . . . . . . . . . . .. . . . . . . . . . . . . . . . x - - - Due from component unit . . . . . . . . . . . . . . . . . . . . . . . . . . . . . . . . . . . . . . . . . . . . . . . . . . . .x 2,036 1,490 3,526 Internal balances . . . . . . . . . . . . . . . . . . . . . . . . . . . . . . . . . . . . . . . . . . . . . . . . . . . . . . .x 2,678 (1,563) 1,115 Inventories . . . . . . . . . . . . . . . . . . . . . . . . . . . . . . . . . . . . . . . . . . . . . . . . . . . . . . . . . .x - - - Prepaid items . . . . . . . . . . . . . . . . . . . . . . . . . . . . . . . . . . . . . . . . . . . . . . . . . . . . . . . . .x 9,142 1 9,143 Other assets . . . . . . . . . . . . . . . . . . . . . . . . . . . . . . . . . . . . . . . . . . . . . . . . . . . . . . . . . x 6,484 - 6,484 Capital assets: x
Land, rare books and construction in progress . . . . . . . . . . . . . . . . . . . . . . . . . . . . . . . . . . . . . . . . .x 110,694 1,251 111,945 Other capital assets, net of depreciation . . . . . . . . . . . . . . . . . . . . . . . . . . . . . . . . . . . . . . . . . . .x 704,337 13,170 717,507
Total assets . . . . . . . . . . . . . . . . . . . . . . . . . . . . . . . . . . . . . . . . . . . . . . . . . . . . . . . . . x 1,381,861 60,158 1,442,019
LIABILITIES:Accounts payable . . . . . . . . . . . . . . . . . . . . . . . . . . . . . . . . . . . . . . . . . . . . . . . . . . . . . . . x 66,268 3,226 69,494 Accrued liabilities . . . . . . . . . . . . . . . . . . . . . . . . . . . . . . . . . . . . . . . . . . . . . . . . . . . . . .x 72,176 5,944 78,120 Due to component unit . . . . . . . . . . . . . . . . . . . . . . . . . . . . . . . . . . . . . . . . . . . . . . . . . . . . .x 2,258 - 2,258 Due to primary government . . . . . . . . . . . . . . . . . . . . . . . . . . . . . . . . . . . . . . . . . . . . . . . . . . .x - - - Unearned revenue . . . . . . . . . . . . . . . . . . . . . . . . . . . . . . . . . . . . . . . . . . . . . . . . . . . . . . . x 54,367 8,116 62,483 Short-term debt . . . . . . . . . . . . . . . . . . . . . . . . . . . . . . . . . . . . . . . . . . . . . . . . . . . . . . . .x 70,071 - 70,071 Long-term liabilities: x
Due within one year . . . . . . . . . . . . . . . . . . . . . . . . . . . . . . . . . . . . . . . . . . . . . . . . . . . . . .x 75,413 2,158 77,571 Due in more than one year . . . . . . . . . . . . . . . . . . . . . . . . . . . . . . . . . . . . . . . . . . . . . . . . . . .x 1,022,575 44,923 1,067,498
x
Total liabilities . . . . . . . . . . . . . . . . . . . . . . . . . . . . . . . . . . . . . . . . . . . . . . . . . . . . . . .x 1,363,128 64,367 1,427,495
x
NET ASSETS (DEFICIT): xInvested in capital assets, net of related debt . . . . . . . . . . . . . . . . . . . . . . . . . . . . . . . . . . . . . . . .x 374,188 14,421 388,609 Restricted for: x Capital projects . . . . . . . . . . . . . . . . . . . . . . . . . . . . . . . . . . . . . . . . . . . . . . . . . . . . . .x 3,277 - 3,277 Debt service . . . . . . . . . . . . . . . . . . . . . . . . . . . . . . . . . . . . . . . . . . . . . . . . . . . . . . . .x 1,723 - 1,723 Public safety . . . . . . . . . . . . . . . . . . . . . . . . . . . . . . . . . . . . . . . . . . . . . . . . . . . . . . . x 1,122 - 1,122 Other purposes . . . . . . . . . . . . . . . . . . . . . . . . . . . . . . . . . . . . . . . . . . . . . . . . . . . . . . .x 109 - 109 Unrestricted (deficit) . . . . . . . . . . . . . . . . . . . . . . . . . . . . . . . . . . . . . . . . . . . . . . . . . . . . x (361,686) (18,630) (380,316)
xTotal net assets (deficit) . . . . . . . . . . . . . . . . . . . . . . . . . . . . . . . . . . . . . . . . . . . . . . . . . . x 18,733$ (4,209)$ 14,524$
PRIMARY GOVERNMENT
______________________________________________________________________________________________________ COUNTY OF ERIE, NEW YORK • 15
Library ECMCC Other
9,824$ 16,542$ 2,242$ - 73,743 1,664 - 135,185 -
1,840 89,441 204 411 1,847 -
- - - - - - - - 44
664 4,972 3 - 3,082 1,443
11,094 13,184 - 6,823 82,547 511
30,656 420,543 6,111
531 25,113 139 670 51,726 1,475
- - - - 3,526 -
689 18,598 - - - -
903 2,250 - 12,008 205,879 -
14,801 307,092 1,614
17,917 14,855 511
- 1,010 - - 10,294 - - - - - 12,062 2,021
(2,062) 75,230 1,965
15,855$ 113,451$ 4,497$
COMPONENT UNITS
16 • COUNTY OF ERIE, NEW YORK _____________________________________________________________________________________________________________________________________
See accompanying notes to the financial statements.
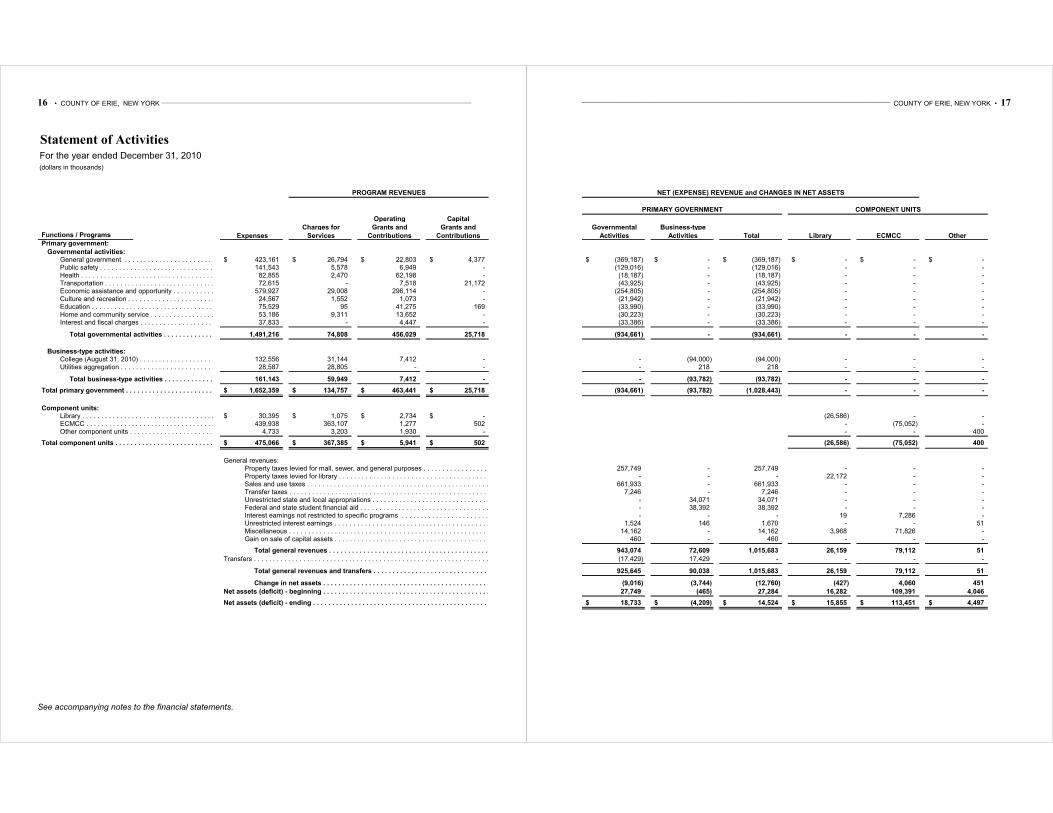
Statement of ActivitiesFor the year ended December 31, 2010(dollars in thousands)
Operating Capital
Charges for Grants and Grants and Functions / Programs Expenses Services Contributions Contributions Primary government:
Governmental activities:General government . . . . . . . . . . . . . . . . . . . . . . . . . . . . . . . . . . . . . . . . . .x 423,161$ 26,794$ 22,803$ 4,377$ Public safety . . . . . . . . . . . . . . . . . . . . . . . . . . . . . . . . . . . . . . . . . .x 141,543 5,578 6,949 - Health . . . . . . . . . . . . . . . . . . . . . . . . . . . . . . . . . . . . . . . . . .x 82,855 2,470 62,198 - Transportation . . . . . . . . . . . . . . . . . . . . . . . . . . . . . . . . . . . . . . . . . .x 72,615 - 7,518 21,172 Economic assistance and opportunity . . . . . . . . . . . . . . . . . . . . . . . . . . . . . . . . . . . . . . . . . .x 579,927 29,008 296,114 - Culture and recreation . . . . . . . . . . . . . . . . . . . . . . . . . . . . . . . . . . . . . . . . . .x 24,567 1,552 1,073 - Education . . . . . . . . . . . . . . . . . . . . . . . . . . . . . . . . . . . . . . . . . .x 75,529 95 41,275 169 Home and community service . . . . . . . . . . . . . . . . . . . . . . . . . . . . . . . . . . . . . . . . . .x 53,186 9,311 13,652 - Interest and fiscal charges . . . . . . . . . . . . . . . . . . . . . . . . . . . . . . . . . . . . . . . . . .x 37,833 - 4,447 -
x
Total governmental activities . . . . . . . . . . . . . . . . . . . . . .x 1,491,216 74,808 456,029 25,718
x
Business-type activities: xCollege (August 31, 2010) . . . . . . . . . . . . . . . . . . . . . . . . . . . . . . . . . . . . . . . . . .x 132,556 31,144 7,412 - Utilities aggregation . . . . . . . . . . . . . . . . . . . . . . . . . . . . . . . . . . . . . . . . . .x 28,587 28,805 - -
x
Total business-type activities . . . . . . . . . . . . . . . . . . . x 161,143 59,949 7,412 - x
Total primary government . . . . . . . . . . . . . . . . . . . . . . . . . . . . . . . x 1,652,359$ 134,757$ 463,441$ 25,718$
x
Component units: xLibrary . . . . . . . . . . . . . . . . . . . . . . . . . . . . . . . . . . . . . . . . . .x 30,395$ 1,075$ 2,734$ -$ ECMCC . . . . . . . . . . . . . . . . . . . . . . . . . . . . . . . . . . . . . . . . . .x 439,938 363,107 1,277 502 Other component units . . . . . . . . . . . . . . . . . . . . . . . . . . . . . . . . . . . . . . . . . .x 4,733 3,203 1,930 -
xTotal component units . . . . . . . . . . . . . . . . . . . . . . . . . . . . . . . . . . . . . . . .x 475,066$ 367,385$ 5,941$ 502$
General revenues: Property taxes levied for mall, sewer, and general purposes . . . . . . . . . . . . . . . . . . . . . . . . . . . . x Property taxes levied for library . . . . . . . . . . . . . . . . . . . . . . . . . . . . . . . . . . . . . . . . . x Sales and use taxes . . . . . . . . . . . . . . . . . . . . . . . . . . . . . . . . . . . . . . . . . . . . . . . . . . . . . . . . . . . . . . . . . . .x Transfer taxes . . . . . . . . . . . . . . . . . . . . . . . . . . . . . . . . . . . . . . . . . . . . . . . . . . . . . . . . . . . . . . . . . . .x Unrestricted state and local appropriations . . . . . . . . . . . . . . . . . . . . . . . . . . . . . . . . . . . . x Federal and state student financial aid . . . . . . . . . . . . . . . . . . . . . . . . . . . . . . . . . . . . . . x Interest earnings not restricted to specific programs . . . . . . . . . . . . . . . . . . . . . . . . . . . . . . .x Unrestricted interest earnings . . . . . . . . . . . . . . . . . . . . . . . . . . . . . . . . . . . . . . . . . . .x Miscellaneous . . . . . . . . . . . . . . . . . . . . . . . . . . . . . . . . . . . . . . . . . . . . . . . . . . . . . . . . . . . . . . . . . . .x Gain on sale of capital assets . . . . . . . . . . . . . . . . . . . . . . . . . . . . . . . . . . . . . . . . . . .x
x Total general revenues . . . . . . . . . . . . . . . . . . . . . . . . . . . . . . . . . . . . . . . . . . . . x
Transfers . . . . . . . . . . . . . . . . . . . . . . . . . . . . . . . . . . . . . . . . . . . . . . . . . . . . . . . . . . . . . . . . . . . . . . . . . . . . . . xx
Total general revenues and transfers . . . . . . . . . . . . . . . . . . . . . . . . . . . . . . . . . . . . . xx
Change in net assets . . . . . . . . . . . . . . . . . . . . . . . . . . . . . . . . . . . . . . . . . . . . . x
Net assets (deficit) - beginning . . . . . . . . . . . . . . . . . . . . . . . . . . . . . . . . . . . . . . . . . . . . . . . xx
Net assets (deficit) - ending . . . . . . . . . . . . . . . . . . . . . . . . . . . . . . . . . . . . . . . . . . . . . . . . .xx
PROGRAM REVENUES
______________________________________________________________________________________________________ COUNTY OF ERIE, NEW YORK • 17
Governmental Business-type
Activities Activities Total Library ECMCC Other
(369,187)$ -$ (369,187)$ -$ -$ -$ (129,016) - (129,016) - - - (18,187) - (18,187) - - - (43,925) - (43,925) - - -
(254,805) - (254,805) - - - (21,942) - (21,942) - - - (33,990) - (33,990) - - - (30,223) - (30,223) - - - (33,386) - (33,386) - - -
(934,661) - (934,661) - - -
- (94,000) (94,000) - - - - 218 218 - - -
- (93,782) (93,782) - - -
(934,661) (93,782) (1,028,443) - - -
(26,586) - - - (75,052) - - - 400
(26,586) (75,052) 400
257,749 - 257,749 - - - - - - 22,172 - -
661,933 - 661,933 - - - 7,246 - 7,246 - - -
- 34,071 34,071 - - - - 38,392 38,392 - - - - - - 19 7,286 -
1,524 146 1,670 - - 51 14,162 - 14,162 3,968 71,826 -
460 - 460 - - - x
943,074 72,609 1,015,683 26,159 79,112 51
(17,429) 17,429 - - - - x -
925,645 90,038 1,015,683 26,159 79,112 51 x
(9,016) (3,744) (12,760) (427) 4,060 451
27,749 (465) 27,284 16,282 109,391 4,046 x
18,733$ (4,209)$ 14,524$ 15,855$ 113,451$ 4,497$ x
PRIMARY GOVERNMENT
NET (EXPENSE) REVENUE and CHANGES IN NET ASSETS
COMPONENT UNITS
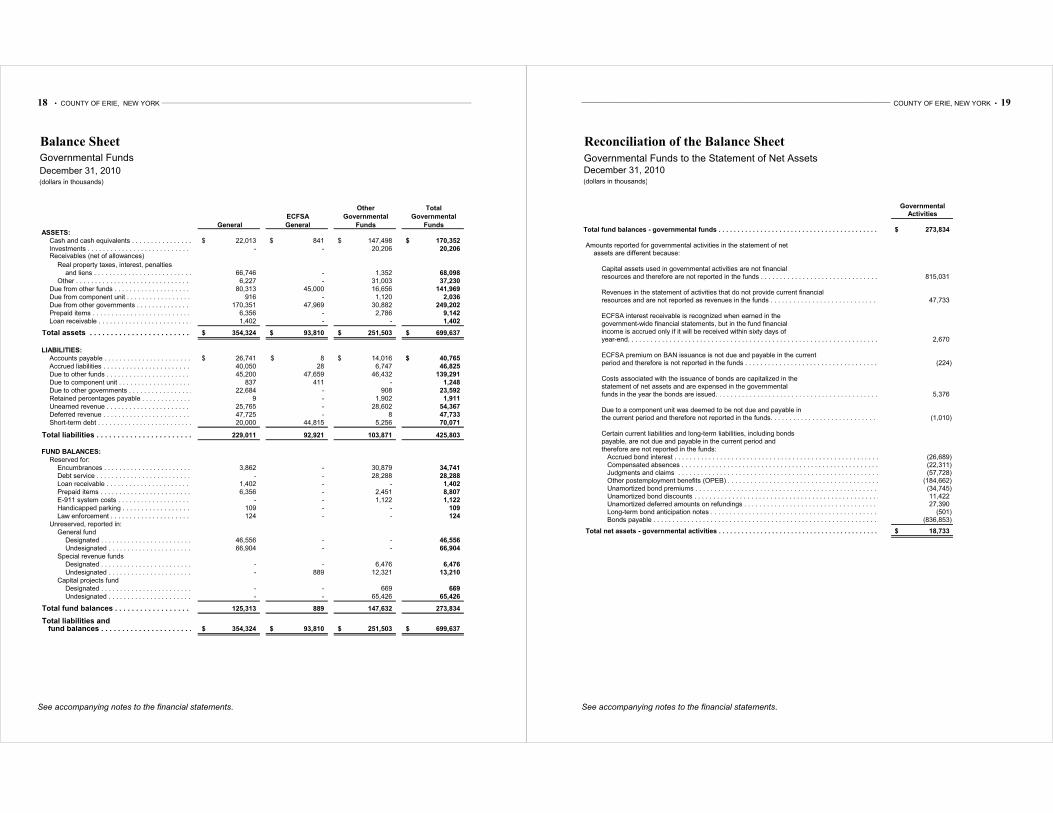
18 • COUNTY OF ERIE, NEW YORK _____________________________________________________________________________________________________________________________________
See accompanying notes to the financial statements.
Balance Sheet
Governmental Funds December 31, 2010 (dollars in thousands)
Other Total
ECFSA Governmental Governmental
General General Funds Funds ASSETS:
Cash and cash equivalents . . . . . . . . . . . . . . . . . . . . . . . . . . . . . . . . . . . . . . . . . . . . . . . . . . x 22,013$ 841$ 147,498$ 170,352$ Investments . . . . . . . . . . . . . . . . . . . . . . . . . . . . . . . . . . . . . . . . . . . . . . . . . . . . . . . . . x - - 20,206 20,206 Receivables (net of allowances) x
Real property taxes, interest, penalties xand liens . . . . . . . . . . . . . . . . . . . . . . . . . . . . . . . . . . . . . . . . .x 66,746 - 1,352 68,098
Other . . . . . . . . . . . . . . . . . . . . . . . . . . . . . . . . . . . . . . . . . . .x 6,227 - 31,003 37,230 Due from other funds . . . . . . . . . . . . . . . . . . . . . . . . . . . . . . . . . . . . . . . . . . . . . . . . . . .x 80,313 45,000 16,656 141,969 Due from component unit . . . . . . . . . . . . . . . . . . . . . . . . . . . . . . . . . . . . . . . . . . . . . . . . . . .x 916 - 1,120 2,036 Due from other governments . . . . . . . . . . . . . . . . . . . . . . . . . . . . . . . . . . . . . . . . . . . . . . . . . . x 170,351 47,969 30,882 249,202 Prepaid items . . . . . . . . . . . . . . . . . . . . . . . . . . . . . . . . . . . . . . . . . . . . . . . . . . .x 6,356 - 2,786 9,142 Loan receivable . . . . . . . . . . . . . . . . . . . . . . . . . . . . . . . . . . . . . . . . . . . . . . . . . . .x 1,402 - - 1,402
xTotal assets . . . . . . . . . . . . . . . . . . . . . . . . . . . . . . . . . . . . . . . . . . . . . . . . . . .x 354,324$ 93,810$ 251,503$ 699,637$
x
LIABILITIES: xAccounts payable . . . . . . . . . . . . . . . . . . . . . . . . . . . . . . . . . . . . . . . . . . . . . . . . . . .x 26,741$ 8$ 14,016$ 40,765$ Accrued liabilities . . . . . . . . . . . . . . . . . . . . . . . . . . . . . . . . . . . . . . . . . . . . . . . . . . .x 40,050 28 6,747 46,825 Due to other funds . . . . . . . . . . . . . . . . . . . . . . . . . . . . . . . . . . . . . . . . . . . . . . . . . . .x 45,200 47,659 46,432 139,291 Due to component unit . . . . . . . . . . . . . . . . . . . . . . . . . . . . . . . . . . . . . . . . . . . . . . . . . . .x 837 411 - 1,248 Due to other governments . . . . . . . . . . . . . . . . . . . . . . . . . . . . . . . . . . . . . . . . . . . . . . . . . . .x 22,684 - 908 23,592 Retained percentages payable . . . . . . . . . . . . . . . . . . . . . . . . . . . . . . . . . . . . . . . . . . . . . . . . . x 9 - 1,902 1,911 Unearned revenue . . . . . . . . . . . . . . . . . . . . . . . . . . . . . . . . . . . . . . . . . . . . . . . . . . .x 25,765 - 28,602 54,367 Deferred revenue . . . . . . . . . . . . . . . . . . . . . . . . . . . . . . . . . . . . . . . . . . . . . . . . . . .x 47,725 - 8 47,733 Short-term debt . . . . . . . . . . . . . . . . . . . . . . . . . . . . . . . . . . . . . . . . . . . . . . . . . . .x 20,000 44,815 5,256 70,071
x
Total liabilities . . . . . . . . . . . . . . . . . . . . . . . . . . . . . . . . . . . . . . . . . . . . . . . . . . .x 229,011 92,921 103,871 425,803 x
FUND BALANCES: xReserved for: x
Encumbrances . . . . . . . . . . . . . . . . . . . . . . . . . . . . . . . . . . . . . . . . . . . . . . . . . . .x 3,862 - 30,879 34,741 Debt service . . . . . . . . . . . . . . . . . . . . . . . . . . . . . . . . . . . . . . . . . . . . . . . . . . .x - - 28,288 28,288 Loan receivable . . . . . . . . . . . . . . . . . . . . . . . . . . . . . . . . . . . . . . . . . . . . . . . . . . .x 1,402 - - 1,402 Prepaid items . . . . . . . . . . . . . . . . . . . . . . . . . . . . . . . . . . . . . . . . . . . . . . . . . . .x 6,356 - 2,451 8,807 E-911 system costs . . . . . . . . . . . . . . . . . . . . . . . . . . . . . . . . . . . . . . . . . . . . . . . . . . .x - - 1,122 1,122 Handicapped parking . . . . . . . . . . . . . . . . . . . . . . . . . . . . . . . . . . . . . . . . . . . . . . . . . . .x 109 - - 109 Law enforcement . . . . . . . . . . . . . . . . . . . . . . . . . . . . . . . . . . . . . . . . . . . . . . . . . . .x 124 - - 124
Unreserved, reported in: xGeneral fund x
Designated . . . . . . . . . . . . . . . . . . . . . . . . . . . . . . . . . . . . . . . . . . . . . . . . . . .x 46,556 - - 46,556 Undesignated . . . . . . . . . . . . . . . . . . . . . . . . . . . . . . . . . . . . . . . . . . . . . . . . . . .x 66,904 - - 66,904
Special revenue funds xDesignated . . . . . . . . . . . . . . . . . . . . . . . . . . . . . . . . . . . . . . . . . . . . . . . . . . .x - - 6,476 6,476 Undesignated . . . . . . . . . . . . . . . . . . . . . . . . . . . . . . . . . . . . . . . . . . . . . . . . . . .x - 889 12,321 13,210
Capital projects fund xDesignated . . . . . . . . . . . . . . . . . . . . . . . . . . . . . . . . . . . . . . . . . . . . . . . . . . .x - - 669 669 Undesignated . . . . . . . . . . . . . . . . . . . . . . . . . . . . . . . . . . . . . . . . . . . . . . . . . . .x - - 65,426 65,426
Total fund balances . . . . . . . . . . . . . . . . . . . . . . . . . . . . . . . . . . . . . . . . . . . . . . . . . . .x 125,313 889 147,632 273,834 x
Total liabilities and fund balances . . . . . . . . . . . . . . . . . . . . . . . . . . . . . . . . . . . . . . . . . . . . . . . . . . .x 354,324$ 93,810$ 251,503$ 699,637$
______________________________________________________________________________________________________ COUNTY OF ERIE, NEW YORK • 19
See accompanying notes to the financial statements.
Reconciliation of the Balance Sheet
Governmental Funds to the Statement of Net AssetsDecember 31, 2010(dollars in thousands)
GovernmentalActivities
Total fund balances - governmental funds . . . . . . . . . . . . . . . . . . . . . . . . . . . . . . . . . . . . . . . . . . . . . . . . . . . . . . . . . . . . . . . . . . . . . . . . . . . . . . . . . . . . . . . .x 273,834$ x
Amounts reported for governmental activities in the statement of net xassets are different because: x
xCapital assets used in governmental activities are not financial xresources and therefore are not reported in the funds . . . . . . . . . . . . . . . . . . . . . . . . . . . . . . . . . . . . .x 815,031
xRevenues in the statement of activities that do not provide current financial xresources and are not reported as revenues in the funds . . . . . . . . . . . . . . . . . . . . . . . . . . . . . . . . . . . .x 47,733
xECFSA interest receivable is recognized when earned in the xgovernment-wide financial statements, but in the fund financial xincome is accrued only if it will be received within sixty days of xyear-end. . . . . . . . . . . . . . . . . . . . . . . . . . . . . . . . . . . . . . . . . . . . . . . . . . . . . . . . . . . . . . . . . . . . . . . . . . . . . . . . . . . . . . . . . . x 2,670
xECFSA premium on BAN issuance is not due and payable in the currentperiod and therefore is not reported in the funds . . . . . . . . . . . . . . . . . . . . . . . . . . . . . . . . . . . . . . .x (224)
Costs associated with the issuance of bonds are capitalized in the xstatement of net assets and are expensed in the governmental xfunds in the year the bonds are issued. . . . . . . . . . . . . . . . . . . . . . . . . . . . . . . . . . . . . . . . . . . . .x 5,376
xDue to a component unit was deemed to be not due and payable in xthe current period and therefore not reported in the funds. . . . . . . . . . . . . . . . . . . . . . . . . . . . . . . . . . .x (1,010)
xCertain current liabilities and long-term liabilities, including bonds xpayable, are not due and payable in the current period and xtherefore are not reported in the funds: x
Accrued bond interest . . . . . . . . . . . . . . . . . . . . . . . . . . . . . . . . . . . . . . . . . . . . . . . . . . . . . . . . . . . . . . . . . . . . . . . . . . . . . . . . . . . . . . . . . x (26,689) Compensated absences . . . . . . . . . . . . . . . . . . . . . . . . . . . . . . . . . . . . . . . . . . . . . . . . . . . . . x (22,311) Judgments and claims . . . . . . . . . . . . . . . . . . . . . . . . . . . . . . . . . . . . . . . . . . . . . . . . . . . . . . . . . . . . . . . . . . . . . . . . . . . . . . . . . . . . . . . . . x (57,728) Other postemployment benefits (OPEB) . . . . . . . . . . . . . . . . . . . . . . . . . . . . . . . . . . . . . . . . . . . . . x (184,662) Unamortized bond premiums . . . . . . . . . . . . . . . . . . . . . . . . . . . . . . . . . . . . . . . . . . . . . . . . . . .x (34,745) Unamortized bond discounts . . . . . . . . . . . . . . . . . . . . . . . . . . . . . . . . . . . . . . . . . . . . . . . . . . x 11,422 Unamortized deferred amounts on refundings . . . . . . . . . . . . . . . . . . . . . . . . . . . . . . . . . . . . . . . . . . x 27,390 Long-term bond anticipation notes . . . . . . . . . . . . . . . . . . . . . . . . . . . . . . . . . . . . . . . . . . . . . . .x (501) Bonds payable . . . . . . . . . . . . . . . . . . . . . . . . . . . . . . . . . . . . . . . . . . . . . . . . . . . . . . . . . . . . . . . . . . . . . . . . . . . . . . . . . . . . . . . . . x (836,853)
xTotal net assets - governmental activities . . . . . . . . . . . . . . . . . . . . . . . . . . . . . . . . . . . . . . . . . . . . . . . . . . . . . . . . . . . . . . . . . . . . . . . . . . . . . . . . . . . . . . . .x 18,733$
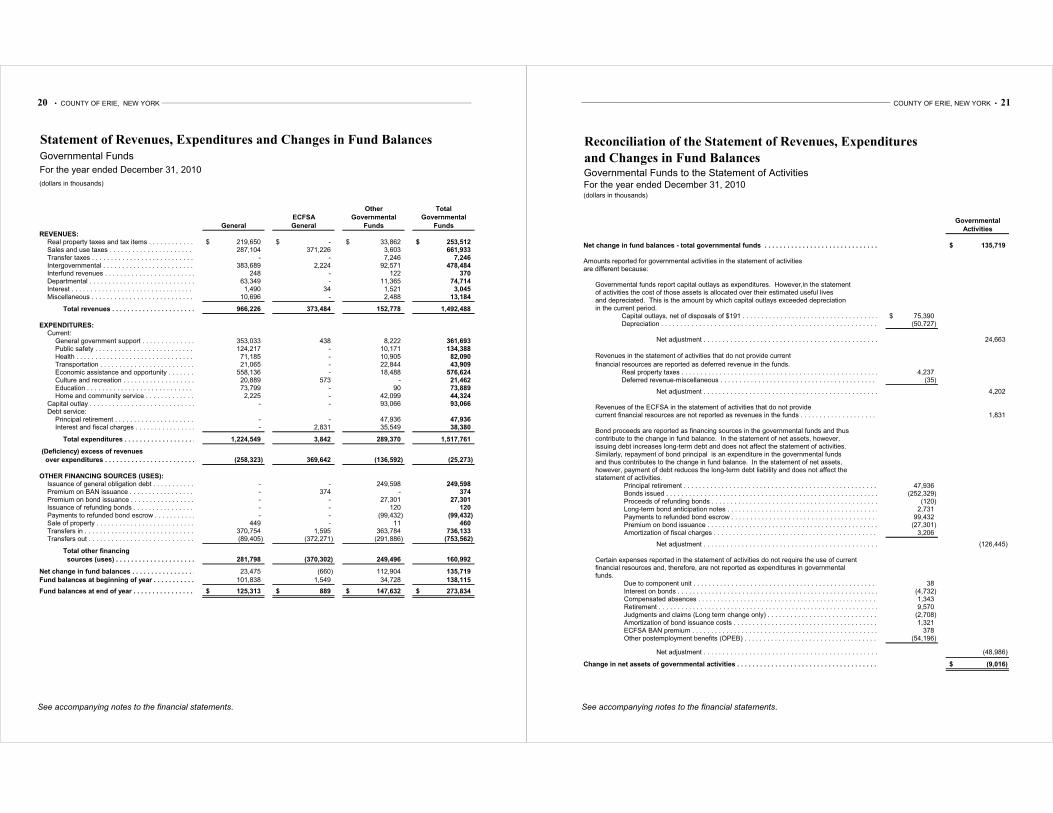
20 • COUNTY OF ERIE, NEW YORK _____________________________________________________________________________________________________________________________________
See accompanying notes to the financial statements.
Statement of Revenues, Expenditures and Changes in Fund Balances
Governmental Funds For the year ended December 31, 2010
(dollars in thousands)
Other Total
ECFSA Governmental Governmental
General General Funds Funds
REVENUES:Real property taxes and tax items . . . . . . . . . . . . . . . . . . . . . . . . . . . . . . . . . . . . . . . . . . . . . . .x 219,650$ -$ 33,862$ 253,512$ Sales and use taxes . . . . . . . . . . . . . . . . . . . . . . . . . . . . . . . . . . . . . . . . . . . . . . . . . .x 287,104 371,226 3,603 661,933 Transfer taxes . . . . . . . . . . . . . . . . . . . . . . . . . . . . . . . . . . . . . . . . . . . . . . . . . .x - - 7,246 7,246 Intergovernmental . . . . . . . . . . . . . . . . . . . . . . . . . . . . . . . . . . . . . . . . . . . . . . . . . .x 383,689 2,224 92,571 478,484 Interfund revenues . . . . . . . . . . . . . . . . . . . . . . . . . . . . . . . . . . . . . . . . . . . . . . . . . .x 248 - 122 370 Departmental . . . . . . . . . . . . . . . . . . . . . . . . . . . . . . . . . . . . . . . . . . . . . . . . . .x 63,349 - 11,365 74,714 Interest . . . . . . . . . . . . . . . . . . . . . . . . . . . . . . . . . . . . . . . . . . . . . . . . . .x 1,490 34 1,521 3,045 Miscellaneous . . . . . . . . . . . . . . . . . . . . . . . . . . . . . . . . . . . . . . . . . . . . . . . . . .x 10,696 - 2,488 13,184
Total revenues . . . . . . . . . . . . . . . . . . . . . . . . . . . . . . . . . . . . . . . . . . . . . . . . . .x 966,226 373,484 152,778 1,492,488
EXPENDITURES:Current:
General government support . . . . . . . . . . . . . . . . . . . . . . . . . . . . . . . . . . . . . . . . . . . . . . . . . .x 353,033 438 8,222 361,693 Public safety . . . . . . . . . . . . . . . . . . . . . . . . . . . . . . . . . . . . . . . . . . . . . . . . . .x 124,217 - 10,171 134,388 Health . . . . . . . . . . . . . . . . . . . . . . . . . . . . . . . . . . . . . . . . . . . . . . . . . .x 71,185 - 10,905 82,090 Transportation . . . . . . . . . . . . . . . . . . . . . . . . . . . . . . . . . . . . . . . . . . . . . . . . . .x 21,065 - 22,844 43,909 Economic assistance and opportunity . . . . . . . . . . . . . . . . . . . . . . . . . . . . . . . . . . . . . . . . . . . . . .x 558,136 - 18,488 576,624 Culture and recreation . . . . . . . . . . . . . . . . . . . . . . . . . . . . . . . . . . . . . . . . . . . . . . . . . .x 20,889 573 - 21,462 Education . . . . . . . . . . . . . . . . . . . . . . . . . . . . . . . . . . . . . . . . . . . . . . . . . .x 73,799 - 90 73,889 Home and community service . . . . . . . . . . . . . . . . . . . . . . . . . . . . . . . . . . . . . . . . . . . . . . . . . .x 2,225 - 42,099 44,324
Capital outlay . . . . . . . . . . . . . . . . . . . . . . . . . . . . . . . . . . . . . . . . . . . . . . . . . .x - - 93,066 93,066 Debt service:
Principal retirement . . . . . . . . . . . . . . . . . . . . . . . . . . . . . . . . . . . . . . . . . . . . . . . . . .x - - 47,936 47,936 Interest and fiscal charges . . . . . . . . . . . . . . . . . . . . . . . . . . . . . . . . . . . . . . . . . . . . . . . . . .x - 2,831 35,549 38,380
Total expenditures . . . . . . . . . . . . . . . . . . . . . . . . . . . . . . . . . . . . . . . . . . . . . . . . . .x 1,224,549 3,842 289,370 1,517,761
(Deficiency) excess of revenues
over expenditures . . . . . . . . . . . . . . . . . . . . . . . . . . . . . . . . . . . . . . . . . . . . . . . . . .x (258,323) 369,642 (136,592) (25,273)
OTHER FINANCING SOURCES (USES):Issuance of general obligation debt . . . . . . . . . . . . . . . . . . . . . . . . . . . . . . . . . . . . . . . . . . . . . .x - - 249,598 249,598 Premium on BAN issuance . . . . . . . . . . . . . . . . . . . . . . . . . . . . . . . . . . . . . . . . . . . . . . . . . .x - 374 - 374 Premium on bond issuance . . . . . . . . . . . . . . . . . . . . . . . . . . . . . . . . . . . . . . . . . . . . . . . . . .x - - 27,301 27,301 Issuance of refunding bonds . . . . . . . . . . . . . . . . . . . . . . . . . . . . x - - 120 120 Payments to refunded bond escrow . . . . . . . . . . . . . . . . . . . . . x - - (99,432) (99,432) Sale of property . . . . . . . . . . . . . . . . . . . . . . . . . . . . . . . . . . . . . . . . . . . . . . . . . .x 449 - 11 460 Transfers in . . . . . . . . . . . . . . . . . . . . . . . . . . . . . . . . . . . . . . . . . . . . . . . . . .x 370,754 1,595 363,784 736,133 Transfers out . . . . . . . . . . . . . . . . . . . . . . . . . . . . . . . . . . . . . . . . . . . . . . . . . .x (89,405) (372,271) (291,886) (753,562)
Total other financing
sources (uses) . . . . . . . . . . . . . . . . . . . . . . . . . . . . . . . . . . . . . . . . . . . . . . . . . .x 281,798 (370,302) 249,496 160,992
Net change in fund balances . . . . . . . . . . . . . . . . . . . . . . . . . . . . . . . . . . . . . . . . . . . . . . . . . .x 23,475 (660) 112,904 135,719
Fund balances at beginning of year . . . . . . . . . . . . . . . . . . . . . . . . . . . . . . . . . . . . . . . . . . . . . . x 101,838 1,549 34,728 138,115
Fund balances at end of year . . . . . . . . . . . . . . . . . . . . . . . . . . . . . . . . . . . . . . . . . . . . . . . . . x 125,313$ 889$ 147,632$ 273,834$
______________________________________________________________________________________________________ COUNTY OF ERIE, NEW YORK • 21
See accompanying notes to the financial statements.
Reconciliation of the Statement of Revenues, Expenditures
and Changes in Fund BalancesGovernmental Funds to the Statement of ActivitiesFor the year ended December 31, 2010(dollars in thousands)
Governmental
Activitiesx
Net change in fund balances - total governmental funds . . . . . . . . . . . . . . . . . . . . . . . . . . . . . . . . . . . .x 135,719$ x
Amounts reported for governmental activities in the statement of activities xare different because: x
xGovernmental funds report capital outlays as expenditures. However,in the statement xof activities the cost of those assets is allocated over their estimated useful lives xand depreciated. This is the amount by which capital outlays exceeded depreciation xin the current period. x
Capital outlays, net of disposals of $191 . . . . . . . . . . . . . . . . . . . . . . . . . . . . . . . . . . . . . . . . . . .x 75,390$ Depreciation . . . . . . . . . . . . . . . . . . . . . . . . . . . . . . . . . . . . . . . . . . . . . . . . . . . . . . . . . . . . . x (50,727)
Net adjustment . . . . . . . . . . . . . . . . . . . . . . . . . . . . . . . . . . . . . . . . . . . . . . . .x 24,663 x
Revenues in the statement of activities that do not provide current x
financial resources are reported as deferred revenue in the funds. xReal property taxes . . . . . . . . . . . . . . . . . . . . . . . . . . . . . . . . . . . . . . . . . . . . . . . . . . . . . .x 4,237 Deferred revenue-miscellaneous . . . . . . . . . . . . . . . . . . . . . . . . . . . . . . . . . . . . . . . . . . . . . . . . x (35)
Net adjustment . . . . . . . . . . . . . . . . . . . . . . . . . . . . . . . . . . . . . . . . . . . . . . . .x 4,202
Revenues of the ECFSA in the statement of activities that do not provide xcurrent financial resources are not reported as revenues in the funds . . . . . . . . . . . . . . . . . . . . . . . . . . . . .x 1,831
Bond proceeds are reported as financing sources in the governmental funds and thus xcontribute to the change in fund balance. In the statement of net assets, however, xissuing debt increases long-term debt and does not affect the statement of activities. xSimilarly, repayment of bond principal is an expenditure in the governmental funds xand thus contributes to the change in fund balance. In the statement of net assets, xhowever, payment of debt reduces the long-term debt liability and does not affect the xstatement of activities. x
Principal retirement . . . . . . . . . . . . . . . . . . . . . . . . . . . . . . . . . . . . . . . . . . . . . . . . . . . . . x 47,936 Bonds issued . . . . . . . . . . . . . . . . . . . . . . . . . . . . . . . . . . . . . . . . . . . . . . . . . . . . . . . . . x (252,329) Proceeds of refunding bonds . . . . . . . . . . . . . . . . . . . . . . . . . . . . . . . . . . . . . . . . . . . . . . . . . .x (120) Long-term bond anticipation notes . . . . . . . . . . . . . . . . . . . . . . . . . . . . . . . . . . . . . . . . . . . . . . .x 2,731 Payments to refunded bond escrow . . . . . . . . . . . . . . . . . . . . . . . . . . . . . . . . . . . . . . . . . . . . . . . x 99,432 Premium on bond issuance . . . . . . . . . . . . . . . . . . . . . . . . . . . . . . . . . . . . . . . . . . . . . . . . . . . x (27,301) Amortization of fiscal charges . . . . . . . . . . . . . . . . . . . . . . . . . . . . . . . . . . . . . . . . . . . . . . . . x 3,206
Net adjustment . . . . . . . . . . . . . . . . . . . . . . . . . . . . . . . . . . . . . . . . . . . . . . . .x (126,445)
Certain expenses reported in the statement of activities do not require the use of current xfinancial resources and, therefore, are not reported as expenditures in governmental xfunds. x
Due to component unit . . . . . . . . . . . . . . . . . . . . . . . . . . . . . . . . . . . . . . . . . . . . . . . . . . . . .x 38 Interest on bonds . . . . . . . . . . . . . . . . . . . . . . . . . . . . . . . . . . . . . . . . . . . . . . . . . . . . . . .x (4,732) Compensated absences . . . . . . . . . . . . . . . . . . . . . . . . . . . . . . . . . . . . . . . . . . . . . . . . . . . . . x 1,343 Retirement . . . . . . . . . . . . . . . . . . . . . . . . . . . . . . . . . . . . . . . . . . . . . . . . . . . . . . . . . . . . . x 9,570 Judgments and claims (Long term change only) . . . . . . . . . . . . . . . . . . . . . . . . . . . . . . . . . . . . . . . . . x (2,708) Amortization of bond issuance costs . . . . . . . . . . . . . . . . . . . . . . . . . . . . . . . . . . . . . . . . . . . . . .x 1,321 ECFSA BAN premium . . . . . . . . . . . . . . . . . . . . . . . . . . . . . . . . . . . . . . . . . . . . . . . . . . . . . . .x 378 Other postemployment benefits (OPEB) . . . . . . . . . . . . . . . . . . . . . . . . . . . . . . . . . . . . . . . . . . . . . x (54,196)
Net adjustment . . . . . . . . . . . . . . . . . . . . . . . . . . . . . . . . . . . . . . . . . . . . . . . .x (48,986)
Change in net assets of governmental activities . . . . . . . . . . . . . . . . . . . . . . . . . . . . . . . . . . . . . . . .x (9,016)$
x
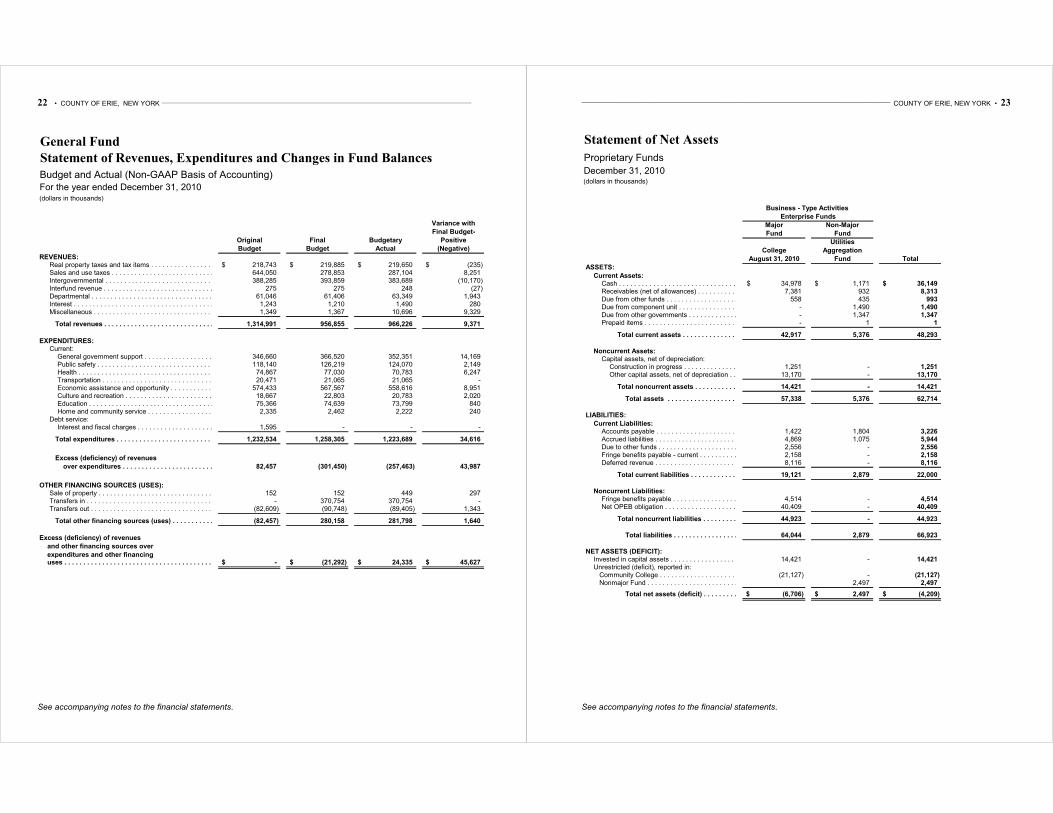
22 • COUNTY OF ERIE, NEW YORK _____________________________________________________________________________________________________________________________________
See accompanying notes to the financial statements.
General Fund
Statement of Revenues, Expenditures and Changes in Fund Balances
Budget and Actual (Non-GAAP Basis of Accounting)For the year ended December 31, 2010(dollars in thousands)
Variance with
Final Budget-
Original Final Budgetary Positive
Budget Budget Actual (Negative)
REVENUES: Real property taxes and tax items . . . . . . . . . . . . . . . . . . . . . . . . . . . . . . . . . . . . . . . . . . . . . . . 218,743$ 219,885$ 219,650$ (235)$ Sales and use taxes . . . . . . . . . . . . . . . . . . . . . . . . . . . . . . . . . . . . . . . . . . . . . . . . . . . . . . 644,050 278,853 287,104 8,251 Intergovernmental . . . . . . . . . . . . . . . . . . . . . . . . . . . . . . . . . . . . . . . . . . . . . . . . . . . . . . . 388,285 393,859 383,689 (10,170) Interfund revenue . . . . . . . . . . . . . . . . . . . . . . . . . . . . . . . . . . . . . . . . . . . . . . . . . . . . . . . 275 275 248 (27) Departmental . . . . . . . . . . . . . . . . . . . . . . . . . . . . . . . . . . . . . . . . . . . . . . . . . . . . . . . . . 61,046 61,406 63,349 1,943 Interest . . . . . . . . . . . . . . . . . . . . . . . . . . . . . . . . . . . . . . . . . . . . . . . . . . . . . . . . . . . 1,243 1,210 1,490 280 Miscellaneous . . . . . . . . . . . . . . . . . . . . . . . . . . . . . . . . . . . . . . . . . . . . . . . . . . . . . . . . . 1,349 1,367 10,696 9,329
Total revenues . . . . . . . . . . . . . . . . . . . . . . . . . . . . . . . . . . . . . . . . . . . . . . . . . . . . . . . . 1,314,991 956,855 966,226 9,371
EXPENDITURES: Current:
General government support . . . . . . . . . . . . . . . . . . . . . . . . . . . . . . . . . . . . . . . . . . . . . . . . . . 346,660 366,520 352,351 14,169 Public safety . . . . . . . . . . . . . . . . . . . . . . . . . . . . . . . . . . . . . . . . . . . . . . . . . . . . . . . . . 118,140 126,219 124,070 2,149 Health . . . . . . . . . . . . . . . . . . . . . . . . . . . . . . . . . . . . . . . . . . . . . . . . . . . . . . . . . . . . 74,867 77,030 70,783 6,247 Transportation . . . . . . . . . . . . . . . . . . . . . . . . . . . . . . . . . . . . . . . . . . . . . . . . . . . . . . . . 20,471 21,065 21,065 - Economic assistance and opportunity . . . . . . . . . . . . . . . . . . . . . . . . . . . . . . . . . . . . . . . . . . . . . . 574,433 567,567 558,616 8,951 Culture and recreation . . . . . . . . . . . . . . . . . . . . . . . . . . . . . . . . . . . . . . . . . . . . . . . . . . . . 18,667 22,803 20,783 2,020 Education . . . . . . . . . . . . . . . . . . . . . . . . . . . . . . . . . . . . . . . . . . . . . . . . . . . . . . . . . . . 75,366 74,639 73,799 840 Home and community service . . . . . . . . . . . . . . . . . . . . . . . . . . . . . . . . . . . . . . . . . . . . . . . . . . 2,335 2,462 2,222 240
Debt service: Interest and fiscal charges . . . . . . . . . . . . . . . . . . . . . . . . . . . . . . . . . . . . . . . . . . . . . . . . . . 1,595 - - -
Total expenditures . . . . . . . . . . . . . . . . . . . . . . . . . . . . . . . . . . . . . . . . . . . . . . . . . . . . . . 1,232,534 1,258,305 1,223,689 34,616
Excess (deficiency) of revenues
over expenditures . . . . . . . . . . . . . . . . . . . . . . . . . . . . . . . . . . . . . . . . . . . . . . . . . . . . . . . 82,457 (301,450) (257,463) 43,987
OTHER FINANCING SOURCES (USES): Sale of property . . . . . . . . . . . . . . . . . . . . . . . . . . . . . . . . . . . . . . . . . . . . . . . . . . . . . . . 152 152 449 297 Transfers in . . . . . . . . . . . . . . . . . . . . . . . . . . . . . . . . . . . . . . . . . . . . . . . . . . . . . . . . . - 370,754 370,754 - Transfers out . . . . . . . . . . . . . . . . . . . . . . . . . . . . . . . . . . . . . . . . . . . . . . . . . . . . . . . . . (82,609) (90,748) (89,405) 1,343
Total other financing sources (uses) . . . . . . . . . . . . . . . . . . . . . . . . . . . . . . . . . . . . . . . . . . . . . (82,457) 280,158 281,798 1,640
Excess (deficiency) of revenues
and other financing sources over
expenditures and other financing uses . . . . . . . . . . . . . . . . . . . . . . . . . . . . . . . . . . . . . . . . . . . . . . . . . . . . . . . . . . . . . -$ (21,292)$ 24,335$ 45,627$
______________________________________________________________________________________________________ COUNTY OF ERIE, NEW YORK • 23
See accompanying notes to the financial statements.
Statement of Net Assets
Proprietary Funds
December 31, 2010(dollars in thousands)
Major Non-Major
Fund Fund
Utilities
College Aggregation
August 31, 2010 Fund Total
ASSETS:
Current Assets:Cash . . . . . . . . . . . . . . . . . . . . . . . . . . . . . . . . . . . . . . . . . . . . . . . . . . 34,978$ 1,171$ 36,149$ Receivables (net of allowances) . . . . . . . . . . . . . . . . . . . . . . . . . . . . . . . . . . . . . . . . . . . . . . . . 7,381 932 8,313 Due from other funds . . . . . . . . . . . . . . . . . . . . . . . . . . . . . . . . . . . . . . . . . . . . . . . . . . 558 435 993 Due from component unit . . . . . . . . . . . . . . . . . . . . . . . . . . . . . . . . . . . . . . . . . . . . . . . . . . - 1,490 1,490 Due from other governments . . . . . . . . . . . . . . . . . . . . . . . . . . . . . . . . . . . . . . . . . . . . . . . . . . - 1,347 1,347 Prepaid items . . . . . . . . . . . . . . . . . . . . . . . . . . . . . . . . . . . . . . . . . . . . . . . . . . - 1 1
Total current assets . . . . . . . . . . . . . . . . . . . . . . . . . . . . . . . . . . . . . . . . . . . . . . . . . . 42,917 5,376 48,293
Noncurrent Assets: Capital assets, net of depreciation:
Construction in progress . . . . . . . . . . . . . . . . . . . . . . . . . . . . . . . . . . . . . . . . . . . . . . . . . . 1,251 - 1,251 Other capital assets, net of depreciation . . . . . . . . . . . . . . . . . . . . . . . . . . . . . . . . . . . . . . . . . . . 13,170 - 13,170
Total noncurrent assets . . . . . . . . . . . . . . . . . . . . . . . . . . . . . . . . . . . . . . . . . . . . . . . . . . 14,421 - 14,421
Total assets . . . . . . . . . . . . . . . . . . . . . . . . . . . . . . . . . . . . . . . . . . . . . . . . . . 57,338 5,376 62,714
LIABILITIES:
Current Liabilities: Accounts payable . . . . . . . . . . . . . . . . . . . . . . . . . . . . . . . . . . . . . . . . . . . . . . . . . . 1,422 1,804 3,226 Accrued liabilities . . . . . . . . . . . . . . . . . . . . . . . . . . . . . . . . . . . . . . . . . . . . . . . . . . 4,869 1,075 5,944 Due to other funds . . . . . . . . . . . . . . . . . . . . . . . . . . . . . . . . . . . . . . . . . . . . . . . . . . 2,556 - 2,556 Fringe benefits payable - current . . . . . . . . . . . . . . . . . . . . . . . . . . . . . . . . . . . . . . . . . . . . . . . 2,158 - 2,158 Deferred revenue . . . . . . . . . . . . . . . . . . . . . . . . . . . . . . . . . . . . . . . . . . . . . . . . . . 8,116 - 8,116
Total current liabilities . . . . . . . . . . . . . . . . . . . . . . . . . . . . . . . . . . . . . . . . . . . . . . . . . . 19,121 2,879 22,000
Noncurrent Liabilities: Fringe benefits payable . . . . . . . . . . . . . . . . . . . . . . . . . . . . . . . . . . . . . . . . . . . . . . . . . . 4,514 - 4,514 Net OPEB obligation . . . . . . . . . . . . . . . . . . . . . . . . . . . . . . . . . . . . . . . . . . . . . . . . . . 40,409 - 40,409
Total noncurrent liabilities . . . . . . . . . . . . . . . . . . . . . . . . . . . . . . . . . . . . . . . . . . . . . . . . . 44,923 - 44,923
Total liabilities . . . . . . . . . . . . . . . . . . . . . . . . . . . . . . . . . . . . . . . . . . . . . . . . . . 64,044 2,879 66,923
NET ASSETS (DEFICIT): Invested in capital assets . . . . . . . . . . . . . . . . . . . . . . . . . . . . . . . . . . . . . . . . . . . . . . . . . . 14,421 - 14,421 Unrestricted (deficit), reported in:
Community College . . . . . . . . . . . . . . . . . . . . . . . . . . . . . . . . . . . . . . . . . . . . . . . . . . (21,127) - (21,127) Nonmajor Fund . . . . . . . . . . . . . . . . . . . . . . . . . . . . . . . . . . . . . . . . . . . . . . . . . . 2,497 2,497
Total net assets (deficit) . . . . . . . . . . . . . . . . . . . . . . . . . . . . . . . . . . . . . . . . . . . . . . . . . . (6,706)$ 2,497$ (4,209)$
Business - Type Activities
Enterprise Funds
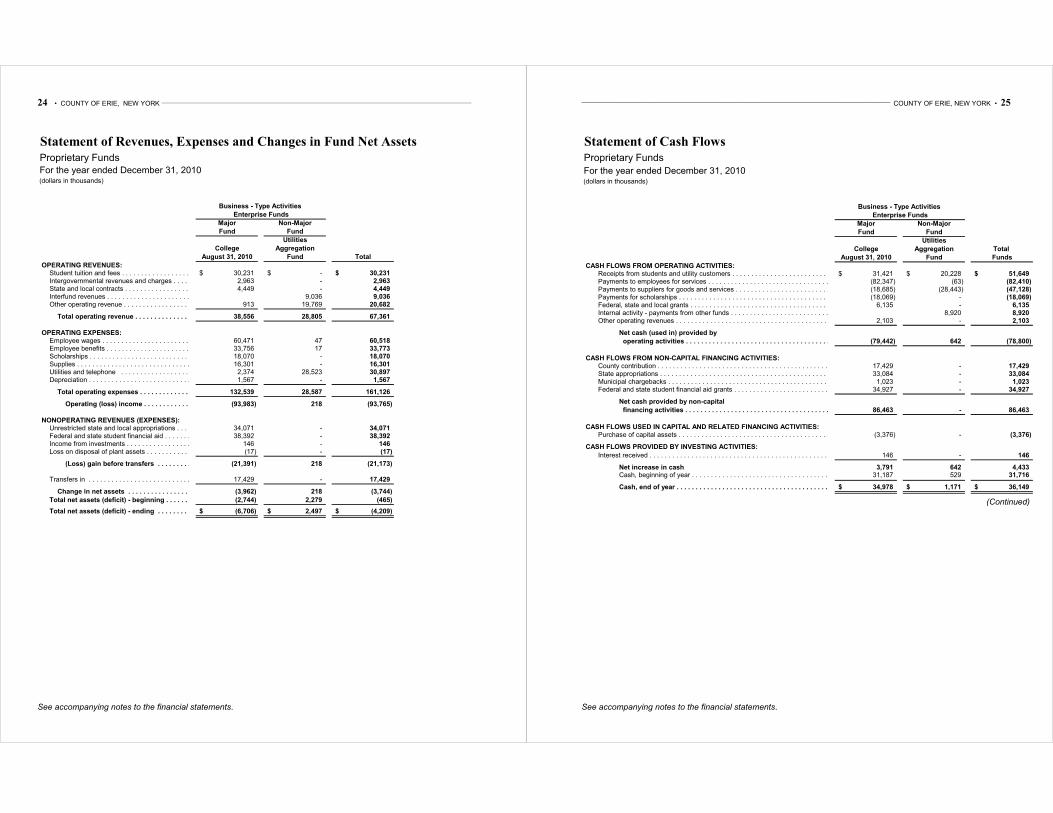
24 • COUNTY OF ERIE, NEW YORK _____________________________________________________________________________________________________________________________________
See accompanying notes to the financial statements.
Statement of Revenues, Expenses and Changes in Fund Net Assets
Proprietary FundsFor the year ended December 31, 2010(dollars in thousands)
Major Non-Major
Fund Fund
Utilities
College Aggregation
August 31, 2010 Fund Total
OPERATING REVENUES: xStudent tuition and fees . . . . . . . . . . . . . . . . . . . . . . . . . . . . . . . . . . . . . . . . . . . . . . . . . .x 30,231$ -$ 30,231$ Intergovernmental revenues and charges . . . . . . . . . . . . . . . . . . . . . . . . . . . . . . . . . . . . . . . . . . . . x 2,963 - 2,963 State and local contracts . . . . . . . . . . . . . . . . . . . . . . . . . . . . . . . . . . . . . . . . . . . . . . . . . .x 4,449 - 4,449 Interfund revenues . . . . . . . . . . . . . . . . . . . . . . . . . . . . . . . . . . . . . . . . . . . . . . . . . .x 9,036 9,036 Other operating revenue . . . . . . . . . . . . . . . . . . . . . . . . . . . . . . . . . . . . . . . . . . . . . . . . . .x 913 19,769 20,682
x
Total operating revenue . . . . . . . . . . . . . . . . . . . . . . . . . . . . . . . . . . . . . . . . . . . . . . . . . .x 38,556 28,805 67,361 x
OPERATING EXPENSES: xEmployee wages . . . . . . . . . . . . . . . . . . . . . . . . . . . . . . . . . . . . . . . . . . . . . . . . . .x 60,471 47 60,518 Employee benefits . . . . . . . . . . . . . . . . . . . . . . . . . . . . . . . . . . . . . . . . . . . . . . . . . .x 33,756 17 33,773 Scholarships . . . . . . . . . . . . . . . . . . . . . . . . . . . . . . . . . . . . . . . . . . . . . . . . . .x 18,070 - 18,070 Supplies . . . . . . . . . . . . . . . . . . . . . . . . . . . . . . . . . . . . . . . . . . . . . . . . . .x 16,301 - 16,301 Utilities and telephone . . . . . . . . . . . . . . . . . . . . . . . . . . . . . . . . . . . . . . . . . . . . . . . . . .x 2,374 28,523 30,897 Depreciation . . . . . . . . . . . . . . . . . . . . . . . . . . . . . . . . . . . . . . . . . . . . . . . . . .x 1,567 - 1,567
x
Total operating expenses . . . . . . . . . . . . . . . . . . . . . . . . . . . . . . . . . . . . . . . . . . . . . . . . . .x 132,539 28,587 161,126 x
Operating (loss) income . . . . . . . . . . . . . . . . . . . . . . . . . . . . . . . . . . . . . . . . . . . . . . . . . .x (93,983) 218 (93,765) x
NONOPERATING REVENUES (EXPENSES): xUnrestricted state and local appropriations . . . . . . . . . . . . . . . . . . . . . . . . . . . . . . . . . . . . . . . . . .x 34,071 - 34,071 Federal and state student financial aid . . . . . . . . . . . . . . . . . . . . . . . . . . . . . . . . . . . . . . . . . . . .x 38,392 - 38,392 Income from investments . . . . . . . . . . . . . . . . . . . . . . . . . . . . . . . . . . . . . . . . . . . . . . . . . .x 146 - 146 Loss on disposal of plant assets . . . . . . . . . . . . . . . . . . . . . . . . . . . . . . . . . . . . . . . . . . . . . . . x (17) - (17)
x
(Loss) gain before transfers . . . . . . . . . . . . . . . . . . . . . . . . . . . . . . . . . . . . . . . . . . . . . . . . .x (21,391) 218 (21,173) x
Transfers in . . . . . . . . . . . . . . . . . . . . . . . . . . . . . . . . . . . . . . . . . . . . . . . . . .x 17,429 - 17,429 x
Change in net assets . . . . . . . . . . . . . . . . . . . . . . . . . . . . . . . . . . . . . . . . . . . . . . . . . .x (3,962) 218 (3,744)
Total net assets (deficit) - beginning . . . . . . . . . . . . . . . . . . . . . . . . . . . . . . . . . . . . . . . . . . . . x (2,744) 2,279 (465) x
Total net assets (deficit) - ending . . . . . . . . . . . . . . . . . . . . . . . . . . . . . . . . . . . . . . . . . . . . . x (6,706)$ 2,497$ (4,209)$
x
Business - Type Activities
Enterprise Funds
______________________________________________________________________________________________________ COUNTY OF ERIE, NEW YORK • 25
See accompanying notes to the financial statements.
Statement of Cash Flows
Proprietary Funds
For the year ended December 31, 2010(dollars in thousands)
Major Non-Major
Fund Fund
Utilities
College Aggregation Total
August 31, 2010 Fund Funds
CASH FLOWS FROM OPERATING ACTIVITIES:Receipts from students and utility customers . . . . . . . . . . . . . . . . . . . . . . . . . . . . . . . . . . . . . . . . . x 31,421$ 20,228$ 51,649$ Payments to employees for services . . . . . . . . . . . . . . . . . . . . . . . . . . . . . . . . . . . . . . . . . . . . . . x (82,347) (63) (82,410) Payments to suppliers for goods and services . . . . . . . . . . . . . . . . . . . . . . . . . . . . . . . . . . . . . . . . . x (18,685) (28,443) (47,128) Payments for scholarships . . . . . . . . . . . . . . . . . . . . . . . . . . . . . . . . . . . . . . . . . . . . . . . . .x (18,069) - (18,069) Federal, state and local grants . . . . . . . . . . . . . . . . . . . . . . . . . . . . . . . . . . . . . . . . . . . . . . . .x 6,135 - 6,135 Internal activity - payments from other funds . . . . . . . . . . . . . . . . . . . . . . . . . . . . . . . . . . . . . . . . .x 8,920 8,920 Other operating revenues . . . . . . . . . . . . . . . . . . . . . . . . . . . . . . . . . . . . . . . . . . . . . . . . .x 2,103 - 2,103
x Net cash (used in) provided by x operating activities . . . . . . . . . . . . . . . . . . . . . . . . . . . . . . . . . . . . . . . . . . . . . . .x (79,442) 642 (78,800)
xCASH FLOWS FROM NON-CAPITAL FINANCING ACTIVITIES: x
County contribution . . . . . . . . . . . . . . . . . . . . . . . . . . . . . . . . . . . . . . . . . . . . . . . . .x 17,429 - 17,429 State appropriations . . . . . . . . . . . . . . . . . . . . . . . . . . . . . . . . . . . . . . . . . . . . . . . . .x 33,084 - 33,084 Municipal chargebacks . . . . . . . . . . . . . . . . . . . . . . . . . . . . . . . . . . . . . . . . . . . . . . . . .x 1,023 - 1,023 Federal and state student financial aid grants . . . . . . . . . . . . . . . . . . . . . . . . . . . . . . . . . . . . . . . . x 34,927 - 34,927
x Net cash provided by non-capital x financing activities . . . . . . . . . . . . . . . . . . . . . . . . . . . . . . . . . . . . . . . . . . . . . . .x 86,463 - 86,463
xCASH FLOWS USED IN CAPITAL AND RELATED FINANCING ACTIVITIES: x
Purchase of capital assets . . . . . . . . . . . . . . . . . . . . . . . . . . . . . . . . . . . . . . . . . . . . . . . . .x (3,376) - (3,376)
xCASH FLOWS PROVIDED BY INVESTING ACTIVITIES: xInterest received . . . . . . . . . . . . . . . . . . . . . . . . . . . . . . . . . . . . . . . . . . . . . . . . .x 146 - 146
x Net increase in cash x 3,791 642 4,433 Cash, beginning of year . . . . . . . . . . . . . . . . . . . . . . . . . . . . . . . . . . . . . . . . . . . . . . x 31,187 529 31,716
x Cash, end of year . . . . . . . . . . . . . . . . . . . . . . . . . . . . . . . . . . . . . . . . . . . . . . . . .x 34,978$ 1,171$ 36,149$
x (Continued)x
xx
Business - Type Activities
Enterprise Funds
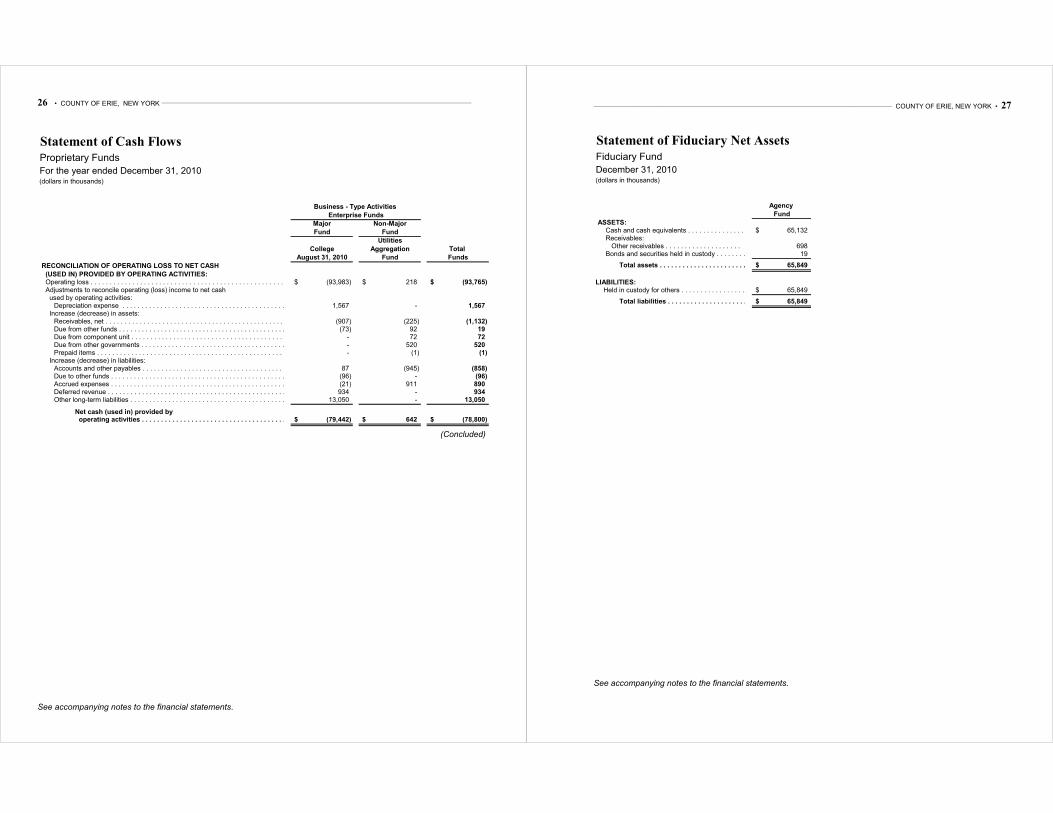
26 • COUNTY OF ERIE, NEW YORK _____________________________________________________________________________________________________________________________________
See accompanying notes to the financial statements.
Statement of Cash Flowsx
Proprietary Funds x
For the year ended December 31, 2010 x
(dollars in thousands) x
x
x
x
x
x Major Non-Major
x Fund Fund
x Utilities
x College Aggregation Total
x August 31, 2010 Fund Funds
RECONCILIATION OF OPERATING LOSS TO NET CASH x(USED IN) PROVIDED BY OPERATING ACTIVITIES: xOperating loss . . . . . . . . . . . . . . . . . . . . . . . . . . . . . . . . . . . . . . . . . . . . . . . . . . . . . . . . x (93,983)$ 218$ (93,765)$ Adjustments to reconcile operating (loss) income to net cash x
used by operating activities: xDepreciation expense . . . . . . . . . . . . . . . . . . . . . . . . . . . . . . . . . . . . . . . . . . . . . . . . .x 1,567 - 1,567
Increase (decrease) in assets: xReceivables, net . . . . . . . . . . . . . . . . . . . . . . . . . . . . . . . . . . . . . . . . . . . . . . . . . . . . . . . x (907) (225) (1,132) Due from other funds . . . . . . . . . . . . . . . . . . . . . . . . . . . . . . . . . . . . . . . . . . . . . . . . .x (73) 92 19 Due from component unit . . . . . . . . . . . . . . . . . . . . . . . . . . . . . . . . . . . . . . . . . . . . . . . . . . . .x - 72 72 Due from other governments . . . . . . . . . . . . . . . . . . . . . . . . . . . . . . . . . . . . . . . . . . . . . . . . . . x - 520 520 Prepaid items . . . . . . . . . . . . . . . . . . . . . . . . . . . . . . . . . . . . . . . . . . . . . . . . . x - (1) (1)
Increase (decrease) in liabilities: xAccounts and other payables . . . . . . . . . . . . . . . . . . . . . . . . . . . . . . . . . . . . . . . . . . . . . . . . .x 87 (945) (858) Due to other funds . . . . . . . . . . . . . . . . . . . . . . . . . . . . . . . . . . . . . . . . . . . . . . . . .x (96) - (96) Accrued expenses . . . . . . . . . . . . . . . . . . . . . . . . . . . . . . . . . . . . . . . . . . . . . . . . .x (21) 911 890 Deferred revenue . . . . . . . . . . . . . . . . . . . . . . . . . . . . . . . . . . . . . . . . . . . . . . . . .x 934 - 934 Other long-term liabilities . . . . . . . . . . . . . . . . . . . . . . . . . . . . . . . . . . . . . . . . . . . . . . . . .x 13,050 - 13,050
x Net cash (used in) provided by x operating activities . . . . . . . . . . . . . . . . . . . . . . . . . . . . . . . . . . . . . . . . . . . . . . .x (79,442)$ 642$ (78,800)$
(Concluded)
Business - Type Activities
Enterprise Funds
_________________________________________________________________________________________________________________________________ COUNTY OF ERIE, NEW YORK • 27
Statement of Fiduciary Net Assets
Fiduciary Fund
December 31, 2010(dollars in thousands)
Agency
Fund
ASSETS: Cash and cash equivalents . . . . . . . . . . . . . . . 65,132$ Receivables:
Other receivables . . . . . . . . . . . . . . . . . . . . 698 Bonds and securities held in custody . . . . . . . . 19
Total assets . . . . . . . . . . . . . . . . . . . . . . . . . . . . . . . . . . . . . . . . . . . . . . . . . . . . . . . . . 65,849$
LIABILITIES: Held in custody for others . . . . . . . . . . . . . . . . . 65,849$
Total liabilities . . . . . . . . . . . . . . . . . . . . . . . . . . . . . . . . . . . . . . . . . . . . . . . . . . . . . . . 65,849$
See accompanying notes to the financial statements.
28 • Notes to the Financial Statements _______________________________________________________________________________________________________________________
NOTES TO THE FINANCIAL STATEMENTS
DECEMBER 31, 2010
I - SUMMARY OF SIGNIFICANT ACCOUNTING POLICIES
The financial statements of the County of Erie, New York (the “County”) have been prepared in conformity
with accounting principles generally accepted in the United States of America (“GAAP”) as applied to
government units. The more significant of the County’s accounting policies are described below.
A. Financial Reporting Entity
The County was established in 1821. Subject to the New York State Constitution, the County
operates pursuant to its Charter and Administrative Code (the “Charter”), as well as various local
laws. Additionally, certain New York State laws govern the County to the extent that such laws are
applicable to counties operating under a charter form of government. The Charter was enacted by
local law and approved by the electorate at a general election held in November 1959. The
Administrative Code was enacted into local law in 1961. The County Legislature is the legislative
body responsible for overall operations, the County Executive serves as chief executive officer, and
the County Comptroller serves as chief fiscal, accounting, reporting and auditing officer.
The County provides mandated social service programs such as Medicaid, Temporary Assistance for
Needy Families and Safety Net. The County also provides services and facilities in the areas of
culture, recreation, police, libraries, youth, health, senior services, roads, and sanitary sewerage.
These general governmental programs and services are financed by various taxes, state and federal
aid, and departmental revenue (which are primarily comprised of service fees and various types of
program-related charges). Additionally, the County operates the Erie Community College (“the
College”).
The financial reporting entity includes the County (the “primary government”) and its significant
component units. A component unit is either a legally separate organization for which the elected
officials of a primary government are financially accountable, or another organization for which the
nature and significance of its relationship with a primary government is such that exclusion would
cause the reporting entity’s financial statements to be misleading or incomplete.
1. DISCRETELY PRESENTED COMPONENT UNITS
Financial data of the County’s component units that are not part of the primary government
is reported in the component units columns in the government-wide financial statements, to
emphasize that these component units are legally separate from the County. The aggregate
discretely presented component units are not simply an extension of the primary government
(e.g. substantially different governing body, and services are provided to the general public).
These discretely present component units include the following:
The Buffalo and Erie County Public Library (the “Library”), formed through a consolidation
of several public and private libraries, was established by the County and chartered by the
State University Board of Regents in 1953. It is a separate and distinct legal corporation that
receives an annual budgetary contribution from the County. Library operations are governed
by a board of trustees who are appointed by the County Legislature. Bonds and notes for
Library capital costs are issued by the County and are obligations of the County. Title to real
and personal property acquired with County funds vests with the County. The Library is
included as a component unit of the County in the financial statements, based on the fact that
_________________________________________________________________________________________________________________________________ COUNTY OF ERIE, NEW YORK • 29
it is a legally separate entity for which the County is financially accountable. The Library
does not issue separate financial statements.
Erie County Medical Center Corporation (“ECMCC”) is a public benefit corporation
created in 2003 for the purpose of acquiring and operating the health facilities of the County.
Effective January 1, 2004 (the “Transfer Date”), a transaction was executed which
transferred ownership of the capital assets, equipment, inventories and certain other assets to
ECMCC in exchange for a payment of $85,000,000 from ECMCC to the County.
Concurrent with the transaction, $101,375,000 of ECMCC bonds were issued, which are
guaranteed by the County. Pursuant to consent decrees entered into between the County and
ECMCC, the County is committed to providing ongoing operating and capital support to
ECMCC. The following component units are included within ECMCC:
Research for Health in Erie County, Inc. - Research for Health in Erie County, Inc.
(“RHEC”) is a nonprofit organization dedicated to developing and increasing the
facilities of the public health institutions, agencies, and departments of the County.
Additionally, RHEC is committed to provide more extensive conduct of studies and
research into the causes, nature, and treatment of diseases, disorders, and defects of
particular importance to the public health. RHEC’s support comes primarily from
various grants from federal, state, and other agencies. The financial statements of
RHEC have been prepared on the accrual basis of accounting. The annual financial
report can be obtained by writing Grant Administration, Research for Health in Erie
County, Inc., 462 Grider Street, Buffalo, NY 14215.
ECMC Lifeline Foundation, Inc. - ECMC Lifeline Foundation, Inc. (the
“Foundation”) is a nonprofit organization exempt from federal income taxes under
Section 501(c)(3) of the Internal Revenue Code. The Foundation was formed for the
purpose of supporting hospital programs generated both by the Foundation and the
Erie County Medical Center. The annual financial report can be obtained by writing
Director, ECMC Lifeline Foundation, Inc., 462 Grider Street, Buffalo, NY 14215.
The Grider Initiative, Inc. - The Grider Initiative, Inc. (the “Physician Endowment”)
is a nonprofit organization exempt from federal income taxes under Section 501
(c)(3) of the Internal Revenue Code. The Physician Endowment was formed in
2009, and funded in 2010, for the purpose of recruiting physicians who shall
practice on the Grider Street campus of the Corporation. The entity was funded
with an initial transfer of $10,000 from the Corporation. Earnings from the
investment of the initial transfer may be used only for physician recruitment and
reasonable and necessary expenses of the entity. The annual financial report can be
obtained by writing to: Chair, The Grider Initiative, Inc. 424 Main Street, Suite
2000, Buffalo, NY 14202.
ECMCC is considered to be a component unit of the County and is discretely presented
based on the fact that it is a legally separate entity for which the County is financially
accountable. Separate financial statements for ECMCC can be obtained from ECMCC, 462
Grider St, Buffalo, New York 14215.
30 • Notes to the Financial Statements _______________________________________________________________________________________________________________________
Other Discretely Presented Component Units: The Auxiliary Services Corporation of Erie Community College, Inc. (the “ECC Auxiliary
Corporation”), and the Erie Community College Foundation, Inc. (the “ECC Foundation”)
are both included as discretely presented component units of the County’s primary
government pursuant to Governmental Accounting Standards Board (“GASB”) Statement
No. 39, Determining Whether Certain Organizations are Component Units based on the fact
that they are legally separate entities for which the College and County are financially
accountable. They receive or hold economic resources that are significant to and can be
accessed by the College that are entirely or almost entirely for the direct benefit of its
constituents (students).
The purpose of the ECC Auxiliary Corporation, a New York non-profit corporation, is to
promote and cultivate educational and social relations through the operation of bookstores,
on-campus dining services, vending facilities, childcare, and student centers for the
convenience of the students, faculty and staff of the College. The ECC Auxiliary
Corporation is funded through sales of merchandise and food, Federal and State grants, and
other fees. Separate financial statements can be obtained from the Auxiliary Services
Corporation of Erie Community College, Inc., Executive Director, 6205 Main Street,
Williamsville, NY 14221.
The ECC Foundation is a New York State nonprofit corporation established to support the
College. Its purpose is to raise, receive, and administer all private gifts and program services
for the College, its programs and its students. Separate financial statements can be obtained
from Erie Community College Foundation, Inc., Executive Director, 4196 Abbott Road,
Orchard Park, NY 14127.
The Buffalo and Erie County Industrial Land Development Corporation, Inc., (“ILDC”) is a
legally separate entity of which the County, acting by and through the County Executive, is
the sole member. It is discretely presented in the County’s financial statements because the
County is financially accountable for it.
A voting majority of the board members are appointed by, and can be removed at will by, the
County. The ILDC is managed by the board.
In 2009, ILDC by–laws and organizing documents were changed and specific activities first
became under the direct governance of Erie County. These changes allow the ILDC to
provide tax-exempt financing to not-for-profit organizations. Such debt of the ILDC can
never be the debt of Erie County or any political subdivision thereof and can only be paid out
of specific revenues and receipts of the ILDC. The ILDC provides no services to the County.
Separate financial statements can be obtained from Buffalo Erie County Industrial Land
Development Corporation Inc., Chief Operating Officer, 275 Oak Street, Buffalo, NY
14203.
2. BLENDED COMPONENT UNITS
Erie County Fiscal Stability Authority (“ECFSA”) is included as a blended component unit
of the County’s primary government pursuant to GASB Statement No. 39 because exclusion
would be misleading. The ECFSA was created to monitor and oversee the finances of the
County. Agencies and departments by the ECFSA’s activities include all the County’s
departments and sewer districts, the College and the Library. It reports using the
_________________________________________________________________________________________________________________________________ COUNTY OF ERIE, NEW YORK • 31
governmental model and its general fund is reported as part of the County’s special revenue
funds.
The ECFSA is a corporate governmental agency and instrumentality of the State of New
York (the “State”) constituting a public benefit corporation created by the Erie County Fiscal
Stability Authority Act, Chapter 182 of the Laws of 2005, as supplemented by Chapter 183
of the Laws of 2005 (the “Act”). The Act became effective July 12, 2005.
The ECFSA is governed by seven directors, each appointed by the Governor, including one
each appointed upon the recommendation of the Majority Leader of the State Senate, the
Speaker of the Assembly and the State Comptroller. The Governor also designates the
chairperson and vice-chairperson from among the directors.
The ECFSA has power under the Act to monitor and oversee the finances of Erie County,
and upon declaration of a “Control Period” as defined in the Act, additional oversight
authority. The ECFSA is also empowered to issue its bonds and notes for various County
purposes, defined in the Act as “Financeable Costs.”
On November 3, 2006, the Authority imposed a control period on the County in accordance
with Section 3595(1)(e) of New York Public Authorities Law through resolution 06-49. The
resolution empowered the ECFSA to operate with its maximum authorized compliment of
control and oversight powers over County finances. During a control period all County
contracts of $50,000 or more and filling of any positions are subject to ECFSA approval and
ECFSA has the power to approve or reject all proposed County borrowings and the County
may not borrow without formal ECFSA approval. In addition, the ECFSA has the right to
freeze wages, although it has not elected to exercise that right. On June 2, 2009, the ECFSA
revoked the control period and reverted to an advisory status with limited control and
oversight powers over County finances.
During 2010, the ECFSA issued serial bonds and a bond anticipation note that were used to
purchase mirror bonds and a revenue anticipation that were issued by the County.
Revenues of the ECFSA consist of sales tax revenues, defined as net collections from sales
and compensating use taxes, penalties and interest authorized by the State and imposed by
the County on the sales and use of tangible personal property and services in the County
(“Sales Tax Revenues”), and investment earnings on money and investments on deposit in
various ECFSA accounts. Sales Tax Revenues collected by the State Comptroller for transfer
to the ECFSA are not subject to appropriation by the State or County. Revenues of the
ECFSA that are not required to pay debt service, operating expenses and other costs of the
ECFSA are payable to the County as frequently as practicable. Separate financial statements
for ECFSA can be obtained from the Erie County Fiscal Stability Authority, 295 Main
Street, Room 946, Buffalo, New York, 14203.
Erie Tobacco Asset Securitization Corporation (“ETASC”) is a special purpose local
development corporation organized under the Not-for-Profit Corporation Law of the State of
New York and is an instrumentality of, but separate and apart from the County. ETASC was
incorporated , for the sole purpose of issuing tobacco settlement asset backed bonds in order
to provide funds to purchase from the County all of the County’s right, title, and interest in
annual payments to be received in settlement of certain smoking-related litigation. Although
legally separate and independent of Erie County, ETASC is considered an affiliated
organization under GASB Statement No. 39 and reported as a component unit of the County
for financial reporting purposes and, accordingly, is included in the County’s financial
32 • Notes to the Financial Statements _______________________________________________________________________________________________________________________
statements. Separate financial statements for ETASC can be obtained from the Erie Tobacco
Asset Securitization Corporation, Treasurer, 95 Franklin Street, Room 1600, Buffalo, New
York, 14202.
Erie Tax Certificate Corporation (“ETCC”) is a special purpose local development
corporation organized under the Not-for-Profit Corporation Law of the State of New York
and is an instrumentality of, but separate and apart from the County. The ETCC was created
for the sole purpose of purchasing certain tax liens owned by the County and collecting the
proceeds that may be received upon redemption of the tax liens or the sale of real property
against which a tax lien exists. Although legally separate and independent of Erie County,
ETCC is considered an affiliated organization under GASB Statement No. 39 and reported
as a component unit of the County for County financial reporting purposes. Separate
financial statements for ETCC can be obtained from the Erie Tax Certificate Corporation,
President, 95 Franklin Street, Room 100, Buffalo, New York 14202.
3. RELATED ORGANIZATIONS
County elected officials nominate and confirm the three-member board of the Erie County
Water Authority, (“Water Authority”) and also appoint a voting majority of the board of the
Buffalo Convention Center Management Corporation (“BCCMC”). The County’s
accountability for these legally separate organizations does not extend beyond making the
board appointments. Specifically, the County cannot impose its will on any of these
organizations. In addition, in the case of the Water Authority, no financial operating
assistance is provided to, nor is the County liable for, any debt issued by this public benefit
corporation. In regard to the not-for-profit BCCMC, the entity and the County are parties to
an exchange transaction under which the BCCMC is responsible for operating and managing
the area’s convention center. These related organizations are not component units of the
County and do not meet the basic criteria for inclusion in the County reporting entity.
4. JOINT VENTURE
The County is a participant in the Western Regional Off-Track Betting Corporation
(“OTB”), a public benefit corporation established under New York State Racing, Pari-
Mutuel Wagering and Breeding Law. The OTB conducts within the region a system of off-
track pari-mutuel betting on horse races, and distributes net revenues to the participants in
accordance with a predetermined formula. Separate financial data for this joint venture has
been excluded from the financial statements, consistent with GAAP. Additional information
about this joint venture is presented in Note XVII.
B. Government-wide and Fund Financial Statements
The government-wide financial statements (i.e., the statement of net assets and the statement of
activities) report information on all of the nonfiduciary activities of the primary government and its
component units. Some amounts reported as interfund activity have been eliminated from these
statements. Governmental activities, which normally are supported by taxes and intergovernmental
revenues, are reported separately from business-type activities, which rely to a significant extent on
fees and charges for support. Likewise, the primary government is reported separately from the
legally separate component units for which the primary government is financially accountable.
The statement of activities demonstrates the degree to which the direct expenses of a given function
or segment is offset by program revenues. Direct expenses are those that are clearly identifiable with
a specific function or segment. Program revenues include: (1) charges to customers or applicants who
_________________________________________________________________________________________________________________________________ COUNTY OF ERIE, NEW YORK • 33
purchase, use, or directly benefit from goods, services, or privileges provided by a given function,
and (2) grants and contributions that are restricted to meeting the operational or capital requirements
of a particular function. Taxes and other items not properly included among program revenues are
reported instead as general revenues.
Separate financial statements are provided for governmental funds, proprietary funds and fiduciary
funds, even though the latter are excluded from the government-wide financial statements. Major
individual governmental funds and major individual enterprise funds are reported as separate
columns in the fund financial statements.
C. Measurement Focus, Basis of Accounting and Financial Statement Presentation
Measurement focus is the determination of what is expressed in reporting an entity’s financial
performance and position, (i.e., expenditures or expenses). A particular measurement focus is
accomplished both by considering what resources will be measured and the basis of accounting.
Basis of accounting refers to when revenues, expenditures/expenses, and the related assets and
liabilities are recognized in the accounts and reported in the financial statements. Basis of accounting
relates to the timing of the measurements made, regardless of the measurement focus.
Accrual Basis – Under the accrual basis of accounting, revenues are recorded when earned and
expenses are recorded when a liability is incurred, regardless of the timing of related cash flows.
Modified Accrual Basis – Under this basis of accounting, revenues are recognized as soon as they are
both measurable and available. Revenues are considered to be available when they are collectible
within the current period or soon enough thereafter to pay liabilities of the current period. For this
purpose, the County considers revenues to be available if they are collected within 60 days of the end
of the current fiscal period (60-day rule). Revenues from federal, state, or other grants designated for
specific County expenditure are recognized when the related expenditures are incurred.
Expenditures generally are recorded when a liability is incurred, as under accrual accounting.
However, debt service expenditures, as well as expenditures related to compensated absences and
claims and judgments, are recorded only when payment is due and expenditures for inventory-type
items and for prepayments (except retirement) are recognized at the time of the disbursements.
The government-wide financial statements are reported using the economic resources measurement
focus and the accrual basis of accounting, as are the proprietary fund, and fiduciary fund financial
statements. Property taxes are recognized as revenues in the year for which they are levied. Grants
and similar items are recognized as revenue as soon as all eligibility requirements imposed by the
provider have been met and are measurable.
Governmental fund financial statements are reported using the current financial resources
measurement focus and the modified accrual basis of accounting. Property taxes, sales and use taxes,
state and federal aid and various grant program revenues associated with the current fiscal period are
all considered to be susceptible to accrual and so have been recognized as revenues of the current
fiscal period. All other revenue items are considered to be measurable and available only when cash
is received by the government, subject to the 60-day rule noted above.
The County reports the following major governmental funds:
General Fund – the principal operating fund that includes all operations not required to be
recorded in other funds.
34 • Notes to the Financial Statements _______________________________________________________________________________________________________________________
ECFSA General Fund – used to account for all of the operations of the ECFSA, included as
a blended component unit. This fund accounts for sales tax revenues received by ECFSA and
for general operating expenditures of ECFSA.
The County reports the following major proprietary fund:
Erie Community College – resources received and used for community college purposes are
accounted for through the College. The College is not a legally separate entity from the
County. A fiscal year ending August 31 is mandated by New York State law for the College.
Accordingly, financial information for the College is presented as of and for the fiscal year
then ended.
The College does not account for certain capital projects, certain capital assets or certain
indebtedness. These are direct functions of the County and are reported within the
governmental activities columns in the government-wide financial statements.
Additional information as excerpted from the College’s financial statements is as follows:
The County Executive and the County Legislature approve the College annual budget, with
the County providing funding for one-half and approximately one-fifth of capital and
operating costs, respectively.
Equipment of the College has been included in the business-type activities column in the
statement of net assets. This equipment is recorded at cost or estimated historical cost.
Donated assets are stated at estimated fair value as of the date received.
Additionally, the County reports the following fiduciary fund type that is used to account for assets
held by the County in a custodial capacity:
Agency Fund – used to account for money and property received and held in the capacity of
custodian or agent. The Agency Fund is custodial in nature and does not involve
measurement of results of operations.
Pursuant to the provisions of GASB Statement No. 20, Accounting and Financial Reporting for
Proprietary Funds and other Governmental Entities that use Proprietary Fund Accounting. Private-
sector standards of accounting and financial reporting issued prior to December 1, 1989, generally are
followed in both the government-wide and proprietary fund financial statements to the extent that
those standards do not conflict with or contradict guidance of GASB. Governments also have the
option of following subsequent private-sector guidance for their business-type activities and
enterprise funds, subject to this same limitation. The County has elected not to follow subsequent
private-sector guidance.
As a general rule, the effect of interfund activity has been eliminated from the government-wide
financial statements. Exceptions to this general rule are interfund services provided and used such as
Utilities Aggregation Fund billings to other funds. Eliminations of these charges would distort the
direct costs and program revenues reported for the various functions concerned.
Amounts reported as program revenues include: (1) charges to customers or applicants for goods,
services, or privileges provided, (2) operating grants and contributions, and (3) capital grants and
contributions. General revenues are those that cannot be associated directly with program activities.
_________________________________________________________________________________________________________________________________ COUNTY OF ERIE, NEW YORK • 35
Proprietary funds distinguish operating revenues and expenses from non-operating items. Operating
revenues and expenses generally result from providing services and producing and delivering goods
in connection with a proprietary fund’s principal ongoing operations. Operating expenses for the
proprietary funds include the cost of sales and services, administrative expenses, and depreciation of
capital assets. All revenues and expenses not meeting this definition are reported as non-operating
revenues and expenses.
When both restricted and unrestricted resources are available for use, it is the County’s policy to use
restricted resources first, then unrestricted resources as they are needed.
D. Deposits and Investments
All highly liquid investments with an original maturity date of three months or less are considered to
be cash equivalents. Investments are stated at fair value, the amount at which a financial instrument
could be exchanged in a current transaction between willing parties.
E. Prepaid Items
Certain payments to vendors and the New York State and Local Employees' Retirement System
reflect costs applicable to future accounting periods and are recorded as prepaid items in both
government-wide and fund financial statements.
F. Capital Assets
All capital assets which are acquired or constructed for general governmental purposes are reported
as expenditures in the fund that finances the asset acquisition and are accounted for and reported in
the government-wide financial statements as capital assets, if they meet the County’s capitalization
criteria. These statements also contain the County’s infrastructure elements that are required to be
capitalized under GAAP. Infrastructure assets include public domain assets such as roads, bridges,
and sewer systems. Such assets are recorded at historical cost or estimated historical cost if
purchased or constructed. Donated capital assets are recorded at estimated fair value at the date of
donation. Major outlays for capital assets and improvements are capitalized as projects are
constructed. The cost of normal maintenance and repairs that do not add to the value of the asset or
materially extend asset lives are not capitalized. Equipment with an initial individual cost equal to or
greater than $10,000 and an estimated useful life of three or more years is capitalized. All purchases
of library books are capitalized because there is no minimum capitalization threshold. Property, plant,
and equipment of the primary government, as well as the component unit, are depreciated using the
straight-line method over the following estimated useful lives:
Description Estimated Lives
Improvements Other Than Buildings 5 - 25 years
Buildings and Improvements 15 - 40 years
Infrastructure 20 - 100 years
Library Collections 5 - 10 years
The Buffalo and Erie County Public Library has a rare book collection that is classified as a Work of
Art and Historical Treasure for financial reporting purposes. This collection is deemed an
inexhaustible asset, and therefore, is not depreciated.
When capital assets are retired, or otherwise disposed of, the cost and related accumulated
depreciation are removed from the accounts, and any resulting gain or loss is reflected in income for
the period in the government-wide statements. Amortization of capital leases is computed using the
straight-line method over the lease term or the estimated useful lives of the assets, whichever is
36 • Notes to the Financial Statements _______________________________________________________________________________________________________________________
shorter. Maintenance and repairs are charged to expense as incurred; significant renewals and
betterments are capitalized.
G. Property Tax Revenue Recognition
The County-wide property tax is levied by the County Legislature effective January 1 of the year the
taxes are recognizable as revenue. Taxes become a lien on the related property on January 1 of the
year for which they are levied. Accordingly, property tax is only recognized as revenue in the year for
which the levy is made, and to the extent that such taxes are received within the reporting period or
60 days thereafter in the fund financial statements.
Delinquent property taxes not collected at year-end (excluding collections in the 60-day subsequent
period) are recorded as deferred revenue in the fund financial statements. The portion of delinquent
property taxes for prior years estimated to be uncollectible at December 31, 2010, amounted to
$11,619,168. This amount has been recorded as an allowance against the property taxes receivable
account.
H. Compensated Absences
Most employees are granted vacation, personal, and sick leave and earn compensatory time in varying
amounts. When they leave service, employees are entitled to payment for accumulated vacation and
unused compensatory time at various rates subject to certain maximum limitations. In addition,
depending on the applicable collective bargaining agreement, retirees may be eligible to receive a
direct cash payment for a portion of unused sick time upon retirement.
Compensated absences for governmental fund type employees are reported as a liability and
expenditure in the government-wide financial statements. Governmental funds recognize the expense
when paid. For proprietary fund type employees, the accumulation is recorded as an accrued liability
and/or other long-term obligation of the proprietary fund type.
Payment of compensated absences recorded in the government-wide financial statements is
dependent upon many factors; therefore, timing of future payment is not readily determinable.
However, management believes that sufficient resources will be made available for the payment of
compensated absences when such payments become due.
I. Insurance
The County assumes the liability for most risk including, but not limited to, property damage,
personal injury liability, medical malpractice, and workers’ compensation. Asserted and incurred but
not reported claims and judgments are recorded when it is probable that an asset has been impaired or
a liability has been incurred and the amount of loss can be reasonably estimated. Such recording is
consistent with the requirements of GASB Statement No. 10, Accounting and Financial Reporting
for Risk Financing and Related Insurance Issues (“GASB 10”). Governmental fund type estimated
current contingent loss liabilities for property damage, personal injury liability, medical malpractice,
and workers’ compensation are reported within governmental activities in the government-wide
financial statements.
Loss contingency liabilities arising from operations of the College are recorded in accordance with
GASB 10 by the County and are reported in full within governmental activities in the government-
wide financial statements and in the General Fund when payment is due. They are only recognized as
a College liability when invoiced from the County.
_________________________________________________________________________________________________________________________________ COUNTY OF ERIE, NEW YORK • 37
J. Pensions
Nearly all County employees are members of various New York State retirement systems. The
County is invoiced annually by the systems for its share of the costs.
K. Statement of Cash Flows
For purposes of reporting cash flows, cash and cash equivalents include the following items: cash on
hand; cash in checking and time accounts; and certain short-term items maturing three months or less
from the date acquired, as permitted by State statute.
L. Restrictions
The government-wide and proprietary fund financial statements utilize a net assets presentation. Net
assets are categorized as invested in capital assets (net of related debt), restricted and unrestricted.
Invested In Capital Assets, Net of Related Debt – This category groups all capital assets,
including infrastructure, into one component of net assets. Accumulated depreciation and the
outstanding balances of debt that are attributable to the acquisition, construction or
improvement of these assets reduce the balance in this category.
Restricted Net Assets – This category presents external restrictions imposed by creditors,
grantors, contributors or laws or regulations of other governments and restrictions imposed by
law through constitutional provisions or enabling legislation. The amount reported as restricted
for other purposes for Governmental Activities, includes $109,278 that is restricted by New
York State Law to payments related to enforcement of Handicapped Parking Laws. In addition,
on the government-wide statement of net assets, ECMCC has reported $1,010,000 as net assets
restricted for capital projects based upon restrictions imposed on certain receivables from the
County by contract or legislative action.
Unrestricted Net Assets – This category represents net assets of the County not restricted for any
project or other purpose.
M. Reserves and Designations
In the fund financial statements, reserves represent that portion of fund balance that has been legally
segregated for a specific use or which cannot be appropriated for expenditure by the County at
December 31, 2010, and include:
Reserved for Encumbrances – representing commitments related to
unperformed (executory) contracts for goods or services.
Reserved for Debt Service – representing resources that must be used for
principal payments that will be made in future periods.
Reserved for Loan Receivable – representing a loan to the Zoological
Society of Buffalo for the redevelopment of the main animal building and a
working capital advance to the ETCC.
Reserved for Prepaid Items – representing amounts prepaid to vendors and
the New York State and Local Employees' Retirement System that are
applicable to future accounting periods. The County limits reservations for
38 • Notes to the Financial Statements _______________________________________________________________________________________________________________________
prepaid items to the amount of fund balance otherwise available and
unreserved.
Reserved for E-911 System Costs – representing unexpended emergency
telephone system surcharge moneys that must be used to pay future system
costs.
Reserved for Handicapped Parking – representing commitments relating to
education, advocacy and increased public awareness of handicapped
parking laws.
Reserved for Law Enforcement – representing funds received from the sale
of surplus helicopter parts to be utilized exclusively to support and maintain
the Sheriff’s Office Aviation Division.
In the fund financial statements, designations are not legally required segregations, but are segregated
for a specific purpose by the County. Accounting prescription set by the Erie County Comptroller
provides for a sunset provision of one fiscal year for all fund balance designations. Legislature
approval is required to establish and subsequently appropriate fund balance designations.
Designations at December 31, 2010 were as follows:
Designated for Subsequent Year’s Expenditures – representing available
fund balances being appropriated to meet future year’s expenditure
requirements. In the General Fund and Sewer Special Revenue Funds,
$46,555,889 and $6,476,339 have been designated respectively. Within the
Tobacco Proceeds and ECMCC Capital Projects Funds, which are recorded
within other governmental funds, designated fund balance represents
tobacco proceeds to be expended on future ECMCC capital projects; this
balance is $668,745 at December 31, 2010.
N. Adoption of New Accounting Pronouncements
During the year ended December 31, 2010 the County adopted the provisions of GASB Statement
No. 51, Accounting and Financial Reporting for Intangible Assets, and GASB Statement No. 58,
Accounting and Financial Reporting for Chapter 9 Bankruptcies, which had no effect on the
County’s financial position or result of operations.
The County also adopted GASB Statement No. 53, Accounting and Financial Reporting for
Derivative Instruments (“GASB 53”). This pronouncement, applicable only to ETASC, addresses the
recognition, measurement, and disclosure of information regarding derivative instruments entered
into by state and local governments. As discussed in Note XII (B), ETASC’s forward purchase swap
agreement was deemed to be an effective hedge at December 31, 2010, requiring changes in the fair
value of the hedging derivative instrument to be recognized as deferred inflows/outflows in the
statement of net assets. As a result of the implementation of this pronouncement, ETASC recorded
an asset with an offsetting liability of $1,108,170, which are presented within other assets and
accrued liabilities, respectively, in the accompanying statement of net assets.
_________________________________________________________________________________________________________________________________ COUNTY OF ERIE, NEW YORK • 39
O. Future Impacts of Accounting Pronouncements
The County has not completed the process of evaluating the impact that will result from adopting
GASB Statement No. 54, Fund Balance Reporting and Governmental Fund Type Definitions, and
GASB Statement No. 59, Financial Instruments Omnibus, which are effective for the year ending
December 31, 2011; GASB Statement No. 57, OPEB Measurements by Agent Employers and Agent
Multiple-Employer Plans, GASB Statement No. 60, Accounting and Financial Reporting for Service
Concession Arrangements, and GASB Statement No. 62, Codification of Accounting and Financial
Reporting Guidance Contained in Pre-November 30, 1989 FASB and AICPA Pronouncements,
which are effective for the year ending December 31, 2012; and GASB Statement No. 61, The
Financial Reporting Entity: Omnibus-an amendment of GASB Statements No. 14 and No. 34, which
is effective for the year ending December 31, 2013. The County is therefore unable to disclose the
impact that adopting GASB Statements No. 54, 57, 59, 60, 61 and 62 will have on its financial
position and results of operations when such statements are adopted.
II – STEWARDSHIP, COMPLIANCE, AND ACCOUNTABILITY
A. Budgetary Information
The County follows these procedures in establishing the budgetary data reflected in the financial
statements:
1. In accordance with the County Charter and Administrative Code, no later than October 15,
the County Executive submits a tentative operating and capital budget which details
proposed expenditures and the proposed means of financing to the Erie County Legislature
for the fiscal year commencing the following January 1. The College budget is not included
in the County Executive’s tentative budget, since it is separately adopted during the first
County legislative meeting in July for the fiscal year commencing September 1.
2. After public hearings are conducted to obtain taxpayer comments, the County Legislature
(governing board) adopts the budget no later than the second Tuesday in December.
3. Annual appropriated budgets are adopted and employed for control of the General Fund; the
Road, Sewer, Downtown Mall, E-911, and Emergency Response Special Revenue Funds;
the Utilities Aggregation Enterprise Fund; and the Debt Service Fund, minimally detailed to
the department, account and selected line item level. The Emergency Response Special
Revenue Fund was established to account for revenues received from the Federal Emergency
Management Agency and expenditures associated with the on-going clean up of major
damage from a storm that occurred in October 2006. These budgets are adopted on a basis
consistent with GAAP, except that encumbrances are reported as budgetary expenditures in
the year of incurrence of commitment to purchase, in the General Fund, the enumerated
Special Revenue Funds and the Debt Service Fund. All unencumbered appropriations lapse
at the end of the fiscal year. Budgetary comparisons presented in this report are on the
budgetary basis and represent the budget as modified. Annual appropriated budgets are not
employed for the Grants and Community Development Special Funds. A reconciliation to
convert GAAP basis data to the budgetary basis is provided below.
4. Capital Projects funds are subject to project budgets determined primarily by the bonding
authorizations used to fund a particular project rather than annual budgetary appropriations.
These budgets do not lapse at year-end; rather, they lapse upon termination of the project.
5. The County Executive is authorized to make budget transfers within the same administrative
unit up to a cumulative total of $10,000 between accounts or line items. Any proposed
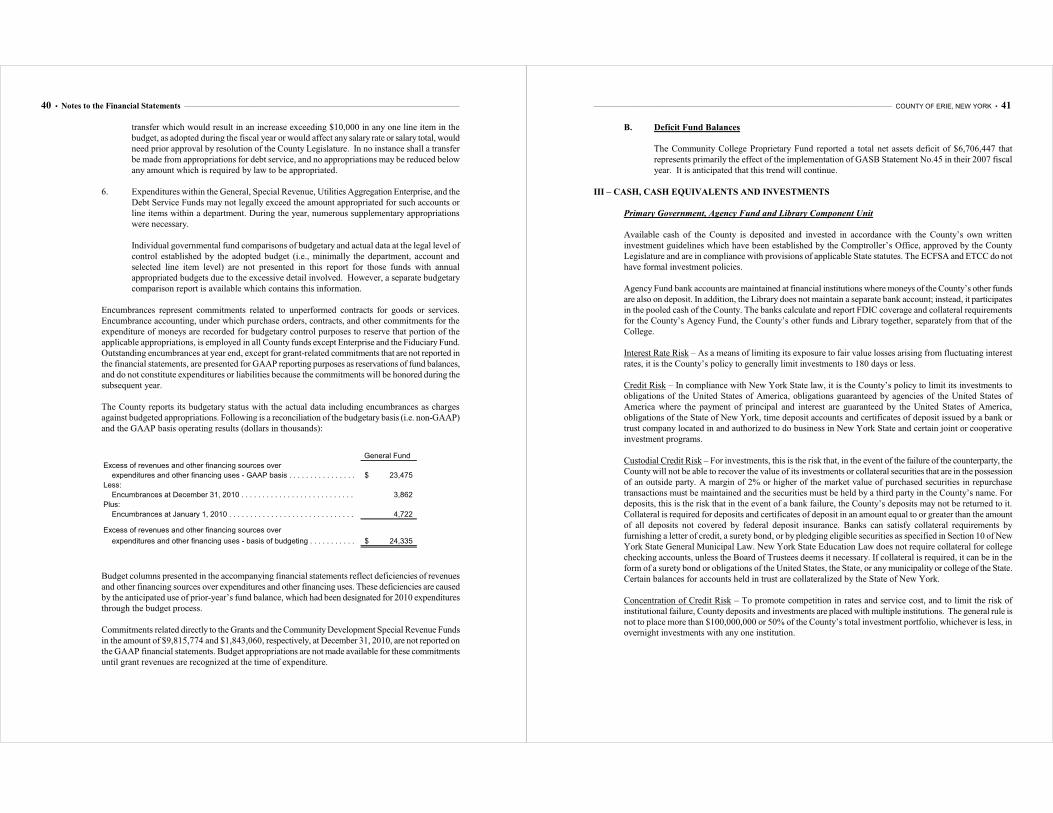
40 • Notes to the Financial Statements _______________________________________________________________________________________________________________________
transfer which would result in an increase exceeding $10,000 in any one line item in the
budget, as adopted during the fiscal year or would affect any salary rate or salary total, would
need prior approval by resolution of the County Legislature. In no instance shall a transfer
be made from appropriations for debt service, and no appropriations may be reduced below
any amount which is required by law to be appropriated.
6. Expenditures within the General, Special Revenue, Utilities Aggregation Enterprise, and the
Debt Service Funds may not legally exceed the amount appropriated for such accounts or
line items within a department. During the year, numerous supplementary appropriations
were necessary.
Individual governmental fund comparisons of budgetary and actual data at the legal level of
control established by the adopted budget (i.e., minimally the department, account and
selected line item level) are not presented in this report for those funds with annual
appropriated budgets due to the excessive detail involved. However, a separate budgetary
comparison report is available which contains this information.
Encumbrances represent commitments related to unperformed contracts for goods or services.
Encumbrance accounting, under which purchase orders, contracts, and other commitments for the
expenditure of moneys are recorded for budgetary control purposes to reserve that portion of the
applicable appropriations, is employed in all County funds except Enterprise and the Fiduciary Fund.
Outstanding encumbrances at year end, except for grant-related commitments that are not reported in
the financial statements, are presented for GAAP reporting purposes as reservations of fund balances,
and do not constitute expenditures or liabilities because the commitments will be honored during the
subsequent year.
The County reports its budgetary status with the actual data including encumbrances as charges
against budgeted appropriations. Following is a reconciliation of the budgetary basis (i.e. non-GAAP)
and the GAAP basis operating results (dollars in thousands):
General Fund
Excess of revenues and other financing sources over
expenditures and other financing uses - GAAP basis . . . . . . . . . . . . . . . . . . . . . . . . . . . . . . . . . . . . 23,475$
Less:
Encumbrances at December 31, 2010 . . . . . . . . . . . . . . . . . . . . . . . . . . . . . . . . . . . . . . . . . . . . . 3,862
Plus:
Encumbrances at January 1, 2010 . . . . . . . . . . . . . . . . . . . . . . . . . . . . . . . . . . . . . . . . . . . . . . 4,722
Excess of revenues and other financing sources over
expenditures and other financing uses - basis of budgeting . . . . . . . . . . . . . . . . . . . . . . . . . . . . . . . . 24,335$
Budget columns presented in the accompanying financial statements reflect deficiencies of revenues
and other financing sources over expenditures and other financing uses. These deficiencies are caused
by the anticipated use of prior-year’s fund balance, which had been designated for 2010 expenditures
through the budget process.
Commitments related directly to the Grants and the Community Development Special Revenue Funds
in the amount of $9,815,774 and $1,843,060, respectively, at December 31, 2010, are not reported on
the GAAP financial statements. Budget appropriations are not made available for these commitments
until grant revenues are recognized at the time of expenditure.
_________________________________________________________________________________________________________________________________ COUNTY OF ERIE, NEW YORK • 41
B. Deficit Fund Balances
The Community College Proprietary Fund reported a total net assets deficit of $6,706,447 that
represents primarily the effect of the implementation of GASB Statement No.45 in their 2007 fiscal
year. It is anticipated that this trend will continue.
III – CASH, CASH EQUIVALENTS AND INVESTMENTS
Primary Government, Agency Fund and Library Component Unit
Available cash of the County is deposited and invested in accordance with the County’s own written
investment guidelines which have been established by the Comptroller’s Office, approved by the County
Legislature and are in compliance with provisions of applicable State statutes. The ECFSA and ETCC do not
have formal investment policies.
Agency Fund bank accounts are maintained at financial institutions where moneys of the County’s other funds
are also on deposit. In addition, the Library does not maintain a separate bank account; instead, it participates
in the pooled cash of the County. The banks calculate and report FDIC coverage and collateral requirements
for the County’s Agency Fund, the County’s other funds and Library together, separately from that of the
College.
Interest Rate Risk – As a means of limiting its exposure to fair value losses arising from fluctuating interest
rates, it is the County’s policy to generally limit investments to 180 days or less.
Credit Risk – In compliance with New York State law, it is the County’s policy to limit its investments to
obligations of the United States of America, obligations guaranteed by agencies of the United States of
America where the payment of principal and interest are guaranteed by the United States of America,
obligations of the State of New York, time deposit accounts and certificates of deposit issued by a bank or
trust company located in and authorized to do business in New York State and certain joint or cooperative
investment programs.
Custodial Credit Risk – For investments, this is the risk that, in the event of the failure of the counterparty, the
County will not be able to recover the value of its investments or collateral securities that are in the possession
of an outside party. A margin of 2% or higher of the market value of purchased securities in repurchase
transactions must be maintained and the securities must be held by a third party in the County’s name. For
deposits, this is the risk that in the event of a bank failure, the County’s deposits may not be returned to it.
Collateral is required for deposits and certificates of deposit in an amount equal to or greater than the amount
of all deposits not covered by federal deposit insurance. Banks can satisfy collateral requirements by
furnishing a letter of credit, a surety bond, or by pledging eligible securities as specified in Section 10 of New
York State General Municipal Law. New York State Education Law does not require collateral for college
checking accounts, unless the Board of Trustees deems it necessary. If collateral is required, it can be in the
form of a surety bond or obligations of the United States, the State, or any municipality or college of the State.
Certain balances for accounts held in trust are collateralized by the State of New York.
Concentration of Credit Risk – To promote competition in rates and service cost, and to limit the risk of
institutional failure, County deposits and investments are placed with multiple institutions. The general rule is
not to place more than $100,000,000 or 50% of the County’s total investment portfolio, whichever is less, in
overnight investments with any one institution.
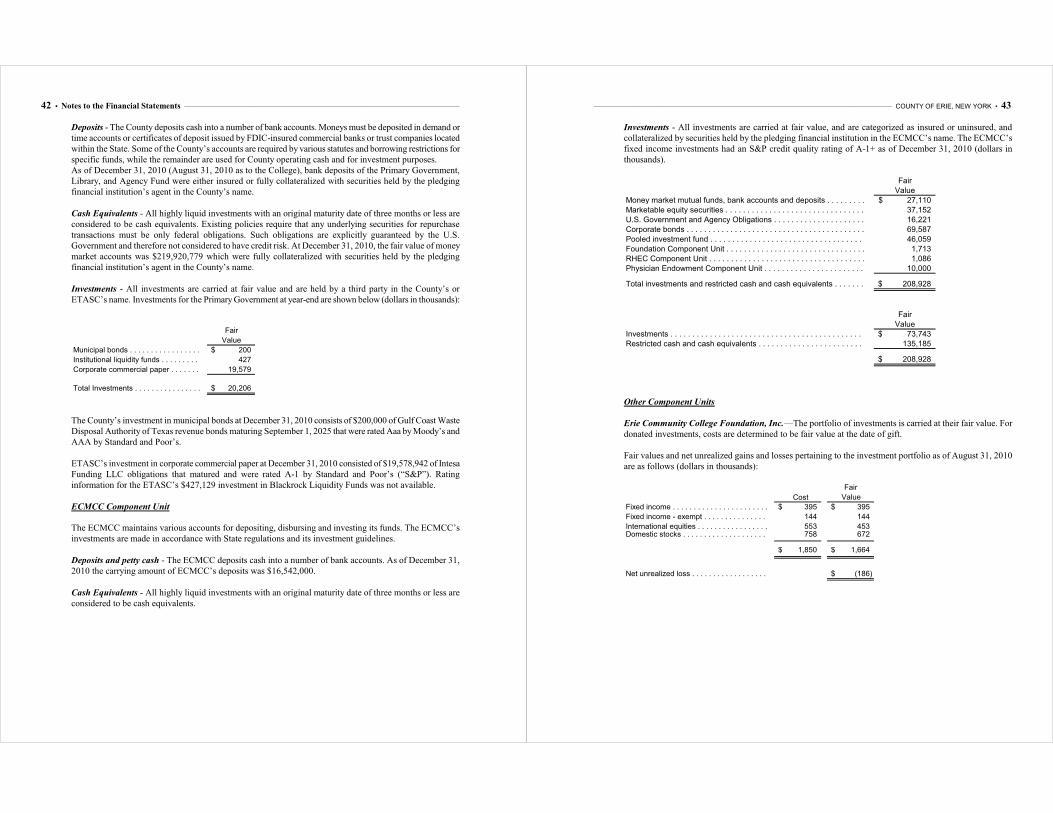
42 • Notes to the Financial Statements _______________________________________________________________________________________________________________________
Deposits - The County deposits cash into a number of bank accounts. Moneys must be deposited in demand or
time accounts or certificates of deposit issued by FDIC-insured commercial banks or trust companies located
within the State. Some of the County’s accounts are required by various statutes and borrowing restrictions for
specific funds, while the remainder are used for County operating cash and for investment purposes.
As of December 31, 2010 (August 31, 2010 as to the College), bank deposits of the Primary Government,
Library, and Agency Fund were either insured or fully collateralized with securities held by the pledging
financial institution’s agent in the County’s name.
Cash Equivalents - All highly liquid investments with an original maturity date of three months or less are
considered to be cash equivalents. Existing policies require that any underlying securities for repurchase
transactions must be only federal obligations. Such obligations are explicitly guaranteed by the U.S.
Government and therefore not considered to have credit risk. At December 31, 2010, the fair value of money
market accounts was $219,920,779 which were fully collateralized with securities held by the pledging
financial institution’s agent in the County’s name.
Investments - All investments are carried at fair value and are held by a third party in the County’s or
ETASC’s name. Investments for the Primary Government at year-end are shown below (dollars in thousands):
Fair
Value
Municipal bonds . . . . . . . . . . . . . . . . . . . . . . . . . . . . . . . . . . . . . . . . . . . . . . . . . . . . . . . . 200$
Institutional liquidity funds . . . . . . . . . . . . . . . . . . . . . . . . . . . . . . . . . . . . . . . . . . . . . . . . . 427
Corporate commercial paper . . . . . . . . . . . . . . . . . . . . . . . . . . . . . . . . . . . . . . . . . . . . . . . . . . 19,579
Total Investments . . . . . . . . . . . . . . . . . . . . . . . . . . . . . . . . . . . . . . . . . . . . . . . . . . . . . . . 20,206$
The County’s investment in municipal bonds at December 31, 2010 consists of $200,000 of Gulf Coast Waste
Disposal Authority of Texas revenue bonds maturing September 1, 2025 that were rated Aaa by Moody’s and
AAA by Standard and Poor’s.
ETASC’s investment in corporate commercial paper at December 31, 2010 consisted of $19,578,942 of Intesa
Funding LLC obligations that matured and were rated A-1 by Standard and Poor’s (“S&P”). Rating
information for the ETASC’s $427,129 investment in Blackrock Liquidity Funds was not available.
ECMCC Component Unit
The ECMCC maintains various accounts for depositing, disbursing and investing its funds. The ECMCC’s
investments are made in accordance with State regulations and its investment guidelines.
Deposits and petty cash - The ECMCC deposits cash into a number of bank accounts. As of December 31,
2010 the carrying amount of ECMCC’s deposits was $16,542,000.
Cash Equivalents - All highly liquid investments with an original maturity date of three months or less are
considered to be cash equivalents.
_________________________________________________________________________________________________________________________________ COUNTY OF ERIE, NEW YORK • 43
Investments - All investments are carried at fair value, and are categorized as insured or uninsured, and
collateralized by securities held by the pledging financial institution in the ECMCC’s name. The ECMCC’s
fixed income investments had an S&P credit quality rating of A-1+ as of December 31, 2010 (dollars in
thousands).
Fair
Value
Money market mutual funds, bank accounts and deposits . . . . . . . . . . . . . . . . . . . . . . . . . . . . . . . . . . . . . 27,110$
Marketable equity securities . . . . . . . . . . . . . . . . . . . . . . . . . . . . . . . . . . . . . . . . . . . . . . . . . 37,152U.S. Government and Agency Obligations . . . . . . . . . . . . . . . . . . . . . . . . . . . . . . . . . . . . . . . . . . . . 16,221
Corporate bonds . . . . . . . . . . . . . . . . . . . . . . . . . . . . . . . . . . . . . . . . . . . . . . . . . . . . . . . . 69,587
Pooled investment fund . . . . . . . . . . . . . . . . . . . . . . . . . . . . . . . . . . . . . . . . . . . . . . . . . . . . 46,059
Foundation Component Unit . . . . . . . . . . . . . . . . . . . . . . . . . . . . . . . . . . . . . . . . . . . . . . . . . . . 1,713
RHEC Component Unit . . . . . . . . . . . . . . . . . . . . . . . . . . . . . . . . . . . . . . . . . . . . . . . . . . . . . . 1,086
Physician Endowment Component Unit . . . . . . . . . . . . . . . . . . . . . . . . . . . . . . . . . . . . . . . . . . . . . . 10,000
Total investments and restricted cash and cash equivalents . . . . . . . . . . . . . . . . . . . . . . . . . . . . . . . . . . 208,928$
Fair
Value
Investments . . . . . . . . . . . . . . . . . . . . . . . . . . . . . . . . . . . . . . . . . . . . . . . . . . . . . . . . . . 73,743$
Restricted cash and cash equivalents . . . . . . . . . . . . . . . . . . . . . . . . . . . . . . . . . . . . . . . . . . . . . 135,185
208,928$
Other Component Units
Erie Community College Foundation, Inc.—The portfolio of investments is carried at their fair value. For
donated investments, costs are determined to be fair value at the date of gift.
Fair values and net unrealized gains and losses pertaining to the investment portfolio as of August 31, 2010
are as follows (dollars in thousands):
Fair
Cost Value
Fixed income . . . . . . . . . . . . . . . . . . . . . . . . . . . . . . . . . . . . . . . . . . . . . . . . . . . . . . . . . 395$ 395$
Fixed income - exempt . . . . . . . . . . . . . . . . . . . . . . . . . . . . . . . . . . . . . . . . . . . . . . . . . . . . . 144 144
International equities . . . . . . . . . . . . . . . . . . . . . . . . . . . . . . . . . . . . . . . . . . . . . . . . . . . . 553 453 Domestic stocks . . . . . . . . . . . . . . . . . . . . . . . . . . . . . . . . . . . . . . . . . . . . . . . . . . . . . . . . 758 672
1,850$ 1,664$
Net unrealized loss . . . . . . . . . . . . . . . . . . . . . . . . . . . . . . . . . . . . . . . . . . . . . . . . . . . . . . (186)$
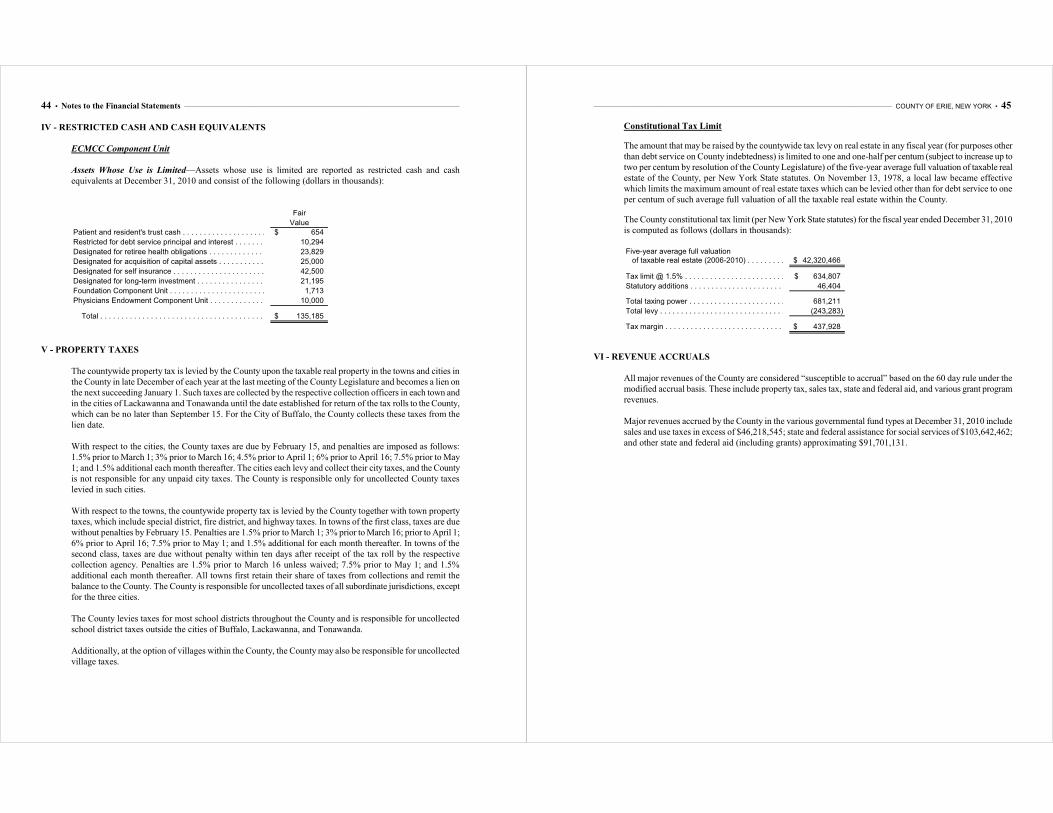
44 • Notes to the Financial Statements _______________________________________________________________________________________________________________________
IV - RESTRICTED CASH AND CASH EQUIVALENTS
ECMCC Component Unit
Assets Whose Use is Limited—Assets whose use is limited are reported as restricted cash and cash
equivalents at December 31, 2010 and consist of the following (dollars in thousands):
Fair
Value
Patient and resident's trust cash . . . . . . . . . . . . . . . . . . . . . . . . . . . . . . . . . . . . . . . . . . . . . . . 654$
Restricted for debt service principal and interest . . . . . . . . . . . . . . . . . . . . . . . . . . . . . . . . . . . . . . 10,294
Designated for retiree health obligations . . . . . . . . . . . . . . . . . . . . . . . . . . . . . . . . . . . . . . . . . . . 23,829
Designated for acquisition of capital assets . . . . . . . . . . . . . . . . . . . . . . . . . . . . . . . . . . . . . . . . . 25,000
Designated for self insurance . . . . . . . . . . . . . . . . . . . . . . . . . . . . . . . . . . . . . . . . . . . . . . . . . 42,500
Designated for long-term investment . . . . . . . . . . . . . . . . . . . . . . . . . . . . . . . . . . . . . . . . . . . . . . 21,195
Foundation Component Unit . . . . . . . . . . . . . . . . . . . . . . . . . . . . . . . . . . . . . . . . . . . . . . . . . . . 1,713
Physicians Endowment Component Unit . . . . . . . . . . . . . . . . . . . . . . . . . . . . . . . . . . . . . . . . . . . . . . 10,000
Total . . . . . . . . . . . . . . . . . . . . . . . . . . . . . . . . . . . . . . . . . . . . . . . . . . . . . . . . . . . 135,185$
V - PROPERTY TAXES
The countywide property tax is levied by the County upon the taxable real property in the towns and cities in
the County in late December of each year at the last meeting of the County Legislature and becomes a lien on
the next succeeding January 1. Such taxes are collected by the respective collection officers in each town and
in the cities of Lackawanna and Tonawanda until the date established for return of the tax rolls to the County,
which can be no later than September 15. For the City of Buffalo, the County collects these taxes from the
lien date.
With respect to the cities, the County taxes are due by February 15, and penalties are imposed as follows:
1.5% prior to March 1; 3% prior to March 16; 4.5% prior to April 1; 6% prior to April 16; 7.5% prior to May
1; and 1.5% additional each month thereafter. The cities each levy and collect their city taxes, and the County
is not responsible for any unpaid city taxes. The County is responsible only for uncollected County taxes
levied in such cities.
With respect to the towns, the countywide property tax is levied by the County together with town property
taxes, which include special district, fire district, and highway taxes. In towns of the first class, taxes are due
without penalties by February 15. Penalties are 1.5% prior to March 1; 3% prior to March 16; prior to April 1;
6% prior to April 16; 7.5% prior to May 1; and 1.5% additional for each month thereafter. In towns of the
second class, taxes are due without penalty within ten days after receipt of the tax roll by the respective
collection agency. Penalties are 1.5% prior to March 16 unless waived; 7.5% prior to May 1; and 1.5%
additional each month thereafter. All towns first retain their share of taxes from collections and remit the
balance to the County. The County is responsible for uncollected taxes of all subordinate jurisdictions, except
for the three cities.
The County levies taxes for most school districts throughout the County and is responsible for uncollected
school district taxes outside the cities of Buffalo, Lackawanna, and Tonawanda.
Additionally, at the option of villages within the County, the County may also be responsible for uncollected
village taxes.
_________________________________________________________________________________________________________________________________ COUNTY OF ERIE, NEW YORK • 45
Constitutional Tax Limit
The amount that may be raised by the countywide tax levy on real estate in any fiscal year (for purposes other
than debt service on County indebtedness) is limited to one and one-half per centum (subject to increase up to
two per centum by resolution of the County Legislature) of the five-year average full valuation of taxable real
estate of the County, per New York State statutes. On November 13, 1978, a local law became effective
which limits the maximum amount of real estate taxes which can be levied other than for debt service to one
per centum of such average full valuation of all the taxable real estate within the County.
The County constitutional tax limit (per New York State statutes) for the fiscal year ended December 31, 2010
is computed as follows (dollars in thousands):
Five-year average full valuation of taxable real estate (2006-2010) . . . . . . . . . . . . . . . . . . . . . . . . . . . . . . . . . . . . . . . . . . . . . 42,320,466$
Tax limit @ 1.5% . . . . . . . . . . . . . . . . . . . . . . . . . . . . . . . . . . . . . . . . . . . . . . . . . . . . . . . 634,807$
Statutory additions . . . . . . . . . . . . . . . . . . . . . . . . . . . . . . . . . . . . . . . . . . . . . . . . . . . . . . 46,404
Total taxing power . . . . . . . . . . . . . . . . . . . . . . . . . . . . . . . . . . . . . . . . . . . . . . . . . . . . . . 681,211
Total levy . . . . . . . . . . . . . . . . . . . . . . . . . . . . . . . . . . . . . . . . . . . . . . . . . . . . . . . . . . (243,283)
Tax margin . . . . . . . . . . . . . . . . . . . . . . . . . . . . . . . . . . . . . . . . . . . . . . . . . . . . . . . . . . 437,928$
VI - REVENUE ACCRUALS
All major revenues of the County are considered “susceptible to accrual” based on the 60 day rule under the
modified accrual basis. These include property tax, sales tax, state and federal aid, and various grant program
revenues.
Major revenues accrued by the County in the various governmental fund types at December 31, 2010 include
sales and use taxes in excess of $46,218,545; state and federal assistance for social services of $103,642,462;
and other state and federal aid (including grants) approximating $91,701,131.
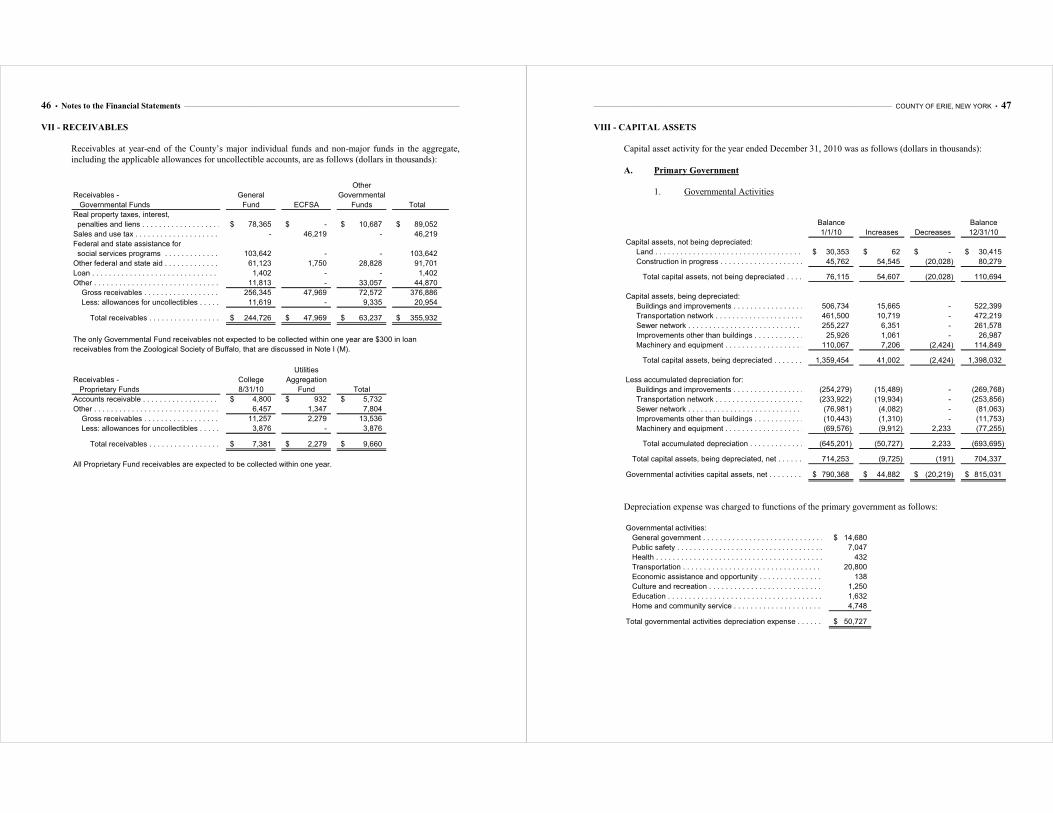
46 • Notes to the Financial Statements _______________________________________________________________________________________________________________________
VII - RECEIVABLES
Receivables at year-end of the County’s major individual funds and non-major funds in the aggregate,
including the applicable allowances for uncollectible accounts, are as follows (dollars in thousands):
Other
Receivables - General Governmental
Governmental Funds Fund ECFSA Funds Total
Real property taxes, interest,
penalties and liens . . . . . . . . . . . . . . . . . . . . . . . . . . . . . . . . . . . . . . . . . . . . . . . . . . . . . 78,365$ -$ 10,687$ 89,052$
Sales and use tax . . . . . . . . . . . . . . . . . . . . . . . . . . . . . . . . . . . . . . . . . . . . . . . . . . . . . . . - 46,219 - 46,219
Federal and state assistance for
social services programs . . . . . . . . . . . . . . . . . . . . . . . . . . . . . . . . . . . . . . . . . . . . . . . . . . 103,642 - - 103,642
Other federal and state aid . . . . . . . . . . . . . . . . . . . . . . . . . . . . . . . . . . . . . . . . . . . . . . . . . . 61,123 1,750 28,828 91,701
Loan . . . . . . . . . . . . . . . . . . . . . . . . . . . . . . . . . . . . . . . . . . . . . . . . . . . . . . . . . . . . . 1,402 - - 1,402
Other . . . . . . . . . . . . . . . . . . . . . . . . . . . . . . . . . . . . . . . . . . . . . . . . . . . . . . . . . . . . . 11,813 - 33,057 44,870
Gross receivables . . . . . . . . . . . . . . . . . . . . . . . . . . . . . . . . . . . . . . . . . . . . . . . . . . . . . 256,345 47,969 72,572 376,886
Less: allowances for uncollectibles . . . . . . . . . . . . . . . . . . . . . . . . . . . . . . . . . . . . . . . . . . . . 11,619 - 9,335 20,954
Total receivables . . . . . . . . . . . . . . . . . . . . . . . . . . . . . . . . . . . . . . . . . . . . . . . . . . . 244,726$ 47,969$ 63,237$ 355,932$
The only Governmental Fund receivables not expected to be collected within one year are $300 in loan
receivables from the Zoological Society of Buffalo, that are discussed in Note I (M).
Utilities
Receivables - College Aggregation
Proprietary Funds 8/31/10 Fund Total
Accounts receivable . . . . . . . . . . . . . . . . . . . . . . . . . . . . . . . . . . . . . . . . . . . . . . . . . . . . . . 4,800$ 932$ 5,732$
Other . . . . . . . . . . . . . . . . . . . . . . . . . . . . . . . . . . . . . . . . . . . . . . . . . . . . . . . . . . . . . 6,457 1,347 7,804
Gross receivables . . . . . . . . . . . . . . . . . . . . . . . . . . . . . . . . . . . . . . . . . . . . . . . . . . . . . 11,257 2,279 13,536
Less: allowances for uncollectibles . . . . . . . . . . . . . . . . . . . . . . . . . . . . . . . . . . . . . . . . . . . . 3,876 - 3,876
Total receivables . . . . . . . . . . . . . . . . . . . . . . . . . . . . . . . . . . . . . . . . . . . . . . . . . . . 7,381$ 2,279$ 9,660$
All Proprietary Fund receivables are expected to be collected within one year.
_________________________________________________________________________________________________________________________________ COUNTY OF ERIE, NEW YORK • 47
VIII - CAPITAL ASSETS
Capital asset activity for the year ended December 31, 2010 was as follows (dollars in thousands):
A. Primary Government
1. Governmental Activities
Balance Balance
1/1/10 Increases Decreases 12/31/10
Capital assets, not being depreciated:
Land . . . . . . . . . . . . . . . . . . . . . . . . . . . . . . . . . . . . . . . . . . . . . . . . . . . . . . . . . . . 30,353$ 62$ -$ 30,415$
Construction in progress . . . . . . . . . . . . . . . . . . . . . . . . . . . . . . . . . . . . . . . . . . . . . . . . . 45,762 54,545 (20,028) 80,279
Total capital assets, not being depreciated . . . . . . . . . . . . . . . . . . . . . . . . . . . . . . . . . . . . . . 76,115 54,607 (20,028) 110,694
Capital assets, being depreciated:
Buildings and improvements . . . . . . . . . . . . . . . . . . . . . . . . . . . . . . . . . . . . . . . . . . . . . . . . 506,734 15,665 - 522,399
Transportation network . . . . . . . . . . . . . . . . . . . . . . . . . . . . . . . . . . . . . . . . . . . . . . . . . . 461,500 10,719 - 472,219
Sewer network . . . . . . . . . . . . . . . . . . . . . . . . . . . . . . . . . . . . . . . . . . . . . . . . . . . . . . 255,227 6,351 - 261,578
Improvements other than buildings . . . . . . . . . . . . . . . . . . . . . . . . . . . . . . . . . . . . . . . . . . . . 25,926 1,061 - 26,987
Machinery and equipment . . . . . . . . . . . . . . . . . . . . . . . . . . . . . . . . . . . . . . . . . . . . . . . . . 110,067 7,206 (2,424) 114,849
Total capital assets, being depreciated . . . . . . . . . . . . . . . . . . . . . . . . . . . . . . . . . . . . . . . . 1,359,454 41,002 (2,424) 1,398,032
Less accumulated depreciation for:
Buildings and improvements . . . . . . . . . . . . . . . . . . . . . . . . . . . . . . . . . . . . . . . . . . . . . . . . (254,279) (15,489) - (269,768)
Transportation network . . . . . . . . . . . . . . . . . . . . . . . . . . . . . . . . . . . . . . . . . . . . . . . . . . (233,922) (19,934) - (253,856)
Sewer network . . . . . . . . . . . . . . . . . . . . . . . . . . . . . . . . . . . . . . . . . . . . . . . . . . . . . . (76,981) (4,082) - (81,063)
Improvements other than buildings . . . . . . . . . . . . . . . . . . . . . . . . . . . . . . . . . . . . . . . . . . . . (10,443) (1,310) - (11,753)
Machinery and equipment . . . . . . . . . . . . . . . . . . . . . . . . . . . . . . . . . . . . . . . . . . . . . . . . . (69,576) (9,912) 2,233 (77,255)
Total accumulated depreciation . . . . . . . . . . . . . . . . . . . . . . . . . . . . . . . . . . . . . . . . . . . . (645,201) (50,727) 2,233 (693,695)
Total capital assets, being depreciated, net . . . . . . . . . . . . . . . . . . . . . . . . . . . . . . . . . . . . . . . . 714,253 (9,725) (191) 704,337
Governmental activities capital assets, net . . . . . . . . . . . . . . . . . . . . . . . . . . . . . . . . . . . . . . . . . . 790,368$ 44,882$ (20,219)$ 815,031$
Depreciation expense was charged to functions of the primary government as follows:
Governmental activities:
General government . . . . . . . . . . . . . . . . . . . . . . . . . . . . . . . . . . . . . . . . . . . . . . . . . . . . . 14,680$
Public safety . . . . . . . . . . . . . . . . . . . . . . . . . . . . . . . . . . . . . . . . . . . . . . . . . . . . . . . 7,047
Health . . . . . . . . . . . . . . . . . . . . . . . . . . . . . . . . . . . . . . . . . . . . . . . . . . . . . . . . . . . 432
Transportation . . . . . . . . . . . . . . . . . . . . . . . . . . . . . . . . . . . . . . . . . . . . . . . . . . . . . . . 20,800
Economic assistance and opportunity . . . . . . . . . . . . . . . . . . . . . . . . . . . . . . . . . . . . . . . . . . . . 138
Culture and recreation . . . . . . . . . . . . . . . . . . . . . . . . . . . . . . . . . . . . . . . . . . . . . . . . . . . 1,250
Education . . . . . . . . . . . . . . . . . . . . . . . . . . . . . . . . . . . . . . . . . . . . . . . . . . . . . . . . . 1,632
Home and community service . . . . . . . . . . . . . . . . . . . . . . . . . . . . . . . . . . . . . . . . . . . . . . . . . 4,748
Total governmental activities depreciation expense . . . . . . . . . . . . . . . . . . . . . . . . . . . . . . . . . . . . . . 50,727$
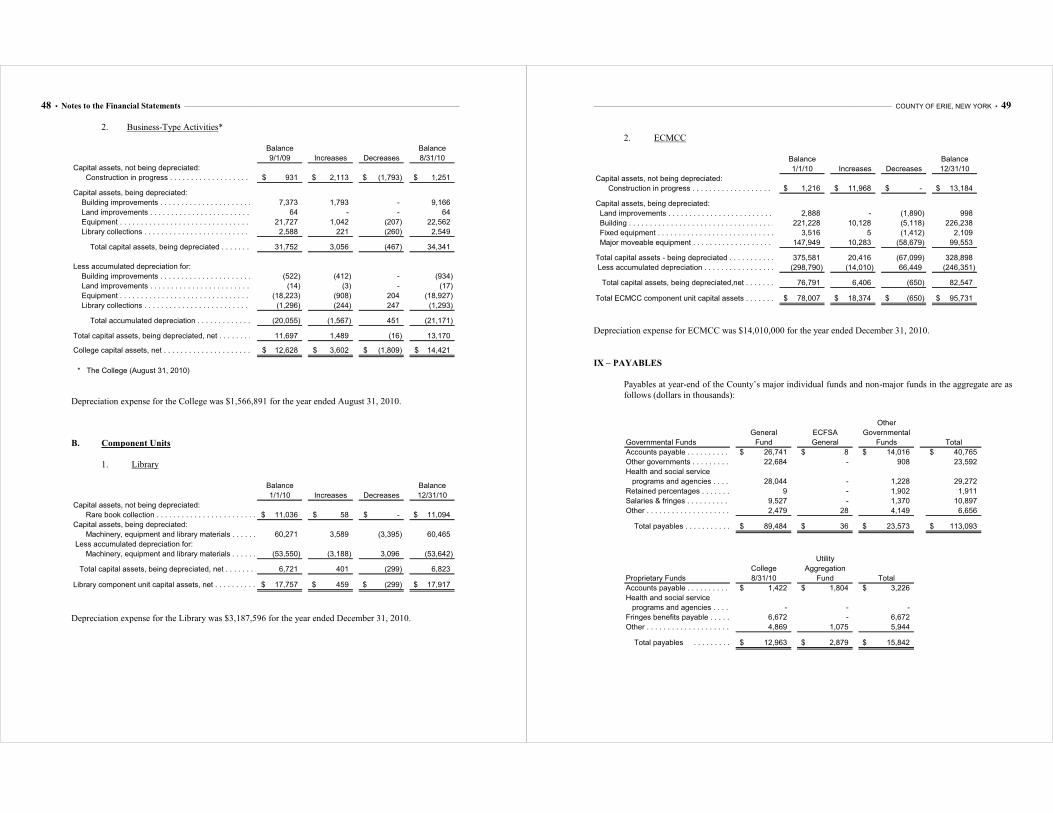
48 • Notes to the Financial Statements _______________________________________________________________________________________________________________________
2. Business-Type Activities*
Balance Balance
9/1/09 Increases Decreases 8/31/10
Capital assets, not being depreciated:
Construction in progress . . . . . . . . . . . . . . . . . . . . . . . . . . . . . . . . . . . . . . . . . . . . . . . . 931$ 2,113$ (1,793)$ 1,251$
Capital assets, being depreciated:
Building improvements . . . . . . . . . . . . . . . . . . . . . . . . . . . . . . . . . . . . . . . . . . . . . . . . . . . 7,373 1,793 - 9,166
Land improvements . . . . . . . . . . . . . . . . . . . . . . . . . . . . . . . . . . . . . . . . . . . . . . . . . . . . . 64 - - 64
Equipment . . . . . . . . . . . . . . . . . . . . . . . . . . . . . . . . . . . . . . . . . . . . . . . . . . . . . . . . . 21,727 1,042 (207) 22,562
Library collections . . . . . . . . . . . . . . . . . . . . . . . . . . . . . . . . . . . . . . . . . . . . . . . . . . . . 2,588 221 (260) 2,549
Total capital assets, being depreciated . . . . . . . . . . . . . . . . . . . . . . . . . . . . . . . . . . . . . . . . 31,752 3,056 (467) 34,341
Less accumulated depreciation for:
Building improvements . . . . . . . . . . . . . . . . . . . . . . . . . . . . . . . . . . . . . . . . . . . . . . . . . . . (522) (412) - (934)
Land improvements . . . . . . . . . . . . . . . . . . . . . . . . . . . . . . . . . . . . . . . . . . . . . . . . . . . . . (14) (3) - (17)
Equipment . . . . . . . . . . . . . . . . . . . . . . . . . . . . . . . . . . . . . . . . . . . . . . . . . . . . . . . . . (18,223) (908) 204 (18,927)
Library collections . . . . . . . . . . . . . . . . . . . . . . . . . . . . . . . . . . . . . . . . . . . . . . . . . . . . (1,296) (244) 247 (1,293)
Total accumulated depreciation . . . . . . . . . . . . . . . . . . . . . . . . . . . . . . . . . . . . . . . . . . . . (20,055) (1,567) 451 (21,171)
Total capital assets, being depreciated, net . . . . . . . . . . . . . . . . . . . . . . . . . . . . . . . . . . . . . . . . . 11,697 1,489 (16) 13,170
College capital assets, net . . . . . . . . . . . . . . . . . . . . . . . . . . . . . . . . . . . . . . . . . . . . . . . . . . 12,628$ 3,602$ (1,809)$ 14,421$
* The College (August 31, 2010)
Depreciation expense for the College was $1,566,891 for the year ended August 31, 2010.
B. Component Units
1. Library
Balance Balance
1/1/10 Increases Decreases 12/31/10
Capital assets, not being depreciated:
Rare book collection . . . . . . . . . . . . . . . . . . . . . . . . . . . . . . . . . . . . . . . . . . . . . . . . . . 11,036$ 58$ -$ 11,094$
Capital assets, being depreciated:
Machinery, equipment and library materials . . . . . . . . . . . . . . . . . . . . . . . . . . . . . . . . . . . . . . . 60,271 3,589 (3,395) 60,465
Less accumulated depreciation for:
Machinery, equipment and library materials . . . . . . . . . . . . . . . . . . . . . . . . . . . . . . . . . . . . . . . (53,550) (3,188) 3,096 (53,642)
Total capital assets, being depreciated, net . . . . . . . . . . . . . . . . . . . . . . . . . . . . . . . . . . . . . . . .6,721 401 (299) 6,823
Library component unit capital assets, net . . . . . . . . . . . . . . . . . . . . . . . . . . . . . . . . . . . . . . . . . . 17,757$ 459$ (299)$ 17,917$
Depreciation expense for the Library was $3,187,596 for the year ended December 31, 2010.
_________________________________________________________________________________________________________________________________ COUNTY OF ERIE, NEW YORK • 49
2. ECMCC
Balance Balance
1/1/10 Increases Decreases 12/31/10
Capital assets, not being depreciated:
Construction in progress . . . . . . . . . . . . . . . . . . . . . . . . . . . . . . . . . . . . . . . . . . . . . . . . 1,216$ 11,968$ -$ 13,184$
Capital assets, being depreciated:
Land improvements . . . . . . . . . . . . . . . . . . . . . . . . . . . . . . . . . . . . . . . . . . . . . . . . . . . . . . 2,888 - (1,890) 998
Building . . . . . . . . . . . . . . . . . . . . . . . . . . . . . . . . . . . . . . . . . . . . . . . . . . . . . . . . . . 221,228 10,128 (5,118) 226,238
Fixed equipment . . . . . . . . . . . . . . . . . . . . . . . . . . . . . . . . . . . . . . . . . . . . . . . . . . . . . . . 3,516 5 (1,412) 2,109
Major moveable equipment . . . . . . . . . . . . . . . . . . . . . . . . . . . . . . . . . . . . . . . . . . . . . . . . . . 147,949 10,283 (58,679) 99,553
Total capital assets - being depreciated . . . . . . . . . . . . . . . . . . . . . . . . . . . . . . . . . . . . . . . . . . . 375,581 20,416 (67,099) 328,898
Less accumulated depreciation . . . . . . . . . . . . . . . . . . . . . . . . . . . . . . . . . . . . . . . . . . . . . . . . (298,790) (14,010) 66,449 (246,351)
Total capital assets, being depreciated,net . . . . . . . . . . . . . . . . . . . . . . . . . . . . . . . . . . . . . . . . 76,791 6,406 (650) 82,547
Total ECMCC component unit capital assets . . . . . . . . . . . . . . . . . . . . . . . . . . . . . . . . . . . . . . . . . . . 78,007$ 18,374$ (650)$ 95,731$
Depreciation expense for ECMCC was $14,010,000 for the year ended December 31, 2010.
IX – PAYABLES
Payables at year-end of the County’s major individual funds and non-major funds in the aggregate are as
follows (dollars in thousands):
Other
General ECFSA Governmental
Governmental Funds Fund General Funds Total
Accounts payable . . . . . . . . . . . . . . . . . . . . . . . . . . . . . . . . . . . . . . . . . . . . . . . . . . . . . . . 26,741$ 8$ 14,016$ 40,765$
Other governments . . . . . . . . . . . . . . . . . . . . . . . . . . . . . . . . . . . . . . . . . . . . . . . . . . . . . . . 22,684 - 908 23,592
Health and social service programs and agencies . . . . . . . . . . . . . . . . . . . . . . . . . . . . . . . . . . . . . . . . . . . . . . . . . . . 28,044 - 1,228 29,272
Retained percentages . . . . . . . . . . . . . . . . . . . . . . . . . . . . . . . . . . . . . . . . . . . . . . . . . . . . . 9 - 1,902 1,911
Salaries & fringes . . . . . . . . . . . . . . . . . . . . . . . . . . . . . . . . . . . . . . . . . . . . . . . . . . . . . . 9,527 - 1,370 10,897
Other . . . . . . . . . . . . . . . . . . . . . . . . . . . . . . . . . . . . . . . . . . . . . . . . . . . . . . . . . . . . . 2,479 28 4,149 6,656
Total payables . . . . . . . . . . . . . . . . . . . . . . . . . . . . . . . . . . . . . . . . . . . . . . . . . . . . . . 89,484$ 36$ 23,573$ 113,093$
Utility
College Aggregation
Proprietary Funds 8/31/10 Fund Total
Accounts payable . . . . . . . . . . . . . . . . . . . . . . . . . . . . . . . . . . . . . . . . . . . . . . . . . . . . . . . 1,422$ 1,804$ 3,226$
Health and social service programs and agencies . . . . . . . . . . . . . . . . . . . . . . . . . . . . . . . . . . . . . . . . . . . . . . . . . . . - - -
Fringes benefits payable . . . . . . . . . . . . . . . . . . . . . . . . . . . . . . . . . . . . . . . . . . . . . . . . . . . 6,672 - 6,672
Other . . . . . . . . . . . . . . . . . . . . . . . . . . . . . . . . . . . . . . . . . . . . . . . . . . . . . . . . . . . . . 4,869 1,075 5,944
Total payables . . . . . . . . . . . . . . . . . . . . . . . . . . . . . . . . . . . . . . . . . . . . . . . . . . . . 12,963$ 2,879$ 15,842$
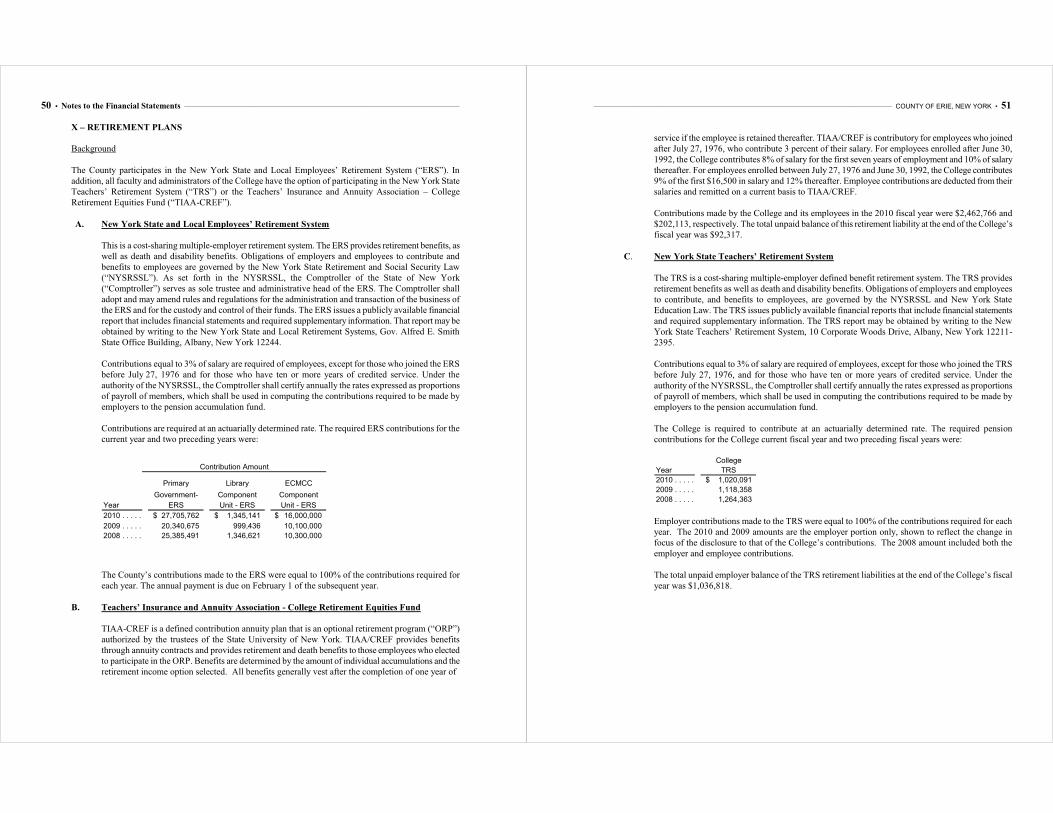
50 • Notes to the Financial Statements _______________________________________________________________________________________________________________________
X – RETIREMENT PLANS
Background
The County participates in the New York State and Local Employees’ Retirement System (“ERS”). In
addition, all faculty and administrators of the College have the option of participating in the New York State
Teachers’ Retirement System (“TRS”) or the Teachers’ Insurance and Annuity Association – College
Retirement Equities Fund (“TIAA-CREF”).
A. New York State and Local Employees’ Retirement System
This is a cost-sharing multiple-employer retirement system. The ERS provides retirement benefits, as
well as death and disability benefits. Obligations of employers and employees to contribute and
benefits to employees are governed by the New York State Retirement and Social Security Law
(“NYSRSSL”). As set forth in the NYSRSSL, the Comptroller of the State of New York
(“Comptroller”) serves as sole trustee and administrative head of the ERS. The Comptroller shall
adopt and may amend rules and regulations for the administration and transaction of the business of
the ERS and for the custody and control of their funds. The ERS issues a publicly available financial
report that includes financial statements and required supplementary information. That report may be
obtained by writing to the New York State and Local Retirement Systems, Gov. Alfred E. Smith
State Office Building, Albany, New York 12244.
Contributions equal to 3% of salary are required of employees, except for those who joined the ERS
before July 27, 1976 and for those who have ten or more years of credited service. Under the
authority of the NYSRSSL, the Comptroller shall certify annually the rates expressed as proportions
of payroll of members, which shall be used in computing the contributions required to be made by
employers to the pension accumulation fund.
Contributions are required at an actuarially determined rate. The required ERS contributions for the
current year and two preceding years were:
Primary Library ECMCC
Government- Component Component
Year ERS Unit - ERS Unit - ERS
2010 . . . . . . . . . . . . . . . . . . . . . . . . . . . . . . . . . . . . . . . . . . . . . . . . . . . . . . . . . . . . . 27,705,762$ 1,345,141$ 16,000,000$
2009 . . . . . . . . . . . . . . . . . . . . . . . . . . . . . . . . . . . . . . . . . . . . . . . . . . . . . . . . . . . . . 20,340,675 999,436 10,100,000
2008 . . . . . . . . . . . . . . . . . . . . . . . . . . . . . . . . . . . . . . . . . . . . . . . . . . . . . . . . . . . . . 25,385,491 1,346,621 10,300,000
Contribution Amount
The County’s contributions made to the ERS were equal to 100% of the contributions required for
each year. The annual payment is due on February 1 of the subsequent year.
B. Teachers’ Insurance and Annuity Association - College Retirement Equities Fund
TIAA-CREF is a defined contribution annuity plan that is an optional retirement program (“ORP”)
authorized by the trustees of the State University of New York. TIAA/CREF provides benefits
through annuity contracts and provides retirement and death benefits to those employees who elected
to participate in the ORP. Benefits are determined by the amount of individual accumulations and the
retirement income option selected. All benefits generally vest after the completion of one year of
_________________________________________________________________________________________________________________________________ COUNTY OF ERIE, NEW YORK • 51
service if the employee is retained thereafter. TIAA/CREF is contributory for employees who joined
after July 27, 1976, who contribute 3 percent of their salary. For employees enrolled after June 30,
1992, the College contributes 8% of salary for the first seven years of employment and 10% of salary
thereafter. For employees enrolled between July 27, 1976 and June 30, 1992, the College contributes
9% of the first $16,500 in salary and 12% thereafter. Employee contributions are deducted from their
salaries and remitted on a current basis to TIAA/CREF.
Contributions made by the College and its employees in the 2010 fiscal year were $2,462,766 and
$202,113, respectively. The total unpaid balance of this retirement liability at the end of the College’s
fiscal year was $92,317.
C. New York State Teachers’ Retirement System
The TRS is a cost-sharing multiple-employer defined benefit retirement system. The TRS provides
retirement benefits as well as death and disability benefits. Obligations of employers and employees
to contribute, and benefits to employees, are governed by the NYSRSSL and New York State
Education Law. The TRS issues publicly available financial reports that include financial statements
and required supplementary information. The TRS report may be obtained by writing to the New
York State Teachers’ Retirement System, 10 Corporate Woods Drive, Albany, New York 12211-
2395.
Contributions equal to 3% of salary are required of employees, except for those who joined the TRS
before July 27, 1976, and for those who have ten or more years of credited service. Under the
authority of the NYSRSSL, the Comptroller shall certify annually the rates expressed as proportions
of payroll of members, which shall be used in computing the contributions required to be made by
employers to the pension accumulation fund.
The College is required to contribute at an actuarially determined rate. The required pension
contributions for the College current fiscal year and two preceding fiscal years were:
College
Year TRS
2010 . . . . . . . . . . . . . . . . . . . . . . . . . . . . . . . . . . . . . . . . . . . . . . . . . . . . . . . . . . . . . 1,020,091$
2009 . . . . . . . . . . . . . . . . . . . . . . . . . . . . . . . . . . . . . . . . . . . . . . . . . . . . . . . . . . . . . 1,118,358
2008 . . . . . . . . . . . . . . . . . . . . . . . . . . . . . . . . . . . . . . . . . . . . . . . . . . . . . . . . . . . . . 1,264,363
Employer contributions made to the TRS were equal to 100% of the contributions required for each
year. The 2010 and 2009 amounts are the employer portion only, shown to reflect the change in
focus of the disclosure to that of the College’s contributions. The 2008 amount included both the
employer and employee contributions.
The total unpaid employer balance of the TRS retirement liabilities at the end of the College’s fiscal
year was $1,036,818.
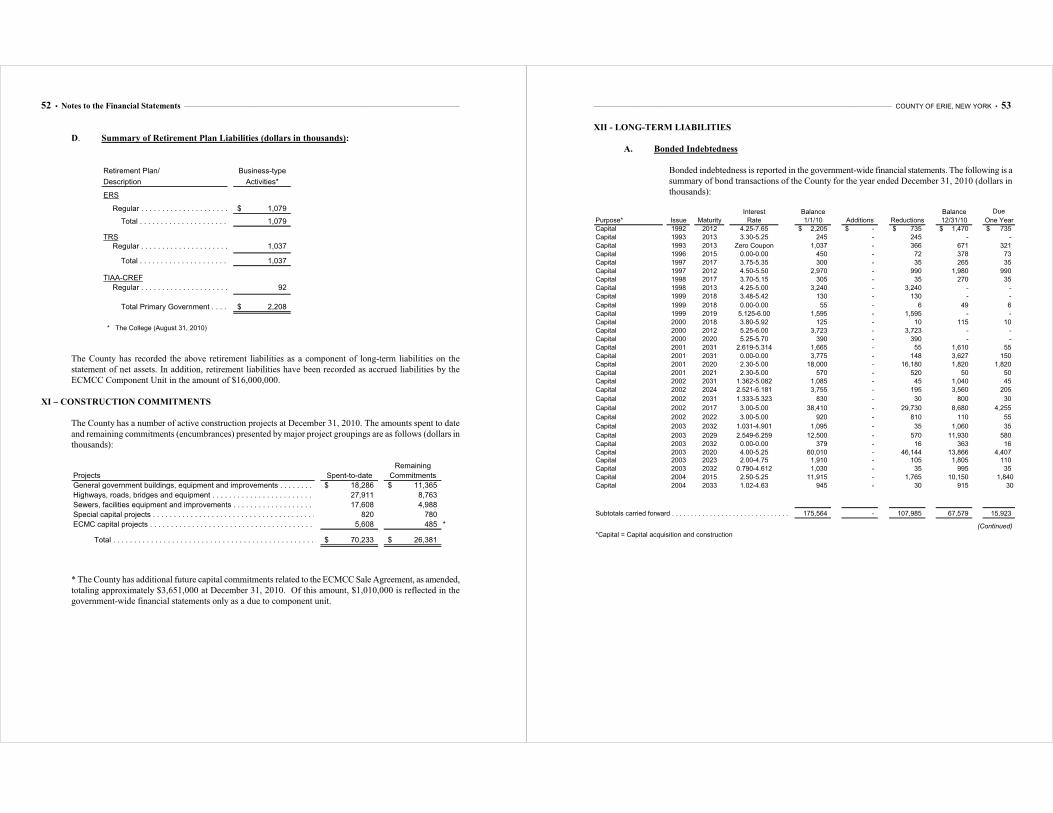
52 • Notes to the Financial Statements _______________________________________________________________________________________________________________________
D. Summary of Retirement Plan Liabilities (dollars in thousands):
Retirement Plan/ Business-type
Description Activities*
ERS
Regular . . . . . . . . . . . . . . . . . . . . . . . . . . . . . . . . . . . . . . . . . . . . . . . . . . . . . . . . . . . . 1,079$
Total . . . . . . . . . . . . . . . . . . . . . . . . . . . . . . . . . . . . . . . . . . . . . . . . . . . . . . . . . . . 1,079
TRS Regular . . . . . . . . . . . . . . . . . . . . . . . . . . . . . . . . . . . . . . . . . . . . . . . . . . . . . . . . . . . . 1,037
Total . . . . . . . . . . . . . . . . . . . . . . . . . . . . . . . . . . . . . . . . . . . . . . . . . . . . . . . . . . . 1,037
TIAA-CREF
Regular . . . . . . . . . . . . . . . . . . . . . . . . . . . . . . . . . . . . . . . . . . . . . . . . . . . . . . . . . . . . 92
Total Primary Government . . . . . . . . . . . . . . . . . . . . . . . . . . . . . . . . . . . . . . . . . . . . . . . . . 2,208$
* The College (August 31, 2010)
The County has recorded the above retirement liabilities as a component of long-term liabilities on the
statement of net assets. In addition, retirement liabilities have been recorded as accrued liabilities by the
ECMCC Component Unit in the amount of $16,000,000.
XI – CONSTRUCTION COMMITMENTS
The County has a number of active construction projects at December 31, 2010. The amounts spent to date
and remaining commitments (encumbrances) presented by major project groupings are as follows (dollars in
thousands):
Remaining
Projects Spent-to-date Commitments
General government buildings, equipment and improvements . . . . . . . . . . . . . . . . . . . . . . . . . . . . . . . . . . . 18,286$ 11,365$
Highways, roads, bridges and equipment . . . . . . . . . . . . . . . . . . . . . . . . . . . . . . . . . . . . . . . . . . . . 27,911 8,763
Sewers, facilities equipment and improvements . . . . . . . . . . . . . . . . . . . . . . . . . . . . . . . . . . . . . . . . . 17,608 4,988
Special capital projects . . . . . . . . . . . . . . . . . . . . . . . . . . . . . . . . . . . . . . . . . . . . . . . . . . . 820 780
ECMC capital projects . . . . . . . . . . . . . . . . . . . . . . . . . . . . . . . . . . . . . . . . . . . . . . . . . . . . . 5,608 485 *
Total . . . . . . . . . . . . . . . . . . . . . . . . . . . . . . . . . . . . . . . . . . . . . . . . . . . . . . . . 70,233$ 26,381$
* The County has additional future capital commitments related to the ECMCC Sale Agreement, as amended,
totaling approximately $3,651,000 at December 31, 2010. Of this amount, $1,010,000 is reflected in the
government-wide financial statements only as a due to component unit.
_________________________________________________________________________________________________________________________________ COUNTY OF ERIE, NEW YORK • 53
XII - LONG-TERM LIABILITIES
A. Bonded Indebtedness
Bonded indebtedness is reported in the government-wide financial statements. The following is a
summary of bond transactions of the County for the year ended December 31, 2010 (dollars in
thousands):
Interest Balance Balance Due
Purpose* Issue Maturity Rate 1/1/10 Additions Reductions 12/31/10 One Year
Capital 1992 2012 4.25-7.65 2,205$ -$ 735$ 1,470$ 735$
Capital 1993 2013 3.30-5.25 245 - 245 - -
Capital 1993 2013 Zero Coupon 1,037 - 366 671 321
Capital 1996 2015 0.00-0.00 450 - 72 378 73
Capital 1997 2017 3.75-5.35 300 - 35 265 35
Capital 1997 2012 4.50-5.50 2,970 - 990 1,980 990
Capital 1998 2017 3.70-5.15 305 - 35 270 35
Capital 1998 2013 4.25-5.00 3,240 - 3,240 - -
Capital 1999 2018 3.48-5.42 130 - 130 - -
Capital 1999 2018 0.00-0.00 55 - 6 49 6
Capital 1999 2019 5.125-6.00 1,595 - 1,595 - -
Capital 2000 2018 3.80-5.92 125 - 10 115 10
Capital 2000 2012 5.25-6.00 3,723 - 3,723 - -
Capital 2000 2020 5.25-5.70 390 - 390 - -
Capital 2001 2031 2.619-5.314 1,665 - 55 1,610 55
Capital 2001 2031 0.00-0.00 3,775 - 148 3,627 150
Capital 2001 2020 2.30-5.00 18,000 - 16,180 1,820 1,820
Capital 2001 2021 2.30-5.00 570 - 520 50 50
Capital 2002 2031 1.362-5.082 1,085 - 45 1,040 45
Capital 2002 2024 2.521-6.181 3,755 - 195 3,560 205
Capital 2002 2031 1.333-5.323 830 - 30 800 30
Capital 2002 2017 3.00-5.00 38,410 - 29,730 8,680 4,255
Capital 2002 2022 3.00-5.00 920 - 810 110 55
Capital 2003 2032 1.031-4.901 1,095 - 35 1,060 35
Capital 2003 2029 2.549-6.259 12,500 - 570 11,930 580
Capital 2003 2032 0.00-0.00 379 - 16 363 16
Capital 2003 2020 4.00-5.25 60,010 - 46,144 13,866 4,407 Capital 2003 2023 2.00-4.75 1,910 - 105 1,805 110
Capital 2003 2032 0.790-4.612 1,030 - 35 995 35
Capital 2004 2015 2.50-5.25 11,915 - 1,765 10,150 1,840
Capital 2004 2033 1.02-4.63 945 - 30 915 30
Subtotals carried forward . . . . . . . . . . . . . . . . . . . . . . . . . . . . . . . . . . . . . . . . . . . . . . . . . . . 175,564 - 107,985 67,579 15,923
(Continued)
*Capital = Capital acquisition and construction
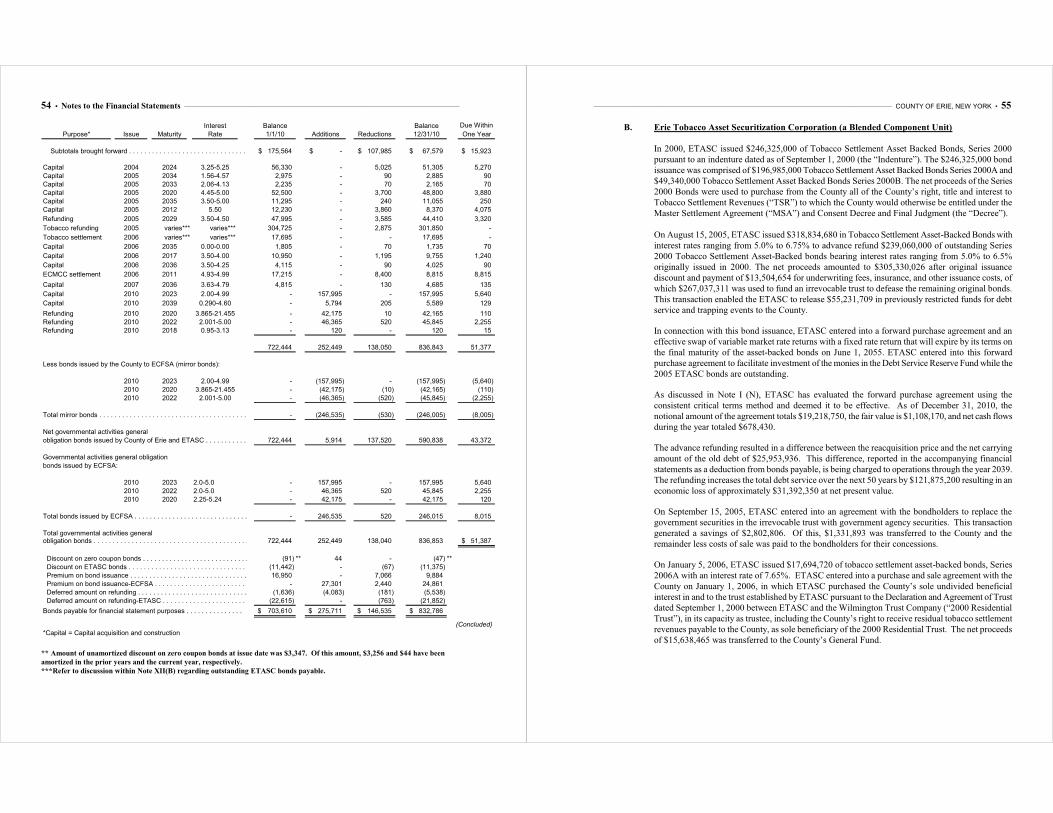
54 • Notes to the Financial Statements _______________________________________________________________________________________________________________________
Interest Balance Balance Due Within
Purpose* Issue Maturity Rate 1/1/10 Additions Reductions 12/31/10 One Year
Subtotals brought forward . . . . . . . . . . . . . . . . . . . . . . . . . . . . . . . . . . . . . . . . . . . . . . . . . 175,564$ -$ 107,985$ 67,579$ 15,923$
Capital 2004 2024 3.25-5.25 56,330 - 5,025 51,305 5,270
Capital 2005 2034 1.56-4.57 2,975 - 90 2,885 90
Capital 2005 2033 2.06-4.13 2,235 - 70 2,165 70
Capital 2005 2020 4.45-5.00 52,500 - 3,700 48,800 3,880
Capital 2005 2035 3.50-5.00 11,295 - 240 11,055 250
Capital 2005 2012 5.50 12,230 - 3,860 8,370 4,075
Refunding 2005 2029 3.50-4.50 47,995 - 3,585 44,410 3,320
Tobacco refunding 2005 varies*** varies*** 304,725 - 2,875 301,850 -
Tobacco settlement 2006 varies*** varies*** 17,695 - - 17,695 -
Capital 2006 2035 0.00-0.00 1,805 - 70 1,735 70
Capital 2006 2017 3.50-4.00 10,950 - 1,195 9,755 1,240
Capital 2006 2036 3.50-4.25 4,115 - 90 4,025 90
ECMCC settlement 2006 2011 4.93-4.99 17,215 - 8,400 8,815 8,815
Capital 2007 2036 3.63-4.79 4,815 - 130 4,685 135
Capital 2010 2023 2.00-4.99 - 157,995 - 157,995 5,640
Capital 2010 2039 0.290-4.60 - 5,794 205 5,589 129
Refunding 2010 2020 3.865-21.455 - 42,175 10 42,165 110
Refunding 2010 2022 2.001-5.00 - 46,365 520 45,845 2,255
Refunding 2010 2018 0.95-3.13 - 120 - 120 15
722,444 252,449 138,050 836,843 51,377
Less bonds issued by the County to ECFSA (mirror bonds):
2010 2023 2.00-4.99 - (157,995) - (157,995) (5,640)
2010 2020 3.865-21.455 - (42,175) (10) (42,165) (110)
2010 2022 2.001-5.00 - (46,365) (520) (45,845) (2,255)
Total mirror bonds . . . . . . . . . . . . . . . . . . . . . . . . . . . . . . . . . . . . . . . . . . . . . . . . . . . . . . - (246,535) (530) (246,005) (8,005)
Net governmental activities general
obligation bonds issued by County of Erie and ETASC . . . . . . . . . . . . . . . . . . . . . . . . . . . . . . . . . . . . . . 722,444 5,914 137,520 590,838 43,372
Governmental activities general obligation
bonds issued by ECFSA:
2010 2023 2.0-5.0 - 157,995 - 157,995 5,640
2010 2022 2.0-5.0 - 46,365 520 45,845 2,255
2010 2020 2.25-5.24 - 42,175 - 42,175 120
Total bonds issued by ECFSA . . . . . . . . . . . . . . . . . . . . . . . . . . . . . . . . . . . . . . . . . . . . . . . . . . - 246,535 520 246,015 8,015
Total governmental activities general obligation bonds . . . . . . . . . . . . . . . . . . . . . . . . . . . . . . . . . . . . . . . . . . . . . . . . . . . . . . . 722,444 252,449 138,040 836,853 51,387$
Discount on zero coupon bonds . . . . . . . . . . . . . . . . . . . . . . . . . . . . . . . . . . . . . . . . . . . . . . . . (91) ** 44 - (47) **
Discount on ETASC bonds . . . . . . . . . . . . . . . . . . . . . . . . . . . . . . . . . . . . . . . . . . . . . . . . . . . (11,442) - (67) (11,375)
Premium on bond issuance . . . . . . . . . . . . . . . . . . . . . . . . . . . . . . . . . . . . . . . . . . . . . . . . . . 16,950 - 7,066 9,884
Premium on bond issuance-ECFSA . . . . . . . . . . . . . . . . . . . . . . . . . . . . . . . . . . . . . . . . . . . . . . . - 27,301 2,440 24,861
Deferred amount on refunding . . . . . . . . . . . . . . . . . . . . . . . . . . . . . . . . . . . . . . . . . . . . . . . . (1,636) (4,083) (181) (5,538)
Deferred amount on refunding-ETASC . . . . . . . . . . . . . . . . . . . . . . . . . . . . . . . . . . . . . . . . . . . . . (22,615) - (763) (21,852)
703,610$ 275,711$ 146,535$ 832,786$
(Concluded)
*Capital = Capital acquisition and construction
Bonds payable for financial statement purposes . . . . . . . . . . . . . . . . . . . . . . . . . . . . . . . . . . . . . . . .
** Amount of unamortized discount on zero coupon bonds at issue date was $3,347. Of this amount, $3,256 and $44 have been
amortized in the prior years and the current year, respectively.
***Refer to discussion within Note XII(B) regarding outstanding ETASC bonds payable.
_________________________________________________________________________________________________________________________________ COUNTY OF ERIE, NEW YORK • 55
B. Erie Tobacco Asset Securitization Corporation (a Blended Component Unit)
In 2000, ETASC issued $246,325,000 of Tobacco Settlement Asset Backed Bonds, Series 2000
pursuant to an indenture dated as of September 1, 2000 (the “Indenture”). The $246,325,000 bond
issuance was comprised of $196,985,000 Tobacco Settlement Asset Backed Bonds Series 2000A and
$49,340,000 Tobacco Settlement Asset Backed Bonds Series 2000B. The net proceeds of the Series
2000 Bonds were used to purchase from the County all of the County’s right, title and interest to
Tobacco Settlement Revenues (“TSR”) to which the County would otherwise be entitled under the
Master Settlement Agreement (“MSA”) and Consent Decree and Final Judgment (the “Decree”).
On August 15, 2005, ETASC issued $318,834,680 in Tobacco Settlement Asset-Backed Bonds with
interest rates ranging from 5.0% to 6.75% to advance refund $239,060,000 of outstanding Series
2000 Tobacco Settlement Asset-Backed bonds bearing interest rates ranging from 5.0% to 6.5%
originally issued in 2000. The net proceeds amounted to $305,330,026 after original issuance
discount and payment of $13,504,654 for underwriting fees, insurance, and other issuance costs, of
which $267,037,311 was used to fund an irrevocable trust to defease the remaining original bonds.
This transaction enabled the ETASC to release $55,231,709 in previously restricted funds for debt
service and trapping events to the County.
In connection with this bond issuance, ETASC entered into a forward purchase agreement and an
effective swap of variable market rate returns with a fixed rate return that will expire by its terms on
the final maturity of the asset-backed bonds on June 1, 2055. ETASC entered into this forward
purchase agreement to facilitate investment of the monies in the Debt Service Reserve Fund while the
2005 ETASC bonds are outstanding.
As discussed in Note I (N), ETASC has evaluated the forward purchase agreement using the
consistent critical terms method and deemed it to be effective. As of December 31, 2010, the
notional amount of the agreement totals $19,218,750, the fair value is $1,108,170, and net cash flows
during the year totaled $678,430.
The advance refunding resulted in a difference between the reacquisition price and the net carrying
amount of the old debt of $25,953,936. This difference, reported in the accompanying financial
statements as a deduction from bonds payable, is being charged to operations through the year 2039.
The refunding increases the total debt service over the next 50 years by $121,875,200 resulting in an
economic loss of approximately $31,392,350 at net present value.
On September 15, 2005, ETASC entered into an agreement with the bondholders to replace the
government securities in the irrevocable trust with government agency securities. This transaction
generated a savings of $2,802,806. Of this, $1,331,893 was transferred to the County and the
remainder less costs of sale was paid to the bondholders for their concessions.
On January 5, 2006, ETASC issued $17,694,720 of tobacco settlement asset-backed bonds, Series
2006A with an interest rate of 7.65%. ETASC entered into a purchase and sale agreement with the
County on January 1, 2006, in which ETASC purchased the County’s sole undivided beneficial
interest in and to the trust established by ETASC pursuant to the Declaration and Agreement of Trust
dated September 1, 2000 between ETASC and the Wilmington Trust Company (“2000 Residential
Trust”), in its capacity as trustee, including the County’s right to receive residual tobacco settlement
revenues payable to the County, as sole beneficiary of the 2000 Residential Trust. The net proceeds
of $15,638,465 was transferred to the County’s General Fund.
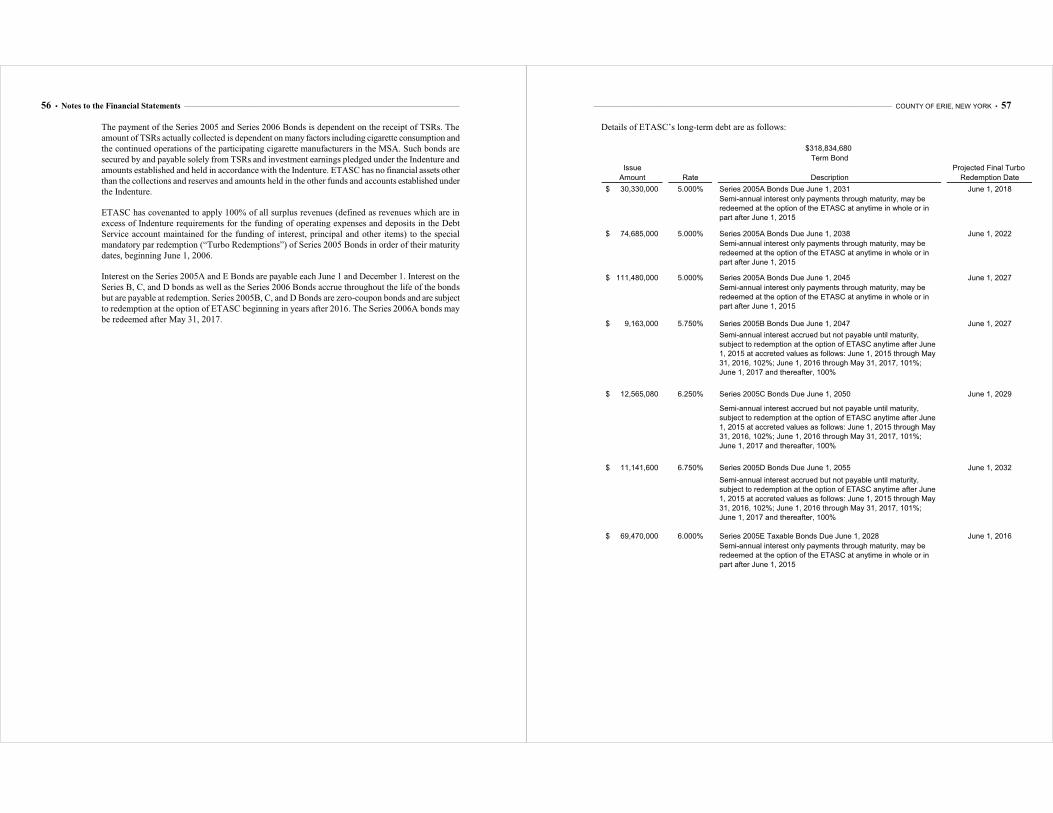
56 • Notes to the Financial Statements _______________________________________________________________________________________________________________________
The payment of the Series 2005 and Series 2006 Bonds is dependent on the receipt of TSRs. The
amount of TSRs actually collected is dependent on many factors including cigarette consumption and
the continued operations of the participating cigarette manufacturers in the MSA. Such bonds are
secured by and payable solely from TSRs and investment earnings pledged under the Indenture and
amounts established and held in accordance with the Indenture. ETASC has no financial assets other
than the collections and reserves and amounts held in the other funds and accounts established under
the Indenture.
ETASC has covenanted to apply 100% of all surplus revenues (defined as revenues which are in
excess of Indenture requirements for the funding of operating expenses and deposits in the Debt
Service account maintained for the funding of interest, principal and other items) to the special
mandatory par redemption (“Turbo Redemptions”) of Series 2005 Bonds in order of their maturity
dates, beginning June 1, 2006.
Interest on the Series 2005A and E Bonds are payable each June 1 and December 1. Interest on the
Series B, C, and D bonds as well as the Series 2006 Bonds accrue throughout the life of the bonds
but are payable at redemption. Series 2005B, C, and D Bonds are zero-coupon bonds and are subject
to redemption at the option of ETASC beginning in years after 2016. The Series 2006A bonds may
be redeemed after May 31, 2017.
_________________________________________________________________________________________________________________________________ COUNTY OF ERIE, NEW YORK • 57
Details of ETASC’s long-term debt are as follows:
$318,834,680
Term Bond
Issue Projected Final Turbo
Amount Rate Description Redemption Date
30,330,000$ 5.000% Series 2005A Bonds Due June 1, 2031 June 1, 2018
74,685,000$ 5.000% Series 2005A Bonds Due June 1, 2038 June 1, 2022
111,480,000$ 5.000% Series 2005A Bonds Due June 1, 2045 June 1, 2027
9,163,000$ 5.750% Series 2005B Bonds Due June 1, 2047 June 1, 2027
12,565,080$ 6.250% Series 2005C Bonds Due June 1, 2050 June 1, 2029
11,141,600$ 6.750% Series 2005D Bonds Due June 1, 2055 June 1, 2032
69,470,000$ 6.000% Series 2005E Taxable Bonds Due June 1, 2028 June 1, 2016
Semi-annual interest only payments through maturity, may be redeemed at the option of the ETASC at anytime in whole or in
part after June 1, 2015
Semi-annual interest only payments through maturity, may be redeemed at the option of the ETASC at anytime in whole or in part after June 1, 2015
Semi-annual interest only payments through maturity, may be
redeemed at the option of the ETASC at anytime in whole or in part after June 1, 2015
Semi-annual interest accrued but not payable until maturity, subject to redemption at the option of ETASC anytime after June 1, 2015 at accreted values as follows: June 1, 2015 through May 31, 2016, 102%; June 1, 2016 through May 31, 2017, 101%; June 1, 2017 and thereafter, 100%
Semi-annual interest accrued but not payable until maturity, subject to redemption at the option of ETASC anytime after June 1, 2015 at accreted values as follows: June 1, 2015 through May 31, 2016, 102%; June 1, 2016 through May 31, 2017, 101%; June 1, 2017 and thereafter, 100%
Semi-annual interest accrued but not payable until maturity, subject to redemption at the option of ETASC anytime after June 1, 2015 at accreted values as follows: June 1, 2015 through May 31, 2016, 102%; June 1, 2016 through May 31, 2017, 101%; June 1, 2017 and thereafter, 100%
Semi-annual interest only payments through maturity, may be redeemed at the option of the ETASC at anytime in whole or in part after June 1, 2015
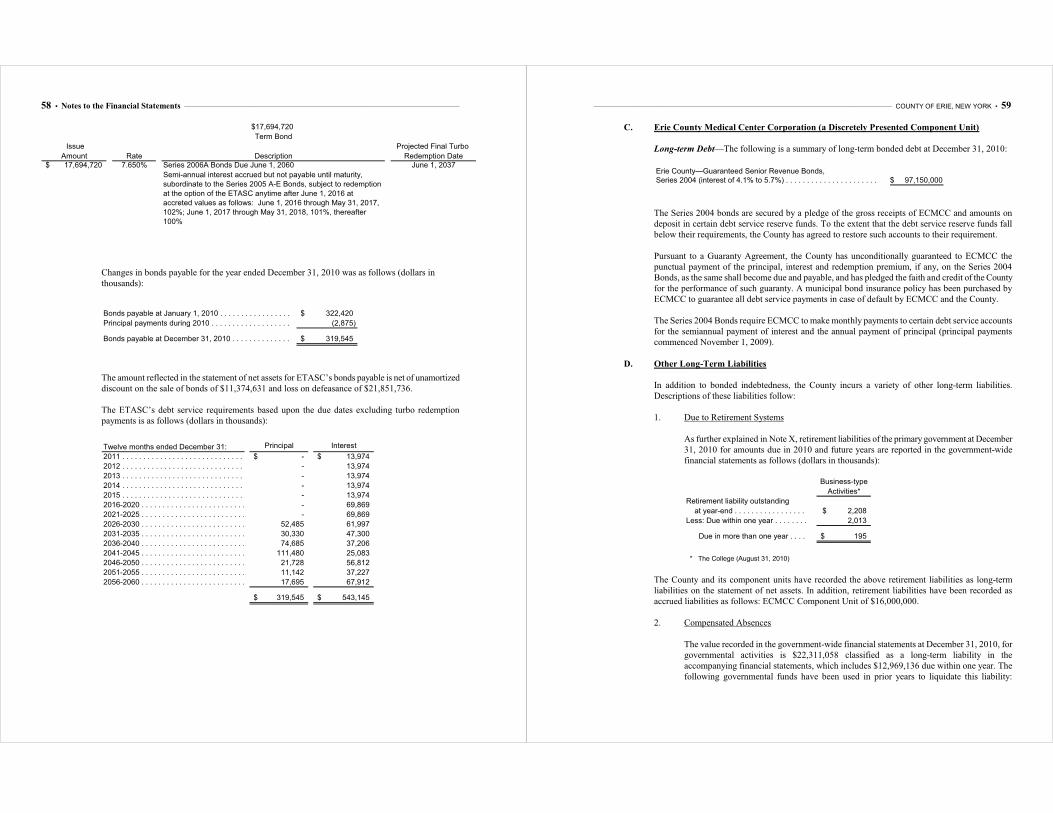
58 • Notes to the Financial Statements _______________________________________________________________________________________________________________________
$17,694,720
Term Bond
Issue Projected Final Turbo
Amount Rate Description Redemption Date17,694,720$ 7.650% Series 2006A Bonds Due June 1, 2060 June 1, 2037
Semi-annual interest accrued but not payable until maturity,
subordinate to the Series 2005 A-E Bonds, subject to redemption
at the option of the ETASC anytime after June 1, 2016 at
accreted values as follows: June 1, 2016 through May 31, 2017,
102%; June 1, 2017 through May 31, 2018, 101%, thereafter
100%
Changes in bonds payable for the year ended December 31, 2010 was as follows (dollars in
thousands):
Bonds payable at January 1, 2010 . . . . . . . . . . . . . . . . . . . . . . . . . . . . . . . . . . . . . . . . . . . . . . . 322,420$
Principal payments during 2010 . . . . . . . . . . . . . . . . . . . . . . . . . . . . . . . . . . . . . . . . . . . . . . . . (2,875)
Bonds payable at December 31, 2010 . . . . . . . . . . . . . . . . . . . . . . . . . . . . . . . . . . . . . . . . . . . . . . 319,545$
The amount reflected in the statement of net assets for ETASC’s bonds payable is net of unamortized
discount on the sale of bonds of $11,374,631 and loss on defeasance of $21,851,736.
The ETASC’s debt service requirements based upon the due dates excluding turbo redemption
payments is as follows (dollars in thousands):
Twelve months ended December 31: Principal Interest
2011 . . . . . . . . . . . . . . . . . . . . . . . . . . . . . . . . . . . . . . . . . . . . . . . . . . . . . . . . . . . . . -$ 13,974$
2012 . . . . . . . . . . . . . . . . . . . . . . . . . . . . . . . . . . . . . . . . . . . . . . . . . . . . . . . . . . . . . - 13,974
2013 . . . . . . . . . . . . . . . . . . . . . . . . . . . . . . . . . . . . . . . . . . . . . . . . . . . . . . . . . . . . . - 13,974
2014 . . . . . . . . . . . . . . . . . . . . . . . . . . . . . . . . . . . . . . . . . . . . . . . . . . . . . . . . . . . . . - 13,974
2015 . . . . . . . . . . . . . . . . . . . . . . . . . . . . . . . . . . . . . . . . . . . . . . . . . . . . . . . . . . . . . - 13,974
2016-2020 . . . . . . . . . . . . . . . . . . . . . . . . . . . . . . . . . . . . . . . . . . . . . . . . . . . . . . . . . . . - 69,869
2021-2025 . . . . . . . . . . . . . . . . . . . . . . . . . . . . . . . . . . . . . . . . . . . . . . . . . . . . . . . . . . . - 69,869
2026-2030 . . . . . . . . . . . . . . . . . . . . . . . . . . . . . . . . . . . . . . . . . . . . . . . . . . . . . . . . . . . 52,485 61,997
2031-2035 . . . . . . . . . . . . . . . . . . . . . . . . . . . . . . . . . . . . . . . . . . . . . . . . . . . . . . . . . . . 30,330 47,300
2036-2040 . . . . . . . . . . . . . . . . . . . . . . . . . . . . . . . . . . . . . . . . . . . . . . . . . . . . . . . . . . . 74,685 37,206
2041-2045 . . . . . . . . . . . . . . . . . . . . . . . . . . . . . . . . . . . . . . . . . . . . . . . . . . . . . . . . . . . 111,480 25,083
2046-2050 . . . . . . . . . . . . . . . . . . . . . . . . . . . . . . . . . . . . . . . . . . . . . . . . . . . . . . . . . . . 21,728 56,812
2051-2055 . . . . . . . . . . . . . . . . . . . . . . . . . . . . . . . . . . . . . . . . . . . . . . . . . . . . . . . . . . . 11,142 37,227
2056-2060 . . . . . . . . . . . . . . . . . . . . . . . . . . . . . . . . . . . . . . . . . . . . . . . . . . . . . . . . . . . 17,695 67,912
319,545$ 543,145$
_________________________________________________________________________________________________________________________________ COUNTY OF ERIE, NEW YORK • 59
C. Erie County Medical Center Corporation (a Discretely Presented Component Unit)
Long-term Debt—The following is a summary of long-term bonded debt at December 31, 2010:
Erie County—Guaranteed Senior Revenue Bonds,
Series 2004 (interest of 4.1% to 5.7%) . . . . . . . . . . . . . . . . . . . . . . . . . . . . . . . . . . . . . . . . . . . . 97,150,000$
The Series 2004 bonds are secured by a pledge of the gross receipts of ECMCC and amounts on
deposit in certain debt service reserve funds. To the extent that the debt service reserve funds fall
below their requirements, the County has agreed to restore such accounts to their requirement.
Pursuant to a Guaranty Agreement, the County has unconditionally guaranteed to ECMCC the
punctual payment of the principal, interest and redemption premium, if any, on the Series 2004
Bonds, as the same shall become due and payable, and has pledged the faith and credit of the County
for the performance of such guaranty. A municipal bond insurance policy has been purchased by
ECMCC to guarantee all debt service payments in case of default by ECMCC and the County.
The Series 2004 Bonds require ECMCC to make monthly payments to certain debt service accounts
for the semiannual payment of interest and the annual payment of principal (principal payments
commenced November 1, 2009).
D. Other Long-Term Liabilities
In addition to bonded indebtedness, the County incurs a variety of other long-term liabilities.
Descriptions of these liabilities follow:
1. Due to Retirement Systems
As further explained in Note X, retirement liabilities of the primary government at December
31, 2010 for amounts due in 2010 and future years are reported in the government-wide
financial statements as follows (dollars in thousands):
Business-type
Activities*
Retirement liability outstanding
at year-end . . . . . . . . . . . . . . . . . . . . . . . . . . . . . . . . . . . . . . . . . . . . . . . . . . . . . . . . 2,208$
Less: Due within one year . . . . . . . . . . . . . . . . . . . . . . . . . . . . . . . . . . . . . . . . . . . . . . . . . . . 2,013
Due in more than one year . . . . . . . . . . . . . . . . . . . . . . . . . . . . . . . . . . . . . . . . . . . . . . . . 195$
* The College (August 31, 2010)
The County and its component units have recorded the above retirement liabilities as long-term
liabilities on the statement of net assets. In addition, retirement liabilities have been recorded as
accrued liabilities as follows: ECMCC Component Unit of $16,000,000.
2. Compensated Absences
The value recorded in the government-wide financial statements at December 31, 2010, for
governmental activities is $22,311,058 classified as a long-term liability in the
accompanying financial statements, which includes $12,969,136 due within one year. The
following governmental funds have been used in prior years to liquidate this liability:
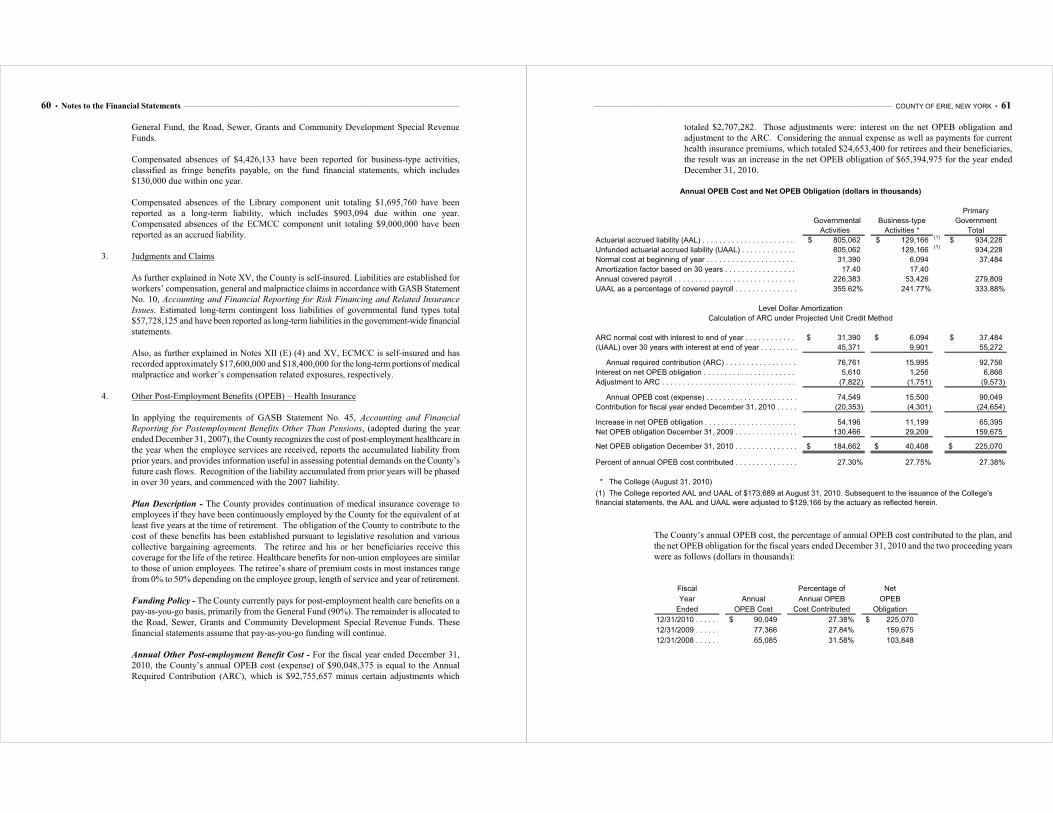
60 • Notes to the Financial Statements _______________________________________________________________________________________________________________________
General Fund, the Road, Sewer, Grants and Community Development Special Revenue
Funds.
Compensated absences of $4,426,133 have been reported for business-type activities,
classified as fringe benefits payable, on the fund financial statements, which includes
$130,000 due within one year.
Compensated absences of the Library component unit totaling $1,695,760 have been
reported as a long-term liability, which includes $903,094 due within one year.
Compensated absences of the ECMCC component unit totaling $9,000,000 have been
reported as an accrued liability.
3. Judgments and Claims
As further explained in Note XV, the County is self-insured. Liabilities are established for
workers’ compensation, general and malpractice claims in accordance with GASB Statement
No. 10, Accounting and Financial Reporting for Risk Financing and Related Insurance
Issues. Estimated long-term contingent loss liabilities of governmental fund types total
$57,728,125 and have been reported as long-term liabilities in the government-wide financial
statements.
Also, as further explained in Notes XII (E) (4) and XV, ECMCC is self-insured and has
recorded approximately $17,600,000 and $18,400,000 for the long-term portions of medical
malpractice and worker’s compensation related exposures, respectively.
4. Other Post-Employment Benefits (OPEB) – Health Insurance
In applying the requirements of GASB Statement No. 45, Accounting and Financial
Reporting for Postemployment Benefits Other Than Pensions, (adopted during the year
ended December 31, 2007), the County recognizes the cost of post-employment healthcare in
the year when the employee services are received, reports the accumulated liability from
prior years, and provides information useful in assessing potential demands on the County’s
future cash flows. Recognition of the liability accumulated from prior years will be phased
in over 30 years, and commenced with the 2007 liability.
Plan Description - The County provides continuation of medical insurance coverage to
employees if they have been continuously employed by the County for the equivalent of at
least five years at the time of retirement. The obligation of the County to contribute to the
cost of these benefits has been established pursuant to legislative resolution and various
collective bargaining agreements. The retiree and his or her beneficiaries receive this
coverage for the life of the retiree. Healthcare benefits for non-union employees are similar
to those of union employees. The retiree’s share of premium costs in most instances range
from 0% to 50% depending on the employee group, length of service and year of retirement.
Funding Policy - The County currently pays for post-employment health care benefits on a
pay-as-you-go basis, primarily from the General Fund (90%). The remainder is allocated to
the Road, Sewer, Grants and Community Development Special Revenue Funds. These
financial statements assume that pay-as-you-go funding will continue.
Annual Other Post-employment Benefit Cost - For the fiscal year ended December 31,
2010, the County’s annual OPEB cost (expense) of $90,048,375 is equal to the Annual
Required Contribution (ARC), which is $92,755,657 minus certain adjustments which
_________________________________________________________________________________________________________________________________ COUNTY OF ERIE, NEW YORK • 61
totaled $2,707,282. Those adjustments were: interest on the net OPEB obligation and
adjustment to the ARC. Considering the annual expense as well as payments for current
health insurance premiums, which totaled $24,653,400 for retirees and their beneficiaries,
the result was an increase in the net OPEB obligation of $65,394,975 for the year ended
December 31, 2010.
Primary
Governmental Business-type Government
Activities Activities * Total
Actuarial accrued liability (AAL) . . . . . . . . . . . . . . . . . . . . . . . . . . . . . . . . . . . . . . . . . . . . . . . 805,062$ 129,166$ (1) 934,228$
Unfunded actuarial accrued liability (UAAL) . . . . . . . . . . . . . . . . . . . . . . . . . . . . . . . . . . . . . . . . . . 805,062 129,166 (1) 934,228
Normal cost at beginning of year . . . . . . . . . . . . . . . . . . . . . . . . . . . . . . . . . . . . . . . . . . . . . . . 31,390 6,094 37,484
Amortization factor based on 30 years . . . . . . . . . . . . . . . . . . . . . . . . . . . . . . . . . . . . . . . . . . . . . 17.40 17.40
Annual covered payroll . . . . . . . . . . . . . . . . . . . . . . . . . . . . . . . . . . . . . . . . . . . . . . . . . . . . 226,383 53,426 279,809
UAAL as a percentage of covered payroll . . . . . . . . . . . . . . . . . . . . . . . . . . . . . . . . . . . . . . . . . . . . 355.62% 241.77% 333.88%
ARC normal cost with interest to end of year . . . . . . . . . . . . . . . . . . . . . . . . . . . . . . . . . . . . . . . . . 31,390$ 6,094$ 37,484$
(UAAL) over 30 years with interest at end of year . . . . . . . . . . . . . . . . . . . . . . . . . . . . . . . . . . . . . . . 45,371 9,901 55,272
Annual required contribution (ARC) . . . . . . . . . . . . . . . . . . . . . . . . . . . . . . . . . . . . . . . . . . . . 76,761 15,995 92,756
Interest on net OPEB obligation . . . . . . . . . . . . . . . . . . . . . . . . . . . . . . . . . . . . . . . . . . . . . . . . 5,610 1,256 6,866
Adjustment to ARC . . . . . . . . . . . . . . . . . . . . . . . . . . . . . . . . . . . . . . . . . . . . . . . . . . . . . . . (7,822) (1,751) (9,573)
Annual OPEB cost (expense) . . . . . . . . . . . . . . . . . . . . . . . . . . . . . . . . . . . . . . . . . . . . . . . . 74,549 15,500 90,049
Contribution for fiscal year ended December 31, 2010 . . . . . . . . . . . . . . . . . . . . . . . . . . . . . . . . . . . . . (20,353) (4,301) (24,654)
Increase in net OPEB obligation . . . . . . . . . . . . . . . . . . . . . . . . . . . . . . . . . . . . . . . . . . . . . . . . 54,196 11,199 65,395
Net OPEB obligation December 31, 2009 . . . . . . . . . . . . . . . . . . . . . . . . . . . . . . . . . . . . . . . . . . . . . 130,466 29,209 159,675
Net OPEB obligation December 31, 2010 . . . . . . . . . . . . . . . . . . . . . . . . . . . . . . . . . . . . . . . . . . . . . 184,662$ 40,408$ 225,070$
Percent of annual OPEB cost contributed . . . . . . . . . . . . . . . . . . . . . . . . . . . . . . . . . . . . . . . . . . . . 27.30% 27.75% 27.38%
* The College (August 31, 2010)
Annual OPEB Cost and Net OPEB Obligation (dollars in thousands)
Level Dollar Amortization
Calculation of ARC under Projected Unit Credit Method
(1) The College reported AAL and UAAL of $173,689 at August 31, 2010. Subsequent to the issuance of the College's
financial statements, the AAL and UAAL were adjusted to $129,166 by the actuary as reflected herein.
The County’s annual OPEB cost, the percentage of annual OPEB cost contributed to the plan, and
the net OPEB obligation for the fiscal years ended December 31, 2010 and the two proceeding years
were as follows (dollars in thousands):
Fiscal Percentage of Net
Year Annual Annual OPEB OPEB
Ended OPEB Cost Cost Contributed Obligation
12/31/2010 . . . . . . . . . . . . . . . . . . . . . . . . . . . . . . . . . . . . . . . . . . . . . . . . . . . . . . . . . . 90,049$ 27.38% 225,070$
12/31/2009 . . . . . . . . . . . . . . . . . . . . . . . . . . . . . . . . . . . . . . . . . . . . . . . . . . . . . . . . . . 77,366 27.84% 159,675
12/31/2008 . . . . . . . . . . . . . . . . . . . . . . . . . . . . . . . . . . . . . . . . . . . . . . . . . . . . . . . . . . 65,085 31.58% 103,848

62 • Notes to the Financial Statements _______________________________________________________________________________________________________________________
Funded Status and Funding Progress – The OPEB plan was unfunded, resulting in an
unfunded accrued liability (UAAL) of $756,743,082 for governmental activities and
$122,456,935 for business-type activities as of the most recent actuarial valuation date of
January 1, 2010.
The County’s schedule of funding progress is presented below (dollars in thousands):
Actuarial Ratio of
Actuarial Actuarial Accrued Unfunded UAAL to
Valuation Value of Liability AAL Funded Covered Covered
Date Assets ("AAL") ("UAAL") Ratio Payroll Payroll
1/1/2010 . . . . . . . . . . . . . . . . . . . . . . . . . . . . . . . . . . . . . . . . . . . . . . . . . . . . . . . . . . . -$ 879,200$ 879,200$ - % 279,809$ 314.21%
1/1/2008 . . . . . . . . . . . . . . . . . . . . . . . . . . . . . . . . . . . . . . . . . . . . . . . . . . . . . . . . . . . - 748,175 748,175 - % 256,543 291.64%
1/1/2006 . . . . . . . . . . . . . . . . . . . . . . . . . . . . . . . . . . . . . . . . . . . . . . . . . . . . . . . . . . . - 736,192 736,192 - % 243,332 302.55%
Actuarial valuations of an ongoing plan involve estimates of the value of reported amounts
and assumptions about the probability of occurrence of events far into the future. Amounts
determined regarding the funded status of the plan and the annual required contributions of
the employer are subject to continual revision as actual results are compared with past
expectations and new estimates are made about the future. The schedule of funding
progress, presented as required supplementary information following the notes to the
financial statements, presents multiyear trend information that shows whether the actuarial
value of plan assets is increasing or decreasing over time relative to the actuarial accrued
liabilities for benefits.
Actuarial Methods and Assumptions - Projections of benefits for financial reporting
purposes are based on the types of benefits provided under the terms of the substantive plan
(the plan as understood by the employer and the plan members) and on the historical pattern
of cost sharing between the employer and plan members at that point. The actuarial methods
and assumptions used include techniques that are designed to reduce the effects of short-term
volatility in actuarial accrued liabilities and the actuarial value of assets, consistent with the
long-term perspective of the calculations. Included coverages are “experience-rated” and
annual premiums for experience-rated coverages were used as a proxy for claims costs with
age adjustments for pre-65 and post-65 participants. The unfunded actuarial accrued liability
is being amortized over 30 years on a level dollar open basis.
In the January 1, 2010 actuarial valuation, the liabilities were computed using the projected
unit credit method. The actuarial assumptions utilized an inflation rate of 3.25% and a
4.30% investment rate of return. The latter rate is based on the projected long-term earning
rate of the assets expected to be available to pay benefits. Because the County does not
currently segregate funding for these benefits, the rate selected is the expected return on the
County’s assets. The valuation assumes healthcare cost trends as follows: pre-65 medical,
9.00%; post-65 non-Medicare Advantage (“MA”) medical, 8.50%; post 65 MA, 30%; and
prescription, 8.5%. Healthcare trends are reduced by decrements to reach a rate of 5.00% in
2018.
Medical Reimbursements - The County’s Medicare Part D prescription drug subsidy, which
reduces the cost of retiree healthcare premiums, is accrued as revenue only in the current
year. Projected subsidies for future years cannot be recognized as a reduction to the actuarial
accrued liability.
_________________________________________________________________________________________________________________________________ COUNTY OF ERIE, NEW YORK • 63
5. Bond Anticipation Notes
During the year ended December 31, 2010, the County issued bond anticipation notes in the
amount of $4,766,947. The County refinanced $500,650 of the total amount outstanding of
$5,756,182 on a long-term basis on May 5, 2011. Accordingly, that portion of the obligation
will not require the use of available financial resources and has been reclassified as long-
term.
E. Summary of Changes in Long-Term Liabilities
The following is a summary of changes in long-term liabilities for the year ended December 31, 2010
(dollars in thousands):
1. Governmental Activities
Balance Balance Due Within
1/1/10 Additions Reductions 12/31/10 One Year
statement purposes . . . . . . . . . . . . . . . . . . . . . . . . . . . . . . . . . . . . . . . . . . . . . . . . . . . . . . 703,610$ 275,711$ (1) 146,535$ 832,786$ 51,387$
Local Employees'
Retirement System . . . . . . . . . . . . . . . . . . . . . . . . . . . . . . . . . . . . . . . . . . . . . . . . . . . . . . . 9,570 42 9,612 - -
23,654 17,776 19,119 22,311 12,969
55,020 16,227 13,519 57,728 11,057
130,466 82,371 28,175 184,662 -
3,232 501 3,232 501 - (2)
925,552$ 392,628$ 220,192$ 1,097,988$ 75,413$
(1) Includes $44 representing portion of zero coupon bonds discount amortized in current year;
remaining unamortized discount is $47.
(2) Detailed amoritization schedules for the portion of BANs classified as long-term are not readily available.
long-term liabilities . . . . . . . . . . . . . . . . . . . . . . . . . . . . . . . . . . . . . . . . . . . . . . . . . Governmental activities
OPEB liability . . . . . . . . . . . . . . . . . . . . . . . . . . . . . . . . . . . . . . . . . . . . . . . . . . . . . . . .
Bonds payable for financial
Due to New York State and
Compensated absences . . . . . . . . . . . . . . . . . . . . . . . . . . . . . . . . . . . . . . . . . . . . . . . . . . . . .
Bond anticipation notes . . . . . . . . . . . . . . . . . . . . . . . . . . . . . . . . . . . . . . . . . . . . . . . . . . . .
Judgments and claims . . . . . . . . . . . . . . . . . . . . . . . . . . . . . . . . . . . . . . . . . . . . . . . . . . . . .
2. Business-Type Activities*
Balance Balance Due Within
9/1/09 Additions Reductions 8/31/10 One Year
Retirement liabilities . . . . . . . . . . . . . . . . . . . . . . . . . . . . . . . . . . . . . . . . . . . . . . . . . . . . 2,067$ 5,256$ 5,076$ 2,247$ (1) 2,028$ (1)
Compensated absences
and fringe benefits . . . . . . . . . . . . . . . . . . . . . . . . . . . . . . . . . . . . . . . . . . . . . . . . . . . . . 4,201 396 171 4,426 130
OPEB liability . . . . . . . . . . . . . . . . . . . . . . . . . . . . . . . . . . . . . . . . . . . . . . . . . . . . . . . . 29,209 15,500 4,301 40,408 -
Business-type activities
Long-term liabilities . . . . . . . . . . . . . . . . . . . . . . . . . . . . . . . . . . . . . . . . . . . . . . . . . . . 35,477$ 21,152$ 9,548$ 47,081$ 2,158$
* The College (August 31, 2010)
(1) Includes $39 of Retirement Incentive Wages, of which $15 is due within one year.
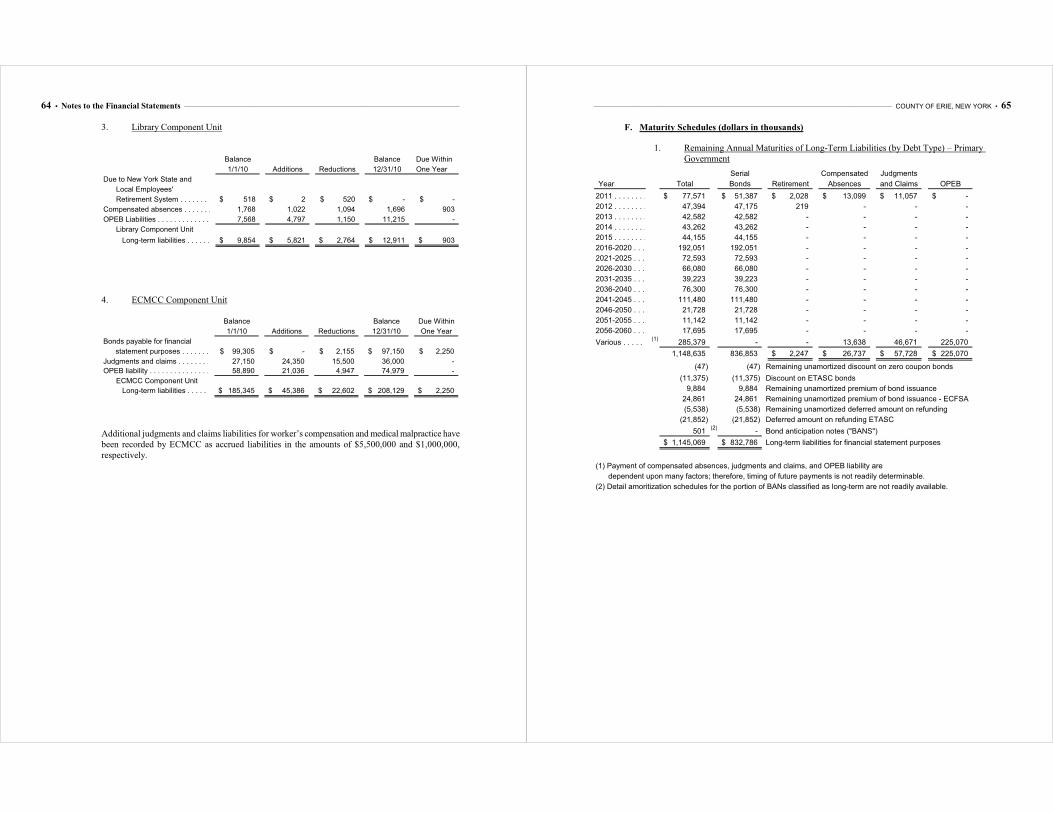
64 • Notes to the Financial Statements _______________________________________________________________________________________________________________________
3. Library Component Unit
Balance Balance Due Within
1/1/10 Additions Reductions 12/31/10 One Year
Local Employees'
Retirement System . . . . . . . . . . . . . . . . . . . . . . . . . . . . . . . . . . . . . . . . . . . . . . . . . . . . . . . 518$ 2$ 520$ -$ -$
1,768 1,022 1,094 1,696 903
7,568 4,797 1,150 11,215 -
Library Component Unit
Long-term liabilities . . . . . . . . . . . . . . . . . . . . . . . . . . . . . . . . . . . . . . . . . . . . . . . . . . . 9,854$ 5,821$ 2,764$ 12,911$ 903$
OPEB Liabilities . . . . . . . . . . . . . . . . . . . . . . . . . . . . . . . . . . . . . . . . . . . . . . . . . . . . . . .
Compensated absences . . . . . . . . . . . . . . . . . . . . . . . . . . . . . . . . . . . . . . . . . . . . . . . . . . . . .
Due to New York State and
4. ECMCC Component Unit
Balance Balance Due Within
1/1/10 Additions Reductions 12/31/10 One Year
statement purposes . . . . . . . . . . . . . . . . . . . . . . . . . . . . . . . . . . . . . . . . . . . . . . . . . . . 99,305$ -$ 2,155$ 97,150$ 2,250$
Judgments and claims . . . . . . . . . . . . . . . . . . . . . . . . . . . . . . . . . . . . . . . . . . . . . . . . . . . . . 27,150 24,350 15,500 36,000 -
OPEB liability . . . . . . . . . . . . . . . . . . . . . . . . . . . . . . . . . . . . . . . . . . . . . . . . . . . . . . . . 58,890 21,036 4,947 74,979 -
ECMCC Component Unit Long-term liabilities . . . . . . . . . . . . . . . . . . . . . . . . . . . . . . . . . . . . . . . . . . . . . . . . . . . 185,345$ 45,386$ 22,602$ 208,129$ 2,250$
Bonds payable for financial
Additional judgments and claims liabilities for worker’s compensation and medical malpractice have
been recorded by ECMCC as accrued liabilities in the amounts of $5,500,000 and $1,000,000,
respectively.
_________________________________________________________________________________________________________________________________ COUNTY OF ERIE, NEW YORK • 65
F. Maturity Schedules (dollars in thousands)
1. Remaining Annual Maturities of Long-Term Liabilities (by Debt Type) – Primary
Government
Serial Compensated Judgments
Year Total Bonds Retirement Absences and Claims OPEB
2011 . . . . . . . . . . . . . . . . . . . . . . . . . . . . . . . . . . . . . . . . . . . . . . . . . . . . . . . . . . . . . 77,571$ 51,387$ 2,028$ 13,099$ 11,057$ -$
2012 . . . . . . . . . . . . . . . . . . . . . . . . . . . . . . . . . . . . . . . . . . . . . . . . . . . . . . . . . . . . . 47,394 47,175 219 - - -
2013 . . . . . . . . . . . . . . . . . . . . . . . . . . . . . . . . . . . . . . . . . . . . . . . . . . . . . . . . . . . . . 42,582 42,582 - - - -
2014 . . . . . . . . . . . . . . . . . . . . . . . . . . . . . . . . . . . . . . . . . . . . . . . . . . . . . . . . . . . . . 43,262 43,262 - - - -
2015 . . . . . . . . . . . . . . . . . . . . . . . . . . . . . . . . . . . . . . . . . . . . . . . . . . . . . . . . . . . . . 44,155 44,155 - - - -
2016-2020 . . . . . . . . . . . . . . . . . . . . . . . . . . . . . . . . . . . . . . . . . . . . . . . . . . . . . . . . . . . 192,051 192,051 - - - -
2021-2025 . . . . . . . . . . . . . . . . . . . . . . . . . . . . . . . . . . . . . . . . . . . . . . . . . . . . . . . . . . . 72,593 72,593 - - - -
2026-2030 . . . . . . . . . . . . . . . . . . . . . . . . . . . . . . . . . . . . . . . . . . . . . . . . . . . . . . . . . . . 66,080 66,080 - - - -
2031-2035 . . . . . . . . . . . . . . . . . . . . . . . . . . . . . . . . . . . . . . . . . . . . . . . . . . . . . . . . . . . 39,223 39,223 - - - -
2036-2040 . . . . . . . . . . . . . . . . . . . . . . . . . . . . . . . . . . . . . . . . . . . . . . . . . . . . . . . . . . . 76,300 76,300 - - - -
2041-2045 . . . . . . . . . . . . . . . . . . . . . . . . . . . . . . . . . . . . . . . . . . . . . . . . . . . . . . . . . . . 111,480 111,480 - - - -
2046-2050 . . . . . . . . . . . . . . . . . . . . . . . . . . . . . . . . . . . . . . . . . . . . . . . . . . . . . . . . . . . 21,728 21,728 - - - -
2051-2055 . . . . . . . . . . . . . . . . . . . . . . . . . . . . . . . . . . . . . . . . . . . . . . . . . . . . . . . . . . . 11,142 11,142 - - - -
2056-2060 . . . . . . . . . . . . . . . . . . . . . . . . . . . . . . . . . . . . . . . . . . . . . . . . . . . . . . . . . . . 17,695 17,695 - - - -
Various . . . . . . . . . . . . . . . . . . . . . . . . . . . . . . . . . . . . . . . . . . . . . . . . . . . . . . . . . . . . (1)
285,379 - - 13,638 46,671 225,070
1,148,635 836,853 2,247$ 26,737$ 57,728$ 225,070$
(47) (47)
(11,375) (11,375) Discount on ETASC bonds
9,884 9,884
24,861 24,861
(5,538) (5,538)
(21,852) (21,852) Deferred amount on refunding ETASC
501 (2)
-
1,145,069$ 832,786$
(1) Payment of compensated absences, judgments and claims, and OPEB liability are
dependent upon many factors; therefore, timing of future payments is not readily determinable.
(2) Detail amoritization schedules for the portion of BANs classified as long-term are not readily available.
Long-term liabilities for financial statement purposes
Remaining unamortized discount on zero coupon bonds
Remaining unamortized premium of bond issuance
Remaining unamortized deferred amount on refunding
Remaining unamortized premium of bond issuance - ECFSA
Bond anticipation notes ("BANS")
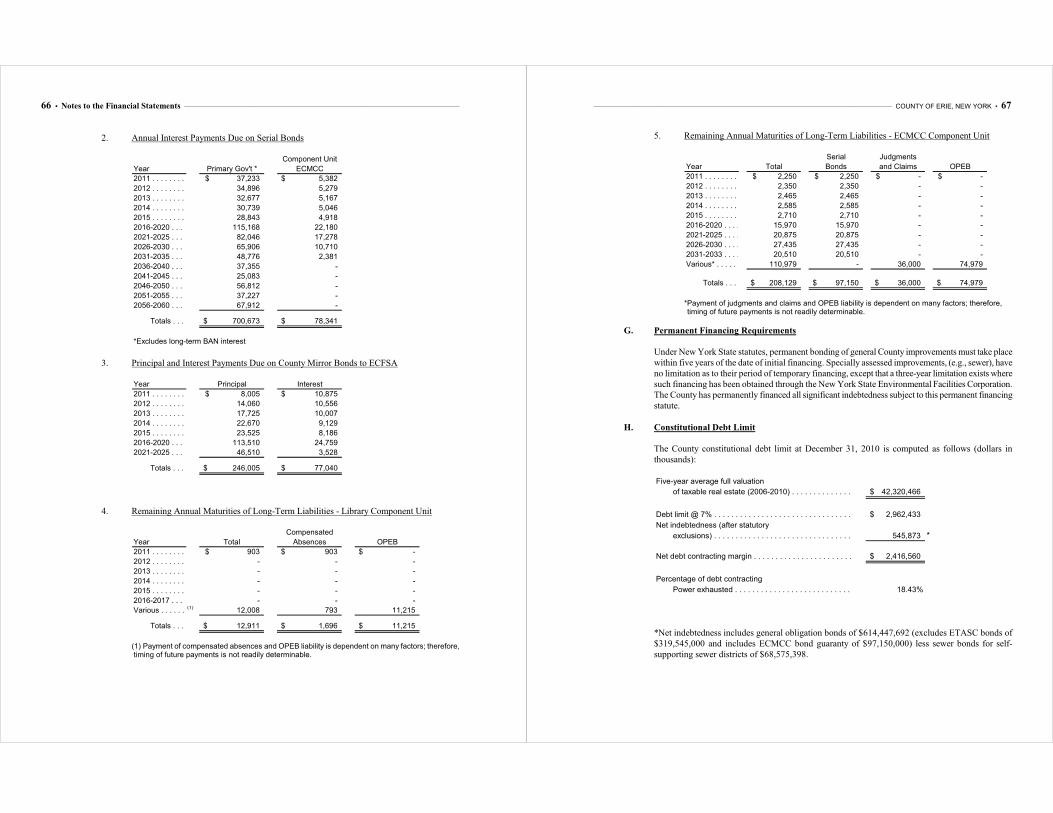
66 • Notes to the Financial Statements _______________________________________________________________________________________________________________________
2. Annual Interest Payments Due on Serial Bonds
Component Unit
Year Primary Gov't * ECMCC
2011 . . . . . . . . . . . . . . . . . . . . . . . . . . . . . . . . . . . . . . . . . . . . . . . . . . . . . . . . . . . . . 37,233$ 5,382$
2012 . . . . . . . . . . . . . . . . . . . . . . . . . . . . . . . . . . . . . . . . . . . . . . . . . . . . . . . . . . . . . 34,896 5,279
2013 . . . . . . . . . . . . . . . . . . . . . . . . . . . . . . . . . . . . . . . . . . . . . . . . . . . . . . . . . . . . . 32,677 5,167
2014 . . . . . . . . . . . . . . . . . . . . . . . . . . . . . . . . . . . . . . . . . . . . . . . . . . . . . . . . . . . . . 30,739 5,046
2015 . . . . . . . . . . . . . . . . . . . . . . . . . . . . . . . . . . . . . . . . . . . . . . . . . . . . . . . . . . . . . 28,843 4,918
2016-2020 . . . . . . . . . . . . . . . . . . . . . . . . . . . . . . . . . . . . . . . . . . . . . . . . . . . . . . . . . . . 115,168 22,180
2021-2025 . . . . . . . . . . . . . . . . . . . . . . . . . . . . . . . . . . . . . . . . . . . . . . . . . . . . . . . . . . . 82,046 17,278
2026-2030 . . . . . . . . . . . . . . . . . . . . . . . . . . . . . . . . . . . . . . . . . . . . . . . . . . . . . . . . . . . 65,906 10,710
2031-2035 . . . . . . . . . . . . . . . . . . . . . . . . . . . . . . . . . . . . . . . . . . . . . . . . . . . . . . . . . . . 48,776 2,381
2036-2040 . . . . . . . . . . . . . . . . . . . . . . . . . . . . . . . . . . . . . . . . . . . . . . . . . . . . . . . . . . . 37,355 -
2041-2045 . . . . . . . . . . . . . . . . . . . . . . . . . . . . . . . . . . . . . . . . . . . . . . . . . . . . . . . . . . . 25,083 -
2046-2050 . . . . . . . . . . . . . . . . . . . . . . . . . . . . . . . . . . . . . . . . . . . . . . . . . . . . . . . . . . . 56,812 -
2051-2055 . . . . . . . . . . . . . . . . . . . . . . . . . . . . . . . . . . . . . . . . . . . . . . . . . . . . . . . . . . . 37,227 -
2056-2060 . . . . . . . . . . . . . . . . . . . . . . . . . . . . . . . . . . . . . . . . . . . . . . . . . . . . . . . . . . . 67,912 -
Totals . . . . . . . . . . . . . . . . . . . . . . . . . . . . . . . . . . . . . . . . . . . . . . . . . . . . . . . . 700,673$ 78,341$
*Excludes long-term BAN interest
3. Principal and Interest Payments Due on County Mirror Bonds to ECFSA
Year Principal Interest
2011 . . . . . . . . . . . . . . . . . . . . . . . . . . . . . . . . . . . . . . . . . . . . . . . . . . . . . . . . . . . . . 8,005$ 10,875$
2012 . . . . . . . . . . . . . . . . . . . . . . . . . . . . . . . . . . . . . . . . . . . . . . . . . . . . . . . . . . . . . 14,060 10,556
2013 . . . . . . . . . . . . . . . . . . . . . . . . . . . . . . . . . . . . . . . . . . . . . . . . . . . . . . . . . . . . . 17,725 10,007
2014 . . . . . . . . . . . . . . . . . . . . . . . . . . . . . . . . . . . . . . . . . . . . . . . . . . . . . . . . . . . . . 22,670 9,129
2015 . . . . . . . . . . . . . . . . . . . . . . . . . . . . . . . . . . . . . . . . . . . . . . . . . . . . . . . . . . . . . 23,525 8,186
2016-2020 . . . . . . . . . . . . . . . . . . . . . . . . . . . . . . . . . . . . . . . . . . . . . . . . . . . . . . . . . . . 113,510 24,759
2021-2025 . . . . . . . . . . . . . . . . . . . . . . . . . . . . . . . . . . . . . . . . . . . . . . . . . . . . . . . . . . . 46,510 3,528
Totals . . . . . . . . . . . . . . . . . . . . . . . . . . . . . . . . . . . . . . . . . . . . . . . . . . . . . . . . 246,005$ 77,040$
4. Remaining Annual Maturities of Long-Term Liabilities - Library Component Unit
Compensated
Year Total Absences OPEB
2011 . . . . . . . . . . . . . . . . . . . . . . . . . . . . . . . . . . . . . . . . . . . . . . . . . . . . . . . . . . . . . 903$ 903$ -$
2012 . . . . . . . . . . . . . . . . . . . . . . . . . . . . . . . . . . . . . . . . . . . . . . . . . . . . . . . . . . . . . - - -
2013 . . . . . . . . . . . . . . . . . . . . . . . . . . . . . . . . . . . . . . . . . . . . . . . . . . . . . . . . . . . . . - - -
2014 . . . . . . . . . . . . . . . . . . . . . . . . . . . . . . . . . . . . . . . . . . . . . . . . . . . . . . . . . . . . . - - -
2015 . . . . . . . . . . . . . . . . . . . . . . . . . . . . . . . . . . . . . . . . . . . . . . . . . . . . . . . . . . . . . - - -
2016-2017 . . . . . . . . . . . . . . . . . . . . . . . . . . . . . . . . . . . . . . . . . . . . . . . . . . . . . . . . . . . - - -
Various . . . . . . . . . . . . . . . . . . . . . . . . . . . . . . . . . . . . . . . . . . . . . . . . . . . . . . . . . . . .(1) 12,008 793 11,215
Totals . . . . . . . . . . . . . . . . . . . . . . . . . . . . . . . . . . . . . . . . . . . . . . . . . . . . . . . . 12,911$ 1,696$ 11,215$
(1) Payment of compensated absences and OPEB liability is dependent on many factors; therefore, timing of future payments is not readily determinable.
_________________________________________________________________________________________________________________________________ COUNTY OF ERIE, NEW YORK • 67
5. Remaining Annual Maturities of Long-Term Liabilities - ECMCC Component Unit
Serial Judgments
Year Total Bonds and Claims OPEB
2011 . . . . . . . . . . . . . . . . . . . . . . . . . . . . . . . . . . . . . . . . . . . . . . . . . . . . . . . . . . . . . 2,250$ 2,250$ -$ -$
2012 . . . . . . . . . . . . . . . . . . . . . . . . . . . . . . . . . . . . . . . . . . . . . . . . . . . . . . . . . . . . . 2,350 2,350 - -
2013 . . . . . . . . . . . . . . . . . . . . . . . . . . . . . . . . . . . . . . . . . . . . . . . . . . . . . . . . . . . . . 2,465 2,465 - -
2014 . . . . . . . . . . . . . . . . . . . . . . . . . . . . . . . . . . . . . . . . . . . . . . . . . . . . . . . . . . . . . 2,585 2,585 - -
2015 . . . . . . . . . . . . . . . . . . . . . . . . . . . . . . . . . . . . . . . . . . . . . . . . . . . . . . . . . . . . . 2,710 2,710 - -
2016-2020 . . . . . . . . . . . . . . . . . . . . . . . . . . . . . . . . . . . . . . . . . . . . . . . . . . . . . . . . . . . 15,970 15,970 - -
2021-2025 . . . . . . . . . . . . . . . . . . . . . . . . . . . . . . . . . . . . . . . . . . . . . . . . . . . . . . . . . . . 20,875 20,875 - -
2026-2030 . . . . . . . . . . . . . . . . . . . . . . . . . . . . . . . . . . . . . . . . . . . . . . . . . . . . . . . . . . . 27,435 27,435 - -
2031-2033 . . . . . . . . . . . . . . . . . . . . . . . . . . . . . . . . . . . . . . . . . . . . . . . . . . . . . . . . . . . 20,510 20,510 - -
Various* . . . . . . . . . . . . . . . . . . . . . . . . . . . . . . . . . . . . . . . . . . . . . . . . . . . . . . . . . . . 110,979 - 36,000 74,979
Totals . . . . . . . . . . . . . . . . . . . . . . . . . . . . . . . . . . . . . . . . . . . . . . . . . . . . . . . . 208,129$ 97,150$ 36,000$ 74,979$
*Payment of judgments and claims and OPEB liability is dependent on many factors; therefore,
timing of future payments is not readily determinable.
G. Permanent Financing Requirements
Under New York State statutes, permanent bonding of general County improvements must take place
within five years of the date of initial financing. Specially assessed improvements, (e.g., sewer), have
no limitation as to their period of temporary financing, except that a three-year limitation exists where
such financing has been obtained through the New York State Environmental Facilities Corporation.
The County has permanently financed all significant indebtedness subject to this permanent financing
statute.
H. Constitutional Debt Limit
The County constitutional debt limit at December 31, 2010 is computed as follows (dollars in
thousands):
Five-year average full valuation
of taxable real estate (2006-2010) . . . . . . . . . . . . . . . . . . . . . . . . . . . . . . . . . . . . . . . . . . . . . . 42,320,466$
Debt limit @ 7% . . . . . . . . . . . . . . . . . . . . . . . . . . . . . . . . . . . . . . . . . . . . . . . . . . . . . . . . 2,962,433$
Net indebtedness (after statutory
exclusions) . . . . . . . . . . . . . . . . . . . . . . . . . . . . . . . . . . . . . . . . . . . . . . . . . . . . . . . . . . 545,873 *
Net debt contracting margin . . . . . . . . . . . . . . . . . . . . . . . . . . . . . . . . . . . . . . . . . . . . . . . . . . 2,416,560$
Percentage of debt contracting
Power exhausted . . . . . . . . . . . . . . . . . . . . . . . . . . . . . . . . . . . . . . . . . . . . . . . . . . . . . . . . 18.43%
*Net indebtedness includes general obligation bonds of $614,447,692 (excludes ETASC bonds of
$319,545,000 and includes ECMCC bond guaranty of $97,150,000) less sewer bonds for self-
supporting sewer districts of $68,575,398.
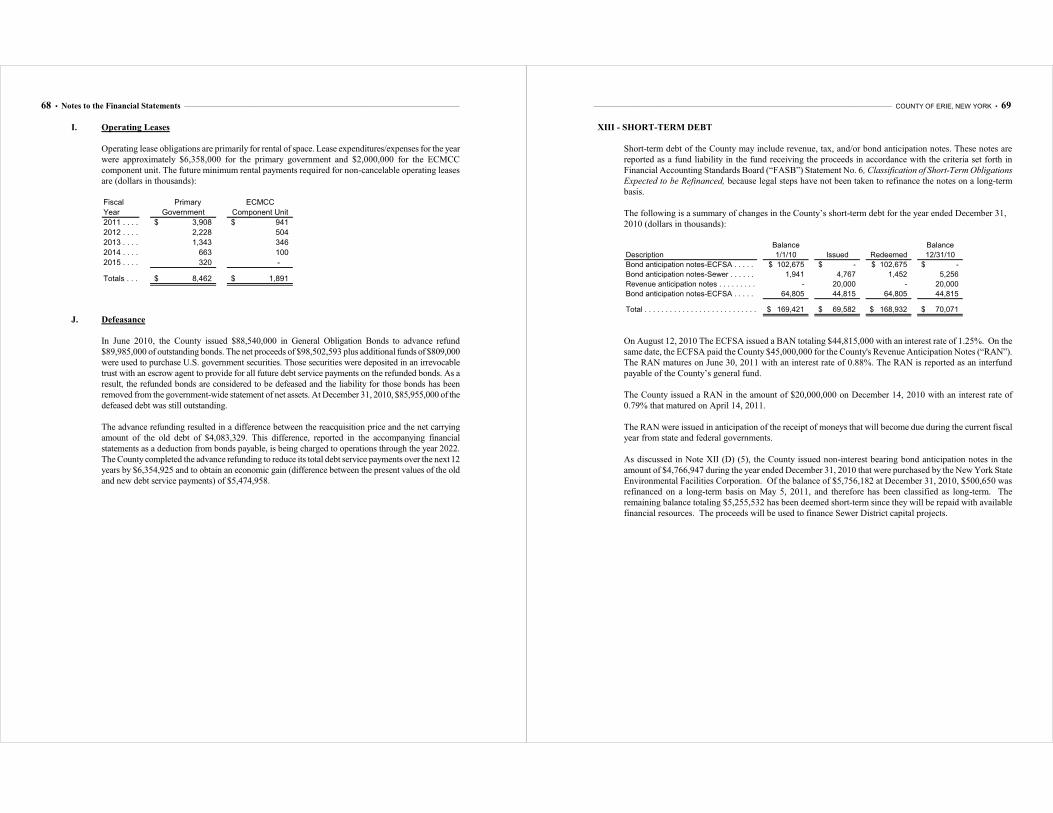
68 • Notes to the Financial Statements _______________________________________________________________________________________________________________________
I. Operating Leases
Operating lease obligations are primarily for rental of space. Lease expenditures/expenses for the year
were approximately $6,358,000 for the primary government and $2,000,000 for the ECMCC
component unit. The future minimum rental payments required for non-cancelable operating leases
are (dollars in thousands):
Fiscal Primary ECMCC
Year Government Component Unit
2011 . . . . . . . . . . . . . . . . . . . . . . . . . . . . . . . . . . . . . . . . . . . . . . . . . . . . . . . . . . . . . 3,908$ 941$
2012 . . . . . . . . . . . . . . . . . . . . . . . . . . . . . . . . . . . . . . . . . . . . . . . . . . . . . . . . . . . . . 2,228 504
2013 . . . . . . . . . . . . . . . . . . . . . . . . . . . . . . . . . . . . . . . . . . . . . . . . . . . . . . . . . . . . . 1,343 346
2014 . . . . . . . . . . . . . . . . . . . . . . . . . . . . . . . . . . . . . . . . . . . . . . . . . . . . . . . . . . . . . 663 100
2015 . . . . . . . . . . . . . . . . . . . . . . . . . . . . . . . . . . . . . . . . . . . . . . . . . . . . . . . . . . . . . 320 -
Totals . . . . . . . . . . . . . . . . . . . . . . . . . . . . . . . . . . . . . . . . . . . . . . . . . . . . . . . . . . . . 8,462$ 1,891$
J. Defeasance
In June 2010, the County issued $88,540,000 in General Obligation Bonds to advance refund
$89,985,000 of outstanding bonds. The net proceeds of $98,502,593 plus additional funds of $809,000
were used to purchase U.S. government securities. Those securities were deposited in an irrevocable
trust with an escrow agent to provide for all future debt service payments on the refunded bonds. As a
result, the refunded bonds are considered to be defeased and the liability for those bonds has been
removed from the government-wide statement of net assets. At December 31, 2010, $85,955,000 of the
defeased debt was still outstanding.
The advance refunding resulted in a difference between the reacquisition price and the net carrying
amount of the old debt of $4,083,329. This difference, reported in the accompanying financial
statements as a deduction from bonds payable, is being charged to operations through the year 2022.
The County completed the advance refunding to reduce its total debt service payments over the next 12
years by $6,354,925 and to obtain an economic gain (difference between the present values of the old
and new debt service payments) of $5,474,958.
_________________________________________________________________________________________________________________________________ COUNTY OF ERIE, NEW YORK • 69
XIII - SHORT-TERM DEBT
Short-term debt of the County may include revenue, tax, and/or bond anticipation notes. These notes are
reported as a fund liability in the fund receiving the proceeds in accordance with the criteria set forth in
Financial Accounting Standards Board (“FASB”) Statement No. 6, Classification of Short-Term Obligations
Expected to be Refinanced, because legal steps have not been taken to refinance the notes on a long-term
basis.
The following is a summary of changes in the County’s short-term debt for the year ended December 31,
2010 (dollars in thousands):
Balance Balance
Description 1/1/10 Issued Redeemed 12/31/10
Bond anticipation notes-ECFSA . . . . . . . . . . . . . . . . . . . . . . . . . . . . . . . . . . . . . . . . . . . . . . . . . 102,675$ -$ 102,675$ -$
Bond anticipation notes-Sewer . . . . . . . . . . . . . . . . . . . . . . . . . . . . . . . . . . . . . . . . . . . . . . . . . 1,941 4,767 1,452 5,256
Revenue anticipation notes . . . . . . . . . . . . . . . . . . . . . . . . . . . . . . . . . . . . . . . . . . . . . . . . . . - 20,000 - 20,000
Bond anticipation notes-ECFSA . . . . . . . . . . . . . . . . . . . . . . . . . . . . . . . . . . . . . . . . . . . . . . . . . 64,805 44,815 64,805 44,815
Total . . . . . . . . . . . . . . . . . . . . . . . . . . . . . . . . . . . . . . . . . . . . . . . . . . . . . . . . . . . . . 169,421$ 69,582$ 168,932$ 70,071$
On August 12, 2010 The ECFSA issued a BAN totaling $44,815,000 with an interest rate of 1.25%. On the
same date, the ECFSA paid the County $45,000,000 for the County's Revenue Anticipation Notes (“RAN”).
The RAN matures on June 30, 2011 with an interest rate of 0.88%. The RAN is reported as an interfund
payable of the County’s general fund.
The County issued a RAN in the amount of $20,000,000 on December 14, 2010 with an interest rate of
0.79% that matured on April 14, 2011.
The RAN were issued in anticipation of the receipt of moneys that will become due during the current fiscal
year from state and federal governments.
As discussed in Note XII (D) (5), the County issued non-interest bearing bond anticipation notes in the
amount of $4,766,947 during the year ended December 31, 2010 that were purchased by the New York State
Environmental Facilities Corporation. Of the balance of $5,756,182 at December 31, 2010, $500,650 was
refinanced on a long-term basis on May 5, 2011, and therefore has been classified as long-term. The
remaining balance totaling $5,255,532 has been deemed short-term since they will be repaid with available
financial resources. The proceeds will be used to finance Sewer District capital projects.
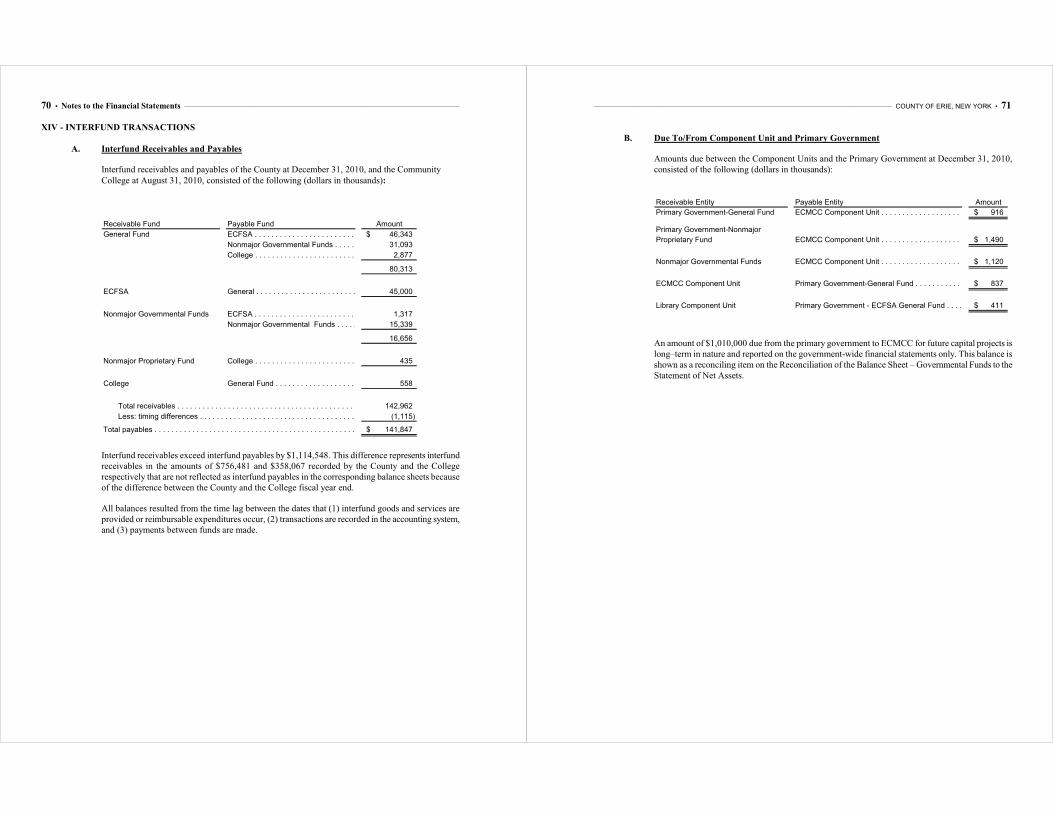
70 • Notes to the Financial Statements _______________________________________________________________________________________________________________________
XIV - INTERFUND TRANSACTIONS
A. Interfund Receivables and Payables
Interfund receivables and payables of the County at December 31, 2010, and the Community
College at August 31, 2010, consisted of the following (dollars in thousands):
Receivable Fund Payable Fund Amount
General Fund ECFSA . . . . . . . . . . . . . . . . . . . . . . . . . . . . . . . . . . . . . . . . . . . . . . . . . . . . . . . . . . . . . 46,343$
Nonmajor Governmental Funds . . . . . . . . . . . . . . . . . . . . . . . . . . . . . . . . . . . . . . . . . . . . . . . . . . 31,093
College . . . . . . . . . . . . . . . . . . . . . . . . . . . . . . . . . . . . . . . . . . . . . . . . . . . . . . . . . . . . 2,877
80,313
ECFSA General . . . . . . . . . . . . . . . . . . . . . . . . . . . . . . . . . . . . . . . . . . . . . . . . . . . . . . . . . . . . 45,000
Nonmajor Governmental Funds ECFSA . . . . . . . . . . . . . . . . . . . . . . . . . . . . . . . . . . . . . . . . . . . . . . . . . . . . . . . . . . . . . 1,317
Nonmajor Governmental Funds . . . . . . . . . . . . . . . . . . . . . . . . . . . . . . . . . . . . . . . . . . . . . . . . . 15,339
16,656
Nonmajor Proprietary Fund College . . . . . . . . . . . . . . . . . . . . . . . . . . . . . . . . . . . . . . . . . . . . . . . . . . . . . . . . . . . . 435
College General Fund . . . . . . . . . . . . . . . . . . . . . . . . . . . . . . . . . . . . . . . . . . . . . . . . . . . . . . . . . 558
Total receivables . . . . . . . . . . . . . . . . . . . . . . . . . . . . . . . . . . . . . . . . . . . . . . . . . . . 142,962
Less: timing differences . . . . . . . . . . . . . . . . . . . . . . . . . . . . . . . . . . . . . . . . . . . . . . . . (1,115)
Total payables . . . . . . . . . . . . . . . . . . . . . . . . . . . . . . . . . . . . . . . . . . . . . . . . . . . . . . . . 141,847$
Interfund receivables exceed interfund payables by $1,114,548. This difference represents interfund
receivables in the amounts of $756,481 and $358,067 recorded by the County and the College
respectively that are not reflected as interfund payables in the corresponding balance sheets because
of the difference between the County and the College fiscal year end.
All balances resulted from the time lag between the dates that (1) interfund goods and services are
provided or reimbursable expenditures occur, (2) transactions are recorded in the accounting system,
and (3) payments between funds are made.
_________________________________________________________________________________________________________________________________ COUNTY OF ERIE, NEW YORK • 71
B. Due To/From Component Unit and Primary Government
Amounts due between the Component Units and the Primary Government at December 31, 2010,
consisted of the following (dollars in thousands):
Receivable Entity Payable Entity Amount
Primary Government-General Fund ECMCC Component Unit . . . . . . . . . . . . . . . . . . . . . . . . . . . . . . . . . . . . . . . . . . . . . . . . . . . . . 916$
Primary Government-Nonmajor
Proprietary Fund ECMCC Component Unit . . . . . . . . . . . . . . . . . . . . . . . . . . . . . . . . . . . . . . . . . . . . . . . . . . . . . 1,490$
Nonmajor Governmental Funds ECMCC Component Unit . . . . . . . . . . . . . . . . . . . . . . . . . . . . . . . . . . . . . . . . . . . . . . . . . . . . . 1,120$
ECMCC Component Unit Primary Government-General Fund . . . . . . . . . . . . . . . . . . . . . . . . . . . . . . . . . . . . . . . . . . . . . . . . 837$
Library Component Unit Primary Government - ECFSA General Fund . . . . . . . . . . . . . . . . . . . . . . . . . . . . . . . . . . . . . . . . . . . . 411$
An amount of $1,010,000 due from the primary government to ECMCC for future capital projects is
long–term in nature and reported on the government-wide financial statements only. This balance is
shown as a reconciling item on the Reconciliation of the Balance Sheet – Governmental Funds to the
Statement of Net Assets.
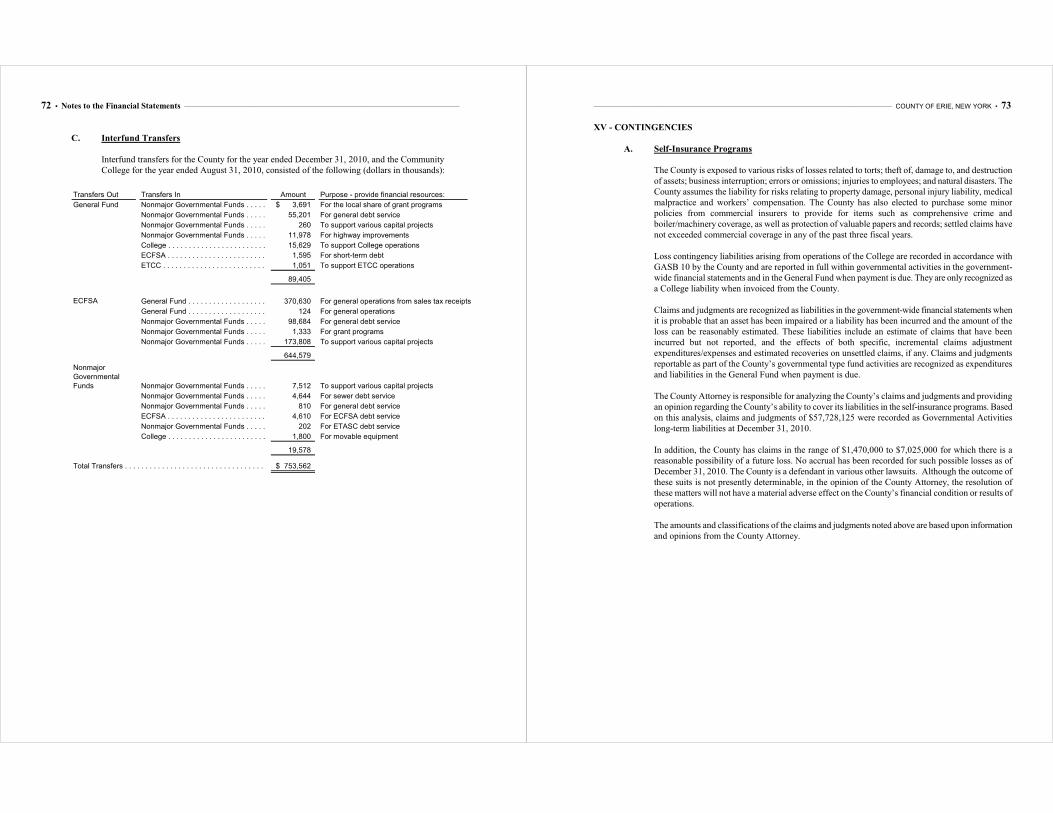
72 • Notes to the Financial Statements _______________________________________________________________________________________________________________________
C. Interfund Transfers
Interfund transfers for the County for the year ended December 31, 2010, and the Community
College for the year ended August 31, 2010, consisted of the following (dollars in thousands):
Transfers Out Transfers In Amount Purpose - provide financial resources:
General Fund Nonmajor Governmental Funds . . . . . . . . . . . . . . . . . . . . . . . . . . . . . . . . . . . . . . . . . . . . . . . . . . 3,691$ For the local share of grant programs
Nonmajor Governmental Funds . . . . . . . . . . . . . . . . . . . . . . . . . . . . . . . . . . . . . . . . . . . . . . . . . . 55,201 For general debt service
Nonmajor Governmental Funds . . . . . . . . . . . . . . . . . . . . . . . . . . . . . . . . . . . . . . . . . . . . . . . . . . 260 To support various capital projects
Nonmajor Governmental Funds . . . . . . . . . . . . . . . . . . . . . . . . . . . . . . . . . . . . . . . . . . . . . . . . . . 11,978 For highway improvements
College . . . . . . . . . . . . . . . . . . . . . . . . . . . . . . . . . . . . . . . . . . . . . . . . . . . . . . . . . . . . 15,629 To support College operations
ECFSA . . . . . . . . . . . . . . . . . . . . . . . . . . . . . . . . . . . . . . . . . . . . . . . . . . . . . . . . . . . . . 1,595 For short-term debt
ETCC . . . . . . . . . . . . . . . . . . . . . . . . . . . . . . . . . . . . . . . . . . . . . . . . . . . . . . . . . . . . . 1,051 To support ETCC operations
89,405
ECFSA General Fund . . . . . . . . . . . . . . . . . . . . . . . . . . . . . . . . . . . . . . . . . . . . . . . . . . . . . . . . . 370,630 For general operations from sales tax receipts
General Fund . . . . . . . . . . . . . . . . . . . . . . . . . . . . . . . . . . . . . . . . . . . . . . . . . . . . . . . . . 124 For general operations
Nonmajor Governmental Funds . . . . . . . . . . . . . . . . . . . . . . . . . . . . . . . . . . . . . . . . . . . . . . . . . . 98,684 For general debt service
Nonmajor Governmental Funds . . . . . . . . . . . . . . . . . . . . . . . . . . . . . . . . . . . . . . . . . . . . . . . . . . 1,333 For grant programs
Nonmajor Governmental Funds . . . . . . . . . . . . . . . . . . . . . . . . . . . . . . . . . . . . . . . . . . . . . . . . . . 173,808 To support various capital projects
644,579
Nonmajor Governmental Funds . . . . . . . . . . . . . . . . . . . . . . . . . . . . . . . . . . . . . . . . . . . . . . . . . . 7,512 To support various capital projects
Nonmajor Governmental Funds . . . . . . . . . . . . . . . . . . . . . . . . . . . . . . . . . . . . . . . . . . . . . . . . . . 4,644 For sewer debt service
Nonmajor Governmental Funds . . . . . . . . . . . . . . . . . . . . . . . . . . . . . . . . . . . . . . . . . . . . . . . . . . 810 For general debt service
ECFSA . . . . . . . . . . . . . . . . . . . . . . . . . . . . . . . . . . . . . . . . . . . . . . . . . . . . . . . . . . . . . 4,610 For ECFSA debt service
Nonmajor Governmental Funds . . . . . . . . . . . . . . . . . . . . . . . . . . . . . . . . . . . . . . . . . . . . . . . . . . 202 For ETASC debt service
College . . . . . . . . . . . . . . . . . . . . . . . . . . . . . . . . . . . . . . . . . . . . . . . . . . . . . . . . . . . . 1,800 For movable equipment
19,578
Total Transfers . . . . . . . . . . . . . . . . . . . . . . . . . . . . . . . . . . . . . . . . . . . . . . . . . . . . . . . . 753,562$
Nonmajor
Governmental
Funds
_________________________________________________________________________________________________________________________________ COUNTY OF ERIE, NEW YORK • 73
XV - CONTINGENCIES
A. Self-Insurance Programs
The County is exposed to various risks of losses related to torts; theft of, damage to, and destruction
of assets; business interruption; errors or omissions; injuries to employees; and natural disasters. The
County assumes the liability for risks relating to property damage, personal injury liability, medical
malpractice and workers’ compensation. The County has also elected to purchase some minor
policies from commercial insurers to provide for items such as comprehensive crime and
boiler/machinery coverage, as well as protection of valuable papers and records; settled claims have
not exceeded commercial coverage in any of the past three fiscal years.
Loss contingency liabilities arising from operations of the College are recorded in accordance with
GASB 10 by the County and are reported in full within governmental activities in the government-
wide financial statements and in the General Fund when payment is due. They are only recognized as
a College liability when invoiced from the County.
Claims and judgments are recognized as liabilities in the government-wide financial statements when
it is probable that an asset has been impaired or a liability has been incurred and the amount of the
loss can be reasonably estimated. These liabilities include an estimate of claims that have been
incurred but not reported, and the effects of both specific, incremental claims adjustment
expenditures/expenses and estimated recoveries on unsettled claims, if any. Claims and judgments
reportable as part of the County’s governmental type fund activities are recognized as expenditures
and liabilities in the General Fund when payment is due.
The County Attorney is responsible for analyzing the County’s claims and judgments and providing
an opinion regarding the County’s ability to cover its liabilities in the self-insurance programs. Based
on this analysis, claims and judgments of $57,728,125 were recorded as Governmental Activities
long-term liabilities at December 31, 2010.
In addition, the County has claims in the range of $1,470,000 to $7,025,000 for which there is a
reasonable possibility of a future loss. No accrual has been recorded for such possible losses as of
December 31, 2010. The County is a defendant in various other lawsuits. Although the outcome of
these suits is not presently determinable, in the opinion of the County Attorney, the resolution of
these matters will not have a material adverse effect on the County’s financial condition or results of
operations.
The amounts and classifications of the claims and judgments noted above are based upon information
and opinions from the County Attorney.
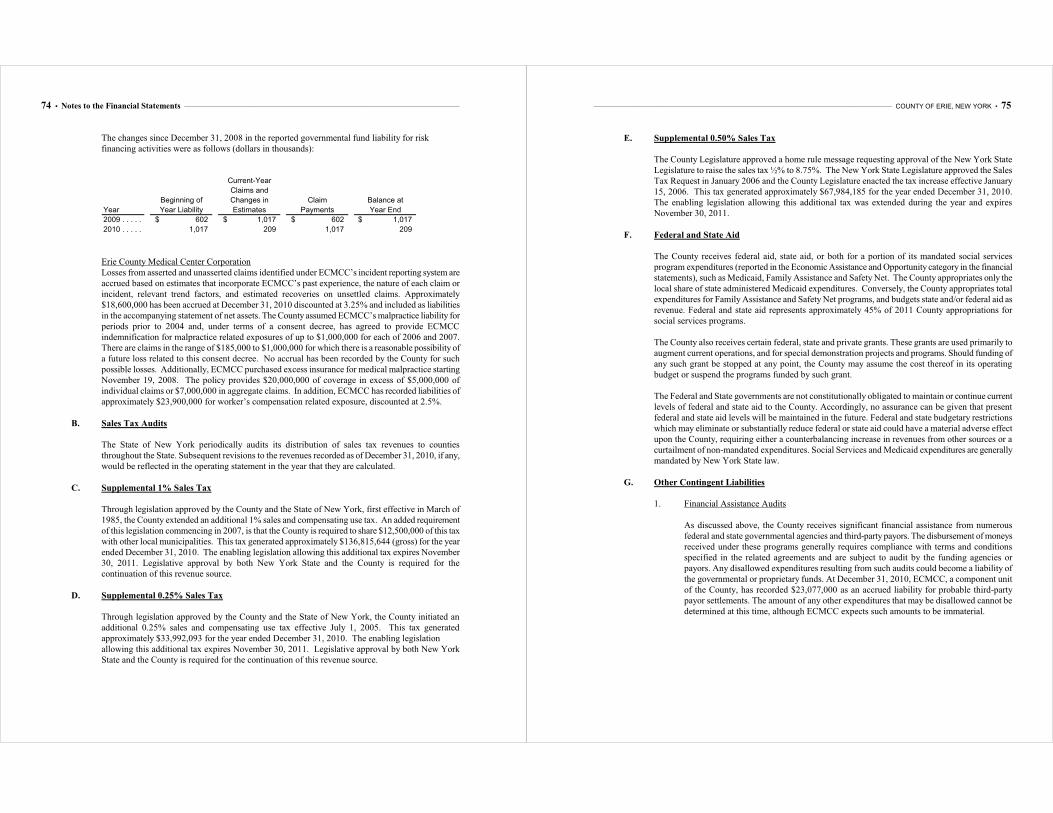
74 • Notes to the Financial Statements _______________________________________________________________________________________________________________________
The changes since December 31, 2008 in the reported governmental fund liability for risk
financing activities were as follows (dollars in thousands):
Current-Year
Claims and
Beginning of Changes in Claim Balance at
Year Year Liability Estimates Payments Year End
2009 . . . . . . . . . . . . . . . . . . . . . . . . . . . . . . . . . . . . . . . . . . . . . . . . . . . . . . . . . . . . . 602$ 1,017$ 602$ 1,017$
2010 . . . . . . . . . . . . . . . . . . . . . . . . . . . . . . . . . . . . . . . . . . . . . . . . . . . . . . . . . . . . . 1,017 209 1,017 209
Erie County Medical Center Corporation
Losses from asserted and unasserted claims identified under ECMCC’s incident reporting system are
accrued based on estimates that incorporate ECMCC’s past experience, the nature of each claim or
incident, relevant trend factors, and estimated recoveries on unsettled claims. Approximately
$18,600,000 has been accrued at December 31, 2010 discounted at 3.25% and included as liabilities
in the accompanying statement of net assets. The County assumed ECMCC’s malpractice liability for
periods prior to 2004 and, under terms of a consent decree, has agreed to provide ECMCC
indemnification for malpractice related exposures of up to $1,000,000 for each of 2006 and 2007.
There are claims in the range of $185,000 to $1,000,000 for which there is a reasonable possibility of
a future loss related to this consent decree. No accrual has been recorded by the County for such
possible losses. Additionally, ECMCC purchased excess insurance for medical malpractice starting
November 19, 2008. The policy provides $20,000,000 of coverage in excess of $5,000,000 of
individual claims or $7,000,000 in aggregate claims. In addition, ECMCC has recorded liabilities of
approximately $23,900,000 for worker’s compensation related exposure, discounted at 2.5%.
B. Sales Tax Audits
The State of New York periodically audits its distribution of sales tax revenues to counties
throughout the State. Subsequent revisions to the revenues recorded as of December 31, 2010, if any,
would be reflected in the operating statement in the year that they are calculated.
C. Supplemental 1% Sales Tax
Through legislation approved by the County and the State of New York, first effective in March of
1985, the County extended an additional 1% sales and compensating use tax. An added requirement
of this legislation commencing in 2007, is that the County is required to share $12,500,000 of this tax
with other local municipalities. This tax generated approximately $136,815,644 (gross) for the year
ended December 31, 2010. The enabling legislation allowing this additional tax expires November
30, 2011. Legislative approval by both New York State and the County is required for the
continuation of this revenue source.
D. Supplemental 0.25% Sales Tax
Through legislation approved by the County and the State of New York, the County initiated an
additional 0.25% sales and compensating use tax effective July 1, 2005. This tax generated
approximately $33,992,093 for the year ended December 31, 2010. The enabling legislation
allowing this additional tax expires November 30, 2011. Legislative approval by both New York
State and the County is required for the continuation of this revenue source.
_________________________________________________________________________________________________________________________________ COUNTY OF ERIE, NEW YORK • 75
E. Supplemental 0.50% Sales Tax
The County Legislature approved a home rule message requesting approval of the New York State
Legislature to raise the sales tax ½% to 8.75%. The New York State Legislature approved the Sales
Tax Request in January 2006 and the County Legislature enacted the tax increase effective January
15, 2006. This tax generated approximately $67,984,185 for the year ended December 31, 2010.
The enabling legislation allowing this additional tax was extended during the year and expires
November 30, 2011.
F. Federal and State Aid
The County receives federal aid, state aid, or both for a portion of its mandated social services
program expenditures (reported in the Economic Assistance and Opportunity category in the financial
statements), such as Medicaid, Family Assistance and Safety Net. The County appropriates only the
local share of state administered Medicaid expenditures. Conversely, the County appropriates total
expenditures for Family Assistance and Safety Net programs, and budgets state and/or federal aid as
revenue. Federal and state aid represents approximately 45% of 2011 County appropriations for
social services programs.
The County also receives certain federal, state and private grants. These grants are used primarily to
augment current operations, and for special demonstration projects and programs. Should funding of
any such grant be stopped at any point, the County may assume the cost thereof in its operating
budget or suspend the programs funded by such grant.
The Federal and State governments are not constitutionally obligated to maintain or continue current
levels of federal and state aid to the County. Accordingly, no assurance can be given that present
federal and state aid levels will be maintained in the future. Federal and state budgetary restrictions
which may eliminate or substantially reduce federal or state aid could have a material adverse effect
upon the County, requiring either a counterbalancing increase in revenues from other sources or a
curtailment of non-mandated expenditures. Social Services and Medicaid expenditures are generally
mandated by New York State law.
G. Other Contingent Liabilities
1. Financial Assistance Audits
As discussed above, the County receives significant financial assistance from numerous
federal and state governmental agencies and third-party payors. The disbursement of moneys
received under these programs generally requires compliance with terms and conditions
specified in the related agreements and are subject to audit by the funding agencies or
payors. Any disallowed expenditures resulting from such audits could become a liability of
the governmental or proprietary funds. At December 31, 2010, ECMCC, a component unit
of the County, has recorded $23,077,000 as an accrued liability for probable third-party
payor settlements. The amount of any other expenditures that may be disallowed cannot be
determined at this time, although ECMCC expects such amounts to be immaterial.
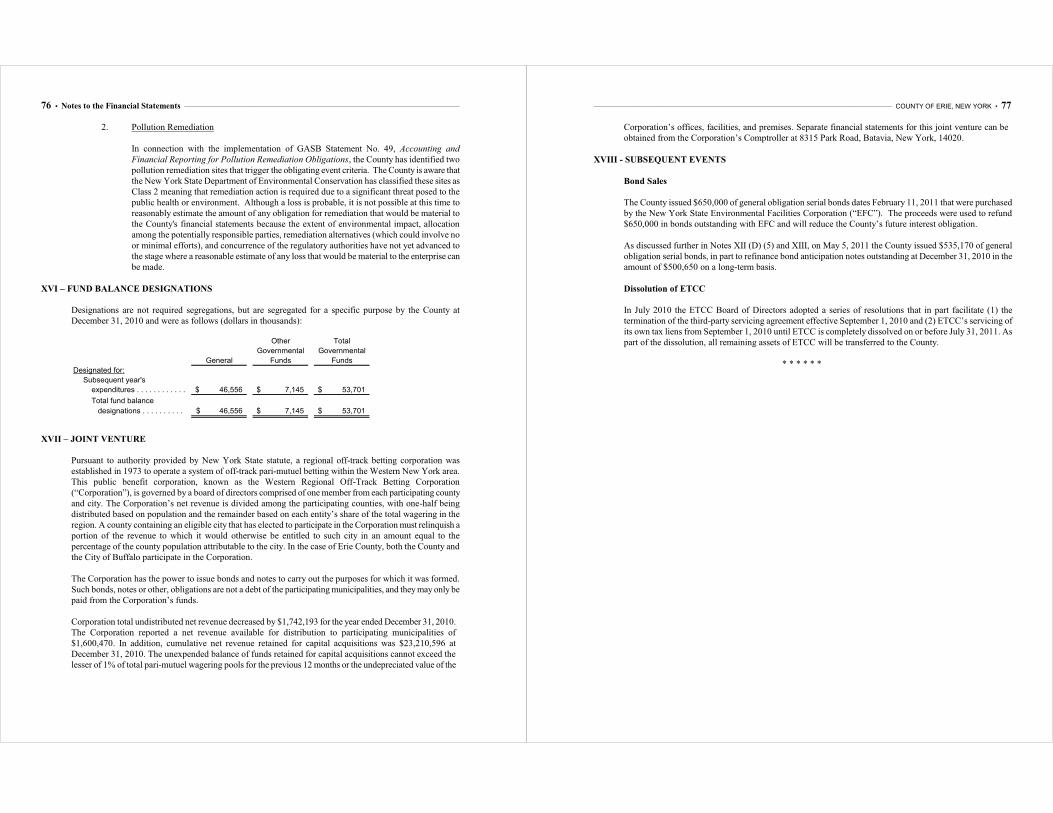
76 • Notes to the Financial Statements _______________________________________________________________________________________________________________________
2. Pollution Remediation
In connection with the implementation of GASB Statement No. 49, Accounting and
Financial Reporting for Pollution Remediation Obligations, the County has identified two
pollution remediation sites that trigger the obligating event criteria. The County is aware that
the New York State Department of Environmental Conservation has classified these sites as
Class 2 meaning that remediation action is required due to a significant threat posed to the
public health or environment. Although a loss is probable, it is not possible at this time to
reasonably estimate the amount of any obligation for remediation that would be material to
the County's financial statements because the extent of environmental impact, allocation
among the potentially responsible parties, remediation alternatives (which could involve no
or minimal efforts), and concurrence of the regulatory authorities have not yet advanced to
the stage where a reasonable estimate of any loss that would be material to the enterprise can
be made.
XVI – FUND BALANCE DESIGNATIONS
Designations are not required segregations, but are segregated for a specific purpose by the County at
December 31, 2010 and were as follows (dollars in thousands):
Other Total
Governmental Governmental
General Funds Funds
Designated for:
Subsequent year's
expenditures . . . . . . . . . . . . . . . . . . . . . . . . . . . . . . . . . . . . . . . . . . . . . . . . . . . . . . . 46,556$ 7,145$ 53,701$
Total fund balance
designations . . . . . . . . . . . . . . . . . . . . . . . . . . . . . . . . . . . . . . . . . . . . . . . . . . . . . . 46,556$ 7,145$ 53,701$
XVII – JOINT VENTURE
Pursuant to authority provided by New York State statute, a regional off-track betting corporation was
established in 1973 to operate a system of off-track pari-mutuel betting within the Western New York area.
This public benefit corporation, known as the Western Regional Off-Track Betting Corporation
(“Corporation”), is governed by a board of directors comprised of one member from each participating county
and city. The Corporation’s net revenue is divided among the participating counties, with one-half being
distributed based on population and the remainder based on each entity’s share of the total wagering in the
region. A county containing an eligible city that has elected to participate in the Corporation must relinquish a
portion of the revenue to which it would otherwise be entitled to such city in an amount equal to the
percentage of the county population attributable to the city. In the case of Erie County, both the County and
the City of Buffalo participate in the Corporation.
The Corporation has the power to issue bonds and notes to carry out the purposes for which it was formed.
Such bonds, notes or other, obligations are not a debt of the participating municipalities, and they may only be
paid from the Corporation’s funds.
Corporation total undistributed net revenue decreased by $1,742,193 for the year ended December 31, 2010.
The Corporation reported a net revenue available for distribution to participating municipalities of
$1,600,470. In addition, cumulative net revenue retained for capital acquisitions was $23,210,596 at
December 31, 2010. The unexpended balance of funds retained for capital acquisitions cannot exceed the
lesser of 1% of total pari-mutuel wagering pools for the previous 12 months or the undepreciated value of the
_________________________________________________________________________________________________________________________________ COUNTY OF ERIE, NEW YORK • 77
Corporation’s offices, facilities, and premises. Separate financial statements for this joint venture can be
obtained from the Corporation’s Comptroller at 8315 Park Road, Batavia, New York, 14020.
XVIII - SUBSEQUENT EVENTS
Bond Sales
The County issued $650,000 of general obligation serial bonds dates February 11, 2011 that were purchased
by the New York State Environmental Facilities Corporation (“EFC”). The proceeds were used to refund
$650,000 in bonds outstanding with EFC and will reduce the County’s future interest obligation.
As discussed further in Notes XII (D) (5) and XIII, on May 5, 2011 the County issued $535,170 of general
obligation serial bonds, in part to refinance bond anticipation notes outstanding at December 31, 2010 in the
amount of $500,650 on a long-term basis.
Dissolution of ETCC
In July 2010 the ETCC Board of Directors adopted a series of resolutions that in part facilitate (1) the
termination of the third-party servicing agreement effective September 1, 2010 and (2) ETCC’s servicing of
its own tax liens from September 1, 2010 until ETCC is completely dissolved on or before July 31, 2011. As
part of the dissolution, all remaining assets of ETCC will be transferred to the County.
* * * * * *

78 • Notes to the Financial Statements _______________________________________________________________________________________________________________________
______________________________________________________________________________________________________ COUNTY OF ERIE, NEW YORK • 79
REQUIRED SUPPLEMENTARY INFORMATION
The schedule of funding progress presents the results of OPEB valuations as of January 1,
2010, 2008, and 2006 and provides trend information about whether the actuarial values of
the plan assets are increasing or decreasing over time relative to the actuarial accrued
liabilities for benefits.
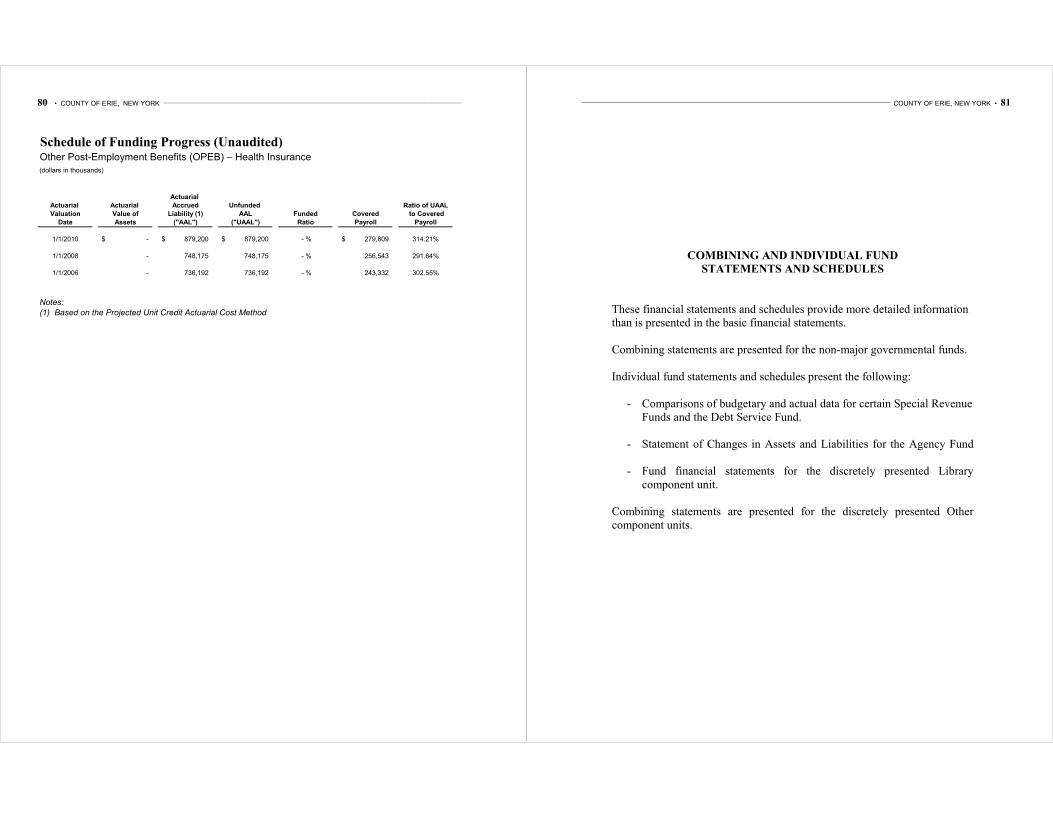
80 • COUNTY OF ERIE, NEW YORK ________________________________________________________________________________________________________________________________
Schedule of Funding Progress (Unaudited)Other Post-Employment Benefits (OPEB) – Health Insurance
(dollars in thousands)
Actuarial
Actuarial Actuarial Accrued Unfunded Ratio of UAAL
Valuation Value of Liability (1) AAL Funded Covered to Covered
Date Assets ("AAL") ("UAAL") Ratio Payroll Payroll
1/1/2010 -$ 879,200$ 879,200$ - % 279,809$ 314.21%
1/1/2008 - 748,175 748,175 - % 256,543 291.64%
1/1/2006 - 736,192 736,192 - % 243,332 302.55%
Notes:
(1) Based on the Projected Unit Credit Actuarial Cost Method
______________________________________________________________________________________________________ COUNTY OF ERIE, NEW YORK • 81
COMBINING AND INDIVIDUAL FUND
STATEMENTS AND SCHEDULES
These financial statements and schedules provide more detailed information
than is presented in the basic financial statements.
Combining statements are presented for the non-major governmental funds.
Individual fund statements and schedules present the following:
- Comparisons of budgetary and actual data for certain Special Revenue
Funds and the Debt Service Fund.
- Statement of Changes in Assets and Liabilities for the Agency Fund
- Fund financial statements for the discretely presented Library
component unit.
Combining statements are presented for the discretely presented Other
component units.
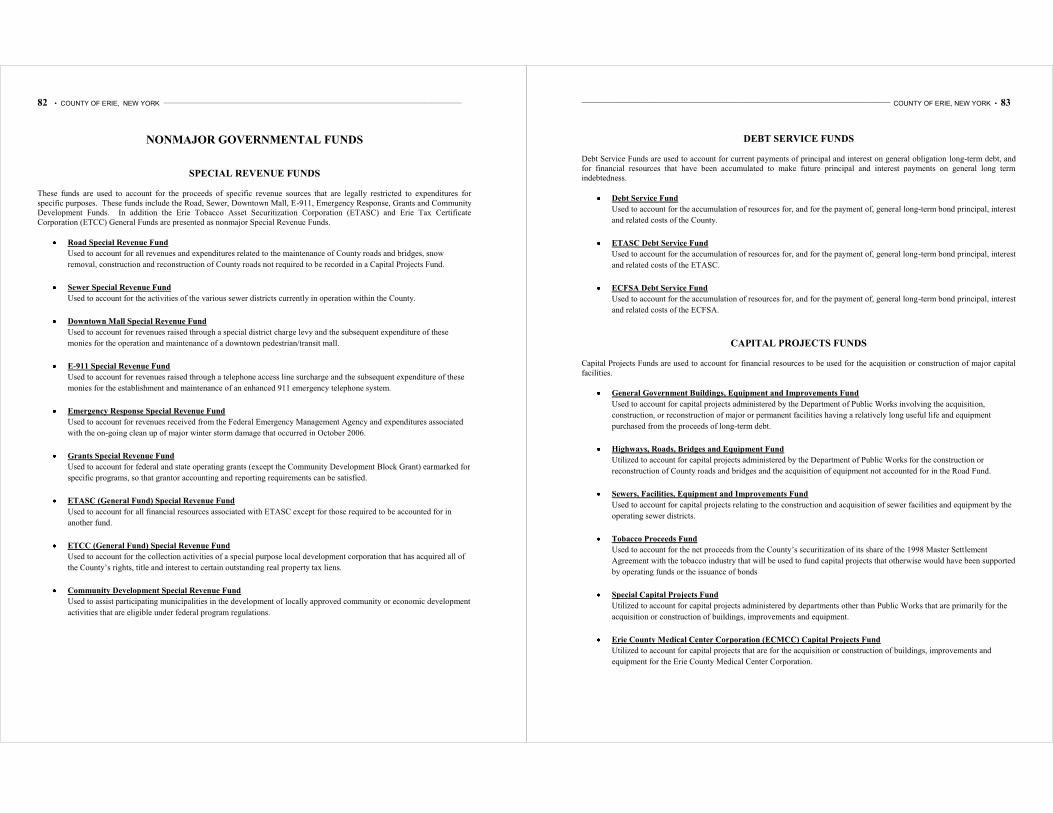
82 • COUNTY OF ERIE, NEW YORK ________________________________________________________________________________________________________________________________
NONMAJOR GOVERNMENTAL FUNDS
SPECIAL REVENUE FUNDS
These funds are used to account for the proceeds of specific revenue sources that are legally restricted to expenditures for
specific purposes. These funds include the Road, Sewer, Downtown Mall, E-911, Emergency Response, Grants and Community
Development Funds. In addition the Erie Tobacco Asset Securitization Corporation (ETASC) and Erie Tax Certificate
Corporation (ETCC) General Funds are presented as nonmajor Special Revenue Funds.
Road Special Revenue Fund
Used to account for all revenues and expenditures related to the maintenance of County roads and bridges, snow
removal, construction and reconstruction of County roads not required to be recorded in a Capital Projects Fund.
Sewer Special Revenue Fund
Used to account for the activities of the various sewer districts currently in operation within the County.
Downtown Mall Special Revenue Fund
Used to account for revenues raised through a special district charge levy and the subsequent expenditure of these
monies for the operation and maintenance of a downtown pedestrian/transit mall.
E-911 Special Revenue Fund
Used to account for revenues raised through a telephone access line surcharge and the subsequent expenditure of these
monies for the establishment and maintenance of an enhanced 911 emergency telephone system.
Emergency Response Special Revenue Fund
Used to account for revenues received from the Federal Emergency Management Agency and expenditures associated
with the on-going clean up of major winter storm damage that occurred in October 2006.
Grants Special Revenue Fund
Used to account for federal and state operating grants (except the Community Development Block Grant) earmarked for
specific programs, so that grantor accounting and reporting requirements can be satisfied.
ETASC (General Fund) Special Revenue Fund
Used to account for all financial resources associated with ETASC except for those required to be accounted for in
another fund.
ETCC (General Fund) Special Revenue Fund
Used to account for the collection activities of a special purpose local development corporation that has acquired all of
the County’s rights, title and interest to certain outstanding real property tax liens.
Community Development Special Revenue Fund
Used to assist participating municipalities in the development of locally approved community or economic development
activities that are eligible under federal program regulations.
______________________________________________________________________________________________________ COUNTY OF ERIE, NEW YORK • 83
DEBT SERVICE FUNDS
Debt Service Funds are used to account for current payments of principal and interest on general obligation long-term debt, and
for financial resources that have been accumulated to make future principal and interest payments on general long term
indebtedness.
Debt Service Fund
Used to account for the accumulation of resources for, and for the payment of, general long-term bond principal, interest
and related costs of the County.
ETASC Debt Service Fund
Used to account for the accumulation of resources for, and for the payment of, general long-term bond principal, interest
and related costs of the ETASC.
ECFSA Debt Service Fund
Used to account for the accumulation of resources for, and for the payment of, general long-term bond principal, interest
and related costs of the ECFSA.
CAPITAL PROJECTS FUNDS
Capital Projects Funds are used to account for financial resources to be used for the acquisition or construction of major capital
facilities.
General Government Buildings, Equipment and Improvements Fund
Used to account for capital projects administered by the Department of Public Works involving the acquisition,
construction, or reconstruction of major or permanent facilities having a relatively long useful life and equipment
purchased from the proceeds of long-term debt.
Highways, Roads, Bridges and Equipment Fund
Utilized to account for capital projects administered by the Department of Public Works for the construction or
reconstruction of County roads and bridges and the acquisition of equipment not accounted for in the Road Fund.
Sewers, Facilities, Equipment and Improvements Fund
Used to account for capital projects relating to the construction and acquisition of sewer facilities and equipment by the
operating sewer districts.
Tobacco Proceeds Fund
Used to account for the net proceeds from the County’s securitization of its share of the 1998 Master Settlement
Agreement with the tobacco industry that will be used to fund capital projects that otherwise would have been supported
by operating funds or the issuance of bonds
Special Capital Projects Fund
Utilized to account for capital projects administered by departments other than Public Works that are primarily for the
acquisition or construction of buildings, improvements and equipment.
Erie County Medical Center Corporation (ECMCC) Capital Projects Fund
Utilized to account for capital projects that are for the acquisition or construction of buildings, improvements and
equipment for the Erie County Medical Center Corporation.
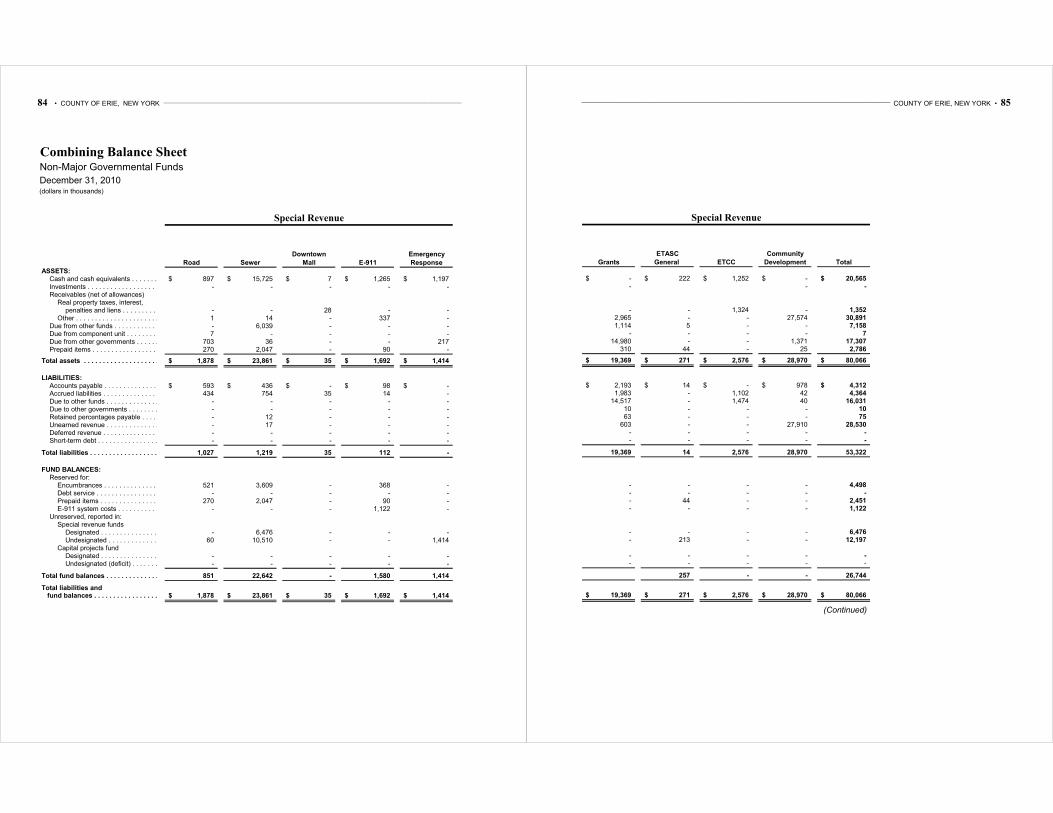
84 • COUNTY OF ERIE, NEW YORK ________________________________________________________________________________________________________________________________
Combining Balance SheetNon-Major Governmental Funds
December 31, 2010(dollars in thousands)
Downtown Emergency
Road Sewer Mall E-911 Response
ASSETS:Cash and cash equivalents . . . . . . . . . . . . . . . . . . . . . . . . . . . . . . .x 897$ 15,725$ 7$ 1,265$ 1,197$ Investments . . . . . . . . . . . . . . . . . . . . . . . . . . . . . . .x - - - - - Receivables (net of allowances) x
Real property taxes, interest, xpenalties and liens . . . . . . . . . . . . . . . . . . . . . . . . . . . . . . .x - - 28 - -
Other . . . . . . . . . . . . . . . . . . . . . . . . . . . . . . .x 1 14 - 337 - Due from other funds . . . . . . . . . . . . . . . . . . . . . . . . . . . . . . .x - 6,039 - - - Due from component unit . . . . . . . . . . . . . . . . . . . . . . . . . . . . . . .x 7 - - - - Due from other governments . . . . . . . . . . . . . . . . . . . . . . . . . . . . . . .x 703 36 - - 217 Prepaid items . . . . . . . . . . . . . . . . . . . . . . . . . . . . . . .x 270 2,047 - 90 -
xTotal assets . . . . . . . . . . . . . . . . . . . . . . . . . . . . . . .x 1,878$ 23,861$ 35$ 1,692$ 1,414$
x
LIABILITIES: xAccounts payable . . . . . . . . . . . . . . . . . . . . . . . . . . . . . . .x 593$ 436$ -$ 98$ -$ Accrued liabilities . . . . . . . . . . . . . . . . . . . . . . . . . . . . . . .x 434 754 35 14 - Due to other funds . . . . . . . . . . . . . . . . . . . . . . . . . . . . . . .x - - - - - Due to other governments . . . . . . . . . . . . . . . . . . . . . . . . . . . . . . .x - - - - - Retained percentages payable . . . . . . . . . . . . . . . . . . . . . . . . . . . . . . .x - 12 - - - Unearned revenue . . . . . . . . . . . . . . . . . . . . . . . . . . . . . . .x - 17 - - - Deferred revenue . . . . . . . . . . . . . . . . . . . . . . . . . . . . . . .x - - - - - Short-term debt . . . . . . . . . . . . . . . . . . . . . . . . . . . . . . .x - - - - -
x
Total liabilities . . . . . . . . . . . . . . . . . . . . . . . . . . . . . . .x 1,027 1,219 35 112 -
FUND BALANCES: xReserved for: x
Encumbrances . . . . . . . . . . . . . . . . . . . . . . . . . . . . . . .x 521 3,609 - 368 - Debt service . . . . . . . . . . . . . . . . . . . . . . . . . . . . . . .x - - - - - Prepaid items . . . . . . . . . . . . . . . . . . . . . . . . . . . . . . .x 270 2,047 - 90 - E-911 system costs . . . . . . . . . . . . . . . . . . . . . . . . . . . . . . .x - - - 1,122 -
Unreserved, reported in: xSpecial revenue funds x
Designated . . . . . . . . . . . . . . . . . . . . . . . . . . . . . . .x - 6,476 - - - Undesignated . . . . . . . . . . . . . . . . . . . . . . . . . . . . . . .x 60 10,510 - - 1,414
Capital projects fund xDesignated . . . . . . . . . . . . . . . . . . . . . . . . . . . . . . .x - - - - - Undesignated (deficit) . . . . . . . . . . . . . . . . . . . . . . . . . . . . . . .x - - - - -
Total fund balances . . . . . . . . . . . . . . . . . . . . . . . . . . . . . . .x 851 22,642 - 1,580 1,414 x
Total liabilities and fund balances . . . . . . . . . . . . . . . . . . . . . . . . . . . . . . .x 1,878$ 23,861$ 35$ 1,692$ 1,414$
Special Revenue
______________________________________________________________________________________________________ COUNTY OF ERIE, NEW YORK • 85
ETASC Community
Grants General ETCC Development Total
-$ 222$ 1,252$ -$ 20,565$ - - -
- - 1,324 - 1,352 2,965 - - 27,574 30,891 1,114 5 - - 7,158
- - - - 7 14,980 - - 1,371 17,307
310 44 - 25 2,786
19,369$ 271$ 2,576$ 28,970$ 80,066$
2,193$ 14$ -$ 978$ 4,312$ 1,983 - 1,102 42 4,364
14,517 - 1,474 40 16,031 10 - - - 10 63 - - - 75
603 - - 27,910 28,530 - - - - - - - - - -
19,369 14 2,576 28,970 53,322
- - - - 4,498 - - - - - - 44 - - 2,451 - - - - 1,122
- - - - 6,476 - 213 - - 12,197
- - - - - - - - - -
257 - - 26,744
19,369$ 271$ 2,576$ 28,970$ 80,066$
(Continued)
Special Revenue

86 • COUNTY OF ERIE, NEW YORK ________________________________________________________________________________________________________________________________
Combining Balance SheetNon-Major Governmental Funds
December 31, 2010(dollars in thousands)
Capital ProjectsGeneral
Government
Buildings,
Debt ETASC ECFSA Equipment and
Service Debt Service Debt Service Total Improvements
ASSETS:Cash and cash equivalents . . . . . . . . . . . . . . . . . . . . . . . . . . . . . . .x 1,957$ -$ 9,420$ 11,377$ 56,573$ Investments . . . . . . . . . . . . . . . . . . . . . . . . . . . . . . .x - 20,006 - 20,006 - Receivables (net of allowances) x
Real property taxes, interest, xpenalties and liens . . . . . . . . . . . . . . . . . . . . . . . . . . . . . . .x - - - - -
Other . . . . . . . . . . . . . . . . . . . . . . . . . . . . . . .x 104 8 - 112 - Due from other funds . . . . . . . . . . . . . . . . . . . . . . . . . . . . . . .x 9,296 - - 9,296 202 Due from component unit . . . . . . . . . . . . . . . . . . . . . . . . . . . . . . .x - - - - 1,113 Due from other governments . . . . . . . . . . . . . . . . . . . . . . . . . . . . . . .x 265 - - 265 2,320 Prepaid items . . . . . . . . . . . . . . . . . . . . . . . . . . . . . . .x - - - - -
xTotal assets . . . . . . . . . . . . . . . . . . . . . . . . . . . . . . .x 11,622$ 20,014$ 9,420$ 41,056$ 60,208$
x
LIABILITIES: xAccounts payable . . . . . . . . . . . . . . . . . . . . . . . . . . . . . . .x -$ -$ -$ -$ 3,684$ Accrued liabilities . . . . . . . . . . . . . . . . . . . . . . . . . . . . . . .x 62 - - 62 908 Due to other funds . . . . . . . . . . . . . . . . . . . . . . . . . . . . . . .x 3,236 42 9,296 12,574 1,652 Due to other governments . . . . . . . . . . . . . . . . . . . . . . . . . . . . . . .x - - - - - Retained percentages payable . . . . . . . . . . . . . . . . . . . . . . . . . . . . . . .x - - - - 1,212 Unearned revenue . . . . . . . . . . . . . . . . . . . . . . . . . . . . . . .x - - - - - Deferred revenue . . . . . . . . . . . . . . . . . . . . . . . . . . . . . . .x - 8 - 8 - Short-term debt . . . . . . . . . . . . . . . . . . . . . . . . . . . . . . .x - - - - -
x
Total liabilities . . . . . . . . . . . . . . . . . . . . . . . . . . . . . . .x 3,298 50 9,296 12,644 7,456
FUND BALANCES: xReserved for: x
Encumbrances . . . . . . . . . . . . . . . . . . . . . . . . . . . . . . .x - - - - 11,365 Debt service . . . . . . . . . . . . . . . . . . . . . . . . . . . . . . .x 8,200 19,964 124 28,288 - Prepaid items . . . . . . . . . . . . . . . . . . . . . . . . . . . . . . .x - - - - - E-911 system costs . . . . . . . . . . . . . . . . . . . . . . . . . . . . . . .x - - - - -
Unreserved, reported in: xSpecial revenue funds x
Designated . . . . . . . . . . . . . . . . . . . . . . . . . . . . . . .x - - - - - Undesignated . . . . . . . . . . . . . . . . . . . . . . . . . . . . . . .x 124 - - 124 -
Capital projects fund xDesignated . . . . . . . . . . . . . . . . . . . . . . . . . . . . . . .x - - - - - Undesignated (deficit) . . . . . . . . . . . . . . . . . . . . . . . . . . . . . . .x - - - - 41,387
Total fund balances . . . . . . . . . . . . . . . . . . . . . . . . . . . . . . .x 8,324 19,964 124 28,412 52,752 x
Total liabilities and fund balances . . . . . . . . . . . . . . . . . . . . . . . . . . . . . . .x 11,622$ 20,014$ 9,420$ 41,056$ 60,208$
Debt Service
______________________________________________________________________________________________________ COUNTY OF ERIE, NEW YORK • 87
Highways, Sewers, Total
Roads, Facilities, Special ECMCC Non-Major
Bridges and Equipment and Tobacco Capital Capital Governmental
Equipment Improvements Proceeds Projects Projects Total Funds
30,597$ 13,953$ 16$ 11,048$ 3,369$ 115,556$ 147,498$ - - 200 - - 200 20,206
- - - - - - 1,352 - - - - - - 31,003 - - - - - 202 16,656 - - - - - 1,113 1,120
10,973 17 - - - 13,310 30,882 - - - - - - 2,786
41,570$ 13,970$ 216$ 11,048$ 3,369$ 130,381$ 251,503$
4,970$ 998$ -$ 27$ 25$ 9,704$ 14,016$ 1,176 184 - 21 32 2,321 6,747 9,898 6,038 - 237 2 17,827 46,432
898 - - - - 898 908 - 582 - - 33 1,827 1,902
72 - - - - 72 28,602 - - - - - - 8 - 5,256 - - - 5,256 5,256
17,014 13,058 - 285 92 37,905 103,871
8,763 4,988 - 780 485 26,381 30,879 - - - - - - 28,288 - - - - - - 2,451 - - - - - - 1,122
- - - - - - 6,476 - - - - - - 12,321
- - 46 - 623 669 669 15,793 (4,076) 170 9,983 2,169 65,426 65,426
24,556 912 216 10,763 3,277 92,476 147,632
41,570$ 13,970$ 216$ 11,048$ 3,369$ 130,381$ 251,503$
(Concluded)
Capital Projects
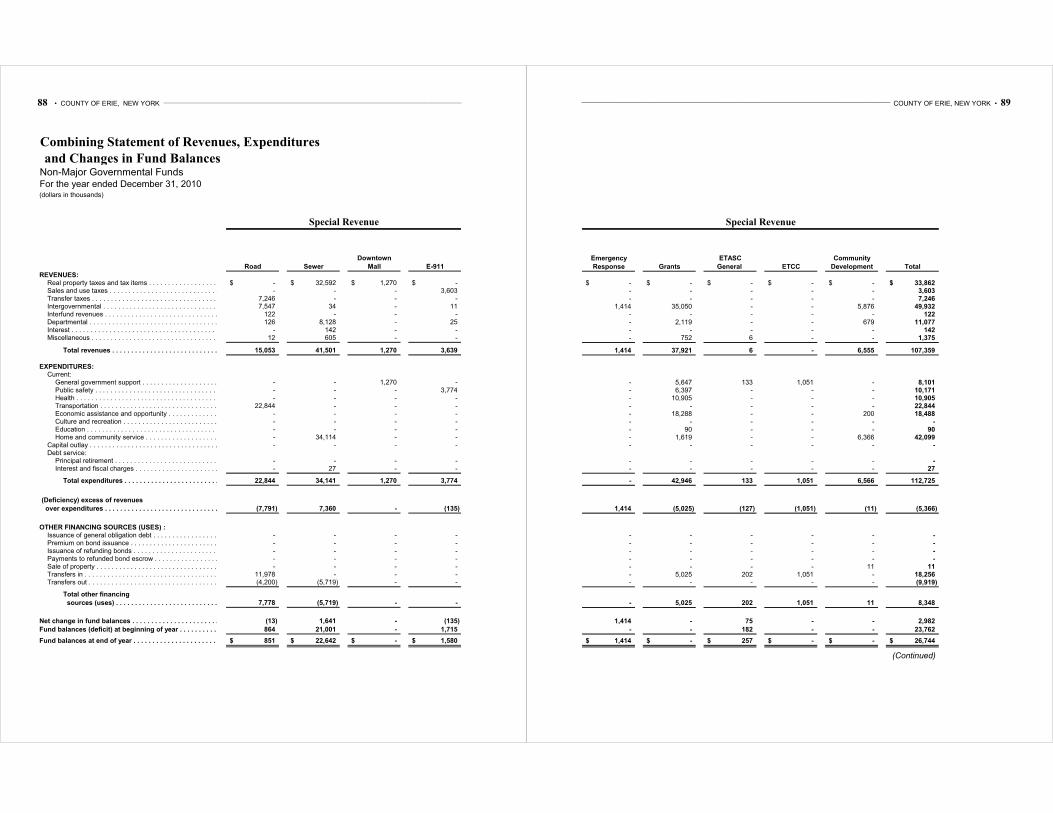
88 • COUNTY OF ERIE, NEW YORK ________________________________________________________________________________________________________________________________
Combining Statement of Revenues, Expenditures
and Changes in Fund BalancesNon-Major Governmental FundsFor the year ended December 31, 2010(dollars in thousands)
Downtown
Road Sewer Mall E-911
REVENUES:Real property taxes and tax items . . . . . . . . . . . . . . . . . . . . . . . . . . . . . . . . . . . . . . . . . . . . . . .x -$ 32,592$ 1,270$ -$ Sales and use taxes . . . . . . . . . . . . . . . . . . . . . . . . . . . . . . . . . . . . . . . . . . . . . . . . . .x - - - 3,603 Transfer taxes . . . . . . . . . . . . . . . . . . . . . . . . . . . . . . . . . . . . . . . . . . . . . . . . . .x 7,246 - - - Intergovernmental . . . . . . . . . . . . . . . . . . . . . . . . . . . . . . . . . . . . . . . . . . . . . . . . . .x 7,547 34 - 11 Interfund revenues . . . . . . . . . . . . . . . . . . . . . . . . . . . . . . . . . . . . . . . . . . . . . . . . . .x 122 - - - Departmental . . . . . . . . . . . . . . . . . . . . . . . . . . . . . . . . . . . . . . . . . . . . . . . . . .x 126 8,128 - 25 Interest . . . . . . . . . . . . . . . . . . . . . . . . . . . . . . . . . . . . . . . . . . . . . . . . . .x - 142 - - Miscellaneous . . . . . . . . . . . . . . . . . . . . . . . . . . . . . . . . . . . . . . . . . . . . . . . . . .x 12 605 - -
x
Total revenues . . . . . . . . . . . . . . . . . . . . . . . . . . . . . . . . . . . . . . . . . . . . . . . . . .x 15,053 41,501 1,270 3,639 x
EXPENDITURES: xCurrent: x
General government support . . . . . . . . . . . . . . . . . . . . . . . . . . . . . . . . . . . . . . . . . . . . . . . . . .x - - 1,270 - Public safety . . . . . . . . . . . . . . . . . . . . . . . . . . . . . . . . . . . . . . . . . . . . . . . . . .x - - - 3,774 Health . . . . . . . . . . . . . . . . . . . . . . . . . . . . . . . . . . . . . . . . . . . . . . . . . .x - - - - Transportation . . . . . . . . . . . . . . . . . . . . . . . . . . . . . . . . . . . . . . . . . . . . . . . . . .x 22,844 - - - Economic assistance and opportunity . . . . . . . . . . . . . . . . . . . . . . . . . . . . . . . . . . . . . . . . . . . . . .x - - - - Culture and recreation . . . . . . . . . . . . . . . . . . . . . . . . . . . . . . . . . . . . . . . . . . . . . . . . . .x - - - - Education . . . . . . . . . . . . . . . . . . . . . . . . . . . . . . . . . . . . . . . . . . . . . . . . . .x - - - - Home and community service . . . . . . . . . . . . . . . . . . . . . . . . . . . . . . . . . . . . . . . . . . . . . . . . . .x - 34,114 - -
Capital outlay . . . . . . . . . . . . . . . . . . . . . . . . . . . . . . . . . . . . . . . . . . . . . . . . . .x - - - - Debt service: x
Principal retirement . . . . . . . . . . . . . . . . . . . . . . . . . . . . . . . . . . . . . . . . . . . . . . . . . .x - - - - Interest and fiscal charges . . . . . . . . . . . . . . . . . . . . . . . . . . . . . . . . . . . . . . . . . . . . . . . . . .x - 27 - -
x
Total expenditures . . . . . . . . . . . . . . . . . . . . . . . . . . . . . . . . . . . . . . . . . . . . . . . . . .x 22,844 34,141 1,270 3,774
x
(Deficiency) excess of revenues x
over expenditures . . . . . . . . . . . . . . . . . . . . . . . . . . . . . . . . . . . . . . . . . . . . . . . . . .x (7,791) 7,360 - (135)
x
OTHER FINANCING SOURCES (USES) : xIssuance of general obligation debt . . . . . . . . . . . . . . . . . . . . . . . . . . . . . . . . . . . . . . . . . . . . . .x - - - - Premium on bond issuance . . . . . . . . . . . . . . . . . . . . . . . . . . . . . . . . . . . . . . . . . . . . . . . . . .x - - - - Issuance of refunding bonds . . . . . . . . . . . . . . . . . . . . . . . . . . . . x - - - - Payments to refunded bond escrow . . . . . . . . . . . . . . . . . . . . . x - - - - Sale of property . . . . . . . . . . . . . . . . . . . . . . . . . . . . . . . . . . . . . . . . . . . . . . . . . .x - - - - Transfers in . . . . . . . . . . . . . . . . . . . . . . . . . . . . . . . . . . . . . . . . . . . . . . . . . .x 11,978 - - - Transfers out . . . . . . . . . . . . . . . . . . . . . . . . . . . . . . . . . . . . . . . . . . . . . . . . . .x (4,200) (5,719) - -
x
Total other financing x
sources (uses) . . . . . . . . . . . . . . . . . . . . . . . . . . . . . . . . . . . . . . . . . . . . . . . . . .x 7,778 (5,719) - -
x
Net change in fund balances . . . . . . . . . . . . . . . . . . . . . . . . . . . . . . . . . . . . . . . . . . . . . . . . . .x (13) 1,641 - (135)
Fund balances (deficit) at beginning of year . . . . . . . . . . . . . . . . . . . . . . . . . . . . . . . . . . . . . . . . . x 864 21,001 - 1,715
Fund balances at end of year . . . . . . . . . . . . . . . . . . . . . . . . . . . . . . . . . . . . . . . . . . . . . . . . . x 851$ 22,642$ -$ 1,580$
Special Revenue
______________________________________________________________________________________________________ COUNTY OF ERIE, NEW YORK • 89
Emergency ETASC Community
Response Grants General ETCC Development Total
-$ -$ -$ -$ -$ 33,862$ - - - - - 3,603 - - - - - 7,246
1,414 35,050 - - 5,876 49,932 - - - - - 122 - 2,119 - - 679 11,077 - - - - - 142 - 752 6 - - 1,375
1,414 37,921 6 - 6,555 107,359
- 5,647 133 1,051 - 8,101 - 6,397 - - - 10,171 - 10,905 - - - 10,905 - - - - - 22,844 - 18,288 - - 200 18,488 - - - - - - - 90 - - - 90 - 1,619 - - 6,366 42,099 - - - - - -
- - - - - - - - - - - 27
- 42,946 133 1,051 6,566 112,725
1,414 (5,025) (127) (1,051) (11) (5,366)
- - - - - - - - - - - - - - - - - - - - - - - - - - - - 11 11 - 5,025 202 1,051 - 18,256 - - - - - (9,919)
- 5,025 202 1,051 11 8,348
1,414 - 75 - - 2,982
- - 182 - - 23,762
1,414$ -$ 257$ -$ -$ 26,744$
(Continued)
Special Revenue
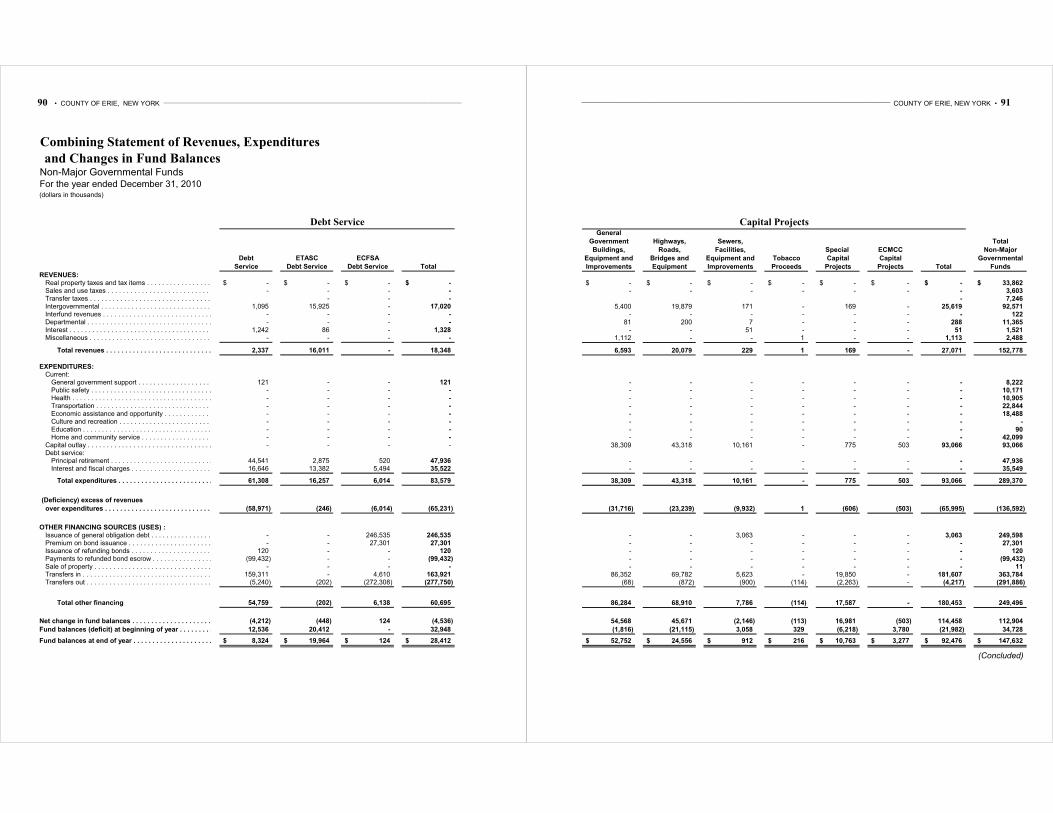
90 • COUNTY OF ERIE, NEW YORK ________________________________________________________________________________________________________________________________
Combining Statement of Revenues, Expenditures
and Changes in Fund BalancesNon-Major Governmental FundsFor the year ended December 31, 2010(dollars in thousands)
Debt ETASC ECFSA
Service Debt Service Debt Service Total
REVENUES:Real property taxes and tax items . . . . . . . . . . . . . . . . . . . . . . . . . . . . . . . . . . . . . . . . . . . . . . .x -$ -$ -$ -$ Sales and use taxes . . . . . . . . . . . . . . . . . . . . . . . . . . . . . . . . . . . . . . . . . . . . . . . . . .x - - - - Transfer taxes . . . . . . . . . . . . . . . . . . . . . . . . . . . . . . . . . . . . . . . . . . . . . . . . . .x - - - Intergovernmental . . . . . . . . . . . . . . . . . . . . . . . . . . . . . . . . . . . . . . . . . . . . . . . . . .x 1,095 15,925 - 17,020 Interfund revenues . . . . . . . . . . . . . . . . . . . . . . . . . . . . . . . . . . . . . . . . . . . . . . . . . .x - - - - Departmental . . . . . . . . . . . . . . . . . . . . . . . . . . . . . . . . . . . . . . . . . . . . . . . . . .x - - - - Interest . . . . . . . . . . . . . . . . . . . . . . . . . . . . . . . . . . . . . . . . . . . . . . . . . .x 1,242 86 - 1,328 Miscellaneous . . . . . . . . . . . . . . . . . . . . . . . . . . . . . . . . . . . . . . . . . . . . . . . . . .x - - - -
x
Total revenues . . . . . . . . . . . . . . . . . . . . . . . . . . . . . . . . . . . . . . . . . . . . . . . . . .x 2,337 16,011 - 18,348 x
EXPENDITURES: xCurrent: x
General government support . . . . . . . . . . . . . . . . . . . . . . . . . . . . . . . . . . . . . . . . . . . . . . . . . .x 121 - - 121 Public safety . . . . . . . . . . . . . . . . . . . . . . . . . . . . . . . . . . . . . . . . . . . . . . . . . .x - - - - Health . . . . . . . . . . . . . . . . . . . . . . . . . . . . . . . . . . . . . . . . . . . . . . . . . .x - - - - Transportation . . . . . . . . . . . . . . . . . . . . . . . . . . . . . . . . . . . . . . . . . . . . . . . . . .x - - - - Economic assistance and opportunity . . . . . . . . . . . . . . . . . . . . . . . . . . . . . . . . . . . . . . . . . . . . . .x - - - - Culture and recreation . . . . . . . . . . . . . . . . . . . . . . . . . . . . . . . . . . . . . . . . . . . . . . . . . .x - - - - Education . . . . . . . . . . . . . . . . . . . . . . . . . . . . . . . . . . . . . . . . . . . . . . . . . .x - - - - Home and community service . . . . . . . . . . . . . . . . . . . . . . . . . . . . . . . . . . . . . . . . . . . . . . . . . .x - - - -
Capital outlay . . . . . . . . . . . . . . . . . . . . . . . . . . . . . . . . . . . . . . . . . . . . . . . . . .x - - - - Debt service: x
Principal retirement . . . . . . . . . . . . . . . . . . . . . . . . . . . . . . . . . . . . . . . . . . . . . . . . . .x 44,541 2,875 520 47,936 Interest and fiscal charges . . . . . . . . . . . . . . . . . . . . . . . . . . . . . . . . . . . . . . . . . . . . . . . . . .x 16,646 13,382 5,494 35,522
x
Total expenditures . . . . . . . . . . . . . . . . . . . . . . . . . . . . . . . . . . . . . . . . . . . . . . . . . .x 61,308 16,257 6,014 83,579
x
(Deficiency) excess of revenues x
over expenditures . . . . . . . . . . . . . . . . . . . . . . . . . . . . . . . . . . . . . . . . . . . . . . . . . .x (58,971) (246) (6,014) (65,231)
x
OTHER FINANCING SOURCES (USES) : xIssuance of general obligation debt . . . . . . . . . . . . . . . . . . . . . . . . . . . . . . . . . . . . . . . . . . . . . .x - - 246,535 246,535 Premium on bond issuance . . . . . . . . . . . . . . . . . . . . . . . . . . . . . . . . . . . . . . . . . . . . . . . . . .x - - 27,301 27,301 Issuance of refunding bonds . . . . . . . . . . . . . . . . . . . . . . . . . . . . x 120 - - 120 Payments to refunded bond escrow . . . . . . . . . . . . . . . . . . . . . x (99,432) - - (99,432) Sale of property . . . . . . . . . . . . . . . . . . . . . . . . . . . . . . . . . . . . . . . . . . . . . . . . . .x - - - - Transfers in . . . . . . . . . . . . . . . . . . . . . . . . . . . . . . . . . . . . . . . . . . . . . . . . . .x 159,311 - 4,610 163,921 Transfers out . . . . . . . . . . . . . . . . . . . . . . . . . . . . . . . . . . . . . . . . . . . . . . . . . .x (5,240) (202) (272,308) (277,750)
x
Total other financing x 54,759 (202) 6,138 60,695
x
Net change in fund balances . . . . . . . . . . . . . . . . . . . . . . . . . . . . . . . . . . . . . . . . . . . . . . . . . .x (4,212) (448) 124 (4,536)
Fund balances (deficit) at beginning of year . . . . . . . . . . . . . . . . . . . . . . . . . . . . . . . . . . . . . . . . . x 12,536 20,412 - 32,948
Fund balances at end of year . . . . . . . . . . . . . . . . . . . . . . . . . . . . . . . . . . . . . . . . . . . . . . . . . x 8,324$ 19,964$ 124$ 28,412$
Debt Service
______________________________________________________________________________________________________ COUNTY OF ERIE, NEW YORK • 91
General
Government Highways, Sewers, Total
Buildings, Roads, Facilities, Special ECMCC Non-Major
Equipment and Bridges and Equipment and Tobacco Capital Capital Governmental
Improvements Equipment Improvements Proceeds Projects Projects Total Funds
-$ -$ -$ -$ -$ -$ -$ 33,862$ - - - - - - - 3,603
- 7,246 5,400 19,879 171 - 169 - 25,619 92,571
- - - - - - - 122 81 200 7 - - - 288 11,365
- - 51 - - - 51 1,521 1,112 - - 1 - - 1,113 2,488
6,593 20,079 229 1 169 - 27,071 152,778
- - - - - - - 8,222 - - - - - - - 10,171 - - - - - - - 10,905 - - - - - - - 22,844 - - - - - - - 18,488 - - - - - - - - - - - - - - - 90 - - - - - - - 42,099
38,309 43,318 10,161 - 775 503 93,066 93,066
- - - - - - - 47,936 - - - - - - - 35,549
38,309 43,318 10,161 - 775 503 93,066 289,370
(31,716) (23,239) (9,932) 1 (606) (503) (65,995) (136,592)
- - 3,063 - - - 3,063 249,598 - - - - - - - 27,301 - - - - - - - 120 - - - - - - - (99,432) - - - - - - - 11
86,352 69,782 5,623 - 19,850 - 181,607 363,784 (68) (872) (900) (114) (2,263) - (4,217) (291,886)
86,284 68,910 7,786 (114) 17,587 - 180,453 249,496
54,568 45,671 (2,146) (113) 16,981 (503) 114,458 112,904
(1,816) (21,115) 3,058 329 (6,218) 3,780 (21,982) 34,728
52,752$ 24,556$ 912$ 216$ 10,763$ 3,277$ 92,476$ 147,632$
(Concluded)
Capital Projects
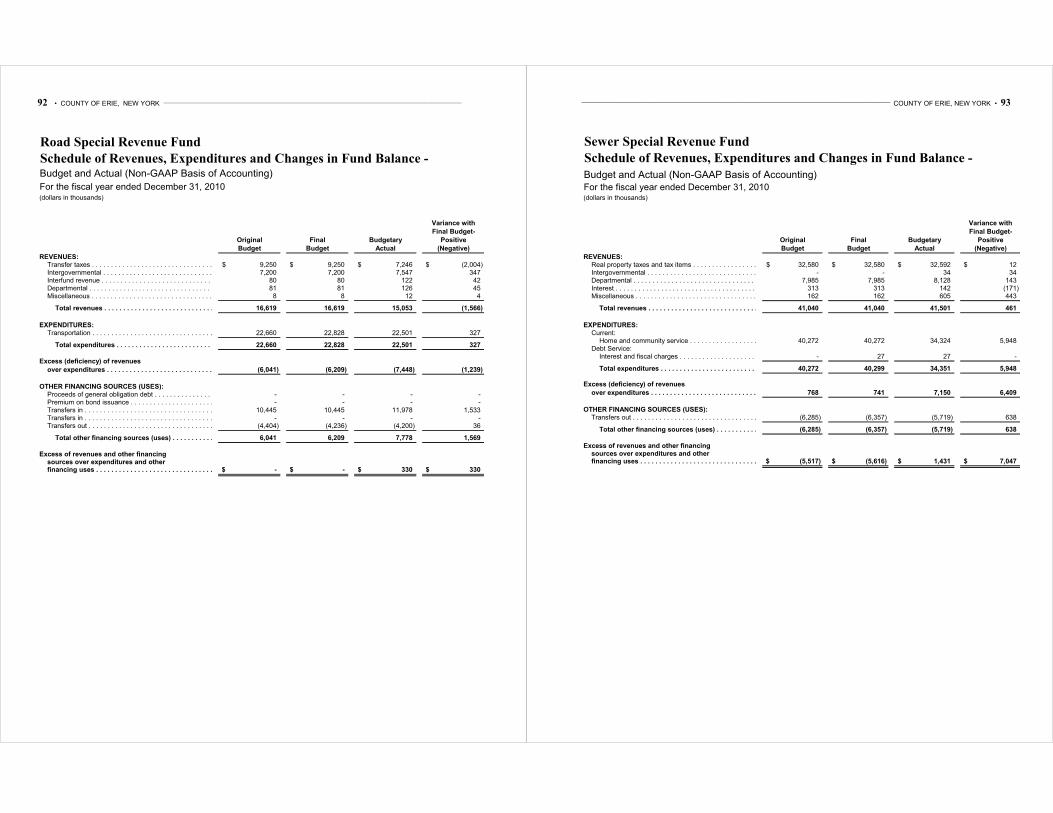
92 • COUNTY OF ERIE, NEW YORK ________________________________________________________________________________________________________________________________
Road Special Revenue Fund
Schedule of Revenues, Expenditures and Changes in Fund Balance - Budget and Actual (Non-GAAP Basis of Accounting)
For the fiscal year ended December 31, 2010(dollars in thousands)
Variance with
Final Budget-
Original Final Budgetary Positive
Budget Budget Actual (Negative)
REVENUES: 9,250$ 9,250$ 7,246$ (2,004)$ 7,200 7,200 7,547 347 80 80 122 42 81 81 126 45
Miscellaneous . . . . . . . . . . . . . . . . . . . . . . . . . . . . . . . . . . . . . . . . . . . . . . . . . . . . . . . . . 8 8 12 4
16,619 16,619 15,053 (1,566)
EXPENDITURES: 22,660 22,828 22,501 327
22,660 22,828 22,501 327
Excess (deficiency) of revenues
over expenditures . . . . . . . . . . . . . . . . . . . . . . . . . . . . . . . . . . . . . . . . . . . . . . . . . . . . . . . (6,041) (6,209) (7,448) (1,239)
OTHER FINANCING SOURCES (USES): Proceeds of general obligation debt . . . . . . . . . . . . . . . . . . . . . . . . . . . . . . . . . . . . . . . . . . . . . . - - - - Premium on bond issuance . . . . . . . . . . . . . . . . . . . . . . . . . . . . . . . . . . . . . . . . . . . . . . . . . . . - - - -
10,445 10,445 11,978 1,533 - - - - (4,404) (4,236) (4,200) 36
Total other financing sources (uses) . . . . . . . . . . . . . . . . . . . . . . . . . . . . . . . . . . . . . . . . . . . . . 6,041 6,209 7,778 1,569
Excess of revenues and other financing
sources over expenditures and other financing uses . . . . . . . . . . . . . . . . . . . . . . . . . . . . . . . . . . . . . . . . . . . . . . . . . . . . . . . . -$ -$ 330$ 330$
Interfund revenue . . . . . . . . . . . . . . . . . . . . . . . . . . . . . . . . . . . . . . . . . . . . . . . . . . . . . . .
Transfers in . . . . . . . . . . . . . . . . . . . . . . . . . . . . . . . . . . . . . . . . . . . . . . . . . . . . . . . . . Transfers in . . . . . . . . . . . . . . . . . . . . . . . . . . . . . . . . . . . . . . . . . . . . . . . . . . . . . . . . . Transfers out . . . . . . . . . . . . . . . . . . . . . . . . . . . . . . . . . . . . . . . . . . . . . . . . . . . . . . . . .
Intergovernmental . . . . . . . . . . . . . . . . . . . . . . . . . . . . . . . . . . . . . . . . . . . . . . . . . . . . . . .
Total expenditures . . . . . . . . . . . . . . . . . . . . . . . . . . . . . . . . . . . . . . . . . . . . . . . . . . . . . .
Total revenues . . . . . . . . . . . . . . . . . . . . . . . . . . . . . . . . . . . . . . . . . . . . . . . . . . . . . . . .
Transportation . . . . . . . . . . . . . . . . . . . . . . . . . . . . . . . . . . . . . . . . . . . . . . . . . . . . . . . .
Departmental . . . . . . . . . . . . . . . . . . . . . . . . . . . . . . . . . . . . . . . . . . . . . . . . . . . . . . . . .
Transfer taxes . . . . . . . . . . . . . . . . . . . . . . . . . . . . . . . . . . . . . . . . . . . . . . . . . . . . . . . .
______________________________________________________________________________________________________ COUNTY OF ERIE, NEW YORK • 93
Sewer Special Revenue Fund
Schedule of Revenues, Expenditures and Changes in Fund Balance -
Budget and Actual (Non-GAAP Basis of Accounting)For the fiscal year ended December 31, 2010(dollars in thousands)
Variance with
Original Final Budgetary
Budget Budget Actual
REVENUES: 32,580$ 32,580$ 32,592$ 12$ - - 34 34 7,985 7,985 8,128 143 313 313 142 (171) 162 162 605 443
Total revenues . . . . . . . . . . . . . . . . . . . . . . . . . . . . . . . . . . . . . . . . . . . . . . . . . . . . . . . . 41,040 41,040 41,501 461
Current:
Home and community service . . . . . . . . . . . . . . . . . . . . . . . . . . . . . . . . . . . . . . . . . . . . . . . . . . 40,272 40,272 34,324 5,948 Debt Service:
Interest and fiscal charges . . . . . . . . . . . . . . . . . . . . . . . . . . . . . . . . . . . . . . . . . . . . . . . . . . - 27 27 -
Total expenditures . . . . . . . . . . . . . . . . . . . . . . . . . . . . . . . . . . . . . . . . . . . . . . . . . . . . . . 40,272 40,299 34,351 5,948
Excess (deficiency) of revenues
over expenditures . . . . . . . . . . . . . . . . . . . . . . . . . . . . . . . . . . . . . . . . . . . . . . . . . . . . . . . 768 741 7,150 6,409
OTHER FINANCING SOURCES (USES): (6,285) (6,357) (5,719) 638
(6,285) (6,357) (5,719) 638
Excess of revenues and other financing
sources over expenditures and other financing uses . . . . . . . . . . . . . . . . . . . . . . . . . . . . . . . . . . . . . . . . . . . . . . . . . . . . . . . . (5,517)$ (5,616)$ 1,431$ 7,047$
Departmental . . . . . . . . . . . . . . . . . . . . . . . . . . . . . . . . . . . . . . . . . . . . . . . . . . . . . . . . . Interest . . . . . . . . . . . . . . . . . . . . . . . . . . . . . . . . . . . . . . . . . . . . . . . . . . . . . . . . . . .
Intergovernmental . . . . . . . . . . . . . . . . . . . . . . . . . . . . . . . . . . . . . . . . . . . . . . . . . . . . . . .
Total other financing sources (uses) . . . . . . . . . . . . . . . . . . . . . . . . . . . . . . . . . . . . . . . . . . . . .
EXPENDITURES:
Miscellaneous . . . . . . . . . . . . . . . . . . . . . . . . . . . . . . . . . . . . . . . . . . . . . . . . . . . . . . . . .
Transfers out . . . . . . . . . . . . . . . . . . . . . . . . . . . . . . . . . . . . . . . . . . . . . . . . . . . . . . . . .
Final Budget-
Positive
(Negative)
Real property taxes and tax items . . . . . . . . . . . . . . . . . . . . . . . . . . . . . . . . . . . . . . . . . . . . . . .
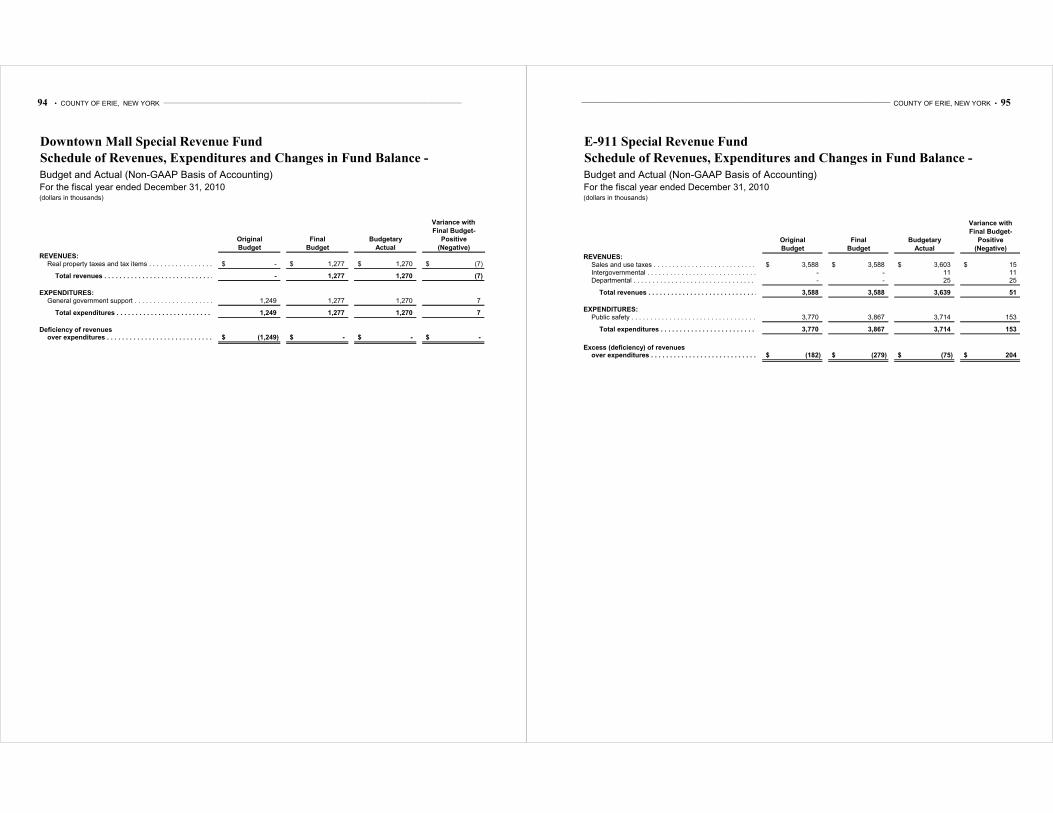
94 • COUNTY OF ERIE, NEW YORK ________________________________________________________________________________________________________________________________
Downtown Mall Special Revenue Fund
Schedule of Revenues, Expenditures and Changes in Fund Balance -
Budget and Actual (Non-GAAP Basis of Accounting)For the fiscal year ended December 31, 2010 (dollars in thousands)
Variance with
Original Final Budgetary
Budget Budget Actual
REVENUES: -$ 1,277$ 1,270$ (7)$
Total revenues . . . . . . . . . . . . . . . . . . . . . . . . . . . . . . . . . . . . . . . . . . . . . . . . . . . . . . . . - 1,277 1,270 (7)
EXPENDITURES: General government support . . . . . . . . . . . . . . . . . . . . . . . . . . . . . . . . . . . . . . . . . . . . . . . . . . 1,249 1,277 1,270 7
Total expenditures . . . . . . . . . . . . . . . . . . . . . . . . . . . . . . . . . . . . . . . . . . . . . . . . . . . . . . 1,249 1,277 1,270 7
Deficiency of revenues over expenditures . . . . . . . . . . . . . . . . . . . . . . . . . . . . . . . . . . . . . . . . . . . . . . . . . . . . . . . (1,249)$ -$ -$ -$
Real property taxes and tax items . . . . . . . . . . . . . . . . . . . . . . . . . . . . . . . . . . . . . . . . . . . . . . .
Final Budget-
Positive
(Negative)
______________________________________________________________________________________________________ COUNTY OF ERIE, NEW YORK • 95
E-911 Special Revenue Fund
Schedule of Revenues, Expenditures and Changes in Fund Balance -
Budget and Actual (Non-GAAP Basis of Accounting)For the fiscal year ended December 31, 2010 (dollars in thousands)
Variance with
Original Final Budgetary
Budget Budget Actual
REVENUES: Sales and use taxes . . . . . . . . . . . . . . . . . . . . . . . . . . . . . . . . . . . . . . . . . . . . . . . . . . . . . . 3,588$ 3,588$ 3,603$ 15$ Intergovernmental . . . . . . . . . . . . . . . . . . . . . . . . . . . . . . . . . . . . . . . . . . . . . . . . . . . . . . . - - 11 11 Departmental . . . . . . . . . . . . . . . . . . . . . . . . . . . . . . . . . . . . . . . . . . . . . . . . . . . . . . . . . - - 25 25
Total revenues . . . . . . . . . . . . . . . . . . . . . . . . . . . . . . . . . . . . . . . . . . . . . . . . . . . . . . . . 3,588 3,588 3,639 51
EXPENDITURES: Public safety . . . . . . . . . . . . . . . . . . . . . . . . . . . . . . . . . . . . . . . . . . . . . . . . . . . . . . . . . 3,770 3,867 3,714 153
Total expenditures . . . . . . . . . . . . . . . . . . . . . . . . . . . . . . . . . . . . . . . . . . . . . . . . . . . . . . 3,770 3,867 3,714 153
Excess (deficiency) of revenues over expenditures . . . . . . . . . . . . . . . . . . . . . . . . . . . . . . . . . . . . . . . . . . . . . . . . . . . . . . . (182)$ (279)$ (75)$ 204$
Final Budget-
Positive
(Negative)
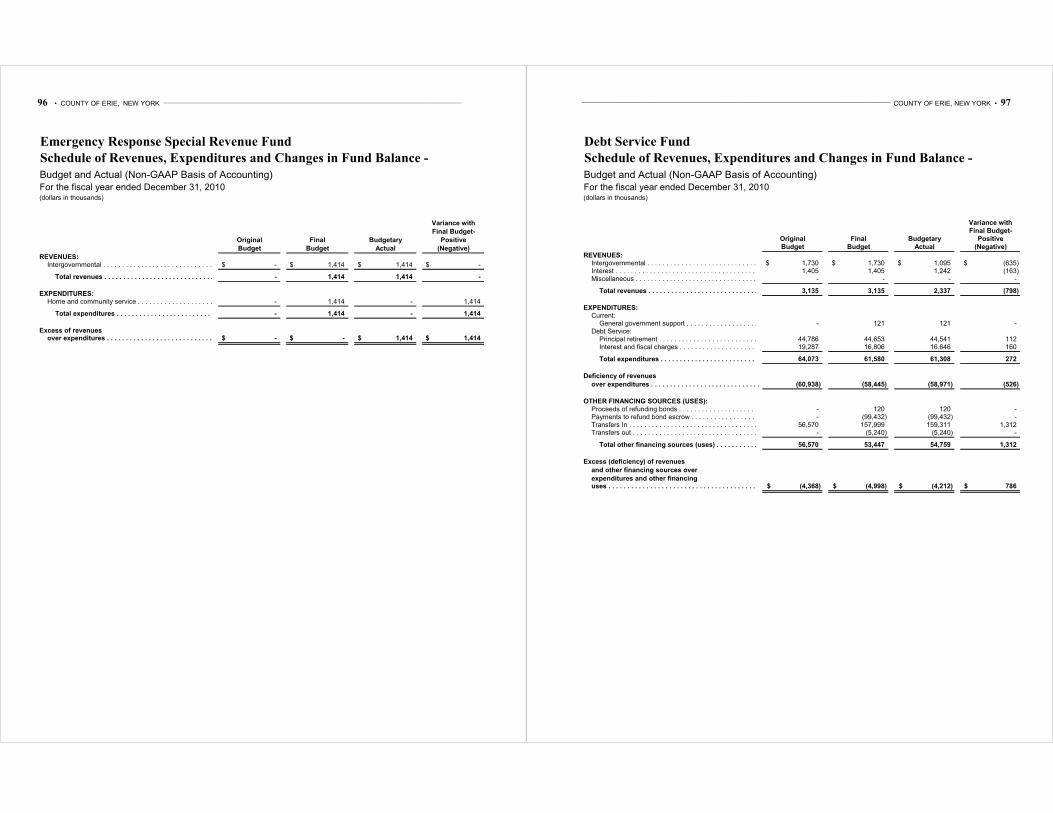
96 • COUNTY OF ERIE, NEW YORK ________________________________________________________________________________________________________________________________
Emergency Response Special Revenue Fund
Schedule of Revenues, Expenditures and Changes in Fund Balance -
Budget and Actual (Non-GAAP Basis of Accounting)For the fiscal year ended December 31, 2010 (dollars in thousands)
Variance with
Original Final Budgetary
Budget Budget Actual
REVENUES: Intergovernmental . . . . . . . . . . . . . . . . . . . . . . . . . . . . . . . . . . . . . . . . . . . . . . . . . . . . . . . -$ 1,414$ 1,414$ -$
Total revenues . . . . . . . . . . . . . . . . . . . . . . . . . . . . . . . . . . . . . . . . . . . . . . . . . . . . . . . . - 1,414 1,414 -
EXPENDITURES: Home and community service . . . . . . . . . . . . . . . . . . . . . . . . . . . . . . . . . . . . . . . . . . . . . . . . . . - 1,414 - 1,414
Total expenditures . . . . . . . . . . . . . . . . . . . . . . . . . . . . . . . . . . . . . . . . . . . . . . . . . . . . . . - 1,414 - 1,414
Excess of revenues over expenditures . . . . . . . . . . . . . . . . . . . . . . . . . . . . . . . . . . . . . . . . . . . . . . . . . . . . . . . -$ -$ 1,414$ 1,414$
Final Budget-
Positive
(Negative)
______________________________________________________________________________________________________ COUNTY OF ERIE, NEW YORK • 97
Debt Service Fund
Schedule of Revenues, Expenditures and Changes in Fund Balance -
Budget and Actual (Non-GAAP Basis of Accounting)For the fiscal year ended December 31, 2010 (dollars in thousands)
Variance with
Original Final BudgetaryBudget Budget Actual
REVENUES: 1,730$ 1,730$ 1,095$ (635)$
Interest . . . . . . . . . . . . . . . . . . . . . . . . . . . . . . . . . . . . . . . . . . . . . . . . . . . . . . . . . . . 1,405 1,405 1,242 (163) Miscellaneous . . . . . . . . . . . . . . . . . . . . . . . . . . . . . . . . . . . . . . . . . . . . . . . . . . . . . . . . . - - - -
Total revenues . . . . . . . . . . . . . . . . . . . . . . . . . . . . . . . . . . . . . . . . . . . . . . . . . . . . . . . . 3,135 3,135 2,337 (798)
EXPENDITURES: Current:
General government support . . . . . . . . . . . . . . . . . . . . . . . . . . . . . . . . . . . . . . . . . . . . . . . . . . - 121 121 - Debt Service:
Principal retirement . . . . . . . . . . . . . . . . . . . . . . . . . . . . . . . . . . . . . . . . . . . . . . . . . . . . . 44,786 44,653 44,541 112 Interest and fiscal charges . . . . . . . . . . . . . . . . . . . . . . . . . . . . . . . . . . . . . . . . . . . . . . . . . . 19,287 16,806 16,646 160
Total expenditures . . . . . . . . . . . . . . . . . . . . . . . . . . . . . . . . . . . . . . . . . . . . . . . . . . . . . . 64,073 61,580 61,308 272
Deficiency of revenues
over expenditures . . . . . . . . . . . . . . . . . . . . . . . . . . . . . . . . . . . . . . . . . . . . . . . . . . . . . . .(60,938) (58,445) (58,971) (526)
OTHER FINANCING SOURCES (USES): Proceeds of refunding bonds . . . . . . . . . . . . . . . . . . . . . . . . . . . . . . . . . . . . . . . . . . . . . . . . . . - 120 120 - Payments to refund bond escrow . . . . . . . . . . . . . . . . . . . . . . . . . . . . . . . . . . . . . . . . . . . . . . . . - (99,432) (99,432) - Transfers In . . . . . . . . . . . . . . . . . . . . . . . . . . . . . . . . . . . . . . . . . . . . . . . . . . . . . . . . . 56,570 157,999 159,311 1,312 Transfers out . . . . . . . . . . . . . . . . . . . . . . . . . . . . . . . . . . . . . . . . . . . . . . . . . . . . . . . . . - (5,240) (5,240) -
56,570 53,447 54,759 1,312
Excess (deficiency) of revenues
and other financing sources over
expenditures and other financing uses . . . . . . . . . . . . . . . . . . . . . . . . . . . . . . . . . . . . . . . . . . . . . . . . . . . . . . . . . . . . . (4,368)$ (4,998)$ (4,212)$ 786$
Total other financing sources (uses) . . . . . . . . . . . . . . . . . . . . . . . . . . . . . . . . . . . . . . . . . . . . .
Intergovernmental . . . . . . . . . . . . . . . . . . . . . . . . . . . . . . . . . . . . . . . . . . . . . . . . . . . . . . .
Final Budget-Positive
(Negative)

98 • COUNTY OF ERIE, NEW YORK ________________________________________________________________________________________________________________________________
______________________________________________________________________________________________________ COUNTY OF ERIE, NEW YORK • 99
AGENCY FUND
The Agency Fund is used to account for money and property received and
held in the capacity of custodian or agent. The Agency Fund is custodial in
nature and does not involve measurement of results of operations.
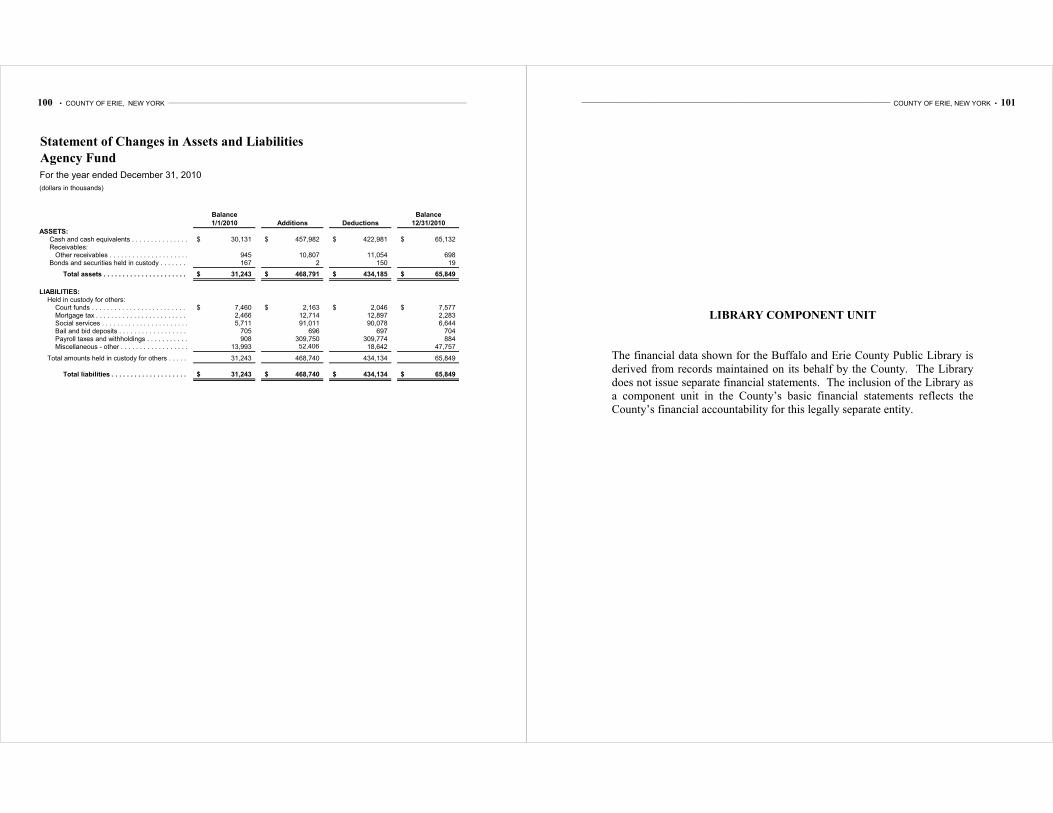
100 • COUNTY OF ERIE, NEW YORK ________________________________________________________________________________________________________________________________
Statement of Changes in Assets and Liabilities
Agency Fund
For the year ended December 31, 2010
(dollars in thousands)
Balance Balance
1/1/2010 Additions Deductions 12/31/2010
ASSETS: Cash and cash equivalents . . . . . . . . . . . . . . . . . . . . . . . . . . . . . . . . . . . . . . . . . . . . . . . . . . . 30,131$ 457,982$ 422,981$ 65,132$ Receivables:
Other receivables . . . . . . . . . . . . . . . . . . . . . . . . . . . . . . . . . . . . . . . . . . . . . . . . . . . . . . . 945 10,807 11,054 698 Bonds and securities held in custody . . . . . . . . . . . . . . . . . . . . . . . . . . . . . . . . . . . . . . . . . . . . . 167 2 150 19
Total assets . . . . . . . . . . . . . . . . . . . . . . . . . . . . . . . . . . . . . . . . . . . . . . . . . . . . . . . . . 31,243$ 468,791$ 434,185$ 65,849$
LIABILITIES: Held in custody for others:
Court funds . . . . . . . . . . . . . . . . . . . . . . . . . . . . . . . . . . . . . . . . . . . . . . . . . . . . . . . . . . 7,460$ 2,163$ 2,046$ 7,577$ Mortgage tax . . . . . . . . . . . . . . . . . . . . . . . . . . . . . . . . . . . . . . . . . . . . . . . . . . . . . . . . . 2,466 12,714 12,897 2,283 Social services . . . . . . . . . . . . . . . . . . . . . . . . . . . . . . . . . . . . . . . . . . . . . . . . . . . . . . . . 5,711 91,011 90,078 6,644 Bail and bid deposits . . . . . . . . . . . . . . . . . . . . . . . . . . . . . . . . . . . . . . . . . . . . . . . . . . . . . 705 696 697 704 Payroll taxes and withholdings . . . . . . . . . . . . . . . . . . . . . . . . . . . . . . . . . . . . . . . . . . . . . . . . 908 309,750 309,774 884 Miscellaneous - other . . . . . . . . . . . . . . . . . . . . . . . . . . . . . . . . . . . . . . . . . . . . . . . . . . . . . 13,993 52,406 18,642 47,757
Total amounts held in custody for others . . . . . . . . . . . . . . . . . . . . . . . . . . . . . . . . . . . . . . . . . . . 31,243 468,740 434,134 65,849
Total liabilities . . . . . . . . . . . . . . . . . . . . . . . . . . . . . . . . . . . . . . . . . . . . . . . . . . . . . . . 31,243$ 468,740$ 434,134$ 65,849$
______________________________________________________________________________________________________ COUNTY OF ERIE, NEW YORK • 101
LIBRARY COMPONENT UNIT
The financial data shown for the Buffalo and Erie County Public Library is
derived from records maintained on its behalf by the County. The Library
does not issue separate financial statements. The inclusion of the Library as
a component unit in the County’s basic financial statements reflects the
County’s financial accountability for this legally separate entity.
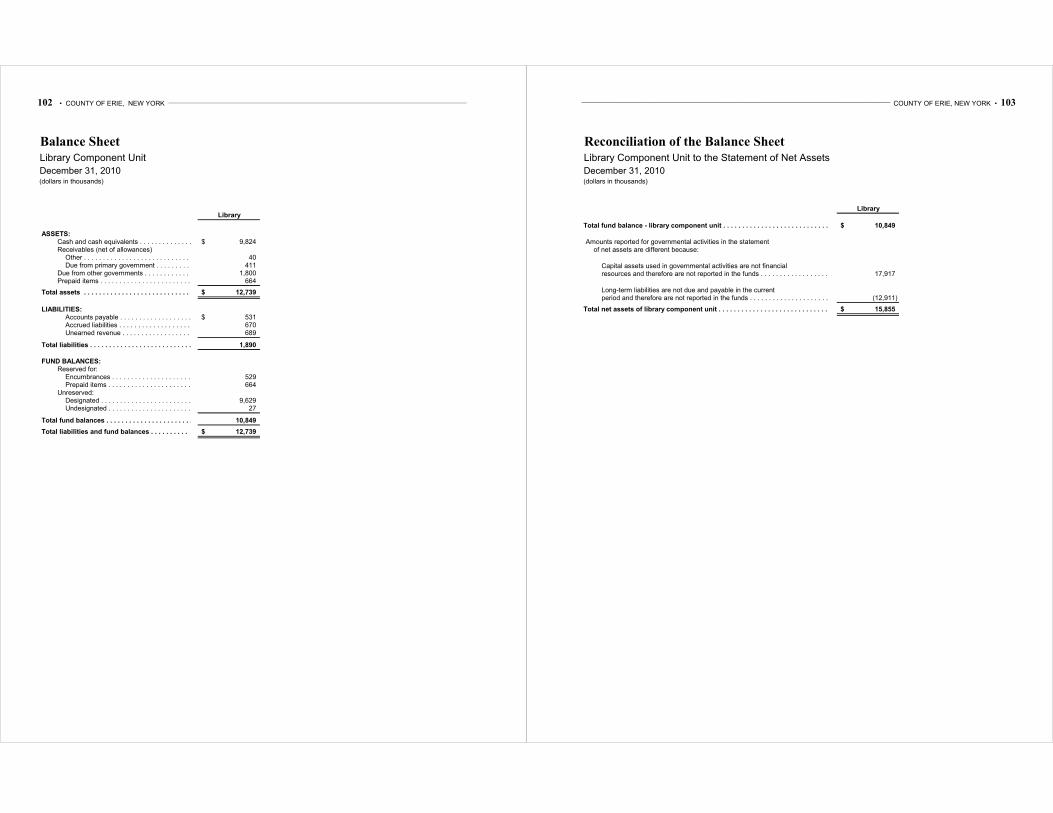
102 • COUNTY OF ERIE, NEW YORK ________________________________________________________________________________________________________________________________
Balance Sheet
Library Component Unit
December 31, 2010(dollars in thousands)
Library
ASSETS:Cash and cash equivalents . . . . . . . . . . . . . . . . . . . . . . . . . . . . . . . . . . . . . . . . . . . . . . . . . . x 9,824$ Receivables (net of allowances) x
Other . . . . . . . . . . . . . . . . . . . . . . . . . . . . . . . . . . . . . . . . . . .x 40 Due from primary government . . . . . . . . . . . x 411
Due from other governments . . . . . . . . . . . . . . . . . . . . . . . . . . . . . . . . . . . . . . . . . . . . . . . . . . x 1,800 Prepaid items . . . . . . . . . . . . . . . . . . . . . . . . . . . . . . . . . . . . . . . . . . . . . . . . . . .x 664
xTotal assets . . . . . . . . . . . . . . . . . . . . . . . . . . . . . . . . . . . . . . . . . . . . . . . . . . .x 12,739$
x
LIABILITIES: xAccounts payable . . . . . . . . . . . . . . . . . . . . . . . . . . . . . . . . . . . . . . . . . . . . . . . . . . .x 531$ Accrued liabilities . . . . . . . . . . . . . . . . . . . . . . . . . . . . . . . . . . . . . . . . . . . . . . . . . . .x 670 Unearned revenue . . . . . . . . . . . . . . . . . . . x 689
x
Total liabilities . . . . . . . . . . . . . . . . . . . . . . . . . . . . . . . . . . . . . . . . . . . . . . . . . . .x 1,890
FUND BALANCES: xReserved for: x
Encumbrances . . . . . . . . . . . . . . . . . . . . . . . . . . . . . . . . . . . . . . . . . . . . . . . . . . .x 529 Prepaid items . . . . . . . . . . . . . . . . . . . . . . . . . . . . . . . . . . . . . . . . . . . . . . . . . . .x 664
Unreserved: xDesignated . . . . . . . . . . . . . . . . . . . . . . . . . . . . . . . . . . . . . . . . . . . . . . . . . . .x 9,629 Undesignated . . . . . . . . . . . . . . . . . . . . . . . . . . . . . . . . . . . . . . . . . . . . . . . . . . .x 27
x
Total fund balances . . . . . . . . . . . . . . . . . . . . . . . . . . . . . . . . . . . . . . . . . . . . . . . . . . .x 10,849
Total liabilities and fund balances . . . . . . . . . . x 12,739$
x
______________________________________________________________________________________________________ COUNTY OF ERIE, NEW YORK • 103
Reconciliation of the Balance Sheet
Library Component Unit to the Statement of Net Assets
December 31, 2010(dollars in thousands)
Library
Total fund balance - library component unit . . . . . . . . . . . . . . . . . . . . . . . . . . . . . x 10,849$
xAmounts reported for governmental activities in the statement x
of net assets are different because: x
xCapital assets used in governmental activities are not financial xresources and therefore are not reported in the funds . . . . . . . . . . . . . . . . . . . . . . . x 17,917
xLong-term liabilities are not due and payable in the current xperiod and therefore are not reported in the funds . . . . . . . . . . . . . . . . . . . . . x (12,911)
xTotal net assets of library component unit . . . . . . . . . . . . . . . . . . . . . . . . . . . . . x 15,855$
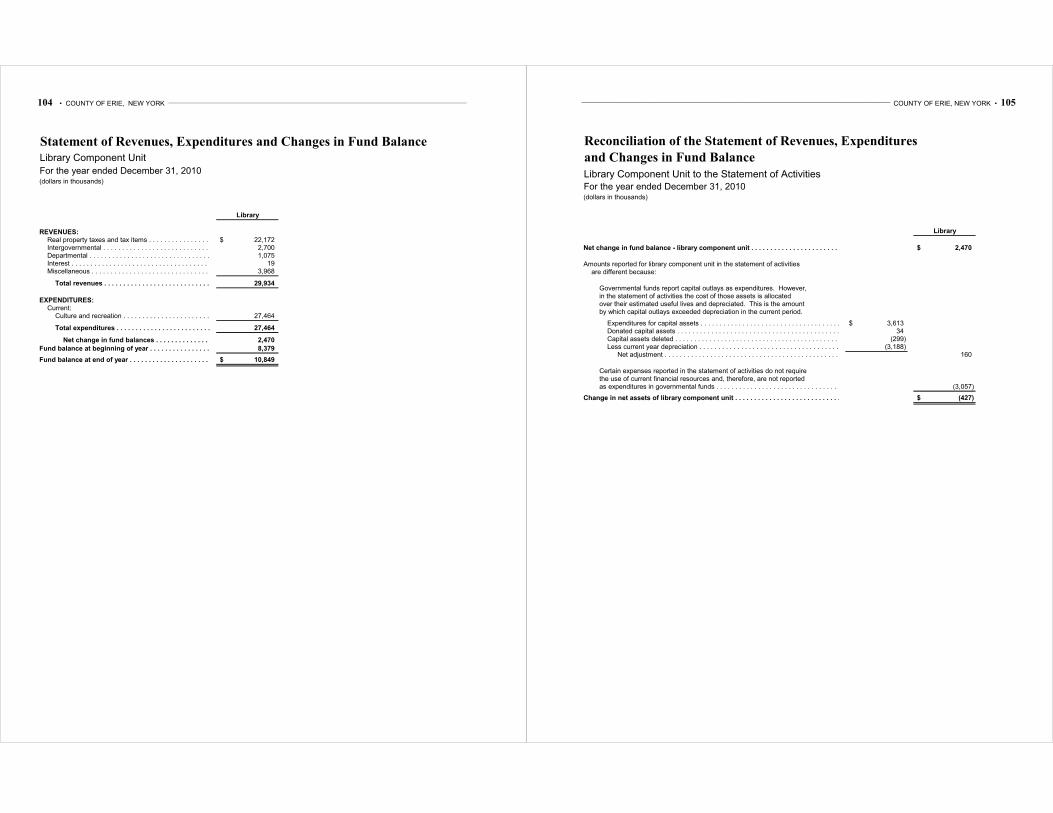
104 • COUNTY OF ERIE, NEW YORK ________________________________________________________________________________________________________________________________
Statement of Revenues, Expenditures and Changes in Fund Balance
Library Component Unit
For the year ended December 31, 2010(dollars in thousands)
Library
x
REVENUES: xReal property taxes and tax items . . . . . . . . . . . . . . . . . . . . . . . . . . . . . . . . . . . .x 22,172$ Intergovernmental . . . . . . . . . . . . . . . . . . . . . . . . . . . . . . . . . . . .x 2,700 Departmental . . . . . . . . . . . . . . . . . . . . . . . . . . . . . . . . . . . .x 1,075 Interest . . . . . . . . . . . . . . . . . . . . . . . . . . . . . . . . . . . . x 19 Miscellaneous . . . . . . . . . . . . . . . . . . . . . . . . . . . . . . . . . . . .x 3,968
x
Total revenues . . . . . . . . . . . . . . . . . . . . . . . . . . . . . . . . . . . . . .x 29,934
x
EXPENDITURES: xCurrent: x
Culture and recreation . . . . . . . . . . . . . . . . . . . . . . . . . . . . . . . . . . . . . .x 27,464 x
Total expenditures . . . . . . . . . . . . . . . . . . . . . . . . . . . . . . . . . . . . . .x 27,464 x
Net change in fund balances . . . . . . . . . . . . . . . . . . . . . . . . . . . . . . . . . . . . . .x 2,470
Fund balance at beginning of year . . . . . . . . . . . . . . . . . . . . . . . . . . . . . . . . . . . . . .x 8,379 x
Fund balance at end of year . . . . . . . . . . . . . . . . . . . . . . . . . . . . . . . . . . . . . .x 10,849$
______________________________________________________________________________________________________ COUNTY OF ERIE, NEW YORK • 105
Reconciliation of the Statement of Revenues, Expenditures
and Changes in Fund Balance
Library Component Unit to the Statement of ActivitiesFor the year ended December 31, 2010(dollars in thousands)
Library
Net change in fund balance - library component unit . . . . . . . . . . . . . . . . . . . . . . . . . . . . . . . .x 2,470$
x Amounts reported for library component unit in the statement of activities
are different because:
Governmental funds report capital outlays as expenditures. However, xin the statement of activities the cost of those assets is allocated xover their estimated useful lives and depreciated. This is the amount xby which capital outlays exceeded depreciation in the current period. x
xExpenditures for capital assets . . . . . . . . . . . . . . . . . . . . . . . . . . . . . . . . . . . . . x 3,613$ Donated capital assets . . . . . . . . . . . . . . . . . . . . . . . . . . . . . . . . . . . . . . . . . . . . . . x 34 Capital assets deleted . . . . . . . . . . . . . . . . . . . . . . . . . . . . . . . . . . . . . . . . . . . . . x (299) Less current year depreciation . . . . . . . . . . . . . . . . . . . . . . . . . . . . . . . . . . . . . . x (3,188)
Net adjustment . . . . . . . . . . . . . . . . . . . . . . . . . . . . . . . . . . . . . . . . . . . . . . . . . .x 160
xCertain expenses reported in the statement of activities do not require xthe use of current financial resources and, therefore, are not reported xas expenditures in governmental funds . . . . . . . . . . . . . . . . . . . . . . . . . . . . . . . . . . x (3,057)
xChange in net assets of library component unit . . . . . . . . . . . . . . . . . . . . . . . . . . . . . . . . . . . . . . . . x (427)$

106 • COUNTY OF ERIE, NEW YORK ________________________________________________________________________________________________________________________________
______________________________________________________________________________________________________ COUNTY OF ERIE, NEW YORK • 107
OTHER COMPONENT UNITS
Other Component Units of Erie County include:
The financial data shown for the Erie Community College Foundation, Inc.,
and the Auxiliary Services Corporation of Erie Community College, Inc., is
derived from their separately issued financial statements. Both of these
entities are included as component units in the County’s basic financial
statements, based on the fact that they are legally separate entities for which
the College and County are financially accountable.
The financial data shown for the Buffalo and Erie County Industrial Land
Development Corporation (“ILDC”) is derived from their separately issued
financial statements. The inclusion of the ILDC as a component unit in the
County’s basic financial statements reflects the County’s financial
accountability for this legally separate entity.
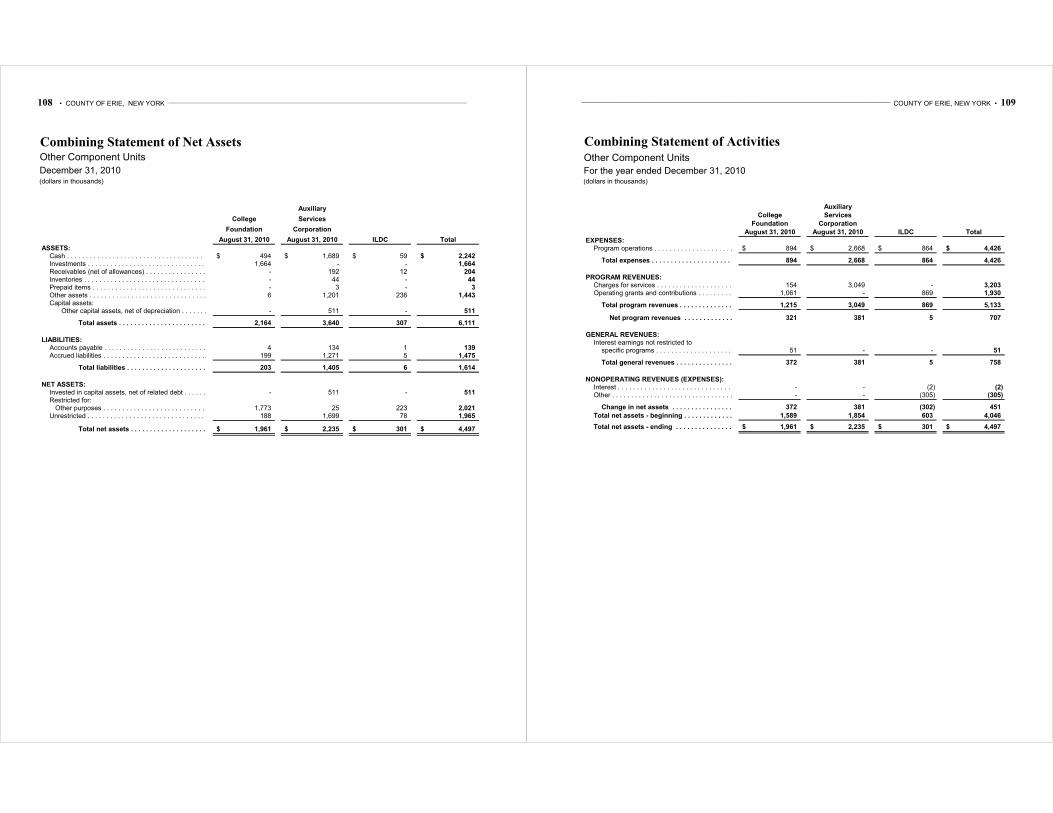
108 • COUNTY OF ERIE, NEW YORK ________________________________________________________________________________________________________________________________
Combining Statement of Net AssetsOther Component Units
December 31, 2010(dollars in thousands)
Auxiliary
College Services
Foundation Corporation
August 31, 2010 August 31, 2010 ILDC Total
ASSETS:Cash . . . . . . . . . . . . . . . . . . . . . . . . . . . . . . . . . . . . x 494$ 1,689$ 59$ 2,242$ Investments . . . . . . . . . . . . . . . . . . . . . . . . . . . . . . . . . . . .x 1,664 - - 1,664 Receivables (net of allowances) . . . . . . . . . . . . . . . . . . . . . . . . . . . . . . . . . . . .x - 192 12 204 Inventories . . . . . . . . . . . . . . . . . . . . . . . . . . . . . . . . . . . .x - 44 - 44 Prepaid items . . . . . . . . . . . . . . . . . . . . . . . . . . . . . . . . . . . .x - 3 - 3 Other assets . . . . . . . . . . . . . . . . . . . . . . . . . . . . . . . . . . . .x 6 1,201 236 1,443 Capital assets: x
Other capital assets, net of depreciation . . . . . . . . . . . . . . . . . . . . . . . . . . . . . . . . . . . .x - 511 - 511 x
Total assets . . . . . . . . . . . . . . . . . . . . . . . . . . . . . . . . . . . .x 2,164 3,640 307 6,111
x
LIABILITIES: xAccounts payable . . . . . . . . . . . . . . . . . . . . . . . . . . . . . . . . . . . .x 4 134 1 139 Accrued liabilities . . . . . . . . . . . . . . . . . . . . . . . . . . . . . . . . . . . .x 199 1,271 5 1,475
x
Total liabilities . . . . . . . . . . . . . . . . . . . . . . . . . . . . . . . . . . . .x 203 1,405 6 1,614
x
NET ASSETS: xInvested in capital assets, net of related debt . . . . . . . . . . . . . . . . . . . . . . . . . . . . . . . . . . . .x - 511 - 511 Restricted for: x Other purposes . . . . . . . . . . . . . . . . . . . . . . . . . . . . . . . . . . . .x 1,773 25 223 2,021 Unrestricted . . . . . . . . . . . . . . . . . . . . . . . . . . . . . . . . . . . .x 188 1,699 78 1,965
x
Total net assets . . . . . . . . . . . . . . . . . . . . . . . . . . . . . . . . . . . .x 1,961$ 2,235$ 301$ 4,497$
______________________________________________________________________________________________________ COUNTY OF ERIE, NEW YORK • 109
Combining Statement of Activities
Other Component Units
For the year ended December 31, 2010(dollars in thousands)
Auxiliary
College Services
Foundation Corporation
August 31, 2010 August 31, 2010 ILDC Total
EXPENSES:Program operations . . . . . . . . . . . . . . . . . . . . . . . . . . . . . . . . . . . .x 894$ 2,668$ 864$ 4,426$
x
Total expenses . . . . . . . . . . . . . . . . . . . . . . . . . . . . . . . . . . . .x 894 2,668 864 4,426
x
PROGRAM REVENUES: xCharges for services . . . . . . . . . . . . . . . . . . . . . . . . . . . . . . . . . . . .x 154 3,049 - 3,203 Operating grants and contributions . . . . . . . . . . . . . . . . . . . . . . . . . . . . . . . . . . . .x 1,061 - 869 1,930
x
Total program revenues . . . . . . . . . . . . . . . . . . . . . . . . . . . . . . . . . . . .x 1,215 3,049 869 5,133 x
Net program revenues . . . . . . . . . . . . . . . . . . . . . . . . . . . . . . . . . . . .x 321 381 5 707
x
GENERAL REVENUES: xInterest earnings not restricted to x specific programs . . . . . . . . . . . . . . . . . . . . . . . . . . . . . . . . . . . .x 51 - - 51
x
Total general revenues . . . . . . . . . . . . . . . . . . . . . . . . . . . . . . . . . . . .x 372 381 5 758
x
NONOPERATING REVENUES (EXPENSES): xInterest . . . . . . . . . . . . . . . . . . . . . . . . . . . . . . . . . . . .x - - (2) (2) Other . . . . . . . . . . . . . . . . . . . . . . . . . . . . . . . . . . . .x - - (305) (305)
x
Change in net assets . . . . . . . . . . . . . . . . . . . . . . . . . . . . . . . . . . . .x 372 381 (302) 451
Total net assets - beginning . . . . . . . . . . . . . . . . . . . . . . . . . . . . . . . . . . . .x 1,589 1,854 603 4,046 x
Total net assets - ending . . . . . . . . . . . . . . . . . . . . . . . . . . . . . . . . . . . .x 1,961$ 2,235$ 301$ 4,497$

110 • COUNTY OF ERIE, NEW YORK ________________________________________________________________________________________________________________________________
______________________________________________________________________________________________________ COUNTY OF ERIE, NEW YORK • 111
STATISTICAL SECTION
This part of Erie County’s comprehensive annual financial report presents detailed
information as a context for understanding what the information in the financial statements,
note disclosures, and required supplementary information says about the County’s overall
financial health.
Contents Page
Financial Trends..................................................................................................112
These schedules contain trend information to help the reader understand
how the County’s financial performance and well-being have changed over
time.
Revenue Capacity................................................................................................122
These schedules contain information to help the reader assess two of the County’s most
significant revenue sources; sales and use taxes and property taxes.
Debt Capacity .....................................................................................................130
These schedules present information to help the reader assess the
affordability of the County’s current levels of outstanding debt and the
County’s ability to issue additional debt in the future.
Demographic and Economic Information ..........................................................137
These schedules offer demographic and economic indicators to help the
reader understand the environment within which the County’s financial
activities take place.
Operating Information.........................................................................................138
These schedules contain service and infrastructure data to help the reader
understand how the information in the County’s financial report relates to
the services the County provides and the activities it performs.
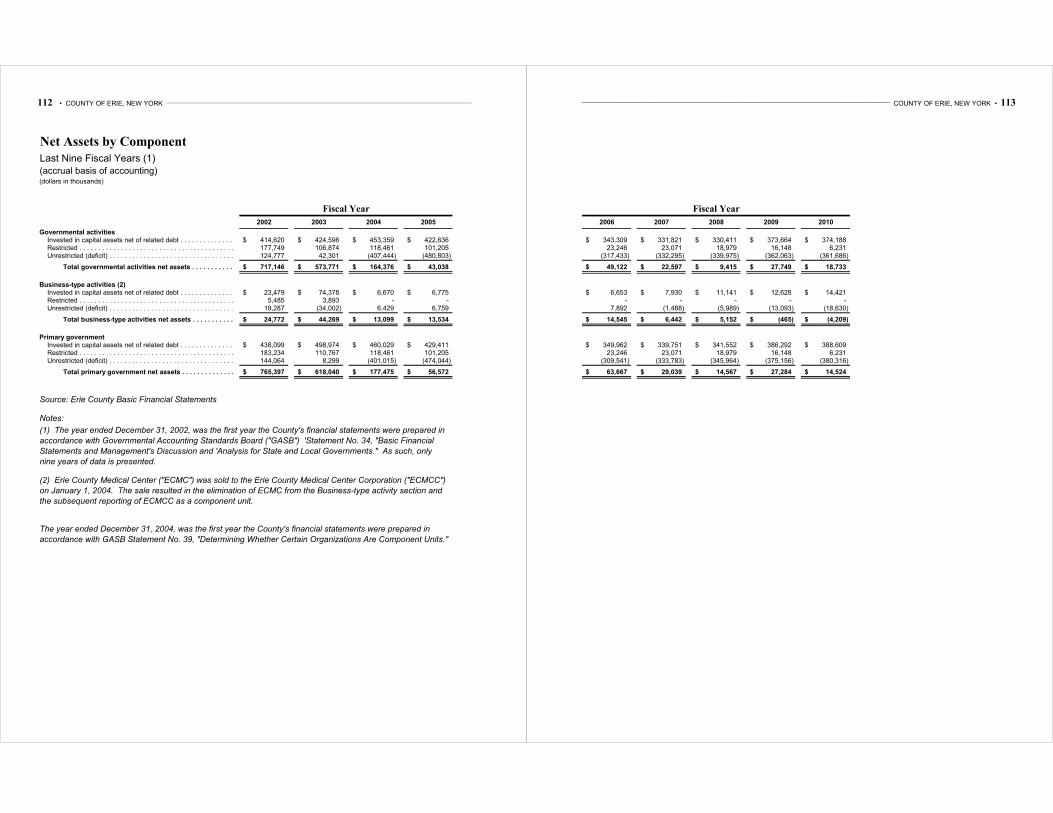
112 • COUNTY OF ERIE, NEW YORK ___________________________________________________________________________________________________________________________________
Net Assets by Component
Last Nine Fiscal Years (1)(accrual basis of accounting)(dollars in thousands)
2002 2003 2004 2005
Governmental activitiesInvested in capital assets net of related debt . . . . . . . . . . . . . . . . . . . . . . . . . . . . . . . . . . . . . . . . 414,620$ 424,596$ 453,359$ 422,636$ Restricted . . . . . . . . . . . . . . . . . . . . . . . . . . . . . . . . . . . . . . . . . . . . . . . . . . . . . . . . . . 177,749 106,874 118,461 101,205 Unrestricted (deficit) . . . . . . . . . . . . . . . . . . . . . . . . . . . . . . . . . . . . . . . . . . . . . . . . . . . . 124,777 42,301 (407,444) (480,803)
Total governmental activities net assets . . . . . . . . . . . . . . . . . . . . . . . . . . . . . . . . . . . . . . . . . . . 717,146$ 573,771$ 164,376$ 43,038$
Business-type activities (2) Invested in capital assets net of related debt . . . . . . . . . . . . . . . . . . . . . . . . . . . . . . . . . . . . . . . . 23,479$ 74,378$ 6,670$ 6,775$ Restricted . . . . . . . . . . . . . . . . . . . . . . . . . . . . . . . . . . . . . . . . . . . . . . . . . . . . . . . . . . 5,485 3,893 - - Unrestricted (deficit) . . . . . . . . . . . . . . . . . . . . . . . . . . . . . . . . . . . . . . . . . . . . . . . . . . . . 19,287 (34,002) 6,429 6,759
Total business-type activities net assets . . . . . . . . . . . . . . . . . . . . . . . . . . . . . . . . . . . . . . . . . . 24,772$ 44,269$ 13,099$ 13,534$
Primary government Invested in capital assets net of related debt . . . . . . . . . . . . . . . . . . . . . . . . . . . . . . . . . . . . . . . . 438,099$ 498,974$ 460,029$ 429,411$ Restricted . . . . . . . . . . . . . . . . . . . . . . . . . . . . . . . . . . . . . . . . . . . . . . . . . . . . . . . . . . 183,234 110,767 118,461 101,205 Unrestricted (deficit) . . . . . . . . . . . . . . . . . . . . . . . . . . . . . . . . . . . . . . . . . . . . . . . . . . . . 144,064 8,299 (401,015) (474,044)
Total primary government net assets . . . . . . . . . . . . . . . . . . . . . . . . . . . . . . . . . . . . . . . . . . . . . 765,397$ 618,040$ 177,475$ 56,572$
Source: Erie County Basic Financial Statements
Notes:
The year ended December 31, 2004, was the first year the County's financial statements were prepared in
accordance with GASB Statement No. 39, "Determining Whether Certain Organizations Are Component Units."
Fiscal Year
(1) The year ended December 31, 2002, was the first year the County's financial statements were prepared in
accordance with Governmental Accounting Standards Board ("GASB") 'Statement No. 34, "Basic Financial
Statements and Management's Discussion and 'Analysis for State and Local Governments." As such, only
nine years of data is presented.
(2) Erie County Medical Center ("ECMC") was sold to the Erie County Medical Center Corporation ("ECMCC")
on January 1, 2004. The sale resulted in the elimination of ECMC from the Business-type activity section and
the subsequent reporting of ECMCC as a component unit.
______________________________________________________________________________________________________ COUNTY OF ERIE, NEW YORK • 113
2006 2007 2008 2009 2010
343,309$ 331,821$ 330,411$ 373,664$ 374,188$ 23,246 23,071 18,979 16,148 6,231
(317,433) (332,295) (339,975) (362,063) (361,686)
49,122$ 22,597$ 9,415$ 27,749$ 18,733$
6,653$ 7,930$ 11,141$ 12,628$ 14,421$ - - - - -
7,892 (1,488) (5,989) (13,093) (18,630)
14,545$ 6,442$ 5,152$ (465)$ (4,209)$
349,962$ 339,751$ 341,552$ 386,292$ 388,609$ 23,246 23,071 18,979 16,148 6,231
(309,541) (333,783) (345,964) (375,156) (380,316)
63,667$ 29,039$ 14,567$ 27,284$ 14,524$
Fiscal Year
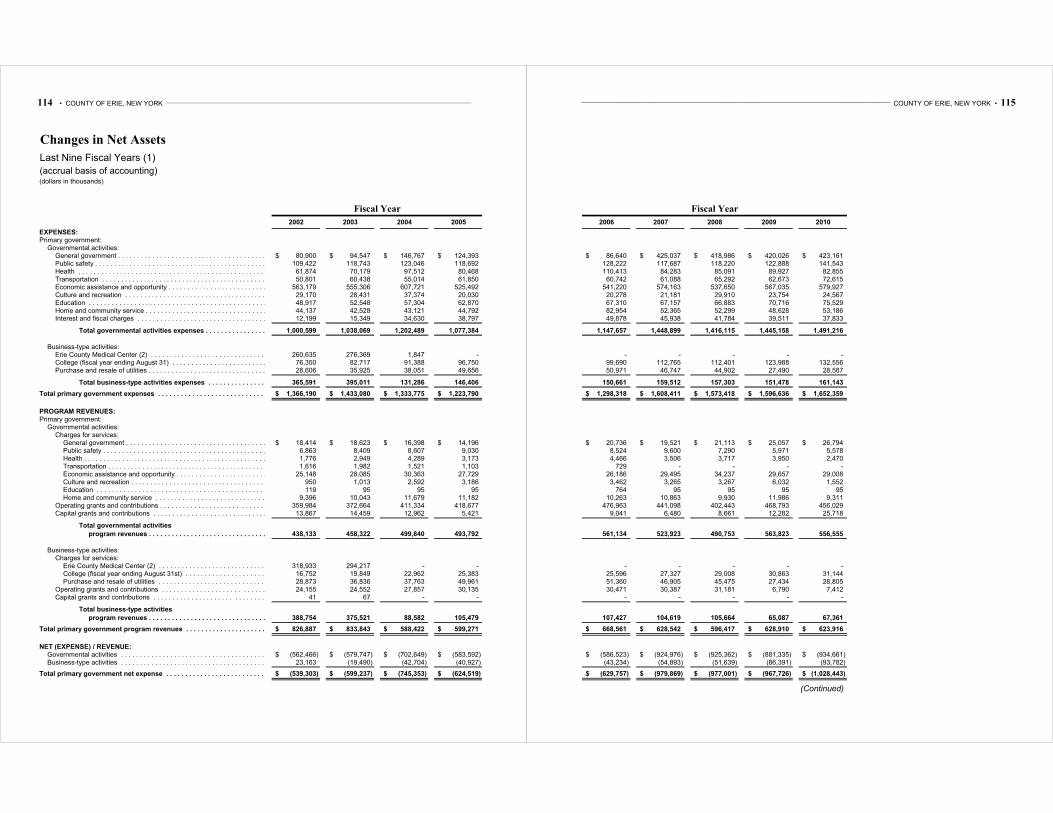
114 • COUNTY OF ERIE, NEW YORK ___________________________________________________________________________________________________________________________________
Changes in Net Assets
Last Nine Fiscal Years (1)
(accrual basis of accounting)(dollars in thousands)
2002 2003 2004 2005
EXPENSES: Primary government:
Governmental activities: General government . . . . . . . . . . . . . . . . . . . . . . . . . . . . . . . . . . . . . . . . . . . . . . . . . . . . . . 80,900$ 94,547$ 146,767$ 124,393$ Public safety . . . . . . . . . . . . . . . . . . . . . . . . . . . . . . . . . . . . . . . . . . . . . . . . . . . . . . . . . 109,422 118,743 123,046 118,692 Health . . . . . . . . . . . . . . . . . . . . . . . . . . . . . . . . . . . . . . . . . . . . . . . . . . . . . . . . . . . . 61,874 70,179 97,512 80,468 Transportation . . . . . . . . . . . . . . . . . . . . . . . . . . . . . . . . . . . . . . . . . . . . . . . . . . . . . . . . 50,801 60,438 55,014 61,850 Economic assistance and opportunity . . . . . . . . . . . . . . . . . . . . . . . . . . . . . . . . . . . . . . . . . . . . . . 563,179 555,306 607,721 525,492 Culture and recreation . . . . . . . . . . . . . . . . . . . . . . . . . . . . . . . . . . . . . . . . . . . . . . . . . . . . 29,170 28,431 37,374 20,030 Education . . . . . . . . . . . . . . . . . . . . . . . . . . . . . . . . . . . . . . . . . . . . . . . . . . . . . . . . . . 48,917 52,548 57,304 62,870 Home and community service . . . . . . . . . . . . . . . . . . . . . . . . . . . . . . . . . . . . . . . . . . . . . . . . . . 44,137 42,528 43,121 44,792 Interest and fiscal charges . . . . . . . . . . . . . . . . . . . . . . . . . . . . . . . . . . . . . . . . . . . . . . . . . 12,199 15,349 34,630 38,797
Total governmental activities expenses . . . . . . . . . . . . . . . . . . . . . . . . . . . . . . . . . . . . . . . . . . . . 1,000,599 1,038,069 1,202,489 1,077,384
Business-type activities:
Erie County Medical Center (2) . . . . . . . . . . . . . . . . . . . . . . . . . . . . . . . . . . . . . . . . . . . . . . . . 260,635 276,369 1,847 - College (fiscal year ending August 31) . . . . . . . . . . . . . . . . . . . . . . . . . . . . . . . . . . . . . . . . . . . . 76,350 82,717 91,388 96,750 Purchase and resale of utilities . . . . . . . . . . . . . . . . . . . . . . . . . . . . . . . . . . . . . . . . . . . . . . . 28,606 35,925 38,051 49,656
Total business-type activities expenses . . . . . . . . . . . . . . . . . . . . . . . . . . . . . . . . . . . . . . . . . . . 365,591 395,011 131,286 146,406
Total primary government expenses . . . . . . . . . . . . . . . . . . . . . . . . . . . . . . . . . . . . . . . . . . . . . . 1,366,190$ 1,433,080$ 1,333,775$ 1,223,790$
PROGRAM REVENUES: Primary government:
Governmental activities: Charges for services:
General government . . . . . . . . . . . . . . . . . . . . . . . . . . . . . . . . . . . . . . . . . . . . . . . . . . . . . . 18,414$ 18,623$ 16,398$ 14,196$ Public safety . . . . . . . . . . . . . . . . . . . . . . . . . . . . . . . . . . . . . . . . . . . . . . . . . . . . . . . . . 6,863 8,409 8,607 9,030 Health . . . . . . . . . . . . . . . . . . . . . . . . . . . . . . . . . . . . . . . . . . . . . . . . . . . . . . . . . . . . 1,776 2,949 4,289 3,173 Transportation . . . . . . . . . . . . . . . . . . . . . . . . . . . . . . . . . . . . . . . . . . . . . . . . . . . . . . . . 1,616 1,982 1,521 1,103 Economic assistance and opportunity . . . . . . . . . . . . . . . . . . . . . . . . . . . . . . . . . . . . . . . . . . . . . . 25,148 28,085 30,363 27,729 Culture and recreation . . . . . . . . . . . . . . . . . . . . . . . . . . . . . . . . . . . . . . . . . . . . . . . . . . . . 950 1,013 2,592 3,186 Education . . . . . . . . . . . . . . . . . . . . . . . . . . . . . . . . . . . . . . . . . . . . . . . . . . . . . . . . . . 119 95 95 95 Home and community service . . . . . . . . . . . . . . . . . . . . . . . . . . . . . . . . . . . . . . . . . . . . . . . . . . 9,396 10,043 11,679 11,182
Operating grants and contributions . . . . . . . . . . . . . . . . . . . . . . . . . . . . . . . . . . . . . . . . . . . . . . 359,984 372,664 411,334 418,677 Capital grants and contributions . . . . . . . . . . . . . . . . . . . . . . . . . . . . . . . . . . . . . . . . . . . . . . . 13,867 14,459 12,962 5,421
Total governmental activities
program revenues . . . . . . . . . . . . . . . . . . . . . . . . . . . . . . . . . . . . . . . . . . . . . . . . . . . . . 438,133 458,322 499,840 493,792
Business-type activities:
Charges for services: Erie County Medical Center (2) . . . . . . . . . . . . . . . . . . . . . . . . . . . . . . . . . . . . . . . . . . . . . . . . 318,933 294,217 - - College (fiscal year ending August 31st) . . . . . . . . . . . . . . . . . . . . . . . . . . . . . . . . . . . . . . . . . . . 16,752 19,849 22,962 25,383 Purchase and resale of utilities . . . . . . . . . . . . . . . . . . . . . . . . . . . . . . . . . . . . . . . . . . . . . . . 28,873 36,836 37,763 49,961
Operating grants and contributions . . . . . . . . . . . . . . . . . . . . . . . . . . . . . . . . . . . . . . . . . . . . . 24,155 24,552 27,857 30,135 Capital grants and contributions . . . . . . . . . . . . . . . . . . . . . . . . . . . . . . . . . . . . . . . . . . . . . . 41 67 - -
Total business-type activities
program revenues . . . . . . . . . . . . . . . . . . . . . . . . . . . . . . . . . . . . . . . . . . . . . . . . . . . . . 388,754 375,521 88,582 105,479
Total primary government program revenues . . . . . . . . . . . . . . . . . . . . . . . . . . . . . . . . . . . . . . . . . . 826,887$ 833,843$ 588,422$ 599,271$
NET (EXPENSE) / REVENUE: Governmental activities . . . . . . . . . . . . . . . . . . . . . . . . . . . . . . . . . . . . . . . . . . . . . . . . . . . (562,466)$ (579,747)$ (702,649)$ (583,592)$ Business-type activities . . . . . . . . . . . . . . . . . . . . . . . . . . . . . . . . . . . . . . . . . . . . . . . . . . . 23,163 (19,490) (42,704) (40,927)
Total primary government net expense . . . . . . . . . . . . . . . . . . . . . . . . . . . . . . . . . . . . . . . . . . . . . (539,303)$ (599,237)$ (745,353)$ (624,519)$
Fiscal Year
______________________________________________________________________________________________________ COUNTY OF ERIE, NEW YORK • 115
2006 2007 2008 2009 2010
86,640$ 425,037$ 418,986$ 420,026$ 423,161$ 128,222 117,687 118,220 122,888 141,543 110,413 84,283 85,091 89,927 82,855 60,742 61,088 65,292 62,673 72,615
541,220 574,163 537,650 567,035 579,927 20,278 21,181 29,910 23,754 24,567 67,310 67,157 66,883 70,716 75,529 82,954 52,365 52,299 48,628 53,186 49,878 45,938 41,784 39,511 37,833
1,147,657 1,448,899 1,416,115 1,445,158 1,491,216
- - - - - 99,690 112,765 112,401 123,988 132,556 50,971 46,747 44,902 27,490 28,587
150,661 159,512 157,303 151,478 161,143
1,298,318$ 1,608,411$ 1,573,418$ 1,596,636$ 1,652,359$
20,736$ 19,521$ 21,113$ 25,057$ 26,794$ 8,524 9,600 7,290 5,971 5,578 4,466 3,506 3,717 3,950 2,470
729 - - - - 26,186 29,495 34,237 29,657 29,008 3,462 3,265 3,267 6,032 1,552
764 95 95 95 95 10,263 10,863 9,930 11,986 9,311
476,963 441,098 402,443 468,793 456,029 9,041 6,480 8,661 12,282 25,718
561,134 523,923 490,753 563,823 556,555
- - - - - 25,596 27,327 29,008 30,863 31,144 51,360 46,905 45,475 27,434 28,805 30,471 30,387 31,181 6,790 7,412
- - - - -
107,427 104,619 105,664 65,087 67,361
668,561$ 628,542$ 596,417$ 628,910$ 623,916$
(586,523)$ (924,976)$ (925,362)$ (881,335)$ (934,661)$ (43,234) (54,893) (51,639) (86,391) (93,782)
(629,757)$ (979,869)$ (977,001)$ (967,726)$ (1,028,443)$
(Continued)
Fiscal Year
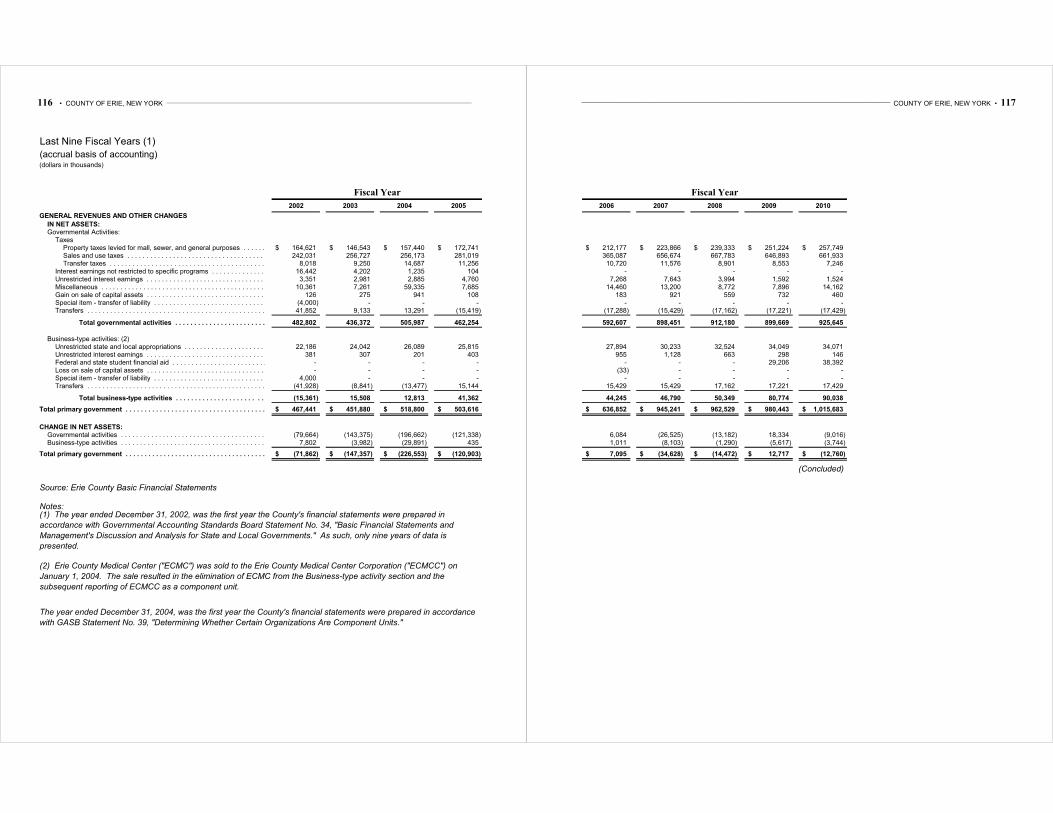
116 • COUNTY OF ERIE, NEW YORK ___________________________________________________________________________________________________________________________________
Last Nine Fiscal Years (1)
(accrual basis of accounting)
(dollars in thousands)
2002 2003 2004 2005
GENERAL REVENUES AND OTHER CHANGES
IN NET ASSETS: Governmental Activities:
Taxes Property taxes levied for mall, sewer, and general purposes . . . . . . . . . . . . . . . . . . . . . . . . . . . . . . . . . 164,621$ 146,543$ 157,440$ 172,741$ Sales and use taxes . . . . . . . . . . . . . . . . . . . . . . . . . . . . . . . . . . . . . . . . . . . . . . . . . . . . . 242,031 256,727 256,173 281,019 Transfer taxes . . . . . . . . . . . . . . . . . . . . . . . . . . . . . . . . . . . . . . . . . . . . . . . . . . . . . . . . 8,018 9,250 14,687 11,256
Interest earnings not restricted to specific programs . . . . . . . . . . . . . . . . . . . . . . . . . . . . . . . . . . . . 16,442 4,202 1,235 104 Unrestricted interest earnings . . . . . . . . . . . . . . . . . . . . . . . . . . . . . . . . . . . . . . . . . . . . . . . . 3,351 2,981 2,885 4,760 Miscellaneous . . . . . . . . . . . . . . . . . . . . . . . . . . . . . . . . . . . . . . . . . . . . . . . . . . . . . . . . 10,361 7,261 59,335 7,685 Gain on sale of capital assets . . . . . . . . . . . . . . . . . . . . . . . . . . . . . . . . . . . . . . . . . . . . . . . . 126 275 941 108 Special item - transfer of liability . . . . . . . . . . . . . . . . . . . . . . . . . . . . . . . . . . . . . . . . . . . . . (4,000) - - - Transfers . . . . . . . . . . . . . . . . . . . . . . . . . . . . . . . . . . . . . . . . . . . . . . . . . . . . . . . . . . 41,852 9,133 13,291 (15,419)
Total governmental activities . . . . . . . . . . . . . . . . . . . . . . . . . . . . . . . . . . . . . . . . . . . . . . . . 482,802 436,372 505,987 462,254
Business-type activities: (2)
Unrestricted state and local appropriations . . . . . . . . . . . . . . . . . . . . . . . . . . . . . . . . . . . . . . . . . 22,186 24,042 26,089 25,815 Unrestricted interest earnings . . . . . . . . . . . . . . . . . . . . . . . . . . . . . . . . . . . . . . . . . . . . . . . . 381 307 201 403 Federal and state student financial aid . . . . . . . . . . . . . . . . . . . . . . . . . . . . . . . . . . . . . . . . . . . - - - - Loss on sale of capital assets . . . . . . . . . . . . . . . . . . . . . . . . . . . . . . . . . . . . . . . . . . . . . . . . - - - - Special item - transfer of liability . . . . . . . . . . . . . . . . . . . . . . . . . . . . . . . . . . . . . . . . . . . . . 4,000 - - - Transfers . . . . . . . . . . . . . . . . . . . . . . . . . . . . . . . . . . . . . . . . . . . . . . . . . . . . . . . . . . (41,928) (8,841) (13,477) 15,144
Total business-type activities . . . . . . . . . . . . . . . . . . . . . . . . . . . . . . . . . . . . . . . . . . . . . . . (15,361) 15,508 12,813 41,362
Total primary government . . . . . . . . . . . . . . . . . . . . . . . . . . . . . . . . . . . . . . . . . . . . . . . . . . . 467,441$ 451,880$ 518,800$ 503,616$
CHANGE IN NET ASSETS: Governmental activities . . . . . . . . . . . . . . . . . . . . . . . . . . . . . . . . . . . . . . . . . . . . . . . . . . . (79,664) (143,375) (196,662) (121,338) Business-type activities . . . . . . . . . . . . . . . . . . . . . . . . . . . . . . . . . . . . . . . . . . . . . . . . . . . 7,802 (3,982) (29,891) 435
Total primary government . . . . . . . . . . . . . . . . . . . . . . . . . . . . . . . . . . . . . . . . . . . . . . . . . . . (71,862)$ (147,357)$ (226,553)$ (120,903)$
Source: Erie County Basic Financial Statements
Notes:
The year ended December 31, 2004, was the first year the County's financial statements were prepared in accordance
with GASB Statement No. 39, "Determining Whether Certain Organizations Are Component Units."
Fiscal Year
(1) The year ended December 31, 2002, was the first year the County's financial statements were prepared in
accordance with Governmental Accounting Standards Board Statement No. 34, "Basic Financial Statements and
Management's Discussion and Analysis for State and Local Governments." As such, only nine years of data is
presented.
(2) Erie County Medical Center ("ECMC") was sold to the Erie County Medical Center Corporation ("ECMCC") on
January 1, 2004. The sale resulted in the elimination of ECMC from the Business-type activity section and the
subsequent reporting of ECMCC as a component unit.
______________________________________________________________________________________________________ COUNTY OF ERIE, NEW YORK • 117
2006 2007 2008 2009 2010
212,177$ 223,866$ 239,333$ 251,224$ 257,749$ 365,087 656,674 667,783 646,893 661,933 10,720 11,576 8,901 8,553 7,246
- - - - - 7,268 7,643 3,994 1,592 1,524
14,460 13,200 8,772 7,896 14,162 183 921 559 732 460
- - - - - (17,288) (15,429) (17,162) (17,221) (17,429)
592,607 898,451 912,180 899,669 925,645
27,894 30,233 32,524 34,049 34,071 955 1,128 663 298 146
- - - 29,206 38,392 (33) - - - -
- - - - - 15,429 15,429 17,162 17,221 17,429
44,245 46,790 50,349 80,774 90,038
636,852$ 945,241$ 962,529$ 980,443$ 1,015,683$
6,084 (26,525) (13,182) 18,334 (9,016) 1,011 (8,103) (1,290) (5,617) (3,744)
7,095$ (34,628)$ (14,472)$ 12,717$ (12,760)$
(Concluded)
Fiscal Year
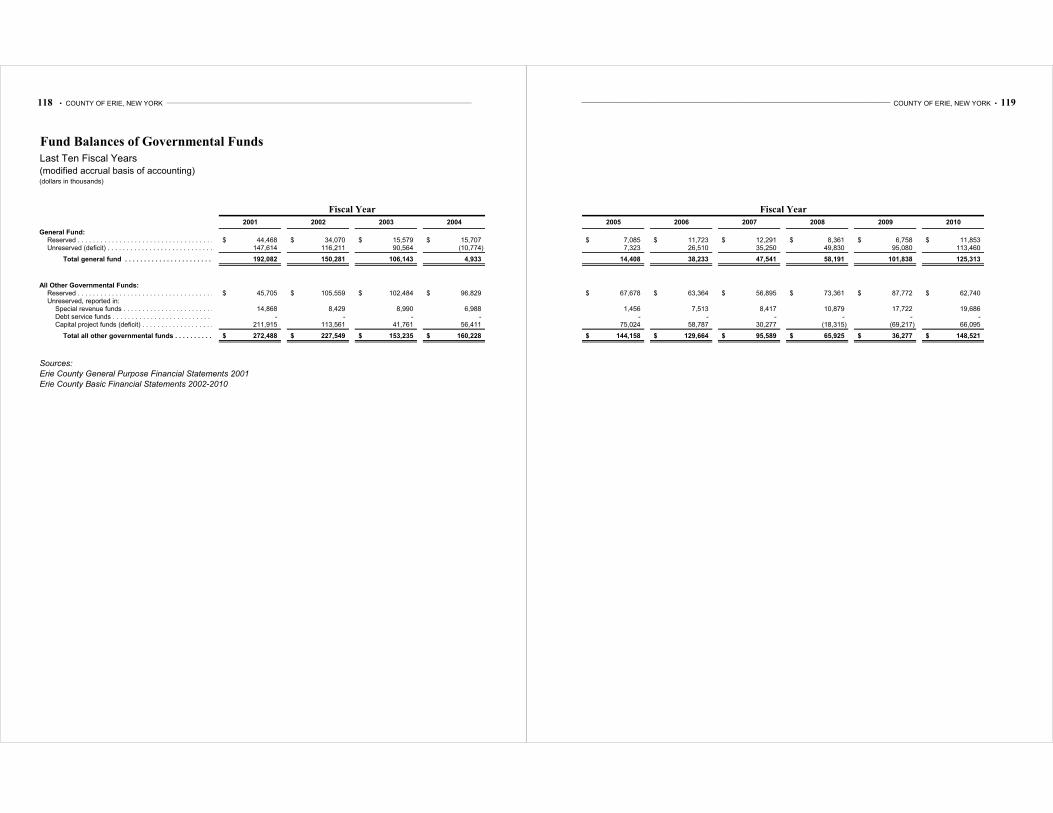
118 • COUNTY OF ERIE, NEW YORK ___________________________________________________________________________________________________________________________________
Fund Balances of Governmental Funds
Last Ten Fiscal Years(modified accrual basis of accounting)(dollars in thousands)
2001 2002 2003 2004
General Fund: Reserved . . . . . . . . . . . . . . . . . . . . . . . . . . . . . . . . . . . . . . . . . . . . . . . . . . . . . . . . . . . 44,468$ 34,070$ 15,579$ 15,707$ Unreserved (deficit) . . . . . . . . . . . . . . . . . . . . . . . . . . . . . . . . . . . . . . . . . . . . . . . . . . . . . 147,614 116,211 90,564 (10,774)
Total general fund . . . . . . . . . . . . . . . . . . . . . . . . . . . . . . . . . . . . . . . . . . . . . . . . . . . . . . 192,082 150,281 106,143 4,933
All Other Governmental Funds: Reserved . . . . . . . . . . . . . . . . . . . . . . . . . . . . . . . . . . . . . . . . . . . . . . . . . . . . . . . . . . . 45,705$ 105,559$ 102,484$ 96,829$ Unreserved, reported in:
Special revenue funds . . . . . . . . . . . . . . . . . . . . . . . . . . . . . . . . . . . . . . . . . . . . . . . . . . . . . 14,868 8,429 8,990 6,988 Debt service funds . . . . . . . . . . . . . . . . . . . . . . . . . . . . . . . . . . . . . . . . . . . . . . . . . . . . . . - - - - Capital project funds (deficit) . . . . . . . . . . . . . . . . . . . . . . . . . . . . . . . . . . . . . . . . . . . . . . . . 211,915 113,561 41,761 56,411
Total all other governmental funds . . . . . . . . . . . . . . . . . . . . . . . . . . . . . . . . . . . . . . . . . . . . . . 272,488$ 227,549$ 153,235$ 160,228$
Sources:
Erie County General Purpose Financial Statements 2001
Erie County Basic Financial Statements 2002-2010
Fiscal Year
______________________________________________________________________________________________________ COUNTY OF ERIE, NEW YORK • 119
2005 2006 2007 2008 2009 2010
7,085$ 11,723$ 12,291$ 8,361$ 6,758$ 11,853$ 7,323 26,510 35,250 49,830 95,080 113,460
14,408 38,233 47,541 58,191 101,838 125,313
67,678$ 63,364$ 56,895$ 73,361$ 87,772$ 62,740$
1,456 7,513 8,417 10,879 17,722 19,686 - - - - - -
75,024 58,787 30,277 (18,315) (69,217) 66,095
144,158$ 129,664$ 95,589$ 65,925$ 36,277$ 148,521$
Fiscal Year
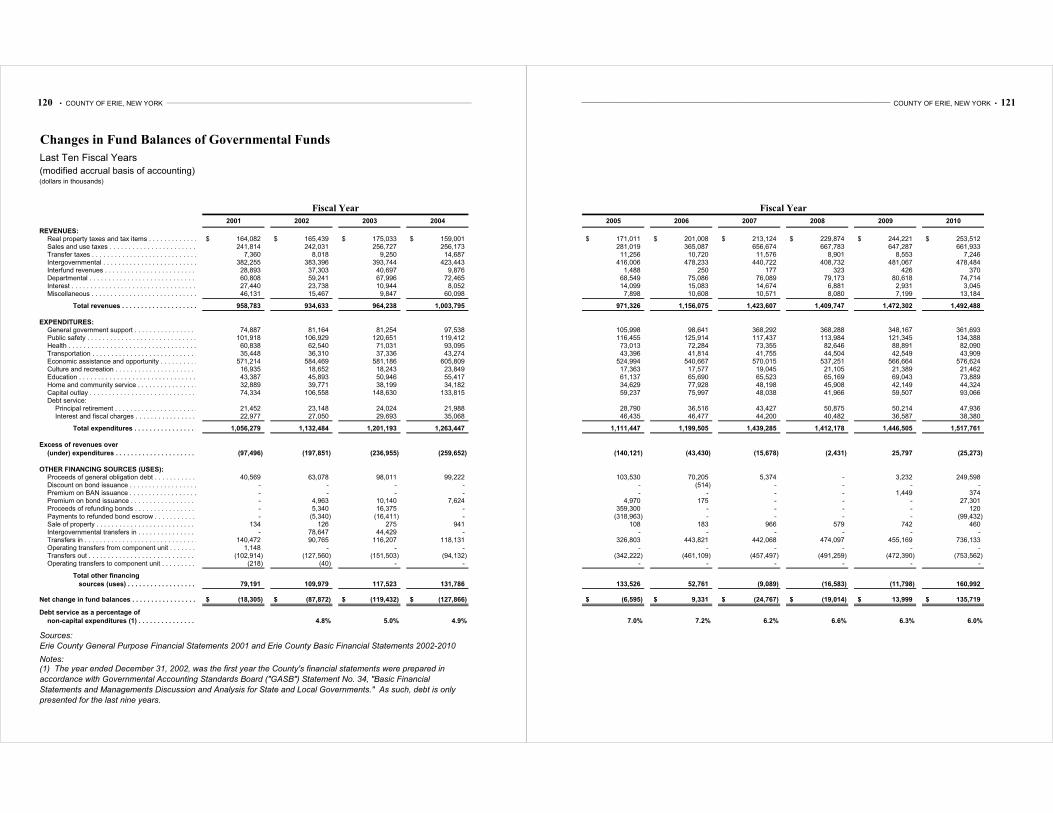
120 • COUNTY OF ERIE, NEW YORK ___________________________________________________________________________________________________________________________________
Changes in Fund Balances of Governmental Funds
Last Ten Fiscal Years
(modified accrual basis of accounting)(dollars in thousands)
2001 2002 2003 2004
REVENUES: Real property taxes and tax items . . . . . . . . . . . . . . . . . . . . . . . . . . . . . . . . . . . . . . . . . . . . . . . 164,082$ 165,439$ 175,033$ 159,001$ Sales and use taxes . . . . . . . . . . . . . . . . . . . . . . . . . . . . . . . . . . . . . . . . . . . . . . . . . . . . . . 241,814 242,031 256,727 256,173 Transfer taxes . . . . . . . . . . . . . . . . . . . . . . . . . . . . . . . . . . . . . . . . . . . . . . . . . . . . . . . . 7,360 8,018 9,250 14,687 Intergovernmental . . . . . . . . . . . . . . . . . . . . . . . . . . . . . . . . . . . . . . . . . . . . . . . . . . . . . . . 382,255 383,396 393,744 423,443 Interfund revenues . . . . . . . . . . . . . . . . . . . . . . . . . . . . . . . . . . . . . . . . . . . . . . . . . . . . . . 28,893 37,303 40,697 9,876 Departmental . . . . . . . . . . . . . . . . . . . . . . . . . . . . . . . . . . . . . . . . . . . . . . . . . . . . . . . . . 60,808 59,241 67,996 72,465 Interest . . . . . . . . . . . . . . . . . . . . . . . . . . . . . . . . . . . . . . . . . . . . . . . . . . . . . . . . . . . 27,440 23,738 10,944 8,052 Miscellaneous . . . . . . . . . . . . . . . . . . . . . . . . . . . . . . . . . . . . . . . . . . . . . . . . . . . . . . . . . 46,131 15,467 9,847 60,098
Total revenues . . . . . . . . . . . . . . . . . . . . . . . . . . . . . . . . . . . . . . . . . . . . . . . . . . . . . . . . 958,783 934,633 964,238 1,003,795
EXPENDITURES: General government support . . . . . . . . . . . . . . . . . . . . . . . . . . . . . . . . . . . . . . . . . . . . . . . . . . 74,887 81,164 81,254 97,538 Public safety . . . . . . . . . . . . . . . . . . . . . . . . . . . . . . . . . . . . . . . . . . . . . . . . . . . . . . . . . 101,918 106,929 120,651 119,412 Health . . . . . . . . . . . . . . . . . . . . . . . . . . . . . . . . . . . . . . . . . . . . . . . . . . . . . . . . . . . . 60,838 62,540 71,031 93,095 Transportation . . . . . . . . . . . . . . . . . . . . . . . . . . . . . . . . . . . . . . . . . . . . . . . . . . . . . . . . 35,448 36,310 37,336 43,274 Economic assistance and opportunity . . . . . . . . . . . . . . . . . . . . . . . . . . . . . . . . . . . . . . . . . . . . . . 571,214 584,469 581,186 605,809 Culture and recreation . . . . . . . . . . . . . . . . . . . . . . . . . . . . . . . . . . . . . . . . . . . . . . . . . . . . 16,935 18,652 18,243 23,849 Education . . . . . . . . . . . . . . . . . . . . . . . . . . . . . . . . . . . . . . . . . . . . . . . . . . . . . . . . . . . 43,387 45,893 50,946 55,417 Home and community service . . . . . . . . . . . . . . . . . . . . . . . . . . . . . . . . . . . . . . . . . . . . . . . . . . 32,889 39,771 38,199 34,182 Capital outlay . . . . . . . . . . . . . . . . . . . . . . . . . . . . . . . . . . . . . . . . . . . . . . . . . . . . . . . . 74,334 106,558 148,630 133,815 Debt service:
Principal retirement . . . . . . . . . . . . . . . . . . . . . . . . . . . . . . . . . . . . . . . . . . . . . . . . . . . . . 21,452 23,148 24,024 21,988 Interest and fiscal charges . . . . . . . . . . . . . . . . . . . . . . . . . . . . . . . . . . . . . . . . . . . . . . . . . . 22,977 27,050 29,693 35,068
Total expenditures . . . . . . . . . . . . . . . . . . . . . . . . . . . . . . . . . . . . . . . . . . . . . . . . . . . . . . 1,056,279 1,132,484 1,201,193 1,263,447
Excess of revenues over
(under) expenditures . . . . . . . . . . . . . . . . . . . . . . . . . . . . . . . . . . . . . . . . . . . . . . . . . . . . . (97,496) (197,851) (236,955) (259,652)
OTHER FINANCING SOURCES (USES): Proceeds of general obligation debt . . . . . . . . . . . . . . . . . . . . . . . . . . . . . . . . . . . . . . . . . . . . . . 40,569 63,078 98,011 99,222 Discount on bond issuance . . . . . . . . . . . . . . . . . . . . . . . . . . . . . . . . . . . . . . . . . . . . . . . . . . . - - - - Premium on BAN issuance . . . . . . . . . . . . . . . . . . . . . . . . . . . . . . . . . . . . . . . . . . . . . . . . . . . . - - - - Premium on bond issuance . . . . . . . . . . . . . . . . . . . . . . . . . . . . . . . . . . . . . . . . . . . . . . . . . . . - 4,963 10,140 7,624 Proceeds of refunding bonds . . . . . . . . . . . . . . . . . . . . . . . . . . . . . . . . . . . . . . . . . . . . . . . . . . - 5,340 16,375 - Payments to refunded bond escrow . . . . . . . . . . . . . . . . . . . . . . . . . . . . . . . . . . . . . . . . . . . . . . . - (5,340) (16,411) - Sale of property . . . . . . . . . . . . . . . . . . . . . . . . . . . . . . . . . . . . . . . . . . . . . . . . . . . . . . . 134 126 275 941 Intergovernmental transfers in . . . . . . . . . . . . . . . . . . . . . . . . . . . . . . . . . . . . . . . . . . . . . . . . - 78,647 44,429 - Transfers in . . . . . . . . . . . . . . . . . . . . . . . . . . . . . . . . . . . . . . . . . . . . . . . . . . . . . . . . . 140,472 90,765 116,207 118,131 Operating transfers from component unit . . . . . . . . . . . . . . . . . . . . . . . . . . . . . . . . . . . . . . . . . . . . 1,148 - - - Transfers out . . . . . . . . . . . . . . . . . . . . . . . . . . . . . . . . . . . . . . . . . . . . . . . . . . . . . . . . . (102,914) (127,560) (151,503) (94,132) Operating transfers to component unit . . . . . . . . . . . . . . . . . . . . . . . . . . . . . . . . . . . . . . . . . . . . . (218) (40) - -
Total other financing
sources (uses) . . . . . . . . . . . . . . . . . . . . . . . . . . . . . . . . . . . . . . . . . . . . . . . . . . . . . . . 79,191 109,979 117,523 131,786
Net change in fund balances . . . . . . . . . . . . . . . . . . . . . . . . . . . . . . . . . . . . . . . . . . . . . . . . . . (18,305)$ (87,872)$ (119,432)$ (127,866)$
Debt service as a percentage of
non-capital expenditures (1) . . . . . . . . . . . . . . . . . . . . . . . . . . . . . . . . . . . . . . . . . . . . . . . . . 4.8% 5.0% 4.9%
Sources:
Erie County General Purpose Financial Statements 2001 and Erie County Basic Financial Statements 2002-2010
Notes:
Fiscal Year
(1) The year ended December 31, 2002, was the first year the County's financial statements were prepared in
accordance with Governmental Accounting Standards Board ("GASB") Statement No. 34, "Basic Financial
Statements and Managements Discussion and Analysis for State and Local Governments." As such, debt is only
presented for the last nine years.
______________________________________________________________________________________________________ COUNTY OF ERIE, NEW YORK • 121
2005 2006 2007 2008 2009 2010
171,011$ 201,008$ 213,124$ 229,874$ 244,221$ 253,512$ 281,019 365,087 656,674 667,783 647,287 661,933 11,256 10,720 11,576 8,901 8,553 7,246
416,006 478,233 440,722 408,732 481,067 478,484 1,488 250 177 323 426 370
68,549 75,086 76,089 79,173 80,618 74,714 14,099 15,083 14,674 6,881 2,931 3,045 7,898 10,608 10,571 8,080 7,199 13,184
971,326 1,156,075 1,423,607 1,409,747 1,472,302 1,492,488
105,998 98,641 368,292 368,288 348,167 361,693 116,455 125,914 117,437 113,984 121,345 134,388 73,013 72,284 73,355 82,646 88,891 82,090 43,396 41,814 41,755 44,504 42,549 43,909
524,994 540,667 570,015 537,251 566,664 576,624 17,363 17,577 19,045 21,105 21,389 21,462 61,137 65,690 65,523 65,169 69,043 73,889 34,629 77,928 48,198 45,908 42,149 44,324 59,237 75,997 48,038 41,966 59,507 93,066
28,790 36,516 43,427 50,875 50,214 47,936 46,435 46,477 44,200 40,482 36,587 38,380
1,111,447 1,199,505 1,439,285 1,412,178 1,446,505 1,517,761
(140,121) (43,430) (15,678) (2,431) 25,797 (25,273)
103,530 70,205 5,374 - 3,232 249,598 - (514) - - - - - - - - 1,449 374
4,970 175 - - - 27,301 359,300 - - - - 120
(318,963) - - - - (99,432) 108 183 966 579 742 460
- - - - - - 326,803 443,821 442,068 474,097 455,169 736,133
- - - - - - (342,222) (461,109) (457,497) (491,259) (472,390) (753,562)
- - - - - -
133,526 52,761 (9,089) (16,583) (11,798) 160,992
(6,595)$ 9,331$ (24,767)$ (19,014)$ 13,999$ 135,719$
7.0% 7.2% 6.2% 6.6% 6.3% 6.0%
Fiscal Year
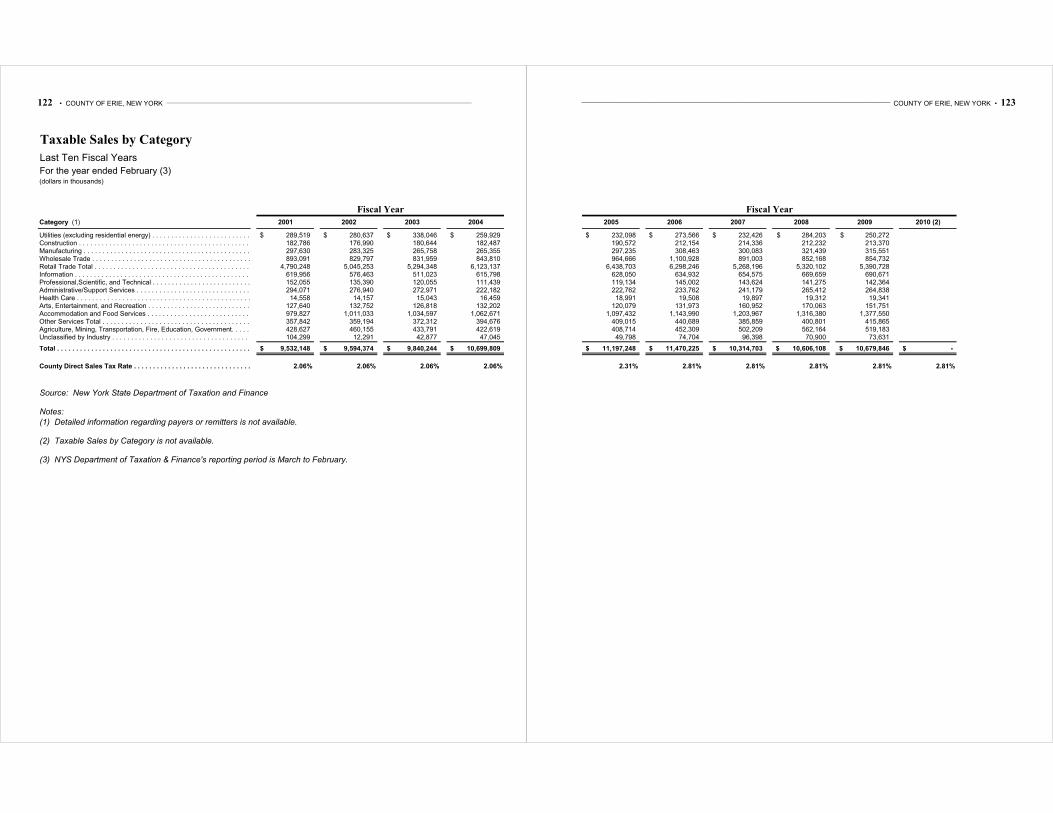
122 • COUNTY OF ERIE, NEW YORK ___________________________________________________________________________________________________________________________________
Taxable Sales by Category
Last Ten Fiscal Years
For the year ended February (3)(dollars in thousands)
Category (1) 2001 2002 2003 2004
Utilities (excluding residential energy) . . . . . . . . . . . . . . . . . . . . . . . . . . . . . . . . . . . . . . . . . . . 289,519$ 280,637$ 338,046$ 259,929$ Construction . . . . . . . . . . . . . . . . . . . . . . . . . . . . . . . . . . . . . . . . . . . . . . . . . . . . . . . . . 182,786 176,990 180,644 182,487 Manufacturing . . . . . . . . . . . . . . . . . . . . . . . . . . . . . . . . . . . . . . . . . . . . . . . . . . . . . . . . . 297,630 283,325 265,758 265,355 Wholesale Trade . . . . . . . . . . . . . . . . . . . . . . . . . . . . . . . . . . . . . . . . . . . . . . . . . . . . . . . . 893,091 829,797 831,959 843,810 Retail Trade Total . . . . . . . . . . . . . . . . . . . . . . . . . . . . . . . . . . . . . . . . . . . . . . . . . . . . . . 4,790,248 5,045,253 5,294,348 6,123,137 Information . . . . . . . . . . . . . . . . . . . . . . . . . . . . . . . . . . . . . . . . . . . . . . . . . . . . . . . . . . 619,956 576,463 511,023 615,798 Professional,Scientific, and Technical . . . . . . . . . . . . . . . . . . . . . . . . . . . . . . . . . . . . . . . . . . . . 152,055 135,390 120,055 111,439 Administrative/Support Services . . . . . . . . . . . . . . . . . . . . . . . . . . . . . . . . . . . . . . . . . . . . . . . . 294,071 276,940 272,971 222,182 Health Care . . . . . . . . . . . . . . . . . . . . . . . . . . . . . . . . . . . . . . . . . . . . . . . . . . . . . . . . . . 14,558 14,157 15,043 16,459 Arts, Entertainment, and Recreation . . . . . . . . . . . . . . . . . . . . . . . . . . . . . . . . . . . . . . . . . . . . . . 127,640 132,752 126,818 132,202 Accommodation and Food Services . . . . . . . . . . . . . . . . . . . . . . . . . . . . . . . . . . . . . . . . . . . . . . . . 979,827 1,011,033 1,034,597 1,062,671 Other Services Total . . . . . . . . . . . . . . . . . . . . . . . . . . . . . . . . . . . . . . . . . . . . . . . . . . . . . 357,842 359,194 372,312 394,676 Agriculture, Mining, Transportation, Fire, Education, Government. . . . . . . . . . . . . . . . . . . . . . . . . . . . . . . . 428,627 460,155 433,791 422,619 Unclassified by Industry . . . . . . . . . . . . . . . . . . . . . . . . . . . . . . . . . . . . . . . . . . . . . . . . . . . 104,299 12,291 42,877 47,045
Total . . . . . . . . . . . . . . . . . . . . . . . . . . . . . . . . . . . . . . . . . . . . . . . . . . . . . . . . . . . . . 9,532,148$ 9,594,374$ 9,840,244$ 10,699,809$
County Direct Sales Tax Rate . . . . . . . . . . . . . . . . . . . . . . . . . . . . . . . . . . . . . . . . . . . . . . . . . 2.06% 2.06% 2.06% 2.06%
Source: New York State Department of Taxation and Finance
Notes:
(1) Detailed information regarding payers or remitters is not available.
(2) Taxable Sales by Category is not available.
(3) NYS Department of Taxation & Finance's reporting period is March to February.
Fiscal Year
______________________________________________________________________________________________________ COUNTY OF ERIE, NEW YORK • 123
2005 2006 2007 2008 2009 2010 (2)
232,098$ 273,566$ 232,426$ 284,203$ 250,272$ 190,572 212,154 214,336 212,232 213,370 297,235 308,463 300,083 321,439 315,551 964,666 1,100,928 891,003 852,168 854,732
6,438,703 6,298,246 5,268,196 5,320,102 5,390,728 628,050 634,932 654,575 669,659 690,671 119,134 145,002 143,624 141,275 142,364 222,762 233,762 241,179 265,412 264,838 18,991 19,508 19,897 19,312 19,341
120,079 131,973 160,952 170,063 151,751 1,097,432 1,143,990 1,203,967 1,316,380 1,377,550
409,015 440,689 385,859 400,801 415,865 408,714 452,309 502,209 562,164 519,183 49,798 74,704 96,398 70,900 73,631
11,197,248$ 11,470,225$ 10,314,703$ 10,606,108$ 10,679,846$ -$
2.31% 2.81% 2.81% 2.81% 2.81% 2.81%
Fiscal Year
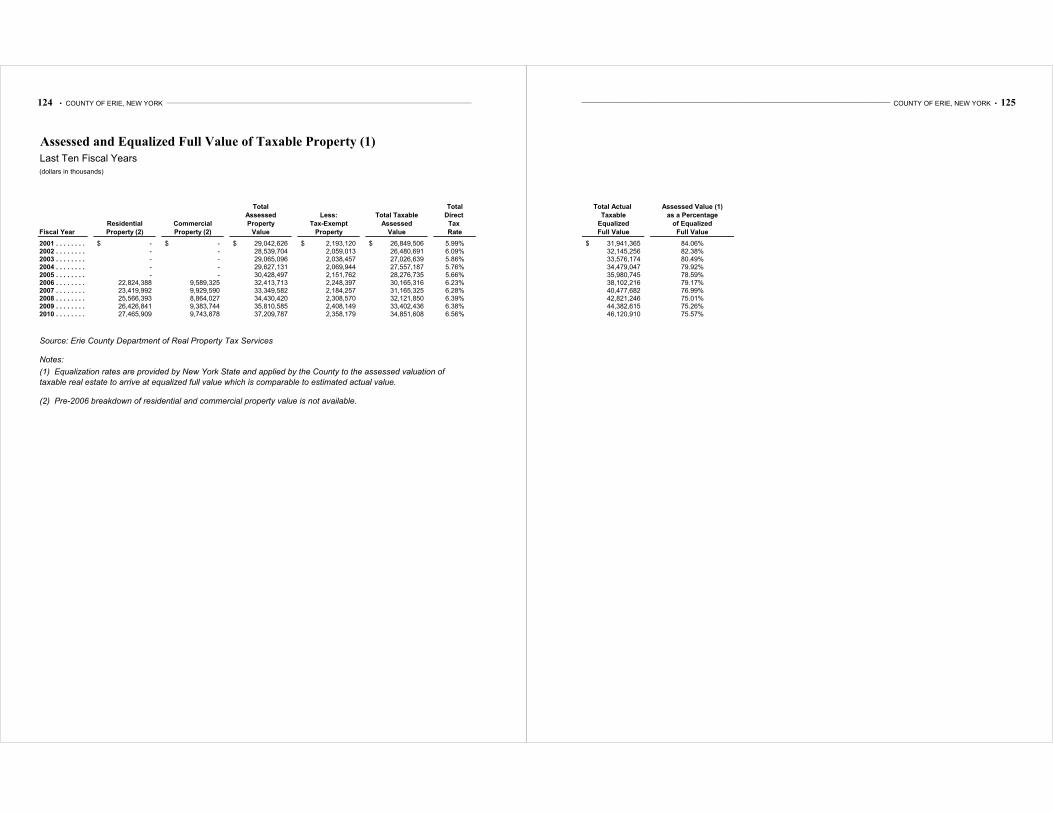
124 • COUNTY OF ERIE, NEW YORK ___________________________________________________________________________________________________________________________________
Assessed and Equalized Full Value of Taxable Property (1)
Last Ten Fiscal Years(dollars in thousands)
Total Total
Assessed Less: Total Taxable Direct
Residential Commercial Property Tax-Exempt Assessed Tax
Fiscal Year Property (2) Property (2) Value Property Value Rate
2001 . . . . . . . . . . . . . . . . . . . . . . . . . . . . . . . . . . . . . . . . . . . . . . . . . . . . . . . . . . . . . -$ -$ 29,042,626$ 2,193,120$ 26,849,506$ 5.99%2002 . . . . . . . . . . . . . . . . . . . . . . . . . . . . . . . . . . . . . . . . . . . . . . . . . . . . . . . . . . . . . - - 28,539,704 2,059,013 26,480,691 6.09%2003 . . . . . . . . . . . . . . . . . . . . . . . . . . . . . . . . . . . . . . . . . . . . . . . . . . . . . . . . . . . . . - - 29,065,096 2,038,457 27,026,639 5.86%2004 . . . . . . . . . . . . . . . . . . . . . . . . . . . . . . . . . . . . . . . . . . . . . . . . . . . . . . . . . . . . . - - 29,627,131 2,069,944 27,557,187 5.76%2005 . . . . . . . . . . . . . . . . . . . . . . . . . . . . . . . . . . . . . . . . . . . . . . . . . . . . . . . . . . . . . - - 30,428,497 2,151,762 28,276,735 5.66%2006 . . . . . . . . . . . . . . . . . . . . . . . . . . . . . . . . . . . . . . . . . . . . . . . . . . . . . . . . . . . . . 22,824,388 9,589,325 32,413,713 2,248,397 30,165,316 6.23%2007 . . . . . . . . . . . . . . . . . . . . . . . . . . . . . . . . . . . . . . . . . . . . . . . . . . . . . . . . . . . . . 23,419,992 9,929,590 33,349,582 2,184,257 31,165,325 6.28%2008 . . . . . . . . . . . . . . . . . . . . . . . . . . . . . . . . . . . . . . . . . . . . . . . . . . . . . . . . . . . . . 25,566,393 8,864,027 34,430,420 2,308,570 32,121,850 6.39%2009 . . . . . . . . . . . . . . . . . . . . . . . . . . . . . . . . . . . . . . . . . . . . . . . . . . . . . . . . . . . . . 26,426,841 9,383,744 35,810,585 2,408,149 33,402,436 6.38%2010 . . . . . . . . . . . . . . . . . . . . . . . . . . . . . . . . . . . . . . . . . . . . . . . . . . . . . . . . . . . . . 27,465,909 9,743,878 37,209,787 2,358,179 34,851,608 6.56%
Source: Erie County Department of Real Property Tax Services
Notes:
(1) Equalization rates are provided by New York State and applied by the County to the assessed valuation of
taxable real estate to arrive at equalized full value which is comparable to estimated actual value.
(2) Pre-2006 breakdown of residential and commercial property value is not available.
______________________________________________________________________________________________________ COUNTY OF ERIE, NEW YORK • 125
Total Actual Assessed Value (1)
Taxable as a Percentage
Equalized of Equalized
Full Value Full Value
31,941,365$ 84.06%32,145,256 82.38%33,576,174 80.49%34,479,047 79.92%35,980,745 78.59%38,102,216 79.17%40,477,682 76.99%42,821,246 75.01%44,382,615 75.26%46,120,910 75.57%
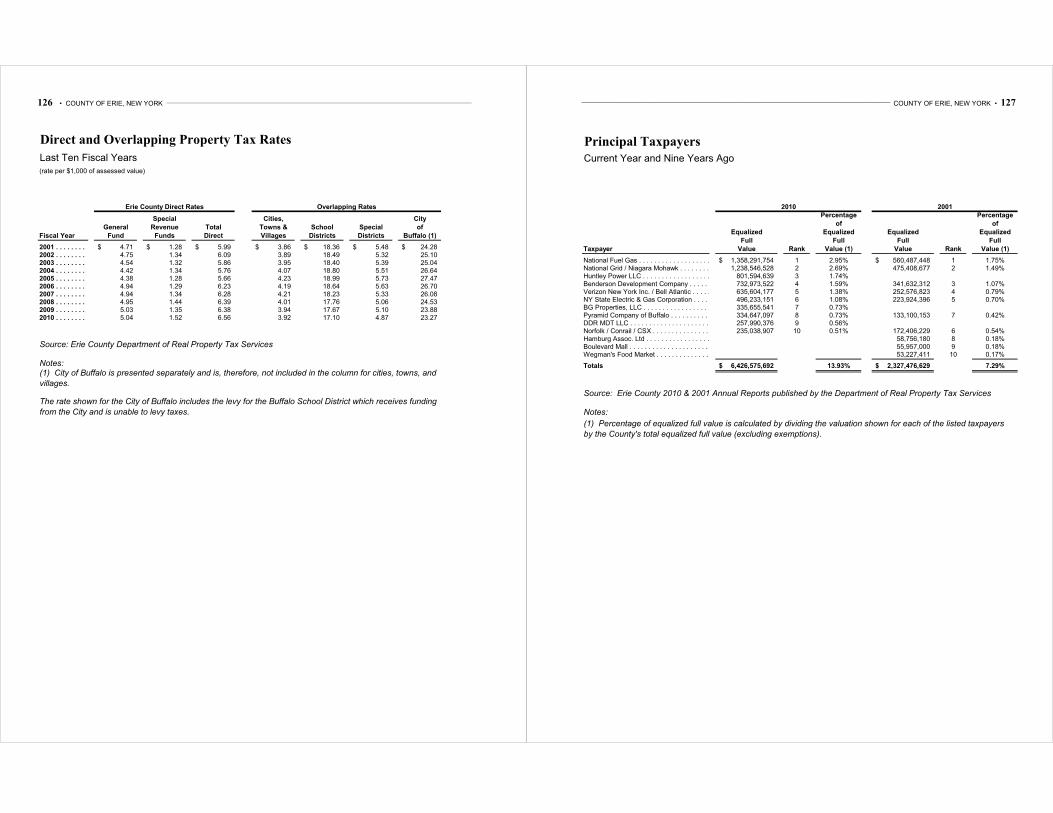
126 • COUNTY OF ERIE, NEW YORK ___________________________________________________________________________________________________________________________________
Direct and Overlapping Property Tax Rates
Last Ten Fiscal Years(rate per $1,000 of assessed value)
Special Cities, City
General Revenue Total Towns & School Special of
Fiscal Year Fund Funds Direct Villages Districts Districts Buffalo (1)
2001 . . . . . . . . . . . . . . . . . . . . . . . . . . . . . . . . . . . . . . . . . . . . . . . . . . . . . . . . . . . . . 4.71$ 1.28$ 5.99$ 3.86$ 18.36$ 5.48$ 24.28$ 2002 . . . . . . . . . . . . . . . . . . . . . . . . . . . . . . . . . . . . . . . . . . . . . . . . . . . . . . . . . . . . . 4.75 1.34 6.09 3.89 18.49 5.32 25.10 2003 . . . . . . . . . . . . . . . . . . . . . . . . . . . . . . . . . . . . . . . . . . . . . . . . . . . . . . . . . . . . . 4.54 1.32 5.86 3.95 18.40 5.39 25.04 2004 . . . . . . . . . . . . . . . . . . . . . . . . . . . . . . . . . . . . . . . . . . . . . . . . . . . . . . . . . . . . . 4.42 1.34 5.76 4.07 18.80 5.51 26.64 2005 . . . . . . . . . . . . . . . . . . . . . . . . . . . . . . . . . . . . . . . . . . . . . . . . . . . . . . . . . . . . . 4.38 1.28 5.66 4.23 18.99 5.73 27.47 2006 . . . . . . . . . . . . . . . . . . . . . . . . . . . . . . . . . . . . . . . . . . . . . . . . . . . . . . . . . . . . . 4.94 1.29 6.23 4.19 18.64 5.63 26.70 2007 . . . . . . . . . . . . . . . . . . . . . . . . . . . . . . . . . . . . . . . . . . . . . . . . . . . . . . . . . . . . . 4.94 1.34 6.28 4.21 18.23 5.33 26.08 2008 . . . . . . . . . . . . . . . . . . . . . . . . . . . . . . . . . . . . . . . . . . . . . . . . . . . . . . . . . . . . . 4.95 1.44 6.39 4.01 17.76 5.06 24.53 2009 . . . . . . . . . . . . . . . . . . . . . . . . . . . . . . . . . . . . . . . . . . . . . . . . . . . . . . . . . . . . . 5.03 1.35 6.38 3.94 17.67 5.10 23.88 2010 . . . . . . . . . . . . . . . . . . . . . . . . . . . . . . . . . . . . . . . . . . . . . . . . . . . . . . . . . . . . . 5.04 1.52 6.56 3.92 17.10 4.87 23.27
Source: Erie County Department of Real Property Tax Services
Notes:
Erie County Direct Rates Overlapping Rates
(1) City of Buffalo is presented separately and is, therefore, not included in the column for cities, towns, and
villages.
The rate shown for the City of Buffalo includes the levy for the Buffalo School District which receives funding
from the City and is unable to levy taxes.
______________________________________________________________________________________________________ COUNTY OF ERIE, NEW YORK • 127
Principal Taxpayers
Current Year and Nine Years Ago
Percentage Percentage
of of
Equalized Equalized Equalized Equalized
Full Full Full Full
Taxpayer Value Rank Value (1) Value Rank Value (1)
National Fuel Gas . . . . . . . . . . . . . . . . . . . . . . . . . . . . . . . . . . . . . . . . . . . . . . . . . . . . . . . 1,358,291,754$ 1 2.95% 560,487,448$ 1 1.75%National Grid / Niagara Mohawk . . . . . . . . . . . . . . . . . . . . . . . . . . . . . . . . . . . . . . . . . . . . . . . . 1,238,546,528 2 2.69% 475,408,677 2 1.49%Huntley Power LLC . . . . . . . . . . . . . . . . . . . . . . . . . . . . . . . . . . . . . . . . . . . . . . . . . . . . . . . 801,594,639 3 1.74%Benderson Development Company . . . . . . . . . . . . . . . . . . . . . . . . . . . . . . . . . . . . . . . . . . . . . . . . . 732,973,522 4 1.59% 341,632,312 3 1.07%Verizon New York Inc. / Bell Atlantic . . . . . . . . . . . . . . . . . . . . . . . . . . . . . . . . . . . . . . . . . . . . . 635,604,177 5 1.38% 252,576,823 4 0.79%NY State Electric & Gas Corporation . . . . . . . . . . . . . . . . . . . . . . . . . . . . . . . . . . . . . . . . . . . . . . 496,233,151 6 1.08% 223,924,396 5 0.70%BG Properties, LLC . . . . . . . . . . . . . . . . . . . . . . . . . . . . . . . . . . . . . . . . . . . . . . . . . . . . . . 335,655,541 7 0.73%Pyramid Company of Buffalo . . . . . . . . . . . . . . . . . . . . . . . . . . . . . . . . . . . . . . . . . . . . . . . . . . 334,647,097 8 0.73% 133,100,153 7 0.42%DDR MDT LLC . . . . . . . . . . . . . . . . . . . . . . . . . . . . . . . . . . . . . . . . . . . . . . . . . . . . . . . . . . 257,990,376 9 0.56%Norfolk / Conrail / CSX . . . . . . . . . . . . . . . . . . . . . . . . . . . . . . . . . . . . . . . . . . . . . . . . . . . . 235,038,907 10 0.51% 172,406,229 6 0.54%Hamburg Assoc. Ltd . . . . . . . . . . . . . . . . . . . . . . . . . . . . . . . . . . . . . . . . . . . . . . . . . . . . . . 58,756,180 8 0.18%Boulevard Mall . . . . . . . . . . . . . . . . . . . . . . . . . . . . . . . . . . . . . . . . . . . . . . . . . . . . . . . . 55,957,000 9 0.18%Wegman's Food Market . . . . . . . . . . . . . . . . . . . . . . . . . . . . . . . . . . . . . . . . . . . . . . . . . . . . . 53,227,411 10 0.17%
Totals 6,426,575,692$ 13.93% 2,327,476,629$ 7.29%
Source: Erie County 2010 & 2001 Annual Reports published by the Department of Real Property Tax Services
Notes:
2010 2001
(1) Percentage of equalized full value is calculated by dividing the valuation shown for each of the listed taxpayers
by the County's total equalized full value (excluding exemptions).
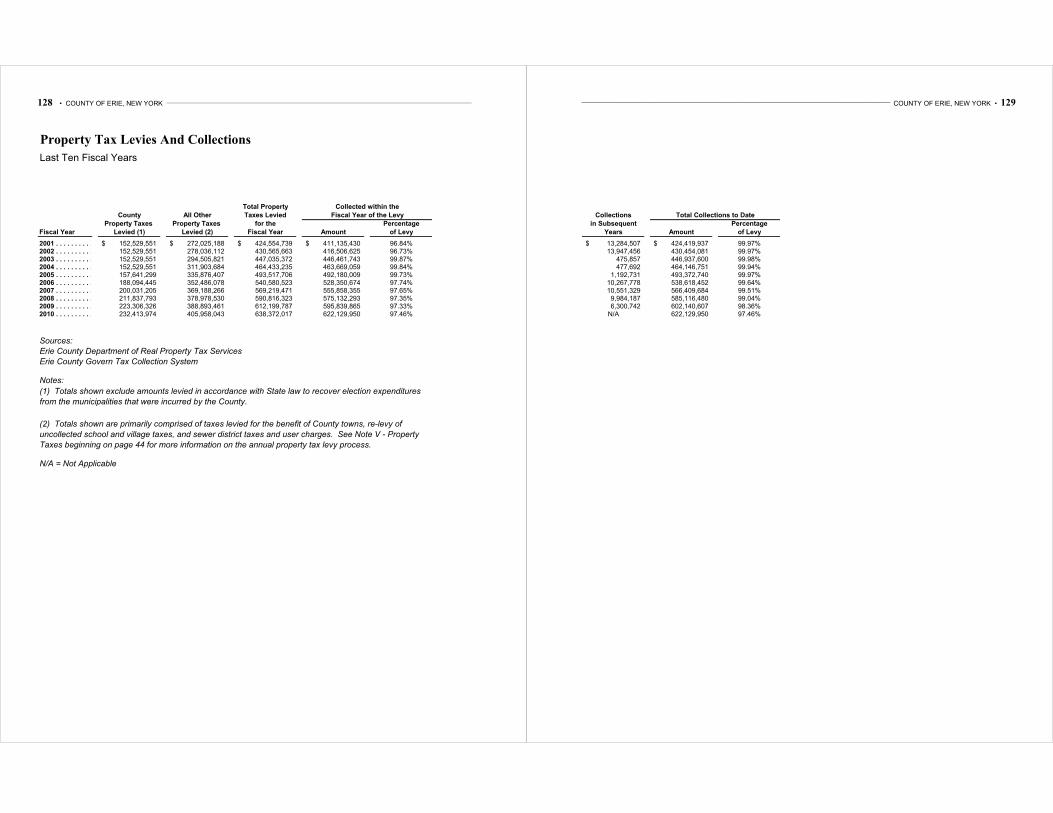
128 • COUNTY OF ERIE, NEW YORK ___________________________________________________________________________________________________________________________________
Property Tax Levies And Collections
Last Ten Fiscal Years
Total Property
County All Other Taxes Levied
Property Taxes Property Taxes for the Percentage
Fiscal Year Levied (1) Levied (2) Fiscal Year Amount of Levy
2001 . . . . . . . . . . . . . . . . . . . . . . . . . . . . . . . . . . . . . . . . . . . . . . . . . . . . . . . . . . . . . 152,529,551$ 272,025,188$ 424,554,739$ 411,135,430$ 96.84%2002 . . . . . . . . . . . . . . . . . . . . . . . . . . . . . . . . . . . . . . . . . . . . . . . . . . . . . . . . . . . . . 152,529,551 278,036,112 430,565,663 416,506,625 96.73%2003 . . . . . . . . . . . . . . . . . . . . . . . . . . . . . . . . . . . . . . . . . . . . . . . . . . . . . . . . . . . . . 152,529,551 294,505,821 447,035,372 446,461,743 99.87%2004 . . . . . . . . . . . . . . . . . . . . . . . . . . . . . . . . . . . . . . . . . . . . . . . . . . . . . . . . . . . . . 152,529,551 311,903,684 464,433,235 463,669,059 99.84%2005 . . . . . . . . . . . . . . . . . . . . . . . . . . . . . . . . . . . . . . . . . . . . . . . . . . . . . . . . . . . . . 157,641,299 335,876,407 493,517,706 492,180,009 99.73%2006 . . . . . . . . . . . . . . . . . . . . . . . . . . . . . . . . . . . . . . . . . . . . . . . . . . . . . . . . . . . . . 188,094,445 352,486,078 540,580,523 528,350,674 97.74%2007 . . . . . . . . . . . . . . . . . . . . . . . . . . . . . . . . . . . . . . . . . . . . . . . . . . . . . . . . . . . . . 200,031,205 369,188,266 569,219,471 555,858,355 97.65%2008 . . . . . . . . . . . . . . . . . . . . . . . . . . . . . . . . . . . . . . . . . . . . . . . . . . . . . . . . . . . . . 211,837,793 378,978,530 590,816,323 575,132,293 97.35%2009 . . . . . . . . . . . . . . . . . . . . . . . . . . . . . . . . . . . . . . . . . . . . . . . . . . . . . . . . . . . . . 223,306,326 388,893,461 612,199,787 595,839,865 97.33%2010 . . . . . . . . . . . . . . . . . . . . . . . . . . . . . . . . . . . . . . . . . . . . . . . . . . . . . . . . . . . . . 232,413,974 405,958,043 638,372,017 622,129,950 97.46%
Sources:
Erie County Department of Real Property Tax Services
Erie County Govern Tax Collection System
Notes:
N/A = Not Applicable
(2) Totals shown are primarily comprised of taxes levied for the benefit of County towns, re-levy of
uncollected school and village taxes, and sewer district taxes and user charges. See Note V - Property
Taxes beginning on page 44 for more information on the annual property tax levy process.
Collected within the
Fiscal Year of the Levy
(1) Totals shown exclude amounts levied in accordance with State law to recover election expenditures
from the municipalities that were incurred by the County.
______________________________________________________________________________________________________ COUNTY OF ERIE, NEW YORK • 129
Collections
in Subsequent Percentage
Years Amount of Levy
13,284,507$ 424,419,937$ 99.97%13,947,456 430,454,081 99.97%
475,857 446,937,600 99.98%477,692 464,146,751 99.94%
1,192,731 493,372,740 99.97%10,267,778 538,618,452 99.64%10,551,329 566,409,684 99.51%9,984,187 585,116,480 99.04%6,300,742 602,140,607 98.36%
N/A 622,129,950 97.46%
Total Collections to Date
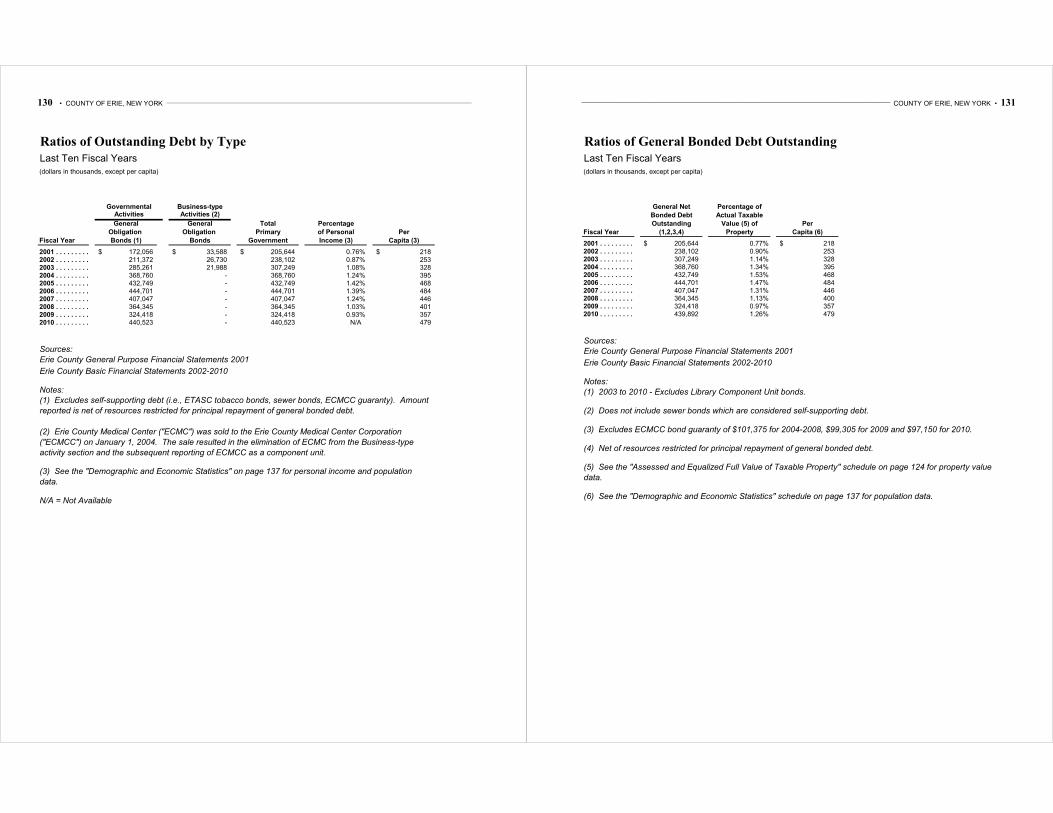
130 • COUNTY OF ERIE, NEW YORK ___________________________________________________________________________________________________________________________________
Ratios of Outstanding Debt by Type
Last Ten Fiscal Years(dollars in thousands, except per capita)
Business-typeActivities (2)
General General Total Percentage
Obligation Obligation Primary of Personal Per
Fiscal Year Bonds (1) Bonds Government Income (3) Capita (3)
2001 . . . . . . . . . . . . . . . . . . . . . . . . . . . . . . . . . . . . . . . . . . . . . . . . . . . . . . . . . . . . . 172,056$ 33,588$ 205,644$ 0.76% 218$ 2002 . . . . . . . . . . . . . . . . . . . . . . . . . . . . . . . . . . . . . . . . . . . . . . . . . . . . . . . . . . . . . 211,372 26,730 238,102 0.87% 253 2003 . . . . . . . . . . . . . . . . . . . . . . . . . . . . . . . . . . . . . . . . . . . . . . . . . . . . . . . . . . . . . 285,261 21,988 307,249 1.08% 328 2004 . . . . . . . . . . . . . . . . . . . . . . . . . . . . . . . . . . . . . . . . . . . . . . . . . . . . . . . . . . . . . 368,760 - 368,760 1.24% 395 2005 . . . . . . . . . . . . . . . . . . . . . . . . . . . . . . . . . . . . . . . . . . . . . . . . . . . . . . . . . . . . . 432,749 - 432,749 1.42% 468 2006 . . . . . . . . . . . . . . . . . . . . . . . . . . . . . . . . . . . . . . . . . . . . . . . . . . . . . . . . . . . . . 444,701 - 444,701 1.39% 484 2007 . . . . . . . . . . . . . . . . . . . . . . . . . . . . . . . . . . . . . . . . . . . . . . . . . . . . . . . . . . . . . 407,047 - 407,047 1.24% 446 2008 . . . . . . . . . . . . . . . . . . . . . . . . . . . . . . . . . . . . . . . . . . . . . . . . . . . . . . . . . . . . . 364,345 - 364,345 1.03% 401 2009 . . . . . . . . . . . . . . . . . . . . . . . . . . . . . . . . . . . . . . . . . . . . . . . . . . . . . . . . . . . . . 324,418 - 324,418 0.93% 357 2010 . . . . . . . . . . . . . . . . . . . . . . . . . . . . . . . . . . . . . . . . . . . . . . . . . . . . . . . . . . . . . 440,523 - 440,523 N/A 479
Sources:
Erie County General Purpose Financial Statements 2001
Erie County Basic Financial Statements 2002-2010
Notes:
N/A = Not Available
(2) Erie County Medical Center ("ECMC") was sold to the Erie County Medical Center Corporation
("ECMCC") on January 1, 2004. The sale resulted in the elimination of ECMC from the Business-type
activity section and the subsequent reporting of ECMCC as a component unit.
(3) See the "Demographic and Economic Statistics" on page 137 for personal income and population
data.
GovernmentalActivities
(1) Excludes self-supporting debt (i.e., ETASC tobacco bonds, sewer bonds, ECMCC guaranty). Amount
reported is net of resources restricted for principal repayment of general bonded debt.
______________________________________________________________________________________________________ COUNTY OF ERIE, NEW YORK • 131
Ratios of General Bonded Debt Outstanding
Last Ten Fiscal Years(dollars in thousands, except per capita)
General Net Percentage of
Bonded Debt Actual Taxable
Outstanding Value (5) of Per
Fiscal Year (1,2,3,4) Property Capita (6)
2001 . . . . . . . . . . . . . . . . . . . . . . . . . . . . . . . . . . . . . . . . . . . . . . . . . . . . . . . . . . . . . 205,644$ 0.77% 218$ 2002 . . . . . . . . . . . . . . . . . . . . . . . . . . . . . . . . . . . . . . . . . . . . . . . . . . . . . . . . . . . . . 238,102 0.90% 2532003 . . . . . . . . . . . . . . . . . . . . . . . . . . . . . . . . . . . . . . . . . . . . . . . . . . . . . . . . . . . . . 307,249 1.14% 3282004 . . . . . . . . . . . . . . . . . . . . . . . . . . . . . . . . . . . . . . . . . . . . . . . . . . . . . . . . . . . . . 368,760 1.34% 3952005 . . . . . . . . . . . . . . . . . . . . . . . . . . . . . . . . . . . . . . . . . . . . . . . . . . . . . . . . . . . . . 432,749 1.53% 4682006 . . . . . . . . . . . . . . . . . . . . . . . . . . . . . . . . . . . . . . . . . . . . . . . . . . . . . . . . . . . . . 444,701 1.47% 4842007 . . . . . . . . . . . . . . . . . . . . . . . . . . . . . . . . . . . . . . . . . . . . . . . . . . . . . . . . . . . . . 407,047 1.31% 4462008 . . . . . . . . . . . . . . . . . . . . . . . . . . . . . . . . . . . . . . . . . . . . . . . . . . . . . . . . . . . . . 364,345 1.13% 4002009 . . . . . . . . . . . . . . . . . . . . . . . . . . . . . . . . . . . . . . . . . . . . . . . . . . . . . . . . . . . . . 324,418 0.97% 3572010 . . . . . . . . . . . . . . . . . . . . . . . . . . . . . . . . . . . . . . . . . . . . . . . . . . . . . . . . . . . . . 439,892 1.26% 479
Sources:
Erie County General Purpose Financial Statements 2001
Erie County Basic Financial Statements 2002-2010
Notes:
(2) Does not include sewer bonds which are considered self-supporting debt.
(1) 2003 to 2010 - Excludes Library Component Unit bonds.
(5) See the "Assessed and Equalized Full Value of Taxable Property" schedule on page 124 for property value
data.
(6) See the "Demographic and Economic Statistics" schedule on page 137 for population data.
(4) Net of resources restricted for principal repayment of general bonded debt.
(3) Excludes ECMCC bond guaranty of $101,375 for 2004-2008, $99,305 for 2009 and $97,150 for 2010.
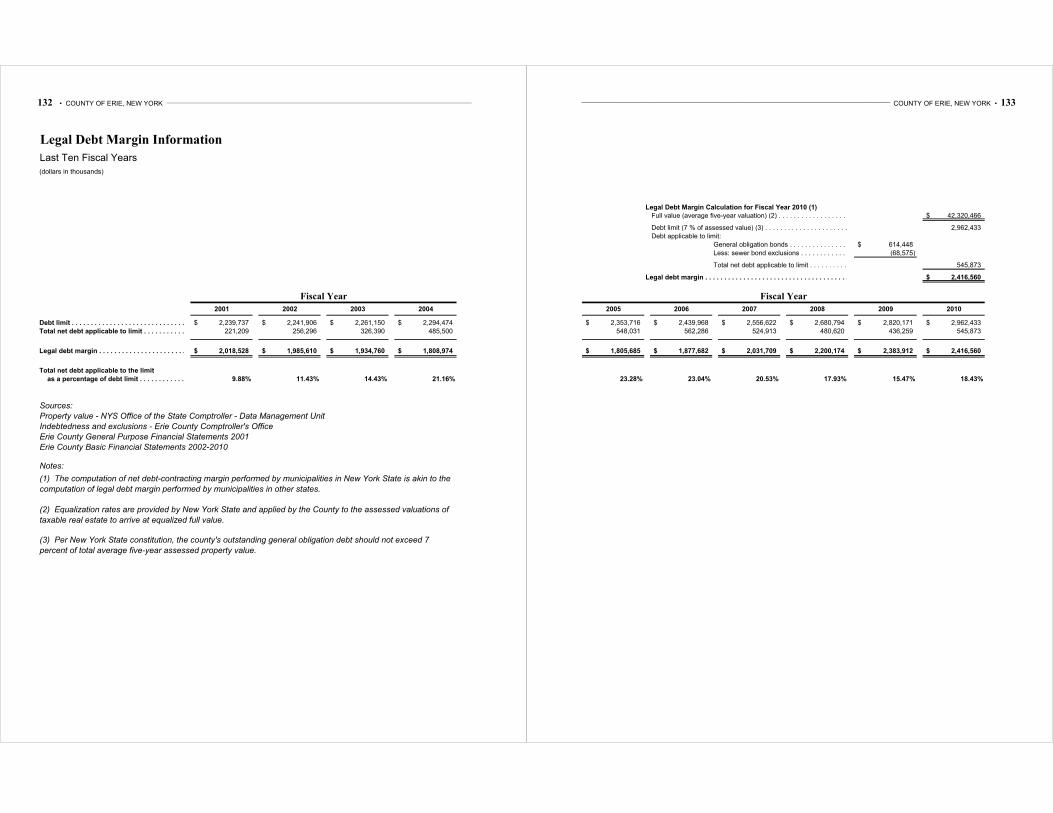
132 • COUNTY OF ERIE, NEW YORK ___________________________________________________________________________________________________________________________________
Legal Debt Margin Information
Last Ten Fiscal Years
(dollars in thousands)
2001 2002 2003 2004
Debt limit . . . . . . . . . . . . . . . . . . . . . . . . . . . . . . . . . . . . . . . . . . . . . . . . . . . . . . . . . . 2,239,737$ 2,241,906$ 2,261,150$ 2,294,474$
Total net debt applicable to limit . . . . . . . . . . . . . . . . . . . . . . . . . . . . . . . . . . . . . . . . . . . . . . 221,209 256,296 326,390 485,500
Legal debt margin . . . . . . . . . . . . . . . . . . . . . . . . . . . . . . . . . . . . . . . . . . . . . . . . . . . . . . . 2,018,528$ 1,985,610$ 1,934,760$ 1,808,974$
Total net debt applicable to the limit
as a percentage of debt limit . . . . . . . . . . . . . . . . . . . . . . . . . . . . . . . . . . . . . . . . . . . . . . . . 9.88% 11.43% 14.43% 21.16%
Sources:
Property value - NYS Office of the State Comptroller - Data Management Unit
Indebtedness and exclusions - Erie County Comptroller's Office
Erie County General Purpose Financial Statements 2001
Erie County Basic Financial Statements 2002-2010
Notes:
(1) The computation of net debt-contracting margin performed by municipalities in New York State is akin to the
computation of legal debt margin performed by municipalities in other states.
(2) Equalization rates are provided by New York State and applied by the County to the assessed valuations of
taxable real estate to arrive at equalized full value.
(3) Per New York State constitution, the county's outstanding general obligation debt should not exceed 7
percent of total average five-year assessed property value.
Fiscal Year
______________________________________________________________________________________________________ COUNTY OF ERIE, NEW YORK • 133
Legal Debt Margin Calculation for Fiscal Year 2010 (1)
Full value (average five-year valuation) (2) . . . . . . . . . . . . . . . . . . . . . . . . . . . . . . . . . . . . . . . . . 42,320,466$
Debt limit (7 % of assessed value) (3) . . . . . . . . . . . . . . . . . . . . . . . . . . . . . . . . . . . . . . . . . . . . 2,962,433
Debt applicable to limit:
General obligation bonds . . . . . . . . . . . . . . . . . . . . . . . . . . . . . . . . . . . . . . . . . . . . . . . . . . . 614,448$
Less: sewer bond exclusions . . . . . . . . . . . . . . . . . . . . . . . . . . . . . . . . . . . . . . . . . . . . . . . . . . (68,575)
Total net debt applicable to limit . . . . . . . . . . . . . . . . . . . . . . . . . . . . . . . . . . . . . . . . . . . . . . 545,873
Legal debt margin . . . . . . . . . . . . . . . . . . . . . . . . . . . . . . . . . . . . . . . . . . . . . . . . . . . . . . . 2,416,560$
2005 2006 2007 2008 2009 2010
2,353,716$ 2,439,968$ 2,556,622$ 2,680,794$ 2,820,171$ 2,962,433$
548,031 562,286 524,913 480,620 436,259 545,873
1,805,685$ 1,877,682$ 2,031,709$ 2,200,174$ 2,383,912$ 2,416,560$
23.28% 23.04% 20.53% 17.93% 15.47% 18.43%
Fiscal Year
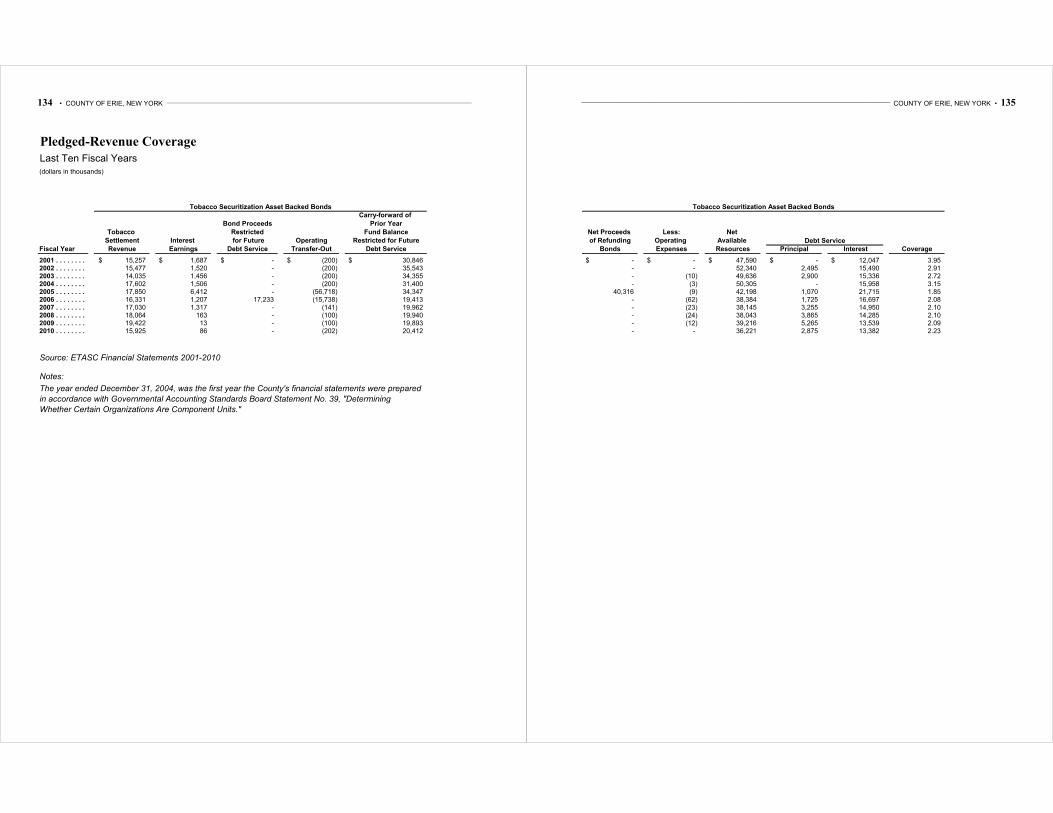
134 • COUNTY OF ERIE, NEW YORK ___________________________________________________________________________________________________________________________________
Pledged-Revenue Coverage
Last Ten Fiscal Years(dollars in thousands)
Carry-forward of
Bond Proceeds Prior Year
Tobacco Restricted Fund Balance
Settlement Interest for Future Operating Restricted for Future
Fiscal Year Revenue Earnings Debt Service Transfer-Out Debt Service
2001 . . . . . . . . . . . . . . . . . . . . . . . . . . . . . . . . . . . . . . . . . . . . . . . . . . . . . . . . . . . . . 15,257$ 1,687$ -$ (200)$ 30,846$ 2002 . . . . . . . . . . . . . . . . . . . . . . . . . . . . . . . . . . . . . . . . . . . . . . . . . . . . . . . . . . . . . 15,477 1,520 - (200) 35,543 2003 . . . . . . . . . . . . . . . . . . . . . . . . . . . . . . . . . . . . . . . . . . . . . . . . . . . . . . . . . . . . . 14,035 1,456 - (200) 34,355 2004 . . . . . . . . . . . . . . . . . . . . . . . . . . . . . . . . . . . . . . . . . . . . . . . . . . . . . . . . . . . . . 17,602 1,506 - (200) 31,400 2005 . . . . . . . . . . . . . . . . . . . . . . . . . . . . . . . . . . . . . . . . . . . . . . . . . . . . . . . . . . . . . 17,850 6,412 - (56,718) 34,347 2006 . . . . . . . . . . . . . . . . . . . . . . . . . . . . . . . . . . . . . . . . . . . . . . . . . . . . . . . . . . . . . 16,331 1,207 17,233 (15,738) 19,413 2007 . . . . . . . . . . . . . . . . . . . . . . . . . . . . . . . . . . . . . . . . . . . . . . . . . . . . . . . . . . . . . 17,030 1,317 - (141) 19,962 2008 . . . . . . . . . . . . . . . . . . . . . . . . . . . . . . . . . . . . . . . . . . . . . . . . . . . . . . . . . . . . . 18,064 163 - (100) 19,940 2009 . . . . . . . . . . . . . . . . . . . . . . . . . . . . . . . . . . . . . . . . . . . . . . . . . . . . . . . . . . . . . 19,422 13 - (100) 19,893 2010 . . . . . . . . . . . . . . . . . . . . . . . . . . . . . . . . . . . . . . . . . . . . . . . . . . . . . . . . . . . . . 15,925 86 - (202) 20,412
Source: ETASC Financial Statements 2001-2010
Notes:
Tobacco Securitization Asset Backed Bonds
The year ended December 31, 2004, was the first year the County's financial statements were prepared
in accordance with Governmental Accounting Standards Board Statement No. 39, "Determining
Whether Certain Organizations Are Component Units."
______________________________________________________________________________________________________ COUNTY OF ERIE, NEW YORK • 135
Net Proceeds Less: Net
of Refunding Operating Available
Bonds Expenses Resources Principal Interest Coverage
-$ -$ 47,590$ -$ 12,047$ 3.95- - 52,340 2,495 15,490 2.91- (10) 49,636 2,900 15,336 2.72- (3) 50,305 - 15,958 3.15
40,316 (9) 42,198 1,070 21,715 1.85- (62) 38,384 1,725 16,697 2.08- (23) 38,145 3,255 14,950 2.10- (24) 38,043 3,865 14,285 2.10- (12) 39,216 5,265 13,539 2.09- - 36,221 2,875 13,382 2.23
Debt Service
Tobacco Securitization Asset Backed Bonds
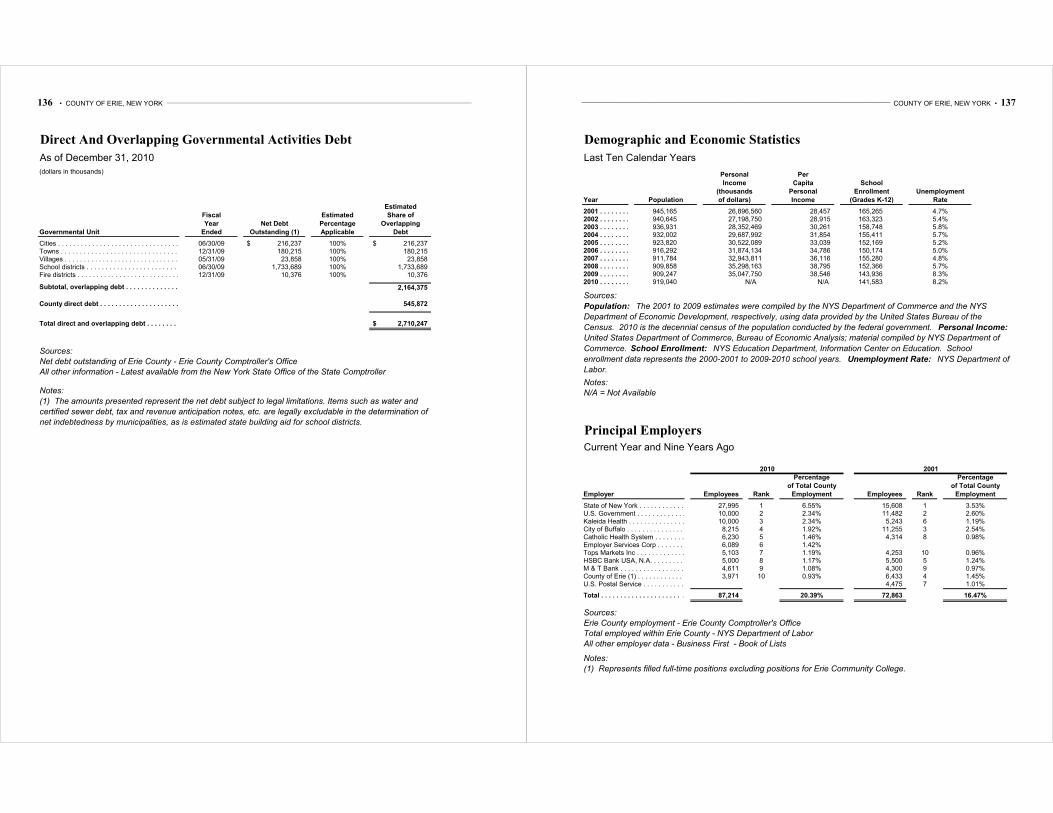
136 • COUNTY OF ERIE, NEW YORK ___________________________________________________________________________________________________________________________________
Direct And Overlapping Governmental Activities Debt
As of December 31, 2010
(dollars in thousands)
Estimated
Fiscal Estimated Share of
Year Net Debt Percentage Overlapping
Governmental Unit Ended Outstanding (1) Applicable Debt
Cities . . . . . . . . . . . . . . . . . . . . . . . . . . . . . . . . . . . . . . . . . . . . . . . . . . . . . . . . . . . . 06/30/09 216,237$ 100% 216,237$ Towns . . . . . . . . . . . . . . . . . . . . . . . . . . . . . . . . . . . . . . . . . . . . . . . . . . . . . . . . . . . . . 12/31/09 180,215 100% 180,215 Villages . . . . . . . . . . . . . . . . . . . . . . . . . . . . . . . . . . . . . . . . . . . . . . . . . . . . . . . . . . . 05/31/09 23,858 100% 23,858 School districts . . . . . . . . . . . . . . . . . . . . . . . . . . . . . . . . . . . . . . . . . . . . . . . . . . . . . . . 06/30/09 1,733,689 100% 1,733,689 Fire districts . . . . . . . . . . . . . . . . . . . . . . . . . . . . . . . . . . . . . . . . . . . . . . . . . . . . . . . . 12/31/09 10,376 100% 10,376
Subtotal, overlapping debt . . . . . . . . . . . . . . . . . . . . . . . . . . . . . . . . . . . . . . . . . . . . . . . . . . 2,164,375
County direct debt . . . . . . . . . . . . . . . . . . . . . . . . . . . . . . . . . . . . . . . . . . . . . . . . . . . . . . 545,872
Total direct and overlapping debt . . . . . . . . . . . . . . . . . . . . . . . . . . . . . . . . . . . . . . . . . . . . . . . 2,710,247$
Sources:
Net debt outstanding of Erie County - Erie County Comptroller's Office
All other information - Latest available from the New York State Office of the State Comptroller
Notes:
(1) The amounts presented represent the net debt subject to legal limitations. Items such as water and
certified sewer debt, tax and revenue anticipation notes, etc. are legally excludable in the determination of
net indebtedness by municipalities, as is estimated state building aid for school districts.
______________________________________________________________________________________________________ COUNTY OF ERIE, NEW YORK • 137
Demographic and Economic Statistics
Last Ten Calendar Years
Personal Per
Income Capita School
(thousands Personal Enrollment Unemployment
Year Population of dollars) Income (Grades K-12) Rate
2001 . . . . . . . . . . . . . . . . . . . . . . . . . . . . . . . . . . . . . . . . . . . . . . . . . . . . . . . . . . . . . 945,165 26,896,560 28,457 165,265 4.7%2002 . . . . . . . . . . . . . . . . . . . . . . . . . . . . . . . . . . . . . . . . . . . . . . . . . . . . . . . . . . . . . 940,645 27,198,750 28,915 163,323 5.4%2003 . . . . . . . . . . . . . . . . . . . . . . . . . . . . . . . . . . . . . . . . . . . . . . . . . . . . . . . . . . . . . 936,931 28,352,469 30,261 158,748 5.8%2004 . . . . . . . . . . . . . . . . . . . . . . . . . . . . . . . . . . . . . . . . . . . . . . . . . . . . . . . . . . . . . 932,002 29,687,992 31,854 155,411 5.7%2005 . . . . . . . . . . . . . . . . . . . . . . . . . . . . . . . . . . . . . . . . . . . . . . . . . . . . . . . . . . . . . 923,820 30,522,089 33,039 152,169 5.2%2006 . . . . . . . . . . . . . . . . . . . . . . . . . . . . . . . . . . . . . . . . . . . . . . . . . . . . . . . . . . . . . 916,292 31,874,134 34,786 150,174 5.0%2007 . . . . . . . . . . . . . . . . . . . . . . . . . . . . . . . . . . . . . . . . . . . . . . . . . . . . . . . . . . . . . 911,784 32,943,811 36,116 155,280 4.8%2008 . . . . . . . . . . . . . . . . . . . . . . . . . . . . . . . . . . . . . . . . . . . . . . . . . . . . . . . . . . . . . 909,858 35,298,163 38,795 152,366 5.7%2009 . . . . . . . . . . . . . . . . . . . . . . . . . . . . . . . . . . . . . . . . . . . . . . . . . . . . . . . . . . . . . 909,247 35,047,750 38,546 143,936 8.3%2010 . . . . . . . . . . . . . . . . . . . . . . . . . . . . . . . . . . . . . . . . . . . . . . . . . . . . . . . . . . . . . 919,040 N/A N/A 141,583 8.2%
Notes:
N/A = Not Available
Sources:
Population: The 2001 to 2009 estimates were compiled by the NYS Department of Commerce and the NYS
Department of Economic Development, respectively, using data provided by the United States Bureau of the
Census. 2010 is the decennial census of the population conducted by the federal government. Personal Income:
United States Department of Commerce, Bureau of Economic Analysis; material compiled by NYS Department of
Commerce. School Enrollment: NYS Education Department, Information Center on Education. School
enrollment data represents the 2000-2001 to 2009-2010 school years. Unemployment Rate: NYS Department of
Labor.
Principal Employers
Current Year and Nine Years Ago
Percentage Percentage
of Total County of Total County
Employer Employees Rank Employment Employees Rank Employment
State of New York . . . . . . . . . . . . . . . . . . . . . . . . . . . . . . . . . . . . . . . . . . . . . . . . . . . . . . 27,995 1 6.55% 15,608 1 3.53%U.S. Government . . . . . . . . . . . . . . . . . . . . . . . . . . . . . . . . . . . . . . . . . . . . . . . . . . . . . . . 10,000 2 2.34% 11,482 2 2.60%Kaleida Health . . . . . . . . . . . . . . . . . . . . . . . . . . . . . . . . . . . . . . . . . . . . . . . . . . . . . . . . 10,000 3 2.34% 5,243 6 1.19%City of Buffalo . . . . . . . . . . . . . . . . . . . . . . . . . . . . . . . . . . . . . . . . . . . . . . . . . . . . . . . 8,215 4 1.92% 11,255 3 2.54%Catholic Health System . . . . . . . . . . . . . . . . . . . . . . . . . . . . . . . . . . . . . . . . . . . . . . . . . . . . 6,230 5 1.46% 4,314 8 0.98%Employer Services Corp . . . . . . . . . . . . . . . . . . . . . . . . . . . . . . . . . . . . . . . . . . . . . . . . . . . . 6,089 6 1.42%Tops Markets Inc . . . . . . . . . . . . . . . . . . . . . . . . . . . . . . . . . . . . . . . . . . . . . . . . . . . . . . . 5,103 7 1.19% 4,253 10 0.96%HSBC Bank USA, N.A. . . . . . . . . . . . . . . . . . . . . . . . . . . . . . . . . . . . . . . . . . . . . . . . . . . . . . 5,000 8 1.17% 5,500 5 1.24%M & T Bank . . . . . . . . . . . . . . . . . . . . . . . . . . . . . . . . . . . . . . . . . . . . . . . . . . . . . . . . . . 4,611 9 1.08% 4,300 9 0.97%County of Erie (1) . . . . . . . . . . . . . . . . . . . . . . . . . . . . . . . . . . . . . . . . . . . . . . . . . . . . . . 3,971 10 0.93% 6,433 4 1.45%U.S. Postal Service . . . . . . . . . . . . . . . . . . . . . . . . . . . . . . . . . . . . . . . . . . . . . . . . . . . . . 4,475 7 1.01%
Total . . . . . . . . . . . . . . . . . . . . . . . . . . . . . . . . . . . . . . . . . . . . . . . . . . . . . . . . . . . . 87,214 20.39% 72,863 16.47%
Sources:
Erie County employment - Erie County Comptroller's Office
Total employed within Erie County - NYS Department of Labor
All other employer data - Business First - Book of Lists
Notes:
(1) Represents filled full-time positions excluding positions for Erie Community College.
2010 2001
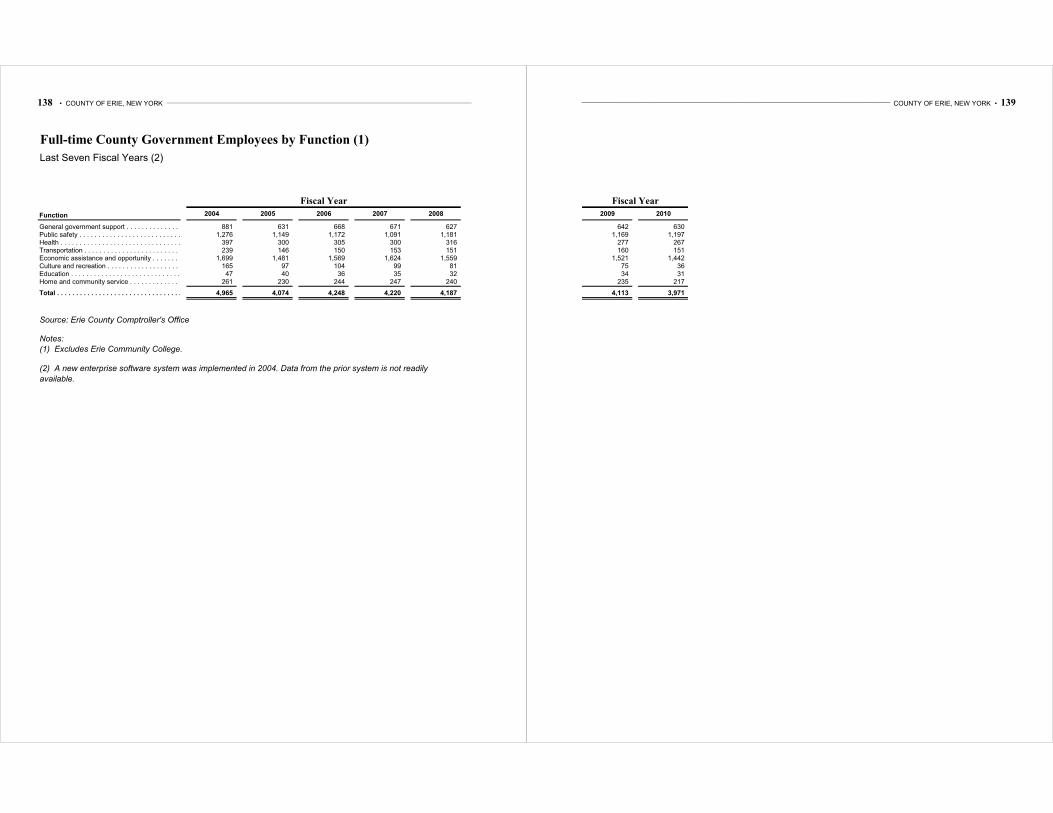
138 • COUNTY OF ERIE, NEW YORK ___________________________________________________________________________________________________________________________________
Full-time County Government Employees by Function (1)
Last Seven Fiscal Years (2)
Function 2004 2005 2006 2007 2008
General government support . . . . . . . . . . . . . . . . . . . . . . . . . . . . . . . . . . . . . . . . . . . . . . . . . . 881 631 668 671 627Public safety . . . . . . . . . . . . . . . . . . . . . . . . . . . . . . . . . . . . . . . . . . . . . . . . . . . . . . . . . 1,276 1,149 1,172 1,091 1,181Health . . . . . . . . . . . . . . . . . . . . . . . . . . . . . . . . . . . . . . . . . . . . . . . . . . . . . . . . . . . . 397 300 305 300 316Transportation . . . . . . . . . . . . . . . . . . . . . . . . . . . . . . . . . . . . . . . . . . . . . . . . . . . . . . . . 239 146 150 153 151Economic assistance and opportunity . . . . . . . . . . . . . . . . . . . . . . . . . . . . . . . . . . . . . . . . . . . . . . 1,699 1,481 1,569 1,624 1,559Culture and recreation . . . . . . . . . . . . . . . . . . . . . . . . . . . . . . . . . . . . . . . . . . . . . . . . . . . . 165 97 104 99 81Education . . . . . . . . . . . . . . . . . . . . . . . . . . . . . . . . . . . . . . . . . . . . . . . . . . . . . . . . . . . 47 40 36 35 32Home and community service . . . . . . . . . . . . . . . . . . . . . . . . . . . . . . . . . . . . . . . . . . . . . . . . . . 261 230 244 247 240 Total . . . . . . . . . . . . . . . . . . . . . . . . . . . . . . . . . . . . . . . . . . . . . . . . . . . . . . . . . . . . . 4,965 4,074 4,248 4,220 4,187
Source: Erie County Comptroller's Office
Notes:
(1) Excludes Erie Community College.
Fiscal Year
(2) A new enterprise software system was implemented in 2004. Data from the prior system is not readily
available.
______________________________________________________________________________________________________ COUNTY OF ERIE, NEW YORK • 139
2009 2010
642 6301,169 1,197
277 267160 151
1,521 1,44275 3634 31
235 217
4,113 3,971
Fiscal Year
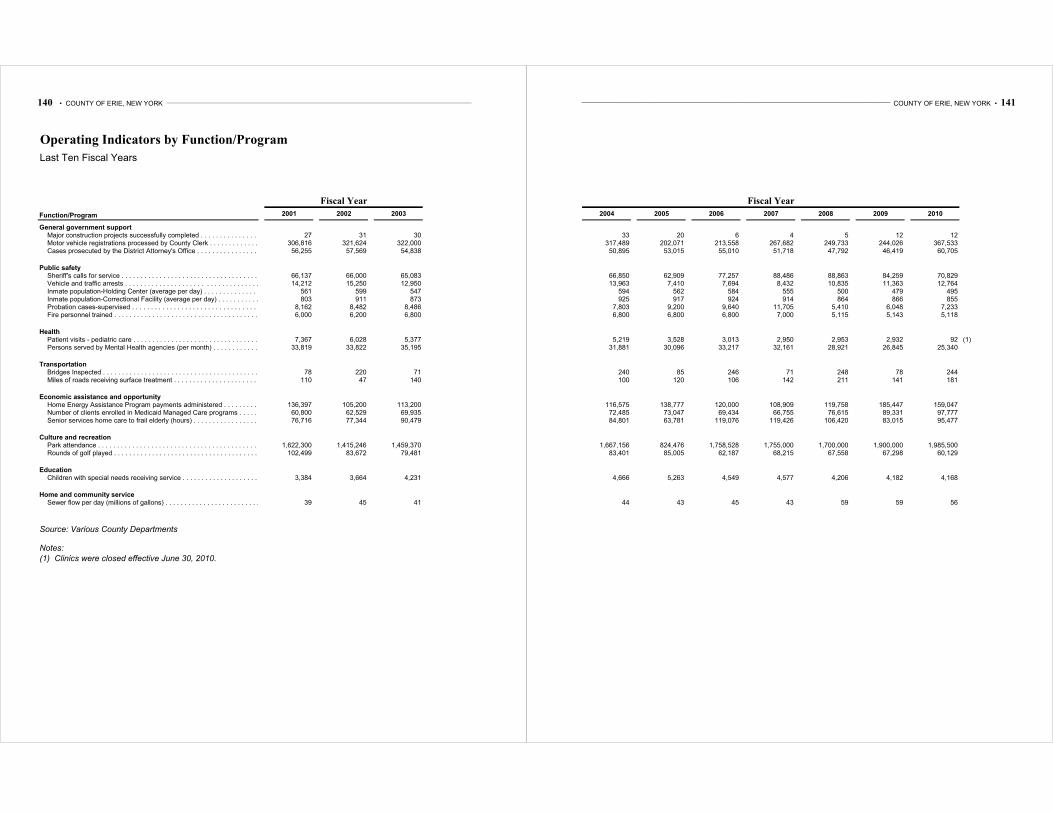
140 • COUNTY OF ERIE, NEW YORK ___________________________________________________________________________________________________________________________________
Operating Indicators by Function/Program
Last Ten Fiscal Years
2001 2002 2003
General government support Major construction projects successfully completed . . . . . . . . . . . . . . . . . . . . . . . . . . . . . . . . . . . . . . 27 31 30Motor vehicle registrations processed by County Clerk . . . . . . . . . . . . . . . . . . . . . . . . . . . . . . . . . . . . . 306,816 321,624 322,000Cases prosecuted by the District Attorney's Office . . . . . . . . . . . . . . . . . . . . . . . . . . . . . . . . . . . . . . 56,255 57,569 54,838
Public safety Sheriff's calls for service . . . . . . . . . . . . . . . . . . . . . . . . . . . . . . . . . . . . . . . . . . . . . . . . . . 66,137 66,000 65,083Vehicle and traffic arrests . . . . . . . . . . . . . . . . . . . . . . . . . . . . . . . . . . . . . . . . . . . . . . . . . 14,212 15,250 12,950Inmate population-Holding Center (average per day) . . . . . . . . . . . . . . . . . . . . . . . . . . . . . . . . . . . . . . 561 599 547Inmate population-Correctional Facility (average per day) . . . . . . . . . . . . . . . . . . . . . . . . . . . . . . . . . . 803 911 873Probation cases-supervised . . . . . . . . . . . . . . . . . . . . . . . . . . . . . . . . . . . . . . . . . . . . . . . . . . 8,162 8,482 8,486Fire personnel trained . . . . . . . . . . . . . . . . . . . . . . . . . . . . . . . . . . . . . . . . . . . . . . . . . . . . 6,000 6,200 6,800
Health Patient visits - pediatric care . . . . . . . . . . . . . . . . . . . . . . . . . . . . . . . . . . . . . . . . . . . . . . . . 7,367 6,028 5,377Persons served by Mental Health agencies (per month) . . . . . . . . . . . . . . . . . . . . . . . . . . . . . . . . . . . . . 33,819 33,822 35,195
Transportation Bridges Inspected . . . . . . . . . . . . . . . . . . . . . . . . . . . . . . . . . . . . . . . . . . . . . . . . . . . . . . . 78 220 71Miles of roads receiving surface treatment . . . . . . . . . . . . . . . . . . . . . . . . . . . . . . . . . . . . . . . . . . 110 47 140
Economic assistance and opportunity Home Energy Assistance Program payments administered . . . . . . . . . . . . . . . . . . . . . . . . . . . . . . . . . . . . . 136,397 105,200 113,200Number of clients enrolled in Medicaid Managed Care programs . . . . . . . . . . . . . . . . . . . . . . . . . . . . . . . . . 60,800 62,529 69,935Senior services home care to frail elderly (hours) . . . . . . . . . . . . . . . . . . . . . . . . . . . . . . . . . . . . . . 76,716 77,344 90,479
Culture and recreation Park attendance . . . . . . . . . . . . . . . . . . . . . . . . . . . . . . . . . . . . . . . . . . . . . . . . . . . . . . . . 1,622,300 1,415,246 1,459,370Rounds of golf played . . . . . . . . . . . . . . . . . . . . . . . . . . . . . . . . . . . . . . . . . . . . . . . . . . . . . 102,499 83,672 79,481
Education Children with special needs receiving service . . . . . . . . . . . . . . . . . . . . . . . . . . . . . . . . . . . . . . . . . 3,384 3,664 4,231
Home and community service Sewer flow per day (millions of gallons) . . . . . . . . . . . . . . . . . . . . . . . . . . . . . . . . . . . . . . . . . . . 39 45 41
Source: Various County Departments
Notes:
(1) Clinics were closed effective June 30, 2010.
Function/Program
Fiscal Year
______________________________________________________________________________________________________ COUNTY OF ERIE, NEW YORK • 141
2004 2005 2006 2007 2008 2009 2010
33 20 6 4 5 12 12317,489 202,071 213,558 267,682 249,733 244,026 367,53350,895 53,015 55,010 51,718 47,792 46,419 60,705
66,850 62,909 77,257 88,486 88,863 84,259 70,82913,963 7,410 7,694 8,432 10,835 11,363 12,764
594 562 584 555 500 479 495925 917 924 914 864 866 855
7,803 9,200 9,640 11,705 5,410 6,048 7,2336,800 6,800 6,800 7,000 5,115 5,143 5,118
5,219 3,528 3,013 2,950 2,953 2,932 92 (1)31,881 30,096 33,217 32,161 28,921 26,845 25,340
240 85 246 71 248 78 244100 120 106 142 211 141 181
116,575 138,777 120,000 108,909 119,758 185,447 159,04772,485 73,047 69,434 66,755 76,615 89,331 97,77784,801 63,781 119,076 119,426 106,420 83,015 95,477
1,667,156 824,476 1,758,528 1,755,000 1,700,000 1,900,000 1,985,50083,401 85,005 62,187 68,215 67,558 67,298 60,129
4,666 5,263 4,549 4,577 4,206 4,182 4,168
44 43 45 43 59 59 56
Fiscal Year
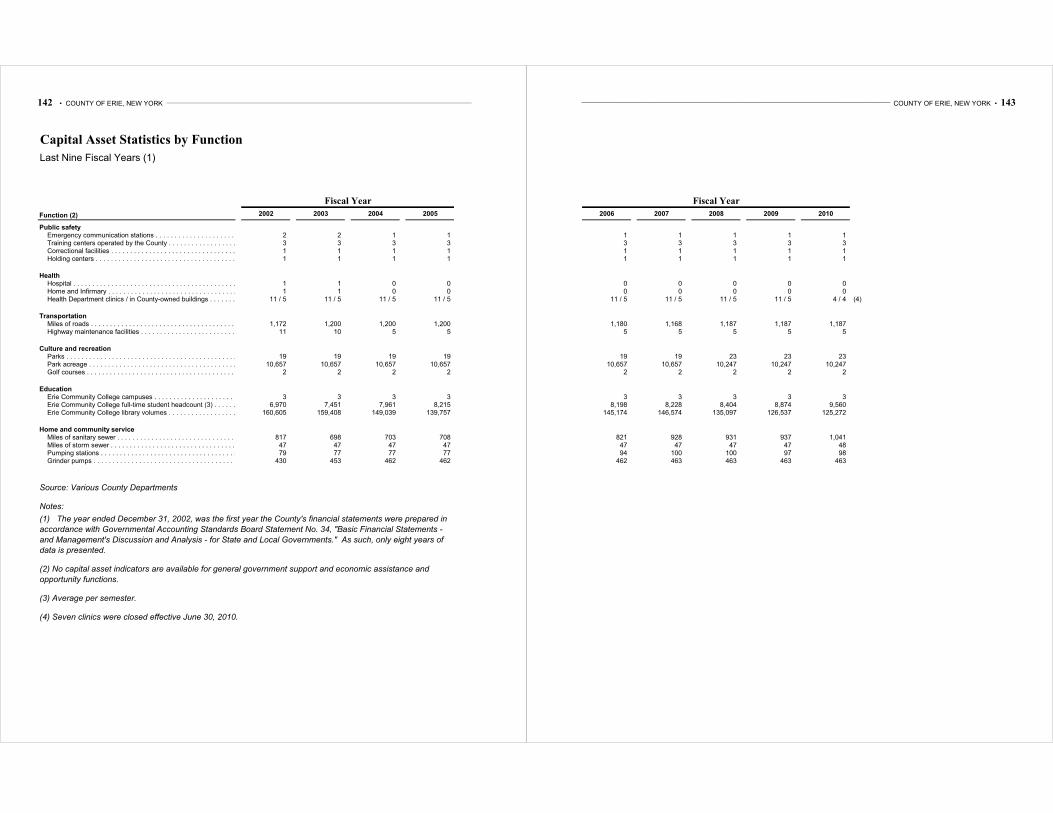
142 • COUNTY OF ERIE, NEW YORK ___________________________________________________________________________________________________________________________________
Capital Asset Statistics by Function
Last Nine Fiscal Years (1)
2002 2003 2004 2005
Public safety Emergency communication stations . . . . . . . . . . . . . . . . . . . . . . . . . . . . . . . . . . . . . . . . . . . . . . . 2 2 1 1 Training centers operated by the County . . . . . . . . . . . . . . . . . . . . . . . . . . . . . . . . . . . . . . . . . . . . 3 3 3 3 Correctional facilities . . . . . . . . . . . . . . . . . . . . . . . . . . . . . . . . . . . . . . . . . . . . . . . . . . . . 1 1 1 1 Holding centers . . . . . . . . . . . . . . . . . . . . . . . . . . . . . . . . . . . . . . . . . . . . . . . . . . . . . . . . 1 1 1 1
Health
Hospital . . . . . . . . . . . . . . . . . . . . . . . . . . . . . . . . . . . . . . . . . . . . . . . . . . . . . . . . . . 1 1 0 0 Home and Infirmary . . . . . . . . . . . . . . . . . . . . . . . . . . . . . . . . . . . . . . . . . . . . . . . . . . . . . . 1 1 0 0 Health Department clinics / in County-owned buildings . . . . . . . . . . . . . . . . . . . . . . . . . . . . . . . . . . . . 11 / 5 11 / 5 11 / 5 11 / 5
Transportation
Miles of roads . . . . . . . . . . . . . . . . . . . . . . . . . . . . . . . . . . . . . . . . . . . . . . . . . . . . . . . . 1,172 1,200 1,200 1,200 Highway maintenance facilities . . . . . . . . . . . . . . . . . . . . . . . . . . . . . . . . . . . . . . . . . . . . . . . . 11 10 5 5
Culture and recreation
Parks . . . . . . . . . . . . . . . . . . . . . . . . . . . . . . . . . . . . . . . . . . . . . . . . . . . . . . . . . . . . . 19 19 19 19 Park acreage . . . . . . . . . . . . . . . . . . . . . . . . . . . . . . . . . . . . . . . . . . . . . . . . . . . . . . . . . 10,657 10,657 10,657 10,657 Golf courses . . . . . . . . . . . . . . . . . . . . . . . . . . . . . . . . . . . . . . . . . . . . . . . . . . . . . . . . . 2 2 2 2
Education
Erie Community College campuses . . . . . . . . . . . . . . . . . . . . . . . . . . . . . . . . . . . . . . . . . . . . . . . . 3 3 3 3 Erie Community College full-time student headcount (3) . . . . . . . . . . . . . . . . . . . . . . . . . . . . . . . . . . . . 6,970 7,451 7,961 8,215 Erie Community College library volumes . . . . . . . . . . . . . . . . . . . . . . . . . . . . . . . . . . . . . . . . . . . . 160,605 159,408 149,039 139,757
Home and community service
Miles of sanitary sewer . . . . . . . . . . . . . . . . . . . . . . . . . . . . . . . . . . . . . . . . . . . . . . . . . . . . 817 698 703 708 Miles of storm sewer . . . . . . . . . . . . . . . . . . . . . . . . . . . . . . . . . . . . . . . . . . . . . . . . . . . . . 47 47 47 47 Pumping stations . . . . . . . . . . . . . . . . . . . . . . . . . . . . . . . . . . . . . . . . . . . . . . . . . . . . . . . 79 77 77 77 Grinder pumps . . . . . . . . . . . . . . . . . . . . . . . . . . . . . . . . . . . . . . . . . . . . . . . . . . . . . . . . . 430 453 462 462
Source: Various County Departments
Notes:
(3) Average per semester.
(4) Seven clinics were closed effective June 30, 2010.
(1) The year ended December 31, 2002, was the first year the County's financial statements were prepared in
accordance with Governmental Accounting Standards Board Statement No. 34, "Basic Financial Statements -
and Management's Discussion and Analysis - for State and Local Governments." As such, only eight years of
data is presented.
(2) No capital asset indicators are available for general government support and economic assistance and
opportunity functions.
Fiscal Year
Function (2)
______________________________________________________________________________________________________ COUNTY OF ERIE, NEW YORK • 143
2006 2007 2008 2009 2010
1 1 1 1 1 3 3 3 3 3 1 1 1 1 1 1 1 1 1 1
0 0 0 0 0 0 0 0 0 0
11 / 5 11 / 5 11 / 5 11 / 5 4 / 4 (4)
1,180 1,168 1,187 1,187 1,187 5 5 5 5 5
19 19 23 23 23 10,657 10,657 10,247 10,247 10,247
2 2 2 2 2
3 3 3 3 3 8,198 8,228 8,404 8,874 9,560
145,174 146,574 135,097 126,537 125,272
821 928 931 937 1,041 47 47 47 47 48 94 100 100 97 98
462 463 463 463 463
Fiscal Year