country size effects of international trade structure
TRANSCRIPT

Country Size Effects of International Trade Structure: Case of China and Russia
Chen Jun1, a, Oleksii A. Chugaiev2, b
1School of business, Jiangxi University of Science and Technology, Nanchang 330013, China 2Institute of International Relations, Taras Shevchenko National University of Kyiv, Kyiv 04119,
Ukraine a [email protected], b [email protected]
Keywords: country size, large economies, international trade, trade structure, industry, agriculture.
Abstract: The paper provides evidence for structural difference of international trade in small and large economies and its effect on economic growth. The merchandise trade structures of China and Russia differ from typical large economies with domination of inter-industry trade in bilateral relations.
1. Introduction
In our paper we check the hypothesis about dependence of structure of international trade on economy size. We further aim at finding optimal values of trade structure for small, medium-sized and large economies. Then we extrapolate the results for the large economies of China and Russia and their bilateral trade.
2. Literature Review
D. Perkins and M. Syrquin stress that larger economies tend to export more manufactures [1]. G. H. Hanson and Chong Xiang conclude that large economies are more suitable for industries with high transportation costs and differentiated products [2]. Kwok Tong Soo estimated that large economies export relatively less consumer products and relatively more intermediate products [3]. М. Perry stressed that small economies tend to specialize in low-tech industry [4]. P. Braunerhjelm and P. Thulin do not prove the home market effect for exports of high-tech products in the OECD countries. Differentiation of products and vertical specialization under trade liberalization allowed small economies to participate in high-tech production [5]. J. Fagerberg proved the home market effect for several high-tech industries [6].
2018 2nd International Conference on Innovations in Economic Management and Social Science (IEMSS 2018)
Published by CSP © 2018 the Authors 117
3. Methodology
The analyzed countries are divided into three groups according to their GDP at purchasing power parity in 2015: 31 large economies (GDP > $640 billion), 63 medium-sized economies ($640 billion > GDP > $70 billion) and 95 small economies (GDP < $70 billion).
We use ANOVA with F-test for difference in means, Kruskal-Wallis test and median test to estimate the country size effect on foreign trade. In order to assess the structural difference of trade in comparison to typical structure of large economies, we also use the formula:
ITSD = Σ(Sia - Sile)/2 (1)
ITSD is the index of export or import structural difference, % (0% means that trade structures of two exporting countries (economies) to the third one, are perfectly similar, and 100% means that they are perfectly different); Sia is the share of the product group i in exports or imports of the country or group of countries a; Sile is the average share of the product group i in exports or imports of large economies. The relevant indicators for China and Russia in 2016 are compared with the mean values for large economies.
Two-way ANOVA is used to estimate the effect of trade structure on real GDP per capita growth. We estimate the main effect of each binary trade variable (two groups of values with a threshold which equals to the mean value for all the countries) and the interaction effect between economy size and a trade indicator. Robustness of results is checked with the ordinary least square regression analysis. The general formula is:
GDPgr = b0 + b1GNIpc + b2TS (2)
GDPgr is the average GDP per capita growth in a country in %, GDPpc is the GNI per capita in thousand dollars (PPP method, thousand dollars in 2015), TS is a trade structure variable for exports or imports. We use the mean values of GDP growth and trade structure indicators for 2009-2016 for each country.
4. Results
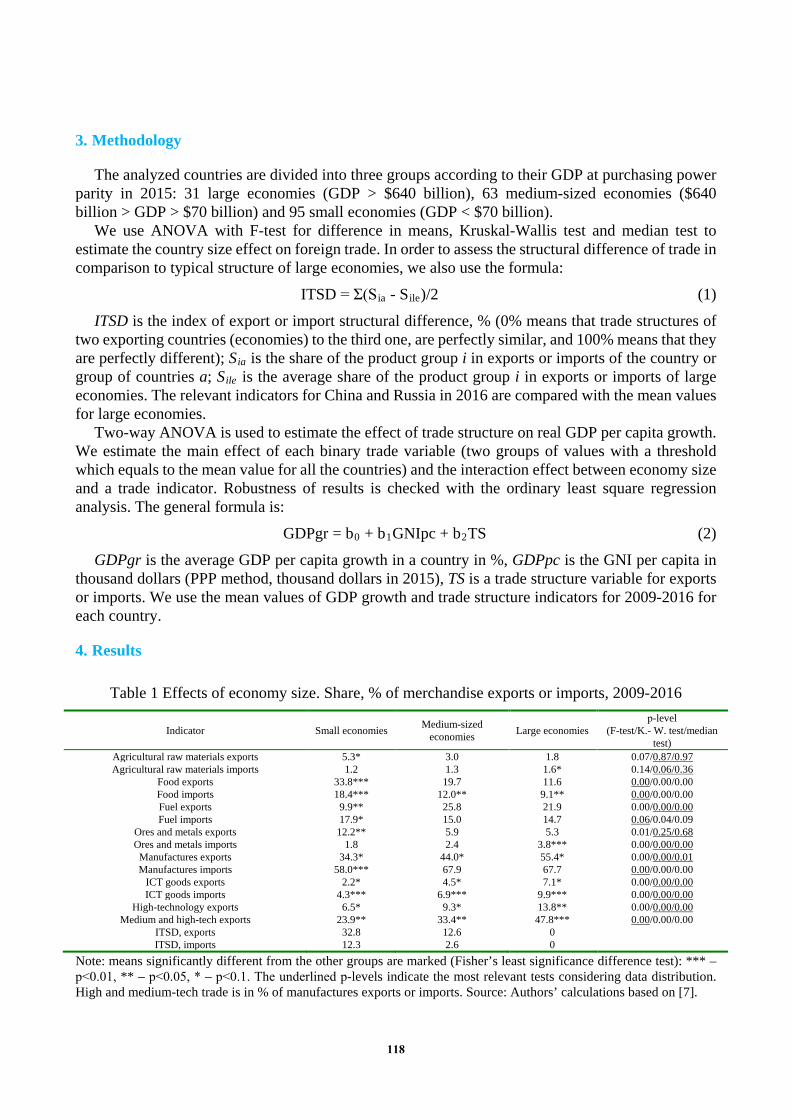
Table 1 Effects of economy size. Share, % of merchandise exports or imports, 2009-2016
Indicator Small economies Medium-sized economies Large economies
р-level (F-test/K.- W. test/median
test) Agricultural raw materials exports 5.3* 3.0 1.8 0.07/0.87/0.97 Agricultural raw materials imports 1.2 1.3 1.6* 0.14/0.06/0.36
Food exports 33.8*** 19.7 11.6 0.00/0.00/0.00 Food imports 18.4*** 12.0** 9.1** 0.00/0.00/0.00 Fuel exports 9.9** 25.8 21.9 0.00/0.00/0.00 Fuel imports 17.9* 15.0 14.7 0.06/0.04/0.09
Ores and metals exports 12.2** 5.9 5.3 0.01/0.25/0.68 Ores and metals imports 1.8 2.4 3.8*** 0.00/0.00/0.00
Manufactures exports 34.3* 44.0* 55.4* 0.00/0.00/0.01 Manufactures imports 58.0*** 67.9 67.7 0.00/0.00/0.00
ICT goods exports 2.2* 4.5* 7.1* 0.00/0.00/0.00 ICT goods imports 4.3*** 6.9*** 9.9*** 0.00/0.00/0.00
High-technology exports 6.5* 9.3* 13.8** 0.00/0.00/0.00 Medium and high-tech exports 23.9** 33.4** 47.8*** 0.00/0.00/0.00
ITSD, exports 32.8 12.6 0 ITSD, imports 12.3 2.6 0
Note: means significantly different from the other groups are marked (Fisher’s least significance difference test): *** – р<0.01, ** – р<0.05, * – р<0.1. The underlined p-levels indicate the most relevant tests considering data distribution. High and medium-tech trade is in % of manufactures exports or imports. Source: Authors’ calculations based on [7].
118
We have found no significant effect of economy size on international trade in agricultural raw materials. Small economies tend to be more structurally dependent on exports and imports of food than other countries. Also small economies usually import slightly more fuels and export less fuels than other economies. Large economies import more ores and metals. They also rely more on manufactures exports. The share of manufactures imports in medium-sized economies is as high as in large economies, while the share of manufactures exports is smaller. Larger economies also seem to be leaders in exports and imports of ICT goods, high-tech and medium-tech exports (see the Table 1). Medium-sized economies are more similar with large economies than with small ones. Export structures are more different than import structures.
The two-way ANOVA provided no evidence that trade in fuels and high-tech exports have a significant effect on economic growth. Small and medium-sized economies with the share of agricultural raw materials exports more than 3.9% experienced higher economic growth (with mean /median GDP per capita growth 2.4%/2.0%) in comparison to other countries (1.0%/1.0%). The effect for large economies is different: those with the share of agricultural raw materials imports more than 3.9% performed better (2.5%/2.2%) than other large economies (0.7%/0.5%). Fast growing medium-sized economies had the share of food in exports more than 25% (3.1%/3.3%) unlike other countries of similar size (0.9%/1.1%). Meanwhile small and medium-sized economies with food imports less than 14.4% were more successful (1.7%/1.7%) unlike other countries (1.0%/1.2%). Medium-sized economies with ores and metals less than 2.4% of imports had economic growth 2.3%/2.3% unlike in other economies of similar size (0.5%/0.5%). Large economies with the share of manufactures in imports less than 63% are more efficient (3.0%/2.1%) than other large economies (1.1%/0.8%). The best performing medium-sized economies (among low and medium-income economies only) are those with medium and high-tech exports less than 33% of manufactures exports (2.0%/2.5%) in comparison to other countries of similar size and development level (1.0%/0.9%).
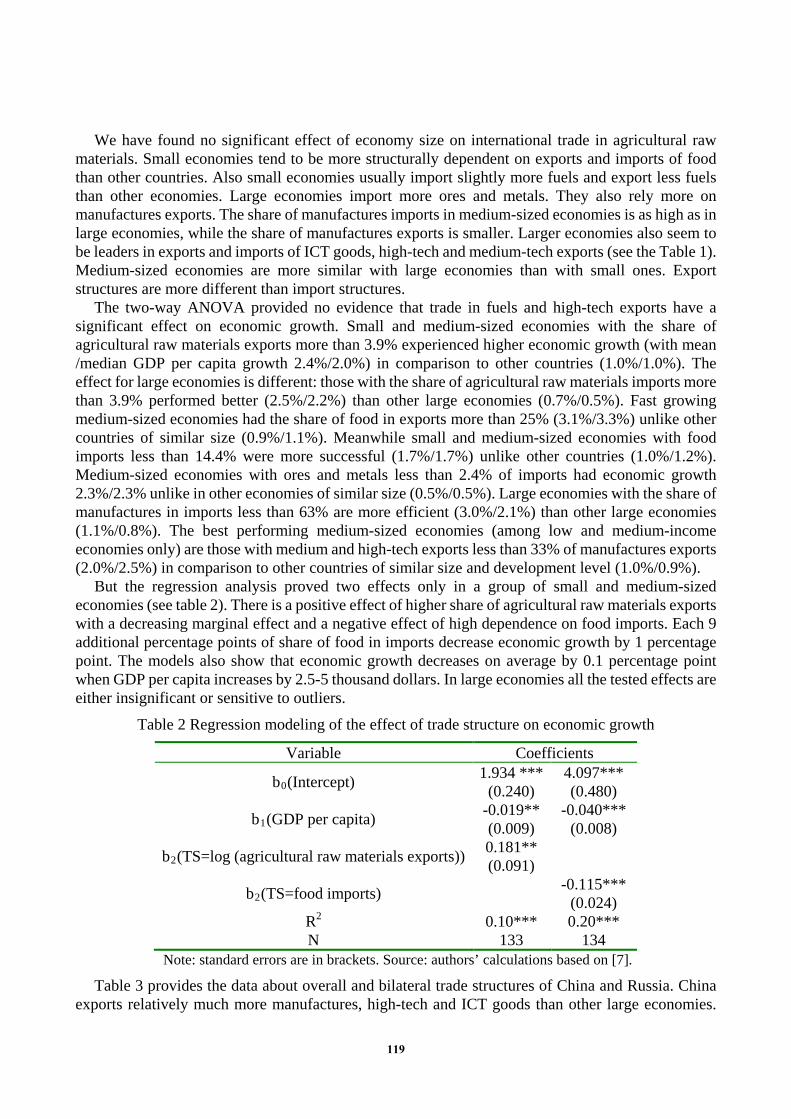
But the regression analysis proved two effects only in a group of small and medium-sized economies (see table 2). There is a positive effect of higher share of agricultural raw materials exports with a decreasing marginal effect and a negative effect of high dependence on food imports. Each 9 additional percentage points of share of food in imports decrease economic growth by 1 percentage point. The models also show that economic growth decreases on average by 0.1 percentage point when GDP per capita increases by 2.5-5 thousand dollars. In large economies all the tested effects are either insignificant or sensitive to outliers.
Table 2 Regression modeling of the effect of trade structure on economic growth
Variable Coefficients
b0(Intercept) 1.934 *** (0.240)
4.097*** (0.480)
b1(GDP per capita) -0.019** (0.009)
-0.040*** (0.008)
b2(TS=log (agricultural raw materials exports)) 0.181** (0.091)
b2(TS=food imports) -0.115*** (0.024)
R2 0.10*** 0.20*** N 133 134
Note: standard errors are in brackets. Source: authors’ calculations based on [7].
Table 3 provides the data about overall and bilateral trade structures of China and Russia. China exports relatively much more manufactures, high-tech and ICT goods than other large economies.
119
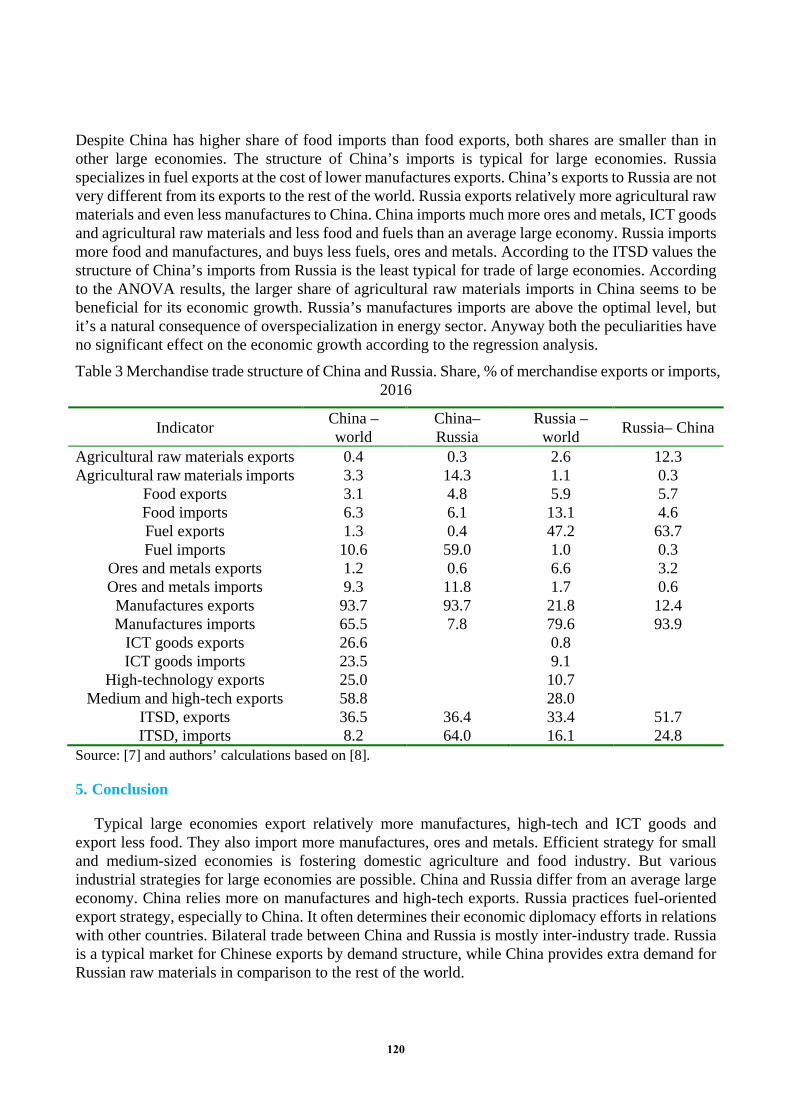
Despite China has higher share of food imports than food exports, both shares are smaller than in other large economies. The structure of China’s imports is typical for large economies. Russia specializes in fuel exports at the cost of lower manufactures exports. China’s exports to Russia are not very different from its exports to the rest of the world. Russia exports relatively more agricultural raw materials and even less manufactures to China. China imports much more ores and metals, ICT goods and agricultural raw materials and less food and fuels than an average large economy. Russia imports more food and manufactures, and buys less fuels, ores and metals. According to the ITSD values the structure of China’s imports from Russia is the least typical for trade of large economies. According to the ANOVA results, the larger share of agricultural raw materials imports in China seems to be beneficial for its economic growth. Russia’s manufactures imports are above the optimal level, but it’s a natural consequence of overspecialization in energy sector. Anyway both the peculiarities have no significant effect on the economic growth according to the regression analysis.
Table 3 Merchandise trade structure of China and Russia. Share, % of merchandise exports or imports, 2016
Indicator China – world
China– Russia
Russia – world Russia– China
Agricultural raw materials exports 0.4 0.3 2.6 12.3 Agricultural raw materials imports 3.3 14.3 1.1 0.3
Food exports 3.1 4.8 5.9 5.7 Food imports 6.3 6.1 13.1 4.6 Fuel exports 1.3 0.4 47.2 63.7 Fuel imports 10.6 59.0 1.0 0.3
Ores and metals exports 1.2 0.6 6.6 3.2 Ores and metals imports 9.3 11.8 1.7 0.6
Manufactures exports 93.7 93.7 21.8 12.4 Manufactures imports 65.5 7.8 79.6 93.9
ICT goods exports 26.6 0.8 ICT goods imports 23.5 9.1
High-technology exports 25.0 10.7 Medium and high-tech exports 58.8 28.0
ITSD, exports 36.5 36.4 33.4 51.7 ITSD, imports 8.2 64.0 16.1 24.8
Source: [7] and authors’ calculations based on [8].
5. Conclusion
Typical large economies export relatively more manufactures, high-tech and ICT goods and export less food. They also import more manufactures, ores and metals. Efficient strategy for small and medium-sized economies is fostering domestic agriculture and food industry. But various industrial strategies for large economies are possible. China and Russia differ from an average large economy. China relies more on manufactures and high-tech exports. Russia practices fuel-oriented export strategy, especially to China. It often determines their economic diplomacy efforts in relations with other countries. Bilateral trade between China and Russia is mostly inter-industry trade. Russia is a typical market for Chinese exports by demand structure, while China provides extra demand for Russian raw materials in comparison to the rest of the world.
120

Acknowledgements
This article is supported by the youth program of University Humanities and Social Science Foundation of Jiangxi. (No.JJ17215).
References
[1] Perkins D. 1989. Large countries: the influence of size. Handbook of Development Economics, Vol. II., Chenery H, Srinivasan T N (Eds.). Amsterdam: Elsevier Science. DOI: 10.1016/S1573-4471(89)02019-X. [2] Hanson G H, Xiang Ch. 2002. The home market effect and bilateral trade patterns. Working Paper No. 9076. Cambridge, MA: National Bureau of Economic Research. DOI: 10.3386/w9076. [3] Kwok Tong Soo. 2016. Country size and trade in intermediate goods. Economics Working Paper Series No. 2016/013. Lancaster University Management School. [4] Perry M. 2001. Shared trust in small countries. The limits to borrowing model. New Economy, Vol. 8, No. 3. [5] Braunerhjelm P, Thulin P. 2006. Can countries create comparative advantages? R&D-expenditures, high-tech exports and country size in 19 OECD-countries, 1981–1999. CESIS Electronic Working Paper No. 61. [6] Fagerberg J. 1995. Is there a large-country advantage in high-tech? Norwegian Institute of International Affairs. Retrieved April 11, 2018 from: https://www.researchgate.net/publication/ 23546914_Is_there_a_large-country_advantage_in_high-tech. [7] The World Bank. 2018. World Development Indicators. Retrieved February 22, 2018 from: http://data.worldbank.org/data-catalog/world-development-indicators. [8] UNCTADStat. 2018. Data center. Retrieved April 10, 2018 from: http://unctadstat.unctad.org/wds/ReportFolders/reportFolders.aspx?sCS_ChosenLang=en.
121