country nutrition paper - fao.org
TRANSCRIPT

Country Nutrition Paper
Submitted by: Swaziland
Prepared for the
Joint FAO/WHO Second International Conference on
Nutrition
ICN2
Technical Proposal

2
Summary table
General Indicators Most recent n/%
Sources/ Year [i]
Total population 1.093 million Population Projections 2013
National birth rate 3.8 DHS 2007
Total number of live births 70072 Maternal Health report 2013
National life expectancy (males, females) 45.5% Population Projections 2013
Human Development Index rank 0.53 UNDP 2014
Population % below international poverty 63 SHIES 2010
Under-five mortality rate (per 1000 live birth)
104 MICS 2010
Infant mortality ratio/100 000 79 MICS 2010
Maternal mortality ratio/100 000 live births (reported)
390 UNICEF 2005
Primary net enrolment or attendance ratio 115% World Bank 2011
Primary school net enrolment – ratio of males/females
89.8% World Bank 2011
Access to improved drinking water rural areas - %
61% UNICEF 2008
Access to improved sanitation in rural areas - %
53% UNICEF 2008
Arable land area - % 1720 FAO 2011
Average dietary energy requirement – kcal 2240 FAO 2010
Dietary energy supply (DES) kcal 2290 FAO 2010
Total protein share in DES - % 10.9 FAO 2010
Fat share in DES - % 20.9 FAO 2010
Average daily consumption of calories per person - kcal
Calories from protein - %
Calories from fat - %
Average daily fruit consumption (g) 1.1% STEPS 2008
Average daily vegetable consumption (g) 1.6% STEPS 2008
Prevalence of stunting in children < 5 years of age
31% MICS 2010
Prevalence of wasting < 5 years of age 1% MICS 2010
Prevalence of underweight children < 5years of age
5.9% MICS 2010
Prevalence of obesity >30 BMI - Children under 5 years old - Adults
23% MICS 2010
Women (15-49 years) with a BMI <18.5 kg/m2
3% MICS 2010
Exclusive breastfeeding under 6 months % 44.1% MICS 2010
Breastfeeding with complimentary foods (6-9 months)
60% MICS 2010
Household consuming adequately iodized salt (> 15 ppm)- %
52% MICS 2010
Vitamin a supplementation coverage rate 68% MICS 2010

3
General Indicators Most recent n/%
Sources/ Year [i]
for children aged 6-59 months - %
Percentage of children age 6-59 months with anaemia
42% DHS 2006/7
Percentage of women age 15-49 with anaemia
30% DHS 2006/7
Framework of the country paper for the
1.1 Swaziland Geographic information
The Kingdom of Swaziland is the smallest landlocked country in Southern Africa measuring
approximately 17,000 km2. The country enjoys a tropical to near-temperate climate along the
western highlands, which rises to an altitude of over 1,800 metres above sea level, while the
lowveld areas are generally hot. Swaziland lies in a summer rainfall region. Swaziland’s HDI
value for 2012 is 0.536—in the medium human development category—positioning the
country at 141 out of 187 countries and territories. Between 1980 and 2012, Swaziland’s life
expectancy at birth decreased by 5.4 years, mean years of schooling increased by 3.5 years
and expected years of schooling increased by 2.2 years.
1.2 Main Socio and economic development since 1992
1.2.1 Agriculture
The estimated area planted to maize (major staple) for 2012/13 season amounted to 61,260 Ha,
reflecting a slight increase from the previous season which has 52,064 Ha cultivated. Other
food crops including legumes, tubers and pulses are produced on a relatively small scale. The
main cash crops include sugar cane (sugar), citrus, pineapples, cotton and forest plantations.
The main livestock produced in Swaziland, include cattle, goats and poultry (indigenous,
broilers, and layers). The most significant being cattle slaughtered and exported to European
markets where the country has an export quota. (Include figures).

4
The country imports a bulk of its vegetables; however this is a rapidly growing industry, with
the main vegetables produced locally including cabbage, beetroot, spinach, lettuce for the local
market and a small portion for export by the national agricultural marketing board and other
exporters.
1.2.2 Food Security (food availability, access, utilization, diet and food habits, and coping
mechanisms)
Food availability, as expressed in the food balance sheet remains in net deficit in the country;
as of 2013/2014 marketing year, the total production (of maize), was estimated at 81,934mt,
whilst the requirement for the same period is estimated at 116,420mt. The balance of over
40,000mt will be covered by imports and food aid (provided by the Government and other
development partners).
During 2013/2014 consumption year, an estimated 289,920 people are at risk of food
insecurity. Although over 70% of the population is involved in agriculture, only 20% of there
of households derive food from own production. Other means of accessing food include
purchase, food assistance, battering and employment of coping means (switching to less
preferred foods, reduction of number of meals, asset disposal and borrowing).
Food utilisation is affected by among other things the high disease burden and accompanying
effects such as poor production and poor food use efficiency in the body. The country also has
challenges of access to safe drinking water; seven in ten households in Swaziland obtain water
from improved sources. Water is available on the premises for 76 percent of households in the
urban areas and 22 percent of households in rural areas. Overall, one in four households take
30 or more minutes to obtain water; 4 percent in the urban areas compared with 34 percent in
the rural areas.
Malnutrition challenges manifested in high stunting (weight for height) ratios in children
(currently estimated at 31%, MICS 2010) and obesity (consistently estimated at over 50% in
Swazi women aged between 15-49, DHS 2007) in adults. According to the WHO STEPS
(2008) Swaziland is ranked as having the second highest levels of obesity in the WHO
countries in Africa.

5
'Shiselweni 1
'SomntongoZombodze
Hosea'Matsanjeni
Maseyisini
'SigweSandleni Ngudzeni
MbangweniLubuli
Mtsambama
Nkwene
Gege
Kubuta
Sithobela
Nkilongo
Mahlangatja
Ngwempisi
Ntondozi
SiphofaneniNhlambeni
LamgabhiMthongwaneni
KwaluseniManzini
Tikhuba
Mahlanya
MangcongcoMpolonjeni
LobambaMafutseniMhlambanyatsi
Ludzeludze
Dvokodvweni
Kukhanyeni
Mbabane Mdzimba
Mkhiweni
Motjane
Hlane
Maphalaleni
Nkhaba
Madlangempisi
Lomahasha
Mhlume
Ndzingeni
Piggs Peak
Mhlangatane
Mayiwane
Ntfonjeni
Timpisini
Lugongolweni
Swaziland Survival Deficit for 2013
Shiselweni
Manzini
Hhohho
Lubombo
Legend
Map Source: Swazi VAC 2013.
1.2.3 Gross Domestic Product (GDP)
According to the World Bank, Swaziland, with a Gross National Income (GNI) of $2,860 in
2012, comfortably sits in the lower middle-income category of countries ($1,036 to $4,085).
The Swazi economy is relatively diversified compared to other small economies and economic
growth has averaged 1.3 percent in the past five years, against a national target of 5 percent.
Nominal Gross Domestic Product (GDP) was E32.4 billion in 2012 (around US$3.6 billion),
driven mainly by manufacturing, agriculture and wholesale and retail industry. Agro-based
manufacturing, specifically sugar processing, wood pulp production and food canning,
contributes a growing share to Swaziland’s Gross Domestic Product (GDP). Supported by
trade preferences, the country exports a large range of products including sugar, textiles, soft
drink concentrates, canned fruit and citrus fruits. Swaziland is integrated into the global
economy and is a member of the Southern African Customs Union (SACU), Southern African
6
Development Community (SADC) and Common Market for Eastern and Southern Africa
(COMESA). The country is also a beneficiary of the Africa Growth and Opportunity Act
(AGOA), promulgated by the United States, and the Cotonou Agreement signed with the
European Union (EU). However, the global economic crisis, a depression of prices in the
agricultural sector, persistent drought, climate change, and the human toll of HIV/AIDS have
compromised the country’s ability to implement policies that will help achieve its goals for
health, education, job creation, safe water, sanitation, and rural development. The economic
growth rate declined from an average of 10 percent in the 1990s to 3 percent in the last ten
years. Health remains a priority sector for Government: the annual budget allocation to health
has increased from about 6.5% in 2002 to 12.2% in 2012 and 13% in 2013.
1.2.4 Poverty rates
The prevalence of poverty, measured by the proportion of people living below the poverty line,
increased from 66 percent in 1995 to 69 percent in 2001 as shown by the Swaziland Household
Income and Expenditure Survey (SHIES) of 2001. This is attributed to many factors: inter-alia,
the decline in incomes and stagnation of real private consumption associated with slowing
economic growth that started in early 1990’s and worsened post 2000; the fall in real GDP
growth from an annual average of 8 percent in the 1980’s to 3.5 percent in the 1990’s; the
relocation of some companies from Swaziland to South Africa after the democratisation
process of South Africa that led to increases in unemployment rates’ and the impact of
HIV/AIDS during the same time.
This is consistent with the fall in the prevalence of poverty projected in the T21 model,
currently being developed by the Ministry of Economic Planning and Development to project
poverty figures. Projections indicate that poverty is declining. In fact, 64 percent is projected to
be the population living below the poverty line for the year 2009/10.
More recently, the global economic and financial crisis has had a detrimental impact on
employment prospects in the country. Reduced demand for Swazi exports contributed to the
closure of companies and the loss of around 3000 jobs in the manufacturing sector (Budget
Speech 2010). In response the country has set itself a target of creating at least 10 000 jobs in
2010.
1.3 Main population, health and human development.
1.3.1 Population
The population was estimated at 1.093 million in 2013, based on projections from the 2007
national census. Fifty-three percent of the population is female and almost half (48%) of
households is headed by a woman. Swaziland has a young population with 44 percent of the
population under 15 years; 4 percent is aged 65 years or older. The total fertility rate was
estimated at 3.8 births per 1000 women in 2007, representing a significant decline from 6.4 in
1986. Declining fertility levels, coupled with a rising rate of mortality, have been responsible
for the low annual rates of population growth.
7
1.3.2 Health
The health status in Swaziland is below expectation, with life expectancy at birth estimated at
only 54 years (52 years for males, and 55 years for females) according to the WHO 2014
World Health Statistics. This level is very low, as compared to other middle-income countries
where the expectation of life (at birth) on average ranges from 63.8 – 72 years for males, and
67.9 – 76.2 years for females. The rate is even lower than that for low-income countries (60.2
years for males, and 63.1 years for females). The rate is however higher than it was in the year
2000, when it had dropped to 48 years (48 and 49 years for males and females respectively),
though not yet at the level of 1990 where it was at 61 years (62 and 61 years for males and
females respectively).
While the numbers of new HIV infections and deaths are on a downward trend, the overall
prevalence remains high, due to the large population that exists with HIV/AIDS in the country.
TB contribution in the Burden of Disease (BOD) can be recognized considering that “in 2012
the number of people newly diagnosed with TB increased from 811 in 2010 to 1671. The
increase is no doubt in part due to a six-fold increase in the TB case detection rate as well as a
general increase in the TB burden...”. (eNSF).
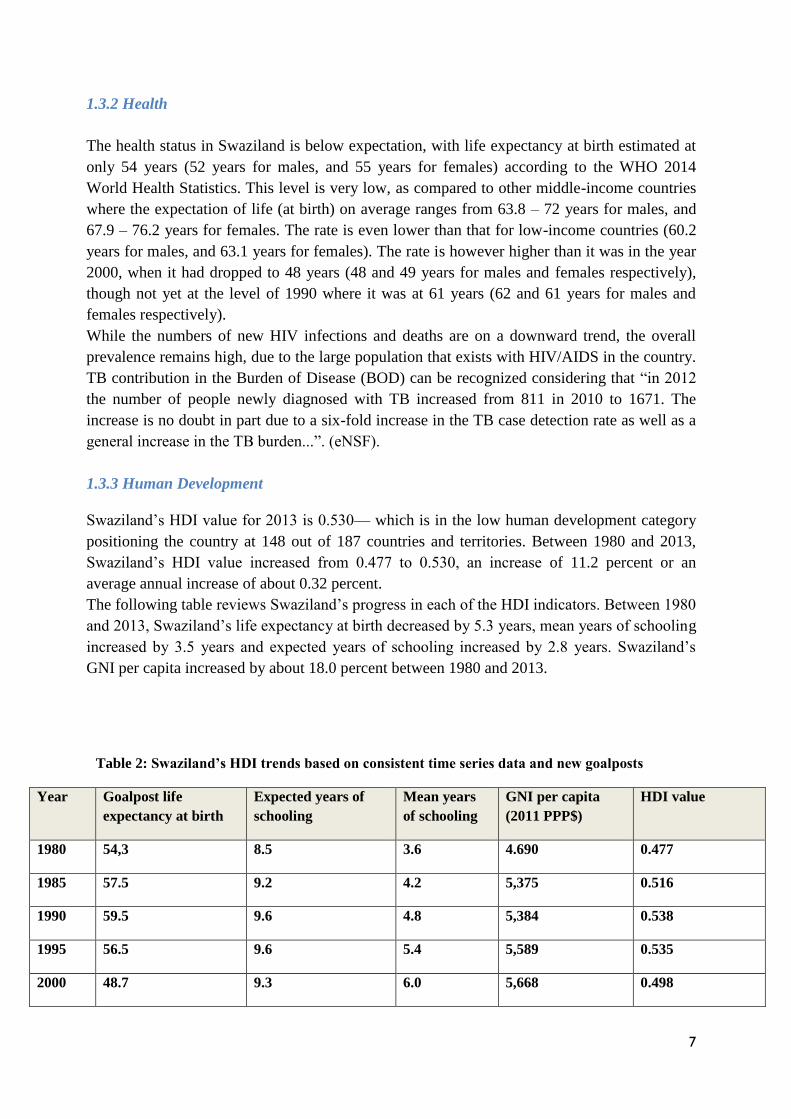
1.3.3 Human Development
Swaziland’s HDI value for 2013 is 0.530— which is in the low human development category
positioning the country at 148 out of 187 countries and territories. Between 1980 and 2013,
Swaziland’s HDI value increased from 0.477 to 0.530, an increase of 11.2 percent or an
average annual increase of about 0.32 percent.
The following table reviews Swaziland’s progress in each of the HDI indicators. Between 1980
and 2013, Swaziland’s life expectancy at birth decreased by 5.3 years, mean years of schooling
increased by 3.5 years and expected years of schooling increased by 2.8 years. Swaziland’s
GNI per capita increased by about 18.0 percent between 1980 and 2013.
Table 2: Swaziland’s HDI trends based on consistent time series data and new goalposts
Year Goalpost life
expectancy at birth
Expected years of
schooling
Mean years
of schooling
GNI per capita
(2011 PPP$)
HDI value
1980 54,3 8.5 3.6 4.690 0.477
1985 57.5 9.2 4.2 5,375 0.516
1990 59.5 9.6 4.8 5,384 0.538
1995 56.5 9.6 5.4 5,589 0.535
2000 48.7 9.3 6.0 5,668 0.498

8
2005 45.9 9.9 6.6 6,343 0.498
2010 48.4 11.1 7.1 5,784 0.527
2011 48.7 11.3 7.1 5,710 0.530
2012 48.9 11.3 7.1 5,451 0.529
The country paper for the
FAO/WHO Second International Conference on Nutrition (ICN2)
Inputs from the Food and Agriculture Sector
1. Current nutrition policy framework and implementation mechanisms in the
country.
The existing policy framework (i.e. policies, strategies and action plans related to nutrition,
food security, agricultural development, sustainability, etc.) for addressing nutrition
problems in your country.
The country has developed policies and strategies to guide food and nutrition security
intervention in the country to addressing nutrition problems in the country. These policies and
9
strategies include Comprehensive Agriculture policy, Food and Nutrition Security policy,
National Food and Nutrition Policy pending cabinet approval, Poverty Reduction Strategy
(PRSP), National development Strategy (NDS), Sexual and Reproductive Health Policy,
National Health Sector Strategic Plan (NHSSP) (please refer to table 2).
The policy and programme implementation mechanisms in the country for
improving food and nutrition security:
Emanating from the Nutrition Plan of Action developed in 1992, the country has managed to
establish a Nutrition Council responsible for advocacy, coordination and strategic guidance
on nutrition issues in Swaziland. The Nutrition Council was allocated an office and to execute
its duties. The Council was allocated a budget through the Ministry of Health which is the
parent ministry to implement nutrition interventions in the country. The Nutrition Council
works in collaboration with other government sectors such as the Ministry of Agriculture, the
Ministry of Education and the Ministry of Health. Therefore, nutrition sensitive interventions
are integrated within these government ministries and partners dealing with nutrition.
However, nutrition specific interventions are done by the Nutrition Council thus it has a dual
role in as far and nutrition is concerned in Swaziland.
The country has also joined the SUN movement (Scaling Up Nutrition) with the objective of
ensuring that nutrition interventions are well coordinated and evaluated. In this regard, the
country has developed a multi-stakeholder platform where all food and nutrition stakeholders
are expected to meet and share they plans and progress reports on nutrition interventions on a
yearly basis.
Food and agriculture programs and interventions being implemented to improve
nutrition:
1. Agriculture
The economy of Swaziland is largely based on agriculture and characterized by a
strong agriculture based manufacturing sector. Production of agricultural commodities
takes place in Swazi Nation Land and Tittle Deed Land. Despite the adverse
challenges in the production environment, agriculture remains the principal source of
livelihood for over 70% of the population. In addition, agriculture remains one of the
largest employers, contributing about 20% to the country’s formal employment sector.
The following are programs done by the Ministry of Agriculture:
a) Animal Production
The animal production division was established to equip livestock producers with adequate
knowledge, skills and technical expertise on the efficient management of all resources that
will ensure profitable returns and an efficient and sustainable livestock industry. The thrust is
to promote commercialization of cattle, poultry, pig and goat production to ensure food
security, poverty alleviation and improved living standards of the farming community.
The division has seven sections; which are livestock production extension, fattening and sisa
ranches, cattle breeding stations, range management and animal nutrition, livestock
marketing, pig breeding and data process & investigations.

10
b) Agriculture Crop Promotion and extension services
This program is responsible for the promotion of crop production as well as promoting
improved human nutrition. The department’s major activity is to provide an agricultural
extension service that advises farmers on improved farming systems and technologies that
will assure increased productivity and improve their standards of living.
c) Home Economics Section
Responsible for enhancing improved household economics and livelihoods through
promotion of improved nutrition, home management, child care and development, consumer
education and income generation.
d) Fisheries section
Responsible for promoting the development and sustainable utilization of fisheries resources
at both household and national level for increased national food and nutrition security, income
generation and poverty alleviation.
2. Health
a) Prevention and control of micronutrient deficiencies
Micronutrients deficiencies are of concern in the country. The deficiencies which are of
public health significance in Swaziland include vitamin A deficiency, Iron deficiency, Iodine
Deficiency Disorders. These deficiencies are preventable and the appropriate intervention
strategies are available. The country introduced salt iodization regulations to ensure all retail
outlets sell iodized salt to prevent iodine deficiency disorders. Children between 6-59 months
are given vitamin A supplements to prevent vitamin A deficiencies and this is done with
assistance from partners from both NGOs and UN agencies. Other interventions aimed at
prevention of micronutrient deficiencies include campaigns on micronutrients which are done
at Inkhundla level to sensitize communities on the importance of fruits and vegetable
consumption as well as importance of food fortification and the enforcement of household
backyard gardens.
b) Infant and Young Child Feeding
The country has made a remarkable progress on promoting exclusive breastfeeding in
infants from 0-6months. According to MICS 2010, the exclusive breastfeeding rate is
at 44% which is from 32% according to DHS 2006/7. In promoting exclusive
breastfeeding the country has ensured that facilities that have maternity wing are baby
friendly through the implementation of BFHI at health facilities.
This program is implemented both at facility and community level. At community
level the program has a special focus on using a community oriented approach to
address performance gaps within infant and young child feeding. Issues such as
maternal nutrition, PMTCT and community management of malnutrition are also
integrated into community based approaches, mobile outreach teams and primary
health centers.
11
c) Community Based Growth Monitoring and Promotion
The integrated community based growth monitoring and promotion program (ICBGM & P)
was established by the Ministry of Health in conjunction with UNICEF in 2010. The
ICBGM&P programme was initiated to respond to conditions that were threatening the health
of children more especially those who are under five (5) years as they are alleged to be more
vulnerable than other groups in all communities.
These conditions include HIV and AIDS, Diarrhoea, pneumonia, Childhood illnesses and
Severe malnutrition. The RHMs, according to this initiative, perform activities related to the
following programs and/or tasks, Expanded program of immunisation (EPI), Integrated
management of childhood illnesses (IMCI), Nutritional surveillance (MUAC, weighing, and
nutritional oedema), De-worming, Health education/promotion, Growth faltering and chronic
illnesses identification and counselling as well as assessment of special needs for Orphaned
and Vulnerable children.
d) Food-by-Prescription
The programme identifies malnourished individuals based on their Body Mass Index, Mid-
Upper Arm Circumference, and weight measurements, using internationally accepted baseline
measurements. Individuals who are both malnourished and participating in one of the eligible
treatment programmes (ART, TB, PMTCT and ANC) offered supplementary feeding
products designed to reduce malnutrition and to incentivize them to attend their clinical
appointments and improve their nutritional health, as well as that of their families. The food
distribution component of the programme is not a general food security intervention.
It is not concerned with the alleviation of poverty or even the alleviation of hunger
outside the target groups. The programme is administered by the Ministry of Health
with the objective of improving the health status and treatment adherence of health
system clients.
e) Integrated Management of Acute Malnutrition
The Integrated Management of Malnutrition (IMAM) was established in the country in 2007.
The purpose of the intervention is to reduce the child morbidity and mortality due to acute
malnutrition. Although national levels of acute malnutrition are at 3% (SDHS, 2007), it is
important to note that HIV and AIDS pose a new and significant challenge in addressing
acute malnutrition as the two are intrinsically related.
With the guidelines on Integrated Management of Acute Malnutrition in place, it avails an
opportunity for all health care workers to realize the importance of proper management at
health facility level and community level, ensure successful diagnosis and treatment and
consequently address one of the Millennium Development Goals (MDG) of reducing child
mortality.
2. Progress made in terms of political commitment and operational capacity since the 1992
International Conference on Nutrition (ICN)

12
In 1992 there was an overall deficit in local food production and availability, resulting in
massive importations, especially of wheat and meat. The marketing of local foodstuffs was
also difficult because of poor roads and storage facilities. Food processing is still mostly on a
traditional small-scale basis. The cost of local food was relatively high.
However, there has been enormous progress in as far as food production is concerned and this
includes subsidized farming inputs such as fertilizer and seeds. There is also promotion of
maize and vegetable production through farmer’s competition and continuous extension
education. Special attention has been paid towards women empowerment in agricultural
farming through women farmer competition.
In addition, there is a strong linkage between food and agricultural policies and their impact
on nutritional status. On another note, food technology center has been established to
nutritional analysis of food including our stable food and the country is in the process of
developing Swaziland food composition tables.
In terms of political commitment, the country has developed a number policies to promote
food and nutrition security in the country. In this regard, the government has increased the
budget line for both the Ministry of Agriculture and Ministry of H
Table 3: Policies and Strategies currently in place to improve nutrition
Strategy / Policy Reference Period
Objectives and main components Key points
National Development Strategy (NDS) Poverty Reduction Strategy and Action Programme (PRSAP)
1997 2007
The vision of the NDS in relation to food and nutrition security stresses the implementation of strategies for food security enhancement, drought mitigation, poverty alleviation and sustainable use of the country’s natural resources.
The essential parts of the PRSAP are consolidated under the empowerment of the poor to generate income through improving access to land, increasing income from agriculture, and reducing unemployment.
Sustainable national development. Poverty reduction and sustainable livelihoods.
13
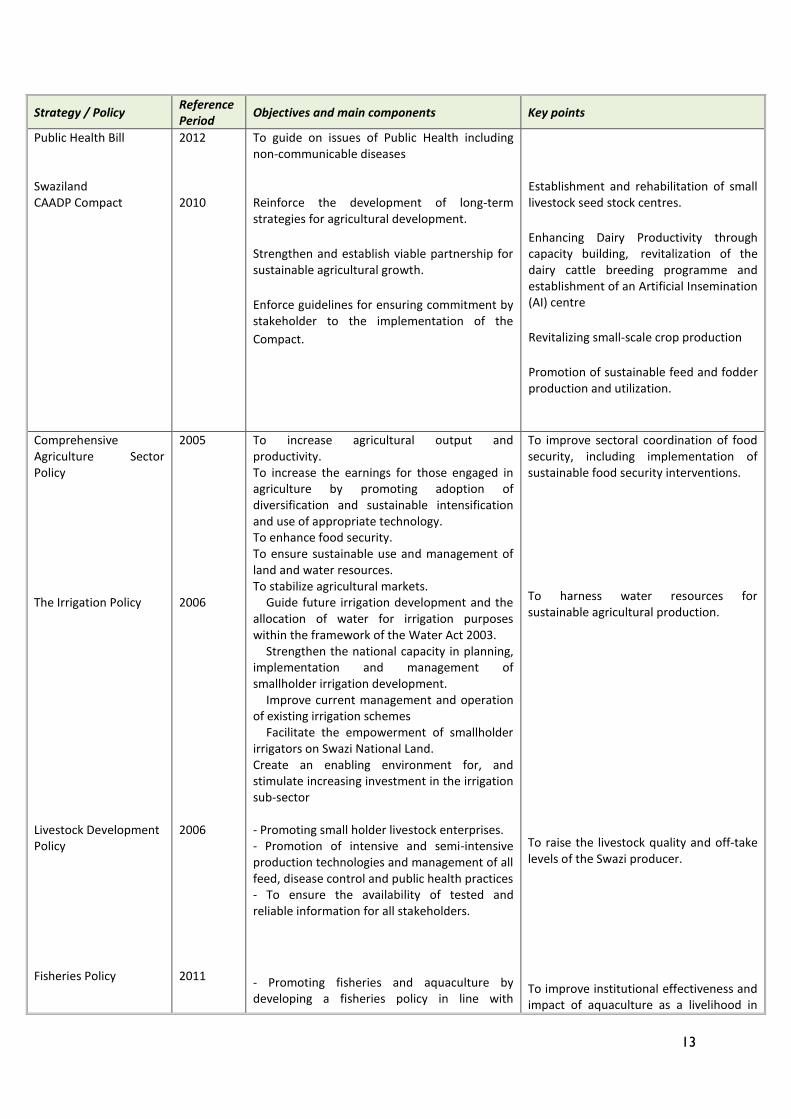
Strategy / Policy Reference Period
Objectives and main components Key points
Public Health Bill Swaziland CAADP Compact
2012 2010
To guide on issues of Public Health including non-communicable diseases Reinforce the development of long-term strategies for agricultural development.
Strengthen and establish viable partnership for sustainable agricultural growth.
Enforce guidelines for ensuring commitment by stakeholder to the implementation of the
Compact.
Establishment and rehabilitation of small livestock seed stock centres.
Enhancing Dairy Productivity through capacity building, revitalization of the dairy cattle breeding programme and establishment of an Artificial Insemination (AI) centre
Revitalizing small-scale crop production
Promotion of sustainable feed and fodder production and utilization.
Comprehensive Agriculture Sector Policy The Irrigation Policy Livestock Development Policy Fisheries Policy
2005 2006 2006 2011
To increase agricultural output and productivity. To increase the earnings for those engaged in agriculture by promoting adoption of diversification and sustainable intensification and use of appropriate technology. To enhance food security. To ensure sustainable use and management of land and water resources. To stabilize agricultural markets.
Guide future irrigation development and the allocation of water for irrigation purposes within the framework of the Water Act 2003.
Strengthen the national capacity in planning, implementation and management of smallholder irrigation development.
Improve current management and operation of existing irrigation schemes
Facilitate the empowerment of smallholder irrigators on Swazi National Land. Create an enabling environment for, and stimulate increasing investment in the irrigation sub-sector - Promoting small holder livestock enterprises. - Promotion of intensive and semi-intensive production technologies and management of all feed, disease control and public health practices - To ensure the availability of tested and reliable information for all stakeholders.
- Promoting fisheries and aquaculture by developing a fisheries policy in line with
To improve sectoral coordination of food security, including implementation of sustainable food security interventions.
To harness water resources for sustainable agricultural production.
To raise the livestock quality and off-take levels of the Swazi producer. To improve institutional effectiveness and impact of aquaculture as a livelihood in

14
Strategy / Policy Reference Period
Objectives and main components Key points
national, regional and international instruments
- Operationalising the national fish hatchery to produce fish fingerlings to support the expansion of subsistence and small-scale commercial fish farming projects.
Creating an appropriate regulatory climate to attract investments into intensive commercial fish farming including value-adding technologies and marketing.
Swaziland.
- National Food Security Policy (NFSP) - National Programme for food security
2005 2005
In line with the CASP, the NFSP aims at addressing the threats and opportunities related to improving food and nutrition security. It introduces food security in the international context. It provides a basis for priority setting and strategy development around food security and poverty challenges. The Specific Objective related to Pillar 1 Food Availability is: To ensure that a sufficient quantity of food of appropriate quality is available to all people in Swaziland, through domestic production and imports. The Specific Objective related to Pillar 2 Food
Access is: To ensure that there is access by all individuals in Swaziland to adequate resources (entitlements)
i to acquire appropriate foods for
a nutritious diet. The Specific Objective related to Pillar 3 Food Utilization and Nutritional Requirements is: To ensure that all individuals in Swaziland reach a state of nutritional well being for which all physiological needs are met.
ii
The Specific Objective related to Pillar 4 Stability of Supply is:
To promote food security in Swaziland To implement food security interventions in Swaziland
15
Strategy / Policy Reference Period
Objectives and main components Key points
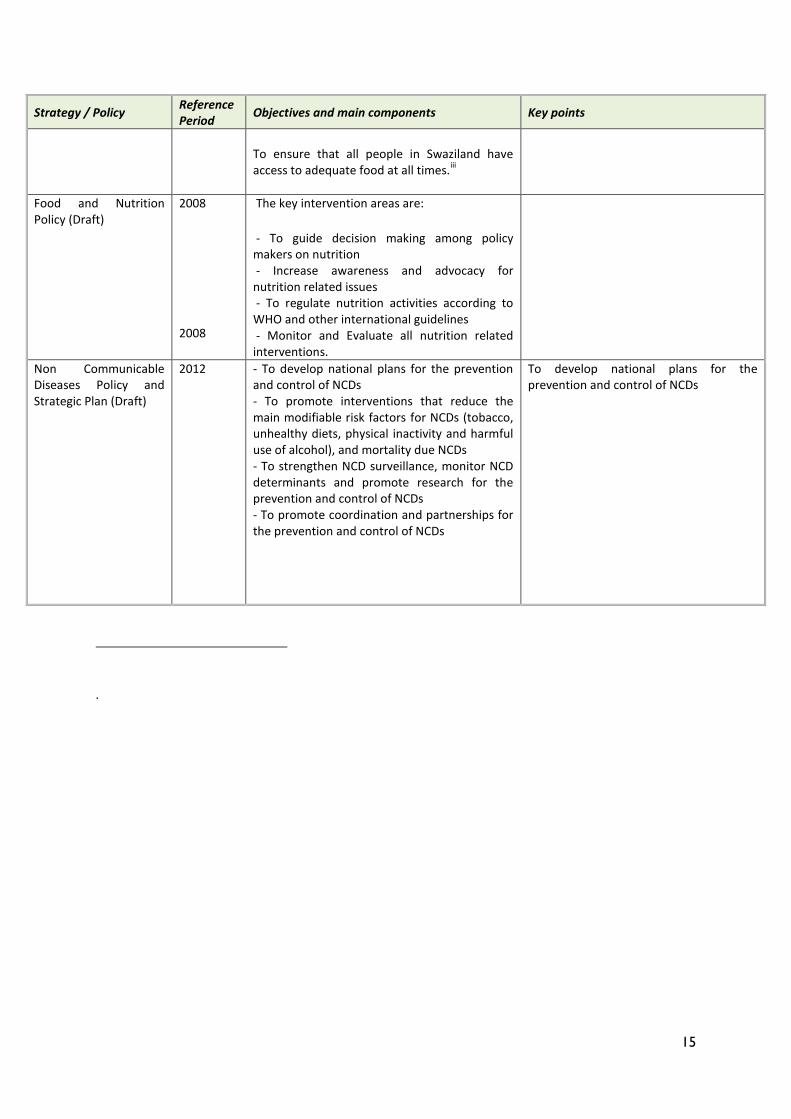
To ensure that all people in Swaziland have access to adequate food at all times.
iii
Food and Nutrition Policy (Draft)
2008 2008
The key intervention areas are:
- To guide decision making among policy makers on nutrition - Increase awareness and advocacy for nutrition related issues - To regulate nutrition activities according to WHO and other international guidelines - Monitor and Evaluate all nutrition related interventions.
Non Communicable Diseases Policy and Strategic Plan (Draft)
2012
- To develop national plans for the prevention and control of NCDs - To promote interventions that reduce the main modifiable risk factors for NCDs (tobacco, unhealthy diets, physical inactivity and harmful use of alcohol), and mortality due NCDs - To strengthen NCD surveillance, monitor NCD determinants and promote research for the prevention and control of NCDs - To promote coordination and partnerships for the prevention and control of NCDs
To develop national plans for the prevention and control of NCDs
.