countries and sectors in global value chains
TRANSCRIPT
Policy Research Working Paper 9785
Countries and Sectors in Global Value ChainsAlessandro BorinMichele ManciniDaria Taglioni
Development Economics Development Research GroupSeptember 2021
Pub
lic D
iscl
osur
e A
utho
rized
Pub
lic D
iscl
osur
e A
utho
rized
Pub
lic D
iscl
osur
e A
utho
rized
Pub
lic D
iscl
osur
e A
utho
rized
Produced by the Research Support Team
Abstract
The Policy Research Working Paper Series disseminates the findings of work in progress to encourage the exchange of ideas about development issues. An objective of the series is to get the findings out quickly, even if the presentations are less than fully polished. The papers carry the names of the authors and should be cited accordingly. The findings, interpretations, and conclusions expressed in this paper are entirely those of the authors. They do not necessarily represent the views of the International Bank for Reconstruction and Development/World Bank and its affiliated organizations, or those of the Executive Directors of the World Bank or the governments they represent.
Policy Research Working Paper 9785
Production of goods and services has increasingly globalized since the 1970s but is hard to measure. Standard approaches either overstate the degree of backward integration or under-estimate the involvement of some industries, especially services, in Global Value Chain (GVC) activity. To correct these biases, this paper proposes a novel comprehensive
method to measure GVC participation using Inter-Country Input-Output (ICIO) linkages in both trade and output and presents the related database available on the World Integrated Trade Solution website of the World Bank.
This paper is a product of the Development Research Group, Development Economics. It is part of a larger effort by the World Bank to provide open access to its research and make a contribution to development policy discussions around the world. Policy Research Working Papers are also posted on the Web at http://www.worldbank.org/prwp. The authors may be contacted at [email protected].

Countries and Sectors in Global Value Chains
Alessandro Borin Daria Taglioni∗Michele Mancini
Keywords: trade in value-added; global value chains; inter-country input-output tables.JEL classification: E16, F1, F14, F15.
∗Borin: [email protected], Bank of Italy; Mancini: [email protected],Bank of Italy and European Central Bank; Taglioni: [email protected], The World Bank. Thispaper was started as part of the World Bank’s World Development Report 2020 "Global Value Chains:Trading for Development" project. The broad set of measures discussed in the paper is available on theWorld Integrated Trade Solutions (WITS) platform: the dataset is available here and the data visualiza-tions here. Furthermore, readers interested in computing their own measures of global value chain tradeby origin and destination using also user-provided input output tables are referred to the icio module inStata by Belotti et al. (2021). The study team is grateful for support from the World Bank’s Knowledgefor Change Program (KCP). The views expressed are those of the authors and do not necessarily reflectthose of the World Bank, its Executive Directors, or the countries they represent nor those of the EuropeanCentral Bank or the Bank of Italy.

1 Introduction
Production of goods and services has increasingly globalized since the 1970s, but how tomeasure this phenomenon is still the object of academic debate. The main challenge liesin measuring where value is added in a GVC, where it comes from, and where it flows to.Ideally, data that trace firm-to-firm transactions both within and across countries shouldbe used, since it is not countries or industries that engage in value chain productionbut rather firms. Using a firm-level approach to GVC participation however is severelyconstrained by data availability. According to Bems and Kikkawa (2021) only one countryin the world - Belgium - allows to obtain comparable data on firm-level trade and thecomplementary census information on firm-to-firm domestic transactions needed for afully-fledged measurement of GVC participation. It is equally hard to disentangle theforeign input content of a firm’s exports from the foreign content of overall production(Kee and Tang, 2016 attempted to do so using processing trade in China). Even whena firm is identified as an exporter of intermediate inputs (instead of final goods), it isalmost impossible to establish whether those inputs are fully absorbed in the importingcountry or whether they are reexported to third markets by the importing firms afterhaving added value to them. Finally, without linking customs data across countries, it isvery hard to establish the nature of the GVC link.
Given the difficulties in using a firm-level approach to measuring many importantaspects of GVC participation, a large body of work has focused on combining informationfrom customs offices with national input-output tables. The most widely used are theWorld Input-Output Database (WIOD; Timmer et al., 2015), a collaborative project ledby researchers at the University of Groenigen; the Trade in Value Added (TiVA) databasecompiled by the Organization for Economic Cooperation and Development (OECD); andthe EORA global supply chain database (Lenzen et al., 2013), constructed by a teamof researchers at the University of Sydney. Despite their limitations,1 such global input-output databases can be used to devise ways of measuring the extent to which productionprocesses have globalized in recent years, how countries and sectors participate in GVCs,and several features of GVC linkages consistent with what Antràs (2020) calls the broadview of GVC participation.2
Building on global input-output tables, a sufficient condition for considering trade1Global input-output tables have two main limitations. First, because they rely on aggregated input-
output data, the resulting sectoral disaggregation of GVC flows is coarse. They therefore miss a lot ofGVC activity within the broadly defined sectors. For example, one can compute the origin of fabricatedmetal products in the production of motor vehicles in the United States but cannot infer where morespecific components such as tires, car engines, or windshield wipers originate. Second, in constructingthe tables, researchers are forced to impose strong assumptions to back out some bilateral intermediateinput trade flows that cannot be readily read from either customs data or national IO tables, leading tostatistically relevant aggregation biases (De Gortari, 2019; Bems and Kikkawa, 2021).
2In Antràs (2020), broad view of GVC participation a global value chain or GVC consists of a series ofstages involved in producing a product or service that is sold to consumers, with each stage adding value,and with at least two stages being produced in different countries
2
as GVC-related is that it crosses at least two borders (Hummels et al. 2001; Borin andMancini, 2015; Antràs, 2020). This can be seen as the sum of two natural measures ofcross-border linkages, i.e. backward GVC participation and forward GVC participation,which broadly speaking trace how much imports are embedded in a country’s exports andhow much of a country’s own production is absorbed by demand from the global markets.According to the definition, all what is bought from abroad and exported constitutes abackward linkage and all what is exported for consumption in third markets is a forwardlinkage:
• Backward GVC participation, in which a country’s exports embody inputs previouslyimported from abroad. In this case, GVC participation is considered backward asthe intermediates used in exports come from previous production stages.
• Forward GVC participation, in which a country’s production or exports are notfully absorbed in the importing country and instead are embodied in the importingcountry’s exports to third countries. This type of GVC participation is consideredforward because the domestic firm is at the early stage of production of goodsexported by a trade partner or by third countries.
The first bias that this paper studies is generated when the distinction betweenbackward participation and forward participation is assumed to fully characterize engage-ment in GVCs. The concepts of backward and forward participation are important, sinceexposure to foreign economic forces depends on the absolute and relative importance offorward and backward linkages in GVCs.3 The empirical regularity we are primarilyconcerned about is that GVC participation encompasses many activities that are linkedsimultaneously backward and forward to entities abroad. This is what is known as theI2E (import to export) in the Baldwin and Lopez-Gonzales (2015) terminology.
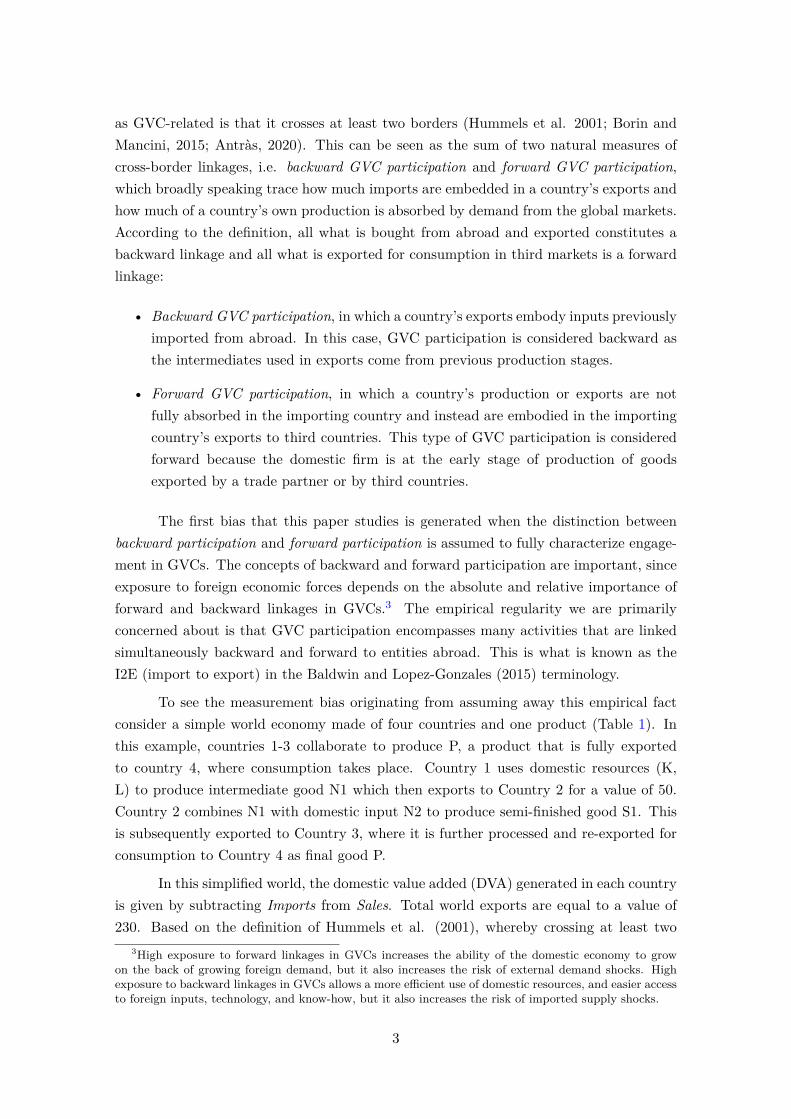
To see the measurement bias originating from assuming away this empirical factconsider a simple world economy made of four countries and one product (Table 1). Inthis example, countries 1-3 collaborate to produce P, a product that is fully exportedto country 4, where consumption takes place. Country 1 uses domestic resources (K,L) to produce intermediate good N1 which then exports to Country 2 for a value of 50.Country 2 combines N1 with domestic input N2 to produce semi-finished good S1. Thisis subsequently exported to Country 3, where it is further processed and re-exported forconsumption to Country 4 as final good P.
In this simplified world, the domestic value added (DVA) generated in each countryis given by subtracting Imports from Sales. Total world exports are equal to a value of230. Based on the definition of Hummels et al. (2001), whereby crossing at least two
3High exposure to forward linkages in GVCs increases the ability of the domestic economy to growon the back of growing foreign demand, but it also increases the risk of external demand shocks. Highexposure to backward linkages in GVCs allows a more efficient use of domestic resources, and easier accessto foreign inputs, technology, and know-how, but it also increases the risk of imported supply shocks.
3
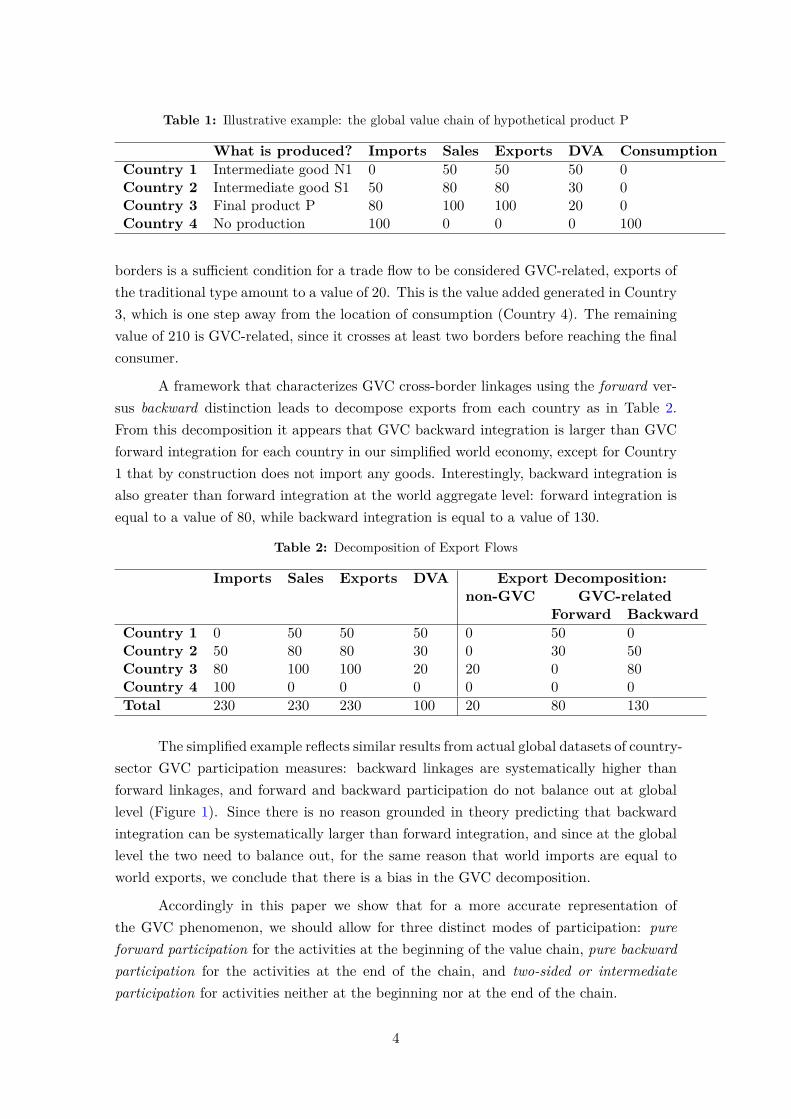
Table 1: Illustrative example: the global value chain of hypothetical product P
What is produced? Imports Sales Exports DVA ConsumptionCountry 1 Intermediate good N1 0 50 50 50 0Country 2 Intermediate good S1 50 80 80 30 0Country 3 Final product P 80 100 100 20 0Country 4 No production 100 0 0 0 100
borders is a sufficient condition for a trade flow to be considered GVC-related, exports ofthe traditional type amount to a value of 20. This is the value added generated in Country3, which is one step away from the location of consumption (Country 4). The remainingvalue of 210 is GVC-related, since it crosses at least two borders before reaching the finalconsumer.
A framework that characterizes GVC cross-border linkages using the forward ver-sus backward distinction leads to decompose exports from each country as in Table 2.From this decomposition it appears that GVC backward integration is larger than GVCforward integration for each country in our simplified world economy, except for Country1 that by construction does not import any goods. Interestingly, backward integration isalso greater than forward integration at the world aggregate level: forward integration isequal to a value of 80, while backward integration is equal to a value of 130.
Table 2: Decomposition of Export Flows
Imports Sales Exports DVA Export Decomposition:non-GVC GVC-related
Forward BackwardCountry 1 0 50 50 50 0 50 0Country 2 50 80 80 30 0 30 50Country 3 80 100 100 20 20 0 80Country 4 100 0 0 0 0 0 0Total 230 230 230 100 20 80 130
The simplified example reflects similar results from actual global datasets of country-sector GVC participation measures: backward linkages are systematically higher thanforward linkages, and forward and backward participation do not balance out at globallevel (Figure 1). Since there is no reason grounded in theory predicting that backwardintegration can be systematically larger than forward integration, and since at the globallevel the two need to balance out, for the same reason that world imports are equal toworld exports, we conclude that there is a bias in the GVC decomposition.
Accordingly in this paper we show that for a more accurate representation ofthe GVC phenomenon, we should allow for three distinct modes of participation: pureforward participation for the activities at the beginning of the value chain, pure backwardparticipation for the activities at the end of the chain, and two-sided or intermediateparticipation for activities neither at the beginning nor at the end of the chain.
4
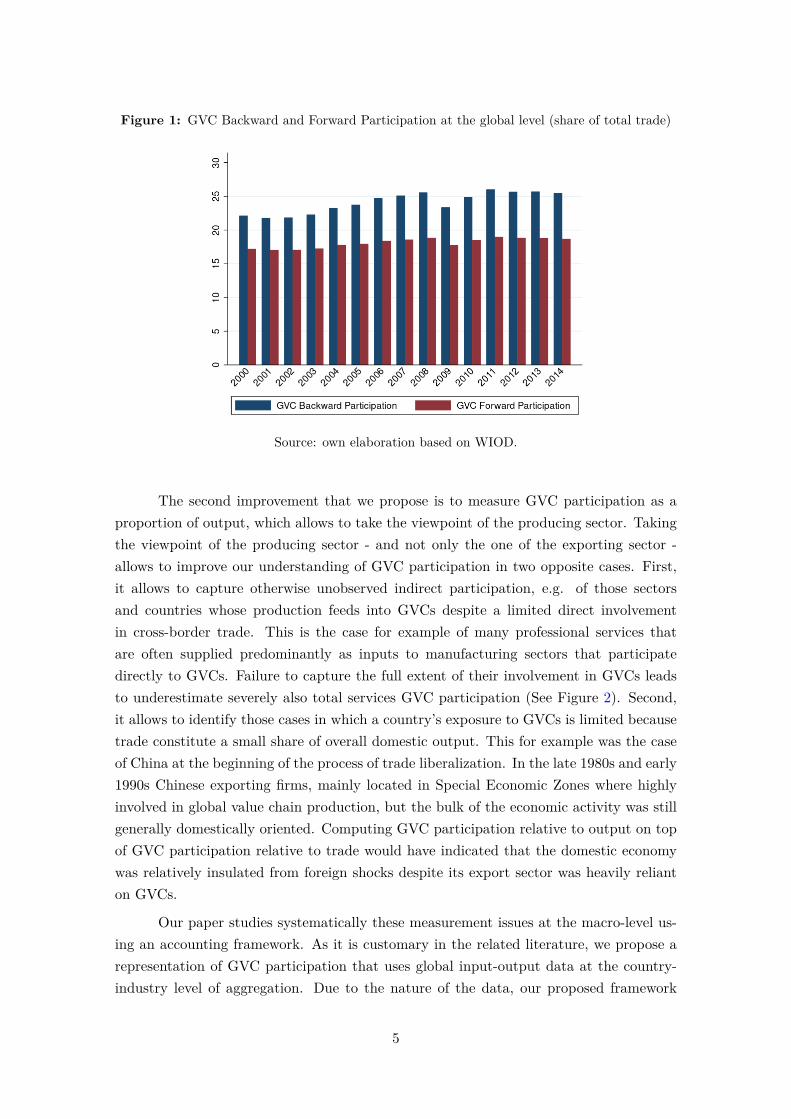
Figure 1: GVC Backward and Forward Participation at the global level (share of total trade)
Source: own elaboration based on WIOD.
The second improvement that we propose is to measure GVC participation as aproportion of output, which allows to take the viewpoint of the producing sector. Takingthe viewpoint of the producing sector - and not only the one of the exporting sector -allows to improve our understanding of GVC participation in two opposite cases. First,it allows to capture otherwise unobserved indirect participation, e.g. of those sectorsand countries whose production feeds into GVCs despite a limited direct involvementin cross-border trade. This is the case for example of many professional services thatare often supplied predominantly as inputs to manufacturing sectors that participatedirectly to GVCs. Failure to capture the full extent of their involvement in GVCs leadsto underestimate severely also total services GVC participation (See Figure 2). Second,it allows to identify those cases in which a country’s exposure to GVCs is limited becausetrade constitute a small share of overall domestic output. This for example was the caseof China at the beginning of the process of trade liberalization. In the late 1980s and early1990s Chinese exporting firms, mainly located in Special Economic Zones where highlyinvolved in global value chain production, but the bulk of the economic activity was stillgenerally domestically oriented. Computing GVC participation relative to output on topof GVC participation relative to trade would have indicated that the domestic economywas relatively insulated from foreign shocks despite its export sector was heavily relianton GVCs.
Our paper studies systematically these measurement issues at the macro-level us-ing an accounting framework. As it is customary in the related literature, we propose arepresentation of GVC participation that uses global input-output data at the country-industry level of aggregation. Due to the nature of the data, our proposed framework
5
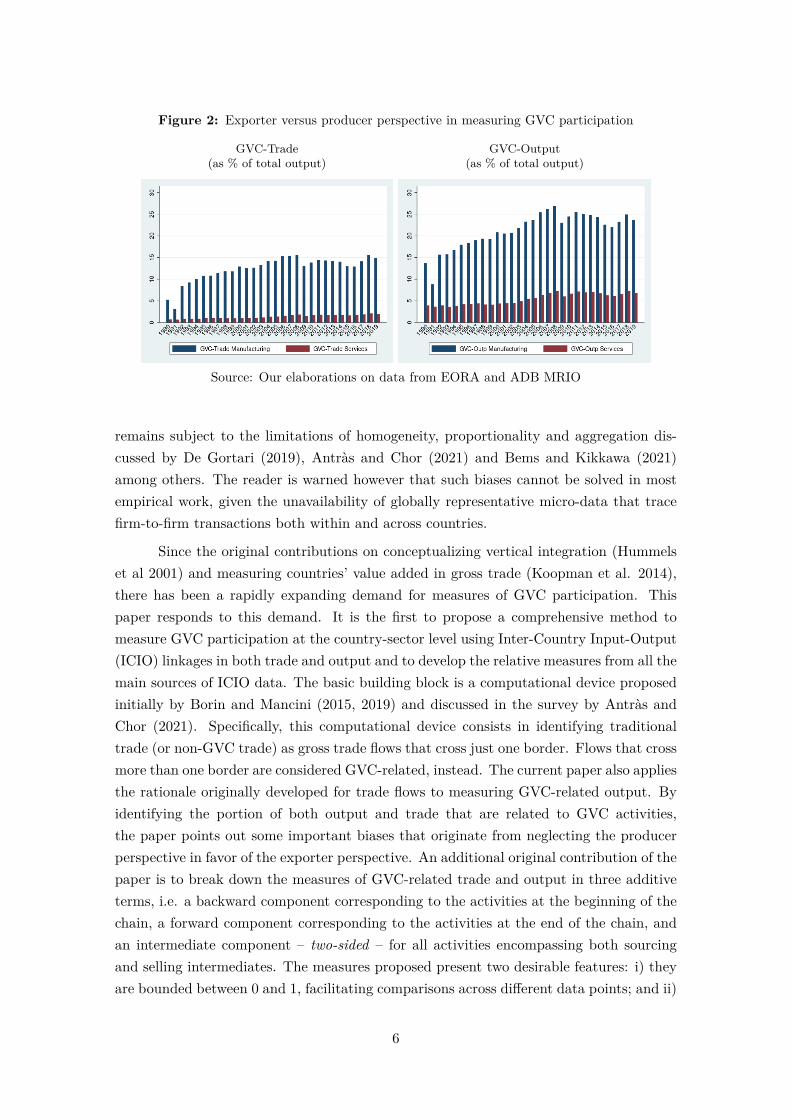
Figure 2: Exporter versus producer perspective in measuring GVC participation
GVC-Trade(as % of total output)
GVC-Output(as % of total output)
Source: Our elaborations on data from EORA and ADB MRIO
remains subject to the limitations of homogeneity, proportionality and aggregation dis-cussed by De Gortari (2019), Antràs and Chor (2021) and Bems and Kikkawa (2021)among others. The reader is warned however that such biases cannot be solved in mostempirical work, given the unavailability of globally representative micro-data that tracefirm-to-firm transactions both within and across countries.
Since the original contributions on conceptualizing vertical integration (Hummelset al 2001) and measuring countries’ value added in gross trade (Koopman et al. 2014),there has been a rapidly expanding demand for measures of GVC participation. Thispaper responds to this demand. It is the first to propose a comprehensive method tomeasure GVC participation at the country-sector level using Inter-Country Input-Output(ICIO) linkages in both trade and output and to develop the relative measures from all themain sources of ICIO data. The basic building block is a computational device proposedinitially by Borin and Mancini (2015, 2019) and discussed in the survey by Antràs andChor (2021). Specifically, this computational device consists in identifying traditionaltrade (or non-GVC trade) as gross trade flows that cross just one border. Flows that crossmore than one border are considered GVC-related, instead. The current paper also appliesthe rationale originally developed for trade flows to measuring GVC-related output. Byidentifying the portion of both output and trade that are related to GVC activities,the paper points out some important biases that originate from neglecting the producerperspective in favor of the exporter perspective. An additional original contribution of thepaper is to break down the measures of GVC-related trade and output in three additiveterms, i.e. a backward component corresponding to the activities at the beginning of thechain, a forward component corresponding to the activities at the end of the chain, andan intermediate component – two-sided – for all activities encompassing both sourcingand selling intermediates. The measures proposed present two desirable features: i) theyare bounded between 0 and 1, facilitating comparisons across different data points; and ii)
6

they are additive at any level of aggregation/disaggregation of trade flows, thus data canbe summed up and partitioned at any level along both the geographical and the sectoraldimension. In so doing, the methodology and indicators proposed by this paper offer asummary and yet comprehensive system of measures on countries and sectors engagementin GVC activities.
The reminder of the paper is structured as follows. Section 2 describes the method-ology of decomposing GVC-related trade participation in three measures: pure backwardparticipation, pure forward participation, and two-sided or intermediate participation.Section 3 generalizes these results beyond trade, i.e. GVC-related value-added, GVC-related final goods production, and GVC-related output. Section 4 shows that our pro-posed decomposition matters empirically, showing the measures applied to country-wide,sector-specific examples. Finally Section 5 concludes. Annex A illustrates the notationand provides some basic accounting relationships used in the paper. Finally, Annex Billustrates how to retrieve the broad set of measures discussed in the paper and madeavailable on the World Integrated Trade Solutions (WITS) platform.
2 GVC-related trade
In this section we take the view of an exporting sector, showing how to detect within anytrade flow the amount of it that can be traced back to global value chains.
Consider a standard Inter-Country Input-Output (ICIO) model with G countriesand N sectors. Appendix A gives an exhaustive definition of the notation and, for thisreason, here we only mention that Esr is the N × 1 vector of exports of country s tocountry r, Xs is the N × 1 vector of gross output produced by country s, Ysr is theN × 1 vector of final goods and services produced by country s and absorbed in countryr, A is the GN×GN global matrix of input coefficients, B is the global Leontief inversematrix for the entire inter-country model, L is the local Leontief inverse matrix, takinginto account only the domestic chains, and Vs is the 1×N vector that incorporates thevalue-added shares embedded in each unit of gross output produced by country s. Lastly,given a generic 1×N or N × 1 vector W, W
∧is its N ×N diagonal form.
It is convenient to start from the identification of the simplest form of trade betweencountries, by tracing the amount of value that crosses just once the border between theexporter and the importer. It consists of the value of final goods produced entirely athome and consumed abroad and of the value of the intermediate inputs that are (entirely)produced at home and used by the importing country to produce final goods for its internalmarket. In more formal terms, the simplest form of trade between country s and r is theDirectly Absorbed Value-Added exports:
DAVAXsr = VsLss
∧Ysr + VsLss
∧AsrLrrYrr, (1)
7
The vector DAVAXsr identifies, for each country s n ∈ N sector of exports, the‘traditional’ type of exports to country r, as opposed to the international shipments thattake place under the global sharing of production (‘GVC-related trade’). In other words,the ‘GVC-related trade’ includes all the traded items that cross at least two internationalborders, i.e. that are re-exported at least once before being absorbed in final demand.This can be considered as a sufficient condition for an exported good to be part of aninternational production network.4
The ‘GVC-related trade’ can be measured simply by excluding from country s
gross exports to country r the domestic value-added exported by each sector n that isabsorbed directly by country r, i.e. the bilateral partner (DAVAXsr):
GVCsr = Esr −DAVAXsr.5 (2)
This GVC indicator presents two desirable features: i) once divided by exports, i.e.GVCsr�Esr, it is bounded between 0 and 1, since it traces within the trade flow the shareof it related to GVC activity; ii) it is additive at any level of aggregation/disaggregationof trade flows; thus, data can be summed at any level – total country exports/worldexports/world sector exports/country groups and so on – in order to obtain the properGVC participation measures at the desired level of aggregation. For instance, the GVCshare of the total exports of country s, for each sector n, will be
GVCXs =G∑
r 6=s
GVCsr �G∑
r 6=s
Esr, (3)
while at the world level we have:
GVCXworld =G∑s
G∑r 6=s
GVCsr �G∑s
G∑r 6=s
Esr. (4)
Total GVC-related trade for any country s is obtained summing across the exportsof each sector n, as
GV CXs =∑G
r 6=s uN GVCsr∑Gs
∑Gr 6=s uN Esr
. (5)
where uN is the 1×N unit row vector.4In principle, also value-added produced in completion stages of the production process, even if it crosses
only one border, should be labeled as GVC. However, this part cannot be singled out using standard ICIOtables and, indeed, it is not considered by any other measure of GVC trade in the literature.
5This broad definition is completely in line with Borin and Mancini (2017, 2019). However its sub-components differ. More specifically, here the pure forward participation corresponds to what they labelas forward participation. Instead, the sum of pure backward and two-sided participation equals theirbackward participation. See below for further discussion.
8

In the same way, world trade related to GVC is
GV CX =∑G
s
∑Gr 6=s uN GVCsr∑G
s
∑Gr 6=s uN Esr
. (6)
It should be noted that the overall GVC participation encompasses three differenttypes of GVC linkages, i.e. purely forward, purely backward, and intermediate ones. Infact, a sector of export n might be engaged in GVC activities at the end of the chain,relying on imported inputs to export goods and services that are not further re-exportedby the partner (pure backward participation). Alternatively, it might participate closerto the origin of the chain, exporting value-added that has been generated within thedomestic chains – without any border crossing – to partners which, in turn, re-exportsit to other markets (pure forward participation). Finally, the sector might be located ina more central position of the chain, therefore using imported inputs to produce its ownexports, further re-exported by the partner (two-sided participation).
In the rest of the section, we provide a precise measure of the share of exportsrelated to ‘pure forward’, ‘two-sided’ and ‘pure backward’ linkages.
The pure forward participation is simply the difference between the entire domesticvalue-added that is exported (VsLss
∧Esr) and the one that is directly absorbed by the
importer,6 i.e. the DAVAXsr
GVCPureForwsr = VsLss
∧Esr −DAVAXsr.7 (7)
The rest of the GVC-related trade is given by the sum of the pure backward participationand the intermediate participation. This is what Hummels et al. (2001) call verticalspecialization, i.e. the import content of exports
G∑t6=s
uN AtsLss
∧Esr.8 (8)
6It should be noted that Borin and Mancini (2017, 2019) label what here is defined as pure forwardparticipation simply as forward. In fact, in this paper we refine their classification considering a broadersufficient condition to define the total forward participation, i.e. the supply of intermediate inputs forforeign exporters. In turn, the necessary condition to have a pure forward participation is that intermediateinputs for foreign exporters have to originate in the domestic economy, as in equation (7).
7For some empirical application, it could be convenient to trace also the market where the value-addedis ultimately absorbed, following Borin and Mancini (2019):
GVCP ureF orwsr = VsLss
∧
AsrLrr(G∑
j 6=r
Yrj +G∑
j 6=r
Arj
G∑k
G∑l 6=s
BjkYkl).
8Borin and Mancini (2019) show that Hummels et al. (2001) import content of exports might beexpressed in a more convenient way to trace also the origin of the imported inputs. In this way, importcontent of exports is given by the sum of the entire foreign content in a country’s exports and the domesticdouble counting, i.e. the domestic inputs that are first exported and then imported again by the country
9

The total import content of exports might be broken down into two very differentterms, namely the import content of country s’s exports absorbed by the importing countryr and the import content of country s’ exports re-exported by r. The former measures‘pure’ backward participation, since the chain ends just after the exporting activity. Thelatter, instead, traces the GVC activities that are more in an intermediate position, asgoods and services are further re-exported beyond the bilateral partner, i.e. two-sidedparticipation.9
Operationally, we first express bilateral exports Esr as the sum of exports of finalgoods and intermediates that are absorbed by the partner without crossing any otherborder and intermediates that are further re-exported by the partner,
Esr = (Ysr + AsrLrrYrr) +(
AsrLrr
G∑j 6=r
Erj
). (9)
Then, we substitute this result back in in the import content of exports (8). Pure backwardparticipation is given by the imported inputs embedded in the exports to final markets10
GVCPureBacksr =G∑
t6=s
uN AtsLss
∧(Ysr + AsrLrrYrr) . (11)
Instead, two-sided participation is given by the imported inputs embedded in the
to produce other exports
VsLss
G∑j 6=s
AsjBjs
∧
Esr +G∑
t6=s
VtBts
∧
Esr.
9Borin and Mancini (2017, 2019) consider the entire import content of export as a measure of GVCbackward participation. In fact, a sufficient condition to define backward participation is the use ofimported intermediates to produce exports. In this work we refine this definition, adding a necessarycondition for pure backward participation, i.e. the use of imported intermediates to produce exports tofinal destinations. In other terms, we label as two-sided participation the imported intermediates used toproduce exports that are further re-exported. While it would be correct to account them in the engagementin backward activities, as in Borin and Mancini (2017, 2019), it is true that they also meets the sufficientcondition to be considered as forward participation, i.e. the supply of intermediates for foreign exporters.
10The country of origin of the imported inputs might be traced separating foreign content from domesticdouble counting,
GVCPureBacksr = VsLss
G∑j 6=s
AsjBjs
∧
(Ysr + AsrLrrYrr)
+G∑
t 6=s
VtBts
∧
(Ysr + AsrLrrYrr) . (10)
10
re-exports of the bilateral partner11
GVCTwoSidesr =G∑
t 6=s
uN AtsLss
∧(
AsrLrr
G∑j 6=r
Erj
). (13)
Since GVCPureBacksr traces backward linkages up to country s’s exports to thefinal market, it mirrors GVCPureForwsr, which measures forward linkages on-wardsfrom the origin of the chain, i.e. country s itself. Instead, the intermediate participationmeets the sufficient condition that define a broad measure of backward participation –since it encompasses the use of imported inputs for the country’s exports – and also abroad measure of forward participation – as it also encompasses the exports of inputs thatare further re-exported by the bilateral partner. However, it does not meet the necessarycondition for pure backward participation – use of imported inputs for the country’sexports to final markets – nor the one for pure forward participation – exports of inputsproduced with domestic value-added that are further re-exported by the bilateral partner.Depending on the empirical application, it could be useful to consider broad measures ofparticipation instead of pure ones. These are precisely defined by the sufficient conditionshighlighted above, and can be computed simply aggregating the intermediate mode ofparticipation to one of the two pure modes.
Finally, the GVC-related trade within the export flow from s to r for any sector n
might be expressed as the sum of these three components:
GVCsr = GVCPureForwsr + GVCPureBacksr + GVCTwoSidesr. (14)
The forward, backward and two-sided participation might also be computed forany level of aggregation, as for the overall indicator of ‘GVC-related trade’ (see equations3 to 6).
Furthermore, at the aggregate level, i.e. summing across exporters s, importers r
and sectors n, the ‘GVC pure backward-related trade’ is equal to the ‘GVC pure forward-11As for the pure forward and pure backward participation, the country of origin of the imported inputs
and the country of final absorption might be traced as
GVCTwoSidesr = VsLss
G∑j 6=s
AsjBjs
∧[AsrLrr
G∑j 6=r
(Yrj + Arj
G∑k
G∑l 6=s
BjkYkl
)]
+G∑
t 6=s
VtBts
∧[
AsrLrr
G∑j 6=r
(Yrj + Arj
G∑k
G∑l 6=s
BjkYkl
)], (12)
11
related trade’:
G∑s,r 6=s
uN GVCPureBacksr =G∑
s,r 6=s
uN GVCPureForwsr. (15)
Lastly, a natural measure of the type of participation in GVC at any level ofaggregation can be straightforwardly obtained as the difference between pure forwardand pure backward participation divided by the overall GVC participation. For instance,for each n exporting sector within the trade flow from s to r:
Psr = (GVCPureForwsr −GVCPureBacksr)�GVCsr. (16)
The vector Psr measures the ‘forwardness’ of country s exports to country r, foreach sector, and each of its elements is bounded between -1 and 1. At the country-level,i.e. summing across sectors and bilateral partners, we have:
Ps =∑G
r 6=s uN GVCPureForwsr −∑G
r 6=s uN GVCPureBacksr∑Gr 6=s uN GVCsr
. (17)
At the global level, P is equal to zero, given the relation in equation (15):
G∑s
Ps = 0. (18)
Thus, any index different from zero at any level of aggregation might be interpreted as adeviation from the world aggregate average.
2.1 Comparison with other indices of GVC-trade participation
The GVC-related trade indicator proposed above is not the first measure based on ICIOtables that has been developed to gauge the relevance of GVCs in international ship-ments. The ‘vertical specialization’ index (VS) of Hummels et al. (2001), measuring theimport content of country’s exports, is probably one of the first and most popular of thesemeasures:
VSsr = uN
G∑t6=s
Ats(I−Ass)−1
∧
Esr � Esr. (19)
However, as pointed out by the authors themselves, it is a partial measure ofparticipation in global value chains, as also shown in Figure 3, where VSsr, computedat the global level, lies well below the total GVC-trade. Indeed, it can be shown thatHummels et al.’s (2001) vertical specialization VSsr corresponds precisely to the sum ofpure backward and two-sided GVC participation as reported in equations (11) and (13).
12
In addition, equations (10) and (12) generalize the VSsr indicator, providing informationboth on the very origin of the value and on its final destination.
In order to take forward linkages into account, Hummels et al. (2001) also suggestconsidering the exports of intermediate products that are later further processed and re-exported (they label it VS1). However, they do not propose a precise formulation ofthis measure, since it can be implemented only in a fully-fledged ICIO framework thatwas not available at the time of writing. Thus, the ‘forward’ component of GVC-trade inequation (7) can be considered as the first correct implementation of the VS1 indicatorsuggested by Hummels et al. (2001).
Therefore, our overall GVC-trade indicator can be seen as the implementation andgeneralization of Hummels et al. (2001) insights:
GVCsr = GVCPureForwsr︸ ︷︷ ︸VS1sr
+ GVCPureBacksr + GVCTwoSidesr︸ ︷︷ ︸VSsr
. (20)
Notably, at the country level, GVCPureForws differs from the version of theVS1s index proposed by Koopman et al. (2014) – and recently reported also by Aslam etal. (2017) – since they compute it by aggregating the content of a country’s productionembedded in other countries’ exports (i.e. Vs
∑r 6=s BsrEr∗). While the GVCPureForw
index is a portion of country s’s exports (like VS), this does not necessarily hold true forthe measure proposed by Koopman et al. (2014). Suppose, for instance, that a certainintermediate component exported by country s later undergoes other processing phasesin different countries; the original component will be double-counted several times in thesummation of country s’s content in other countries’ exports. The discrepancy betweenthe original value of goods exported by s and the related amount that enters in Koopmanet al.’s (2014) indicator increases with the relative ‘upstreamness’ of country s’s produc-tion. This is a feature that refers to the relative positioning of a country in GVCs andthat has been specifically addressed in the literature through proper tools.12 Moreover,this positioning does not directly influence the V S indicator which is commonly used asthe ‘backward’-participation counterpart of the V S1 indicator proposed by Koopman etal. (2014).13 Conversely, the GVCPureForw of equation (7) measures the share of acountry’s exports related to forward GVC linkages in a way that is consistent with howthe GVCPureBack (i.e. VS) measures the portion that is related to backward GVCconnections.
12Indicators of relative upstreamness/downstreamness in GVCs have been proposed by Fally, 2012;Antràs et al., 2012; Wang et al., 2017, among others. See Antràs and Chor (2019) for a comprehensivediscussion.
13The VSs index does not vary with the number of borders crossed by a certain item before beingimported by country s. In other words, the relative ‘downstreamness’ of country s does not influencethe VSs indicator in the same way as its relative ‘upstreamness’ influences the VS1s indicator in theformulation of Koopman et al. (2014).
13

Figure 3: Comparison among different GVC measures.
Finally, other studies have measured a country’s GVC-trade participation by iden-tifying the export components that are later re-exported by the direct importer, as wepropose here (see, among others, Rahman and Zhao, 2013; Cappariello and Felettigh,2015; Ahmed et al., 2017; Altomonte et al., 2018). However, these contributions rely onthe decomposition of gross exports of Koopman et al. (2014) or, alternatively, on thatof Wang et al. (2013). The problem, discussed in detail in Borin and Mancini (2019), isthat these methodologies do not properly allocate countries’ exports between the sharethat is directly absorbed by importers and the one that is re-exported abroad. Thus, theresulting measures of GVC participation are also imprecise.
In some cases the complement of the Johnson and Noguera (2012) value-addedexports to gross exports ratio (VAX) has been interpreted as a measure of the share oftrade involved in GVCs (see the red line in Figure 3). Although the change over time ofthis indicator tends to be closely related to the variation in international fragmentationof production —especially at the world level, see Johnson and Noguera (2017)— in levelterms, it underestimates to a quite large extent the weight of GVCs in trade. As comparedto the GVC-related trade index of equation (4), the underestimation is given by thedifference between VAX and DAVAX divided by gross exports, as shown also in Antràsand Chor (2021).14
2.2 Regional GVC-related trade
The total GVC-related trade as reported in equation (14) can be broken down to distin-guish between intra-regional and extra-regional value chain participation. The same holds
14This comes from the fact that only a subportion of VAX is not GVC-related, and this is preciselythe DAVAX.
14
for its sub-components, i.e. pure forward, pure backward and two-sided participation inequations (7), (11) and (13).
Given a country s, member of a region K, intra-regional value-chain participation,IRVCs,K for each exporting sector n is defined as the sum of the import content ofinputs sourced directly from a regional member that are exported to final markets (purebackward) or to partners that re-exports it (two-sided), and domestic value-added re-exported by a regional member (pure forward). In formal terms,
IRVCPureBacks,K =G∑
t∈K,t6=s
uN AtsLss
∧ G∑r 6=s
(Ysr + AsrLrrYrr) (21)
IRVCTwoSides,K =G∑
t∈K,t6=s
uN AtsLss
∧ G∑r 6=s
(AsrLrr
G∑j 6=r
Erj
). (22)
IRVCPureForws,K = VsLss
∧ G∑r∈K,r 6=s
Esr −G∑
r∈K,r 6=s
DAVAXsr, (23)
Extra-regional value-chain participation with countries outside region K, ERVCs, /K ,is the difference between the total GVC participation and the intra-regional one:
ERVCis, /K = GVCis − IRVCis,K (24)
for i = PureForw, PureBack, Interm.
3 A more general view on GVC participation
In the previous section we showed how to precisely single out the amount of a sector’sgross trade that stems from countries’ participation in global production sharing. Thisallows to assess how import and export dynamics are driven by the evolution of GVCs.Nevertheless, in order to gauge the overall degree of involvement of a specific sector wecannot limit the analysis to trade flows. In some countries the exporting sectors might bedeeply integrated in GVCs, but they might account only for a small fraction of the wholeeconomic activity. It was the case, for instance, of China at the beginning of the openingup process in the late ‘80s and early ‘90s, when the exporting firms, mainly locatedin the Special Economic Zones, where highly involved in the international productionchains, while the remaining part of the economic activity was still generally domesticallyoriented. Moreover, regarding the sectoral participation in GVCs, it is necessary to takeinto account that some industries might be indirectly but heavily involved in internationalproduction networks despite their limited export activity (e.g. often services are suppliedas inputs to manufacturing sectors that directly participate to GVCs).
15
A more general assessment of the amount of productions of each sector that isrelated to GVCs is retrieved taking into account the entire supply chain in which a sectorparticipates to, regardless of its involvement in export activities. Similarly as for theidentification of GVC-related trade, we identify three salient moments that matters todefine a supply chain, namely the contribution provided by a sector to the productionstages at its very beginning, in an intermediate position, and at the very end of it.
Here the emphasis to define the mode of participation is on the sector of production,not on the sector of exports, as in Section 2. Therefore, the activities related to thecreation of value-added that will be exported by any sector and then re-exported by thepartner are the most purely forward ones, the very first link of a chain. Those related tothe assembly of the final goods or services are instead the most purely backward related,as they represents the last link of a chain. Even final goods that are not exported fallinto this case, if they are assembled using inputs that have previously crossed at least twoborders. In between we find all the activities that encompass both buying and selling ofinputs, therefore representing an intermediate type of participation, not purely forwardnor backward but two-sided.
In the following sections we define three indices of GVC participation based onthe framework provided above. In Section 3.1 we present the GVC-related value-added, ameasure of purely forward engagement in GVC, traced in the sector of its origin. In Section3.2 we compute the GVC-related final goods and services, a measure of purely backwardparticipation, traced at the very end of the chain, in the sector of final completion. Finally,in Section 3.3 we provide a comprehensive breakdown of total output, showing how totrace not only GVC-related value-added and final goods and services – the origin andthe end of the chain – but also a more central mode of participation, consisting of allthe inputs that are bought and sold by a sector in the intermediate links of the globalsupply chain. It turns out that this intermediate mode of participation, overlooked bythe literature, is by far the most relevant in the data.
3.1 GVC-related value-added
The portion of value-added related to GVC corresponds to value-added originated ina specific sector, exported directly or after further domestic processing stages, and re-exported by the bilateral partner. This mode of participation is purely forward, as goodsand services are sold onwards from the origin. It is obtained subtracting from total value-added of a sector the portion that is never exported and the one that cross just one border,following Borin and Mancini (2015) and Wang et al. (2017), i.e.
GVCV As = Vs
∧ G∑j,k
BsjYjk −Vs
∧Lss
[Yss +
G∑r 6=s
Ysr +G∑
r 6=s
AsrLrrYrr
](25)
16
It should be noted that at the country level this is precisely the GVC-related trade forwardparticipation in equation (7), since Vs
∑Gj,k BsjYjk − VsLssYss = VsLss
∑Gr 6=s Esr.15
Instead, at the sectoral level GVC-forward participation in exports and GVC-relatedvalue-added do differ. The former traces the engagement in GVC activities of a particularexporting sector, which might not be the origin of the value-added. Instead, the latterlooks at the direct and indirect connections with international production networks of thesector that is the origin of the value-added and might not even export at all.
At the country level, summing across the n sectors, the share of value-added relatedto GVC activities is
GV CXV As = uN GVCV A
s
uN VAs= GVCPureForws
uN VAs, (26)
while at the world level
GV CXV A = uN∑G
s GVCV As
uN∑G
s VAs
= uN∑G
s GVCPureForws
uN∑G
s VAs
, (27)
It should be noted that at the global level, while the overall GVC-related trade(GV CX in equation 6) takes into account also the length and the complexity of theGVCs, GVC-related value-added does not. In fact, when the same item (i.e. valueadded component) is re-exported many times along the value chain by different countries,the GVC share of gross trade will automatically increase as compared to the non-GVCportion. Instead, the GVC-related value-added indicator is not directly affected by thefact that a certain item crosses just two or many borders.
3.2 GVC-related final goods production
Following the usual rationale, we consider as GVC-related those final goods and servicesproductions that crossed at least two borders, as in Wang et al. (2017). This is traced inthe sector that completes the final goods and services, as it is the very last link of a chain,purely backward integrated. Operationally, we need to subtract from total final goodsproduction what is imported by the bilateral partner and absorbed in the domestic econ-omy and what is produced only exploiting domestic value chains, before being absorbedby the domestic or foreign demand:
GVCYs =
G∑z
Ysz −G∑
j 6=s
VjLjjAjsLss
∧Yss −VsLss
∧ G∑z
Ysz (28)
Again, at the country level, summing across the n sectors, the share of final goods15In other words, domestic value-added in exports, which is given by the GVC pure forward participation
and the traditional trade, is equal to the total domestic value-added minus the domestic value-added infinal goods that has never crossed a single border.
17

related to GVC activities is
GV CXYs = uN GVCY
s∑Gz uN Ysz
, (29)
while at the world levelGV CXY = uN
∑Gs GVCY
s
uN∑G
s,z Ysz
, (30)
Obviously, at the global level, summing across countries and sectors, final goodsproduction related to GVC is equal to the value-added related to GVC activities:
G∑s
uN GVCV As =
G∑s
uN GVCYs . (31)
In the next Section we show that this property can be exploited to obtain an indexof the degree of relative participation in GVC-output.
3.3 GVC-related output
We now develop a more comprehensive framework to trace different modes of GVC par-ticipation within output, taking the view of a sector of production. We show that thisencompasses the GVC activities traced in value-added and final goods, but also all the ex-changes of inputs within the intermediates stages of production that are related to GVCs.This is crucial since GVC-related value-added and final goods provide just a partial repre-sentation of countries’ and sectors’ engagement in GVCs. The former looks only at purelyforward linkages, traced in the very first link of a chain, i.e. the sector of origin of thevalue-added. The latter considers only purely backward linkages, measured in the verylast link of a chain, i.e. the sector of completion of final goods and services. At the endof the section we will discuss the advantages of assessing GVC participation consideringthe entire chain.
Following the same rationale as in the case of GVC participation traced in tradeflows we define as GVC-related the output of a sector that crosses more than one border.
First, we decompose the total output of a specific sector in terms of i) importedintermediates, ii) domestic intermediates and iii) value added:
Xs =G∑j
VjLjj∑G
k 6=j AjkBks
∧
Xs + VsLssAss
∧Xs + Vs
∧Xs (32)
Then, we trace in each one of the terms above the share that is related to GVCactivities, i.e. that crosses at least two borders.
Starting from imported inputs, we note that only those coming directly from the
18
partner – bought by country s sector n directly from abroad or indirectly, from otherdomestic sectors after many processing stages within the domestic value chain – andnot re-exported cannot be considered as related to GVC. The reason is that only theseimported inputs cross just one border. The rest, directly or indirectly bought by thesector through domestic and foreign value chains, crosses at least two borders, eitherbefore the domestic absorption or considering also their re-export. Thus, GVC-relatedimported inputs is
GVCImpInps =
G∑j
VjLjj∑G
k 6=j AjkBks
∧
Xs −G∑
j 6=s
VjLjjAjsLss
∧LssYss (33)
It should be noted that the only portion of GVC imported inputs not sold to othersectors, i.e. at the end of the chain, is the one purchased by the sector of completionof the final good. Indeed, this is the only share of total output that is purely relatedto backward participation in GVC. In other words, it represents the very last link of achain, since it encompasses i) the inputs that have crossed more than one border that areembedded in final goods and services produced in country s by the sector and absorbed ins itself; and ii) the inputs that have crossed one border and are embedded in final goodsand services produced in s by the sector and exported by the same sector to the finalmarket. Therefore, starting from (33), pure backward GVC related-output is obtainedsubstituting final production to output in the two terms:
GVCPureBackXs =
G∑j
VjLjj∑G
k 6=j AjkBks
∧G∑z
Ysz −G∑
j 6=s
VjLjjAjsLss
∧Yss (34)
Despite the different formulation, GVCPureBackXs is equal to GVC-related final
goods production, i.e. GVCYs reported in equation (28).16
Lastly, the part of GVC-related imported inputs that is not pure backward par-ticipation might be considered as an intermediate type of participation in GVCs, i.e.two-sided, as imported inputs are bought directly or indirectly by the sector (backward)but are sold to other sectors (forward):
GVCTwoSideImpInps = GVCImpInp
s −GVCPureBackXs (35)
The same strategy to compute GVC-related output might be applied to the secondcomponent, i.e. domestic inputs. These inputs originate in country s and are boughtdirectly or indirectly through domestic chains by the sector (VsLssAss
∧Xs). We can
16Proof available upon request.
19

focus on just two sub-components of domestic inputs, namely domestic inputs sold toother countries by the sector (
∑Gr 6=s AsrXr) and domestic inputs sold to other domestic
sectors and embedded in exports later on (∑G
r 6=s AssLssAsrXr). To encompass GVCparticipation, we need to be sure that inputs are further re-exported by the bilateralpartner, thus crossing at least two borders. This can be achieved substituting total grossoutput of country r, Xr, with the total gross output of r that is re-exported, or, in otherterms, not directly absorbed, Xexp
r = Xr − LrrYrr. It should also be noted that GVC-related domestic inputs embraces both backward and forward inter-linkages. In fact,these inputs are bought within domestic chains (backward component) but also sold toother domestic sectors or directly exported (forward component). Therefore, GVC-relateddomestic inputs represents an intermediate mode of GVC participation:
GVCTwoSideDomInps = VsLssAss
∧ G∑r 6=s
(AsrXexpr + AssLssAsrXexp
r ) (36)
Finally, we consider the last component of output, i.e. value-added, and trace thepart of it related to GVC following the same rationale applied to domestic inputs. Theonly difference is that the sector producing value-added identifies the very first link of asupply chains, i.e. it’s actual origin. Thus, it might be considered as a measure of pureforward participation in GVCs:
GVCPureForwXs = Vs
∧ G∑r 6=s
(AsrXexpr + AssLssAsrXexp
r ) . (37)
Not surprisingly, despite the different formulation, GVC pure forward participa-tion measured in output is equal to GVC-related value-added, i.e. GVCV A
s reported inequation (25).17
Summing up, as for the GVC-related trade presented in Section 2, GVC-relatedoutput can be broken down in three components: pure backward participation, i.e. im-ported inputs embedded by the sector in final goods; pure forward participation, i.e.value-added sold by the sector of origin abroad or domestically and incorporated in ex-ports later on; domestic inputs and imported inputs not embedded in final goods, i.e. atwo-sided type of GVC participation that is simultaneously backward and forward related,since it consists of inputs that are first bought and then sold by the sector:
GVCXs = GVCPureBackX
s + GVCPureForwXs + GVCTwoSideX
s (38)17Proof available upon request.
20
where GVCTwoSideXs = GVCTwoSideImpInp
s + GVCTwoSideDomInps .
As for the other indices of GVC participation, results at the country level, i.e.summing across the n sectors, might be obtained thanks to the additive property of thesemeasures:
GV CXXs = uN GVCX
s
uN Xs, (39)
while at the world levelGV CXX = uN
∑Gs GVCX
s
uN∑G
s Xs
, (40)
Analogously, GVCXs sub-indices can be aggregated to national and global level:
GV CiXXs = uN GVCiX
s
uN Xs, (41)
while at the world levelGV CiXV A = uN
∑Gs GVCiX
s
uN∑G
s Xs
, (42)
where i = PureForw, TwoSide, PureBack.
In addition, the value of output that never crosses a border, i.e. purely domestic,is obtained as the sum of the domestic inputs and value-added that are not exported atall:
DomXs = VsLssAss
∧LssYss + Vs
∧LssYss. (43)
Finally, output related to traditional trade, i.e. crossing only one border beforebeing absorbed by final demand, can be computed as:
TradXs = Xs −DomX
s −GVCXs . (44)
As for the indicator of ‘GVC-related trade’, at the global level, i.e. summingacross all countries, the ‘GVC pure-backward-related output’ will be equal to the ‘GVCpure-forward-related output’:
G∑s
GVCPureForws =G∑s
GVCPureBacks. (45)
Therefore, a natural measure of the type of participation in output of countriesand sectors in GVC can be straightforwardly obtained as
PXs =
(GVCPureForwX
s −GVCPureBackXs
)�GVCX
s . (46)
The vector PXs measures the ‘forwardness’ of the n sectors in country s in terms
21
of their total output, and is bounded between -1 and 1. At the country level, summingacross the sectors, we have
P Xs = uN GVCPureForws − uN GVCPureBacks
uN GVCs. (47)
In addition, it is equal to 0 at the aggregate level, given the relation in equation(45).
It should be clear now why GVCX is a much more general indicator with respect toGVCY = GVCPureBackX and GVCV A = GVCPureForwX .Not considering as partof the GVC participation the inputs exchanged in the intermediate stages of a productionchain leads to largely understate the actual engagement in GVCs of countries and sectors.In fact, the total value of the inputs sold and bought during the intermediate stages ofglobal supply chains represents more than half of the total output related to GVCs, asshown in Section 4.
Another drawback of relying only on GVCV A or GVCY is the inaccurate mode ofGVC participation that can be inferred from them once they are expressed as a share oftotal value-added and total final goods and services production, respectively, as in Wang etal. (2017). Suppose, for instance, that a sector produces only final goods (total value of100), with imported inputs related to GVCs (75), adding a very small amount of value-added (25), which is in turn completely GVC-related. The share of value-added relatedto GVCs with respect to total value-added, i.e. GV CXV A in equation (26), will be equalto 100%, while the share of final goods production related to GVCs with respect to totalfinal goods production, i.e. GV CXY in equation (29), will be 75%. This might leadto the incorrect conclusion that the sector is mostly integrated in GVCs with forwardlinkages, even if it participates in GVCs especially in the completion of final products,at the end of a chain. Instead, the index of ‘forwardness’ based on GVC-related output,P X
s , will correctly indicate a higher backward participation compared to forward, i.e.−0.50 = (25−75)/(25+75). The reason is that it traces, within the total GVC-output,18
the amount of it that is related to pure backward or pure forward participation, and itdoes not depend on the scale of value-added or final goods production. In addition, sinceit is equal to zero at the global level, the actual position of a country or a sector withrespect to the average (i.e. zero) is immediately evident.
4 Empirics: country-sector measures of GVC participation
Using the EORA dataset, which covers the period 1990-2015, and the Asian DevelopmentBank MRIOT database (ADB), which covers the period 2007-2019 we are able to construct
18In this simplified example we considered a sector producing only final goods, thus GVC-related outputand GVC-related final goods obviously coincide. However, its conclusions are valid also in more generalcases.
22
a series of GVC participation from 1990 to 2019. These data can inform two types ofquestions. First, they allow to evaluate the extent to which countries/sectors participatein GVC, or in other words, what part of trade and output are involved in GVC. Secondlythe allow to assess how countries and sectors participate in GVCs. The question inthis second case is whether a given country-sector is mainly a supplier of inputs or adownstream user.
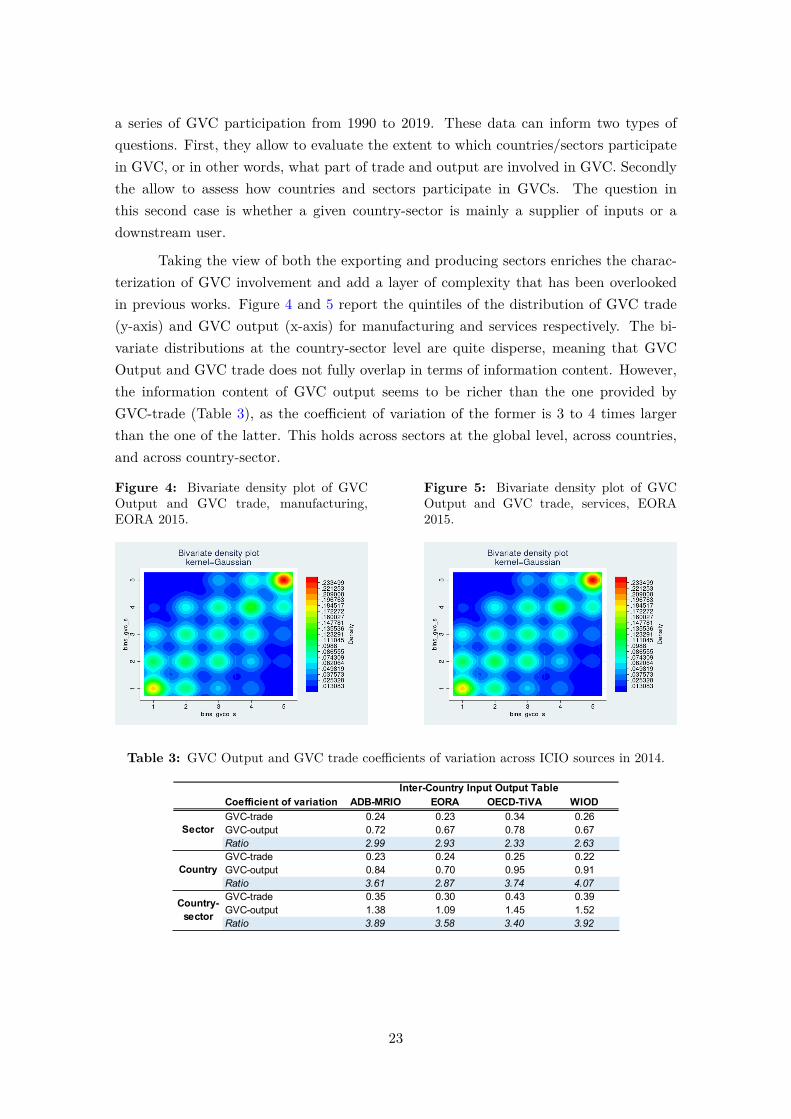
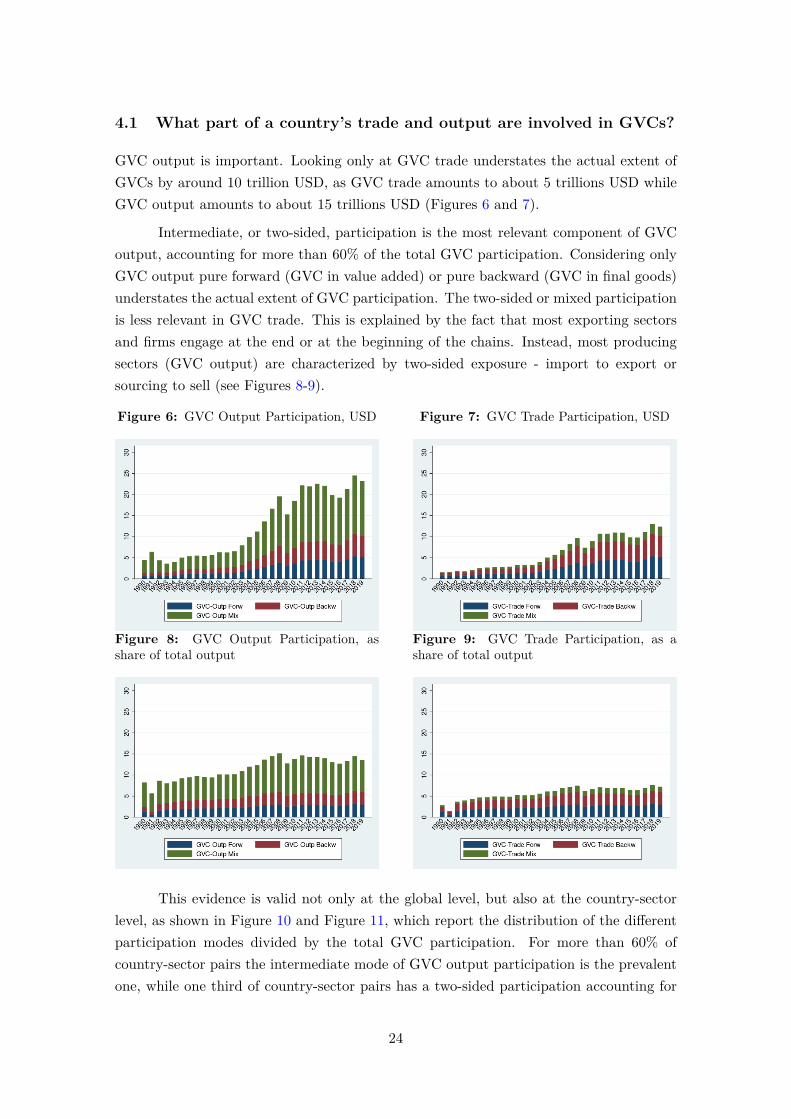
Taking the view of both the exporting and producing sectors enriches the charac-terization of GVC involvement and add a layer of complexity that has been overlookedin previous works. Figure 4 and 5 report the quintiles of the distribution of GVC trade(y-axis) and GVC output (x-axis) for manufacturing and services respectively. The bi-variate distributions at the country-sector level are quite disperse, meaning that GVCOutput and GVC trade does not fully overlap in terms of information content. However,the information content of GVC output seems to be richer than the one provided byGVC-trade (Table 3), as the coefficient of variation of the former is 3 to 4 times largerthan the one of the latter. This holds across sectors at the global level, across countries,and across country-sector.
Figure 4: Bivariate density plot of GVCOutput and GVC trade, manufacturing,EORA 2015.
Figure 5: Bivariate density plot of GVCOutput and GVC trade, services, EORA2015.
Table 3: GVC Output and GVC trade coefficients of variation across ICIO sources in 2014.
Coefficient of variation ADB-MRIO EORA OECD-TiVA WIOD
GVC-trade 0.24 0.23 0.34 0.26GVC-output 0.72 0.67 0.78 0.67Ratio 2.99 2.93 2.33 2.63GVC-trade 0.23 0.24 0.25 0.22GVC-output 0.84 0.70 0.95 0.91Ratio 3.61 2.87 3.74 4.07GVC-trade 0.35 0.30 0.43 0.39GVC-output 1.38 1.09 1.45 1.52Ratio 3.89 3.58 3.40 3.92
Note: 2014 data
Country-sector
Country
Sector
Inter-Country Input Output Table
23
4.1 What part of a country’s trade and output are involved in GVCs?
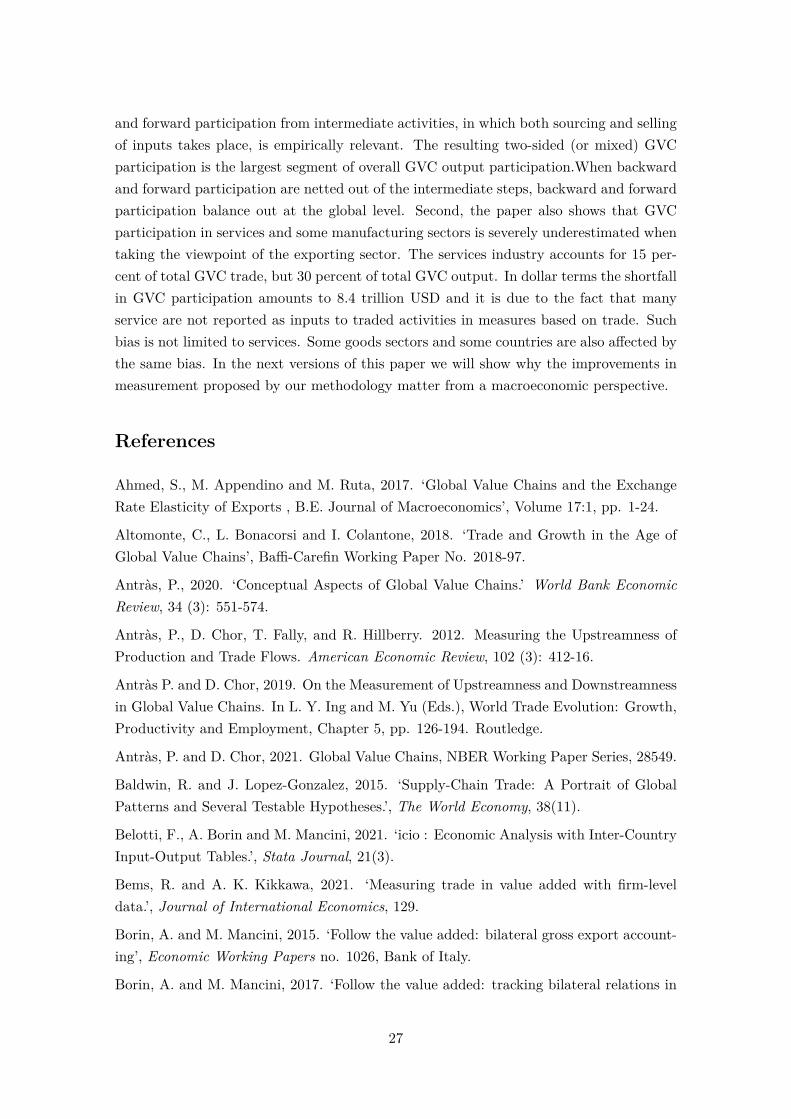
GVC output is important. Looking only at GVC trade understates the actual extent ofGVCs by around 10 trillion USD, as GVC trade amounts to about 5 trillions USD whileGVC output amounts to about 15 trillions USD (Figures 6 and 7).
Intermediate, or two-sided, participation is the most relevant component of GVCoutput, accounting for more than 60% of the total GVC participation. Considering onlyGVC output pure forward (GVC in value added) or pure backward (GVC in final goods)understates the actual extent of GVC participation. The two-sided or mixed participationis less relevant in GVC trade. This is explained by the fact that most exporting sectorsand firms engage at the end or at the beginning of the chains. Instead, most producingsectors (GVC output) are characterized by two-sided exposure - import to export orsourcing to sell (see Figures 8-9).
Figure 6: GVC Output Participation, USD Figure 7: GVC Trade Participation, USD
Figure 8: GVC Output Participation, asshare of total output
Figure 9: GVC Trade Participation, as ashare of total output
This evidence is valid not only at the global level, but also at the country-sectorlevel, as shown in Figure 10 and Figure 11, which report the distribution of the differentparticipation modes divided by the total GVC participation. For more than 60% ofcountry-sector pairs the intermediate mode of GVC output participation is the prevalentone, while one third of country-sector pairs has a two-sided participation accounting for
24

more that two thirds of their total GVC participation.
Figure 10: Distribution of GVC outputparticipation modes over total GVC output,WIOD 2014.
Figure 11: Distribution of GVC exportsparticipation modes over total GVC exports,WIOD 2014.
From the point of view of sectors, services participation in GVC is negligible whenwe look at the share of GVC-trade over output. It is noticeably larger when participationis measured from the viewpoint of GVC output. The reason is that services sectors do notexport directly but exploit domestic chains to export indirectly, and when one looks atexport only their contribution ends up recorded as exports of a downstream using sector.Meanwhile about one quarter of all manufacturing output is connected to GVC trade (seeFigure 12 and Figure 13).
Figure 12: GVC Output Participation inManufacturing and Services, as share of totaloutput. EORA and ADB MRIO.
Figure 13: GVC Trade Participation Manu-facturing and Services, as a share of total out-put. EORA and ADB MRIO.
At the country level GVC trade and output are clearly correlated, but the countryrank is different. Each dot in Figure 14 and Figure 15 is a country among the 30 countriesworldwide with the highest real GDP. We highlight those countries whose rank movesby at least 25 positions when we compare GVC output to GVC trade participation.For example, in the left hand panel Germany is ranked 22nd in terms of GVC outputparticipation but 53rd in terms of GVC trade participation, out of a total of 189 countriesreported in the EORA dataset.
25

Figure 14: GVC Output Participation vsTrade Participation in Manufacturing, EORA2015.
Figure 15: GVC Output Participation vsTrade Participation in Services, EORA 2015.
4.2 Supplier or user of intermediate inputs?
The indices of forwardness discussed in Section 2 and Section 3 are useful to assess thetype of engagement of countries in GVCs. Indeed, they are also correlated with relativeposition, computed as the ratio of upstreamness and downstreamness (see Antràs andChor, 2019 and Wang et al., 2017). Figure 16 and Figure 17 show that correlation ishigher for forwardness in output, more in line with the standard measures of positioning.
Figure 16: Forwardness in exports vsposition, EORA 2015.
Position is computed as the ratio of up-streamness and downstreamness.
Figure 17: Forwardness in output vsposition, EORA 2015.
Position is computed as the ratio of up-streamness and downstreamness.
5 Conclusion
This paper identifies two important sources of mismeasurement of GVC participation incountry-sector (macro) settings and proposes a methodology and measures that correctfor these biases. First, the paper shows that the distinction of participation in backwardversus forward leads to a false empirical regularity whereby each country appears system-atically more GVC integrated backward than forward. Instead, separating pure backward
26
and forward participation from intermediate activities, in which both sourcing and sellingof inputs takes place, is empirically relevant. The resulting two-sided (or mixed) GVCparticipation is the largest segment of overall GVC output participation.When backwardand forward participation are netted out of the intermediate steps, backward and forwardparticipation balance out at the global level. Second, the paper also shows that GVCparticipation in services and some manufacturing sectors is severely underestimated whentaking the viewpoint of the exporting sector. The services industry accounts for 15 per-cent of total GVC trade, but 30 percent of total GVC output. In dollar terms the shortfallin GVC participation amounts to 8.4 trillion USD and it is due to the fact that manyservice are not reported as inputs to traded activities in measures based on trade. Suchbias is not limited to services. Some goods sectors and some countries are also affected bythe same bias. In the next versions of this paper we will show why the improvements inmeasurement proposed by our methodology matter from a macroeconomic perspective.
References
Ahmed, S., M. Appendino and M. Ruta, 2017. ‘Global Value Chains and the ExchangeRate Elasticity of Exports , B.E. Journal of Macroeconomics’, Volume 17:1, pp. 1-24.
Altomonte, C., L. Bonacorsi and I. Colantone, 2018. ‘Trade and Growth in the Age ofGlobal Value Chains’, Baffi-Carefin Working Paper No. 2018-97.
Antràs, P., 2020. ‘Conceptual Aspects of Global Value Chains.’ World Bank EconomicReview, 34 (3): 551-574.
Antràs, P., D. Chor, T. Fally, and R. Hillberry. 2012. Measuring the Upstreamness ofProduction and Trade Flows. American Economic Review, 102 (3): 412-16.
Antràs P. and D. Chor, 2019. On the Measurement of Upstreamness and Downstreamnessin Global Value Chains. In L. Y. Ing and M. Yu (Eds.), World Trade Evolution: Growth,Productivity and Employment, Chapter 5, pp. 126-194. Routledge.
Antràs, P. and D. Chor, 2021. Global Value Chains, NBER Working Paper Series, 28549.
Baldwin, R. and J. Lopez-Gonzalez, 2015. ‘Supply-Chain Trade: A Portrait of GlobalPatterns and Several Testable Hypotheses.’, The World Economy, 38(11).
Belotti, F., A. Borin and M. Mancini, 2021. ‘icio : Economic Analysis with Inter-CountryInput-Output Tables.’, Stata Journal, 21(3).
Bems, R. and A. K. Kikkawa, 2021. ‘Measuring trade in value added with firm-leveldata.’, Journal of International Economics, 129.
Borin, A. and M. Mancini, 2015. ‘Follow the value added: bilateral gross export account-ing’, Economic Working Papers no. 1026, Bank of Italy.
Borin, A. and M. Mancini, 2017. ‘Follow the value added: tracking bilateral relations in
27

global value chains’, MPRA Working paper No. 82692.
Borin, A. and M. Mancini, 2019. ‘Measuring What Matters in Global Value Chains andValue-Added Trade’, Policy ResearchWorking Paper;No. 8804. World Bank, Washington,DC.
Cappariello, R. and A. Felettigh, 2015. ‘How does foreign demand activate domesticvalue-added? A comparison among the largest euro-area economies.’ Temi di Discussione(Working Papers) 1001, Bank of Italy.
de Gortari, A., 2019. ‘Disentangling Global Value Chains.’, NBER Working Paper Series,25868.
Hummels, D., J. Ishii and K.M. Yi, 2001. ‘The Nature and Growth of Vertical Special-ization in World Trade.’ Journal of International Economics, 54, pp. 75-96.
Johnson, R. C. and G. Noguera, 2012. ‘Accounting for Intermediates: Production Sharingand Trade in Value Added.’ Journal of International Economics, 86, Iss. 2, pp. 224-236.
Johnson, R. C. and G. Noguera, 2017. ‘A Portrait of Trade in Value-Added over FourDecades.’ Review of Economics and Statistics, 99, Iss. 5, pp. 896-911.
Kee, H L., and H. Tang, 2016. ‘Domestic Value Added in Exports: Theory and FirmEvidence from China.’ American Economic Review, 106 (6): 1402-36.
Koopman, R., Z. Wang and S. Wei, 2014. ‘Tracing Value-Added and Double Counting inGross Exports.’ American Economic Review, 104(2): 459-94.
Lenzen, M., D. Moran, K. Kanemoto and A. Geschke, 2013. ‘Building EORA: a globalmulti-region input-output database at high country and sector resolution’, Economic Sys-tems Research, 25:1, pp. 20-49.
Rahman, J. and T. Zhao, 2013. ‘Export Performance in Europe : What Do We Knowfrom Supply Links?’ IMF Working Paper, No. 13/62.
Timmer, M. P., E. Dietzenbacher, B. Los, R. Stehrer and G.J. de Vries, 2015. ‘An Illus-trated User Guide to the World Input-Output Database: the Case of Global AutomotiveProduction.’ Review of International Economics.
Wang, Z., S. Wei and K. Zhu, 2013. ‘Quantifying International Production Sharing atthe Bilateral and Sector Levels.’ NBER Working Paper, No. 19677.
Wang, Z., S. Wei, X. Yu and K. Zhu, 2017. ‘Characterizing Global Value Chains: Pro-duction Length and Upstreamness.’ NBER Working Paper Series, 23261.
28
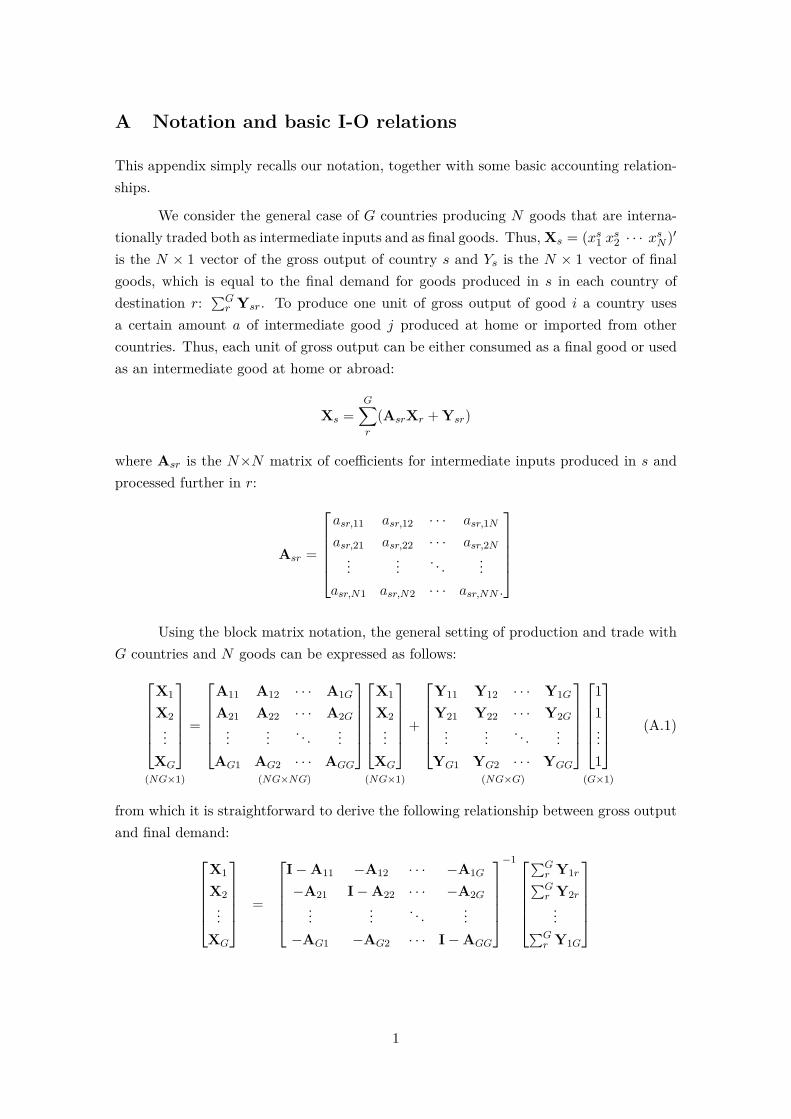
A Notation and basic I-O relations
This appendix simply recalls our notation, together with some basic accounting relation-ships.
We consider the general case of G countries producing N goods that are interna-tionally traded both as intermediate inputs and as final goods. Thus, Xs = (xs
1 xs2 · · · xs
N )′
is the N × 1 vector of the gross output of country s and Ys is the N × 1 vector of finalgoods, which is equal to the final demand for goods produced in s in each country ofdestination r:
∑Gr Ysr. To produce one unit of gross output of good i a country uses
a certain amount a of intermediate good j produced at home or imported from othercountries. Thus, each unit of gross output can be either consumed as a final good or usedas an intermediate good at home or abroad:
Xs =G∑r
(AsrXr + Ysr)
where Asr is the N×N matrix of coefficients for intermediate inputs produced in s andprocessed further in r:
Asr =
asr,11 asr,12 · · · asr,1N
asr,21 asr,22 · · · asr,2N
...... . . . ...
asr,N1 asr,N2 · · · asr,NN .
Using the block matrix notation, the general setting of production and trade with
G countries and N goods can be expressed as follows:X1
X2...
XG
(NG×1)
=
A11 A12 · · · A1G
A21 A22 · · · A2G
...... . . . ...
AG1 AG2 · · · AGG
(NG×NG)
X1
X2...
XG
(NG×1)
+
Y11 Y12 · · · Y1G
Y21 Y22 · · · Y2G
...... . . . ...
YG1 YG2 · · · YGG
(NG×G)
11...1
(G×1)
(A.1)
from which it is straightforward to derive the following relationship between gross outputand final demand:
X1
X2...
XG
=
I−A11 −A12 · · · −A1G
−A21 I−A22 · · · −A2G
...... . . . ...
−AG1 −AG2 · · · I−AGG
−1
∑Gr Y1r∑Gr Y2r
...∑Gr Y1G
1
=
B11 B12 · · · B1N
B21 B22 · · · B2N
...... . . . ...
BG1 BG2 · · · BGG
∑Gr Y1r∑Gr Y2r
...∑Gr Y1G
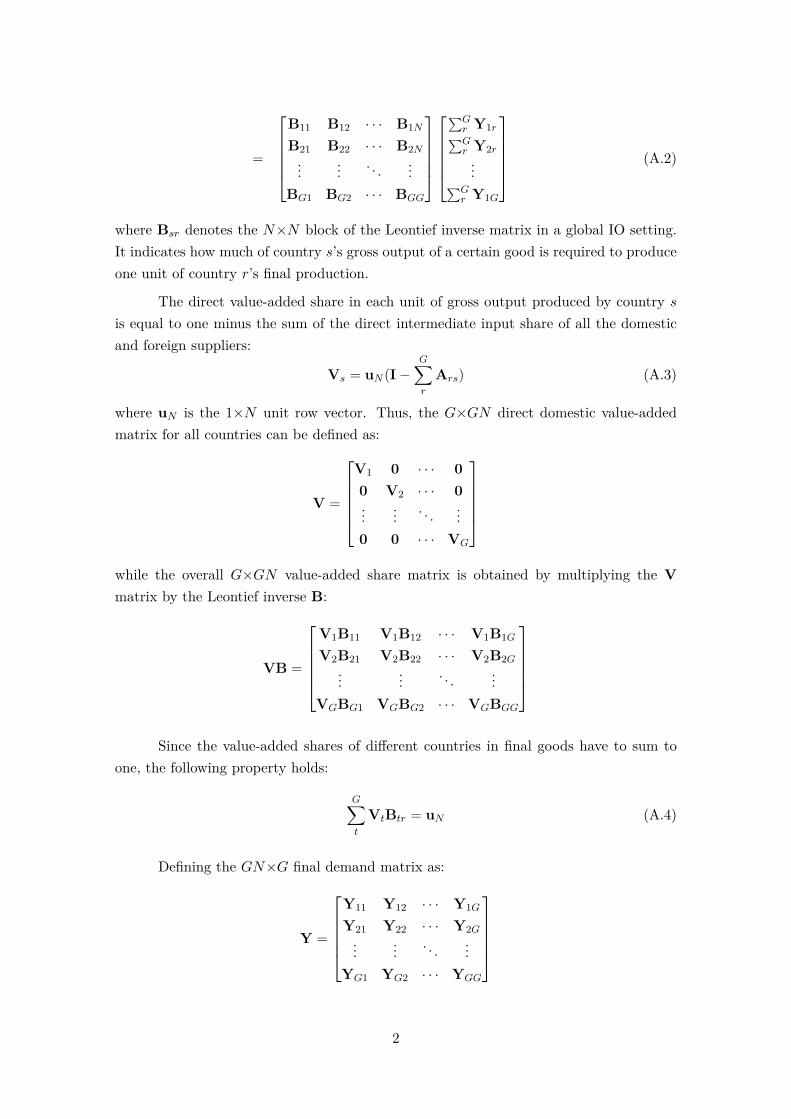
(A.2)
where Bsr denotes the N×N block of the Leontief inverse matrix in a global IO setting.It indicates how much of country s’s gross output of a certain good is required to produceone unit of country r’s final production.
The direct value-added share in each unit of gross output produced by country s
is equal to one minus the sum of the direct intermediate input share of all the domesticand foreign suppliers:
Vs = uN (I−G∑r
Ars) (A.3)
where uN is the 1×N unit row vector. Thus, the G×GN direct domestic value-addedmatrix for all countries can be defined as:
V =
V1 0 · · · 00 V2 · · · 0...
... . . . ...0 0 · · · VG
while the overall G×GN value-added share matrix is obtained by multiplying the Vmatrix by the Leontief inverse B:
VB =
V1B11 V1B12 · · · V1B1G
V2B21 V2B22 · · · V2B2G
...... . . . ...
VGBG1 VGBG2 · · · VGBGG
Since the value-added shares of different countries in final goods have to sum to
one, the following property holds:
G∑t
VtBtr = uN (A.4)
Defining the GN×G final demand matrix as:
Y =
Y11 Y12 · · · Y1G
Y21 Y22 · · · Y2G
...... . . . ...
YG1 YG2 · · · YGG
2
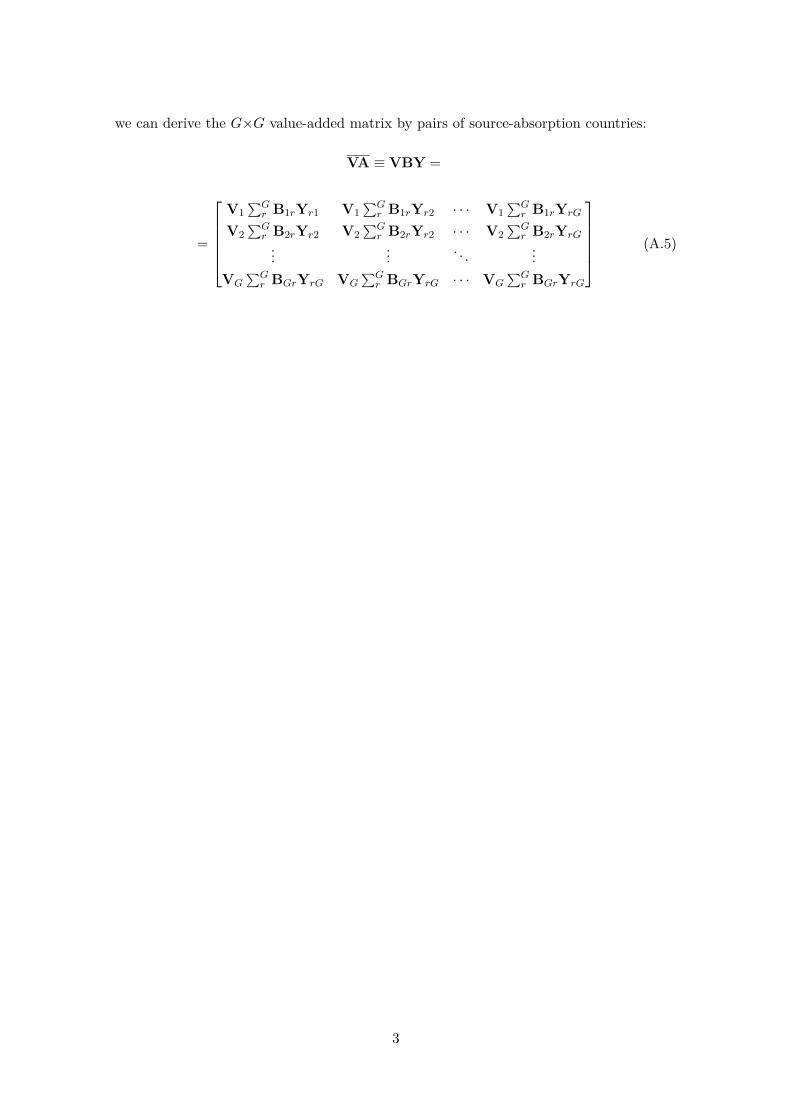
we can derive the G×G value-added matrix by pairs of source-absorption countries:
VA ≡ VBY =
=
V1
∑Gr B1rYr1 V1
∑Gr B1rYr2 · · · V1
∑Gr B1rYrG
V2∑G
r B2rYr2 V2∑G
r B2rYr2 · · · V2∑G
r B2rYrG
...... . . . ...
VG∑G
r BGrYrG VG∑G
r BGrYrG · · · VG∑G
r BGrYrG
(A.5)
3

B GVC Database on the World Integrated Trade Solutions
The broad set of measures discussed in the paper is available on the World IntegratedTrade Solutions (WITS) platform: the dataset is available here and the data visualizationshere.
Data sources
Inter-Country Input-Output data has been provisioned from multiple data sources. Theseare
• EORA26 (1990-2015) 199.82 version (eora). Lenzen, M., Moran, D., Kanemoto, K.,Geschke, A. 2013. ‘Building Eora: A Global Multi-regional Input-Output Databaseat High Country and Sector Resolution.’ Economic Systems Research, 25:1, 20-49.Please remember that the Eora MRIO is free for academic (university or grant-funded) work at degree-granting institutions. All other uses require a data licensebefore the results are shared.
• WIOD 2016 VERSION (2000-2014) (wiodn) and WIOD 2013 VERSION (1995-2011) (wiodo). Timmer, M. P., E. Dietzenbacher, B. Los, R. Stehrer and G.J. deVries, 2015. ‘An Illustrated User Guide to the World Input-Output Database: theCase of Global Automotive Production.’ Review of International Economics. 23:575-605.
• OECD TiVA 2018 VERSION (2005-2015) (tivan) and OECD TiVA 2016 VERSION(1995-2011) (tivao). OECD, Trade in Value Added database, 2018, oe.cd/tiva
• ADBMRIO 2021 version (2000;2007-2020) (adb). Asian Development Bank MRIOTDatabase, mrio.adbx.online
The GVC Trade dataset contains measures related to international trade. Theunit of observation is the exporting country-importing country-exporting sector-year. TheGVC Output dataset contains measures related to gross output. The unit of observa-tion is country-producing sector-year. All data are in millions of US dollars.
Variables description
GVC Trade dataset
GVC-related trade measures the value of goods and services exported by a sector or acountry that crosses more than one border. The difference between gross trade and GVC-related trade is defined as Traditional trade, i.e. the value of goods and services thatcrosses just one border. The Traditional trade can also be divided into Traditional
4

trade in intermediate goods and Traditional trade in final goods. GVC-relatedtrade presents two desirable features:
• once expressed as a share of gross trade, it is bounded between 0 and 1;
• it is additive at any level of aggregation/disaggregation of trade flows; thus, datacan be summed at any level – total country exports/world exports/world sectorexports/country groups and so on – in order to obtain the proper GVC participationmeasures at the desired level of aggregation
GVC-related trade is always traced in the exporting sector. The overallGVC-relatedtrade encompasses three different types of GVC linkages.
• Pure forward GVC related-trade: value-added in goods and services entirelygenerated within the domestic chains – without any border crossing – exported bythe sector and re-exported further by the partner. The exporting sector is engagedin GVC activities at the origin of the chain.
• Two-sided GVC related-trade: imported inputs bought by the exporting sectordirectly from abroad or indirectly through domestic chains, exported and furtherre-exported by the partner. The exporting sector is located in a central position ofthe chain.
• Pure backward GVC related-trade: imported inputs bought by the sectordirectly from abroad or indirectly through domestic chains, exported by the sectorto the final market, as intermediates or final goods. The exporting sector is engagedin GVC activities close to the end of the chain.
A natural measure of the Type of participation in GVC-related trade (forward-ness) at any level of aggregation can be straightforwardly obtained as the differencebetween pure forward and pure backward participation as a share of the overall GVCrelated-trade. This measure is bounded between -1 and 1 and it is equal to zero at theglobal level.
GVC Output dataset
GVC-related output is the output of a country or sector that directly or indirectlycrosses more than one border. It provides a more general assessment of the amount ofproductions of each sector that is related to GVCs, since it takes into account the entiresupply chain the sector participates to, regardless of its direct involvement in exportactivities.
The GVC-related output shares the same properties of GVC related-trade:
5

• once expressed as the share of output, it is bounded between 0 and 1;
• it is additive at any level of aggregation/disaggregation.
Within the total output of a country or sector, the amount that never crosses a singleborder, neither directly or indirectly, is labeled Purely domestic output. Instead, theoutput that directly or indirectly crosses just one border is labeled Output related totraditional trade, i.e. value-added produced by the sector and sold abroad to the finalmarket, directly by the producing sector or indirectly trough domestic chains. The overallGVC-related output encompasses three different types of GVC linkages.
• Pure forward GVC related-output: value-added produced by the sector andsold directly abroad by the sector or indirectly trough domestic chains; then, re-exported by the partner country. In other terms, the GVC-output is traced in thesector where the value-added originates, the very first link of a chain. Pure forwardGVC related-output might also be labeled as GVC related-value-added.
• Two-sided GVC related-output: domestic inputs bought by the sector withindomestic chains and sold directly abroad by the sector or indirectly trough domesticchains, and re-exported by the partner; imported inputs bought directly from abroadby the sector or indirectly trough domestic chains, and sold directly abroad as inputsor indirectly trough domestic chains. In other terms, the GVC-output here is tracedin the sector that simultaneously buys and sells intermediate inputs, in a centralposition of the chain.
• Pure backward GVC related-output: imported inputs bought by the sectordirectly from abroad or indirectly through domestic chains, and embedded in finalgoods and services production sold to domestic consumers – if inputs crossed morethan 1 border before – or to foreign consumers – if inputs crossed only 1 border.In other terms, GVC-output is traced in the sector that completes the final goodsor services, the very last link of a chain. Pure backward GVC related-outputmight also be labeled as GVC related-final goods and services.
A natural measure of the Type of participation in GVC-related output (forward-ness) at any level of aggregation can be straightforwardly obtained as the differencebetween pure forward and pure backward participation as a share of the overall GVCrelated-output. This measure is bounded between -1 and 1 and it is equal to zero at theglobal level. Finally, readers interested in computing their own measures of global valuechain trade by origin and destination using also user-provided input output tables arereferred to the icio module in Stata by Belotti et al. (2021). Please note that in icio
backward participation is equal to pure backward + two-sided participation while forwardparticipation corresponds to the pure forward participation described in this paper.
6