counting multidimensional deprivations in the presence … · counting multidimensional...
TRANSCRIPT

Counting Multidimensional Deprivations in the Presence
of Differences in Needs
Yadira Diaz (ISER, University of Essex, United Kingdom) and Vasileios Iliopoulos (University
of Essex, United Kingdom)
Paper prepared for the 34
th IARIW General Conference
Dresden, Germany, August 21-27, 2016
Session 3 (Plenary): Well-Being I
Time: Tuesday, August 23, 2016 [Morning]

Counting multidimensional deprivations in thepresence of differences in needs
Yadira Díaz ∗ Vasileios Iliopoulos
August 4, 2016
Abstract
Individuals from different demographic population subgroups and house-holds of different size and composition exhibit different needs. Multidi-mensional deprivation comparisons in the presence of these differences inneeds have yet to be analysed. This paper proposes a family of multidi-mensional deprivation indices that explicitly takes into account observeddifferences in needs across demographically heterogeneous units (i.e., ei-ther households of different size and composition or individuals of dif-ferent population subgroups). The proposed counting family of indicesdraws from the one-dimensional parametric equivalence scale literatureand aims to describe how much deprivation two demographically hetero-geneous units with different needs must exhibit to be catalogued as equiva-lently deprived. Through the use of empirically developed counterfactualscenarios, we evaluate the effects on multidimensional deprivation inci-dence profiles of using the different approaches to measurement includedin our proposed family of indices. The results of this evaluation demon-strate that neglecting differences in needs yields biased multidimensionaldeprivation incidence profiles. These results also shed light on the abilityof our proposed measures to effectively capture differences in needs. Ourfamily of measures is also evaluated in this paper in terms of its properties.These results prove our proposed approach to measurement has the properorientation and is adequate for the purposes of poverty measurement.
Keywords: Multidimensional deprivation; poverty measurement; equivalencescales; heterogeneous households; individual heterogeneityJEL Codes: D63, I32
∗I would like to thank Paul Clarke, supervisor and graduate director of the Institute forSocial and Economic Research, for his guidance and thoughtful comments during the devel-opment of an earlier version of this manuscript, which appeared in the ECINEQ workingpaper series number 387 from December 2015. I am thankful for the helpful comments re-ceived from Erik Schokkaert. I have also benefited from discussions with Sabina Alkire, FrankCowell, Koen Decanq, Marc Fleurbaey and Suman Seth.
1

1 IntroductionThere is an increasing interest in measuring poverty by assessing deprivationin multiple dimensions of well-being rather than by exclusively evaluating theability to consume market commodities. Within this growing literature, mostof the applications of multidimensional deprivation measurement use the Alkireand Foster (2011) method and either individuals or households as the unit ofanalysis1.
However, differences in needs are present when measuring multidimensionaldeprivation across either individuals from different demographic population sub-groups or households of different sizes and compositions. While pregnant women,for instance, need access to antenatal health services, school-age children needaccess to basic education services. Deprivation of antenatal health services isthus relevant only to pregnant women, and access to basic education services isonly relevant to school-age children. Similarly, households without children arenot necessarily deprived in the absence of educational services and vaccinations,just as households without pregnant women are not necessarily deprived be-cause of a lack of antenatal health services. Differences in needs therefore, posecomparability challenges when measuring multidimensional deprivation acrossdemographically heterogeneous units, such as households of different sizes andcompositions or individuals of different age ranges and genders.
The individual-based applied multidimensional deprivation literature haveaddressed these differences in needs by restricting the analysis to demographi-cally homogeneous individuals. For instance, in terms of the individual-basedapplied multidimensional literature, the majority of these studies focuses onmeasuring multidimensional deprivation among either children or adult pop-ulations2. To this date in our knowledge, no individual-based application ofmultidimensional deprivation measurement considering the whole age range ofthe population can be found.
In terms of household-based indices, policy influential applications as theglobal Multidimensional Poverty Index (MPI) launched by the United NationsDevelopment Program (Alkire, Conconi, and Roche, 2013), the Colombian Mul-tidimensional Poverty Index (Angulo, Díaz, and Pardo, 2015), or studies suchas Alkire and Seth (2015), Alkire and Santos (2014), Ayuya, Gido, Bett, La-gat, Kahi, and Bauer (2015), Bader, Bieri, Wiesmann, and Heinimann (2015),Cavapozzi, Han, and Miniaci (2013), Mitra (2014), Alkire, Roche, Seth, and
1Although the terms ‘multidimensional deprivation’ and ‘multidimensional poverty’ areused interchangeably in literature, throughout this paper we use the former term to refer toindices that count the multiple deprivations jointly observed across a selected unit of analysisand, based on this counting procedure, identify the poor as the most deprived population.Examples of the long-standing literature in multidimensional deprivation measurement arethe following studies: Townsend (1979), Atkinson and Bourguignon (1982), Mack, Lansleyet al. (1985), Callan, Nolan, and Whelan (1993), Feres and Mancero (2001), Atkinson (2002),Alkire and Foster (2011), and Aaberge and Brandolini (2014a).
2Studies regarding child multidimensional deprivation are Roelen, Gassmann, andde Neubourg (2010), Roche (2013), Trani and Cannings (2013), Trani, Biggeri, and Mauro(2013), and Qi and Wu (2014). Studies that focus on multidimensional deprivation among anadult population include Oshio and Kan (2014) and Solaymani and Kari (2014).
2

Summer (2015), and Yu (2013), identify as most deprived those householdsthat exhibit the largest number of dimensions in deprivation disregarding theirsize and composition. They therefore, either assume the same set of needs acrosshouseholds or ignore the fact that demographically dissimilar households havesignificantly different needs.
In contrast to the multidimensional measurement literature, a plethora ofmethods and techniques that account for differences in needs can be found inthe one-dimensional welfare literature. Examples of such works include Kapteynand Van Praag (1978); Pollak and Wales (1979); Blundell and Lewbel (1991);Coulter, Cowell, and Jenkins (1992a); Cowell and Mercader-Prats (1999); Duclosand Mercader-Prats (1999), and Ebert and Moyes (2003). They aim to providesocietal profiles based on comparable household-based aggregates of income orexpenditure obtained through the use of equivalence scales. Comparisons ofmultidimensional deprivation between demographically dissimilar units have yetto be described in the multidimensional measurement literature.
This paper proposes a family of indices that measures multidimensional de-privation across demographically heterogeneous units while explicitly taking intoaccount differences in needs across them. The proposed approach extends theAlkire and Foster (2011) counting family of multidimensional poverty indices,providing a wider set of indices that aims to adjust for observable differences inneeds across demographically heterogeneous units. This is the methodologicalcontribution of this paper to the multidimensional measurement literature.
The choice of the individual or the household as the unit of analysis is notarbitrary. It involves a normative decision to be made during the multidimen-sional measurement process. Household-based measures conceive householdsas cooperative units that jointly face the deprivation suffered by the house-hold members. Individual-based measures, in contrast, allow the unmaskingof differences in multidimensional deprivation across demographic populationsubgroups, such as the case of gender differences analysed by Vijaya, Lahoti,and Swaminathan (2014) for Karnataka, India or by Agbodji, Batana, and Oue-draogo (2013) for Burkina Faso and Togo.
The family of indices that we propose in this paper allows multidimensionaldeprivation to be measured using either individuals or households as the unitof analysis. The choice of individual or household is therefore open to be madeaccording to the context of each application. In the case of household-basedmultidimensional measures, the purpose of accounting for differences in needsis to enable pairs of households and thus different populations of householdsto be compared on a more equivalent basis. Similarly, in the individual-basedcase, the indices proposed in this paper aim to enable multidimensional depri-vation comparisons of any two individuals and hence of different populations ofindividuals.
Furthermore, our proposed family of measures allows describing—under equiv-alent normative considerations—the burden that multidimensional deprivationplaces on each unit of analysis (either households or individuals). Such burdenis expressed through a family of measures that contains absolute, relative andintermediate normative perspectives. Multidimensional deprivation is therefore
3

described via count-based, share-based, or a mixture of count-based and share-based approaches to measurement.
To evaluate the effect of these different approaches to measurement of multi-dimensional deprivation incidence profiles, we construct counterfactual scenar-ios using the 2013 Paraguayan household survey. The obtained results demon-strate that neglecting differences in needs yields multidimensional deprivationincidence profiles to reflect not only differences in deprivation, but also differ-ences in needs that should be tackled by the measurement process. Failure totake differences in needs into account, as the dimensions count-based approachto measurement proposed by the Alkire and Foster (2011) methodology, wasfound to cause biased multidimensional incidence profiles. These results alsoshed light on the ability of our proposed measures to effectively capture thesedifferences in need.
In this paper we also evaluate our proposed family of measures throughthe properties that make it admissible for the purposes of multidimensionaldeprivation measurement. The result of this evaluation shows that our familyof measures fulfils this purpose, has the proper orientation and is non-sensitiveto non-relevant aspects of the distribution.
Our paper is organised as follows. The starting point is the backgroundliterature that analyses welfare comparisons in the presence of heterogeneousneeds. Section 2 presents an overview of this literature and the equivalencescale notion that seeds the family of indices proposed in this paper. Then, inSection 3 we describe the formal setting that includes the Alkire & Foster familyof indices, as background methodology, and the proposed family of multidimen-sional deprivation indices of this study. Sections 4 and 5 evaluate our measures,first disentangling how much of the differences in multidimensional deprivationincidence profiles are observed because unaddressed differences in needs, andthen in terms of their proposed poverty measurement properties. In Section6 we discuss and provide guidelines to set the most important context specificdefinitions that our proposed approach requires, and we conclude our study inSection 7 with some remarks.
2 Background
2.1 Welfare comparisons in the presence of heterogeneousneeds
A variety of methods and techniques from the one-dimensional literature assesswelfare and inequality rankings while taking into account differences in needsbetween households. Examples of such methods and techniques can be foundin Kapteyn and Van Praag (1978); Pollak and Wales (1979); Blundell and Lew-bel (1991); Coulter et al. (1992a); Cowell and Mercader-Prats (1999); Duclosand Mercader-Prats (1999), and Ebert and Moyes (2003). Within this liter-ature, these technologies are known as equivalence scales. Their relevance iscrucial for inequality and social welfare comparisons; as pointed out in Cow-
4

ell and Mercader-Prats (1999, page 409): “Equivalence scales, by providing aninterpersonally comparable measure of living standards, play a central role inthe assessment of social welfare and income inequality. Failure to take accountof the relationship between nominal and equivalised income can give a biasedpicture of both inequality and social welfare”.
In general, equivalence scales have been used to allow the construction of so-cietal measures of welfare and inequality based on comparable household mea-surements of income or expenditure (Fisher, 1987; Muellbauer, 1974). Thesescales intend to reflect the amount of income required for households of differ-ent sizes and compositions to have the same welfare level (Pollak and Wales,1979; Nelson, 1993). An important emerging fact from this literature is thatthere is no universally correct equivalence scale. Different procedures are justi-fied according to different circumstances.
One particular branch of this literature has focused on providing a measure-ment approach to characterize the household income via a set of parameterswhich describe the responsiveness of the income with respect to the size of house-hold needs. Measures developed under this perspective are known as parametricequivalence scales and are based on the selection of parametric values to typifythis relationship in terms of the size and composition of the household. Exam-ples of these technologies can be found in Atkinson and Bourguignon (1987);Buhmann, Rainwater, Schmaus, and Smeeding (1988); Coulter et al. (1992a),and Cowell and Mercader-Prats (1999). A general approach of this type of equiv-alence scale is analysed by Buhmann et al. (1988) and Coulter et al. (1992a), inwhich they express the yh-household adjusted income as a function of the xh-observed household income, the qh-size of the household and a θ-scale relativityparameter. There, the household adjusted income is defined by
yh =xh
(qh)θ. (1)
In this approach, needs are expressed in terms of the size of the household,and the θ-scale relativity parameter varies from no adjustment of the householdincome by needs (θ = 0) to a complete adjustment portrayed by the per capitahousehold income (θ = 1).
The proposed methodology of this paper draws from this one-dimensionalparametric equivalence scale literature. Similarly to the equivalence scale of(1), the family of measures of this paper uses a scale relativity parameter θ toemphasise needs. The proposed methodology of multidimensional deprivationmeasurement of this paper aims to describe how much deprivation demographi-cally heterogeneous units must exhibit to be catalogued as equivalently deprived.It enhances multidimensional deprivation comparisons across either householdsof different sizes and compositions or individuals from different demographicpopulation subgroups and allows societal multidimensional indices based onmore comparable profiles than those available in the applied multidimensionalmeasurement literature.
5

2.2 Multidimensional deprivation measurementSeveral conceptual approaches exist to measure welfare, and each chooses itsspecific focus: resources (income or others), basic needs, Sen’s functionings orcapabilities (Sen, 1993), rights, happiness and so on. As such, the conceptualfocus of any index and the selection of dimensions and indicators correspondto a normative selection to be taken for each specific context. The family ofmultidimensional measures of this paper is proposed to be applied by any ofthese different conceptual approaches.
Within the multidimensional literature, two alternative procedures identifythe poor population and aggregating dimensions: the ‘welfare approach’ andthe ‘counting approach’. The former approach combines several dimensionsinto a single variable and sets a threshold to differentiate between poor andnon-poor populations. The welfare approach has been studied by Bourguignonand Chakravarty (2003), Seth (2009), and Seth (2010), among others.
By contrast, the counting approach—as its name indicates—counts the num-ber of dimensions in which persons suffers deprivation, and the identification ofthe poor person relies on defining how many dimensions must be deprived forsomeone to be categorized as multidimensionally deprived. Examples of thesetypes of measures and analyses are proposed by Townsend (1979), Atkinsonand Bourguignon (1982), Mack et al. (1985), Callan et al. (1993), Feres andMancero (2001), Atkinson (2002), Aaberge and Brandolini (2014a), and Alkireand Foster (2011). Efforts have been made within the literature to analyse bothapproaches under a common framework (for a such study see Atkinson (2003)).However, as pointed out by Aaberge and Brandolini (2014b), this discussion isstill inconclusive.
The family of measures proposed in this paper stands, specifically, withinthe counting multidimensional deprivation literature and extends the Alkire andFoster (2011)’s methodology. For brevity, we henceforth refer to the multidi-mensional poverty measurement method proposed by Alkire and Foster (2011)using the abbreviation ‘AF’ or ‘AF methodology’.
3 Formal settingThis section presents the formal setting that frames the proposed family ofmultidimensional deprivation indices of this article. This setting contains themost commonly used measures of the AF methodology along the measures thatwe propose as extensions of this methodology. The section first describes the AFmultidimensional deprivation measurement methodology while using a slightlymodified notation; and subsequently, presents the proposed extension of thispaper for such methodology.
3.1 The AF methodologyConsider a population consisting of I ≥ 1 individuals evaluated across J ≥ 2indicators. The AF method begins by defining an I × J matrix A = [aij ],
6

where each row corresponds to an individual and each column to an indicatorquantifying the individuals’ achievements such as education level, nutrition,health status, et.c. Obviously, greater values of an achievement indicator referto better-off conditions, and lower values of it refer to worse-off conditions.
Each column of A is either a cardinal or an ordinal achievement indicator3.More precisely, the cell aij of the matrix A quantifies the the j achievement ofi individual. The domain of the A matrix is the non-negative orthant of theJ-dimensional Euclidean space. The AF methodology defines the i individual asdeprived in the j indicator by placing a threshold zj > 0 for each j = 1, . . . , J .As such, the z-vector of non-negative thresholds z = (z1, . . . , zJ) is defined andthe i individual is said to be j-deprived if and only if aij < zj .
The breadth of the suffered deprivation gαij is given by:
gαij =
(zj − aijzj
)αif aij < zj
0 otherwise,
(2)
where α ≥ 0 is the poverty aversion parameter. The α parameter, first intro-duced in the poverty measurement literature by Foster, Greer, and Thorbecke(1984) and used by Alkire and Foster (2011), assigns greater emphasis to themost deprived or lowest achieving individuals. The greater the value of α, thelarger the accentuation of gαij on the most deprived.
However, if the achievement variable is ordinal, the gαij expression is validonly for α = 0, and g0ij takes the value of either 1 or 0, indicating the presenceor absence of deprivation. Hence, as discussed by Alkire and Foster (2011), thebreadth of the suffered deprivation with α > 0 can be defined only for cardinalindicators. Given that most of the public policy indicators in current use areordinal, we restrict gαij strictly to the case of α = 0; and henceforth is denotedas gij .
The AF methodology continues then by aggregating deprivations across di-mensions for each i individual with a ci metric:
ci =
J∑j=1
gij . (3)
3A cardinal indicator is such that any of its values measures the size of the achievement.This means that the comparison between any two given observed points of a cardinal indicatorcan be commensurate with the difference between their respective sizes. For example, yearsof education is a cardinal achievement indicator because having two years of education istwice the number of one year of education. In contrast, an ordinal indicator does not allowmeasuring the size of the achievement, but rather only indicates a particular ordering betweensituations. An example of an ordinal achievement indicator is the self-assessment of healthstatus, which takes the categories of “very poor”, “poor”, “good”, and “very good”. Note thatin this case, we are unable to evaluate the ‘size’ of the situation. For instance, if we comparetwo observations, one person having very good health and another person having very poorhealth, we do not observe the size of the difference between the two situations. In this lattercase, we only know that the first person has better off self-assessed health status than thesecond one, but we do not know the magnitude of the difference in self-assessed health statusbetween the two persons.
7

Subsequently, a threshold k to identify the multidimensionally deprived is placedover this ci metric. As a result, any i individual satisfying ci ≥ k is identifiedas multidimensionally deprived. Then, each gij is censored to zero in case the iindividual is identified as not multidimensionally deprived. Therefore, gij(k) = 0for any i individual that satisfies ci < k.
In order to obtain societal metrics, the simplest measure that AF proposesis the H-multidimensional deprivation incidence. This first metric correspondsto the proportion of people identified as multidimensionally deprived using thek-threshold. The second most important societal metric that AF proposes andthat is currently in use by most of the applications of the method is the M0-adjusted headcount ratio. AF defines the adjusted headcount ratio as M0 =µ(gij(k)), where µ(gij(k)) corresponds to the average gij(k) for i = 1, 2, . . . , Iand j = 1, 2, . . . , J , i.e.
µ(gij(k)) =1
I · J
I∑i=1
J∑j=1
gij(k).
However, when measuring deprivation, demographic heterogeneity plays acentral role in the definition of what can be considered a lack of a minimumachievement. Children, for instance, can be considered deprived when they arenot accessing basic education services, unlike adults, who can be considered de-prived in the same education dimension when they do not know how to readand write. As another example, while adult populations that do not have accessto job opportunities despite seeking those can be defined as deprived in employ-ment, children cannot be defined as deprived in the absence of employment.Then, when it comes to measuring multidimensional deprivation, differences inneeds reflected by the different populations where each indicator is applicableto be measured, bring comparability challenges to measuring how many dimen-sions in deprivation a particular individual or household might exhibit to becatalogued as multidimensionally deprived.
Note that the theoretically developed AF methodology does not address thecomparability problems that differences in needs might bring to multidimen-sional deprivation measurement. It evaluates each i individual of the popu-lation across the all J achievements. Therefore, it implictly assumes that allindividuals of the population as exhibiting the same set of needs.
The applied multidimensional deprivation literature have addressed thesedifferences in needs by restricting individual-based measures of multidimensionaldeprivation to the analysis of demographically homogeneous individuals. Ex-amples of this approach are studies that focus on measuring multidimensionaldeprivation among either children or adult populations such as Roelen et al.(2010), Roche (2013), Trani and Cannings (2013), Trani et al. (2013), Qi andWu (2014), Oshio and Kan (2014) and Solaymani and Kari (2014).
In terms of household-based indices, no family of measures have been for-mally developed using such unit of analysis. Still, influential policy applica-tions as the global MPI launched by the United Nations Development Program
8
(Alkire et al., 2013) and the Colombian Multidimensional Poverty Index (An-gulo et al., 2015), or studies such as Alkire and Seth (2015), Alkire and Santos(2014), Ayuya et al. (2015), Bader et al. (2015), Cavapozzi et al. (2013), Mitra(2014), Alkire et al. (2015), and Yu (2013), they all use household as the unit ofanalysis and identify as most deprived those that exhibit the largest number ofdimensions in deprivation disregarding their size and composition. They there-fore either assume the same set of needs across households or do not considerthe fact that demographically dissimilar households have significantly differentneeds.
The proposed method of this paper enables the measurement of multidimen-sional deprivation across demographically heterogeneous units (i.e., householdsof different sizes and compositions or individuals from different demographicpopulation subgroups) while taking into account observable differences in need.Subsection 3.2 below describes the proposed methodology.
3.2 The proposed family of multidimensional deprivationindices
The proposed methodology of this paper begins by defining for each j achieve-ment the sub-population group for which it is relevant to be measured. Wecall this the applicable population subgroup for achievement j, and we will mea-sure the presence or absence of the j deprivation only within this set of sampleunits. This feature of our methodology captures individual differences in needs,corresponding to the traditional approach in the policy context to tracking in-dicators.4 With this feature, we bridge the gap between theoretically developedmultidimensional indices and policy-oriented single indicators design.
This feature is formalized with an I×J matrix of applicable population sub-groups that we call S. There are as many as J applicable population subgroups,and any two applicable population subgroups are not necessarily mutually ex-clusive. The cell sij of the matrix S is an indicator variable that takes thevalue of 1 if and only if the i individual belongs to the applicable populationsubgroup of the j achievement, and 0 otherwise. For instance, according to theMillennium Development Goals, access to primary education is relevant to bemeasured among school-age children; thus, cell sij takes a value of 1 wheneverthe i-individual is aged 6 to 15 years old and 0 otherwise.
Any observed j achievement for the i person that does not belong to theapplicable population of such achievement is, therefore, defined as unimportantfor the measurement process. Thus, the gij individual dimensional deprivation
4A long-standing tradition of policy indicators evaluates deprivation for each particularachievement over a specific sub-population of interest. For instance, one of the MillenniumDevelopment Goals (MDG) launched by the United Nations Development Programme andadopted by several countries to be achieved by 2015 is universal primary education. An-other MDG is universal access to reproductive health. Both access to primary education andaccess to reproductive health services are relevant for measurement only among their partic-ular applicable populations, which are children 6 to 15 years of age and pregnant women,respectively.
9

indicator evaluated on its applicable population is denoted by gij(sj) and givenby:
gij(sj) =
{1 if aij < zj and sij = 1
0 otherwise,(4)
where sj denotes the applicable population of the j achievement. Then, wedefine the I × J matrix G = [gij(sj)], where each row of G corresponds toan individual and each column to a binary indicator of presence or absence ofdeprivation for the i-individual in the j-indicator. As such, G is a binary matrix.
We continue describing the proposed method to commensurate the burdenthat multidimensional deprivation places on the household, whenever householdis selected as the unit of analysis. Later in this manuscript—as an extension ofhousehold-based measures—the individual-based method is presented.
Household-based metrics
Assume that each i individual belongs to a particular h household, and eachhousehold contains qh household members. The dβhj-dimensional deprivationindicator for the h household and the j dimension is defined as:
dβhj =
( qh∑i=1
gij(sj)
)βif
qh∑i=1
gij(sj) > 0
0 otherwise,
(5)
where β ∈ {0, 1} is the parameter of aversion to deprivation. Whenever β = 0,then household dimensional deprivation is expressed by a {0, 1} indicator ofabsence or presence of at least one j deprived household-member. On the otherhand, if β = 1, then the dimensional deprivation is expressed by the count ofdeprived household members in the j dimension.
The β parameter of aversion to deprivation is analogous to the α parame-ter of poverty aversion introduced by Foster et al. (1984) and used by Alkireand Foster (2011) to assign increasing value to the most deprived dimensions.Similarly to the α parameter of AF method, whenever β = 0, dimensional de-privation is expressed as an indicator of presence or absence of deprivation inthe j dimension. However, while in the AF method α > 0 can be used only incase that the j dimension is captured by a cardinal achievement indicator, forβ = 1 commensurates the household deprivation breadth in the j dimension,without necessarily enforcing the use of cardinal achievement indicators and interms of the number of j deprived household-members.
Due to the ordinal nature of most of policy indicators, current household-based applications of AF method have been restricted to measure the burdenthat dimensional deprivation places on the household by indicating the presenceor absence of at least one household member under deprivation in this dimen-sion. This particular approach corresponds to using d0hj to express dimensionaldeprivation, which is setting β = 0.
10
The use of β = 0, however, does not allow household metrics to be sensitive toincrements in the number of deprived persons in an already deprived dimension.For instance, when evaluating access to primary education, a household with twoschool-aged children, one child attending school and the other not attending,registers d0hj = 1. Now, if this same household, as a result of a deprivationincrement, increases its number of children who are not attending school totwo, its d0hj indicator remains invariant.
In contrast, our proposed methodology enables expressing household dimen-sional deprivation with β = 1, which produces a measure of dimensional de-privation that is sensitive to increments in the number of deprived persons inalready deprived dimensions. For instance, in the example of the previous para-graph, if we evaluate school attendance in the household with one deprivedschool-age child, then d1hj = 1. But if the household has two children deprivedof school attendance, then d1hj = 2: a value that is twice as large that of theinitial case. We further discuss and illustrate this advantage of the proposedmethod in Section 5.
Of course, not every household has the same set of dimensional needs. Infact, the number of j applicable household members generally varies acrosshouseholds. To account for this, we define nβhj to be the size of the h householdneeds on the j dimension:
nβhj =
( qh∑i=1
sij
)βif
qh∑i=1
sij > 0
0 otherwise,
(6)
where n0hj measures the size of household j dimensional needs through an indi-cator of whether or not the household has need in the j dimension (i.e., has atleast one household member that could suffer deprivation in such dimension). Incontrast, the n1hj size of needs informs the number of household members thatexhibit need in the j dimension. For instance, in our same example of schoolattendance, since the h household has two school-age children, then we knowthat n0hj = 1 and n1hj = 2.
The second stage of the proposed methodology of this paper consists of mea-suring the burden that multidimensional deprivation places on the household viaa functional form that enables capturing either count-based, shared-based or amixture of these two approaches to measurement. In this vein, following Cowelland Mercader-Prats (1999) and Buhmann et al. (1988), and using the equiva-lence scale presented in equation (1), we express the burden of multidimensionaldeprivation as:
mβ,θh =
∑Jj=1 d
βhj(∑J
j=1 nβhj
)θ if
J∑j=1
nβhj > 0
0 otherwise,
(7)
11

where θ ∈ [0, 1] is a deprivation response scale parameter that reflects the rel-ativity of the response of the burden of deprivation to the scale of householdneeds. In the case that θ = 0, we are in the presence of a count-based approach,and no discounting in needs is applied at all. Thus, the household is assumedas not receiving any advantage from the cooperative unit, and therefore theburden that deprivation places on the household is not lightened to any degreefrom the scale of the needs.
On the other hand, when θ = 1, we are using a share-based approach.While the count-based structure places greater emphasis on larger householdswithout accounting for any possible scale economy that might arise at this level,the share-based approach places greater emphasis on small households becausethey are more prone to registering the maximum possible burden of deprivation.Values of θ different than 0 or 1, aim to describe mβ,θ through an intermediateapproach that lie in between of count-based and share-based perspectives.
Current household-based indices that use the AF method measure the bur-den of multidimensional deprivation through them0,0 metric, which correspondsto counting the number of dimensions in deprivation. However, the m0,0 metricdoes not discount by household needs at all and thus, does not differentiatethe deprivation burden of non-deprived and non-applicable dimensions. Thisinduces the observation of a systematically lower burden of multidimensionaldeprivation across small and demographically homogeneous households, as weshall see in Section 4.
In contrast, our proposed mβ,θh family of measures allows not only a count-
based approach to measurement, which corresponds to setting θ = 0; but alsotakes into account heterogeneous household needs within and across dimensionsthrough using any 0 < θ ≤ 1. In fact, whenever θ is set in such interval, the bur-den of household multidimensional deprivation is discounted by the householdneeds and takes into account the scale advantages that the household receivesto lighten the burden that deprivation places on it.
The four most intuitive measures of the burden that multidimensional de-privation places on the household are those which set θ ∈ [0, 1] and β ∈ {0, 1}.They are termed as follows:
• The dimensions count-based approach to measurement: m0,0
• The dimension share-based approach: m0,1
• The deprivations count-based approach: m1,0
• The deprivations share-based approach: m1,1.
Henceforth, these measures are referred interchangeably in terms of theirnames or their respective mβ,θ notations.
Identification of the multidimensionally deprived
For a given combination of β and θ, households exhibiting at least a k burden ofmultidimensional deprivation are identified as the multidimensionally deprived.
12

Parameter k represents the multidimensional deprivation threshold above ofwhich the most deprived household are observed. The k threshold takes valuesbetween zero and the maximum possible observable mβ,θ
h . The plausible k needsto be defined according to the context of each application.
In conjunction with the use of the k threshold, a ph-binary indicator ofpresence or absence of multidimensional deprivation, naturally arises as follows:
ph =
{1 if mβ,θ
h ≥ k0 otherwise.
(8)
While applications of the AF method sort households under the basis ofm0,0 and households satisfyingm0,0
h ≥ k are identified as the multidimensionallydeprived, the proposed methodology of this paper enables the identification ofthe most deprived to be done under the basis of any mβ,θ. The implications onmultidimensional deprivation incidence profiles of using different mβ,θ measuresto identify the multidimensionally deprived are investigated and discussed inSection 4. We continue presenting the proposed methodology for aggregatinghousehold multidimensional deprivation at the society level.
The family of societal measures
Let R denoting the total number of households. Then, the simplest metric torepresent the overall society multidimensional deprivation incidence is:
H(mβ,θ) = µ(ph), (9)
where µ(ph) corresponds to the average value of ph for h = 1, . . . , R. Through-out this paper, H(mβ,θ) corresponds to the proportion of multidimensionallydeprived population identified on the basis of a particular mβ,θ
h metric. Notethat the Alkire and FosterH-headcount ratio corresponds here to the case wherem0,0h is used to identify the most deprived population, which is H(m0,0).Now, to construct societal metrics of the average burden that multidimen-
sional deprivation places across households, we censor to zero any mβ,θh for non-
multidimensionally deprived household, namely, mβ,θh = 0 for all h such that
ph = 0. Then, the household burden of multidimensional deprivation after theidentification of the multidimensionally deprived is denoted as mβ,θ(k) and thesocietal mean burden of multidimensional deprivation is defined as:
MDβ,θ = µ(mβ,θ(k)), (10)
where µ(mβ,θ(k)) corresponds to the average value ofmβ,θ(k) for k = 1, 2, . . . , R.In comparison to the Mα family of measures of the AF method, our MD0,0
metric corresponds to theM0 metric of the Alkire and Foster (2011) method. Assuch, the proposedMDβ,θ family of measures constitutes a broader set of metricsthat takes into account count-based, share-based and intermediate approaches tomeasure the burden that multidimensional deprivation places on the household.
13
In general, given the ordinal nature of policy indicators, most current ap-plications on the Alkire and Foster (2011) method are able to describe societalmultidimensional deprivation through H(m0,0) and MD0,0. Our proposed ap-proach, in contrast, allows describing multidimensional deprivation in terms ofany H(mβ,θ) and MDβ,θ with β ∈ {0, 1} and θ ∈ [0, 1].
Weights
For completeness purposes and to guide applications where indicators have dif-ferent relative importance across each-other, this section introduces and de-scribes a weighting system to differentiate these relative importances.
Consider thew = (w1, w2, . . . , wJ) vector of non-negative importance weights,where wj ≥ 0 denotes the relative importance weight for the j achievement inthe overall deprivation evaluation, and satisfies
∑Jj=1 wj = 1. This weighting
system can be used to aggregate deprivations across the J dimensions and obtainthe burden of multidimensional deprivation as:
mβ,θh
=
∑Jj=1 wjd
βhj(∑J
j=1 wjnβhj
)θ if
J∑j=1
wjnβhj > 0
0 otherwise.
(11)
This mβ,θh
burden of multidimensional deprivation represents the w scaled vari-ant of equation (7). The application of the w dimensional weights produces,subsequently, societal measures H andMDβ,θ to be updated using this w scaledvariant of mβ,θ
h .The selection of these dimensional weights can be devised according to the
purpose of the measure and by different alternative procedures such as normativeselection or data-driven techniques. For a study of alternatives to setting weightsin a multidimensional index, see Decancq and Lugo (2013).
The individual-based method
The methodology introduced here is proposed to enable individual-based mul-tidimensional deprivation measurement in presence of different needs acrossdemographically heterogeneous population subgroups. In the context of thispaper, this approach is named as the individual-based method, as it is derivedas a special case of the previously described household-based measures. In thisproposed individual-based method each household in the society is assumed asconsisting of one member, which simply implies each person is in its own house-hold. The afore-presented household-based measures are consequently derived.Hence, both the dimensional deprivation indicator and the burden of multidi-mensional deprivation are obtained without aggregating at the household level.
We remark that the dβhj-dimensional deprivation indicator for the h house-hold in the j dimension was developed as an aggregation of the household mem-bers’ gij(sj) individual deprivation indicators to the power of β (see (5)). How-
14

ever, this aggregation and the β parameter have no relevance in an individual-based method because in this case the resulting measure is always a binaryvariable of presence or absence of deprivation. Consequently, the mβ,θ
h -burdenof multidimensional deprivation for the h household, becomes also non-sensitiveto different values of β and expressed independently for each i individual. Wedenote this variant of (7) as mθ
i .Still, the use of the θ parameter in the individual-based method expresses
the responsiveness of deprivation to the size of the individual’s needs. Similarlyto the household-based case, in the individual-based method, the use of the θparameter allows expression of the multidimensional deprivation burden thatthe i individual suffers, either as a count of dimensions on deprivation, or as aproportion of dimensions of deprivations or as a mixture of these two types ofmeasures.
The use of this individual-based method naturally produces an identifica-tion of the most deprived individuals with any mθ
i measure and defining asmultidimensionally deprived those satisfying mθ
i ≥ k. The societal measuresH and MD, are therefore, developed using the individual-based variants of themeasures.
We point out that the individual-based proposed approach when settingθ = 0 corresponds to the individual-based AF methodology. In this case theproportion of multidimensionally deprived individuals is expressed by H(m0
i )and the MD0 metric results equivalent to the AF metric M0.
We now proceed to evaluate the implications of using different possible mea-sures to identify the multidimensionally deprived population.
4 Whom are identified as multidimensionally de-prived across measures?
In this section, we evaluate empirically the effects on multidimensional depriva-tion profiles of using the AF’s dimensions count-based approach to measurementand compare it with those obtained using other members of the family of mea-sures that we propose in this paper. The analysis is carried out making use ofthe data that is presented in the next section.
4.1 DataFor the empirical analysis in this paper, a multidimensional deprivation index isbuilt using the 2013 Paraguayan Household Survey (PHS). The PHS is a cross-sectional living conditions survey that has been collected yearly since 1984 bythe Paraguayan National Statistical Department. Referred to as the EncuestaPermanente de Hogares. It uses a two-stage, clustered probabilistic sampledesign that was stratified in the first stage by 31 geographical domains.5
5The strata corresponded to rural and urban areas of 15 out of the total 17 Paraguayancounties (departamentos) and the national capital of Asunción.
15

The PHS 2013 captures a broad range of living condition indicators. Itprovides national estimates for income poverty, inequality, and some key qualityof life descriptors. The questionnaire of the PHS 2013 includes informationregarding education, health, the labour market, individual income, dwellingconditions, and international migration and a special module for agricultureand forestry activities.
Table 1 describes the items included within the multidimensional index of de-privation constructed for the analysis purposes of this paper. In particular, thisindex example captures information on access to health services, education, anddwelling conditions, across five deprivation indicators: health insurance non-
Table 1: Example of multidimensional indicator: Dimensions, indicators,weights, applicable population subgroups and deprivation criteria
DimensionDeprivationindicator
Applicable populationsubgroups where theindicator is relevantto be measured
A person from theapplicable population
is deprived if:
Access tohealthservices
Health insurancenon-coverage Any person Is not covered by any
health insurance.
Non-access tohealth serviceswhen needed
Any person thatwas sick or hadan accidentduring the 90days previous tothe interview
Did not receiveinstitutional care*.
Education
Non-schoolattendance
5 - 17 years oldpopulation Is not attending school.
Low educationalachievement
Population 18years old and over
Has less than 9 years ofcompleted education.
Dwellingconditions
Sub-standardhousing Any person
Lacks at least 2 of thefollowing 3 dwellingconditions: flooringdifferent from earth orsand; adequate materialof ceilings**; andadequate material ofwalls***.
Notes: *Institutional care corresponds to attention received by a professional health worker(physicist, nurse, dentist or professional midwife) in private or public health institution (It is nota health care institution: pharmacy, empirical medicine man store, own house, other’s house).**Inadequate ceiling material refers to the following: Straw, eternit, clapboard, palm trunk,cardboard, rubber, packaging timber, other. ***Inadequate wall materials refer to the following:wattle, mud, wood, palm trunk, cardboard, rubber, wood, another material, or no wall at all.
16

coverage, non-access to health services, non-school attendance, low educationalachievement, and substandard housing. The substandard housing indicator wasincluded in this Paraguayan index to illustrate how a deprivation indicator in-variant across household members may be incorporated into an index that usesthe proposed methodology of this paper. As such, the applicable population ofthe substandard housing indicator corresponds to any household member andeach individual is defined as deprived whenever the housing lacks from at least2 of the 3 considered dwelling conditions (flooring different from earth or sand,adequate material of ceilings, and adequate material of walls).
In 2013, the PHS was collected from a sample of 21,207 persons across 5,424households. Of the 21,207 interviewed individuals for PHS 2013, 264 observa-tions were excluded from the analysis because they correspond to individualsthat do not belong to the household unit (i.e., domestic personnel), and 34 ob-servations were also excluded because of non-response in at least one of the fiveconsidered indicators. Thus, the effective sample comprises 20,909 interviewedpersons across 5,423 households.
4.2 Observed multidimensional deprivation incidence pro-files
Table 2 presents the proportion of households with at least one deprived house-hold member in each of the five considered indicators by household size. Thiscorresponds to the mean d0hj-dimensional deprivation indicator across the 5,423observed Paraguayan households. Reading the table by lines, it can be seen thatlarger households exhibit a larger proportion of dimensional deprivation thansmaller households. The dimensions more prone to this behaviour are healthinsurance non-coverage, non-access to health services, non-school attendance,and low educational achievement. A positive relation between household sizeand dimensional deprivation is observed because the number of persons in theapplicable population increases as the household size increases. Take for ex-ample the non-school attendance indicator in Table 2, which is applicable forchildren 5 to 17 years of age. One-person households are rarely composed ofthis population subgroup because school-age children cannot form a household.Therefore, the proportion of households consisting of one person that are dimen-sionally deprived in school attendance is 0%. Conversely, 21.4% of householdsconsisting of seven or more persons are deprived of school attendance becausethey contain on average four children.
If, subsequently, the dimensions exhibiting deprivation are counted and themultidimensionally deprived households are those with the largest count of thesedimensions on deprivation, larger and more heterogeneous households tend tobe identified as the most deprived. The following paragraphs elaborate furtheron this.
With the purpose of comparing the multidimensionally deprived populationof households identified using different mβ,θ measures, households are sortedon the basis of each mβ,θ score and the first 40% most deprived (2,168 house-holds) are identified as multidimensionally deprived. The population of house-
17

Table 2: Proportion of households with at least one deprived person from theapplicable population (%)
Persons per householdTotal
1 2 3 4 5 6 7or more
(1) Health insurancenon-coverage 70.3 75.2 79.9 81.0 84.3 91.4 93.8 81.3
(2) No access tohealth services 12.5 17.7 15.1 19.7 20.1 23.6 29.6 19.0
(3) Non-schoolattendance 0.0 1.9 2.9 4.4 5.8 9.7 21.4 5.5
(4) Low educationalachievement 61.4 64.8 57.8 65.4 68.6 78.3 88.3 67.0
(5) Sub-standardhousing 25.5 25.0 18.5 19.9 23.5 24.9 34.2 23.3
Sample number
Number ofhouseholds 593 836 1,135 1,108 771 466 514 5,423
% of individuals 2.8 8.0 16.3 21.2 18.4 13.4 19.9 100Source: author’s calculations based on 2013 PHS.
holds identified as the most deprived using the dimensions count-based approach(m0,0) is compared with regard to those obtained using the other three mβ,θ
most representative of the proposed methodology: the dimension share-basedapproach (m0,1), the deprivations count-based approach (m1,0), and the depri-vations share-based approach (m1,1).
Note that identifying a fixed share of the population (40% in this case) as themost deprived is different from placing a particular k multidimensional thresh-old over the mβ,θ score. Given that the range of variability of mβ,θ varies alongthe β and θ parameters, the use of a fixed share of households enables us tocompare the different deprived populations on an equal basis. The particular40% share of households arose as a plausible natural breaking point in the distri-bution of deprivations observed by the multidimensional index in the analysis.Nonetheless, in Section 4.5 we test the robustness of the obtained results underother different possible shares of the population.
Figure 1 plots the obtained H-multidimensional deprivation incidence byhousehold size for the four mβ,θ. In the figure, the vertical axis correspondsto the proportion of households of each size identified as multidimensionallydeprived. For example out of the total observed 514 households consisting ofseven or more persons, about 80% of them are identified as multidimension-ally deprived when a deprivations count-based approach (m1,0) is used to sort
18

households.As expected, the results indicate that the H-multidimensional deprivation
incidence varies across household size and measures. No adjustment by differ-ences in needs corresponds to measures that use θ = 0. The profiles obtainedupon these bases show the greatest proportion of multidimensionally deprivedamong large households, as well as the lowest proportion among small house-holds. In particular, when using the AF-proposed m0,0, households consistingof seven or more persons register 29.2 percentage points (p.p.) larger multidi-mensional deprivation incidence than households consisting of one person.
Any θ > 0 enables the burden of household multidimensional deprivation tobe adjusted by household needs, increasing the amount of the adjustment as θincreases. Then, contrary to count-based approaches, a deprivations share-basedapproach (triangle markers in the figure –m1,1–) produces 57.8% of householdsconsisting of one person being catalogued as multidimensionally deprived and43.6% of households consisting of seven or more persons being catalogued asmultidimensionally deprived. Thus, in this case, a 14.2 p.p. higher incidence ofmultidimensional deprivation is observed among smaller households than across
Figure 1: Proportion of multidimensionally deprived households, H(mβ,θ),across household size
Source: author’s calculations based on 2013 PHS.
19
larger households.These descriptive statistics suggest that identifying the most deprived on
the basis of a household burden of multidimensional deprivation not adjustedby household needs results in greater H-deprivation incidence among largerhouseholds. Multidimensional deprivation incidence among larger householdsreduces as adjustment by the size of the needs increases. The use of differentmβ,θ measures to sort households produces different profiles of multidimensionaldeprivation incidence, and these results are driven by the size of the householdneeds.
What should we make of these differences? On one hand—as particular stud-ies from the one-dimensional equivalence scale literature suggest—one couldargue that there is no correct or incorrect equivalence scale and that differ-ent measures are justified according to different circumstances (Cowell andMercader-Prats, 1999, pg.409). In this vein, the selection of the measure todescribe household multidimensional deprivation constitutes a context-specificnormative definition. While count-based approaches (θ = 0) give either to eachdimension (using β = 0) or to each deprivation (β = 1) an equal absolute valuein the measurement of the burden of multidimensional deprivation, deprivationshare-based approaches (θ = 1) give an equal absolute value to each household,disregarding its demographic composition and taking into account the scaleeconomies that arise at this level.
An intermediate normative perspective corresponds to setting the θ param-eter between these two solutions. The value of θ reflects the responsiveness ofthe burden of deprivation to the scale of needs; values of θ close to zero conveya lower response of the burden of multidimensional deprivation to the size ofthe needs. Conversely, values of θ close to one convey a greater response of theburden of deprivation to the size of the needs.
On the other hand, researchers can consider—as we do in this paper—differences in need as a ‘legitimate’ source of variation in the observed mul-tidimensional deprivation profiles that should be tackled by the measurementprocess. Following the framework set up by Fleurbaey (2007) in social choice onequity, responsibility, and fairness, and in particular the proposed approach ofFleurbaey and Schokkaert (2009) to analyse fair and unfair health and health-care inequalities, differences in achievement levels (such as health or educationalattainment) are considered as caused by myriad factors, some of which can becatalogued as producing fair/legitimate differences and others as producing un-fair/illegitimate differences. In particular, for the case of health and healthcareinequalities, Fleurbaey and Schokkaert (2009) defined as legitimate or fair thosedifferences attributed to causes that fall under individuals’ responsibility. Le-gitimate differences in this context correspond, therefore, to those derived frompreferences.
In light of this framework, one can argue differences in multidimensional de-privation measurements should not arise from legitimate causes and we shouldtherefore in our methodologies account for the differences that needs bring, aswell as for any of other legitimate causes, such as differences in preferences.In this paper, for the sake of simplicity and as a first effort in the literature
20
to account for differences in needs, we focus on accounting strictly for them.The effect that other sources of fair/legitimate differences, such as preferences,could have over multidimensional deprivation incidence profiles is left for fur-ther research. Analysis of the relation between multidimensional poverty andpreferences can be found in Decancq, Fleurbaey, and Maniquet (2014).
Therefore, we evaluate how effectively each of the mβ,θ measures accountsfor differences in needs. The methodology for approaching such evaluation andthe results are presented in the following sections.
4.3 MethodTo determine the ability of any multidimensional deprivation measure to ac-count for differences in needs, we contemplate direct and indirect standardiza-tion techniques. As proposed by Fleurbaey and Schokkaert (2009), we considerboth standardization techniques in light of their embedded ethical conditionsand implications. As such, a desirability condition that resembles an indirectstandardization technique is set out here to be attained by a multidimensionaldeprivation incidence profile. Based on this condition, we determine how muchof the observed profile results from differences in needs and this regard its per-formance is evaluated. The next paragraph describes this condition.
Desirability condition. An unbiased multidimensional deprivation inci-dence profile is such that it is unable to distinguish between two populationgroups that have no systematic differences in deprivation between each otherbut only different sets of needs. As such, any two households in a household-based scenario or any two individuals in an individual-based scenario with nosystematic difference in deprivation between the two of them must be classifiedequivalently as either multidimensionally deprived or non-multidimensionallydeprived, regardless of the size of their needs.
Multidimensional deprivation incidence profiles that are unable to equiva-lently classify (as multidimensionally deprived or non-multidimensionally de-prived) two households with differences in mβ,θ, strictly caused by differencesin needs, are said to provide a biased picture of societal multidimensional de-privation incidence.
If we can confirm that a particular mβ,θ measure is able to provide an equiv-alent measurement for any two households with no systematic differences indeprivation but only differences in needs, we also know that a multidimensionalprofile based on such an mβ,θ measure portrays differences in incidence that arenot driven by differences in needs.6
6Another possible course of action could be using an alternative condition. This alternativecondition can be set out in light of a direct standardization procedure. It would define asunbiased multidimensional deprivation incidence profile such that is unable to distinguishtwo population groups with no systematic differences in needs. However, as Fleurbaey andSchokkaert (2009) discussed, if this alternative condition is satisfied, it is possible that nodifference in multidimensional deprivation incidence between two population groups will beobserved because they have identical size of needs. This, despite these two populations stillmight have significant differences in deprivation. If such condition is attained the measurewould depict these differently deprived populations under an equivalent multidimensional
21

Now, given that differences in deprivation originating strictly from differ-ences in needs, cannot be straightforwardly differentiated from factual observedmultidimensional deprivation incidence profiles because we do not know fromthe observed profile how much of the observed differences are due to differencesin needs and how much of them are due to the measurement approach. Weuse a static microsimulation technique to generate a counterfactual deprivationprofile in which the observed differences are strictly due to differences in needs.In such counterfactual scenario, no systematic difference in deprivation existsbut only differences in needs.
Then, the evaluation of of our mβ,θ measures is approached as a ‘controlledexperiment’ (a term used by Figari, Paulus, and Sutherland (2014) to describemicrosimulation techniques) with the data to determine the ability of each mea-sure to observe such counterfactual state of things and therefore to portrait anunbiased incidence profile.
The counterfactual scenario of no systematic difference in deprivation is cre-ated, in use of the 2013 Paraguayan Household Survey, by setting as invariantthe characteristics of the household that describe differences in need and dis-tributing deprivation completely at random across individuals and households.In other words, we fix the characteristics of the sample members (includingwhether or not they are members of applicable population subgroups) and then,for each j-dimension, we randomly allocate whether or not they are in depri-vation. The random allocation is performed by sampling without replacementfrom the observed deprivation so that the total number of deprived people isthe same in the counterfactual and factual samples.
The random distribution of deprivation emulates no systematic differencebecause is not related to any individual or household characteristics and thus isnot a result of an underlying behaviour or characteristic. By building a (counter-factual) population in which there is no difference in deprivation resulting fromthese causes, we can determine whether a multidimensional incidence profilebased on a particular mβ,θ measure is able to make an unbiased comparison.
Any multidimensional deprivation incidence profile satisfying the desirabil-ity condition, must exhibit no relation between multidimensional deprivationincidence and the size of household needs in this counterfactual scenario. Thus,we approach the evaluation of each profile in the counterfactual state of no sys-tematic difference via a comparison of multidimensional deprivation incidenceand the size of households needs. For this purpose, we use the linear regressionph = ρ + δN0
h , where ph is the binary indicator of the presence or absence ofmultidimensional deprivation in the h-household, ρ is the intercept term, N0
h thecount number of dimensions that the h-household needs, and δ is the regressioncoefficient of interest. This δ regression coefficient captures the difference inph-multidimensional deprivation incidence that can be attributed to the size ofhousehold needs. A profile that satisfies the desirability condition must reflectno difference in multidimensional deprivation incidence given by households’
deprivation incidence. For the purposes of this paper, this situation is considered ethicallyundesirable, so we deliberately focus on evaluating our measures only in terms of the selecteddesirability condition.
22

different needs.7One could argue, nonetheless, that because of the randomness of the al-
location of deprivation, a particular population subgroup might have a largerincidence of deprivation than another, simply as a result of this randomness.To overcome these possible random differences among population subgroups,the counterfactual scenario with no illegitimate difference in deprivation amonghouseholds was simulated 1,000 times; each simulation or trial being indepen-dent from the other. The resulting collection of estimates approximates the dis-tribution of the index over the counterfactual scenario’s outcomes. The resultsthat we describe below correspond to the distribution of these 1,000 independentsimulations. For completeness and replicability purposes, Appendix A includesthe implemented pseudo-code for these simulations.
4.4 ResultsIn this section, we describe the obtained results from this evaluation. Figure 2on page 24 plots the summary of these results. The horizontal axis in the figurecorresponds to the range of θ parameters used to calculate the mβ,θ measure.The first value of this range corresponds to θ = 0 (no adjustment for the sizeof household needs), the adjustment by the size of household needs increasesas θ increases. The last value on the right-hand side of the horizontal axiscorresponds to θ = 1. The vertical axis in the figure represents the estimatedmagnitude of the δ regression coefficient in p.p.
One estimated δ regression coefficient is obtained in each of the 1,000 sim-ulations, and consequently, each δ coefficient measures the strength of the re-lationship between ph-multidimensional deprivation incidence and the N0
h-sizeof household needs in the counterfactual scenario of no systematic differencein deprivation. The 1,000 obtained δ coefficients describe the distribution ofthis relation in the (counterfactual) population in which there is no systematicdifference in deprivation.
The mean of the 1,000 obtained regression coefficients is used as the measureof central tendency of the behaviour of δ. In Figure 2, each marker representsthis central tendency measure of the δ regression coefficient obtained from usinga particular mβ,θ measure. The shaded zone around the markers represents therange of variability of 95% of these 1,000 obtained estimates of δ. Any measurethat properly accounts for differences in needs is, ideally, expected to have a
7Different approaches can nonetheless be used to measure the size of household needs, as forexample household size. Still, the N0
h-count number of dimensions that the h-household needsis our preferred measure of the size of household needs to be used for this evaluation becausewith such an approach the number of persons in the household and its composition is takeninto account with respect to the dimensions captured by the multidimensional index. For asimple example consider households A and B, both consisting of two persons each. HouseholdA, consisting of one adult person and one toddler. In the index example, this household maybe scored as deprived in four out of the five considered dimensions. In contrast, household B,consisting of one adult and a 10-year-old child, may be scored as deprived in all five considereddimensions. In this case, household size does not capture the difference in possible deprivationsthat these two households of the same size have.
23

distribution with a mean of zero and a narrow spread (such as 95% of thevalues within that narrow interval).
When using the AF dimensions count-based approach to measurement tosort and identify households (m0,0), we obtain across the 1,000 simulated sce-narios a mean of the δ regression coefficient of 17.8 p.p., with a range of vari-ability of 95% of its values between 16.3 and 19.4 p.p. This result indicatesthat comparing households on the basis of an m0,0 metric does not permit anunbiased incidence profile. The simulation results of using this metric show adistribution of estimates far above the desirable zero mean, and their values areconcentrated around this positive mean.
Similarly, the mean across the 1,000 simulations of the δ regression coefficientobtained when using the deprivations count-based approach to measurement(m1,0), results in 21.9 p.p., with 95% of its values between 20.7 and 23.2 p.p.
Figure 2: Simulation results: distribution of the obtained δ regressioncoefficient in p.p. when using mβ,θ to sort and identify the most deprived
households
Source: author’s calculations based on 2013 Paraguayan Household Survey (PHS). Notes: Esti-mated population means based on a sample of 5,423 households. Results obtained by simulating1,000 independent times a random allocation of deprivation across the observed households, keepingconstant the demographic configuration of the households and the societal amount of deprivation ineach indicator. Shaded areas denote 95% of the obtained δ estimates. The lower limit correspondsto the δ value at the 2.5 percentile and the upper limit to the δ value at the 97.5 percentile.
24

A positive δ regression coefficient observed across all 1,000 counterfactualscenarios when measuring the burden of multidimensional deprivation by anyof these two metrics (the dimensions count-based approach and the depriva-tions count-based approach) indicates that both of these metrics produce mul-tidimensional deprivation incidences ph to be correlated with the size of thehousehold needs. These results demonstrate that count-based measures causeany two households with different sizes of household needs to show differentmultidimensional deprivation incidence even if there is no systematic differencein deprivation between the two of them. Thus, these two metrics are shown tobe ineffective capturing a state in which there are no systematic differences indeprivation between households but only differences in need.
On the other hand, sorting households using share-based approaches to mea-surement, as the m0,1 or the m1,1 metrics do, results as well in biased multi-dimensional deprivation incidence profiles. The distribution of the obtained δregression coefficient in these two cases is concentrated below zero, the mean ofboth distributions have a value lower than -10 p.p and 95% of their values areconcentrated around this negative mean. A negative mean across the simula-tions of the δ regression coefficient indicates that the metric used to sort andidentify households does not effectively address differences in need. It producesa multidimensional deprivation incidence that decreases as the size of householdneeds increases.
For example, sorting households under the basis of the deprivations share-based approach to measurement (m1,1) produces a distribution of the 1,000obtained δ regression coefficients concentrated around 10.9 p.p. below zero, andthe distribution of 95% of the estimates varies between -12.6 and -9.1 p.p. Thismeans that, even when there is no systematic difference in deprivation betweenhouseholds, the use of an m1,1 measure produces an additional dimension thatthe household exhibits as need to reduce the ability of this household to beclassified as multidimensionally deprived by about 10.9 p.p.
Whereas count-based approaches cause a biased picture of household-basedmultidimensional deprivation profiles, larger and more heterogeneous house-holds are more likely to be identified as the most deprived. Share-based ap-proaches invert these results, also producing a biased picture of household-basedmultidimensional deprivation profiles. In the latter case, in contrast to count-based approaches, small and homogeneous households tend to be more likely tobe identified as the most deprived, but only about half as often as in count-basedapproaches.
Nonetheless, sorting households in these counterfactual states based on anymβ,θ measure that uses β = 1 and a value θ between 0.69 and 0.77 satisfiesthe desirability condition. Any of these metrics produces a distribution of theobtained 1,000 δ regression coefficients between ph(m
β,θh ) and N0
h with valuesvery close to zero and a narrow spread of the distribution around this value.These results suggest that, for the particular case of the 2013 Paraguayan indexexample, these metrics enable to classify equivalently as either multidimension-ally deprived or non-multidimensionally deprived households with no systematicdifference in deprivation but only differences in needs among them.
25

One could argue however that the proposed linear regression approach tocompare ph and the size of household needs in the counterfactual scenario mightbe mistaken because such an approach could reveal no relation between ph andthe size of household needs, but still there could be an underlying relationshipbetween them that is not necessarily linear. To analyse these possible alterna-tive situations, the most straightforward recommended evaluation is to buildindependent simulations of the counterfactual state as is done in this paper, butrather than using a linear regression to measure the relationship between ph andthe size of household needs, using dummy variables of different household sizesto regress them against the ph indicator obtained for the counterfactual sce-nario. The joint significance of the estimated relationship between the dummyvariables and ph can be tested as equal between each other and to zero. This isrepeated for each independently simulated counterfactual scenario.
To illustrate this case, we built seven dummy variables of different householdsizes and regressed ph against six of them. This was performed for each of the1,000 simulated counterfactual scenarios. The results for the particular case ofthe m0,0 metric, show that in all 1,000 regressions the null hypothesis of equalrelationship between the dummy variables and ph is rejected. If, for example,the same approach is used to evaluate a profile based on an m1,0.87 metric, in80.8% of the 1,000 counterfactual scenarios, we cannot reject the null hypothesisof an equal estimated relationship among the six dummy variables for householdsize and ph. These 1,000 consistent results confirm that measuring the burdenof multidimensional deprivation with anm0,0 metric does not permit householdsof different size with no systematic difference in deprivation to be classified asequivalently deprived. Consequently, we can assert the m0,0 metric does notpermit an unbiased multidimensional deprivation incidence profile in our 2013Paraguayan application.
However, how do these results translate into factual observed profiles? Toassess the implications of using the m0,0 metric with respect to a metric demon-strating the ability to effectively capture differences in need, as for examplein this Paraguayan context, the m1,0.87 metric. Table 3 presents the multidi-mensional deprivation incidence obtained upon identifying the most deprivedhouseholds under the basis of these two metrics and by household size. Thiscomparison indicates that the use of the m0,0 metric to sort and identify mul-tidimensionally deprived households results in 13.2% of households consistingof one person, as well as 7.6% of households consisting of two persons, to beexcluded from the multidimensionally deprived population because of their de-mographic profile. In addition, 11.0% of the households consisting of seven ormore persons and 13.2% of the households consisting of six persons are identifiedas multidimensionally deprived because of their particular size and composition.
In summary, the results shown in this section indicate that neglecting differ-ences in needs, and in particular the use of a dimensions count-based approach tomeasurement, yields biased household-based multidimensional deprivation inci-dence profiles. Other different combinations of β and θ to describe the burden ofhousehold multidimensional deprivation in the context of the 2013 Paraguayanapplication have proved to reveal unbiased multidimensional deprivation inci-
26
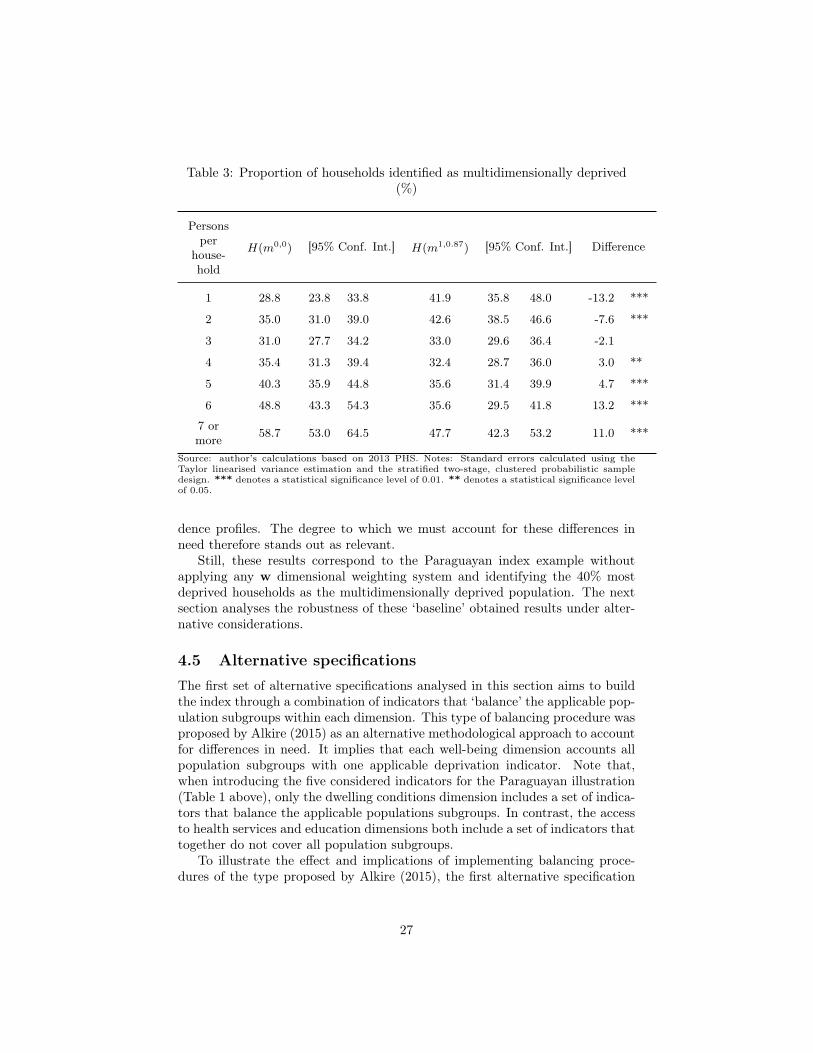
Table 3: Proportion of households identified as multidimensionally deprived(%)
Personsper
house-hold
H(m0,0) [95% Conf. Int.] H(m1,0.87) [95% Conf. Int.] Difference
1 28.8 23.8 33.8 41.9 35.8 48.0 -13.2 ***
2 35.0 31.0 39.0 42.6 38.5 46.6 -7.6 ***
3 31.0 27.7 34.2 33.0 29.6 36.4 -2.1
4 35.4 31.3 39.4 32.4 28.7 36.0 3.0 **
5 40.3 35.9 44.8 35.6 31.4 39.9 4.7 ***
6 48.8 43.3 54.3 35.6 29.5 41.8 13.2 ***
7 ormore 58.7 53.0 64.5 47.7 42.3 53.2 11.0 ***
Source: author’s calculations based on 2013 PHS. Notes: Standard errors calculated using theTaylor linearised variance estimation and the stratified two-stage, clustered probabilistic sampledesign. *** denotes a statistical significance level of 0.01. ** denotes a statistical significance levelof 0.05.
dence profiles. The degree to which we must account for these differences inneed therefore stands out as relevant.
Still, these results correspond to the Paraguayan index example withoutapplying any w dimensional weighting system and identifying the 40% mostdeprived households as the multidimensionally deprived population. The nextsection analyses the robustness of these ‘baseline’ obtained results under alter-native considerations.
4.5 Alternative specificationsThe first set of alternative specifications analysed in this section aims to buildthe index through a combination of indicators that ‘balance’ the applicable pop-ulation subgroups within each dimension. This type of balancing procedure wasproposed by Alkire (2015) as an alternative methodological approach to accountfor differences in need. It implies that each well-being dimension accounts allpopulation subgroups with one applicable deprivation indicator. Note that,when introducing the five considered indicators for the Paraguayan illustration(Table 1 above), only the dwelling conditions dimension includes a set of indica-tors that balance the applicable populations subgroups. In contrast, the accessto health services and education dimensions both include a set of indicators thattogether do not cover all population subgroups.
To illustrate the effect and implications of implementing balancing proce-dures of the type proposed by Alkire (2015), the first alternative specification
27
analysed here consists of balancing the access to health services dimension.Specifically, the access to health services dimension can be considered as ‘un-balanced’ in the baseline configuration of the index, because the indicator ofnon-access to health services when needed applies exclusively to persons thatwere sick or had an accident during the 90 days before the interview; and sucha dimension does not include any additional indicator for persons that were notsick or did not have an accident during the 90 days before the interview. Imple-menting a balancing procedure in this dimension implies either excluding thenon-access to health services indicator from the index, or including an indicatorapplicable exclusively to the population that were not sick and had not had anaccident during the 90 days before the interview. Here, the first approach isimplemented because the latter would be conducive to including an indicatorthat is neither straightforwardly intuitive nor relevant for the purposes of policy.
The results of the δ relation coefficient between ph and the size of householdneeds obtained using the Paraguayan index under this first alternative specifi-cation (i.e. excluding the non-access to health services when needed indicator)and across 1,000 counterfactual scenarios are shown in the second row of Table4 (Specification A). In comparison to the baseline results, the magnitude of δdecreases while reducing the number of indicators applicable to specific pop-ulation subgroups in the index. Whereas the baseline specification consists ofaggregating five indicators, of which three describe differences in needs across de-mographic population subgroups, this alternative Specification A includes onlytwo out of these three indicators. This reduction in indicators, in the case ofthe dimensions count-based approach to measurement, results in a mean δ 7.6p.p. smaller than that observed in the baseline specification.
It is worth noting that this first alternative specification of the index balancesthe access to health services and the dwelling conditions dimensions, but theeducation dimension remains unbalanced. To balance this remaining dimension,an additional indicator applicable exclusively to children under five years ofage is included. The additional deprivation indicator included corresponds towhether or not a 0âĂŞ4 years old child has been registered into the nationalidentification system. The results of this specification are labelled in Table 4 asSpecification B.
The results of Specification B show a larger mean δ relation than the ob-tained by Specification A. This confirms that the strength of the relation be-tween multidimensional deprivation incidence and the size of household needsincreases/decreases along the number of indicators that depict differences inneed across population subgroups does.
Interestingly, the results of Specification B also indicate that despite popula-tion subgroups per each dimension being completely balanced across indicators,the obtained distribution of the δ-relation between multidimensional depriva-tion incidence and the size of household needs is located far above zero withits values concentrated around 16.9 p.p. This result proves that a dimensionscount-based approach to measurement (m0,0) is unable to classify equivalentlyany two households with no systematic difference in deprivation but only dif-ferent needs. This is even though balancing procedures across dimensions and
28

indicators have taken place.Still, one might argue that a weighting structure to avoid giving more im-
portance to some dimensions over others could enhance the outcome of this typeof balancing procedures. Hence, the third alternative specification tested hereimposes over Specification B a nested weighting structure, which means eachdimension and each indicator within each dimension has an equal relative impor-tance in the index. The results of this fourth specification are shown in the table4 as Specification C. We observe that this weighting structure rather worsensthe results and increases in about 70% the size of the δ-relation with regard tothe unweighted specification (Specification B).8 This result is observed becausethe implemented weighting system of Specification C reduces the importancein the index of the indicators that apply to any person (health insurance non-coverage and substandard dwelling conditions) and increases the importance ofindicators that capture differences in needs across population subgroups.
Another possible course of action to implement a balancing procedure couldconsist of applying a set of weights that vary across population subgroups thatexhibit different sets of needs. In the Paraguayan example, this procedure im-plies imposing over the balanced specification of the index (Specification B) aset of weights such that the sum of relative importances across indicators is onein each population group that is accounted through a different set of indica-tors. Note that here weights are applied over individuals’ deprivations ratherthan over household’s dimensions. The results of this D-alternative balancingspecification show a δ relation equivalent to the obtained using the unweightedbalanced specification of the index (Specification B).
Now, in terms of different shares of the population to identify the multidi-mensionally deprived population, while the baseline results are based on identi-fying the first 40% most deprived households, here as alternative specifications20% and 30% of the total population of households are identified as the mul-tidimensionally deprived. Results are shown in the last two rows of Table 4.As expected, the size of the δ relation coefficient is sensitive to the share ofpopulation identified as multidimensionally deprived, it decreases as the shareof identified multidimensionally deprived population decreases.
In summary, these alternative specifications, consistently with Section 4.4’sfindings, demonstrate that measuring the burden of multidimensional depriva-tion without accounting for differences in need, as the dimensions count-basedapproach to measurement does, produces a biased multidimensional depriva-tion incidence profile. It captures not only relevant differences in deprivationbut also unaddressed differences in needs. Though a deprivations share-basedapproach addresses differences in needs, this approach to measurement over-shoots the results. The obtained δ estimates that use this relative approach tomeasurement result concentrated not around the desired zero mean, but aroundnegative values. It conduces multidimensional deprivation incidence to decreasesystematically as the size of the household needs increases. Still, these nega-
8An unweighted specification across five indicators implies in practice that each indicatorhas one fifth of relative importance in the whole index.
29

Table 4: Simulation results: distribution of the obtained δ regression coefficientin p.p. when using mβ,θ to sort and identify the most deprived households
Specification
Dimensions count-based(m0,0)
Deprivations share-based(m1,1)
Meanδ
Ll Ul Meanδ
Ll Ul
(1) (2) (3) (4) (5) (6)
Baseline
Two unbalanceddimensions & 40% ofshare
17.9 16.5 19.5 -10.9 -12.7 -9.2
Alternative specifications
A One unbalanceddimension 10.3 7.8 12.8 -16.9 -19.5 -14.2
B
Balancedspecification: Alldimensions arebalanced
16.9 15.2 18.7 -9.6 -11.3 -7.6
C Weighted balancedspecification 29.0 25.7 32.2 -14.4 -17.9 -10.7
D Using an individualweighting system 17.0 15.2 18.6 -9.5 -11.3 -7.5
E 20% of share 12.0 10.9 13.3 -8.0 -9.6 -6.5
F 30% of share 16.3 14.9 17.6 -8.9 -10.5 -7.3Source: author’s calculations based on 2013 PHS. Notes: Estimated population means based ona sample of 5,423 households. Results obtained by simulating 1,000 independent times a randomallocation of deprivation across the observed households, keeping constant the demographicconfiguration of the households and the societal amount of deprivation in each indicator. Columns(1) and (4) correspond to the mean δ regression coefficient across these 1,000 simulations. Columns(2) and (5) correspond to the δ value at the 2.5 percentile of the distribution of δ coefficientsacross the 1,000 performed simulations. Columns (3) and (6) correspond to the δ value at the 97.5percentile.
tive mean δ values are about half the size of those obtained by the dimensionscount-based metric.
In next section we briefly discuss the case when multidimensional deprivationis evaluated at the individual level; the methodology presented in Section 3.2 iscalled ‘the individual-based method’.
4.6 The individual-based methodThis section illustrates the empirical behaviour of the multidimensional depri-vation measurement methodology proposed in this paper when using individual
30

as the unit of multidimensional deprivation analysis and evaluates its proposedmeasures. For this purpose, the same 2013 PHS indicators used for analysisin previous sections are used here. However, as described when outlining themethodology for the individual-based method (Section 3.2), household-basedaggregates are not pursued here. In contrast, in the individual-based method,each individual is considered its own household and the burden of multidimen-sional deprivation is measured by an mθ metric.
Table 5 presents for each 2013 PHS considered deprivation indicator thenumber of observed persons in its applicable population and the proportion ofdeprived persons within it. These five deprivation indicators are subsequentlycombined to depict the burden that multidimensional deprivation places on eachindividual. As a result, we obtain the mθ index that takes values according tothe used θ parameter of responsiveness of deprivation with regard to the levelof needs.
To evaluate measures, we use the same desirability condition used in theafore-presented sections and outlined on page 21. As such, in a counterfac-tual scenario with no systematic difference in deprivation among individualsbut only differences in needs across them, we analyse the relationship betweenthe multidimensional deprivation incidence (pi) and the size of individual needs.Similarly to the household-based case, we approach this analysis via the linearregression pi = ρ+ δNi, where Ni represents the size of individuals multidimen-sional needs and is measured by the number of achievements, i.e., indicators,
Table 5: Observed individual dimensional deprivation
Deprivationindicator
Applicable populationwhere the indicator isrelevant
Number ofobserved
persons in theapplicablepopulation
Proportion(%) ofdeprived
persons in theapplicablepopulation
Health insurancenon-coverage Any person 20,909 71.9
No access to healthservices
Any person that wassick or had an accidentduring the 90 daysprevious to theinterview
7,199 23.8
Non-schoolattendance
5 - 17 years oldpopulation 5,706 6.7
Low educationalachievement
18 years old populationand over 13,406 47.9
Sub-standardhousing Any person 20,909 24.6
Source: author’s calculations based on 2013 PHS.
31

Figure 3: Simulation results: distribution of the obtained δ regressioncoefficient in percentage points (p.p.) using two different mθ measures
(a) m0 (b) m1
Source: author’s calculations based on 2013 PHS. Notes: Estimated population means based on asample of 20,909 individuals. Results obtained by simulating 1,000 independent times a randomallocation of deprivation across the observed individuals, keeping constant the demographicconfiguration of the population and the societal amount of deprivation in each indicator.
the individual exhibits in need.Figure 3 plots the evaluation results of m0 and m1. The distribution of
the obtained δ estimated coefficient, when using m0 to rank individuals, regis-ter positive values across all the 1,000 simulated scenarios and ranges between11.0 and 15.2 p.p. In these counterfactual scenarios of randomly allocated de-privation, one additional dimension increases the multidimensional deprivationincidence by an average of 13.5 p.p. These results indicate that the m0 metricleads to a biased multidimensional deprivation incidence profile.
Similarly, a multidimensional profile based on a share-based measure doesnot satisfy the desirability condition. We observed from Figure 3.b that theestimates of the δ regression coefficient across the 1,000 simulations range be-tween -5.8 and -0.5 p.p., and the mean of these estimates is concentrated at 2.9p.p. below zero.
The evaluation results of these two metrics (m0 and m1) were obtained uponidentifying as multidimensionally deprived the 40% most deprived population.Other alternative population shares were also used to identify the multidimen-sionally deprived population (30% and 20%), and the results proved robustunder these other two population shares.
We now proceed to evaluate the proposed family of societal measures of thispaper in terms of the characteristics that make it suitable for the purpose ofmultidimensional deprivation measurement.
32

5 PropertiesNot every societal multidimensional deprivation measure is meant to satisfyall desirable properties. The characterization of the family of measures of thispaper, critically draws and extends the properties proposed by Alkire and Foster(2011) for their family of multidimensional measures of poverty. As such, in thissection we characterize the members of the proposed family of measures of thispaper in terms of the properties that make them non-sensitive to non-relevantaspects of the distribution and also in terms of the properties that reflect themeasures’ proper orientation.
5.1 Non-relevant sensitivitiesThe poverty measurement literature and, in particular, the multidimensionalliterature characterises some families of societal measures under a symmetryor anonymity property. According to Alkire and Foster (2011), the symmetryproperty that their family of measures uses, ensures that societal metrics arenot being constructed under the basis of greater emphasis on some populationsubgroups over others. This property is also used by multidimensional measures,such as the ones proposed by Tsui (2002), Bourguignon and Chakravarty (2003),and Seth (2010), among others. In particular, Bourguignon and Chakravarty(2003) defined their measures as symmetric since any person’s characteristics,other than the multiple well-being dimensions considered for the measure, areset as not relevant in the measurement process of their measures. Similarly, Seth(2010) imposes the identities of the individuals as ethically not significant forthe measurement process and therefore individuals are considered anonymouswithin society. We henceforth refer to this measurement property as anonymity.
However, in the presence of differences in needs across population subgroups,the individual or household heterogeneity conflicts with this property becauseindividuals can not longer be assumed as anonymous and the characteristicsthat define their needs must be taken into account. The one-dimensional wel-fare measurement literature has tackled this conflict by either measuring eachpersonâĂŹs well-being through a common metric that incorporates the informa-tion on the heterogeneity in needs and then aggregating across persons using theanonymity property or, alternatively, by dropping the anonymity property andaccounting for the heterogeneity with, for instance, a weighting system that re-flects those heterogeneous needs (Coulter, Cowell, and Jenkins, 1992b). In linewith the former approach, the methodological proposal of this paper tacklesdifferences in needs by incorporating the information of this heterogeneity inthe measures and imposes the anonymity property over the resulting societalmetrics.
Therefore, our societal measures are meant to be non-sensitive to permuta-tions of the units where the identification of the multidimensionally deprivedpopulation occurs. In the individual-based method, this means that societalmeasures are non-sensitive to rearrangements of individuals across the popula-tion. In the household-based scenario, societal measures are then meant to be
33

non-sensitive to permutations of households within society. This characteristicis termed, for the purposes of this paper, as household anonymity.
Still, household anonymity does not imply measures to be non-sensitiveto permutations of individuals across households. Permutations of individu-als across households resemble either demographic changes or transfers acrossunits, to which the proposed household-based measures of this paper are sensi-tive. We further elaborate on these sensitivities when discussing the dominanceand scale invariance properties proposed for our metrics.
Consequently, we impose over our societal metrics a property of non-sensitivityto permutations of individuals within households, which we call Within house-hold anonymity. The usage of within household anonymity implies that theintra-household bargaining power and differences in allocation of resources atthe household level are not taken into account when measuring the burden thatdeprivation places over each individual. Our approach to measurement assumesthat the burden of multidimensional deprivation is equally experienced acrosshousehold members. On the contrary, one branch of the one-dimensional welfaremeasurement literature shows that despite individuals behave under collectiveinstances in the household, they have significant differences in preferences andin their achieved welfare level. Examples of this literature are the studies of Chi-appori (1992), Browning, Chiappori, and Lewbel (2013), and Mazzocco (2005).This measurement issue requires further research to be addressed in the multi-dimensional deprivation context, which we mark as a future research endeavour.
We begin the formal presentation of the household anonymity, the withinhousehold anonymity property and the subsequent properties as follows:
Let a population of I ≥ 2 individuals belonging to R ≥ 1 households, and anI × J matrix G = [gij(sj)] of individual dimensional deprivation, where gij(sj)is the binary indicator of presence or absence of deprivation for the i individualin the j dimension as defined by (4). The h-household is qh sized and eachindividual’s household membership is known.
1. Household anonymity. Let the matrix G′ of dimensional deprivationthat household members experience be defined as a variant of the G ma-trix such that each row of G′ corresponds to a household and each columnto the binary indicator of presence or absence of deprivation of the i indi-vidual that belongs to the h household at the j dimension. If we obtainthe matrix G′′ from a permutation such that G′′ = πG′ where, π is asquare R × R matrix that has one entry 1 in each row and each column,and 0 in the remaining positions, then MDβ,θ(G) =MDβ,θ(G′′).
2. Within household anonymity. Let Gh be a qh×J sub-matrix of G thatcontains the individual dimensional deprivation of the household membersthat belong to the h household. If G′′h is obtained from a permutation suchthat G′′h = πhGh where, πh is a square qh × qh matrix that has one entry1 in each row and each column, and 0 in the remaining positions, thenMDβ,θ(Gh) =MDβ,θ(G′h).
Further, the income or expenditure poverty measurement literature has tra-
34

ditionally used a population replication invariance to ensure societies of differentpopulation size can be compared in terms of their incidence, depth and sever-ity of poverty. Along to this property a normalization property is traditionallyused to express measures in relation to the poverty line. In particular, thisis the approach used by Foster et al. (1984) and described in detail by Foster(2006). For the case of the family of measures proposed in this paper a popula-tion replication invariance is imposed to allow comparisons of any two societieswith different amount of multidimensional needs and a normalization propertyto ensures measures to be expressed in relation to the size of the householdneeds. These two properties are formalized as follows:
3. Population replication invariance. For a population of R households,if we replicate t ≥ 2 times these R households, the society level multidi-mensional measure MDβ,θ will remain unchanged.
4. Normalization. If all household members in society have all their appli-cable dimensions in deprivation, which is gij(sj) = 1 for any i individualin a j dimension satisfying sij = 1, then MDβ,θ = 1. Conversely, if for allhousehold members in society have all their applicable dimensions absentof deprivation, which is gij(sj) = 0 for any i individual in a j dimensionsatisfying sij = 1, then MDβ,θ = 0.
Despite population replication invariance and normalization have been tra-ditionally used in the poverty measurement literature, these properties can becontroversial. As pointed out by Duclos and Tiberti (2016), if we are interestedin comparing the deprivation’s breadth across two societies these two propertiesare not necessarily desirable. The family of measures proposed in this paperovercomes this drawback by incorporating not only societal measures that use arelative approach to measurement, but also other members that use an absoluteperspective. These members of our societal measures allow ranking societies interms of their absolute size of deprivation and correspond to any MDβ,θ suchthat θ = 0.
As such, exclusively H and MDβ,θ measures with θ = 1, correspond to arelative approach to measurement and are invariant to the size of the populationto be compared. These measures are the only ones that attain the normalizationproperty and therefore have a range of variability within the interval [0, 1]. WhileH expresses the incidence of multidimensional deprivation in relation to the sizeof the population of households, MDβ,1 expresses multidimensional deprivationin relation to the size of household needs. We now state the following resultregarding these properties.
Lemma 5.1. For any given k-multidimensional deprivation threshold and anyw vector of weights, the multidimensional deprivation measure MDβ,θ satisfieshousehold anonymity, within household anonymity and population replicationinvariance for any β ∈ {0, 1} and θ ∈ [0, 1] and normalization if and only ifθ = 1.
Proof. See Appendix B.
35

Other non-relevant sensitivities of our proposedMDβ,θ societal measures arethe following types of increments in achievement levels: i) increments in the jachievement level among individuals that belong to a non-multidimensionallydeprived household; ii) increments in the j achievement level among j non-deprived individuals; and iii) increments in the j achievement level among indi-viduals that do not belong to the j applicable population subgroup. We continuefurther elaborating on this.
The non-sensitivity of the measures to increments in achievement levelsamong individuals that belong to non-multidimensionally deprived households,in the context of this paper, is termed multidimensional deprivation focus. Incomparison to the AF method, this characteristic is analogous to the povertyfocus property proposed by the AF method and is the following:
5. Multidimensional deprivation focus. Let a population of R ≥ 1households, made of I individuals and an I × J matrix A = [aij ] ofindividual achievements. If a′ij is obtained by an increment of a constantγ > 0 such that a′ij = aij + γ for any person i that belongs to a non-multidimensionally deprived household while the others remain the same,i.e., a′ij = aij , then MDβ,θ(A) =MDβ,θ(A′).
It is worth noting, however, that in a household-based scenario, this mul-tidimensional deprivation focus property enforces societal measures to be non-sensitive to increments in achievements of both deprived and non-deprived indi-viduals that belong to non-multidimensionally deprived households. Identifyingthe multidimensionally deprived population at the household level is based onconsidering the household as a single unit. As such, it prevents observing multi-dimensionally deprived and non-multidimensionally deprived individuals withinthe same household. It produces measures to be non-sensitive to improvementsor declines in achievement levels of deprived individuals that might have a largenumber of dimensions in deprivation but that do not belong to multidimension-ally deprived households. This is in fact the case of any societal measures basedon household-based metrics, either H(m0,0) and M0 from the AF method orthe proposed H(mβ,θ) and MDβ,θ measures of this paper.
On the other hand, as discussed when introducing the proposed methodol-ogy of this paper, every achievement is not necessarily relevant to be measuredacross an i person. Then, the MDβ,θ proposed measures uncover this consid-eration. This means that the MDβ,θ family of measures considers non-relevantachievement increments, not only among j non-deprived individuals but alsoamong individuals that do not belong to the j applicable population. In thecontext of this paper, this property is called applicable deprivation focus and isformalized as follows:
6. Applicable deprivation focus. Let a population of R ≥ 1 households,made of I individuals and any I×J matrix A = [aij ] of individual achieve-ments. If a′ij is obtained by an increment of a constant γ > 0 such thata′ij = aij + γ for any person i such that aij ≥ zj or any person i in a
36

j dimension satisfying sij = 1, while the others remain a′ij = aij ; then,MDβ,θ(A) =MDβ,θ(A′).
We now present and prove the following Lemma regarding these two prop-erties.
Lemma 5.2. For any given k-multidimensional deprivation threshold and anyw vector of weights, the multidimensional deprivation measure MDβ,θ satisfiesmultidimensional deprivation focus and applicable deprivation focus for any β ∈{0, 1} and θ ∈ [0, 1].
Proof. See Appendix B.
We now discuss the set of properties that describe the orientation and de-sirable sensitivities of our measures, which are termed by Foster (2006) as dom-inance properties. This set of properties reflect the ability of our metrics todescribe improvements or declines among the multidimensionally deprived pop-ulation.
5.2 Dominance propertiesWe begin this characterization defining three relevant types of improvements inachievement levels: i) applicable achievement increment, ii) deprivation reduc-tion among the multidimensionally deprived, and iii) dimensional deprivationreduction among the multidimensionally deprived.
An applicable achievement increment occurs whenever the i individual thatbelongs to the sj applicable population subgroup increases its aij achievementlevel by a constant γ > 0. This means that the a′ij achievement for the ihousehold-member and the j dimension is obtained by an increment of a con-stant γ > 0, such that a′ij = aij + γ for any person i in a j dimension satisfyingsij = 1.
Now, assume that this i individual is deprived in the j dimension and be-longs to a multidimensionally deprived household. Then, a deprivation reduc-tion among the multidimensionally deprived occurs whenever this i individualincreases his/her welfare in the j achievement, and this improvement changeshis/her status in the j dimension from deprived to non-deprived. Hence, inaddition to be an applicable achievement increment, a deprivation reductionamongst to the multidimensionally deprived, makes this individual no longer j-deprived due to this welfare improvement. This means that the a′ij achievementfor the i individual in the j dimension, obtained by an increment of a constantγ > 0 such that a′ij = aij + γ, for any person i in a j dimension satisfyingsij = 1, aij < zj , i ∈ h, given that ph = 1, is a deprivation reduction among themultidimensionally deprived whenever a′ij ≥ zj > aij .
Nonetheless, the household to which this i individual belongs might be stillhaving any other household member j-deprived, therefore continuing to be de-prived in such dimension. Then, a dimensional deprivation reduction among
37

the multidimensionally deprived is an improvement such that it involves an ap-plicable achievement increment that produces a deprivation reduction amongthe multidimensionally deprived and also a change in the household status fromdeprived to non-deprived in such a dimension. This means that the a′ij achieve-ment for the i individual and the j dimension, obtained by an increment of aconstant γ > 0 such that a′ij = aij+γ for any person i in a j dimension satisfyingsij = 1, aij < zj , i ∈ h, given that ph = 1, produces a′ij ≥ zj > aij and d
β′
hj = 0,where the dβhj-dimensional deprivation indicator for the h household and the jdimension is defined as per in (5) and before this achievement increment takesa dβhj > 0 value. After the achievement increment this deprivation indicator
corresponds to dβ′
hj = 0.Having introduced these three different types of increases in welfare as rele-
vant, we propose the following three properties to characterise ourMDβ,θ familyof measures:
7. Weak achievement monotonicity. Let a population of R ≥ 1 house-holds, made of I individuals and an I × J matrix A = [aij ] of individualachievements. If a′ij is obtained from aij by an applicable achievementincrement, then MDβ,θ(A) ≥MDβ,θ(A′).
8. Deprivation monotonicity. If a′ij is obtained from aij by a depriva-tion reduction among the multidimensionally deprived, thenMDβ,θ(A) >MDβ,θ(A′).
9. Dimensional deprivation monotonicity. If a′ij is obtained from aijby a dimensional deprivation reduction amongst the multidimensionallydeprived, then MD1,θ(A) > MD1,θ(A′).
We proceed to show that the above properties are valid.
Lemma 5.3. For any given k-multidimensional deprivation threshold and anyw vector of weights, the multidimensional deprivation measure MDβ,θ satisfiesweak achievement monotonicity and dimensional deprivation monotonicity forany β ∈ {0, 1} and θ ∈ [0, 1], and deprivation monotonicity if and only if β = 1.
Proof. See Appendix B.
Not every measure satisfies the three proposed dominance properties, eachcombination of β and θ parameters enforces different properties. As such, themeasurement of household multidimensional deprivation using our MDβ,θ fam-ily of measures and setting β = 1, which means counting deprivations in thehousehold rather than dimensions in deprivation, have proved to ensure thedesirable orientation.
In terms of an individual-based method and in comparison to the AF set ofproperties, the proposed weak achievement monotonicity and dimensional de-privation monotonicity properties of this paper result equivalently to the AF’s
38

proposed weak monotonicity and dimensional monotonicity properties, respec-tively. However, the AF metrics do not satisfy deprivation monotonicity, whichmake their measures non-sensitive to increments in deprivation among the mul-tidimensionally deprived population. Feature not desirable for the purposes ofpoverty measurement.
Another important dominance characteristic for multidimensional depriva-tion measurement is the ability of the measure to fall unambiguously under anyapplicable achievement increment, even if such achievement increment does notremove deprivation. The AF method termed this property as monotonicity. Inthe case of the AF method, any Mα with α > 0 is meant to satisfy monotonic-ity. However, Mα with α > 0 are metrics not commonly used in the appliedliterature because they require that all considered achievement indicators beingcardinal. Given the ordinal nature of the majority of policy indicators, the AF’smonotonicity property is therefore hardly exhibited. In terms of the measuresproposed in this paper, any measure satisfying monotonicity would produce adecrease in the societal value of MDβ,θ due to an applicable achievement incre-ment. But, the ordinal nature of policy indicators conduces to express them interms of binary data, which disables the ability to document this type of welfareimprovement.
5.3 Decomposability propertiesAny metric that can be expressed as a weighted average of subgroup estimates,where weights are population subgroup shares can be defined as decomposable.Articles such as Foster et al. (1984), Tsui (1999), and Alkire and Foster (2011)refer to this property as decomposability, and Bourguignon and Chakravarty(2003) refers to it as subgroup decomposability. In the context of our proposedmethodology, decomposability is enabled across groups of units where the iden-tification of the multidimensionally deprived population occurs. This meansthat measures that use individuals as the unit of analysis can be decomposedby subgroup of individuals and those that use household as the unit of analy-sis can be decomposed by subgroup of households. We name this property asdecomposability by household subgroups and formalize it as follows:
10. Decomposability by household subgroups. Let a population ofI ≥ 2 individuals belonging to R ≥ 2 households and a I × J matrix Gof individual dimensional deprivation. For a given positive integer L letG1, G2, . . . , GL be submatrices of G and further let λ = 1, . . . , L. EachGλ represents the Iλ × J matrix of dimensional deprivation for a sub-population made of Iλ individuals that belong to Rλ households, with∑Lλ=1 Iλ = I. Then, it holds that
MDβ,θ(G) =
L∑λ=1
IλIMDβ,θ(Gλ).
The second worth analysing decomposability feature refers to the ability ofsocietal metrics to be expressed as a weighted average of the contribution of
39
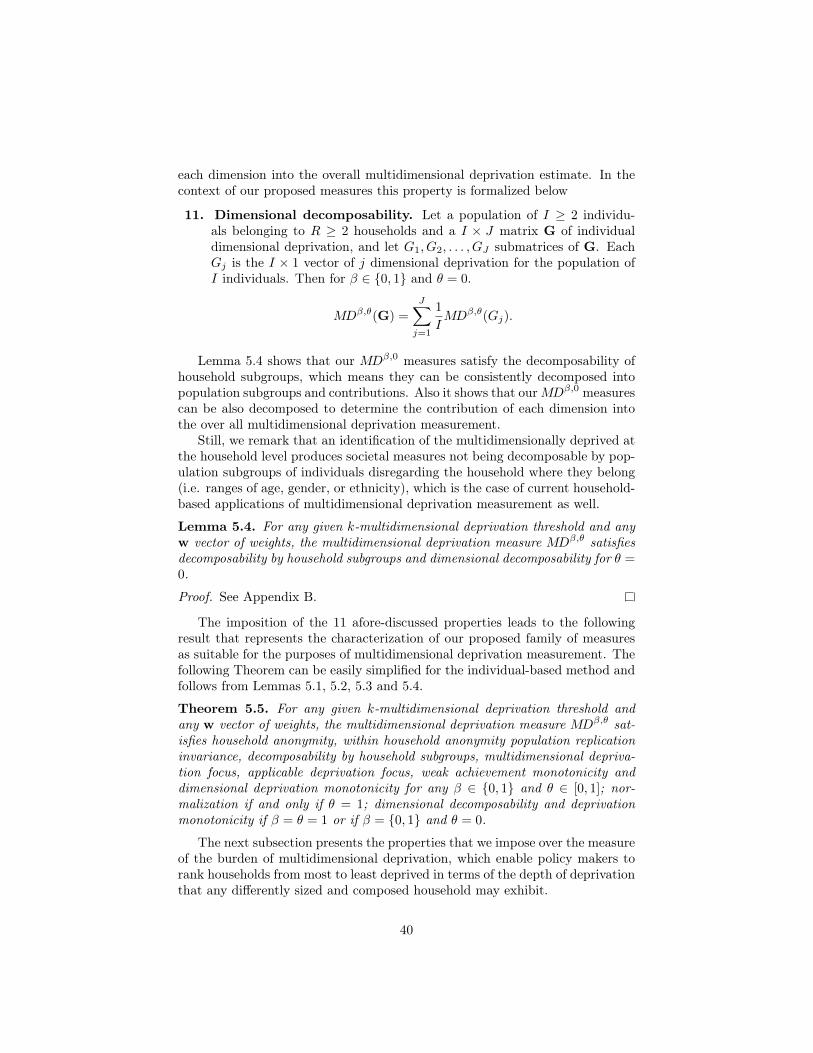
each dimension into the overall multidimensional deprivation estimate. In thecontext of our proposed measures this property is formalized below
11. Dimensional decomposability. Let a population of I ≥ 2 individu-als belonging to R ≥ 2 households and a I × J matrix G of individualdimensional deprivation, and let G1, G2, . . . , GJ submatrices of G. EachGj is the I × 1 vector of j dimensional deprivation for the population ofI individuals. Then for β ∈ {0, 1} and θ = 0.
MDβ,θ(G) =
J∑j=1
1
IMDβ,θ(Gj).
Lemma 5.4 shows that our MDβ,0 measures satisfy the decomposability ofhousehold subgroups, which means they can be consistently decomposed intopopulation subgroups and contributions. Also it shows that ourMDβ,0 measurescan be also decomposed to determine the contribution of each dimension intothe over all multidimensional deprivation measurement.
Still, we remark that an identification of the multidimensionally deprived atthe household level produces societal measures not being decomposable by pop-ulation subgroups of individuals disregarding the household where they belong(i.e. ranges of age, gender, or ethnicity), which is the case of current household-based applications of multidimensional deprivation measurement as well.
Lemma 5.4. For any given k-multidimensional deprivation threshold and anyw vector of weights, the multidimensional deprivation measure MDβ,θ satisfiesdecomposability by household subgroups and dimensional decomposability for θ =0.
Proof. See Appendix B.
The imposition of the 11 afore-discussed properties leads to the followingresult that represents the characterization of our proposed family of measuresas suitable for the purposes of multidimensional deprivation measurement. Thefollowing Theorem can be easily simplified for the individual-based method andfollows from Lemmas 5.1, 5.2, 5.3 and 5.4.
Theorem 5.5. For any given k-multidimensional deprivation threshold andany w vector of weights, the multidimensional deprivation measure MDβ,θ sat-isfies household anonymity, within household anonymity population replicationinvariance, decomposability by household subgroups, multidimensional depriva-tion focus, applicable deprivation focus, weak achievement monotonicity anddimensional deprivation monotonicity for any β ∈ {0, 1} and θ ∈ [0, 1]; nor-malization if and only if θ = 1; dimensional decomposability and deprivationmonotonicity if β = θ = 1 or if β = {0, 1} and θ = 0.
The next subsection presents the properties that we impose over the measureof the burden of multidimensional deprivation, which enable policy makers torank households from most to least deprived in terms of the depth of deprivationthat any differently sized and composed household may exhibit.
40

5.4 Ranking householdsWhen it comes to rank households and determine how much deprived the worstoff household is with regard to the least deprived, the ability of the measures tomeaningfully commensurate the size of deprivation becomes crucial, as well asassuring a well behaved distribution of the multiple deprivations. In this sectionwe describe the three properties that we impose for this purpose: cardinality,absolute translation invariance and equiproportional translation invariance.
Continuity in the multidimensional measurement literature has been used,for instance, by Bourguignon and Chakravarty (2003) to characterise welfaremultidimensional measures. It ensures a well-behaved functional form thatwould produce no abrupt jumps given small changes in achievements. Theproposed approach of this paper may have more than one possible source ofdiscontinuity because is based on binary data that typifies whether or not theperson is deprived each achievement and uses a second cut-off point to identifythe multidimensionally deprived population.
However, since most of the indicators in use for public policy purposes are{0, 1} indicators of presence or absence of deprivation, the lack of continuity inthe proposed metrics of this paper is seen as an actual depiction of the policycontext. To the contrary, we exploit the ordinal nature of the indicators and useeither count-based, share-based, or a mixture of both approaches to lead to acardinal approach to express the mβ,θ-burden of multidimensional deprivation.
The cardinal nature of our proposed mβ,θ metrics allows comparison of thesize of the burden of multidimensional deprivation across any two given house-holds, which for policy purposes constitutes a technology that allow not onlyranking households from most deprived to least deprived but also to measuretheir difference in deprivation in terms of size as follows.
1. Cardinality. For any given two households A and B evaluated acrossJ dimensions, A is said to be t times as deprived as B if and only ifmβ,θA = tmβ,θ
B , for a positive number t.
On the other hand, to describe the distribution of multidimensional depriva-tion, we specifically draw from the properties proposed by Tsui (2002) and Kolm(1976) for measures of absolute and relative inequality and propose two types ofnon-relevant changes in the distribution of multidimensional deprivation: i) Anaddition in the same amount of deprivation to all households in society and ii)an equiproportional variation in multidimensional deprivation among all house-holds in society. The non-sensitivity of the measures to these two non-relevantchanges in the distribution are respectively termed as absolute translation in-variance and Equiproportional translation invariance, and formalized as follows:
2. Absolute translation invariance. Let a population of R ≥ 2 householdsevaluated across J dimensions through an mβ,0
h measure of burden of mul-tidimensional deprivation, and a given constant ζ share of the populationidentified as multidimensionally deprived. If (mβ,0)′ is obtained by anincrement of a constant γ > 0, such that (mβ,0)′ = mβ,0
h + γ for all R
41

households, then, the proportion of households identified as multidimen-sionally deprived and the ranking of households using (mβ,0)′ and mβ,0
h
remains invariant.
3. Equiproportional translation invariance. Let a population of R ≥ 2households evaluated across J dimensions through anmβ,θ
h -burden of mul-tidimensional deprivation, and any given constant ζ share of the popula-tion identified as multidimensionally deprived. If (mβ,θ)′ is obtained by anequiproportional variation in multidimensional deprivation by a constantγ > 0, such that (mβ,θ)′ = mβ,θ
h γ for all R households, then, the pro-portion of households identified as multidimensionally deprived and theranking of households using mβ,θ
h and (mβ,θ)′ remains invariant.
We show now that these properties hold regarding the measure mβ,θ ofmultidimensional deprivation.
Proposition 5.6. For any given w vector of weights, the mβ,θ measure ofmultidimensional deprivation satisfies cardinality for any β ∈ {0, 1} and θ ∈[0, 1]; absolute translation invariance if and only if θ = 0; and equiproportionaltranslation invariance if and only if θ ∈ (0, 1].
Proof. See Appendix B.
6 Context-specific definitionsMultidimensional deprivation measurement embeds, as does any poverty mea-surement process, several assumptions and normative definitions that vary fromcontext to context. In fact, Sen (1979) indicates the following as a good practicefor the general poverty measurement exercise: ‘There is very little alternative toaccepting the element of arbitrariness in the description of poverty, and makingthat element as explicit as possible.’ (Sen, 1979, p.288). In light of this, inthis section we discuss the most relevant context-specific definitions embeddedin the proposed multidimensional deprivation family of indices.
Unit of multidimensional deprivation analysis. The first normative se-lection required when measuring multidimensional deprivation is the unit ofanalysis where multidimensional deprivation is evaluated. The two most com-mon approaches are selecting either households or individuals as the unit ofanalysis. The proposed methodology of this article allows selecting either ofthese two different units. While individual-based measures allow the unmask-ing of differences in multidimensional deprivation across demographic subpop-ulation groups, household-based measures conceive households as co-operativeunits that jointly face the deprivation suffered by the household members.
Considering household as the unit of multidimensional deprivation analy-sis implies understanding the burden that deprivation places as shared amonghousehold members. For example while child mortality refers to a particular
42
episode that is suffered by children, using the household as the unit of depriva-tion analysis implies that this episode is understood as a phenomenon that notonly affects children but also the household as a whole. The living conditionsand behaviours of household members contribute to reducing or increasing thefrequency of such situations, and the burden of the episode is faced collectivelyby the household.
An example of a household-based approach to measurement where possibleintrahousehold externalities arising from the presence of non-deprived house-hold members is the proposed approach of Basu and Foster (1998) for the caseof literacy. In this case, the scholars proposed taking into account in the lit-eracy measurement not only individuals’ ability to read and write but also theadditional advantage that literate householdsâĂŹ members bring to illiteratemembers in the household. Extensions have been developed by Subramanian(2004), Subramanian (2008), and Chakravarty and Majumder (2005), and asimilar approach but for the case of the unemployment rate has been proposedby Basu and Nolen (2008).
As such, the proposed methodology of this paper enables using either thehousehold or the individual as the unit of analysis. It recognizes that select-ing individuals or households have embedded different normative criteria thatneed to be analysed and defined according to the purposes of each particularapplication.
Defining needs. Implicit in our approach is that an individual can be re-garded as deprived by a particular indicator only if it measures an achieve-ment that can be viewed as something that this individual legitimately needs.Needs differ across dimensions of multidimensional deprivation by populationsubgroup. For example while adults who do not have work opportunities despitelooking for them can be catalogued as employment deprived, children cannotbe catalogued as deprived in the absence of employment. Conversely, childrenunder 11 years old who are forced to work would be catalogued as deprived.Children are accountable on other deprivations that are relevant to them, suchas access to education services. As such, adults and children have different setsof needs. While adults need access to job opportunities and are considered em-ployment deprived whenever they do not have access to them, children needaccess to basic school services and are considered educationally deprived if theylack such access.
Needs are, thus, incorporated into my multidimensional deprivation familyof indices by excluding from the calculations all dimensions that do not corre-spond to needs for a particular individual. As such, by setting the applicablepopulation subgroups where relevant to measure presence or absence of depri-vation in each well-being indicator, the practitioner formalizes whom is definedas legitimately needing each of these dimensions. These differences in needmake visible the normative definition of legitimate and illegitimate differencesin achievement levels. Whereas differences in achievement level within the ap-plicable population subgroup of each indicator are set as illegitimate, differences
43

within the non-applicable population subgroup are catalogued as fair and aretherefore tackled by the measurement process.
In consequence, setting the applicable populations results in being a keynormative decision in our proposed approach. It is suggested that they be madeusing context-specific norms of what is considered desirable and undesirable ineach of the dimensions included within the multidimensional index, or availableinternational indicator definitions.
For example in the education dimension, deprivation indicators may be de-fined using the ranges of ages suitable to measure enrolment and school lagaccording to each country. Another example is child labour. The InternationalLabour Organization describes in its regulations the age ranges defined as suit-able to measure this kind of deprivation and the activities and time durationthat are considered as acceptable for this matter. Still, these definitions arecontext specific and should be tailored with special care.
Measuring the burden of multidimensional deprivation. The selectionof parameters that describe the burden that multidimensional deprivation placesover the household also constitutes an important context-specific definition.There is no correct or incorrect selection of parameters. However, each com-bination produces different household rankings and therefore it can be utilizedaccording to the circumstances.
To select the most appropriate combination of parameters, two different ap-proaches can be employed. First, the combination of parameters can be selectedfrom a normative perspective. While count-based approaches (θ = 0) give eitherto each dimension (using β = 0) or to each deprivation (β = 1) an equal abso-lute value in the measurement of the burden of multidimensional deprivation,share-based approaches (θ = 1) give an equal absolute value to each household,regardless of their demographic composition and size, and taking into accountthe possible scale economies that arise at this level. An intermediate normativeperspective approach corresponds to a θ parameter in between these two solu-tions. The value of θ reflects the responsiveness of the burden of deprivation tothe scale of need, and values of θ close to zero convey a lower response of theburden of multidimensional deprivation to the size of need. Conversely, valuesof θ close to one convey a greater response of the burden of deprivation to thesize of need.
On the other hand, the second possible course of action corresponds to de-termining the combination of parameters that enables non-biased societal multi-dimensional deprivation incidence profiles. This combination of parameters canbe obtained, as discussed in Section 4, by simulating a counterfactual scenarioof no illegitimate difference in deprivation. The evaluation of the measures insuch a scenario enables determination of whether or not a particular combina-tion of β and θ to describe the burden of multidimensional deprivation enablesany two households with different sets of needs but no systematic difference indeprivation to be classified as equivalently deprived.
The selection of parametric values of β and θ to describe the burden of
44

multidimensional deprivation under the proposed methodology of this paper isadvised in light of robustness checks using different multidimensional deprivationthresholds and specifications.
7 Concluding remarksThis paper proposed a family of multidimensional deprivation indices that takesinto account differences in need that demographically heterogeneous units (i.e.either households of different size and composition or individuals of differentpopulation subgroups) exhibit. The proposed family of indices is meant to beapplicable for the purposes of policy and suitable for contexts where multidimen-sional deprivation is aimed to be measured through a wide range of indicatorsthat describe differences in needs.
To measure the burden of multidimensional deprivation, we use different ap-proaches to measurement that range from count-based (absolute) to share-based(relative) and intermediate approaches. These different approaches to measure-ment to sort and identify the multidimensional deprived population producesignificantly different multidimensional deprivation profiles. As such, these dif-ferent approaches were evaluated using the 2013 PHS and counterfactual scenar-ios of no systematic differences in deprivation across households/individuals butonly differences in needs. Measures able to catalogue households/individuals asequivalently deprived in these scenarios are said to be portraying an unbiasedmultidimensional deprivation profile.
Multidimensional deprivation measures, which do not address differences inneeds, as for example the dimensions AF’s count-based approach, were foundto yield biased multidimensional deprivation incidence profiles. In general,count-based approaches produced larger multidimensional deprivation incidenceamong households with larger sizes of needs, despite having no systematic dif-ference in deprivation. Share-based approaches, in contrast, produced largermultidimensional deprivation incidence among households with smaller sizes ofneeds. The degree to which we must account for these differences in need,therefore, stands out as relevant.
To evaluate the robustness of these results, the behaviour of the measureswas analysed using different alternative specifications of the index to addressdifferences in needs. Balancing procedures as proposed by Alkire (2015), whichimply in each well-being dimension accounting for all population subgroupswith one applicable deprivation indicator, were also discussed and evaluated asalternative methodological approaches. The results of this paper proved to berobust under all of these alternative considerations.
In the context of the Paraguayan implemented index example, particularmembers of our proposed family of measures of the burden of multidimensionaldeprivation demonstrated the ability to depict as equivalently deprived house-holds with no systematic difference in deprivation but only different sets ofneeds. They, therefore, confirmed providing an unbiased multidimensional de-privation incidence profile in this specific context.
45

We also evaluate the proposed family of measures of this paper in terms ofits properties. The results of this evaluation demonstrate the proper orientationof the family of measures and the desirable non-sensitivities, so we can concludeour proposed technology is adequate for the purposes of poverty measurement.
However, within our used framework the limitations that a parametric equiv-alence scale of this type can be recognized. First, considering that the ultimatepurpose of a multidimensional measure of deprivation is to capture unfair disad-vantage, differences in deprivation due to other fair sources are not accounted.Further research is required to disentangle the effect that other sources of legit-imate differences might have over multidimensional deprivation incidence pro-files, such as preferences or needs not necessarily based on the still limitednumber of observable attributes (i.e. household size, composition, or age andgender) that are addressed in this paper. In addition, differences in need aredue to be analysed in the context of multidimensional deprivation technologiesthat take into account the complementarity and substitutability that might ariseamong dimensions.
Second, as analysed by Pollak and Wales (1979), Fisher (1987), and Blun-dell and Lewbel (1991), for the one-dimensional equivalence scale case, a house-hold’s current demographic composition that leads to differences in need mightbe driven by previous deprivation status as well. For example a particularhousehold consisting of two adults and five children might be this size not onlybecause both adults have a preference for many children, but also because theydid not have access to pregnancy prevention education or could not afford touse some form of birth control. Then, household composition not only reflectsneeds or preferences, catalogued in this paper as producing fair differences indeprivation among households, but also current household compositions mightbe a reflection of avoidable and unfair previous states of deprivation. This is acomplex issue that is left for further research.
Furthermore, the proposed methodology of this paper measures multidi-mensional deprivation either at the individual or at the household level withoutaddressing the intrahousehold bargaining power and allocation of resources thatmight be conducive to ameliorating or intensifying each individual’s burden ofdeprivation. In particular, the one-dimensional welfare comparisons literaturehas shown that households do not behave as a single unit but rather under collec-tive instances where household’s behaviour is the outcome of the joint decisionsof its members (Chiappori, 1992; Browning et al., 2013; Mazzocco, 2005). Assuch, further research is required to provide a multidimensional measurementtechnology able to account for these intrahousehold differences and their effecton the burden that multidimensional deprivation places on each individual.
Nonetheless, following Elster and Roemer (1991, pp.1), who exhorts any no-tion of well-being to be based on appropriately operationalized interpersonalcomparisons, and also to be adequate for the purposes of distributive justice.The family of measures presented in this paper contributes to the multidimen-sional deprivation measurement literature by enhancing the comparability acrosshouseholds or individuals that exhibit different needs, as well as being adequatefor the purposes of multidimensional deprivation measurement.
46
ReferencesS. Alkire, J. Foster, Counting and multidimensional poverty measurement, Jour-nal of Public Economics 95 (7) (2011) 476–487.
P. Townsend, Poverty in the United Kingdom: a survey of household resourcesand standards of living, University of California Press, 1979.
A. B. Atkinson, F. Bourguignon, The comparison of multi-dimensioned distri-butions of economic status, The Review of Economic Studies (1982) 183–201.
J. Mack, S. Lansley, et al., Poor Britain, Allen & Unwin London, 1985.
T. Callan, B. Nolan, C. T. Whelan, Resources, deprivation and the measurementof poverty, Journal of Social Policy 22 (02) (1993) 141–172.
J. C. Feres, X. Mancero, El método de las necesidades básicas insatisfechas(NBI) y sus aplicaciones en América Latina, Naciones Unidas, CEPAL, Divi-sion de Estadística y Proyecciones Económicas, 2001.
A. B. Atkinson, Social indicators: The EU and social inclusion, Oxford Univer-sity Press, 2002.
R. Aaberge, A. Brandolini, Social evaluation of deprivation count distributions,society for the Study of Economic Inequality -ECINEQ- Working Paper SeriesNo. 2014 - 342., 2014a.
K. Roelen, F. Gassmann, C. de Neubourg, Child poverty in Vietnam: Pro-viding insights using a country-specific and multidimensional model, SocialIndicators Research 98 (1) (2010) 129–145.
J. M. Roche, Monitoring progress in child poverty reduction: methodologicalinsights and illustration to the case study of Bangladesh, Social IndicatorsResearch 112 (2) (2013) 363–390.
J.-F. Trani, T. I. Cannings, Child poverty in an emergency and conflict context:A multidimensional profile and an identification of the poorest children inWestern Darfur, World Development 48 (2013) 48–70.
J.-F. Trani, M. Biggeri, V. Mauro, The Multidimensionality of child poverty:Evidence from Afghanistan, Social Indicators Research 112 (2) (2013) 391–416.
D. Qi, Y. Wu, Child Poverty in China-A Multidimensional Deprivation Ap-proach, Child Indicators Research 7 (1) (2014) 89–118.
T. Oshio, M. Kan, Multidimensional poverty and health: evidence from a na-tionwide survey in Japan, International Journal for Equity in Health 13 (1)(2014) 1–11.
47

S. Solaymani, F. Kari, Poverty evaluation in the Malaysian Fishery Community,Ocean & Coastal Management 95 (2014) 165–175.
S. Alkire, A. Conconi, J. Roche, Multidimensional Poverty Index 2013: Briefmethodological note and results, oxford Poverty and Human Initiative -OPHI.Oxford, UK., 2013.
R. Angulo, Y. Díaz, R. Pardo, The Colombian Multidimensional Poverty Index:Measuring Poverty in a Public Policy Context, Social Indicators Research(2015) 1–38.
S. Alkire, S. Seth, Multidimensional poverty reduction in India between 1999and 2006: Where and how?, World Development 72 (2015) 93–108.
S. Alkire, M. E. Santos, Measuring acute poverty in the developing world: Ro-bustness and scope of the multidimensional poverty index, World Develop-ment 59 (2014) 251–274.
O. I. Ayuya, E. O. Gido, H. K. Bett, J. K. Lagat, A. K. Kahi, S. Bauer, Effect ofCertified Organic Production Systems on Poverty among Smallholder Farm-ers: Empirical Evidence from Kenya, World Development 67 (2015) 27–37.
C. Bader, S. Bieri, U. Wiesmann, A. Heinimann, A Different Perspective onPoverty in Lao PDR: Multidimensional Poverty in Lao PDR for the Years2002/2003 and 2007/2008, Social Indicators Research (2015) 1–20.
D. Cavapozzi, W. Han, R. Miniaci, Alternative weighting structures for multi-dimensional poverty assessment, The Journal of Economic Inequality (2013)1–23.
S. Mitra, Synergies Among Monetary, Multidimensional and Subjective Poverty:Evidence from Nepal, Social Indicators Research (2014) 1–23.
S. Alkire, J. M. Roche, S. Seth, A. Summer, Identifying the Poorest Peopleand Groups: Strategies Using the Global Multidimensional Poverty Index,Journal of International Development 27 (3) (2015) 362–387.
J. Yu, Multidimensional poverty in China: Findings based on the CHNS, SocialIndicators Research 112 (2) (2013) 315–336.
A. Kapteyn, B. Van Praag, A new approach to the construction of family equiv-alence scales, European Economic Review 7 (4) (1978) 313–335.
R. A. Pollak, T. J. Wales, Welfare comparisons and equivalence scales, TheAmerican Economic Review (1979) 216–221.
R. Blundell, A. Lewbel, The information content of equivalence scales, Journalof Econometrics 50 (1) (1991) 49–68.
F. A. Coulter, F. A. Cowell, S. P. Jenkins, Equivalence scale relativities and theextent of inequality and poverty, The Economic Journal (1992a) 1067–1082.
48
F. A. Cowell, M. Mercader-Prats, Equivalence scales and inequality, in: J. Silber(Ed.), Handbook of Income Inequality Measurement, chap. 14, Springer, 405–429, 1999.
J.-Y. Duclos, M. Mercader-Prats, Household needs and poverty: with appli-cation to Spain and the UK, Review of Income and Wealth 45 (1) (1999)77–98.
U. Ebert, P. Moyes, Equivalence scales reconsidered, Econometrica: Journal ofthe Econometric Society 71 (1) (2003) 319–343.
R. M. Vijaya, R. Lahoti, H. Swaminathan, Moving from the household to theindividual: Multidimensional poverty analysis, World Development 59 (2014)70–81.
A. E. Agbodji, Y. M. Batana, D. Ouedraogo, Gender inequality in multidi-mensional welfare deprivation in West Africa: The case of Burkina Faso andTogo, world Bank Policy Research Working Paper No. 6522, 2013.
F. M. Fisher, Household equivalence scales and interpersonal comparisons, TheReview of Economic Studies 54 (3) (1987) 519–524.
J. Muellbauer, Household composition, Engel curves and welfare comparisonsbetween households: A duality approach, European Economic Review 5 (2)(1974) 103–122.
J. A. Nelson, Household equivalence scales: theory versus policy?, Journal ofLabor Economics (1993) 471–493.
A. B. Atkinson, F. Bourguignon, Income distribution and differences in needs,in: G. R. Feiwel (Ed.), Arrow and the Foundations of the Theory of EconomicPolicy, vol. 2, Macmillan, 1987.
B. Buhmann, L. Rainwater, G. Schmaus, T. M. Smeeding, Equivalence Scales,Well-Being, Inequality, and Poverty: Sensitivity Estimates across Ten Coun-tries Using the Luxembourg Income Study Database, Review of Income andWealth 34 (2) (1988) 115–142.
A. Sen, Capability and well-being, in: A. Sen, M. Nussbaum (Eds.), The qualityof life, Oxford, 30–54, 1993.
F. Bourguignon, S. R. Chakravarty, The measurement of multidimensionalpoverty, The Journal of Economic Inequality 1 (1) (2003) 25–49.
S. Seth, Inequality, interactions, and human development, Journal of HumanDevelopment and Capabilities 10 (3) (2009) 375–396.
S. Seth, A class of distribution and association sensitive multidimensional wel-fare indices, The Journal of Economic Inequality (2010) 1–30.
49

A. B. Atkinson, Multidimensional deprivation: contrasting social welfare andcounting approaches, The Journal of Economic Inequality 1 (1) (2003) 51–65.
R. Aaberge, A. Brandolini, Multidimensional poverty and inequality, in: A. B.Atkinson, F. Bourguignon (Eds.), Handbook of Income Distribution, Elsevier,2014b.
J. Foster, J. Greer, E. Thorbecke, A class of decomposable poverty measures,Econometrica: Journal of the Econometric Society 52 (3) (1984) 761–766.
K. Decancq, M. A. Lugo, Weights in multidimensional indices of wellbeing: Anoverview, Econometric Reviews 32 (1) (2013) 7–34.
M. Fleurbaey, Fairness, responsibility and welfare, Book Manuscript .
M. Fleurbaey, E. Schokkaert, Unfair inequalities in health and health care, Jour-nal of Health Economics 28 (1) (2009) 73–90.
K. Decancq, M. Fleurbaey, F. Maniquet, Multidimensional poverty measure-ment with individual preferences, princeton University William S. Dietrich IIEconomic Theory Center Research Paper No. 058, 2014.
F. Figari, A. Paulus, H. Sutherland, Microsimulation and policy analysis, Hand-book of Income Distribution 2.
S. Alkire, Personal communication, july, 2015.
K.-y. Tsui, Multidimensional poverty indices, Social Choice and Welfare 19 (1)(2002) 69–93.
F. A. Coulter, F. A. Cowell, S. P. Jenkins, Differences in needs and assessmentof income distributions, Bulletin of Economic Research 44 (2) (1992b) 77–124.
P. A. Chiappori, Collective labor supply and welfare, Journal of Political Econ-omy (1992) 437–467.
M. Browning, P.-A. Chiappori, A. Lewbel, Estimating consumption economiesof scale, adult equivalence scales, and household bargaining power, The Re-view of Economic Studies .
M. Mazzocco, Individual rather than household euler equations: Identificationand estimation of individual preferences using household data, Available atSSRN 695285 .
J. Foster, Poverty indices, in: A. De Janvry, R. Kanbur (Eds.), Poverty, Inequal-ity and Development: Essays in Honor of Erik Thorbecke, Springer Science& Business Media, 41–65, 2006.
J.-Y. Duclos, L. Tiberti, Multidimensional poverty indices: A critical assess-ment, Available at SSRN 2718374 .
50

K.-y. Tsui, Multidimensional inequality and multidimensional generalized en-tropy measures: An axiomatic derivation, Social Choice and Welfare 16 (1)(1999) 145–157.
S.-C. Kolm, Unequal inequalities I, Journal of Economic Theory 12 (3) (1976)416–442.
A. Sen, Issues in the Measurement of Poverty, The Scandinavian Journal ofEconomics (1979) 285–307.
K. Basu, J. E. Foster, On measuring literacy, The Economic Journal 108 (451)(1998) 1733–1749.
S. Subramanian, Measuring literacy: Some extensions of the Basu-Foster frame-work, Journal of Development Economics 73 (1) (2004) 453–463.
S. Subramanian, Externality and literacy: A note, The Journal of DevelopmentStudies 44 (6) (2008) 839–848.
S. R. Chakravarty, A. Majumder, Intersociety Literacy Comparisons, unitedNations University, World Institute for Development Economics. ResearchPaper No. 2005/01, 2005.
K. Basu, P. Nolen, Unemployment and vulnerability: A class of distribution sen-sitive measures, its axiomatic properties, and applications, Rational Choiceand Social Welfare (2008) 237–258.
J. Elster, J. E. Roemer, Interpersonal comparisons of well-being: Introduction,in: J. Elster, J. E. Roemer (Eds.), Interpersonal Comparisons of Well-being,Cambridge University Press, Cambridge, 1–16, 1991.
51

Appendix A. Simulations’ pseudo-code
Pseudocode_sim*********************************************************************** Terminology**********************************************************************Dimensions : noseguro saluate noasiste noedu dwellingVariables
I_* : Individual deprivation indicators (g_ij) pr_* : Applicable population subgroups per indicator (s_ij)
hhid : Household identificationScalars
A_* : Societal observed amount of deprivation C_* : Size of the applicable population subgroup
p03 : Household head identificator (one per household)
************************************************************************ Counterfactual scenario of no ilegitimate difference in deprivation************************************************************************ The replications of each counterfactual scenariolocal repe = 1000local sim=0while `sim'<=`repe'-1 { * Data at the individual level use database, clear
foreach X in noseguro saluate noasiste noedu { * Assigning a random number to individuals within the j-applicable population gen random = runiform() if I_`X'!=. & pr_`X'>0 & pr_`X'!=. sort random gen temp=_n * The simulated deprivation distribution gen R_`X'=0 if temp<=C_`X' & I_`X'!=. & pr_`X'==1 replace R_`X'=1 if temp<=A_`X' & I_`X'!=. & pr_`X'==1 drop temp random } gen random = runiform() if I_dwelling!=. & pr_dwelling==1 & p03==1 sort random gen temp=_n gen temp_dwelling=0 if temp<=C_dwelling & I_dwelling!=. & pr_dwelling==1 & p03==1 replace temp_dwelling=1 if temp<=A_dwelling & I_dwelling!=. & pr_dwelling==1 & p03==1 bysort hhid: egen R_dwelling=mean(temp_dwelling) drop temp random
* Calculating measures in the counterfactual scenario foreach X in noseguro saluate noasiste noedu dwelling { * The beta parameter of deprivation aversion foreach b of numlist 0 1 { * Household dimensional deprivation indicator capture drop temp bysort hhid: egen temp=total(R_`X') gen dh_B`b'_j`X'=(temp)^`b' replace dh_B`b'_j`X'=0 if temp<=0 * Size of household dimensional needs capture drop temp bysort hhid: egen temp=total(pr_`X') gen nh_B`b'_j`X'=(temp)^`b' replace nh_B`b'_j`X'=0 if temp<=0 } }
* Data at the household level keep if p03==1
* Size of household multidimensional needs egen needs_B1=rowtotal(nh_B1_j*) egen needs_B0=rowtotal(nh_B0_j*)
foreach b of numlist 0 1 { * The theta parameter of scale response of deprivation to needs foreach Theta of numlist 0(0.01)1 { local t=round(`Theta'*100 ,1) * Household multidimensional deprivation egen m_B`b'T`t'=rowtotal(dh_B`b'_j*) replace m_B`b'T`t'=m_B`b'T`t'/(needs_B`b'^`Theta') replace m_B`b'T`t'=0 if needs_B`b'<=0 * Identification of the multidimensionally deprived egen orderB`b'T`t'=rank(m_B`b'T`t'), unique gen p_s40_B`b'T`t'=(orderB`b'T`t'>=3254) * The delta regression coefficient regress p_s40_B`b'T`t' needs_B0 sca delta_B`b'T`t'=(_b[needs_B0]) } } local sim=`sim'+1}
Page 1
52

Appendix B. ProofsHere are the proofs of Lemmas 5.1, 5.2, 5.3, 5.4 and the proof of Proposition 5.6.
Proof of Lemma 5.1. The square matrix π is a permutation matrix, since eachrow and each column has an entry equal to the unity and all the other entriesare 0. Interchanging two rows (or two columns) of π and repeating this pro-cedure, we can transform π to the identity matrix In in a finite number t ≥ 0of exchanges of rows or columns of π. Thus the determinant of π is equal todet(π) = (−1)t and π is non-singular. In particular, πT = π−1, where πT is thetranspose matrix of π and thus the inverse π−1 of π is permutation matrix aswell.
To see this, consider that the 1 entry in the cell π(i, j) of π translates to 1in the cell πT(j, i) of πT, since the rows (resp. columns) of the former matrixare the columns (resp. rows) of the latter. Multiplying these matrices, observethat the for the entries of the main diagonal ak,k holds for k = 1, . . . , n thatak,k =
∑nj=1 πk,jπ
Tj,k = 1 and the other entries are 0. Thus G′′ = πG′ permutes
the rows of G′. These arguments prove the first and second properties.The population replication invariance property follows directly by linearity
of expectation, since for each positive integer t > 1, we add t identical copies ofthe population and divide their sum by t · R. We now prove the “if” directionof the normalization property. Given that θ = 1, by (7) and (10) we have that
MDβ,1 =
1
R
R∑k=1
∑Jj=1 d
βkj(∑J
j=1 nβkj
) if
J∑j=1
nβkj > 0
0 otherwise.
Since gij(sj) = 1, for sij = 1 or gij(sj) = 0, for sij = 1 the result follows. Inthe opposite direction, using that 00 = 1 and considering (4) and (5) and giventhat for all household members holds that gij(sj) = 1 for any i individual in a jdimension with sij = 1, then
∑Jj=1 d
βkj =
∑Jj=1 n
βkj . The case where gij(sj) = 0
for any i individual in a j dimension with sij = 1 can be handled by a similarargument. The proof of the Lemma is now complete.
Proof of Lemma 5.2. The multidimensional deprivation focus property is true,since by definition of MDβ,θ, this measure remains invariant for a change bya constant γ for each person belonging to a non-multidimensionally deprivedhousehold. The same reasoning applies as well to the Applicable deprivationfocus property.
Proof of Lemma 5.3. The first two properties are true since adding a positiveconstant γ to a random variable X and letting µX be its average value, we haveby the linearity of expectation that
µX+γ = µX + µγ = µX + γ > µX ,
53

given that µX is finite. Regarding the dimensional deprivation monotonicityproperty, assume that β = 1 and a′ij is obtained from aij by a dimensional depri-vation reduction amongst the multidimensionally deprived, we observe from (7)that
∑Jj=1(dkj + C)β ≥
∑Jj=1 d
βkj if and only if β = 1, θ ∈ [0, 1] and where
d′ = dkj+C and d differ by at most a positive constant C. For if we had β = 0,then we get zero and the property obviously does not hold.
Proof of Lemma 5.4. Under the notation in the statements of the above prop-erties, by definition we have
MDβ,θ(Gλ) =
1
Iλ
Iλ∑k=1
∑Jj=1 d
βkj(∑J
j=1 nβkj
)θ if
J∑j=1
nβkj > 0
0 otherwise.
When∑Jj=1 n
βkj = 0 both properties can be easily seen to hold, so assume that∑J
j=1 nβkj > 0. We then have
L∑λ=1
IλIMDβ,θ(Gλ) =
L∑λ=1
IλI
1
Iλ
Iλ∑k=1
∑Jj=1 d
βkj(∑J
j=1 nβkj
)θ
=1
I
L∑λ=1
Iλ∑k=1
∑Jj=1 d
βkj(∑J
j=1 nβkj
)θ .
For β = θ = 1, we have
L∑λ=1
IλIMD1,1(Gλ) =
1
I
L∑λ=1
(Iλ∑k=1
∑Jj=1 dkj∑Jj=1 nkj
)
and the above expression for∑Jj=1 dkj =
∑Jj=1 nkj is
1
I
L∑λ=1
(Iλ∑k=1
1
)= 1,
which in turn can be easily seen to be equal to MD1,1(G).For β = {0, 1} and θ = 0 with
∑Jj=1 nkj = 0, considering that 00 = 1,
L∑λ=1
IλIMDβ,0(Gλ) =
1
I
L∑λ=1
Iλ∑k=1
J∑j=1
dβkj
= MDβ,0(G).
54

The dimensional decomposability property can be proved by a similar argument.
Proof of Proposition 5.6. For each β ∈ {0, 1} and θ ∈ [0, 1], mβ,θ is a positivenumber. The cardinality property now follows if and only if both the numeratorand denominator are integer numbers, since a rational number equals to thedivision of two integers. Regarding the Absolute translation invariance property,the ‘only if’ part holds, since given that (mβ,θ)′ = mβ,θ
h +γ for all R households,then by (7) θ must be 0 for the ranking of two households to be constant. Onthe other direction, if θ = 0, then from (7), we deduce that mβ,0
h is a linearfunction. Indeed, for a constant γ, we have that mβ,0
γ·h = γ ·mβ,0h and for h, s
holds that mβ,0h+s = mβ,0
h +mβ,0s .
The third property follows immediately by considering the linearity of mβ,0h .
Note that mβ,θh is not linear for θ > 0 and so it holds mβ,θ
γ·h = mβ,θh for some
positive constant γ.
Y. Díaz (Corresponding author), Institute for Social and Economic Research,University of Essex, UK
E-mail address, Y. Díaz: [email protected]
V. Iliopoulos Department of Mathematical Sciences, University of Essex, UKE-mail address, V. Iliopoulos: [email protected]
55