council budget staff report
TRANSCRIPT
CITY COUNCIL OF SALT LAKE CITY
451 SOUTH STATE STREET, ROOM 304
P.O. BOX 145476, SALT LAKE CITY, UTAH 84114-5476 COUNCIL.SLCGOV.COM
TEL 801-535-7600 FAX 801-535-7651
LUKE GARROTT | DISTRICT 4 | COUNCIL CHAIR || JAMES ROGERS | DISTRICT 1 | COUNCIL VICE CHAIR || KYLE LAMALFA | DISTRICT 2 ||
STAN PENFOLD | DISTRICT 3 || ERIN MENDENHALL | DISTRICT 5 || CHARLIE LUKE | DISTRICT 6 | || LISA ADAMS | DISTRICT 7
COUNCIL BUDGET
STAFF REPORT
CITY COUNCIL of SALT LAKE CITY
www.slccouncil.com/city-budget
TO: City Council Members
FROM: Jennifer Bruno
Deputy Director
DATE: May 21, 2015 at 3:53 PM
RE: Fiscal Year 2015-16 Department of Human Resources
VIEW MAYOR’S RECOMMENDED BUDGET HERE
ISSUE AT-A-GLANCE The Department of Human Resources (HR) is funded by both the General Fund and Insurance and Risk Management Fund (which collects and distributes employee premiums and benefits). It consists of 22.56 General Fund FTEs, and 3.44 Risk Fund FTEs. The Department provides numerous services for all City employees. HR Department programs include: Compensation and Employment Recruiting; Benefits and Wellness Management; Insurance and Risk Management; Training and Equal Employment Opportunity (EEO) Regulatory Compliance; Departmental Payroll and Administrators; Departmental Consultants and Administrative Support; Citizen Compensation Advisory Committee (CCAC) Administration and the Civilian Review Board Administration.
Note: Additional details regarding the City’s Health Insurance and Compensation can be found in separate staff reports, Insurance and Risk Management Fund and Employee Compensation.
The proposed Human Resources budget includes:
The Human Resources general fund department budget is proposed to be $2,243,307, a .1% decrease
($19,615). When including employee benefits, which are funded by the Insurance and Risk
Management Fund, the department budget is proposed to be $39.1 million, an 5.1% decrease ($2.1
million). The majority of the decrease is due to savings in the benefits program for employees. That will
be discussed further in the insurance and risk management portion of the budget.
The only changes to the general fund department budget are the standard pay, pension and benefit
increases (total is a net savings of $19,615).
For the Council’s information the following link is to the CCAC Annual Report, which was discussed
with the Council at the March 24, 2015 work session.
Project Timeline: Briefing: May 26, 2014 Budget Hearings: May 19, June 2 Potential Action: June 9 OR 16

Page | 2
ADDITIONAL BACKGROUND INFORMATION
The Administration provides numerous training and development opportunities to City employees throughout
the year. Below is a report from Human Resources, highlighting some of these opportunities and reporting on
employee participation by Department (reporting period July 2014-May 2015).
Training Program Departments # of Employee Participated Orientation FMLA/EEO/Harassment
Prevention Open Government
Transparency Policy Detection & Prevention of
Fraud, Waste & Abuse Emergency Preparedness
New Hires from all departments
285 Total: 285
From Buddy to Boss Airports 20 Total: 20
Harassment Prevention
Purchasing Treasurer’s Office Public Services 911 Bureau HR
9 4 219 11 23 Total: 266
Customer/Public Services
Purchasing Treasurer’s Office Police – Records Building Permits
9 4 5 15 Total: 33
Valuing Diversity
Police Fire Public Utilities 911 Bureau
38 309 265 10 Total: 622
Handling Difficult Conversations
911 Bureau Public Services
10 92 Total: 102
Rewards & Recognition IMS 13 Total: 10
Grand Total: 1338
ATTACHMENTS
Attachment 1 – Summary of Budget Changes
Attachment 2 – Base Purpose Statements for Human Resources (not updated for FY 2016)
Attachment 3 – CCAC Annual Report

Page | 3
ATTACHMENT 1
SUMMARY OF BUDGET CHANGES
FTE's Adopted Proposed FY 2014-15 FY 2015-16
Administrative Support - includes Information Systems, Compensation, and Human Resources Administration
11.26 1,257,463 1,261,585 4,122 0.33%
Department Consultants - support personnel needs of City departments.
9 752,615 728,626 (23,989) -3.19%
Benefits - Program and Administration
3.74 38,938,695 36,854,819 (2,083,876) -5.35%
Training - Employee Training and Development
1 94,108 99,052 4,944 5.25%
Civilian Review Board - provides investigative services and support. (Note: Listed Seperately from Administrative Support.)
1 158,736 154,044 (4,692) -2.96%
Total - Department of Human Resources
26 41,201,617 39,098,126 (2,103,491) -5.11%
Department of Human Resources
PROPOSED EXPENDITURE BUDGETS
Division Difference Percent Change

Page | 4
ATTACHMENT 2
BASE PURPOSE STATEMENTS FOR DEPARTMENT OF HUMAN RESOURCES (FROM PREVIOUS FISCAL YEAR)
PLANNING PERIOD: FY 2012-13 THROUGH FY 2017-18FISCAL YEAR 2013-14
BASEPURPOSESTATEMENTSFiscal Year 2013-14
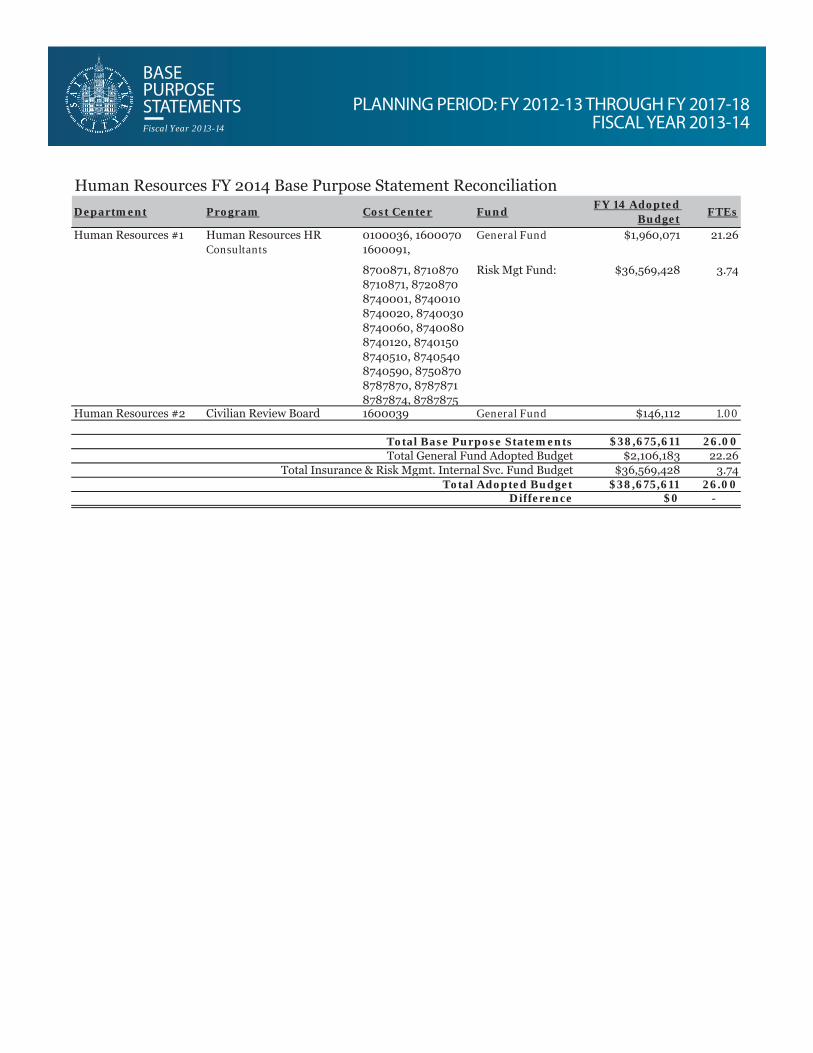
Human Resources FY 2014 Base Purpose Statement Reconciliation
Department Program Cost Center FundFY 14 Adopted
BudgetFTEs
Human Resources #1 Human Resources HR Consultants
0100036, 1600070 1600091,
General Fund $1,960,071 21.26
8700871, 8710870 8710871, 8720870 8740001, 8740010 8740020, 8740030 8740060, 8740080 8740120, 8740150 8740510, 8740540 8740590, 8750870 8787870, 8787871 8787874, 8787875
Risk Mgt Fund: $36,569,428 3.74
Human Resources #2 Civilian Review Board 1600039 General Fund $146,112 1.00
Total Base Purpose Statements $38,675,611 26.00Total General Fund Adopted Budget $2,106,183 22.26
Total Insurance & Risk Mgmt. Internal Svc. Fund Budget $36,569,428 3.74Total Adopted Budget $38,675,611 26.00
Difference $0 -

PLANNING PERIOD: FY 2012-13 THROUGH FY 2017-18FISCAL YEAR 2013-14
BASEPURPOSESTATEMENTSFiscal Year 2013-14
Human Resources #1
FUND: General Fund: 3%
Risk: 97%
COST CENTER NUMBERS:
0100036, 16000701600091, 87008718710870, 87108718720870, 87400018740010, 87400208740030, 87400608740080, 87401208740150, 87405108740540, 87405908750870, 87878708787871, 87878748787875
DEPARTMENT: Human Resources FTE / GF:FTE/ Risk:
21.263.74
DIVISION: Human Resource BUDGET / GF:RISK: $1,960,071
$36,569,428COST CENTER / PROGRAM:
Human ResourcesHR Consultants
G.F. GENERATED REVENUE
$0
AUTHORITY: Title II Administration and Personnel Ordinance, Chapter 2.08.025 provides for programs related to the personnel of Salt Lake City.
STATEMENT OF PURPOSE
The Human Resources Department supports the mission and goals of Salt Lake City by providing strategic partnership, innovation and leadership concerning the most crucial element of City government – its people. Human Resources positively address the quality of life for all City employees through strategic collaboration that assures efficient and effective management of Salt Lake City’s work force.
BASE PURPOSE STATEMENTS
The Human Resources Department is responsible for directing the functions of employee relations; organizational development; employee recruitment and selection; performance management; job analysis, classification and compensation; employee benefits and leave; disciplinary actions and the administration of support staff collective bargaining contracts. The department ensures compliance with all Federal, State, and local laws pertaining to employment. HR creates and delivers staff development programs for employees by working collaboratively with City Administration and Departments.
SIX YEAR BUSINESS PLAN GOALS
Customer Service MeasuresCumulative Targets
2010-11Actual
2011-12Actual
2012-13Actual
2013-14Target
2014-15Target
2015-16Target
RECRUITMENT: Total # of job recruitments
requisitions opened
Track total count of
requisitions closed.
n/a
212 positions posted with 11007 applicants
342 positions posted with
16,748 applicants
TBD TBD TBD

PLANNING PERIOD: FY 2012-13 THROUGH FY 2017-18FISCAL YEAR 2013-14
BASEPURPOSESTATEMENTSFiscal Year 2013-14
Human Resources #1
EEO COMPLIANCE: Total # of EEO
complaints received.
Track number of EEO
complaints received annually.
24 complaints received;
100% resolved
28 complaints received;
100% resolved
40 complaints resolved
TBD TBD TBD
ADA Accommodations
Track total count of ADA Accommodati
on requests reviewed
21 Accommo
dation requests reviewed
6Accommod
ation requests reviewed
23 Accommodati
on requests reviewed
TBD TBD TBD
EEO TRAINING
100% of employees
receive EEO Training
Three Depts.
Completed
11 sessions for
seasonal employees
Provided in New
Employee Orientation
Three
Depts
complete
Three Depts
complete
Three Depts
complete
FMLA COMPLIANCE
Track total # of approved FMLA leave
requests
n/a504 FMLA
requests519 requests
receivedTBD TBD TBD
EMPLOYEE COMMUNICATION
Implement one new
communication method each year
100%Communication HR
will receive
employee feedback through
the development of focus
groups and online
surveys, daily
meetings, bulletin boards,
etc.
Compensation &
Benefits (Total
Compensation)
Notification Letter
issued to all employeesJuly 2011. Also, HR
sponsored employee
focus group was formed
to review and
provide recommen
dations regarding
City’s Tuition
Reimbursement policy
and procedure.
HR sponsored employee
focus group was formed to
review and provide
recommendations regardingcity policies.
TBD TBD TBD
PLANNING PERIOD: FY 2012-13 THROUGH FY 2017-18FISCAL YEAR 2013-14
BASEPURPOSESTATEMENTSFiscal Year 2013-14
Human Resources #1
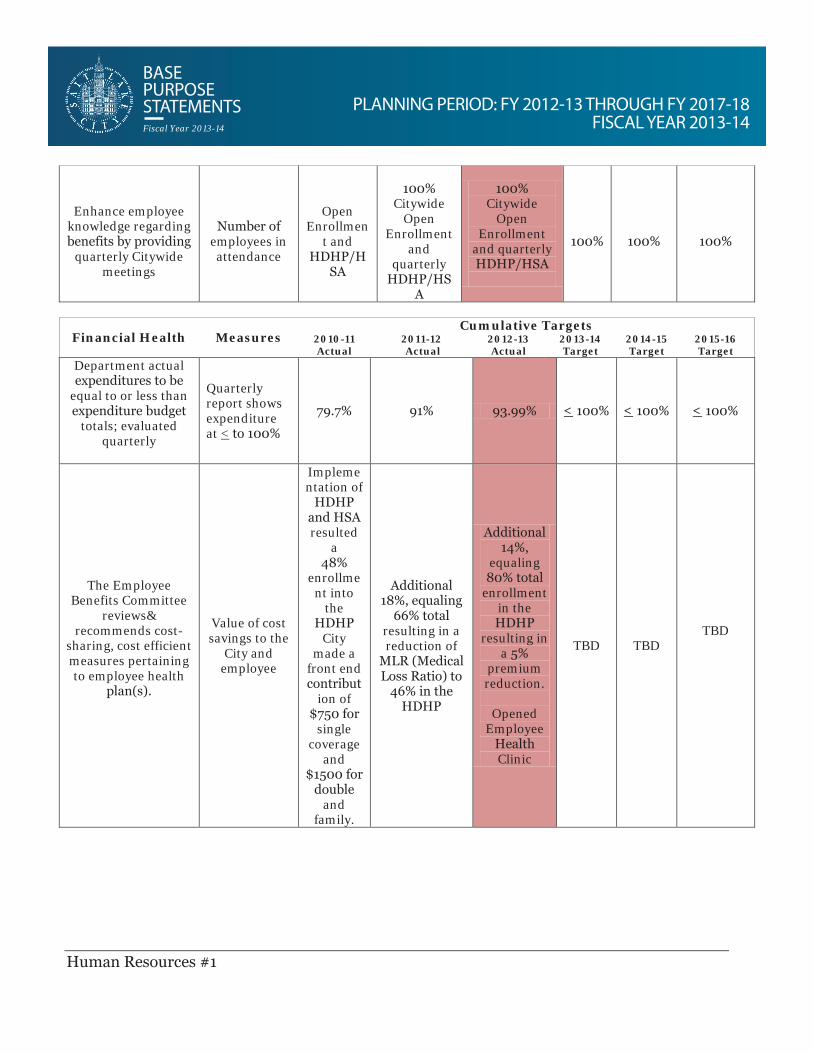
Enhance employee knowledge regarding benefits by providing
quarterly Citywide meetings
Number of employees in attendance
Open Enrollmen
t and HDHP/H
SA
100% Citywide
Open Enrollment
and quarterly
HDHP/HSA
100% Citywide
Open Enrollment
and quarterly HDHP/HSA
100% 100% 100%
Financial Health MeasuresCumulative Targets
2010-11Actual
2011-12Actual
2012-13Actual
2013-14Target
2014-15Target
2015-16Target
Department actual expenditures to be
equal to or less than expenditure budget
totals; evaluated quarterly
Quarterly report shows expenditure at < to 100%
79.7% 91% 93.99% < 100% < 100% < 100%
The Employee Benefits Committee
reviews& recommends cost-
sharing, cost efficient measures pertaining to employee health
plan(s).
Value of cost savings to the
City and employee
Implementation of
HDHP and HSA resulted
a48%
enrollment into
the HDHP
City made a
front end contribut
ion of $750 for
single coverage
and $1500 for
double and
family.
Additional 18%, equaling
66% total resulting in a reduction of
MLR (Medical Loss Ratio) to
46% in the HDHP
Additional 14%,
equaling 80% total
enrollment in the HDHP
resulting in a 5%
premium reduction.
Opened Employee
Health Clinic
TBD TBDTBD

PLANNING PERIOD: FY 2012-13 THROUGH FY 2017-18FISCAL YEAR 2013-14
BASEPURPOSESTATEMENTSFiscal Year 2013-14
Human Resources #1
Efficiency/Effectiveness
Measures
Cumulative Targets2010-11Actual
2011-12 Actual 2012-13 Actual 2013-14
Target
2014-15Target
2015-16Target
Review and updateHR Policies and
Procedures annually.
Track total # of policies
reviewed each year.
Reviewed/
updated three
policies including
: Compens
ation, Drug & Alcohol
and Compens
ation Guideline
s
Reviewed 3 policies
Reviewed 1 policy
Review 3-5polici
es
Review 3-5
policies
Review 3-5
policies
Transfer employees from a manual
insurance enrollment to a web
based on line enrollment through
PEHP
Report number of on line new hire enrollments,
mid-year changes and
Open Enrollment
changes
142 employee
s made their
change through
the PEHP
website on line
enrollment
100% made open
enrollment changes and enrolled as a
new hire
100% Open Enrollment,
new hire enrollment
and midyear changes.
100% Open Enrollmen
t , new hire
enrollment and midyear
changes
100% Open
Enrollment , new
hire enrollme
nt and midyear changes
100% Open Enrollment ,
new hire
enrollment and
midyear
changes
Monitor citywide turnover.
Report turnover at least once annually. Goal to
maintain turnover at
<10%.
5.79% 6.37% 5.77% <10% <10% <10%
Maintain average pay levels for each
salary benchmark to at least 95% of
market for 100% of all salary
benchmarks.
Report the number of
salary benchmarks which are 5% or more below market & the
Five salary
benchmarks were
identified as
significan
Six salary benchmarks
were identified as lagging
slightly behind market (>5 or more). FY12-
FY13-14budget
included appropriation
for salary adjustments
for employees
TBD TBD TBD

PLANNING PERIOD: FY 2012-13 THROUGH FY 2017-18FISCAL YEAR 2013-14
BASEPURPOSESTATEMENTSFiscal Year 2013-14
Human Resources #1
number and degree of
benchmarks adjusted
tly below market (>10%
market); seven salary
benchmarks were
identified as 5-10%
below market.
FY12 budget
included appropriation for
salary adjustme
nts for those most
significantly below market.
13 budget included
appropriation for salary
adjustments for employees
in jobs associated with all six benchmark
groups.
in jobs associated
with benchmarks
lagging slightly behind
market.
FMLA Compliance 100% compliance
New tracking system
launched and
implement August
2011.
Track, audit & report on
FMLA utilization citywide.
Track, audit & report on
FMLA utilization citywide.
100% 100% 100%

PLANNING PERIOD: FY 2012-13 THROUGH FY 2017-18FISCAL YEAR 2013-14
BASEPURPOSESTATEMENTSFiscal Year 2013-14
Human Resources #1
Workforce Quality
MeasuresCumulative Targets
2010-11Actual
2011-12Actual
2012-13Actual
2013-14Target
2014-15Target
2015-16Target
Supervisor Training
100% of supervisors
receive Supervisor Training by
end of FY2013 (cumulatively
)
120 participa
nts complete
dtraining.
Fire has 20 employees
who completed Leadership Training.
70 Employees
have completed abbreviate Leadership Training. There are
currently 50 employees from other
depts. attending
the sessions.
30supervisors completed the series.
68 employees attended
part of the series.
Approx. 56potential
supervisors in Fire Dept. completed
abbreviatedsession.
TBD TBD TBD
Increase diversity of the City’s workforce by ensuring that the City’s job applicant
pool matches or exceeds Wasatch Front workforce
(WFW) statistics.
Applicant Pool
demographics will match or
exceed the available
WFW statistics for
at least 75% of all job
recruitments.
Began quarterly tracking
& reporting
to compare
race & gender
statistics associate
d with the actual number
of job applicant
scompare
d to available
WFW.
Quarterly tracking & reporting
statistics by gender & ethnicity
Applicant Pool
statistics –Caucasian,
71.7%, African
America, 2.3%;
Hispanic Latino, 12.8%; Asian/Pacific
Islander, 4.4%;
American Alaskan Indian, 4.2%;
Unknown,4.6%
Report averag
eannual statistics by
gender &
ethnicity.
Report averag
eannual statistics by
gender &
ethnicity.
Report average annual
statistics by gender & ethnicity.
Enhance department’s ability
Average # of business days
n/aAverage of 3
business Average of
1.5 business < 10 < 10 < 10
PLANNING PERIOD: FY 2012-13 THROUGH FY 2017-18FISCAL YEAR 2013-14
BASEPURPOSESTATEMENTSFiscal Year 2013-14
Human Resources #1
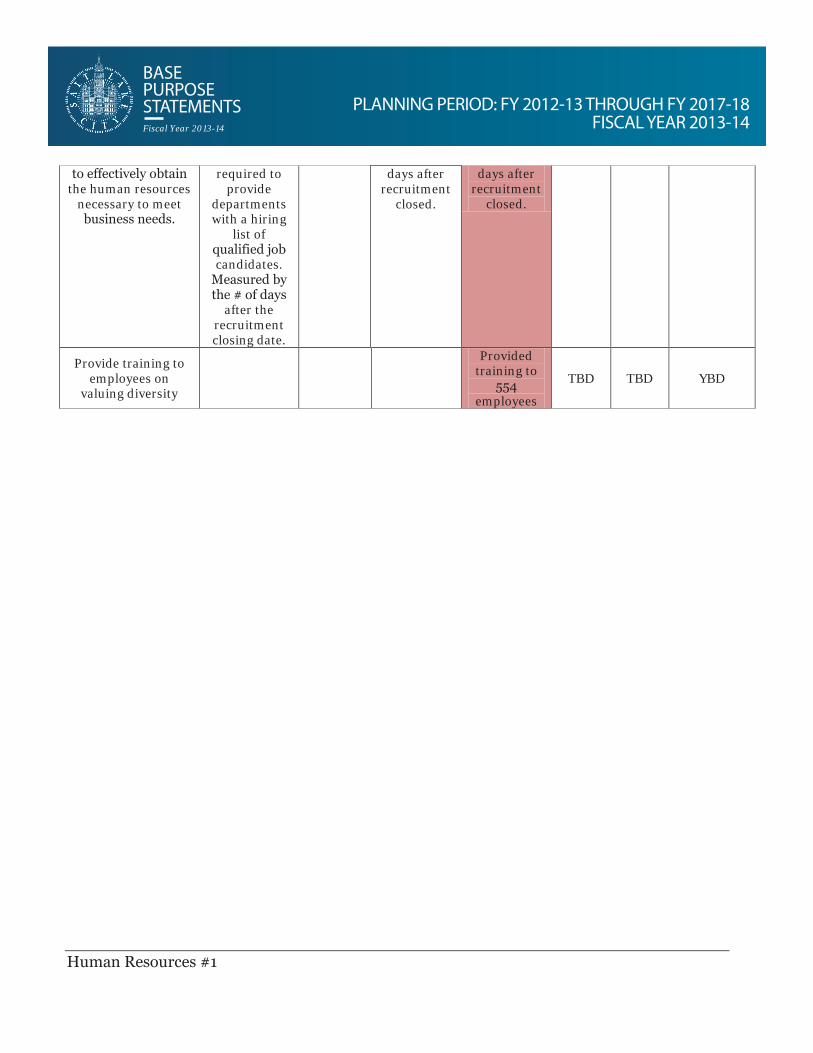
to effectively obtain the human resources
necessary to meet business needs.
required to provide
departments with a hiring
list of qualified job candidates.
Measured by the # of days
after the recruitment closing date.
days after recruitment
closed.
days after recruitment
closed.
Provide training to employees on
valuing diversity
Provided training to
554 employees
TBD TBD YBD

PLANNING PERIOD: FY 2012-13 THROUGH FY 2017-18FISCAL YEAR 2013-14
BASEPURPOSESTATEMENTSFiscal Year 2013-14
Human Resources #2
FUND: General Fund 100% COST CENTER NUMBERS: 16-00039
DEPARTMENT: Administrative Services
FTE / 1.00
DIVISION: Civilian Review Board
BUDGET /$146,112
COST CENTER / PROGRAM:
Civilian Review Board
REVENUE $0
AUTHORITY: (ordinance, state statute, federal regulation, basic municipal function, etc)
STATEMENT OF PURPOSE:
To provide the investigative and administrative support to the appointed citizen Police Civilian Review Board.
BASE PURPOSE STATEMENTS
To audit and review all cases in which it is claimed that a police officer used excessive force and such other cases as the Board in its discretion may request. Such audits and review are intended to foster trust between the community and law enforcement personnel and to assure fair treatment of police officers.
To present findings to the appointed Police Civilian Review Board who, through a panel of members make final case determination which is then passed on to the Police Chief who has final decision of case.
To benchmark with existing national standards and work processes from other entities in the Country that have similar boards.
BASE PURPOSE REVENUE
N/A
SIX YEAR BUSINESS PLAN GOALS
Efficiency/Effectiveness MeasuresCumulative Targets
2010-11 Actuals
2011-12 Actuals
2012-13 Actuals
2013-14
Target
2014-15
Target
2015-16
TargetProvide maximum customer service in the course of the investigative process.
Program/Cost Center staff will be trained in customer service skills once every three years.
100% 100% 100% 100% 100% 100%

DEBRA ALEXANDER RALPH ECKER
DIRECTOR DEPARTMENT OF" HUMAN RESOURCE 03/\1383tt M OR
CITY COUNCIL TRANSMITTAL SCANNED TO: ftftljt SCANNED BY~/Ja/&l, DATE: ~-/d-/5
Date Received: ;:Jt'l/Wt;. Date sent to Council: ~ J /J f Ute;
TO: Salt Lake City Council
Luke Garrott, Chair ~·
FROM: Debra Alexander, Director Human Resources Department
DATE: March 10, 2015
SUBJECT: 2015 Citizens' Compensation Advisory Committee (CCAC) Annual Report
STAFF CONTACT: Debra Alexander, HR Director (801) 535-6604
David Salazar, HR Compensation Program Manager (801) 535-7906
COUNCIL SPONSOR: Exempt
DOCUMENT TYPE: Annual Report
RECOMMENDATION: This report is for informational purposes. Consideration should be given during the City's annual budget review process, as it relates to employee compensation. The City Council will receive a formal presentation of the annual report by the Committee's Chair, Ms. Connie Spyropoulos-Linardakis, during a Council work session; presentation date tentatively scheduled on March 24, 2015
BUDGET IMP ACT: n/a
BACKGROUND/DISCUSSION: This report includes information and recommendations pertaining to the total compensation for the city's elected officials and employees, as required by city ordinance (City Code, Title 2, Chapter 2.35- Citizen's Compensation Advisory Committee (CCAC)
451 SOUTH STATE STREET, ROOM 115, SAL.T L.AKE CITY,· UTAH 84114·5464
MAIL.ING ADDRESS: P.O. BOX 145464, SAL.T L.AKE CITY, UTAH 84114·5464
TELEPHONE: BO 1·535·79DO F"AX: BO 1·535·6614

The following recommendations and information are highlighted in this year's report-
• As funds permit, the Committee strongly recommends appropriations for market salary adjustments for employees in eight salary benchmarks shown to lag market-including first priority for benchmarks specified as significantly below market; and, second priority for benchmarks specified as slightly below market;
• Consideration of a 3.0% total salary budget to be allocated merit-based pay increases that accelerate employees' pay through their respective salary ranges.
• The Committee strongly recommends limiting pay increases for those employees whose pay rates are equal to or above established City market rates and holding the maximum pay rates at a zero increase, including those classified in 17 salary benchmarks (and their related jobs) cited in the report as being paid significantly above market;
• A recommendation to consider other pay alternatives in lieu of cost-of-living adjustments, and instead reserve limited funding available to focus on providing actual pay and salary range adjustments necessary to allow the City to remain competitive with other employers;
• Special reports on pay for: Elected Officials, Department Directors & other key city leaders; also, Fire & Police;
• Commendation on the City's success containing health insurance premium and plan costs related to implementation and administration of a high-deductible health plan (HDHP) option, which now covers a reported 88% of City employees and their eligible dependents. To sustain success and interest in the plan, the Committee encourages the City to continue to provide front-loaded, employer contributions to employee health savings accounts.
• Review of the 2014 analysis, results & findings from a third-party employee benefits market study conducted by the Hay Group.
PUBLIC PROCESS: nla

2015
CITIZENS’
COMPENSATION
ADVISORY
COMMITTEE (CCAC) Salt Lake City Corporation
ANNUAL REPORT
CCAC ANNUAL REPORT
March 2015
1
Executive Summary The Citizens’ Compensation Advisory Committee (CCAC) was formed with the purpose of “…evaluating the total compensation levels of the city's elected officials, executives and employees and making recommendations to the human resources department, mayor and the city council…” (City Code Title 2, Chapter 2.35.060). Each year the Committee is responsible for preparing and submitting a written report to the Mayor and City Council containing, among other things, recommendations of the “appropriate competitive position for the city relative to the compensation practices of comparable employers”, “wages and benefits of the city’s elected officials, executives and employees” and “general recommendations regarding the mix of compensation for the city’s employees, e.g., base salary, benefits, incentives” (City Code Title 2, Chapter 2.35.060.A.6) Based upon a review of current economic trends, market data and other significant considerations, the Committee now recommends the Mayor and City Council consider the following when deciding appropriate measures to be taken regarding the City’s total compensation plan:
1. As a standard, the Committee feels confident the best possible outcomes can be achieved if the City continuously strives to maintain an actual average pay position of no less than 95% compared to the pay levels of other employers with whom the City most directly competes.
2. Based upon current market comparisons of actual average pay, the Committee is confident with regard to the City’s overall pay position relative to market. For the majority of salary benchmarks surveyed Salt Lake City Corporation’s actual average base pay rates are appropriately compared to and generally match or exceed the local market. Over the past year improvement has been made in the position to market for some benchmarks, demonstrated by the reduction of jobs lagging the market from the year prior. Among the 58 salary benchmarks surveyed, actual average pay for 17 (or 29%) of the City’s benchmarks significantly lead the market by more than 10% -- compared to 20 benchmarks in this same category last year (see page 9). HOWEVER, current market data also indicates a total of eight salary benchmarks which lag the market, including four benchmarks that lag significantly, which is more than ten percent below market; and, four benchmarks that lag slightly, which is between 5-10% less than market average (see page 10). In addition, as noted with more detail in this report, the Committee also reviewed two benchmarks considered to be anomalies due to extreme differences in

CCAC ANNUAL REPORT
March 2015
2
survey results. These include the General Maintenance Worker IV and Paralegal benchmarks. Although both lead in comparison to other local government employers, the average actual pay rates of City job incumbents appear to simultaneously significantly lag when compared to their counterparts in the private sector. The Committee strongly encourages City officials to assess what, if any, potential attraction and/or retention issues this unique situation causes and make adjustments, as needed. As funds permit and following similar approaches by the City, the Committee strongly recommends the Mayor and City Council appropriate financial resources necessary to grant special market salary adjustments for employees in benchmark jobs identified in this report as lagging behind market. First priority should be given to those lagging significantly; second priority should be given to those lagging slightly behind market. The Committee recommends implementing market pay adjustments incrementally for incumbents in job benchmark groups designated as lagging market significantly.
3. In consideration of the salary budget forecast available at the time of this report, the Committee advises the City consider a total 3.0% salary budget to be allocated for merit-based pay increases. This recommendation is intended to ensure and maintain the City’s current market competitiveness, especially as it pertains to attracting and retaining high level performers and critical talent. The Committee asserts that effective implementation of budgeted salary increases should be influenced by the following considerations: a) When granting individual wage & salary increases, the Committee
strongly recommends the Administration consider the best practice of granting pay increases that accelerate employees pay through the first and second quartiles of their respective salary ranges, up to and including the City’s established control point or City market rate;
b) For those employees whose pay rates are equal to or above established
City market rates, pay increases, if any, should be limited to smaller increments (not to exceed range maximum); and,
c) For those employees whose pay is at (or above) maximum rates, the
Committee recommends a zero increase; instead, the Committee suggests consideration of lump sum awards such as a longevity bonus or other award in lieu of a base wage or salary increase.
d) Finally, except for the Police Officer and Firefighter benchmarks, potential
concerns arise when comparing the City’s actual average pay for the those benchmarks shown to significantly lead the market. Where market salary data indicate the City’s actual average pay significantly

CCAC ANNUAL REPORT
March 2015
3
leads the average pay offered by other employers, the Committee cautions and advises the City to reconsider its policies and any pay decisions which may compound this issue, especially when considering the value of benefits offered to City employees is at the 75% percentile as compared to other Utah employers. In these cases, the Committee strongly recommends holding the maximum pay rates of these benchmarks (and related) jobs at a zero increase until which time City market rates more closely align with other employers.
e) Considering Salt Lake City’s increasing status as one among the largest
and most relevant cities in the Mountain region, the Committee recommends City leaders also contemplate regional wage data when considering public safety pay decisions (i.e. Fire & Police). As an additional source, this information provides city officials with another perspective of current pay rates for sworn personnel, which the Committee believes should be considered along with local market data.
4. Again, the Committee strongly recommends the City consider pay alternatives
to cost-of-living adjustments (COLA), and, instead, reserve limited funding available to focus on providing actual pay & salary range adjustments necessary to allow the City to remain competitive with other employers; especially in cases where current data indicates a significant lag in actual employee pay and/or established job salary ranges.
5. Across all industries pay for performance continues to be a recognized standard and criterion for setting employee pay. Although no citywide plan or program presently exists, the Committee wishes to continue to encourage efforts to identify and implement the best practices found among other public employers.
6. For the majority of City department directors and other key city leaders, a comparative analysis with similar U.S. cities indicates that current salaries are competitive. The Committee advises the Administration to consider action, if any, for Directors where data indicates that annual salaries lag by more than ten percent. Consideration of pay increases for all others should include the same general salary increase, if any, given to all other employees.
7. The Committee finds the present salaries for the Mayor and City Council to be appropriate when compared to the salaries of elected officials in similar U.S. cities. Therefore, the only salary adjustment recommended for these officials would be the same general salary increase, if any, given to all other employees.
8. The Committee commends the City for its success containing health insurance premium and related plan costs by continuing to offer a high-deductible health plan (HDHP) option, which now covers a reported 88% of City employees and their eligible dependents. This total reflects an annual increase of 8% compared

CCAC ANNUAL REPORT
March 2015
4
to the number enrolled last year. To sustain and promote employee interest in this type of plan, the Committee encourages City officials to continue to provide front-loaded employer contributions to qualified health savings accounts (HSA’s) for employees enrolled in the high-deductible plans.
9. Except for those noted as lagging market, the Committee finds the City’s overall mix of wages, salaries and employer-provided benefits (known as total rewards or total compensation) to be competitive to highly competitive when compared to other local employers.
10. Furthermore, continuing to rely upon the 2014 findings and results of the City benefits market analysis conducted by the Hay Group, the Committee recommends that leaders strive to maintain a full range of benefits that is around the 75th percentile when compared in aggregate to the Utah market. Maintaining this position not only enhances total compensation for employees, but strengthens the City’s overall competitive advantage.
We are hopeful that these recommendations and the detailed information contained within this report are both helpful and beneficial to the City, its leaders, and administration during the important decision-making process ahead. Respectfully,
Citizens’ Compensation Advisory Committee Connie Spyropoulos-Linardakis, Chair Kerma Jones John Mathews Cori Petersen Dale Cox Frances Hume Jennifer Seelig
CCAC ANNUAL REPORT
March 2015
5
Introduction In conjunction with its role as a local government employer, Salt Lake City Corporation is responsible for maintaining a workforce capable of providing for the public safety and well-being of its residents, visitors and business community at large. Success in fulfilling this part of the City’s mission depends in large part upon elected officials’ and public administrators’ ability to make informed and fiscally-responsible decisions with regard to the total rewards offered in the form of compensation and benefits to City employees. This report is intended to aid City officials when determining appropriate compensation and benefit levels, including the pay practices necessary to effectively attract, motivate and retain the human resources required to carry out the City’s mission-critical goals and objectives. This Committee believes the primary mix of indicators upon which the City should rely when making these key decisions include: current economic indicators, pay trends and comparative market data analysis, as conveyed and included in the recommendations of this report. Specific sections in this report include the following:
1) City compensation philosophy 2) 2015 economic outlook, including salary budget projections 3) Market wage & salary analysis 4) Special Reports including: Fire & Police; Elected Officials, Department Directors &
Other Key City Leaders; and Employee Benefits Value 5) Appendices (including a detailed comparative market data analysis by salary
benchmark) City Compensation Philosophy Whether public or private, every employer must find ways to effectively attract, motivate and retain the human resources necessary to carry out its mission-critical goals and objectives. The degree to which an employer succeeds in this endeavor is tied directly to their decision to match, lead or lag the comparative pay levels offered by competing employers. Whether informal or deliberate, pay decisions, practices and policies formulate the basis of any organization’s compensation philosophy. Unlike private employers, City leaders are under pressure to make pay decisions that support the tenuous balance between the competitive pay fairness that employees seek and the fiscal responsibility demanded by taxpayers. To this end, this Committee is confident that the best possible outcomes can be achieved if the City strives to maintain an actual average pay position of no less than 95% compared to the actual average pay offered by other employers with whom the City most directly competes. Furthermore, when qualified human resources are both abundant and readily available from within the
CCAC ANNUAL REPORT
March 2015
6
local area, the Committee affirms that comparing wages and benefits of other Utah employers is most often an adequate approach. Considering the City’s present success in attracting large applicant pools (drawn primarily from along the Wasatch Front), highly competitive wages (and benefits value) and low turnover—measured during FY 2014 at 7.3%-- there is good evidence to support and demonstrate that the City’s existing compensation strategy is working. The Committee acknowledges there may be specific situations or circumstances when the City’s needs, even as a public employer, call for higher than average wages in order to attract the right talent. Factors such as a larger magnitude, higher volumes, and unique challenges associated with delivering services to Utah’s capital city may call for Salt Lake City to promote itself as a local pay leader, such as with Police, Fire and other jobs that are exclusive to the public sector. Other considerations include situations when jobs require highly-specialized or scarce skills, training, education and/or experience. 2015 Economic Outlook
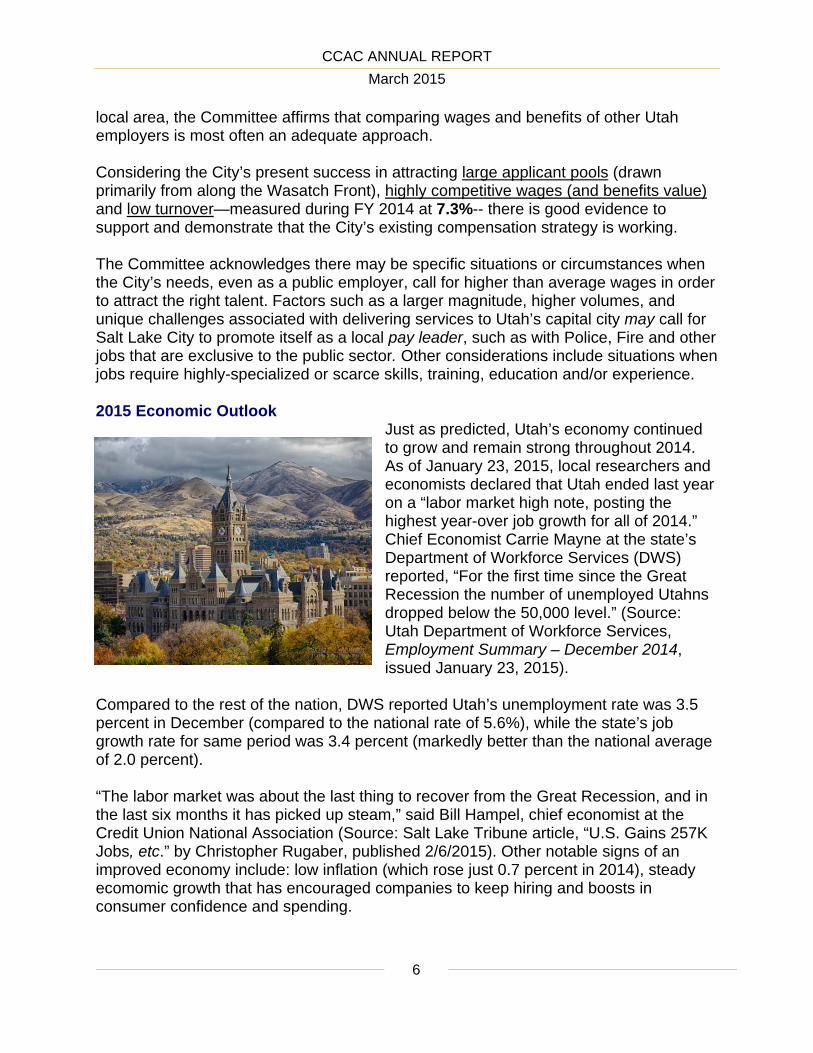
Just as predicted, Utah’s economy continued to grow and remain strong throughout 2014. As of January 23, 2015, local researchers and economists declared that Utah ended last year on a “labor market high note, posting the highest year-over job growth for all of 2014.” Chief Economist Carrie Mayne at the state’s Department of Workforce Services (DWS) reported, “For the first time since the Great Recession the number of unemployed Utahns dropped below the 50,000 level.” (Source: Utah Department of Workforce Services, Employment Summary – December 2014, issued January 23, 2015).
Compared to the rest of the nation, DWS reported Utah’s unemployment rate was 3.5 percent in December (compared to the national rate of 5.6%), while the state’s job growth rate for same period was 3.4 percent (markedly better than the national average of 2.0 percent). “The labor market was about the last thing to recover from the Great Recession, and in the last six months it has picked up steam,” said Bill Hampel, chief economist at the Credit Union National Association (Source: Salt Lake Tribune article, “U.S. Gains 257K Jobs, etc.” by Christopher Rugaber, published 2/6/2015). Other notable signs of an improved economy include: low inflation (which rose just 0.7 percent in 2014), steady ecomomic growth that has encouraged companies to keep hiring and boosts in consumer confidence and spending.
CCAC ANNUAL REPORT
March 2015
7
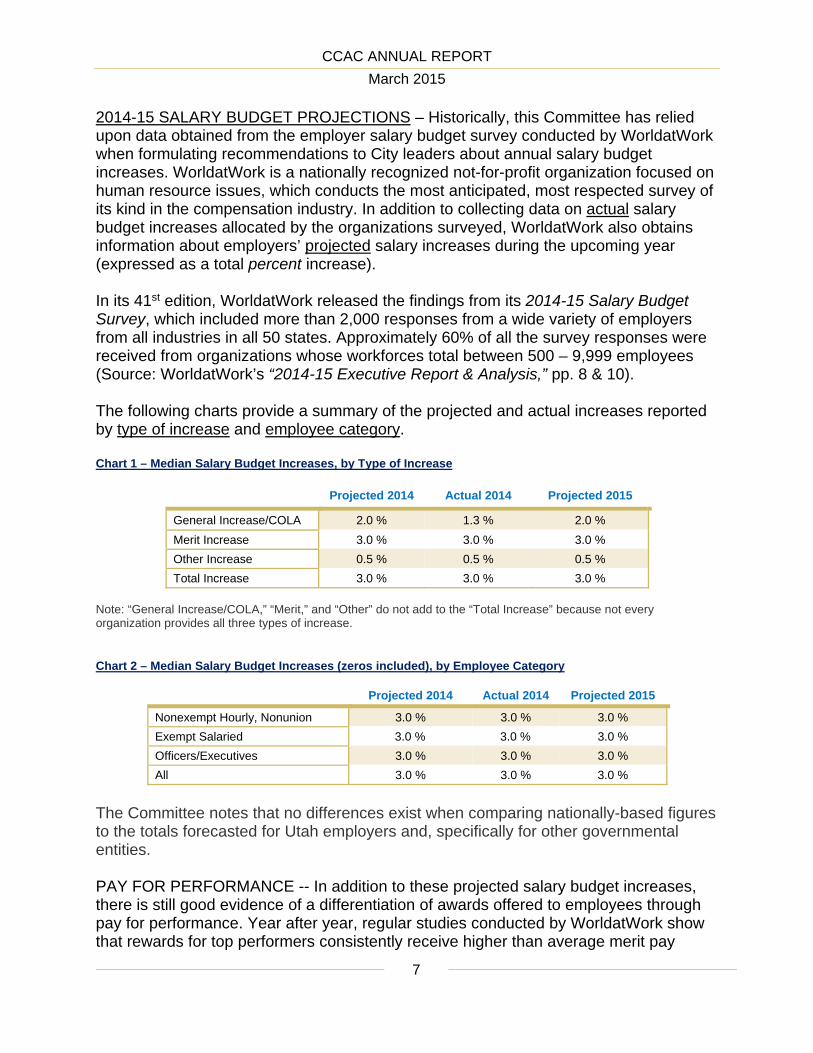
2014-15 SALARY BUDGET PROJECTIONS – Historically, this Committee has relied upon data obtained from the employer salary budget survey conducted by WorldatWork when formulating recommendations to City leaders about annual salary budget increases. WorldatWork is a nationally recognized not-for-profit organization focused on human resource issues, which conducts the most anticipated, most respected survey of its kind in the compensation industry. In addition to collecting data on actual salary budget increases allocated by the organizations surveyed, WorldatWork also obtains information about employers’ projected salary increases during the upcoming year (expressed as a total percent increase). In its 41st edition, WorldatWork released the findings from its 2014-15 Salary Budget Survey, which included more than 2,000 responses from a wide variety of employers from all industries in all 50 states. Approximately 60% of all the survey responses were received from organizations whose workforces total between 500 – 9,999 employees (Source: WorldatWork’s “2014-15 Executive Report & Analysis,” pp. 8 & 10). The following charts provide a summary of the projected and actual increases reported by type of increase and employee category. Chart 1 – Median Salary Budget Increases, by Type of Increase
Projected 2014 Actual 2014 Projected 2015
General Increase/COLA 2.0 % 1.3 % 2.0 %
Merit Increase 3.0 % 3.0 % 3.0 %
Other Increase 0.5 % 0.5 % 0.5 %
Total Increase 3.0 % 3.0 % 3.0 %
Note: “General Increase/COLA,” “Merit,” and “Other” do not add to the “Total Increase” because not every organization provides all three types of increase.
Chart 2 – Median Salary Budget Increases (zeros included), by Employee Category
Projected 2014 Actual 2014 Projected 2015
Nonexempt Hourly, Nonunion 3.0 % 3.0 % 3.0 %
Exempt Salaried 3.0 % 3.0 % 3.0 %
Officers/Executives 3.0 % 3.0 % 3.0 %
All 3.0 % 3.0 % 3.0 %
The Committee notes that no differences exist when comparing nationally-based figures to the totals forecasted for Utah employers and, specifically for other governmental entities. PAY FOR PERFORMANCE -- In addition to these projected salary budget increases, there is still good evidence of a differentiation of awards offered to employees through pay for performance. Year after year, regular studies conducted by WorldatWork show that rewards for top performers consistently receive higher than average merit pay
CCAC ANNUAL REPORT
March 2015
8
increases compared to those given to average performers. WorldatWork notes that if merit increase projections are accurate, differentiation between middle and high performers will expand to 152 percent. The Committee recognizes that no such pay for performance program exists citywide, but is utilized by a few City departments. We believe that such programs, if administered effectively, have the potential to enhance the City’s ability to not only motivate, but also retain top talent upon which the City relies. Market Wage & Salary Analysis As a matter of regular practice, the Committee considered comparative data (wages & salaries only) obtained from two Wasatch Front-based survey groups: 1) the 2014 Salt Lake Area Survey, conducted by the Western Management Group (WMG); and, 2) Wasatch Compensation Group’s (WCG) TechNet system. The Salt Lake Area Survey included 105 participants, the majority of whom are large private or public employers with operations along the Wasatch Front. Data gathered from the Wasatch Compensation Group (WCG) comes exclusively from other Utah public employers, including local municipalities, counties and special districts, who serve populations of approximately 40,000 or more along the Wasatch Front. A complete list of all employers considered for salary comparative purposes is shown in Appendix B of this report. Where appropriate, additional salary data was also collected in special surveys conducted by the Human Resources Department for certain key positions where the City competes regionally and/or nationally, such as for City Planners. Among the City’s more than 830 individual job titles, the Committee reviewed wage & salary data for 58 salary benchmarks. The Committee reviewed a comparison of actual average pay for all benchmark jobs and focused especially on those for which data shows the City either leads or lags market. As noted in previous years, potential concerns arise when comparing the City’s actual average pay for benchmark jobs which significantly lead market. Jobs in this category are defined as those for which actual average pay is ten percent or more above market. In these cases, the Committee cautions City leaders to note that when significantly leading pay is combined with a highly competitive mix of benefits (such as the City has), the likely result is a total compensation value (i.e. the total of base pay and benefits combined) that may be considered overly excessive. Reason for such caution is especially vital in cases when the City competes for talent directly with private sector employers. With the exceptions of the Firefighter and Police Officer jobs (for which the City desires to be a pay leader), the Committee cautions and advises leaders to reconsider its
CCAC ANNUAL REPORT
March 2015
9
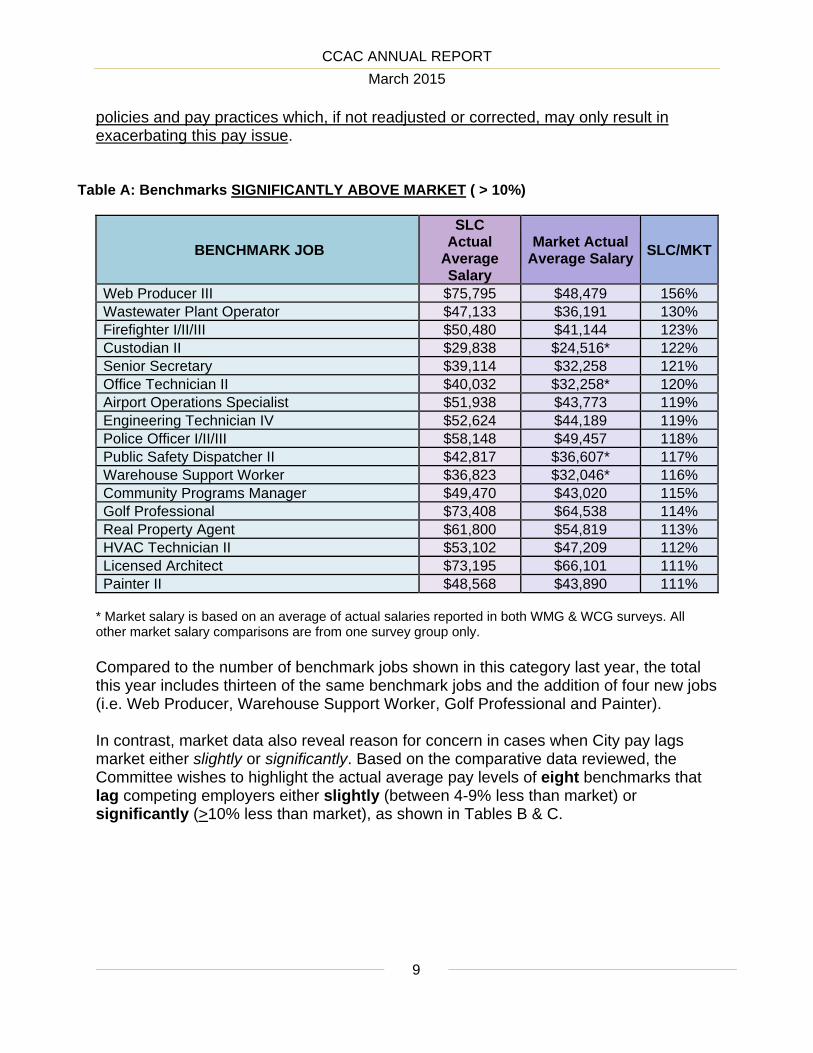
policies and pay practices which, if not readjusted or corrected, may only result in exacerbating this pay issue.
Table A: Benchmarks SIGNIFICANTLY ABOVE MARKET ( > 10%)
BENCHMARK JOB
SLC Actual
Average Salary
Market Actual Average Salary
SLC/MKT
Web Producer III $75,795 $48,479 156% Wastewater Plant Operator $47,133 $36,191 130% Firefighter I/II/III $50,480 $41,144 123% Custodian II $29,838 $24,516* 122% Senior Secretary $39,114 $32,258 121% Office Technician II $40,032 $32,258* 120% Airport Operations Specialist $51,938 $43,773 119% Engineering Technician IV $52,624 $44,189 119% Police Officer I/II/III $58,148 $49,457 118% Public Safety Dispatcher II $42,817 $36,607* 117% Warehouse Support Worker $36,823 $32,046* 116% Community Programs Manager $49,470 $43,020 115% Golf Professional $73,408 $64,538 114% Real Property Agent $61,800 $54,819 113% HVAC Technician II $53,102 $47,209 112% Licensed Architect $73,195 $66,101 111% Painter II $48,568 $43,890 111%
* Market salary is based on an average of actual salaries reported in both WMG & WCG surveys. All other market salary comparisons are from one survey group only. Compared to the number of benchmark jobs shown in this category last year, the total this year includes thirteen of the same benchmark jobs and the addition of four new jobs (i.e. Web Producer, Warehouse Support Worker, Golf Professional and Painter). In contrast, market data also reveal reason for concern in cases when City pay lags market either slightly or significantly. Based on the comparative data reviewed, the Committee wishes to highlight the actual average pay levels of eight benchmarks that lag competing employers either slightly (between 4-9% less than market) or significantly (>10% less than market), as shown in Tables B & C.

CCAC ANNUAL REPORT
March 2015
10
Table B: Benchmarks SIGNIFICANTLY BELOW MARKET (> -10%)
SLC SALARY BENCHMARK SLC Actual
Average Salary
Market Actual Average Salary
SLC/MKT
Metal Fabrication Technician (Welder) $47,736 $57,586 83% Appointed Senior City Attorney $112,921 $126,215 89% Engineer IV $69,346 $78,082 90% Software Engineer $85,094 $94,696 90%
Table C: Benchmarks SLIGHTLY BELOW MARKET (-4 % to -9%)
SLC SALARY BENCHMARK SLC Actual
Average Salary
Market Actual Average Salary
SLC/MKT
Financial Analyst III $67,594 $74,357 91% Water Meter Reader II $32,661 $35,670 92% Evidence Technician II $37,244 $40,210 93% Senior Human Resources Consultant $67,974 $73,462 93%
* Market salary is based on an average of actual salaries reported in both WMG & WCG surveys. All other market salary comparisons are from one survey group only. The Committee also focused on two benchmarks considered to be anomalies due to extreme differences in survey results, including General Maintenance Worker IV and Paralegal. Although both lead in comparison to other local government employers, the average actual pay rates of City job incumbents simultaneously appear to significantly lag when compared to their counterparts in the private sector. The Committee strongly encourages City officials to assess what, if any, potential attraction and/or retention issues may arise due to this unique situation and make adjustments, as needed. Table D: Benchmarks SLIGHTLY BELOW MARKET (-4 % to -9%)
SLC SALARY BENCHMARK SLC Actual
Average Salary
WCG Average Salary
SLC/ WCG
WMG Average Salary
SLC/MKT
General Maintenance Worker IV $44,544 $37,043 120% $53,185 84% Paralegal $50,471 $46,185 109% $59,716 85%
A complete summary of the 2014 SLC/Market survey results for all 58 job salary benchmarks reviewed by the Committee is shown in Appendix A of this report. In presenting this compensation survey data, we repeat our usual cautions: Due to many uncontrollable variables, salary survey results alone should be seen only as indicators, not absolutes.

CCAC ANNUAL REPORT
March 2015
11
To maintain a competitive compensation system, the Committee urges City leaders to also consider effective means for steadily advancing employees through their respective pay ranges, up to the City’s established market rate. Best compensation-related business practices rely on factors such as pay for performance, enhanced competency and market competitiveness when determining frequency and amounts of pay increases. Failure to implement a plan for advancing employee pay most often has negative impact and results in issues such as pay compression, loss in competitiveness and increased turnover due to employee dissatisfaction. SPECIAL REPORTS FIRE & POLICE—Previously in this report, the Committee suggested that the City consider itself a local pay leader when evaluating compensation levels for Police and Fire personnel. Although acting as a pay leader doesn’t necessarily equate to offering the highest pay, the Committee believes that operating under this philosophy better enables the City to more effectively attract and retain the most highly desired talent available from the local workforce. Further support for the idea of Salt Lake City acting as a local area pay leader includes factors such as—the City’s large downtown area and increased weekday business population; broad infrastructure; high call volumes, and the complex logistics required to protect and serve Utah’s capital city. All are traits that make Salt Lake City unique when compared to other local jurisdictions.
With a continuance of lower than average turnover rates and consistently high numbers of candidates qualified to be placed on the City’s public safety hiring registers, current Firefighter & Police Offer pay levels do not appear to be a hindrance to filling limited position vacancies. As the following table indicates, Salt Lake City is in fact in the desired pay leader position, including the highest average pay for the local area market.
Respondents used in these comparisons include other cities, counties, the State of Utah and special service districts such as Salt Lake County’s Unified Fire Authority and Unified Police Department. All are located along the Wasatch Front and serve populations of approximately 40,000 or more.
CCAC ANNUAL REPORT
March 2015
12
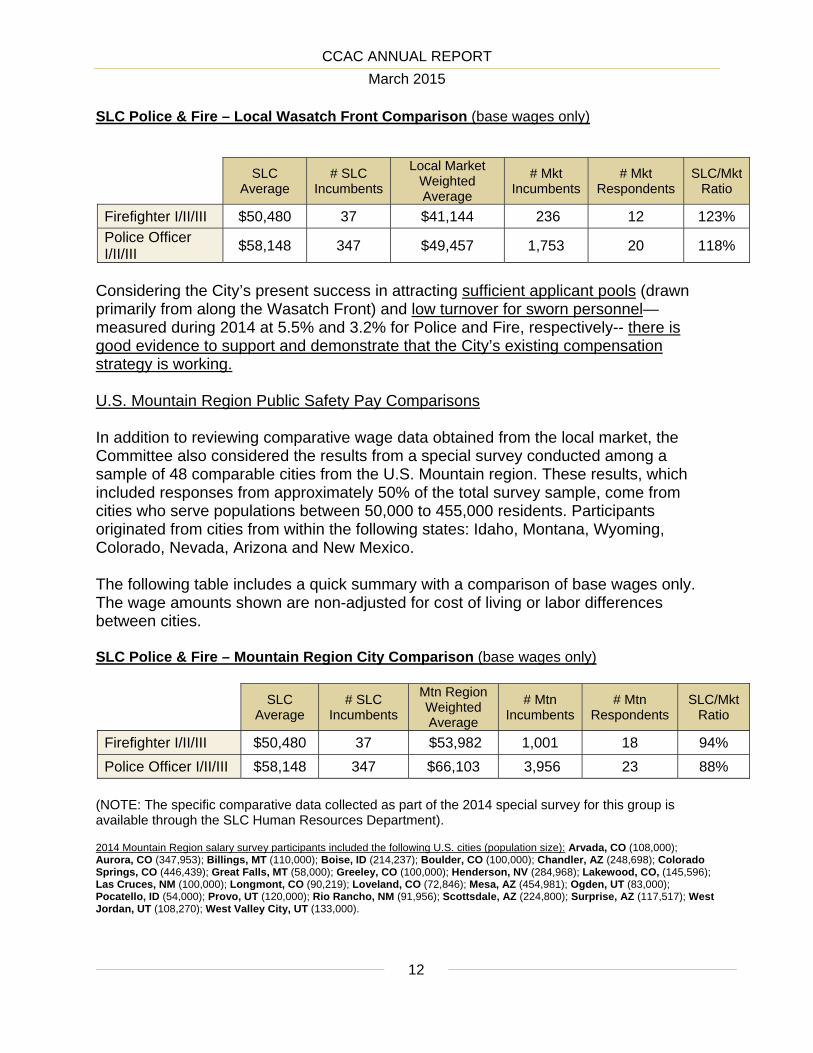
SLC Police & Fire – Local Wasatch Front Comparison (base wages only)
SLC
Average # SLC
Incumbents
Local Market Weighted Average
# Mkt Incumbents
# Mkt Respondents
SLC/Mkt Ratio
Firefighter I/II/III $50,480 37 $41,144 236 12 123%
Police Officer I/II/III
$58,148 347 $49,457 1,753 20 118%
Considering the City’s present success in attracting sufficient applicant pools (drawn primarily from along the Wasatch Front) and low turnover for sworn personnel—measured during 2014 at 5.5% and 3.2% for Police and Fire, respectively-- there is good evidence to support and demonstrate that the City’s existing compensation strategy is working. U.S. Mountain Region Public Safety Pay Comparisons In addition to reviewing comparative wage data obtained from the local market, the Committee also considered the results from a special survey conducted among a sample of 48 comparable cities from the U.S. Mountain region. These results, which included responses from approximately 50% of the total survey sample, come from cities who serve populations between 50,000 to 455,000 residents. Participants originated from cities from within the following states: Idaho, Montana, Wyoming, Colorado, Nevada, Arizona and New Mexico. The following table includes a quick summary with a comparison of base wages only. The wage amounts shown are non-adjusted for cost of living or labor differences between cities. SLC Police & Fire – Mountain Region City Comparison (base wages only)
SLC Average
# SLC Incumbents
Mtn Region Weighted Average
# Mtn Incumbents
# Mtn Respondents
SLC/Mkt Ratio
Firefighter I/II/III $50,480 37 $53,982 1,001 18 94%
Police Officer I/II/III $58,148 347 $66,103 3,956 23 88%
(NOTE: The specific comparative data collected as part of the 2014 special survey for this group is available through the SLC Human Resources Department). 2014 Mountain Region salary survey participants included the following U.S. cities (population size): Arvada, CO (108,000); Aurora, CO (347,953); Billings, MT (110,000); Boise, ID (214,237); Boulder, CO (100,000); Chandler, AZ (248,698); Colorado Springs, CO (446,439); Great Falls, MT (58,000); Greeley, CO (100,000); Henderson, NV (284,968); Lakewood, CO, (145,596); Las Cruces, NM (100,000); Longmont, CO (90,219); Loveland, CO (72,846); Mesa, AZ (454,981); Ogden, UT (83,000); Pocatello, ID (54,000); Provo, UT (120,000); Rio Rancho, NM (91,956); Scottsdale, AZ (224,800); Surprise, AZ (117,517); West Jordan, UT (108,270); West Valley City, UT (133,000).
CCAC ANNUAL REPORT
March 2015
13
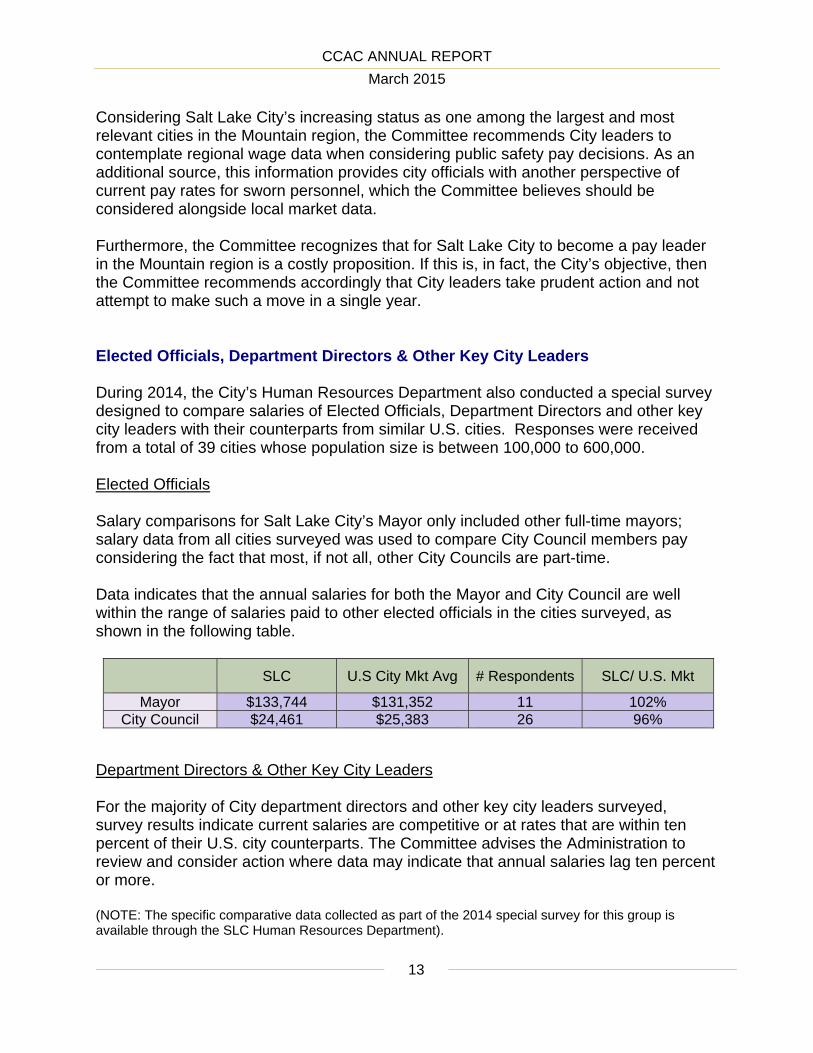
Considering Salt Lake City’s increasing status as one among the largest and most relevant cities in the Mountain region, the Committee recommends City leaders to contemplate regional wage data when considering public safety pay decisions. As an additional source, this information provides city officials with another perspective of current pay rates for sworn personnel, which the Committee believes should be considered alongside local market data. Furthermore, the Committee recognizes that for Salt Lake City to become a pay leader in the Mountain region is a costly proposition. If this is, in fact, the City’s objective, then the Committee recommends accordingly that City leaders take prudent action and not attempt to make such a move in a single year. Elected Officials, Department Directors & Other Key City Leaders During 2014, the City’s Human Resources Department also conducted a special survey designed to compare salaries of Elected Officials, Department Directors and other key city leaders with their counterparts from similar U.S. cities. Responses were received from a total of 39 cities whose population size is between 100,000 to 600,000. Elected Officials Salary comparisons for Salt Lake City’s Mayor only included other full-time mayors; salary data from all cities surveyed was used to compare City Council members pay considering the fact that most, if not all, other City Councils are part-time. Data indicates that the annual salaries for both the Mayor and City Council are well within the range of salaries paid to other elected officials in the cities surveyed, as shown in the following table.
SLC U.S City Mkt Avg # Respondents SLC/ U.S. Mkt
Mayor $133,744 $131,352 11 102% City Council $24,461 $25,383 26 96%
Department Directors & Other Key City Leaders For the majority of City department directors and other key city leaders surveyed, survey results indicate current salaries are competitive or at rates that are within ten percent of their U.S. city counterparts. The Committee advises the Administration to review and consider action where data may indicate that annual salaries lag ten percent or more. (NOTE: The specific comparative data collected as part of the 2014 special survey for this group is available through the SLC Human Resources Department).
CCAC ANNUAL REPORT
March 2015
14
2014 Elected Officials, Department Heads & Other Key City Leaders salary survey participants included the following U.S. cities (population size): Albuquerque, NM (555,417); Anaheim, CA (336,265); Arvada, CO (108,000); Aurora, CO (347,953); Baton Rouge, LA (440,000); Billings, MT (110,000); Boise, ID (214,237); Boulder, CO (100,000); Burbank, CA (104,000); Centennial, CO (104,811); Chandler, AZ (248,698); Colorado Springs, CO (446,439); Denver, CO (634,000); Eugene, OR (159,964); Everett, WA (104,900); Gresham, OR (106,180); Henderson, NV (284,968); Lakewood, CO, (145,596); Las Vegas, NV (619,419); Lincoln, NE (268,738); Mesa, AZ (454,981); New Orleans, LA (369,250); Oklahoma City, OK (580,000); Omaha, NE (434,353); Orlando, FL (255,483); Peoria, AZ (160,000); Portland, OR (603,650); Provo, UT (120,000); Reno, NV (220,000); Salem, OR (157,000); Scottsdale, AZ (224,800); Spokane, WA (210,000); Surprise, AZ (117,517); Tacoma, WA (200,000); Thousand Oaks, CA (128,000); Tulsa, OK (391,906); Vancouver, WA (165,500); West Jordan, UT (108,270); West Valley City, UT (133,000).
Employee Benefits Value In addition to assessing wage and salary information, the Committee is charged with evaluating total compensation of the City’s employees and elected officials. Consideration, therefore, should once again be given to the results of a benefits market analysis conducted by the Hay Group during March 2014. This is the same study which was issued as part of the Committee’s 2014 Annual Report. A review of results of this study should better enable City leaders to do the following:
- Compare the value of the City’s benefits programs with the local market; - Understand the key drivers of cost for the City and the market; - Identify market trends with regard to benefits changes; and, - Make decisions regarding the City’s compensation program in the context of total
compensation. It is important to note that this analysis compared the value of benefits for someone hired today by the City to a new hire in the Utah market (including both private and public sector employees) —ensuring an “apples-to-apples” comparison based on current market conditions. Hay Group’s analysis indicated that the City’s total benefits value is at (or above) the 75th percentile compared to the Utah market. This means that the City’s overall employee benefits offering is valued among the highest 25% of benefit programs provided by competing Utah employers. The total benefits value calculated for Fire & Police is higher than regular SLC employees due primarily to differences in the retirement benefits received. Additional highlights and conclusions regarding the City’s overall benefits value to employees include the following—
- Market position of the City’s health care and retirement benefits, the two primary
drivers of overall market competitiveness, weigh heavily in overall benefit program competitiveness and are above market median relative to the Utah market.

CCAC ANNUAL REPORT
March 2015
15
- Lower than average employee-paid health care contributions (equal to 5% of the total premium) and the City’s front-loaded health savings account (HSA) contributions boost the overall value of the program.
- The Tier 2 Hybrid retirement benefit for regular and Fire & Police (F&P) employees is above market (>P75), as only 18% of the Utah market provides a defined benefit plan.
- Disability and paid leave are also competitive relative to the market, while death benefits (life insurance) are less competitive relative to the market. These benefits, however, comprise a smaller portion of the total benefits program.
Perhaps, the simplest approach for applying these results and assessing employee total compensation is to use the following chart, which illustrates the City’s total benefits value compared to other Utah employers. With the market median noted on this graph as “P50,” City leaders (and employees alike) are able to first identify a specific pay level (along the x-axis), then follow the graph to find the respective benefits value (shown along the y-axis). For example, when considering a Salt Lake City employee whose gross base wage earnings are $55,000 per year, the City’s benefits value equates to approximately $30,000, for $85,000 in total compensation. Compared to an employee receiving the
CCAC ANNUAL REPORT
March 2015
16
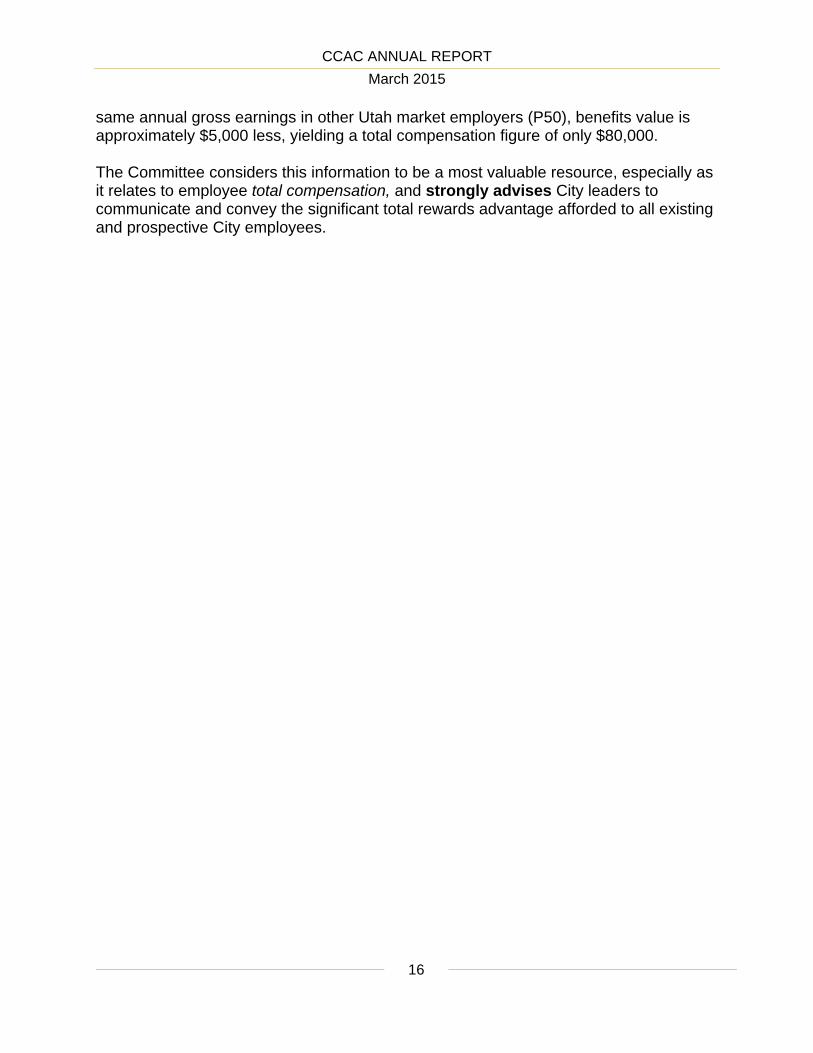
same annual gross earnings in other Utah market employers (P50), benefits value is approximately $5,000 less, yielding a total compensation figure of only $80,000.
The Committee considers this information to be a most valuable resource, especially as it relates to employee total compensation, and strongly advises City leaders to communicate and convey the significant total rewards advantage afforded to all existing and prospective City employees.

APPENDIX A
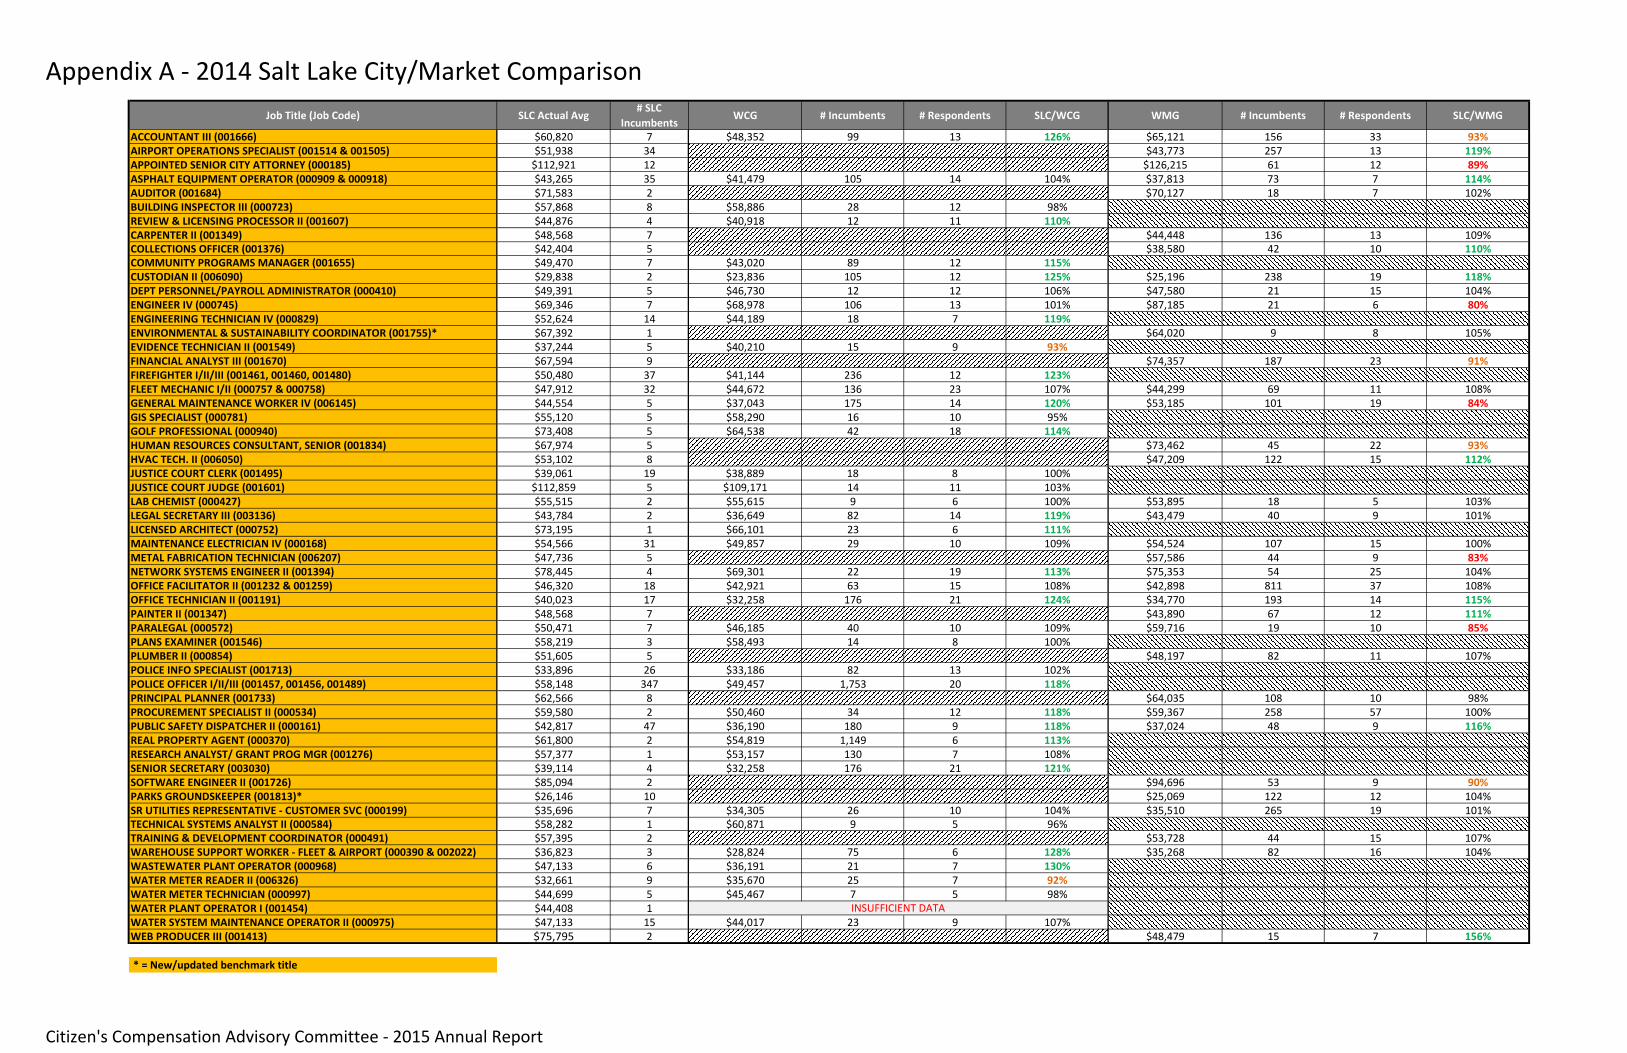
Appendix A ‐ 2014 Salt Lake City/Market ComparisonJob Title (Job Code) SLC Actual Avg
# SLC Incumbents
WCG # Incumbents # Respondents SLC/WCG WMG # Incumbents # Respondents SLC/WMG
ACCOUNTANT III (001666) $60,820 7 $48,352 99 13 126% $65,121 156 33 93%AIRPORT OPERATIONS SPECIALIST (001514 & 001505) $51,938 34 $43,773 257 13 119%APPOINTED SENIOR CITY ATTORNEY (000185) $112,921 12 $126,215 61 12 89%ASPHALT EQUIPMENT OPERATOR (000909 & 000918) $43,265 35 $41,479 105 14 104% $37,813 73 7 114%AUDITOR (001684) $71,583 2 $70,127 18 7 102%BUILDING INSPECTOR III (000723) $57,868 8 $58,886 28 12 98%REVIEW & LICENSING PROCESSOR II (001607) $44,876 4 $40,918 12 11 110%CARPENTER II (001349) $48,568 7 $44,448 136 13 109%COLLECTIONS OFFICER (001376) $42,404 5 $38,580 42 10 110%COMMUNITY PROGRAMS MANAGER (001655) $49,470 7 $43,020 89 12 115%CUSTODIAN II (006090) $29,838 2 $23,836 105 12 125% $25,196 238 19 118%DEPT PERSONNEL/PAYROLL ADMINISTRATOR (000410) $49,391 5 $46,730 12 12 106% $47,580 21 15 104%ENGINEER IV (000745) $69,346 7 $68,978 106 13 101% $87,185 21 6 80%ENGINEERING TECHNICIAN IV (000829) $52,624 14 $44,189 18 7 119%ENVIRONMENTAL & SUSTAINABILITY COORDINATOR (001755)* $67,392 1 $64,020 9 8 105%EVIDENCE TECHNICIAN II (001549) $37,244 5 $40,210 15 9 93%FINANCIAL ANALYST III (001670) $67,594 9 $74,357 187 23 91%FIREFIGHTER I/II/III (001461, 001460, 001480) $50,480 37 $41,144 236 12 123%FLEET MECHANIC I/II (000757 & 000758) $47,912 32 $44,672 136 23 107% $44,299 69 11 108%GENERAL MAINTENANCE WORKER IV (006145) $44,554 5 $37,043 175 14 120% $53,185 101 19 84%GIS SPECIALIST (000781) $55,120 5 $58,290 16 10 95%GOLF PROFESSIONAL (000940) $73,408 5 $64,538 42 18 114%HUMAN RESOURCES CONSULTANT, SENIOR (001834) $67,974 5 $73,462 45 22 93%HVAC TECH. II (006050) $53,102 8 $47,209 122 15 112%JUSTICE COURT CLERK (001495) $39,061 19 $38,889 18 8 100%JUSTICE COURT JUDGE (001601) $112,859 5 $109,171 14 11 103%LAB CHEMIST (000427) $55,515 2 $55,615 9 6 100% $53,895 18 5 103%LEGAL SECRETARY III (003136) $43,784 2 $36,649 82 14 119% $43,479 40 9 101%LICENSED ARCHITECT (000752) $73,195 1 $66,101 23 6 111%MAINTENANCE ELECTRICIAN IV (000168) $54,566 31 $49,857 29 10 109% $54,524 107 15 100%METAL FABRICATION TECHNICIAN (006207) $47,736 5 $57,586 44 9 83%NETWORK SYSTEMS ENGINEER II (001394) $78,445 4 $69,301 22 19 113% $75,353 54 25 104%OFFICE FACILITATOR II (001232 & 001259) $46,320 18 $42,921 63 15 108% $42,898 811 37 108%OFFICE TECHNICIAN II (001191) $40,023 17 $32,258 176 21 124% $34,770 193 14 115%PAINTER II (001347) $48,568 7 $43,890 67 12 111%PARALEGAL (000572) $50,471 7 $46,185 40 10 109% $59,716 19 10 85%PLANS EXAMINER (001546) $58,219 3 $58,493 14 8 100%PLUMBER II (000854) $51,605 5 $48,197 82 11 107%POLICE INFO SPECIALIST (001713) $33,896 26 $33,186 82 13 102%POLICE OFFICER I/II/III (001457, 001456, 001489) $58,148 347 $49,457 1,753 20 118%PRINCIPAL PLANNER (001733) $62,566 8 $64,035 108 10 98%PROCUREMENT SPECIALIST II (000534) $59,580 2 $50,460 34 12 118% $59,367 258 57 100%PUBLIC SAFETY DISPATCHER II (000161) $42,817 47 $36,190 180 9 118% $37,024 48 9 116%REAL PROPERTY AGENT (000370) $61,800 2 $54,819 1,149 6 113%RESEARCH ANALYST/ GRANT PROG MGR (001276) $57,377 1 $53,157 130 7 108%SENIOR SECRETARY (003030) $39,114 4 $32,258 176 21 121%SOFTWARE ENGINEER II (001726) $85,094 2 $94,696 53 9 90%PARKS GROUNDSKEEPER (001813)* $26,146 10 $25,069 122 12 104%SR UTILITIES REPRESENTATIVE ‐ CUSTOMER SVC (000199) $35,696 7 $34,305 26 10 104% $35,510 265 19 101%TECHNICAL SYSTEMS ANALYST II (000584) $58,282 1 $60,871 9 5 96%TRAINING & DEVELOPMENT COORDINATOR (000491) $57,395 2 $53,728 44 15 107%WAREHOUSE SUPPORT WORKER ‐ FLEET & AIRPORT (000390 & 002022) $36,823 3 $28,824 75 6 128% $35,268 82 16 104%WASTEWATER PLANT OPERATOR (000968) $47,133 6 $36,191 21 7 130%WATER METER READER II (006326) $32,661 9 $35,670 25 7 92%WATER METER TECHNICIAN (000997) $44,699 5 $45,467 7 5 98%WATER PLANT OPERATOR I (001454) $44,408 1WATER SYSTEM MAINTENANCE OPERATOR II (000975) $47,133 15 $44,017 23 9 107%WEB PRODUCER III (001413) $75,795 2 $48,479 15 7 156%
* = New/updated benchmark title
INSUFFICIENT DATA
Citizen's Compensation Advisory Committee ‐ 2015 Annual Report

THIS PAGE IS LEFT BLANK INTENTIONALLY

APPENDIX B
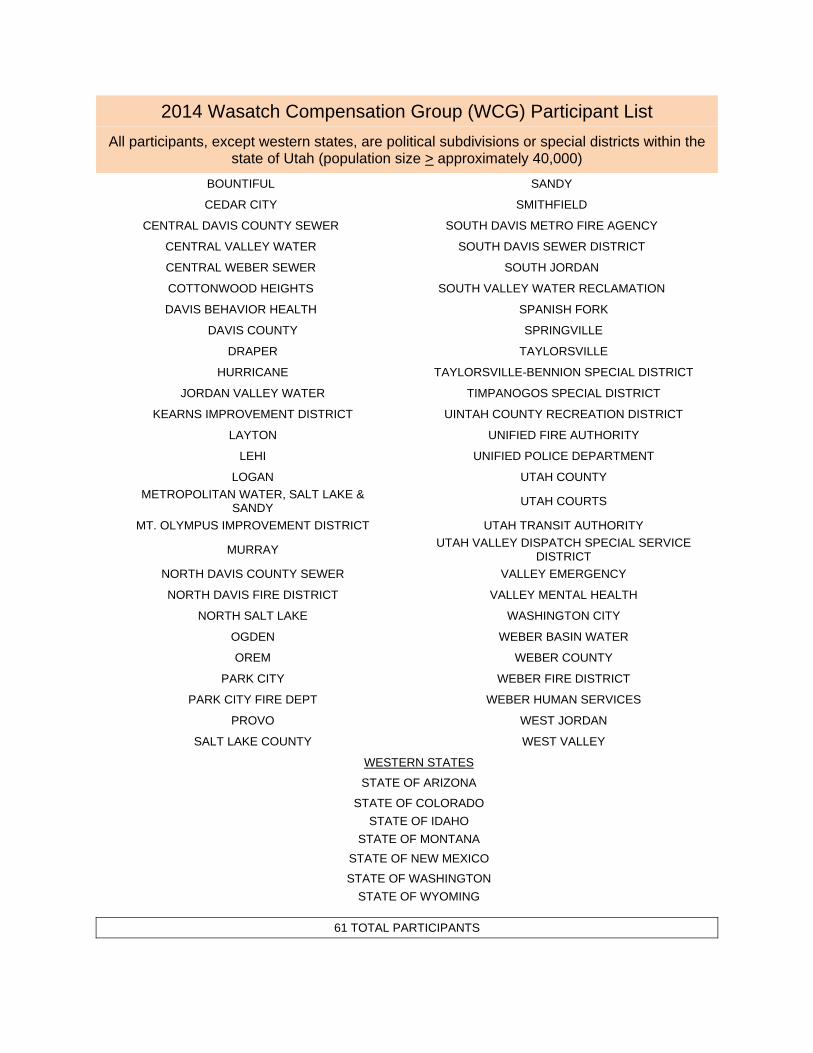
2014 Wasatch Compensation Group (WCG) Participant List
All participants, except western states, are political subdivisions or special districts within the state of Utah (population size > approximately 40,000)
BOUNTIFUL SANDY
CEDAR CITY SMITHFIELD
CENTRAL DAVIS COUNTY SEWER SOUTH DAVIS METRO FIRE AGENCY
CENTRAL VALLEY WATER SOUTH DAVIS SEWER DISTRICT
CENTRAL WEBER SEWER SOUTH JORDAN
COTTONWOOD HEIGHTS SOUTH VALLEY WATER RECLAMATION
DAVIS BEHAVIOR HEALTH SPANISH FORK
DAVIS COUNTY SPRINGVILLE
DRAPER TAYLORSVILLE
HURRICANE TAYLORSVILLE-BENNION SPECIAL DISTRICT
JORDAN VALLEY WATER TIMPANOGOS SPECIAL DISTRICT
KEARNS IMPROVEMENT DISTRICT UINTAH COUNTY RECREATION DISTRICT
LAYTON UNIFIED FIRE AUTHORITY
LEHI UNIFIED POLICE DEPARTMENT
LOGAN UTAH COUNTY
METROPOLITAN WATER, SALT LAKE & SANDY
UTAH COURTS
MT. OLYMPUS IMPROVEMENT DISTRICT UTAH TRANSIT AUTHORITY
MURRAY UTAH VALLEY DISPATCH SPECIAL SERVICE
DISTRICT
NORTH DAVIS COUNTY SEWER VALLEY EMERGENCY
NORTH DAVIS FIRE DISTRICT VALLEY MENTAL HEALTH
NORTH SALT LAKE WASHINGTON CITY
OGDEN WEBER BASIN WATER
OREM WEBER COUNTY
PARK CITY WEBER FIRE DISTRICT
PARK CITY FIRE DEPT WEBER HUMAN SERVICES
PROVO WEST JORDAN
SALT LAKE COUNTY WEST VALLEY
WESTERN STATES
STATE OF ARIZONA
STATE OF COLORADO
STATE OF IDAHO
STATE OF MONTANA
STATE OF NEW MEXICO
STATE OF WASHINGTON
STATE OF WYOMING
61 TOTAL PARTICIPANTS
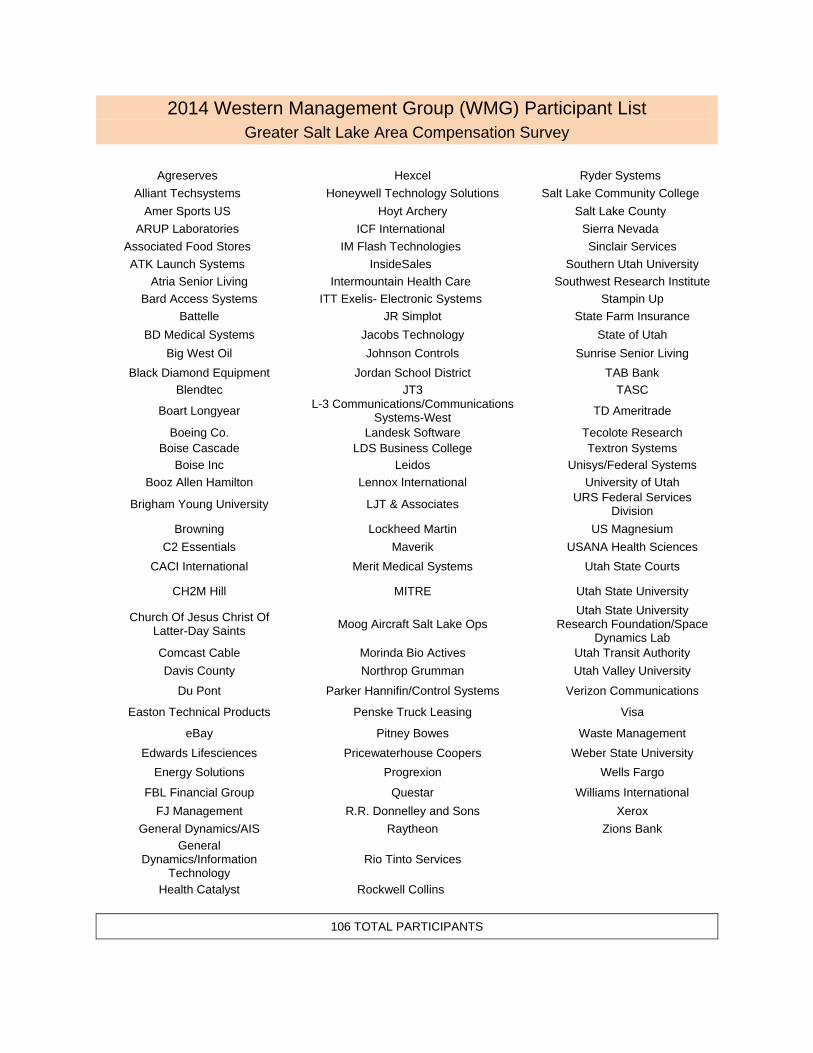
2014 Western Management Group (WMG) Participant List Greater Salt Lake Area Compensation Survey
Agreserves Hexcel Ryder Systems
Alliant Techsystems Honeywell Technology Solutions Salt Lake Community College
Amer Sports US Hoyt Archery Salt Lake County
ARUP Laboratories ICF International Sierra Nevada
Associated Food Stores IM Flash Technologies Sinclair Services
ATK Launch Systems InsideSales Southern Utah University
Atria Senior Living Intermountain Health Care Southwest Research Institute
Bard Access Systems ITT Exelis- Electronic Systems Stampin Up
Battelle JR Simplot State Farm Insurance
BD Medical Systems Jacobs Technology State of Utah
Big West Oil Johnson Controls Sunrise Senior Living
Black Diamond Equipment Jordan School District TAB Bank
Blendtec JT3 TASC
Boart Longyear L-3 Communications/Communications
Systems-West TD Ameritrade
Boeing Co. Landesk Software Tecolote Research Boise Cascade LDS Business College Textron Systems
Boise Inc Leidos Unisys/Federal Systems
Booz Allen Hamilton Lennox International University of Utah
Brigham Young University LJT & Associates URS Federal Services
Division
Browning Lockheed Martin US Magnesium
C2 Essentials Maverik USANA Health Sciences
CACI International Merit Medical Systems Utah State Courts
CH2M Hill MITRE Utah State University
Church Of Jesus Christ Of Latter-Day Saints
Moog Aircraft Salt Lake Ops Utah State University
Research Foundation/Space Dynamics Lab
Comcast Cable Morinda Bio Actives Utah Transit Authority
Davis County Northrop Grumman Utah Valley University
Du Pont Parker Hannifin/Control Systems Verizon Communications
Easton Technical Products Penske Truck Leasing Visa
eBay Pitney Bowes Waste Management
Edwards Lifesciences Pricewaterhouse Coopers Weber State University
Energy Solutions Progrexion Wells Fargo
FBL Financial Group Questar Williams International
FJ Management R.R. Donnelley and Sons Xerox
General Dynamics/AIS Raytheon Zions Bank
General Dynamics/Information
Technology Rio Tinto Services
Health Catalyst Rockwell Collins
106 TOTAL PARTICIPANTS
451 South State Street, Room 115 Salt Lake City, Utah 84114-5464
(801) 535-7900
Debra Alexander, HR Director David Salazar, HR Program Manager - Compensation
Jodi Langford, HR Program Manager - Benefits