cotton production in uganda: would gm technologies be the ......cotton producers will have a buyer...
TRANSCRIPT

1
Cotton Production in Uganda:
Would GM technologies be the Solution?
D. Horna1, M. Kyotalimye2, J. Falck-Zepeda3
1 Postdoctoral Fellow, IFPRI, [email protected], 2 Association for Strengthening Agricultural Research in Eastern and Central Africa, [email protected], 3 Research Fellow, IFPRI, [email protected]
Contributed Paper prepared for presentation at the International Association of Agricultural Economists Conference, Beijing, China, August 16-22, 2009
Copyright 2009 by Horna J.D., Kyotalimye M., and Falck-Zepeda J. All rights reserved. Readers may make verbatim copies of this document for non-commercial purposes by any means, provided that this copyright notice appears on all such copies.
2
Cotton Production in Uganda:
Would GM technologies be the Solution?
D. Horna1, M. Kyotalimye2, J. Falck-Zepeda3
Abstract
The government of Uganda is currently testing the performance of genetically modified (GM)
cotton varieties. Cotton is cultivated in Uganda for two main reasons: 1) agro-ecological
conditions favor cotton cultivation, and 2) there is a long tradition of cotton cultivation in the
country. Two main research questions are addressed in this study: a) would the adoption of
genetically modified (GM) cotton benefit Ugandan farmers? b) Would the use of GM seed be
more profitable than the low input traditional system or than the organic production system?
Stochastic budget analysis is used to address these questions. The results show that estimated
values of cotton profitability do not seem to justify the investment in a complex technology. The
question then is how transferable is GM technology and how easily can it be adopted by Ugandan
farmers. The vertical integration of the chain could facilitate the dissemination of the technology,
but availability of seed and inputs of good quality and appropriate extension support have to be
guaranteed.
Keywords: Stochastic budget analysis, GM cotton, Organic cotton
1 Postdoctoral Fellow, IFPRI, [email protected] 2 Association for Strengthening Agricultural Research in Eastern and Central Africa, [email protected] 3 Research Fellow, IFPRI, [email protected]

3
Cotton Production in Uganda:
Would GM technologies be the Solution?
The government of Uganda is currently testing the performance of genetically modified
(GM) cotton varieties. Confined trials of insect resistant (IR) cotton varieties have been
implemented in two selected sites. Herbicide tolerant (HT) cotton is waiting for approval from the
Uganda National Council of Science and Technology (UNCST). Despite a long cotton cultivation
tradition, cotton productivity in Uganda is very low compare to international averages (900
Kg/ha). In 2005 cotton yield was around 152 kg/ha, one of the lowest in the world. The
government has recognized the potential of genetically modified (GM) cotton to improve cotton
production and thus producers’ livelihoods and the economy in general. Decision makers agree on
the importance of understanding all benefits and risks faced by the different actors involved in the
cotton value chain with the adoption of this technology.
Two main research questions are addressed in this study: a) would the adoption of
genetically modified (GM) cotton benefit Ugandan farmers? b) Would the use of GM seed be
more profitable than the low input traditional system or than the organic production system?
While numerous studies have been published on cotton in Africa, relatively few have attempted to
assess in quantitative terms the potential impact of GM cotton.
1. Why Cotton Production in Uganda?
Cotton is cultivated in Uganda for two main reasons: 1) agro-ecological conditions favor
cotton cultivation, and 2) there is a long tradition of cotton cultivation in the country. The crop
was introduced in 1903 and was initially grown only in the Central Region but eventually it spread
to the rest of the country. Together with coffee became the most important source of revenue for

4
the government from the 50s to the 70s. During the social unrest period of 70s the crop was
abandoned, productivities and areas cultivated dropped dramatically. In the late 1980s the
government initiated a program to provide extension services, tractors, and other inputs for cotton
farmers. Ginneries were rehabilitated and producer prices increased. In 1994 the government of
Uganda in collaboration with the World Bank (WB) implemented a cotton sector development
project. There has been some recovery in production levels; however cotton still only accounts for
2 to 5% of Uganda's exports, compared to 25% in the 1970s (Serunjogi et al. 2001).
The situation that cotton producers face now is however different than in the 70s. To begin
with, Uganda does not longer have a premium price for the cotton quality. Albeit there is only one
variety of cotton in cultivation the lack of uniformity of the cotton lint caused the lost of the
premium price in 2002. While environmental and soil properties favor the development of the crop
pretty much all over the country, climatic conditions have contributed to the slow recovery of the
sector. Drought periods follow by excessive rain, low temperatures and cloudy weather are
considered primary causes of low cotton yields. Recent increases in productivity has been the
result of purification of cotton types by the National Agricultural Research organization (NARO),
credit facilities and input distribution to farmers by the Cotton Development Organization (CDO),
and improvement in agronomic practices through extension work.
Despite that farmers admit that cotton is not a profitable business they keep cultivating it.
The reasons argued are multiple; the most common one is lack of alternatives. The certainty that
cotton producers will have a buyer is probably another strong argument for cotton cultivation.
Seed and inputs are usually distributed by the ginneries that demand in exchange rights over the
harvest. In general, a falling in cotton planted acreage is a dominant trend in Uganda (UEPB
2007). In recent years rice production has come out as a better economic activity for farmers. This

5
is specially the case for areas located in the Eastern Regions. In more marginal areas like the
northern districts cotton is still one of the few alternatives left to farmers.
As an alternative to conventional production, organic production has been adopted in some
areas of Uganda already distinguished by their low input use. In the 2007/08 season about 50% of
the cotton areas embark on en-mass promotion of organic cotton production. Due to lack of proper
training and availability of inputs the pest incidence caused the loss of about 68% of the yield in
these areas. As a consequence organic production only represented 20% of the national production
for the same period (CDO 2008). The most important area of organic cotton production is located
in Lango. This area is characterized by low use of chemical inputs. As any other organic
agricultural system, the Lango system is characterized by use of biological control and cultural
practices to deal with pest and diseases, limited use of productivity-enhancing technologies, and
certification of the whole farming system and individual ginneries. In Lango cotton is produce is
rotation with sesame, an oil seed crop that has a much higher productivity and price in the market.
Farmers do not have many alternatives to cotton in this rotation system. Basically the entire
organic cotton production is for export
2. Methodology
2.1 Stochastic Budget Analysis
In order to evaluate the profitability of cotton production at the farm level we used the
basic partial budget analysis augmented with stochastic simulations. Survey data was collected to
estimate the marginal returns to cotton production for organic and conventional producers and as
well for low input and high input producers. A low input farmer basically only uses a very limited
amount of chemical pesticide. Fertilizer application does not seem to be a common practice in the
study sites in Uganda, therefore farmer using fertilizers and pesticides were classified as high

6
input producers. This information combined with data from published sources was used to predict
the marginal returns of IR cotton and HT cotton. An additional scenario that combines organic
production with GM seed was also developed. The simulations were developed using @Risk
software (an add-in to excel).
The comprehensive guide produced by CIMMYT (1988) was used as the basis for
calculating partial budgets and simulating the profitability of cotton production. Expected total
income, total costs, expected net income and net return to investment were calculated per acre.
Cotton seed is distributed free of charge and thus the value is zero for the producer. Total use of
chemical and organic fertilizers and pesticides were reported by farmers and converted to values
per acre. The value of the land was accounted only for those farmers that rented land. Similarly
only hired labor costs are included in the budgets. Average wages paid to hired labor were used to
estimate the total family labor costs. This assumption seems reasonable in the production areas
studied, where labor markets are active and farmers produce the crops commercially. Male and
female labor days were valued equally. There was no evidence available to justify valuing them
differently.
2.2 Simulations
The scenarios simulated were IR cotton and HT cotton. A seed price difference is expected
for GM seed, but the absolute value of this price difference varies widely according to the
technology provider and its market power. Cost savings associated with the use of GM seed use
are represented by the reduction in insecticide and herbicide applications and/or labor costs
related, if any. Assumptions used in partial budget scenarios are summarized in Table 1. In order
to account for the risk and uncertainty of agricultural production some of the parameters were
replaced by distributions. The distributions used in our study were based either on literature

7
review (e.g. technology fee, abatement effect, and pesticide and spraying costs reduction) or on the
primary data collected from farmers (e.g. yield variability within and across farmers, yield loss
due to constraint, price fluctuations, pesticide, and spraying).
We used @Risk software to estimate candidate distributions and select the one that best fit
the information collected in the survey. We selected distributions that best fit the triangular
distributions elicited from farmers under 3 scenarios: 1) without the constraint, 2) with the
constraint but without using insecticides, and 3) with the constraint and chemical control of the
pest. In @Risk, we drew from the sample distributions of the each yield parameter (minimum,
maximum, mode) to generate yield variability both within and across observations.
Yield losses due to targeted constraints were derived from the elicited yields:
0 , 1
0
E(Y ) E(Y )E(Y )
E(Y )c i c
lossc
= =
=
− = (5)
( )E Yloss is the expected yield loss ratio, ( )0E Yc= is the expected yield without the constraint,
( )1E Yc= is the expected yield with the constraint, and i indicates use of insecticide (1 if farmers use
insecticide or 0 otherwise). Based on expected yield losses, expected damage abatement with
insecticide can also be estimated as:
( ) ( )E Y 1 – E Yabat loss= (6)
While actual damage and damage abatement are variables that are difficult to estimate, this
represents a fair approximation of damage abatement. Yield losses reported by farmers tend to be
upward biased because it is difficult for farmers to single out the effect of any individual pest.
With respect to estimating abatement of yield losses, often farmers relate stronger pesticide effects
with higher doses of pesticides.

8
Best-fit distributions were also used for variables that were easy to obtain from farmers: 1)
output price, 2) pesticide cost, and 3) spraying cost. Triangular distributions, on the other hand,
were used to model variables that measure: 1) technology efficiency (trait expression), 2) the
technology fee, 3) reduction rates in pesticide use, 4) reduction rates in spraying costs for the case
of IR cotton, and 5) increase rate in herbicide use for the case of HT cotton. Explanation on
minimum, mode, and maximum values adopted for all these variables are reported in Table 1.
The technology fee was expressed as a percentage increase in assumed seed price, since
the seed is distributed for free. The assumed seed price is derived from information provided by
the Cotton Development Organization (CDO)4. The technology fee is a sensitive issue because the
price of GM seed will affect its adoption. Other estimates in the literature about biotech crops have
reflected the temporary monopoly conferred in this capital-intensive innovation through
intellectual property instruments (Falck-Zepeda et al. 2000; Moschini and Lapan 1997). We
speculate that the public sector would probably tend to charge lower technology fees than the
private sector.
2.3 Data Collection, Sites and Sampling
A survey instrument was implemented to collect information on cotton production and
current practices used. In addition to the input use and production questions, the survey included
elicitation on subjective yield distributions from growers in order to gauge farmers’ perception to
the extent of yield losses caused by bollworm and by weeds. The triangular distribution
(minimum, maximum, mode) is the simplest distributions to elicit from farmers, approximates the
normal distribution, and is especially useful in cases where no sample data are available (Hardaker
2004).
4 CDO is was established by an Act of Parliament in 1994, regulates, coordinates and promotes all the aspects of the cotton sub-sector in the country

9
Lira and Kasese are the districts where the confined trials have been implemented and they
are also the districts selected for evaluating the current cotton production systems and conduct our
household interviews. After identifying cotton producing, we randomly selected villages with
farmers cropping cotton in the 2006 and 2007 seasons, 3 in Lira and 7 in Kasese. The distribution
of villages followed the proportion of cotton produced in the areas but it also intended to have a
good representation of organic producers.
A total of 150 household heads were interviewed, 48 producers in Lira and 102 in Kasese.
The households were randomly selected from the list of producers provided by ginneries operating
in each region. The questions were addressed for the 2007 campaign, and some additional
information was collected for 2006. In some cases selected producers cultivated more than one
plot. The information was analyzed per plot for the 2007 season only, and plots with incomplete
information were not considered in the analysis. Thus the total number of observations in our
analysis ended up being 151, of them 35 are plots from producers from Lira (12 organic
producers) and the rest are plots from producers in Kasese.
3. Understanding the Cotton Chain
3.1 Seed chain
Cotton value chain depends on the availability of seed and the quality of it. The need for
improved varieties and certified seed is probably the most important constraint encountered in
cotton production in Uganda (Serunjogi et al. 2001). Uganda cotton production is characterized by
the use of a single variety (Bukalasa Pedigree Albar or BPA). The main actors in the cotton seed
chain are cotton producers, the National Agricultural Research Organization (NARO), the Cotton
Development Organization (CDO) and some private ginneries. NARO coordinates and oversights
all aspects of agricultural research. As such this institution is in charge of research, breeding and

10
technology development in the cotton sector. NARO and the institutions that preceded it were
relatively active in selecting and releasing improved cotton varieties. The multiplication and seed
distribution process however needs more attention. The seed that farmers use is entirely channeled
through the ginneries, NARO and CDO.
CDO regulates, coordinates and promotes all the aspects of the cotton sub-sector in the
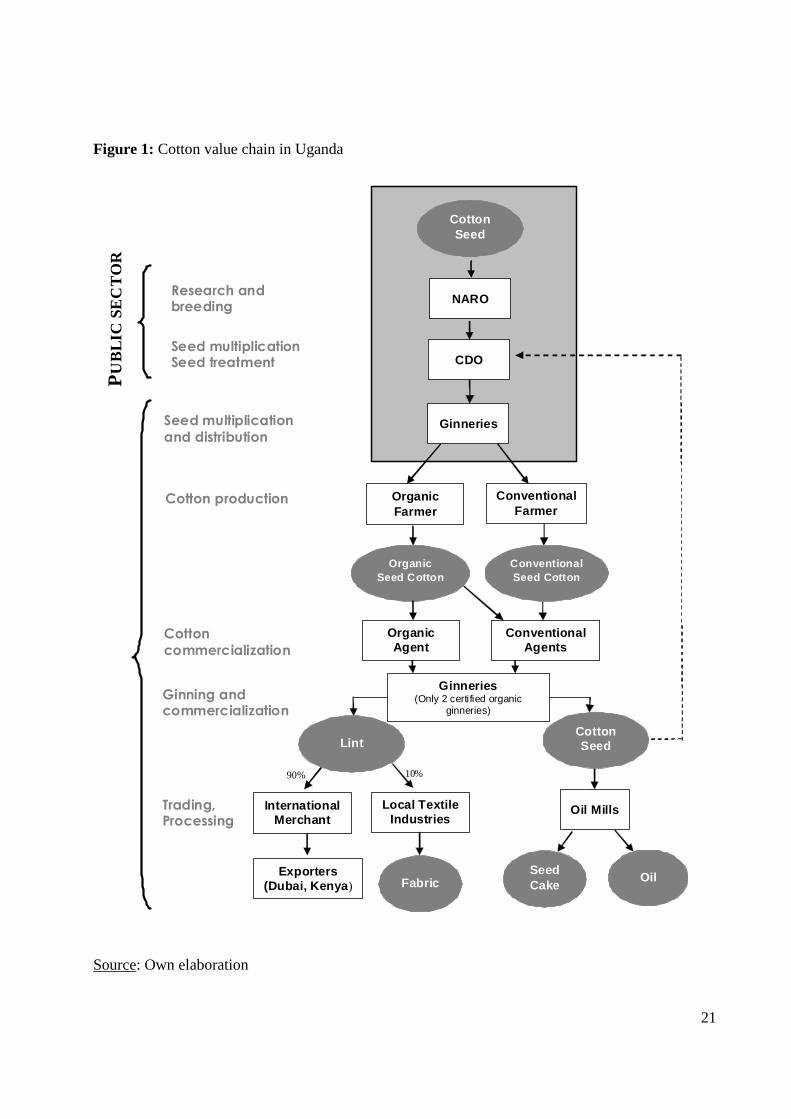
country (Figure 1). CDO also monitors cotton production and marketing and provides policy
advice regarding the crop (CDO 2006). The basic cotton seed is developed by NARO but
multiplied by the CDO and mainly distributed to the ginneries for commercial multiplication and
distribution to farmers. CDO is also in charge of determining and fixing the cotton price given to
farmers. Usually this price is set at 60 – 65% of the World Market price. The price that farmer
receives however can vary considerably depending on the region and time of the year.
The ginneries are around 57 in number and they are privately owned by approximately 36
different companies. Given the irregular cotton production ginneries compete for access to cotton
areas. The ginning capacity of the country is however limited and the operating ginning machines
are of poor quality. Ginneries are obliged to give the seed of good quality back to CDO and use or
sell the rest to oil and milling companies.
CDO makes a rough estimation of the seed volume needed for the following campaign.
CDO is also responsible for de-linting, grading and dressing the seed that will be finally given to
ginneries for distribution. Availability of cotton seed is a very limiting constraint for improving
cotton productivity in Uganda. According to UEPB (2007) cotton exports in 2006 fell 29% in
comparison to the previous year. Among other factors, the low performance in 2006 was related to
late planting, but mainly to the use of ungraded fuzzy seed (not de-linted) leading to high seed

11
wastage and the increased cost of provision of planting seed. The CDO has intervened supporting
efforts in the de-linting and seed grading.
3.2 Product Chain
Farmers, intermediate agents and ginners/exporters are the main actors in the cotton5 value
chain (Figure 1). Producers obtain the seed from the ginners. Very often ginners also provide
farmers with fertilizers and pesticides. Farmers pay back at harvest either with cotton or cash. The
level of inputs use is however still limited and often farmers decide plant cotton only because of
the secure market and fixed price. In the Northern part of the country there are very limited
alternatives to cotton, either as a single crop or as part of a rotation.
At harvest, farmers could bring their production to the ginneries but often the volume
produced is reduced and it does not justify paying for transport. Most commonly, intermediary
agents gather the production of several producers and bring it to the ginneries. These agents can
either work for the ginnery or be independent. Originally there were restrictions on the production
areas that a ginnery could cover and ginning companies were allowed only processed the cotton
produced in the neighboring areas. Currently, farmers can sell their production to any agent
offering the best price. This has increased the competition among agents and ginneries.
While the cotton production in Uganda does not cover the ginning potential and most
companies work with excess capacity, most of the machines are rather old and the quality of the
turnout is low. Ginning companies that have diversified their production and produce oil and soap
remain active during the year. Most of the lint is then exported to external markets like Dubai and
5 Value chain is composed of the product and the seed value chain. In this study we discussed only the product value chain.

12
Kenya, either by the same ginning companies or by other international dealers. Around 10% of the
lint produced remains in the Uganda for the local textile industries.
4. Is Cotton Profitable?
The basic statistics of the household characteristics and production variables are presented in
Table 2. The results are disaggregated by district. The table shows that household characteristics
are comparable across districts, but some production variables behave significantly different. Age
of the household head, level of education, household size and household composition is relatively
similar across sites. Neither is there significant variation concerning land value, labor use, and
years of experience in cotton cultivation. In average farmers interview have more than 14 years
working on cotton.
The size of the cotton plot tends to be larger in Kasese. Similarly seed cotton yield and total
benefits generated from cotton production are also higher in Kasese. These results correspond to
what have been reported by local institutes. On the other hand it seems that the susceptibility to
cotton bollworm is higher in Kasese than in Lira, implying that Bt-cotton could have a higher
success in the Western than in the Northern region.
It is important to point out that the cotton plot can be managed by another person and not
necessarily by the household head. So, while the percentage of female household heads in our
sample is considerably low (3% in Lira and 9% in Kasese), the share of plots managed by women
can be as high as 50% in Kasese and 29% in Lira. Nevertheless, when tested for mean differences
between plots managed by men or women, none of the variables included in Table 2.

13
4.1 Traditional System
Table 3 presents results for partial budgets for low input and the high input cotton
cultivation systems. High input system in the current report does not refer to an ideal situation but
rather to farmers that use chemical fertilizers and more than the average amount of pesticides.
From a total number of observations (151) only 27 qualified as high input users. Most of the
farmers use some type of chemical control to deal with insect pest, relatively few make use of
fertilizers and almost none of them use herbicides. This last input could contribute significantly to
improve the profitability of the crop. Cotton is a labor-intensive crop and it represents more than
50% of the total production costs. Most of the labor is used for manual weeding. Weed infestation
is therefore another severe constraint in cotton production. In our sample, weeding represents 20%
of the total labor costs for both types of producers. Similar patterns are reported by other
institutions working in cotton in the area6. Productivity of seed cotton for our sample (around 800
Kg/ha) is above the reported national average (around 400kg/ha) but the benefit costs ratios
estimated are still considerably low7.
Farmers in Kasese and Lira seem to have serious problems with bollworm. In average this
pest can cause damages for more than 70% of expected output. These estimations are based on
farmers’ perception and may have an upward bias, but they are a good reference to understand the
severity of bollworm infestation in these regions. In addition to bollworm, there are other common
biotic stresses such as aphids, Lygus spp. (a sucking type insect) and cotton strainers. This biotic
constraint combined with high price variability and the unreliable availability of inputs makes
6 Agricultural Productivity Enhancement Program (APEP), personal communication, 2008. 7 FAOSTAT average for seed cotton for the last 5 years is around 417 Kg/ha, last 10 years is around 347 Kg/ha (FAOStats, 2009).

14
cotton production a very risky activity in Uganda. The estimated downside risk (above 40%) for
surveyed farmers illustrates the magnitude of the downside risk in Uganda.
Note that in the survey’s estimates for labor costs family labor could be underestimated
since it is difficult for farmers to recall and give values to family labor employed. Looking at the
main costs components, it is evident that farmers invest very little amounts on fertilization. Most
of the producers interviewed belong to the category “low-input-users” and while they do use
pesticides to control for Lepidoptera and other main pest (Lygus spp., aphis, etc), the amount of
pesticide used is definitively below standard recommendations. On the other hand the “high-input
users” reported not only higher yields but also higher prices paid for their cotton. An OLS
regression shows that this difference in price is statistically significant and that the main
determinants are most likely to be 1) the use of chemical pesticides to control other pests than
lepidopterans, and 2) the accessibility to seasonal roads8.
4.2 Organic System
One of the purposes for the implementation of household surveys in Lira was to cover a
representative number of organic producers and collect information in order to generate a standard
partial budget for an average organic cotton producer. Based on the information collected,
merely12 producers of 35 interviewed qualify as actual standard complying organic producers.
The rest of the producers admitted using some level of chemical control to deal with heavy pest
infestations. The number of organic farmers changes year to year as farmers appear to switch from
conventional to organic with relative freedom. According to Dunavant, in the 2006-07 season,
11,691 organic farmers were registered and contracted for a total production of 6,600 bales (of
about 185 Kg), which accounted almost one third of Dunavant production. During the 2008/9
8 This information is available upon request.

15
season there were serious problems with the production of organic cotton as army bollworms
infested the crop.
While it is not possible to make statistical inference based on a small number of
observations, the analysis of the household surveys information can provide some useful insights.
It is well known for instance that the profitability of organic cotton is considerably low (Ogwang,
et al. 2005). For the sampled farmers the margin benefits are less than 5% of total costs. In
addition to that, the downside risk -the risk of not being able to cover at least the production costs-
is higher than 50%.
As conventional production, organic cotton faces several biotic and abiotic constraints.
Surveyed farmers report that the damage caused by bollworm is above 50% (Table 4). A main cost
in organic cotton production is labor (58%). As any other organic crop, cotton requires significant
amount of labor for manual activities, including insect and weed control. Notice that, the number
of farmers effectively applying organic practices is lower (N=12) than the number of farmers
registered as organic producers. During field observations it became clear that some organic
farmers were so desperate because of poor yields due to pest attack that many applied pesticides
even if they were not supposed to.
5. Would GM cotton be the solution?
In order to estimate the potential profitability of GM cotton four partial budget scenarios
were simulated. The first scenario is an organic production assuming a 12.5% price premium (half
of the price premium that organic companies acknowledge paying to farmers). The second
scenario simulates a hypothetical case where it is possible to use Bt-cotton seed in an organic
system. The third and fourth scenarios illustrate the case of Bt-cotton and HT cotton adoption. The

16
profitability of cotton production is very low for all the scenarios simulated. Also, none of them
show first degree stochastic dominance over the others. The implication of not having a scenario
dominating the others to a first degree is that none has an outcome that is clearly better in average
than the rest.
The use of GM seed may reduce the downside risk, but this depends on the effectiveness of
this technology to control the constraint (e.g. expression of the trait). Experts report that yield
losses due to bollworm could be as high as 80% and this is in agreement with what farmers have
reported (in average around 76%). Given these high values attached farmers’ perception on yield
losses due to Bollworm attack and weeds infestation, it is not surprising that the margins are
higher for both the IR cotton and the HT cotton scenario. Perceptions however are usually
upwards biased given that it is rather difficult for farmers to isolate the effect of one constraint.
The marginal benefits of using GM seed therefore are directly related to the level of incidence of
the productivity constraint and the actual damage caused by the biotic constraint.
In the case of the HT cotton scenario the assumptions are based on expectations. This
scenario is the one reporting the highest B/C ratio and the highest marginal rate of return over low
input or organic productions. Unfortunately this is also the weakest scenario due to the lack of
technical information (ex. number of weeding sessions avoided with 1 application of Round-up,
more accurate yield loss due weeds, relatively low number of respondents, etc). The impact of Bt-
cotton has been more thoroughly documented.
The possibility of receiving a price premium is a good incentive for farmers, who already
use very low inputs and no chemical pesticides, to move to organic cotton. According to public
sources the premium that organic producer receive can be as high as 20% (ACE, 2007).The prices
reported by farmers in Lira however do not seem to be considerably higher what conventional
17
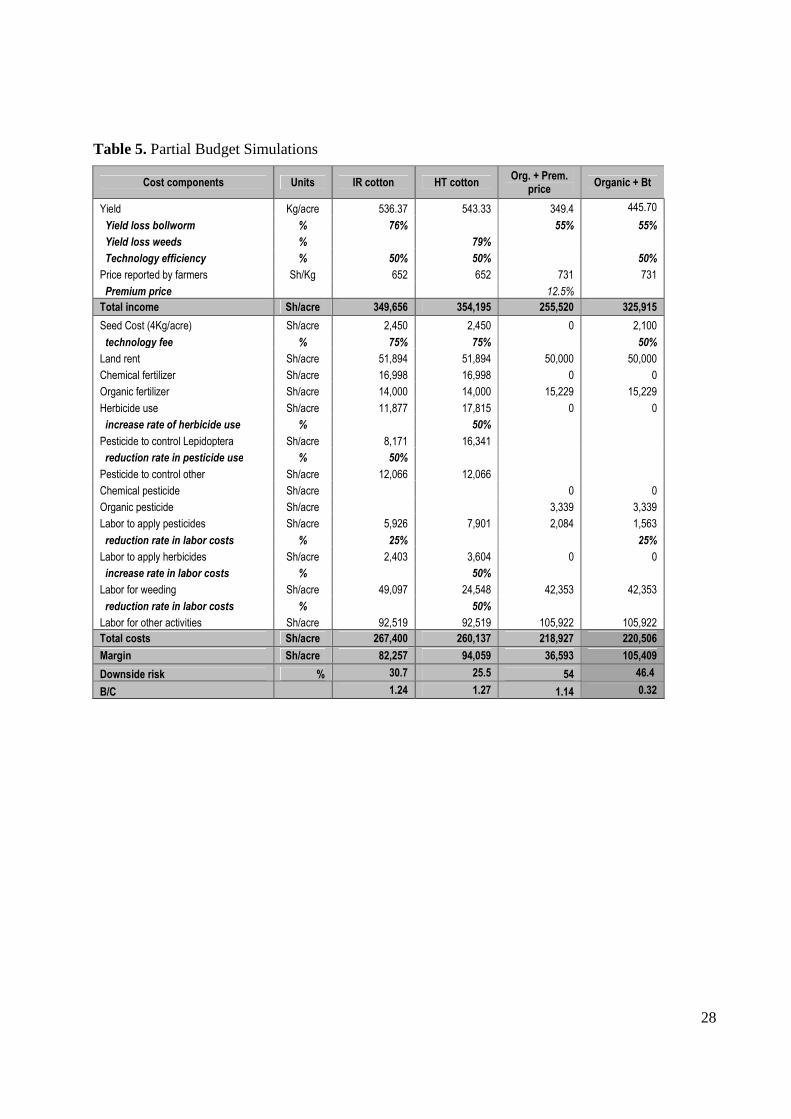
producers get. In Table 5 the third column includes a scenario with a 12.5% price premium,
improving the profitability of cotton. Ogwang et al. (2005) performed an evaluation of organic
cotton production in Lango, an important organic production area in Uganda. The evaluation
included a partial budget comparison across systems: traditional, low input, high input and
organic. The results of this evaluation show that low and high input systems perform much better
than either the traditional or the organic system. Even considering the price premium for organic
cotton the rate of returns are much higher for farmers that make use of chemical inputs. Our results
however show that given the current practices in Lira, organic producers might have a slightly
higher margin than high-input users if they get a premium price. However, organic producers do
not seem to be getting premium prices for their produce. If there is no price premium, then there
are no marginal returns that will provide incentives to farmers to move from low input production
to organic production. If there is premium price, marginal returns are comparable to the ones
generated by adopting Bt-cotton adoption.
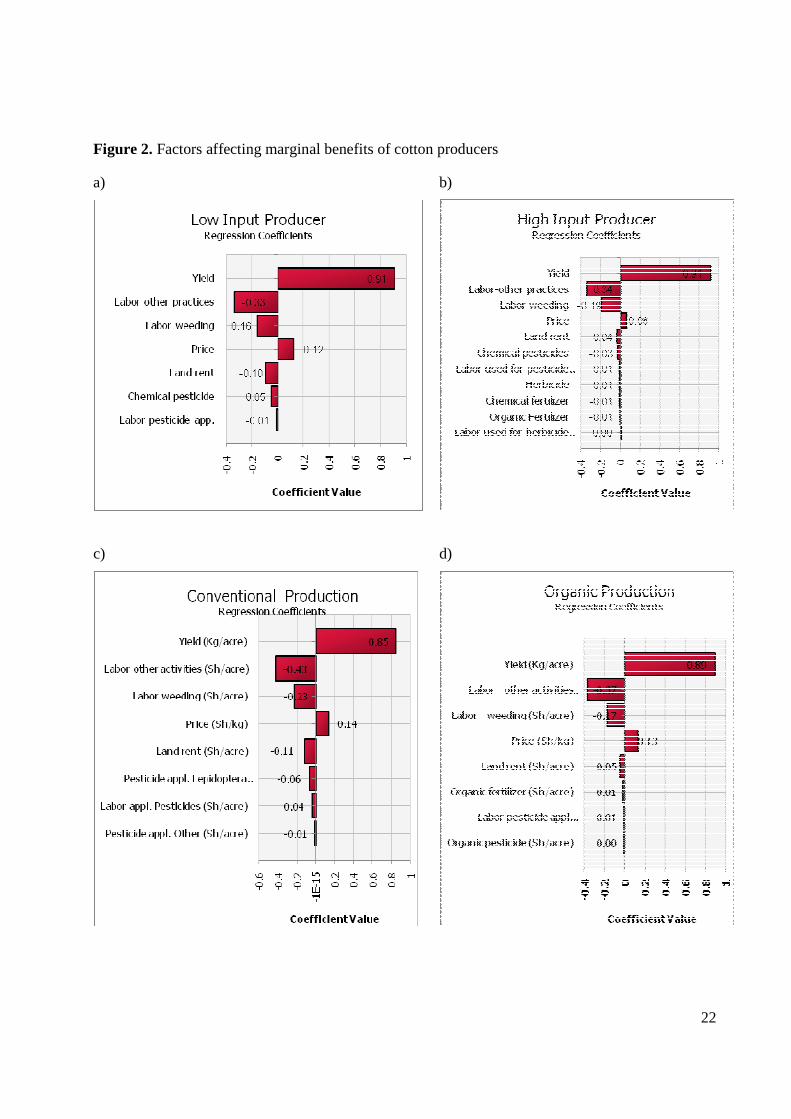
Figure 2 shows the main factor affecting the profitability of the different management
systems: low input, high input, conventional, organic, Bt-cotton, and HT cotton. Across all the
scenarios the variability in yield and the high labor costs are the main determinants of the margins
generated. A technology that contributes to reduce this yield variability would definitively have an
impact on farmers’ welfare.
6. Policy recommendations
Independently to the type of seed used or farming system implemented, investment in
fertilizers and good quality seed are crucial to improve the profitability of cotton in Uganda. In our
survey, in 2007 only 6 farmers out of 150 used chemical fertilizers and only 3 of them used an
organic fertilizer. The introduction of genetically modified technologies could control bollworm or

18
help to reduce the labor used in weeding, but the yield potential of the plant would not be achieved
with the current level of fertilizer application.
Estimated values of cotton profitability do not seem to justify the investment in a complex
technology. The question then is how transferable is GM technology and how easily can it be
adopted by Ugandan farmers. The vertical integration of the chain could facilitate the
dissemination of the technology, but availability of seed and inputs of good quality and
appropriate extension support have to be guaranteed.
In the case of IR cotton it is important to point out that farmers are not using significant
levels of pesticides9 and therefore the expected reduction is pesticide used would be insignificant.
If yield losses dues to Bollworm are lower than reported by farmers then the profitability of this
technology will dramatically decrease. In the case of HT cotton, a potential constraint to the
adoption of this technology is the very limited use of herbicides.
Furthermore, the adoption of GM cotton in Uganda would most likely impact the
performance of the cotton market chain. It is very important to explore how the cotton market
chain would be affected with the adoption of GM cotton and what are the institutional constraints
that might limit the successful introduction of this technology. The growing importance of organic
cotton production would have to be considered in any decision with respect to GM cotton
adoption. One question that needs to be urgently answer is if there are possibilities for co-
existence of the conventional system using GM seed and the organic system. Also, Organic cotton
production needs more detailed evaluation. Price premium, for instance, makes organic production
profitable but more research is needed to evaluate how this price is received by farmers.
9 A production functions with a damage abatement specification and estimated with a non-linear regression shows that chemical pesticides are not significantly abating damage caused either bollworm, but they do control yield losses caused by other insect pest and by weeds.

19
While it is possible to compare the profitability of given year of organic cotton production
with the conventional cotton production using GM seed this is just a very partial view. Since the
interest of our research is to contribute to poverty alleviation, it is much more significant but at the
same time challenging to evaluate the long term contribution of either system to the farmers’
welfare. This is a research topic that needs more attention in the future.
20
References
CIMMYT. 1988. From agronomic data to farmer recommendations: An economics training manual. Completely revised edition ed. Mexico, D.F.: CIMMYT.
Cotton Development Organisation. Cotton Development Organisation. 2008. Report on the Cotton Sector in Uganda for the 2007/08 Season. Presented to the 67th Plernary Meeting of the International Cotton Advisory Committee. Ouagadougou – Burkina Faso. 17th – 21st November, 2008
Cotton Development Organisation. Cotton Development Organisation Annual Report 2003-2004. 1-40. 2004. Kampala, Uganda.
Cotton Development Organisation. The cotton sector in Uganda: Progress made in the sector and recommendations for achieving further progress. 1-14. 2006. CDO.
Falck-Zepeda, J., G. Traxler, and R. G. Nelson. 2000. Surplus distribution from the introduction of a biotechnology innovation. American Journal of Agricultural Economics 82: 360-369.
Hardaker, J. B., R. B. M. Huirne, J. R. Anderson, and G. Lien. 2004. Coping with risk in agriculture. Wallingford: CABI Publishing.
Moschini, G., and H. Lapan. 1997. Intellectual property rights and the welfare effects of agricultural R&D. American Journal of Agricultural Economics 79 (4): 1229-1242.
Owang, J.; Sekamatte, B.; Tindyebwa, A. 2005. Aspect on the organic cotton sub-sector in Uganda. Report on the ground situation of the organic cotton production in selected areas of the Lango Sub-Region. 29p
Pemsl, D., H. Waibel, and A. P. Gutierrez. 2005. Why do some Bt-cotton farmers in China continue to use high levels of pesticides? International Journal of Agricultural Sustainability 3 (1): 44-56.
Pray, C., J. Huang, R. Hu, and S. Rozelle. 2002. Five years of Bt cotton in China - the benafits continue. The Plant Journal 31 (4): 423-430.
Serunjogi, L. K., Elobu, P., Epieru, G, Okoth, V. A. O., Sekamatte, M. B., Takan, J. P., Oryokot, J. O. E. "Traditional cash crops: Cotton (Gossypium Sp.)," Mukiibi, Joseph K., Agriculture in Uganda: Crops. Kampala: Fountain Publishers / CTA / NARO, 2001, 322-375.
Traxler, G., and S. Godoy-Avila. 2004. Transgenic cotton in Mexico. AgBioForum 7 (1&2): 57-62.
UEPB. Export Performance Watch. Export Bulletin Edition 10. 2007. Kanmpala, Uganda Export Promotion Board.
21
Figure 1: Cotton value chain in Uganda
PU
BL
IC S
EC
TO
R
10% 90%
Organic Farmer
Exporters (Dubai, Kenya)
Lint
Cotton Seed
Seed Cake
Oil
Organic Seed Cotton
Conventional Farmer
Organic Agent
Ginneries (Only 2 certified organic
ginneries)
International Merchant
Local Textile Industries
Oil Mills
Cotton Seed
NARO
CDO
Ginneries
Research and breeding
Seed multiplication Seed treatment
Seed multiplication
and distribution
Cotton production
Cotton
commercialization
Ginning and commercialization
Trading, Processing
Fabric
Conventional Agents
Conventional Seed Cotton
Source: Own elaboration
22
Figure 2. Factors affecting marginal benefits of cotton producers
a) b)
c) d)

23
e) f)
24
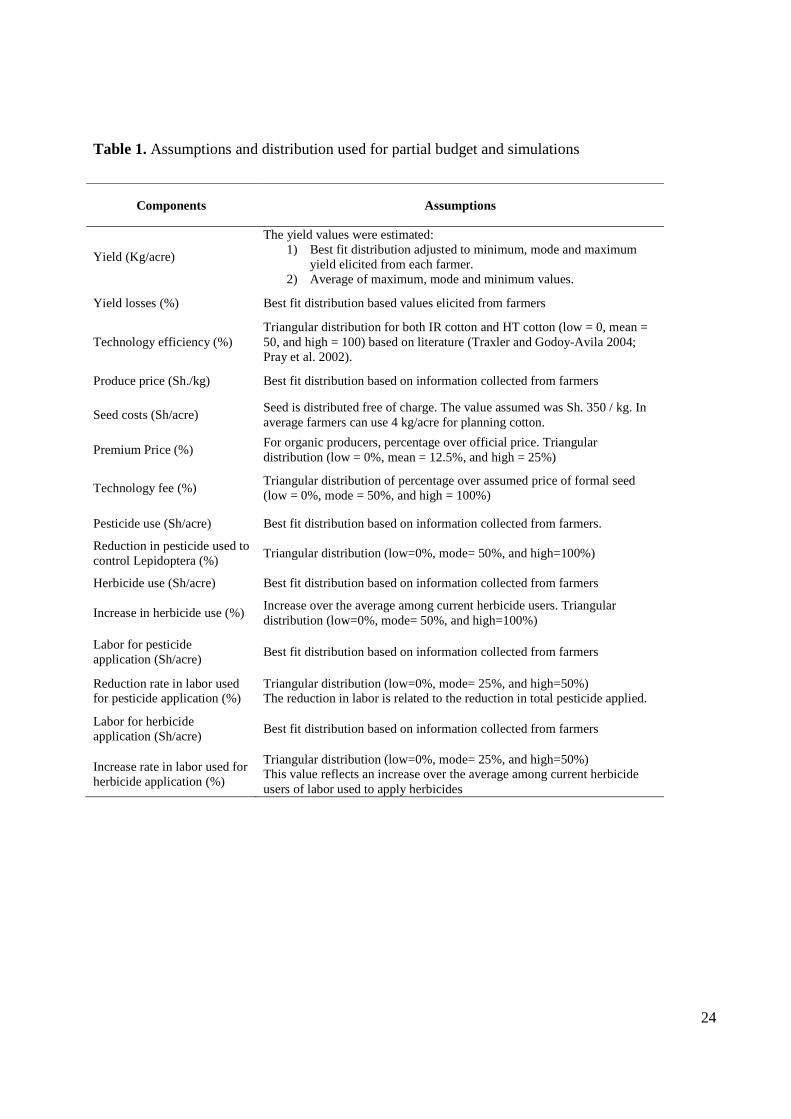
Table 1. Assumptions and distribution used for partial budget and simulations
Components Assumptions
Yield (Kg/acre)
The yield values were estimated: 1) Best fit distribution adjusted to minimum, mode and maximum
yield elicited from each farmer. 2) Average of maximum, mode and minimum values.
Yield losses (%) Best fit distribution based values elicited from farmers
Technology efficiency (%) Triangular distribution for both IR cotton and HT cotton (low = 0, mean = 50, and high = 100) based on literature (Traxler and Godoy-Avila 2004; Pray et al. 2002).
Produce price (Sh./kg) Best fit distribution based on information collected from farmers
Seed costs (Sh/acre) Seed is distributed free of charge. The value assumed was Sh. 350 / kg. In average farmers can use 4 kg/acre for planning cotton.
Premium Price (%) For organic producers, percentage over official price. Triangular distribution (low = 0%, mean = 12.5%, and high = 25%)
Technology fee (%) Triangular distribution of percentage over assumed price of formal seed (low = 0%, mode = 50%, and high = 100%)
Pesticide use (Sh/acre) Best fit distribution based on information collected from farmers.
Reduction in pesticide used to control Lepidoptera (%)
Triangular distribution (low=0%, mode= 50%, and high=100%)
Herbicide use (Sh/acre) Best fit distribution based on information collected from farmers
Increase in herbicide use (%) Increase over the average among current herbicide users. Triangular distribution (low=0%, mode= 50%, and high=100%)
Labor for pesticide application (Sh/acre)
Best fit distribution based on information collected from farmers
Reduction rate in labor used for pesticide application (%)
Triangular distribution (low=0%, mode= 25%, and high=50%) The reduction in labor is related to the reduction in total pesticide applied.
Labor for herbicide application (Sh/acre)
Best fit distribution based on information collected from farmers
Increase rate in labor used for herbicide application (%)
Triangular distribution (low=0%, mode= 25%, and high=50%) This value reflects an increase over the average among current herbicide users of labor used to apply herbicides

25
Table 2. Descriptive statistics
Variables
Total sample (N=151)
Lira (N=35)
Kasese (N=116)
F Sig Mean Std. Error Statistic Std. Error Statistic Std. Error
Gender of the HH head (female=1) 0.09 0.02 0.03 0.03 0.11 0.03
Control of plot (female=1)* 0.46 0.08 0.29 0.13 0.51 0.09
Age of the HH head 44.04 1.14 42.63 2.85 44.47 1.22
Education level of HH head (years) 2.90 0.15 3.03 0.30 2.86 0.18
Household size (number) 7.75 0.31 7.40 0.52 7.86 0.38
No. of males above 16 1.86 0.11 2.23 0.22 1.75 0.12
No. of females above 16 1.74 0.10 1.71 0.17 1.75 0.12
No. of people below 16 4.15 0.23 3.46 0.33 4.36 0.28
Land value (USh/acre) 1,968,278 312,933 1,925,714 455,970 1,981,121 384,340
Total area (acres) 3.51 0.49 3.30 1.05 3.57 0.55
Cotton area (acres) 1.68 0.11 1.09 0.10 1.86 0.14 9.08 ***
Experience with cotton (years) 14.68 1.04 16.86 2.36 14.02 1.15
Probability of bollworm attacks 0.74 0.03 0.59 0.06 0.78 0.03 8.37 ***
Seed cotton price (USh./kg) 651.76 6.30 660.34 14.13 649.24 7.03
Output value (USh/acre) 421,242 43,810 193,104 28,614 490,077 54,845 8.60 ***
Seed cotton yield (Kg/acre) 386.16 23.72 273.59 37.56 420.12 28.04 7.07 ***
Labor used for weeding (USh/acre) 46,385 3,855 44,633 9,727 46,914 4,097
Total labor used (USh/acre) 97,894 6,973 107,330 20,747 95,129 6,705

26
Table 3. Cotton profitability for low and high input systems, season 2007/08
Cost components Units Low Input (N=124)
Share (%)
High Input (N=27)
Share (%)
Seed cotton - Yield Kg/acre 361.7 458.4
Yield loss bollworm % 72% 78%
Total income Sh/acre 231,638 322,369
Land rent Sh/acre 52,333 26% 47,857 16%
Chemical fertilizer Sh/acre
16,998 6%
Organic fertilizer Sh/acre
14,614 5%
Herbicide use Sh/acre
11,877 4%
Chemical pesticide Sh/acre 17,300 9% 14,963 5%
Labor to apply pesticides Sh/acre 4,001 2% 5,088 2%
Labor to apply herbicides Sh/acre
4,500 1%
Labor for weeding Sh/acre 42,066 21% 66,221 22%
Labor for other activities Sh/acre 87,676 43% 120,718 40%
Total costs Sh/acre 203,376 302,836
Margin Sh/acre 28,262 19,533
Downside risk % 49 47
B/C
1.13 1.06

27
Table 4. Cotton profitability for organic cotton producers, 2007/08 season
Cost components Units Conventional
(N=139)
Share (%)
Organic (N=12)
Share (%)
Yield Kg/acre 389.3 349.4
Yield loss bollworm % 76% 55%
Yield loss weeds % 79%
Price reported by farmers Sh/Kg 652 650
Total income Sh/acre 253,802 227,129
Land rent Sh/acre 51,894 18.9% 50,000 22.8%
Chemical fertilizer Sh/acre 16,998 6.2% 0 0.0%
Organic fertilizer Sh/acre 14,000 5.1% 15,229 7.0%
Herbicide use Sh/acre 11,877 4.3% 0 0.0%
Pesticide to control Lepidoptera Sh/acre 16,341 5.9%
Pesticide to control other Sh/acre 12,066 4.4%
Organic pesticide Sh/acre 3,339 1.5%
Labor to apply pesticides Sh/acre 7,901 2.9% 2,084 1.0%
Labor to apply herbicides Sh/acre 2,403 0.9% 0 0.0%
Labor for weeding Sh/acre 49,097 17.8% 42,353 19.3%
Labor for other activities Sh/acre 92,519 33.6% 105,922 48.4%
Total costs Sh/acre 275,095 218,927
Margin Sh/acre -21,293 8,202
Downside risk % 43 58
B/C
0.92 1.04
28
Table 5. Partial Budget Simulations
Cost components Units IR cotton HT cotton Org. + Prem.
price Organic + Bt
Yield Kg/acre 536.37 543.33 349.4 445.70
Yield loss bollworm % 76% 55% 55%
Yield loss weeds % 79%
Technology efficiency % 50% 50% 50%
Price reported by farmers Sh/Kg 652 652 731 731
Premium price 12.5%
Total income Sh/acre 349,656 354,195 255,520 325,915
Seed Cost (4Kg/acre) Sh/acre 2,450 2,450 0 2,100
technology fee % 75% 75% 50%
Land rent Sh/acre 51,894 51,894 50,000 50,000
Chemical fertilizer Sh/acre 16,998 16,998 0 0
Organic fertilizer Sh/acre 14,000 14,000 15,229 15,229
Herbicide use Sh/acre 11,877 17,815 0 0
increase rate of herbicide use % 50%
Pesticide to control Lepidoptera Sh/acre 8,171 16,341
reduction rate in pesticide use % 50%
Pesticide to control other Sh/acre 12,066 12,066
Chemical pesticide Sh/acre 0 0
Organic pesticide Sh/acre 3,339 3,339
Labor to apply pesticides Sh/acre 5,926 7,901 2,084 1,563
reduction rate in labor costs % 25% 25%
Labor to apply herbicides Sh/acre 2,403 3,604 0 0
increase rate in labor costs % 50%
Labor for weeding Sh/acre 49,097 24,548 42,353 42,353
reduction rate in labor costs % 50%
Labor for other activities Sh/acre 92,519 92,519 105,922 105,922
Total costs Sh/acre 267,400 260,137 218,927 220,506
Margin Sh/acre 82,257 94,059 36,593 105,409
Downside risk % 30.7 25.5 54 46.4
B/C
1.24 1.27 1.14 0.32