cotton, chana, guar seed & guar gum - smc trade online · 2018-05-09 · chana (june) guar seed...
TRANSCRIPT

9thMay,2018
Monthly Report On
Cotton, Chana, Guar Seed & Guar GumCotton, Chana, Guar Seed & Guar GumCotton, Chana, Guar Seed & Guar Gum
May 2018

COTTON MCX (MAY)
Fundamentals
Cotton prices on the national bourse are maintaining an uptrend since the beginning of the year on prospects of higher exports amid rupee
touching yearly lows. The Indian rupee at 67.42 weakened to a fresh 15-month low against the US dollar, tracking losses in Asian currencies.
Day’s ahead, cotton futures on MCX (May)is likely to trade with an upside bias in the range of 20500-21500 levels. At higher levels, we would
recommend to keep a word of caution as the counter may
Due to subdued cotton prices, as many farmers are reportedly looking to shift to soybean during the coming kharif sowing season, as the oilseed fetched
a better return last year.Cotton farmers had a bad experience last year, especially in Maharashtra, due to an attack by the pink bollworm on the standing
crop. Around a third of the 4.2 million ha under cotton in Maharashtra was hit by this.
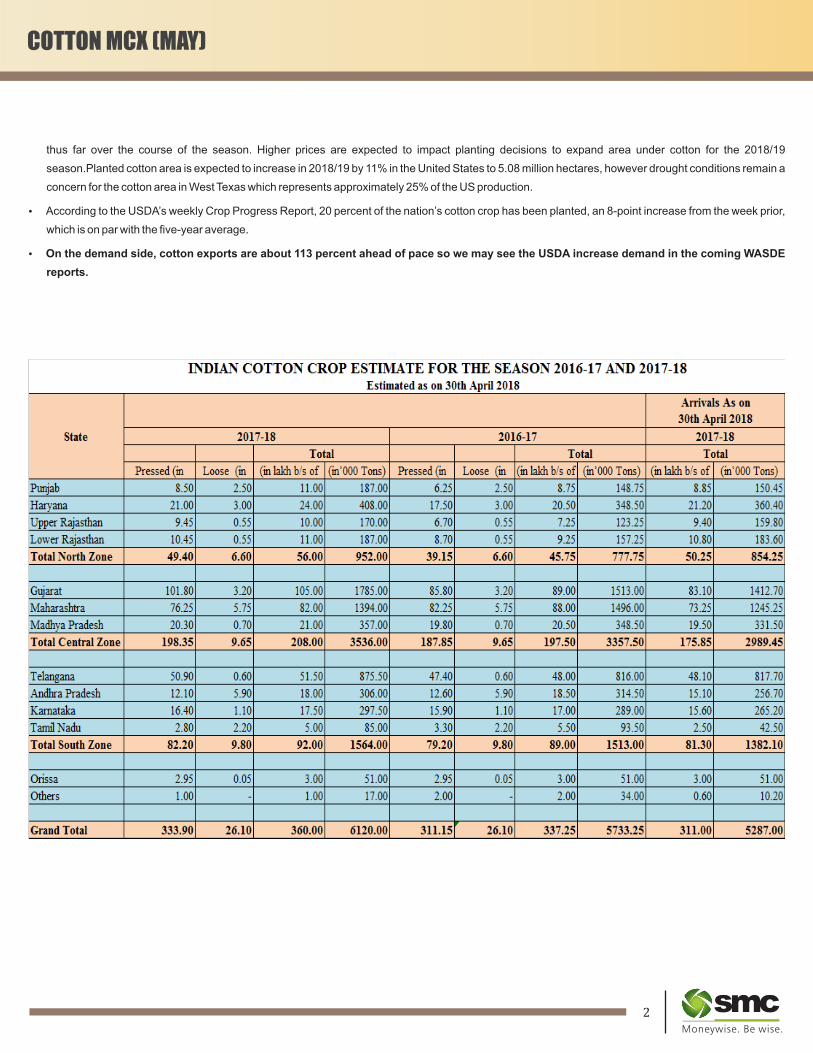
Retaining its earlier estimate of cotton crop at 360 lakh bales (each of 170 kg), the Cotton Association of India (CAI) has noted that around 86 per cent of
the crop has already arrived in the market by April 30, 2018.The apex cotton trade body has also made minor changes in the production figures for the
states.
For Maharashtra and Karnataka, cotton production is estimated to be higher by 2 lakh bales and 50,000 bales, respectively, while the production in
Telangana and Andhra Pradesh is now estimated lower by 1.50 lakh bales and 1 lakh bales, respectively, thus retaining the crop at the same level as
in the previous estimate last month.
The Statistics Committee of CAI has projected total cotton supply up to April 30, 2018 at 347 lakh bales. This includes market arrivals of 311 lakh bales
and imports estimated at 6 lakh bales, the CAI statement said.The country’s cotton consumption for the 7 months from October 2017 to April 2018 stood
at 189 lakh bales with an average of 27 lakh bales per month. Exports are estimated at 61 lakh bales as on April-end.
Cotton stock at the end of April 2018 is estimated at 97 lakh bales, including 52 lakh bales with textile mills, while the remaining 45 lakh bales is estimated
to be held by the Cotton Corporation of India and others, including multinationals, traders, and ginners.
As per the projected yearly balance sheet for the season 2017-18, total cotton supply till the end of the season by September 30, 2018 will be at 410 lakh
bales, including the opening stock of 30 lakh bales at the beginning of the season.
Domestic consumption is estimated at 324 lakh bales, while the exports are estimated to be 65 lakh bales. The carry-over stock at the end of the 2017-18
season is estimated by CAI at 21 lakh bales. The Statistics Committee is scheduled to have its next meeting on June 11.
On the Intercontinental Exchange, cotton prices are likely to maintain its bullishness and reach for 90-92 cents a pound, taking support near 80 levels.
Regarding fundamentals of cotton prevailing in the international market, prices have remained high in 2017/18 at an average of 88.08 cents per pound
Source:Reuters&SMCResearchSource:MCX
S2 S1 Pivot R1 R2
19690 20060 20520 20890 21350
Closingason8thMay,2018
Historic returns of Cotton MCX futures duringmonth of May
Forward curve of Cotton futures (MCX)
1 2
COTTON MCX (MAY)
thus far over the course of the season. Higher prices are expected to impact planting decisions to expand area under cotton for the 2018/19
season.Planted cotton area is expected to increase in 2018/19 by 11% in the United States to 5.08 million hectares, however drought conditions remain a
concern for the cotton area in West Texas which represents approximately 25% of the US production.
According to the USDA’s weekly Crop Progress Report, 20 percent of the nation’s cotton crop has been planted, an 8-point increase from the week prior,
which is on par with the five-year average.
On the demand side, cotton exports are about 113 percent ahead of pace so we may see the USDA increase demand in the coming WASDE
reports.
-9.86%
2.05%
-8.32%
-1.96%
4.34%
1.50%
-12%
-10%
-8%
-6%
-4%
-2%
0%
2%
4%
6%
2012 2013 2014 2015 2016 2017
20,610
20,880
21,180
20,760
20,500
20,600
20,700
20,800
20,900
21,000
21,100
21,200
21,300
Apr May Jun Jul
COTTON MCX (MAY)
Fundamentals
Cotton prices on the national bourse are maintaining an uptrend since the beginning of the year on prospects of higher exports amid rupee
touching yearly lows. The Indian rupee at 67.42 weakened to a fresh 15-month low against the US dollar, tracking losses in Asian currencies.
Day’s ahead, cotton futures on MCX (May)is likely to trade with an upside bias in the range of 20500-21500 levels. At higher levels, we would
recommend to keep a word of caution as the counter may
Due to subdued cotton prices, as many farmers are reportedly looking to shift to soybean during the coming kharif sowing season, as the oilseed fetched
a better return last year.Cotton farmers had a bad experience last year, especially in Maharashtra, due to an attack by the pink bollworm on the standing
crop. Around a third of the 4.2 million ha under cotton in Maharashtra was hit by this.
Retaining its earlier estimate of cotton crop at 360 lakh bales (each of 170 kg), the Cotton Association of India (CAI) has noted that around 86 per cent of
the crop has already arrived in the market by April 30, 2018.The apex cotton trade body has also made minor changes in the production figures for the
states.
For Maharashtra and Karnataka, cotton production is estimated to be higher by 2 lakh bales and 50,000 bales, respectively, while the production in
Telangana and Andhra Pradesh is now estimated lower by 1.50 lakh bales and 1 lakh bales, respectively, thus retaining the crop at the same level as
in the previous estimate last month.
The Statistics Committee of CAI has projected total cotton supply up to April 30, 2018 at 347 lakh bales. This includes market arrivals of 311 lakh bales
and imports estimated at 6 lakh bales, the CAI statement said.The country’s cotton consumption for the 7 months from October 2017 to April 2018 stood
at 189 lakh bales with an average of 27 lakh bales per month. Exports are estimated at 61 lakh bales as on April-end.
Cotton stock at the end of April 2018 is estimated at 97 lakh bales, including 52 lakh bales with textile mills, while the remaining 45 lakh bales is estimated
to be held by the Cotton Corporation of India and others, including multinationals, traders, and ginners.
As per the projected yearly balance sheet for the season 2017-18, total cotton supply till the end of the season by September 30, 2018 will be at 410 lakh
bales, including the opening stock of 30 lakh bales at the beginning of the season.
Domestic consumption is estimated at 324 lakh bales, while the exports are estimated to be 65 lakh bales. The carry-over stock at the end of the 2017-18
season is estimated by CAI at 21 lakh bales. The Statistics Committee is scheduled to have its next meeting on June 11.
On the Intercontinental Exchange, cotton prices are likely to maintain its bullishness and reach for 90-92 cents a pound, taking support near 80 levels.
Regarding fundamentals of cotton prevailing in the international market, prices have remained high in 2017/18 at an average of 88.08 cents per pound
Source:Reuters&SMCResearchSource:MCX
S2 S1 Pivot R1 R2
19690 20060 20520 20890 21350
Closingason8thMay,2018
Historic returns of Cotton MCX futures duringmonth of May
Forward curve of Cotton futures (MCX)
1 2
COTTON MCX (MAY)
thus far over the course of the season. Higher prices are expected to impact planting decisions to expand area under cotton for the 2018/19
season.Planted cotton area is expected to increase in 2018/19 by 11% in the United States to 5.08 million hectares, however drought conditions remain a
concern for the cotton area in West Texas which represents approximately 25% of the US production.
According to the USDA’s weekly Crop Progress Report, 20 percent of the nation’s cotton crop has been planted, an 8-point increase from the week prior,
which is on par with the five-year average.
On the demand side, cotton exports are about 113 percent ahead of pace so we may see the USDA increase demand in the coming WASDE
reports.
-9.86%
2.05%
-8.32%
-1.96%
4.34%
1.50%
-12%
-10%
-8%
-6%
-4%
-2%
0%
2%
4%
6%
2012 2013 2014 2015 2016 2017
20,610
20,880
21,180
20,760
20,500
20,600
20,700
20,800
20,900
21,000
21,100
21,200
21,300
Apr May Jun Jul

CHANA (JUNE) GUAR SEED & GUARGUM (JUNE)
Source:Reuters&SMCResearchSource:NCDEX Closingason8thMay,2018
Fundamentals
Since the beginning of the year, gaur complex have been reeling under the pressure of higher production & large inventories. During this
month, on the national bourse guar seed had made a new yearly low of 3659, while guar gum has tested 8030 levels.
Going ahead, the downtrend of Guar seed futures (June) is likely to get extended towards 3600-3450 levels.
The market sentiment of guar seed has been hurt mainly due to forecast of normal monsoon followed by higher production target set by Rajasthan
government.Rajasthan is expected to produce 17.50 lakh tons
guarseed during the Kharif crop season 2018-19, up 40% from
12.45 lakh tons a year ago due to forecast of normal monsoon.
In addition to it, there is around 90-100 lakh bags of guarseed
stock left in the country, which is more than sufficient to meet
demand and thus any sharp rise in prices unlikely.
Stockiest holding guar crop are expected to release their stock in
case of timely monsoon onset (June 1), and may result in higher
supply.
While Guar gum is expected to take support near 8000 levels &
witness some recovery towards 8600-8700 due to rising crude oil
prices in the international market.
Demand in Guargum is said to be steady from overseas due to rising crude oil and increasing number of rigs count.
Moreover, demand in Guargum is said to be good due to parity in crushing amid increasing ratio between Guarseed and Guargum.
On May 8, Guargum ratio at present is 2.20 of Guargum against 2.10 on Mar 7. It has increased mainly due to less fall in Guargum prices (-5.79%) as
compared with Guarseed (-9.67%) during the same period.
The increased ratio in Guargum is indicating that underlying demand is still encouraging due to higher crude oil prices. Guargum mainly is export oriented
commodity.
Brent crude oil at 76.75 rebounded to trade at the highest level since 2014 as investors focused on how buyers of Iranian crude will react to U.S. sanctions
Historic returns of Guar seed & Guar gumduring month of March
Forward curve of Guar seed & Guar gum futures
3 4
Fundamentals
Chana futures (June) is expected to take support near 3500levels& the upside may get extended towards 3700-3850 levels. The trend of this counter
may take a U-turn towards upside on the back of some fresh buying at the lower level. Moreover, slow selling by farmers at the lower rates against some
good buying from local buyers and exporters may add to the optimism of the market participants. Moreover, a weaker rupee may push forward the
shipments of pulses. The Indian rupee at 67.42 weakened to a fresh 15-month low against the US dollar, tracking losses in Asian currencies.
In recent days, improved demand at lower rate and rise in government's buying on the MSP lifted chana prices by Rs.50-Rs.75 a quintal with chana
(kanta) rising to Rs.3,550-Rs.3,600, chana (desi) ruled at Rs.3,400-Rs.3,450, chana (vishal) at Rs.3,550-Rs.3,600, chana (mausmi) - Rs.5,000-
Rs.5,100, while Kabuli Bitki was quoted at Rs.6,000-Rs.6,100 a quintal. Chana dal quoted at Rs.4,500-Rs.4,600, chana dal (medium) at Rs.4,700-
Rs.4,800, while chana dal (bold) ruled at Rs.4,900-Rs.5,000 a quintal. Dollar chana was Rs.4,200-Rs.5,000. In container dollar chana (42/44 count)
fetched Rs.5,800, dollar chana (44/46 count) Rs.5.600-5,650, while dollar chana (58/60 count) ruled at Rs.4,550.
The Madhya Pradesh government has declared an incentive of 100 rupees per 100 kg on minimum support price and masur to registered farmers. The
incentive will be provided to the farmers who have harvested the crops in 2017-18 (Jul-Jun) Rabi season.The incentive will also be paid to the farmers
who sold their produce when the incentive had not been declared. The procurement of masur began on Apr 10.
For 2018-19 (Apr-Mar), the Centre has fixed 4,250 rupees per 100 kg as the minimum support price for masur.
In 2017-18, production of masur is estimated at 679,000 tonsagainst 653,000 tonsin the state, and mustard production is pegged at 976,000 tons, higher
than 920,000 tonsin last year, according to data from the state farm department.
The Union government has extended the restriction on import of urad and moong dal across all
varieties to cover split and other forms to stabilise domestic prices.“Import policy of urad and
moong in split and other forms are also restricted in addition to urad and moong with annual
import quota of 3 lakh tons for all,” said a notification by the Directorate General of Foreign Trade.
In a bid to protect farmers from making distress sale, National Agricultural Cooperative Marketing
Federation of India Ltd (NAFED) has been buying chana for the ongoing Rabi season (2018) in
Telangana, Karnataka, Andhra Pradesh, Maharashtra, Madhya Pradesh, Gujarat and Rajasthan
under Price Support Scheme (PSS).As on May 05, 2018, NAFED has successfully procured
709977.123 MT of Chana at Minimum Support Price of Rs.4,400 (Rs.4250+150 bonus).
Purchase target completed in Telangana on 10 April 18. Purchase target completed in Karnataka
on 22 April 18.
Source:Reuters&SMCResearchSource:MCX Closingason8thMay,2018
Historic returns of Chana during monthof May
Forward curve of Chana futures
S2 S1 Pivot R1 R2
3241 3367 3609 3735 3977
State Quantity (MT)
Gujarat 1197.17
Maharashtra 50457.638
Rajasthan 150629.577
Madhya Pradesh 303080.062
Andhra Pradesh 77662.450
Karnataka 127301.264
Telangana 50000.05
Total 709977.123
S2 S1 Pivot R1 R2
3544 3693 3986 4134 4427
7940 8226 8756 9042 9572
0.80
0.85
0.90
0.95
1.00
1.05
1.10
1.15
Jan Feb Mar Apr May Jun Jul Aug Sep Oct Nov Dec
SeasonalIndexofGuarseedfutures SeasonalIndexofGuargumfutures
0.90
0.92
0.94
0.96
0.98
1.00
1.02
1.04
1.06
Jan Feb Mar Apr May Jun Jul Aug Sep Oct Nov Dec
3,713
3,789
3,845
8,222
8,341
8,477
8,200
8,250
8,300
8,350
8,400
8,450
8,500
3,650
3,700
3,750
3,800
3,850
3,900
May Jun Jul
ForwardcruveofGuarseedfutures ForwardcruveofGuargumfutures
3,540
3,564
3,604
3,652
3,700
3,500
3,550
3,600
3,650
3,700
3,750
May Jun Jul Aug Sep

SMC Global Securities Ltd. (hereinafter referred to as “SMC”) is regulated by the Securities and Exchange Board of India (“SEBI”) and is licensed to carry on the business of broking, depository services and related
activities. SMC is a registered member of National Stock Exchange of India Limited, Bombay Stock Exchange Limited, MSEI (Metropolitan Stock Exchange of India Ltd.) and M/s SMC Comtrade Ltd is a registered
member of National Commodity and Derivative Exchange Limited and Multi Commodity Exchanges of India and other commodity exchanges in India. SMC is also registered as a Depository Participant with CDSL and
NSDL. SMC’s other associates are registered as Merchant Bankers, Portfolio Managers, NBFC with SEBI and Reserve Bank of India. It also has registration with AMFI as a Mutual Fund Distributor.
SMC is a SEBI registered Research Analyst having registration number INH100001849. SMC or its associates has not been debarred/ suspended by SEBI or any other regulatory authority for accessing /dealing in
securities/commodities market.
The views expressed by the Research Analyst in this Report are based solely on information available publicly available/internal data/ other reliable sources believed to be true. SMC does not represent/ provide any
warranty expressly or impliedly to the accuracy, contents or views expressed herein and investors are advised to independently evaluate the market conditions/risks involved before making any investment decision. The
research analysts who have prepared this Report hereby certify that the views /opinions expressed in this Report are their personal independent views/opinions in respect of the subject commodity.
DISCLAMIER: This Research Report is for the personal information of the authorized recipient and doesn't construe to be any investment, legal or taxation advice to the investor. It is only for private circulation and use. The Research Report is based upon information that we consider reliable, but we do not represent that it is accurate or complete, and it should not be relied upon as such. No action is solicited on the basis of the contents of this Research Report. The Research Report should not be reproduced or redistributed to any other person(s)in any form without prior written permission of the SMC. The contents of this material are general and are neither comprehensive nor inclusive. Neither SMC nor any of its affiliates, associates, representatives, directors or employees shall be responsible for any loss or damage that may arise to any person due to any action taken on the basis of this Research Report. It does not constitute personal recommendations or take into account the particular investment objectives, financial situations or needs of an individual client or a corporate/s or any entity/s. All investments involve risk and past performance doesn't guarantee future results. The value of, and income from investments may vary because of the changes in the macro and micro factors given at a certain period of time. The person should use his/her own judgment while taking investment decisions.
Please note that SMC its affiliates, Research Analyst, officers, directors, and employees, including persons involved in the preparation or issuance if this Research Report: (a) from time to time, may have long or short positions in, and buy or sell the commodity thereof, mentioned here in or (b) be engaged in any other transaction involving such commodities and earn brokerage or other compensation or act as a market maker in the commodities discussed herein(c) may have any other potential conflict of interest with respect to any recommendation and related information and opinions. All disputes shall be subject to the exclusive jurisdiction of Delhi High court. All disputes shall be subject to the exclusive jurisdiction of Delhi High court.
5 6
GUAR SEED & GUARGUM (JUNE)
aimed at cutting exports from OPEC’s third-largest producer. Oil prices extended a rally after U.S. President Donald Trump confirmed his withdrawal from
a 2015 deal that had lifted sanctions against Iran.While industry watchers including have said the measures may curb the OPEC member’s production.
The U.S. is going pursue efforts to reduce
Iran’s crude sales again during and
following a 180-day wind-down period, but
once again has left the door open for
countries to seek “significant reduction
exceptions” at the end of the period if they
reduce the volume of purchases during
that time.
The U.S. will assess each country’s efforts
“including the quantity and percentage of
the reduction in purchases of Iranian crude
oil, the termination of contracts for future
delivery of Iranian crude oil, and other
actions that demonstrate a commitment to
decrease substantially such purchases,”
according to the Treasury Department.
The State Department expects to consult
with nations currently buying from the
Middle East producer during the 180 days.
India Guargum export during the fiscal year 2017-18 (April-March) rose nearly 18% at 494,126 tonnes as compared with 419,948 tonnes during the same
period a year ago, according to latest Agriculture & Processed Food Products Export Development Authority (APEDA).
2.23
2.11
2.20
2.10
2.12
2.14
2.16
2.18
2.20
2.22
2.24
Guargum&GuarseedRatio