costs, technology, and productivity in the u.s....
TRANSCRIPT

Costs, technology, and productivityin the U.S. automobile industry
Ann F. Friedlaender*
Clifford Winston**
and
Kung Wang***
This article analyzes the structure of costs, technology, and productivity in the U.S. au-tomobile industry by estimating a general hedonic joint cost function for domestic auto-motive production for the Big Three American automobile producers: General Motors,Ford, and Chrysler. In general it is found that costs are highly sensitive to the scale andcomposition of output, with General Motors and Chrysler experiencing an output config-uration that exhibits increasing returns to scale and economies of joint production. On theother hand, Chrysler's recent productivity growth is found to be far below that of GeneralMotors. Although Ford's cost structure is not so advantageous as General Motors', itsrecent productivity growth suggests that it can remain an effective competitor in the do-mestic automotive market.
1. Introduction and overview• The automobile industry has traditionally played a major role in the U.S. economy.The four domestic firms currently producing vehicles respectively represent the secondlargest (General Motors), the fourth largest (Ford), the seventeenth largest (Chrysler), andthe one-hundred and ninth largest (American Motors) industrial concerns in the UnitedStates.' Direct employment in automobile production totaled 1.5 million in 1979, exclu-sive of the additional employment in dealer systems, parts or materials suppliers, and theauto-related service industries (e.g., stereos, car washes, etc.). Moreover, activities under-taken by the auto industry have a direct effect upon energy consumption, air quality,traffic safety, and the urban and intercity transportation systems.
In spite of its historical (and recent) premier position in American industry, the U.S.auto industry is currently in a state of ffux. Not only has the Chrysler Corporation beenperilously close to bankruptcy, but Ford and General Motors have sustained unprece-
• Massachusetts Institute of Technology.•* Massachusetts Institute of Technology.*•* Massachusetts Institute of Technology.Support from the National Science Foundation, UPS Foundation, and the Future of the Automobile
Program at the Massachusetts Institute of Technology is gratefully acknowledged. In the course of completingthis research, we have benefited from several discussions with Jack Menge and from the helpful commentsprovided by the participants at the Sloan Micro Workshop at M.I.T., the Conference on Public Policy Issuesin the Automobile Industry at Stanford, and the referees and the Editorial Board of this Journal.
' In addition, Volkswagen has recently started domestic production. However, its scale of domestic op-erations is relatively small compared with the other domestic firms.
^ For a recent discussion of these and related issues, see the Goldschmidt Report (1980).

2 / THE BELL JOURNAL OF ECONOMICS
dented losses in recent years.^ Moreover, Renault of France has recently bought a majorinterest in American Motors, making it effectively a subsidiary of the French company.In addition, imports (particularly Japanese) have managed to achieve substantial pene-tration ofthe domestic market (approaching 30%), apparently indicating that the domesticproducers have not been able to respond effectively to recent changes in consumer tastes."Thus, one of the crucial questions facing the domestic automobile producers is to whatextent are their problems due to an unanticipated change in tastes toward small, fuel-efficient cars, and to what extent are they due to basic structural changes in comparativeadvantage that cannot be easily corrected.
To be sure, a full answer to this question requires an analysis of present and futuredemands for different types of automobiles as well as the present and future costs ofproduction in the United States and abroad. Although considerable empirical work hasalready been undertaken with respect to the demand for automobiles (Ben-Akiva, 1977;Manski and Sherman, 1980; Johnson, 1978; Lave and Train, 1977; Wharton, 1977) andcomparative labor costs and productivity (Abemathy and Clark, 1980; Leone et al., 1980),there has been relatively little empirical work on the underlying technology of the au-tomobile industry. Without a thorough understanding of the nature and extent of econ-omies of scale, economies of multiple or joint production, and the nature and extent ofproductivity growth, one cannot satisfactorily assess many ofthe recent developments inthe industry.
For example, over the past few decades there has been increasing concentration asmany small producers have either merged or gone bankrupt.^ More recently, there issome evidence of increasing specialization and emphasis on the production of fewermodels and even some attention to producing a "world" car instead ofthe diverse productlines that have typified American production. Thus, there are some indications that theworld auto industry could evolve toward a number of quasi-specialized companies con-centrating on particular classes of automobiles. In such a scenario, for example, Toyotaand Ford might specialize in "world" car production, while Mercedes and BMW wouldconcentrate on high-performance autos. Countering this phenomenon, however, is thetrend to diversified product and production technologies utilizing diesel and gasolineengines, robotics, electronic systems, plastics, etc.
The lack of specific quantitative information concerning the cost advantages asso-ciated with different output levels and types of product combinations suggests that itwould be desirable to perform an empirical analysis addressing this issue. Fortunately,recent developments in the economic literature concerning the behavior and technologyof multiproduct firms provide a vehicle for such an analysis.* Despite formidable dataproblems, this article presents an initial attempt to analyze the structure of costs andtechnology of the U.S. automobile industry and to assess the nature of its size-relatedeconomies and productivity growth. It is hoped that the approach taken here can beextended to analyze the behavior of foreign producers.
The article proceeds as follows. Section 2 presents an overview of the institutionalorganization and characteristics of the automobile industry. Section 3 develops the an-
•' In fact. Ford's domestic losses have been cushioned by profitable overseas operations. Thus, there is somequestion regarding the financial viability of Ford's domestic operations.
•* It appears that the penetration of foreign producers has peaked, since in the last few years most foreignproducers' shares have either stabilized or, as in the case of Volkswagen, declined.
' In addition to the possible bankruptcy of Chrysler and the effective takeover of American Motors byRenault, one should also cite the discussed mergers of Renault and Peugeot-Citroen. For a discussion of recentmergers in Europe, see Jones (1980). More generally, see Cohen (1980) and Abernathy (1978).
" For a discussion ofthe theoretical issues involved, see Baumol (1977) and Baumol, Panzar, and Willig(1982). For empirical applications, see Winston, Jara-Diaz, and Kravtin (1982), Wang Chiang and Friedlaender(1981), and Fuss and Waverman (1981).
FRIEDLAENDER, WINSTON AND WANG / 3
alytical framework that is used to guide the empirical analysis and describes the data base.Section 4 discusses the empirical results, and Section 5 presents a summary and the policyimplications of the analysis.
2. Institutional organization and characteristicsof the automobile industry• Since the development of the organizational structure of the automobile industry hasbeen well documented by Abemathy (1978), this section focuses on the elements thatshould be included in a characterization of technology. Although something of an over-simplification, it seems reasonable to characterize the industry as a marriage of two relatedconcepts: one developed by General Motors, which stresses the production of a largenumber of different types of cars to appeal to all types of consumer tastes; and onedeveloped by Ford, which stresses the economies associated with large-scale productionof a standard line of vehicles. Consequently, during the last 50 years domestic automobilemanufacturing has been characterized by large-scale production in conjunction with awide range of differentiated products.^ In other words, domestic automobile productionappears to have been organized to exploit both economies of scale (which refer to econ-omies of mass production) and economies of scope (which refer to economies of jointproduction or multiple outputs).
Although this characterization of the industry is useful as a general guide, a fullcharacterization of the industry's technology requires specific consideration of the natureof output, the production and planning processes, and the relationships among prices,outputs, and costs.
From the point of view of the consumer, the basic unit of production is the car,which is classified by make (e.g., Chevrolet) and model (e.g., Malibu). Thus, in terms ofdemand, the relevant unit of output is a specific automobile characterized by specificattributes (trim, air conditioning, power steering, etc.) within a given make or model.From the point of view of the producer, however, the unit of output is considerably moregeneral. Not only are the same dies used to produce parts for a wide range of differentmodels and makes, but parts and major components such as engines are often inter-changeable as well. Therefore, from the point of view of production, it seems reasonableto define output in terms of broad product lines (e.g., luxury, full-size, compact, subcom-pact, etc.) each of which has a range of generic attributes (e.g., wheelbase, weight, enginedisplacement, etc.).
In terms of production, the activities are not homogeneous, but are composed ofstamping, casting, machining, and assembling, with the latter activity being the funda-mental characteristic of automobile manufacturing. Thus, many automobile producersare primarily limited to the assembling process (Volvo), while firms that do not assembleparts into the final products would have to be classified as suppliers to the industry.Nevertheless, within the industry, there are varying degrees of vertical integration. GeneralMotors has its own divisions that provide a major portion of its stamping, casting, andmachining services internally, while American Motors purchases a significant share ofthese from outside suppliers. Consequently, in assessing the costs and technology of thefirms in the industry, it is useful to consider the degree of vertical integration and theindividual firms' relative demands for parts or materials inputs.
' This differentiation has existed, at least in the eyes of the consumer, if not in terms of the actual productionprocess.
* A recent example of this was the controversy that erupted when it was discovered that Chevrolet engineswere incorporated into many makes and models of Oldsmobiles.

4 / THE BELL JOURNAL OF ECONOMICS
With respect to the utilization of plant and equipment, the industry is characterizedby long planning horizons and extremely large fixed costs associated with the introductionof new car design. Thus, whenever a new type of car is introduced, there is a long processinvolving design, prototype construction, testing and evaluation, designing and manu-facturing of the production machinery and equipment, and the final production of thenew automobile. For example, the introduction of the current new line of front-wheeldrive automobiles by the American automobile manufacturers typically required a 3- to4-year planning horizon and enormous amounts of capital. This long lead time and theassociated massive investments consequently introduce a large amount of risk and widevariability in the utilization of capital stock. Since the capital used in production istypically quite long-lived, this implies that automobile manufacturers may not be at apoint of long-run cost minimization in which all factors are adjusted in an optimal fashionto minimize costs.'
Finally, it is important to note that the domestic automobile industry before 1979or 1980 could be characterized as a tight oligopoly, with General Motors recognized asthe dominant firm. Although there is little formal knowledge of the actual market behaviorof the firms in the industry, the available evidence suggests that General Motors set aprice that it thought would protect its market share, and the other producers followedaccordingly.'" In terms of estimating the structure of technology, this implies that althoughGeneral Motors simultaneously determined outputs, prices, and marginal costs, the otherfirms primarily acted as price followers with respect to G.M. Hence, this suggests that itis appropriate to treat General Motors' outputs as endogenous variables in the cost func-tion. It is also recognized, however, that since the bulk of the remaining outputs mustbe allocated between Ford and Chrysler, one of these firms will determine its outputs,given General Motors' prices, by the location of its marginal cost curves, while the otherwill supply the remaining outputs. In this article, we therefore argue that the outputs ofthe larger firm, Ford, should also be treated an endogenous, while those of Chrysler shouldbe treated as exogenous."
In short, this brief survey of the automobile industry provides the following guidelinesfor modeling the structure of technology: (1) output should be defined in terms of arelatively small number of generic product types; (2) because of varying supplier rela-tionships, the degree of vertical integration should be taken into consideration; (3) becauseof the long planning horizon and the long life of capital used to produce different typesof cars, capital of different vintages should probably be treated as a fixed factor; (4) inview of the determination of prices and outputs in the industry, it is probably reasonableto treat the output of firms other than Chrysler as being endogenously determined.
3. Conceptual framework, data, and variables
• Conceptual framework. Although there have been many studies analyzing the costsof automobile production (Bain, 1956; White, 1971; Pratten, 1971; Rhys, 1972; Toderet ai, 1978), each one has either assumed production can be characterized by a singlehomogeneous output or has analyzed the issue of scale economies at the plant level. Since,however, automobile manufacturers produce a wide variety of outputs and since there
' To the extent, however, that firms are able to shut down obsolete plants, they may have a fairly highdegree of flexibility in utilization of their plant and equipment.
"* In recent years, however, this characterization of the industry appears to have broken down as importshave risen dramatically.
'' In other words, given the total market demand for vehicles, Chrysler's output is treated as an exogenouslydetermined residual after Ford's and General Motors' output levels have been determined. To be sure, thischaracterization may not be realistic in the face of significant market penetration by foreign producers. Thisphenomenon relates, however, to only a small time period covered by our sample. As an empirical issue, wetest for exogeneity in the context of our econometric specification. (See footnote 32.)

FRIEDLAENDER, WINSTON AND WANG / 5
may be economies related to the scale of operations or the composition of output at thefirm level, it is desirable to analyze the costs and technology of automobile productionusing the firm (instead of the plant) as the basic unit of observation in the analysis. Thispermits the evaluation of economies that may be related to the size of the firm and itscomposition of output as well as to purely technical economies that may be related tothe scale of operation of a particular plant.
The general hedonic cost function to be used in this analysis can be written as:'^C = C(<if(Y, q), w, t, T) (1)
where
C = total costs^, = generic level of the rth outputYi = physical level of the rth outputqi = qualities associated with the /th outputw = vector of factor pricest = vector of technological conditions'^
T = time variable'".In recent years a large literature has developed utilizing a wide variety of second-
order approximations to estimate the general cost function given in equation (1)." In thisanalysis we utilize a quadratic approximation, which represents a second-order Taylorapproximation around the mean.'* We thus write the cost function as:
C = «o + 2 a,(0,- - 4>d + 2 0,(wi - wj) + 2 ynith - th) + h(T - T)J h
+ '/2[2 2 AU<t>i - 0/)(0m - 0m) + 2 2 5j«(W; - WJ)(W„ - W„)
+ 2 2 CMUI, - t,)(ti - i!) + DTT(T - T)^] + 2 2 £,;(0, - Mwi - Wj)hi • i
+ 2 2 FMi - 4>d(th - th) + 2 G,T(0/ - MT- f) + 2 2 //;/,(W; - wj)(t,, - F,,)i h
+ 2 J,T(WI - Wj)(T - f) + 2 K,,T(th - t,)(T - f) + e, (2)
' See Spady and Friedlaender (1978) for a discussion of hedonic cost functions.' ' See McFadden (1978) for a discussion of the justification for introducing technological conditions into
a cost function.'"This variable captures purely time-related changes in costs and technology. See Stevenson (1980) for
a discussion of this point.' In estimating cost functions empirically, it is generally important that no a priori restrictions be imposed
concerning the structure of technology, particularly with respect to issues of homotheticity or elasticities offactor substitution. Since conventional functional forms such as the Cobb-Douglas or CES assume separableor homothetic technologies and impose constant elasticities of factor substitution, they may not be suitable. Fora full discussion of these points, see Hall (1973) and Berndt and Khaled (1979).
" Baumoi, Panzar, and Willig (1982) have argued that the quadratic approximation is particularly attractiveto use in multiple-output cost functions since it permits an easy analysis of marginal costs and scale and scopeeconomies. Although the use of the quadratic approximation has been criticized for its inability to impose thehomogeneity condition needed for cost minimization (Caves, Christensen, and Tretheway, 1980), Berndt, Fuss,and Waverman (1979) have developed procedures to deal with this problem. In any event, this problem is notsignificant for our analysis, since data limitations prevent us from controlling for all of our factor prices in theanalysis. (See footnote 28.)
Although the translog approximation is also frequently used in estimating cost functions, the existenceof a large number of zero outputs for small cars in the early portion of our sample would clearly have presentedsubstantial problems in using this functional form. It is possible to use a Box-Cox transformation in a translogspecification to circumvent the problem of zero values, but the limited number of observations in our sampleand the increase in the number of parameters to be estimated that is involved in such a transformation precludedits use.

6 / THE BELL JOURNAL OF ECONOMICS
where
CM = C,H Vh, I
and e represents a disturbance term.For purposes of estimation, we must also specify the generic (hedonic) function. To
economize on the number of parameters, we assume that this can be represented by asimple linear approximation and write
<t>i = yi+X air(qir - qir). ( 3 )r
Thus, when equation (3) is substituted into equation (2), we obtain the complete generalspecification of the cost function used in this analysis.
Using Shepherd's lemma, we derive the following factor demand equation for theyth factor
fiC^ / = ^ = ^y + 2 B|„(w„ - w„)
+ 2 Ei0i - U + 2 Hi,(th - i,,) + JIT(T -T) + (<, (4)
where Cy represents the disturbance term. Since the error terms of the cost and factorshare equations are correlated, it is desirable to estimate the factor demand equationsjointly with the cost function to increase the efficiency of the estimates."
To implement empirically this specification of technology, it is necessary to considerthe quality of the available data and the institutional points raised in Section 2. Thus wenow turn to a discussion of our data base and then present the specification used in theempirical analysis.
D Data and variables. The data base used for this analysis is a pooled cross section, timeseries sample of the "Big Three" domestic automobile manufacturers: General Motors,Ford, and Chrysler,'* for the period 1955-1979. Although these companies exhibit sub-stantial differences in organizational structure, their production technologies are suffi-ciently similar for us to analyze them as if they shared a common technology."
" Since we were unable to control for all of the factor prices in the specification (see below), we did notemploy the usual practice (Berndt et al.. 1974) of deleting one of the factor demand equations in the estimationof the system.
" Initially, efforts were made to include American Motors in the sample. But the differences in the scaleof operations between American Motors and the other three producers were sufficiently great that the approx-imation used to estimate the cost function did not appear to be valid in this case. More specifically, it is highlylikely that American Motors' technology is different from the technology employed by the Big Three becauseit is less vertically integrated. Further, given its smaller scale of operations and lack of integration, AmericanMotors produces a much smaller set of makes and models than the Big Three producers.
" If, in fact, the underlying technology facing each firm were different, this could be statistically testedby the use of firm-specific dummy variables. When these were introduced, however, they proved to be statisticallyinsignificant, thereby indicating that there are no significant differences in the underlying technology facing the"Big Three" domestic auto producers. Unfortunately, a Chow test or a test which utilized dummy variablesthat interacted with specific variables, such as factor prices or outputs, could not be employed because of a lackof degrees of freedom. Nonetheless, our finding regarding a common technology among the Big Three producersIS consistent with conventional wisdom regarding the industry. For instance, Edwards (1965) points out thatthere has been a significant exchange of production technology within the domestic industry. In addition. White(1971) argues that little, if any, of the technology is secret, since there are no key patents controlling the basicmanufacturing processes in the industry.
FRIEDLAENDER, WINSTON AND WANG / 7
The analysis in the previous section indicated that capital is long-lived and notparticularly adaptable to production other than that for which it was planned. This in-dicates that it might be appropriate to estimate a short-run cost function whose dependentvariable would be the noncapital variable costs of production and whose arguments wouldcontain measures of physical capital of varying vintages. Unfortunately, however, dataare not available to permit this analysis. Not only are costs available only on an aggregatebasis, but there are also no data available on the stock of physical capital utilized by theautomobile firms. We consequently had to utilize a long-run cost function in the analysis.From a theoretical viewpoint, this is equivalent to assuming that the automobile firmsare able to adjust their capital stock in an optimal fashion on an annual basis. Althoughsuch "fine tuning" is probably not possible, substantial changes in investments and scrap-page do occur on an annual basis, indicating that the assumption of optimal adjustmentsin the capital stock may not be totally unrealistic.
The data on costs used in the analysis come from the firms' annual reports and henceinclude costs of foreign and nonautomotive operations. But, the available data on factorprices refiect only those of domestic production, which created a serious errors-in-variablesproblem when the full joint cost function was estimated. Consequently, it was assumedthat domestic production and foreign and nonautomotive production were nonjoint, anda cost function was estimated for domestic automotive production alone.^° To this end,we constructed a series of domestic production costs based on a recent analysis bySanford C. Bernstein Co. (1979)^' of the costs of domestic and foreign operations.^^Finally, it should be noted that the domestic expenditures on each factor were derivedfrom the firms' annual reports.
Output was initially divided into six categories, according to the general marketclassifications: ^ luxury cars, full-size cars, compact cars, subcompact cars, truck produc-tion, and a residual, representing tractor production, changes in inventory, and nonau-
° To state the problem formally, production is nonjoint if the joint cost function C = C{yi, . .. , y,,; w)can be written as a nonjoint cost function, C = 2 Ciiy/, w), where y, represents the output type / and w repre-sents the vector of relevant factor prices. Note, however, that since C = 1. C,(>',, w) is a restricted case ofC = C(y , yn', w), no specification error results if a general joint cost function is estimated, when in factproduction is nonjoint. With a nonjoint cost function, it is apparent that d^C/dyidyj = 0. Hence, by restrictingthe appropriate parameters of the joint cost function to be zero, one can statistically test whether the costfunction is nonjoint (Hall, 1973). Although a full joint cost function was estimated, the errors-in-variablesproblems created by the use of domestic factor prices were sufficiently great to make the results of this equationunreliable by usual statistical criteria. Hence, we treated the assumption of nonjoint production for the timeperiod covered by our sample as a maintained hypothesis and thus confined the cost analysis to domesticoperations. Domestic costs were defined to include the cost of goods sold (including labor and materials),depreciation, selling and administration, amortization of special tools and equipment, interest, income taxes,maintenance and repair, other taxes, research and development, and an after-tax return to capital of 12% toreflect a normal rate of return. In addition to corporate annual reports, these data came from Moody's IndustrialManual.
^' It should be noted that this was the only breakdown of the costs of domestic and foreign operations thatwas readily available. Curiously, the financial reports (10-K's) of the companies do not include such a breakdownof costs.
^ Because these data were only available for 1979, we were forced to extrapolate these figures backward.Following Young and Hood's (1977) description of the Big Three producers' investment pattern in Europe, weassumed that Ford's foreign activity grew by .5% per year from 1955 to 1979. that General Motors' foreignactivity grew by .5% per year between 1960 and 1979, and that Chrysler's foreign activity grew by .5% per yearbetween 1955 and 1970, at which time it stabilized at its current levels. Although these assumptions are basedon the Big Three producers' European activity, it should be noted that this activity constitutes a very largeproportion (70%-80%) of their overseas production (Young and Hood, 1977). As an econometric point, it isworth pointing out that any imprecisions that might result from the procedure described above would lead toa measurement error in the dependent variable. It appears that such an error would not be systematically relatedto any of the explanatory variables, so that it is likely that the parameter estimates would remain consistent.
" These data came from Ward's Automotive Yearbook.

8 / THE BELL JOURNAL OF ECONOMICS
tomotive production.^'' But when the estimation was undertaken, it was found that therange of output was sufficiently variable that the approximation of the cost functionaround the sample mean deteriorated. In particular, we were unable to obtain marginalcost estimates that were within an acceptable range of reasonableness. Hence furtheraggregation was used, and the following three output variables were included in theanalysis: compact and subcompact cars, full-size and luxury cars, and trucks.
The hedonic quality attributes should reflect the intrinsic characteristics of the outputthat affect production costs rather than superficial attributes that might affect consumerdemand. This suggests that engineering aspects of the automobile such as type of drivesystem, wheelbase, engine, and suspension are more relevant than, say, accessories, trim,and the like.- ' In this analysis we included three attributes to reflect the intrinsic natureof the car: wheelbase, weight, and cylinder capacity.- ^
Although automobile production is a highly complex activity involving many refinedtypes of inputs, data limitations forced us to follow a rather aggregate approach andinclude only the following three factors in the analysis: labor, capital, and materials. Asindicated above, it would have been desirable to treat capital as a fixed factor (incorpo-rating different vintages), but data were not available to permit this. We thus treatedcapital as a variable factor and used the expected return of a firm's assets, including itsbonds and stocks, as the price of its capital. The expected return of the stock was estimatedwith the capital asset pricing model, while we calculated a weighted average of the intereston long-term debt to represent the expected return of the bonds." Labor costs wereestimated as the average hourly wage of domestic labor (including fringe benefits). Finally,lacking data on the materials inputs actually used in production, we used the price ofsteel plate per ton as a proxy. *
The technological variables used in the cost function should include not only variablesthat indicate organizational differences among the firms, but also variables that reflectexogenous shifts in the production technology that might not be captured by the timevariable alone. We have already argued that a variable reflecting the degree of verticalintegration should be incorporated to capture differences in the degree to which the firmconcentrates on assembling.^' Since data reflecting interfirm organizational differencesare not readily available, a reasonable proxy is the use of simple firm-specific dummyvariables.^"
^' Since Ward's provides production statistics on the first five categories, the residual was obtained bysubtracting these figures from total sales.
" For an analysis of consumer valuation of automobile attributes, see Griliches (1961).*' These characteristics were calculated as a weighted average for each output group.
" See Brealey and Meyers (1981) for a discussion and justification of this procedure.* The utilization of steel in a typical automobile accounts for roughly two-thirds of the material inputs.
In the course of the estimations we also used a constructed composite materials index; however, the index didnot lead to any improvement in the estimation results. Finally, it should be noted that since not all of the factorprices appeared in the cost system, we did not impose the homogeneity condition in the estimations re-ported here.
-'* In principle, this variable could be measured as value-added as a percentage of sales. Although thisinformation is available on an industry basis, it is not readily available on a firm basis. Thus, we could notincorporate it in our analysis.
•™ Although firm-specific dummy variables can indicate that significant differences may exist in the structureof costs of each firm, they cannot indicate whether these differences are due to organizational structure or tobasic technology. Thus, their coefficients should be interpreted with considerable caution. They proved, however,to be statistically insignificant in the analysis (cf footnote 19). In a recent article, Monteverde and Teece (1982)used a limited dependent variable model to analyze the likelihood of vertical integration in the production ofspecific automobile components. Unfortunately, their analysis does not yield a measure of vertical integrationthat we could use, because they considered individual components instead of the overall production of vehicles.Moreover, since their measure of vertical integration is confined to dummy variables, it does not seem to differsubstantially from the firm-specific dummy variables we used in this article.

FRIEDLAENDER, WINSTON AND WANG / 9
In addition to reflecting organizational stmcture, the technological variables couldalso be used to reflect basic changes in the technology that could not be captured by thetime variable alone. This is particularly true for nonsystematic changes in the productionfunction. In this respect, the increased degree of govemmental regulation—particularlywith respect to emissions—is significant, since the industry has vociferously claimed thatemissions controls have increased costs substantially. To measure this effect we con-structed a variable to reflect the percentage reduction in the target emissions level thatwas mandated each year. Further, to capture the extent to which foreign competition maystimulate technical change, we utilized the number of foreign models sold in the UnitedStates as a technological variable.
D Final specification. Initial attempts were made to estimate the cost and factor demandequations given in equations (2)-(4) with the full complement of technological variablesand a full range of outputs. But, given the limited number of observations (75), weencountered severe problems attributable to the limited degrees of freedom. Althoughaggregation into three output types helped the econometric estimation, problems stillexisted with including the range of technological variables. Apparently, the output vari-ables captured most of the organizational effects, and the time trend captured any effectsof technological change or shifts in the cost function induced by regulation. Thus, in thefinal estimation we omitted the technological variables. In addition, since the interactionterms of the hedonic variables with outputs and factor prices proved to be consistentlystatistically insignificant, they were dropped. Thus, the final estimating cost equation andits associated factor demand equation took the following forms:
C = ao + 2 ai(yi - yd + 2 ^j(Wj - vv,) + Z 2 T,/(?// - Qii) + ^T(T - f)
+ '/2 2 2 ^™(y, - yi m
+ V 2 D T T ( T - T ) ( T - T ) + Z 2 F , ; ( y , - y,)(wi - Wj) + 2 2 D
i " ,cv
• i
X ( r - f) + 2 AHy, - MT - f) + 2 D^Awt - Wt)(T - f) + «,
Xi=^ = j + 2 |3J„(w„ - w«) + 2 F,v(y, - y.) + D^AT -T) + ti, (6)
where ,>« = A^i Vi, m\ B^ = Bn, Vn, j ; and e and «y represent tbe error terms for thecost equation and the ;th factor demand equation, respectively. Table 1 presents a listof the specific variables used in this analysis, while Table 2 presents their means andstandard deviations.
Before turning to the estimation results, it is useful to consider the economic inter-pretation of the coefficients. The marginal cost of output / is given by
MQ = ^ = a, + 2 AUyn, - j m) + 2 Fij(wj - Wj) + D^AT - T). (7)dyi m i
Thus each a, represents the marginal cost of output type /, evaluated at the mean outputlevels, factor prices, and time period. Since the change in marginal cost with respect tooutput (dMCi/dyj) is given by the An coefficients, these can be either positive or negative.Aij < 0 implies weak cost complementarity, while Ai, > 0 implies no weak cost comple-mentarity. Aji can be %0 depending on whether marginal costs are rising or falling. Thechange in marginal cost with respect to factor prices (dMCJdWj) is given by F,y and shouldbe positive since increases in factor prices should cause the cost function to rise. Finally,the change in marginal cost with respect to time (SMCi/dT) is given by Z),T and could

10 / THE BELL JOURNAL OF ECONOMICS
TABLE 1 Notation of Variables Used in Estimation
Notation Variable
C total cost of domestic production per year (in million dollars)y, small car production per year (subcompact and compact)^2 large car production per year (full-size and luxury)yi truck production per yearQi, wheel base of small car (in inches)g,2 weight of small car (in pounds)9i3 cylinder capacity of small car (in cubic inches)921 wheelbase of large car (in inches)^22 weight of large car (in pounds)^23 cylinder capacity of large car (in cubic inches)^31 weight of t ruck (in pounds )w, labor price (in dollars per hour)W2 capital price (in percent per dollar per year)^3 materials price (in dollars per ton)T dummy variable for time
be positive or negative depending upon whether the pure time-related changes in marginalcosts are rising or falling. Since this also refiects the output-related change in productivity,a negative value of Z),T implies that technical change increases with the scale of output.'
Equation (6) gives the ;th factor demand equation and indicates that each fi, rep-resents the demand for factor j when all the other variables are evaluated at their mean,and should therefore be positive. Since dXj/dWn represents the change in demand forfactor j with respect to the price of factor n, B,n can be positive or negative, dependingon whether factors ; and n are complements or substitutes. Since the own-price effectsshould be negative, however, each Bjj should be negative. The /",, coefficients reflect thechange in factor demand with respect to each output (dXjIdyi) and should be positivesince additional output is not a free good and requires more inputs.^' Finally, the changein the demand for the ;th factor with respect to time (dXj/dT) is given by DJT and shouldbe positive or negative according to the direction ofthe ;th factor's augmented technicalchange.
Since the interaction terms between quality attributes and the other variables havebeen restricted to zero, the 7,7 coefficients reflect the changes in costs with respect to eachattribute: wheelbase, weight, and engine size of each type of output, evaluated at the meantime period. Since these variables represent technological conditions associated with pro-duction, they could be positive or negative. Finally, the D,7r variables represent the changesin these costs with respect to time and can also be positive or negative, depending on thenature of technical change.
4. Empirical results
• As pointed out in Section 2, General Motors' and Ford's outputs cannot be assumedto be exogenous. Consequently, an instrument was constmcted for each of their outputs. ^
' This also follows since F;, = Fy, and we have argued that dMCJdwj = F,, > 0.•• Instruments were obtained for each firm's outputs by regressing each of the outputs on the following
variables: the finn's market share of that output in the previous year, the absolute level of that output in theprevious year, disposable income per capita, GNP, prime interest rate, unemployment rate, total installmentcredit, and the retail gasoline price. The specification that is obtained by this procedure is basically an aggregatedemand model for each type of output (see Wharton (1977) for a similar demand specification). It should benoted that the specification described here had the best predictive power ofthe specifications that were considered.Finally, the theoretical assertion that Chrysler's output should be treated as exogenous was tested empirically.Following the idea developed in Hausman's (1978) specification test, we used the sum of squared residuals fromthe specification which instrumented all ofthe outputs and the sum of squared residuals from our specificationwhere Chrysler's output was treated as exogenous. The F-test statistic was .641 while the 5% critical value is3.47; hence, for our sfiecification we could not reject exogeneity at the 5% level.

FRIEDLAENDER, WINSTON AND WANG / 11
c o« '.3
2 «c/3 Q
,927
,158
oo p-
,102
oo
m (Noo fN
mTt
tn -^ (Noo — oo
OO
285.
o
<N
O
175.
uVO
VO
•s
I
I1
oc_os
IQ
oo
o
p §"O cdrec/3 Q
§
II
O oo
00 ON O\W-1 ^ —\O^ 00^ f^TT" O' fO O 00Tt fN| (N
ON
o
88o
VO
19.
<N
19. - iS!
^' TffN POr* ro
ONVO
16.
ON
VO O O
VO
vdON ^ rsrr' — dO oo —— r- fvj
—• Tt »ri
Q
Tt
527,
,442
679,
,474
00
VOVO
384.
,650
OO 00 —"" P^ rn— p^ rn
(N 00 <NOO r o
0000SO
I
Ov
968
VO
234.
ONON
118.
VO
830.
2;
341.
(NooOil
•g .2S uc/5 Q
fOoof*S
<NfN(N
rofOTt'
oONfN VO
Ov
roOod
00VO ovp
fN
ooro
OVOfN'
3•Oc p
od — Om VOf l 00
00 fN r^— oo ro
at2 O
utpi
§3
1113ac
Si iz u 111
c ^

12 / THE BELL JOURNAL OF ECONOMICS
TABLE 3 Domestic Cost System
Variable
constanty, (small car)^2 (large car)^3 (truck)
y,y,y>y2
yiy^
^2^2
>'2>'3
^3^3
H', (labor)H'2 (capital)W3 (material)H'lH'i
H'iH'2
H',H'3
H'2 H'2
H'3H'3
W\y\W\y2w.y-.H'2 V]
H'2>'2
w,yt
H'3>'2
^3^3
r(time)7 > i
7>2Tyy
Tw,TW2
Tw,TTq,, (wheelbase, small car)q,2 (weight, small car)13 (cylinder capacity, small car)21 (wheelbase, large car)
922 (weight, large car)23 (cylinder capacity, large car)31 (weight, truck)
Tq,,TqnTq,3Tqi,Tq22
J ^23
Cost EquationLabor EquationCapital EquationMaterial Equation
CoelRcient
12845.1.002264.004282.005499
-1 .3 X 10-'-2 .9 X 10-'
2.1 X 10-'-3 .8 X 10-'°-6 .6 X 10-'°-7.1 X 10-'
541.1146.5878.2
-33.913.5126.43
-15.30-48.29
-5.16 X 10-'27.4 X 10-'
-8.83 X 10-'5.37 X 10"'8.21 X 10"'2.64 X 10-'4.23 X 10-'25.8 X 10-'17.8 X 10-'
-140.8-.000348
.000258-.0015215.4751.1293
21.1959.76
-24.713-.4352
-8.24520.235
.9612.67-.0344
-15.31.4544
-2.197918.747
.06252.1676-.0124
R^
.98
.93
.95
.90
Standard Error
603.05.002058.000620.003055
1.3 X 10-'2.2 X 10-'1.1 X 10-'9.5 X 10-'"2.2 X 10-'
1.01 X I0 - '9.153.28
13.967.882.586.201.806.99
6.06 X 10-'1.35 X 10-'6.77 X 10-'2.18 X 10-'4.99 X 10-'2.52 X 10-'9.21 X 10-'2.04 X 10-'10.2 X 10-'140.8
.00075
.00019
.0007693.661.345.336
41.3976.141
2.4512.37
286.422.26
13.52.3794
8.65.466
3.2936.159
.25772.0056
.0363
R^
.94
.92
.94
.90

FRIEDLAENDER, WINSTON AND WANG / 13
Then, using the data base described in Section 3, we estimated the cost and factor demandequations with Zellner's seemingly unrelated regression procedure.
The parameter estimates pertaining to the domestic cost system are presented inTable 3 ." As can be seen, the parameters have the expected sign with the exception ofthe coefficients for w,;;, and W\y3, which are insignificant.^" In addition, the magnitudesof the coefficients are reasonable; in particular the estimated marginal costs of $2,264,$4,282, and $5,499 respectively associated with the production of small cars, large cars,and trucks at the sample mean, seem quite plausible and, given that each coefficient isat least as large as its standard error, indicate reasonable reliability.
The parameter estimates can be used to calculate several measures that pertain tothe technology and productivity of the U.S. automotive firms, including elasticities ofsubstitution, multiproduct economies of scale, economies of scope, and productivitygrowth.-*' The elasticity of substitution between two inputs, r and s, is equal to
(f)"'"(f) cc
where the subscripts pertaining to the total cost, C, denote partial derivatives. The esti-mates of the elasticities of substitution and their standard errors (at the point of approx-imation) are presented in Table 4. The results indicate that both labor and capital and
TABLE 4 Elasticities of Substitution Evaluatedat Grand Sample Mean*
Labor
Capital
Materials
Labor
-1.49(.35)
Capital
2.19(.43)
-9.04(1.24)
Materials
0.71(.169)
-0.54(.222)
-0.80(.127)
* Standard errors in parentheses.
" Although we report on the significance of various alternative specifications throughout the article, it isuseful to summarize these results briefly. First, the most significant improvements in initial specifications thatled to the current model included using instruments for the output variables and using a more precise capitalprice, which was based on the capital-asset pricing model, instead of a simple weighted average of the cost oflong-term debt. The first change led to more reasonable estimates of scope economies (estimates that were basedon a specification where the outputs were not instrumented were often significantly greater than one), while thesecond change led to more reasonable estimates of marginal costs and factor elasticities. In addition to theseimprovements, a number of alternative specifications were estimated, which included a range of technologicalvariables, a dummy variable to capture technological diflerences among firms, a constructed composite materialsindex, and further disaggregation of output. Unfortunately, all of these changes proved unsuccessful, since theestimated parameters associated with these variables were highly insignificant. In addition, in some cases differentspecifications yielded somewhat less reasonable marginal cost estimates or less precise estimates of factor elas-ticities (particularly with respect to capital and materials).
'" For the most part, the coefficients with regard to the hedonic qualities are also statistically unreliable.•" Standard errors are provided for estimates that correspond to the industry's sample mean. Unfortunately,
calculation of the standard errors at points other than the sample mean (including for the typical firm in the1979 period) imposes excessive computational requirements, since the variances and covariances of the 49parameters that were estimated need to be included in the calculations. When the standard errors are evaluatedat the sample mean, the number of parameters that are needed in the calculations falls significantly.

14 / THE BELL JOURNAL OF ECONOMICS
labor and materials are complements, while capital and materials are substitutes. In ad-dition, the demand for each factor (with the exception of materials) is quite responsiveto changes in its price. In the case of the demand for capital, this result is particularlyimportant since it suggests that our assumption that firms are in long-run, as opposed toshort-run, equilibrium may not be unreasonable. That is, although a priori it seemed thatit would be desirable to derive a long-run cost function from an estimated short-run costfunction that included a fixed capital stock as an argument, our empirical results suggestthat this procedure is not necessary. * To be sure, the demand elasticity for capital israther large by traditional standards; nonetheless the careful construction of the underlyingcapital price and the statistical precision of the elasticity estimate (as indicated by itsrelatively low standard error) suggest that the implications that we draw from the estimateare very likely to be valid.
The estimated coefficients can also be used to calculate the multiproduct degree ofscale economies at a given point of production. As shown by Panzar and Willig (1977),this measure is given by the following expression:
. ,9,
This will be greater or less than one in economies or diseconomies of scale exist; a valueof one represents constant returns to scale."
Table 5a presents the estimated returns to scale for a "typical" firm producing at thesample mean and in the most recent time-period in our sample, 1979, and for each of
TABLE 5
a. Global Economies of Scale by Firm*
Industry's typical firm
General Motors
Ford
Chrysler
Sample Mean
1.05(.09)
1.23
0.88
1.16
1979
1.23
1.10
0.79
7.44
• Standard error in parentheses.
b. Multiproduct Economies of Scale
Sample Mean 1979
Ford: with General Motors'product mix, factor prices,and hedonic attributes 1.17 1.76
Chrysler: with General Motors'product mix, factor prices,and hedonic attributes 1.24 4.40
•"" It should be noted that this conclusion is only suggestive, since we treat the assumption that firms arein long-run equilibrium as a maintained hypothesis in our empirical analysis.
" Note that the single-output measure of the elasticity of cost with respect to output is given by MCI ACand is greater or less than one as decreasing or increasing retums to scale exist. A single-output measure of
retums to scale is therefore given by the reciprocal of the cost elasticity (that is, 5 = AC/MC = ^^^ 1.V dC/dYj
Equation (9) is a multiproduct generalization of the single-output measure of scale economies and is consequentlyS 1 as production is subject to increasing, constant, or decreasing retums to scale.

FRIEDLAENDER, WINSTON AND WANG / 15
the domestic automobile firms producing at their respective sample means and in 1979.These figures are interesting and indicate a wide diversity in estimated returns to scale.Thus, while the "typical" firm, at the sample mean, appears to produce under constantreturns to scale, Chrysler and General Motors appear to be subject to increasing returns,while Ford is subject to decreasing returns. Thus, if Chrysler and General Motors wereto increase the output of all of their product lines simultaneously while maintaining thesame product mix, they would find that their costs rose less than proportionately, whileFord's costs would rise more than proportionately if it increased production in the samemanner. These qualitative findings remain unchanged when we consider the 1979 period.The results for the 1979 period are striking, however, in that they indicate that Chrysler'srecent cut-back in production has prevented it from exhausting a substantial amount ofits potential scale economies.^*
The difference in the estimated scale economies among the firms in the sample isstriking and also somewhat counterintuitive in terms of the conventional single-outputanalysis, which argues that scale economies tend to diminish with firm size. That is,although these empirical results indicate that the smallest firm could enjoy further econ-omies by expanding its scale of operations, this appears to be true for the largest firmas well.^'
The reasonableness of this result can be understood by reestimating the degree ofmultiproduct scale economies that would accrue to Ford and Chrysler if they producedat their observed scale of output but were able to utilize General Motors' product mix,hedonic attributes, and factor prices.'*" As can be seen in Table 5b, both Ford and Chryslerwould exhibit economies of scale if they were able to adopt General Motors' productioncharacteristics. This indicates that the somewhat counterintuitive nature of our results,in terms of the single-product analysis, can be explained by the fact that the single-productanalysis fails to take into account the way in which differences in product mix can influencethe overall degree of economies of scale.""
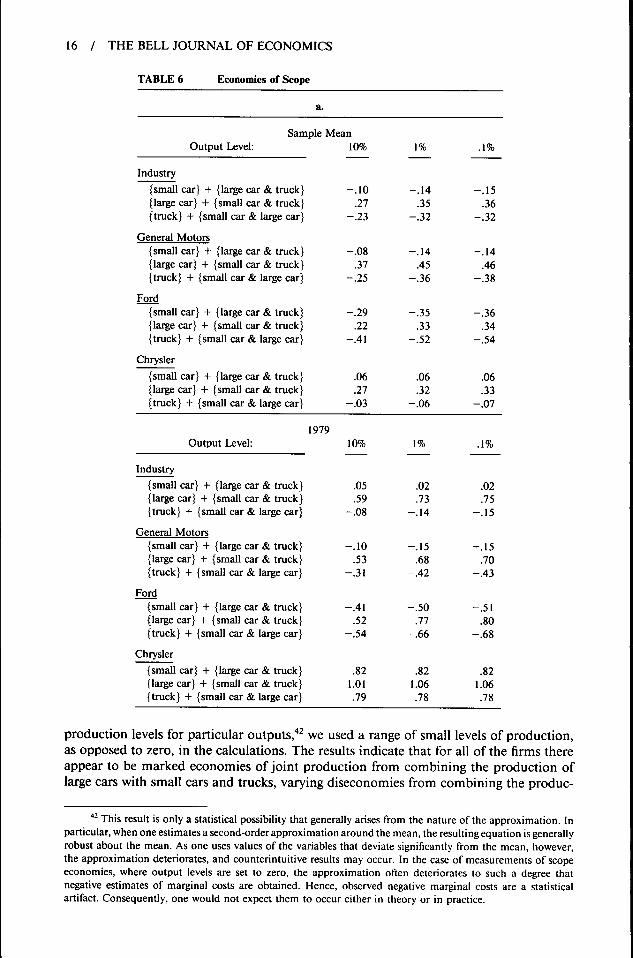
As indicated above, although there may be economies associated with the level ofoutput, there may also be economies associated with the composition of output. Con-sequently, in assessing the relative efficiencies of firms it is desirable to estimate the degreesof economies of scope, which measure the effects of joint production upon costs. FollowingBaumoi (1977), we can measure these economies by the following definition:
, C(YT) +^'~ C(Y^) '
where T and N - T represent disjoint groups of the output set and TU (N - T) = N.Thus C(YT) and C(YN-T) respectively represent the costs of producing output set (T) andoutput set (A' — T) independently, while QIV) represents the cost of producing themjointly. Consequently, Sc measures the percentage cost savings (increases) that are due tojoint production and will be positive or negative depending upon whether economies ordiseconomies of joint production exist.
Table 6a presents the estimated economies of scope that were calculated at the grandsample mean, at each firm-specific mean, and for the 1979 period. Since marginal andtotal costs can actually become negative when these economies are estimated at zero
' The accuracy of our approximation for specific time periods is not so great as at the sample mean. Withthis in mind, one should reasonably consider the 1979 scale estimate for Chrysler in terms of its qualitativesignificance.
•" As a technical point, it can be shown for our specification that ray average costs are C-shaped (and notdeclining everywhere), thus not precluding the results we actually obtain.
"'' The results were virtually unaffected when the calculations were carried out using only GM's productmix, or combinations of the product mix and either the factor prices or hedonic attributes.
•" Given these dramatic differences in measured scale economies, it would be tempting to assert that thefirms must face different technologies. But a statistical test did not support this hypothesis (cf. footnote 19).
16 / THE BELL JOURNAL OF ECONOMICS
TABLE 6 Economies of Scope
a.
SampleOutput Level:
Industry{small car} + {large car & truck}{large car} + {small car & truck}{truck} + {small car & large car}
General Motors{small car} + {large car & truck}{large car} + {small car & truck}{truck} + {small car & large car}
Ford{small car} + {large car & truck}{large car} + {small car & truck}{truck} + {small car & large car}
Chrysler{small car} + {large car & truck}{large car} + {small car & truck}{truck} + {small car & large car}
Mean10%
-.10.27
-.23
-.08.37
-.25
-.29.22
-.41
.06
.27-.03
1979Output Level: 10%
Industry{small car} + {large car & truck}{large car} + {small car & truck}{truck} + {small car & large car}
General Motors{small car} + {large car & truck}{large car} + {small car & truck}{truck} + {small car & large car}
Ford{small car} + {large car & truck}{large car} + {small car & truck}{truck} + {small car & large car}
Chrysler{small car} + {large car & truck}{large car} + {small car & truck}{truck} + {small car & large car}
.05
.59-.08
-.10.53
-.31
-.41.52
-.54
.821.01.79
1%
-.14.35
-.32
-.14.45
-.36
-.35.33
-.52
.06
.32-.06
1%
.02
.73-.14
-.15.68
-.42
-.50.77
-.66
.821.06.78
. 1 %
-.15.36
-.32
-.14.46
-.38
-.36.34
-.54
.06
.33-.07
. 1 %
.02
.75-.15
-.15.70
-.43
-.51.80
-.68
.821.06.78
production levels for particular outputs,"^ we used a range of small levels of production,as opposed to zero, in the calculations. The results indicate that for all of the firms thereappear to be marked economies of joint production from combining the production oflarge cars with small cars and trucks, varying diseconomies from combining the produc-
" This result is only a statistical possibility that generally arises from the nature of the approximation. Inparticular, when one estimates a second-order approximation around the mean, the resulting equation is generallyrobust about the mean. As one uses values of the variables that deviate significantly from the mean, however,the approximation deteriorates, and counterintuitive results may occur. In the case of measurements of scopeeconomies, where output levels are set to zero, the approximation often deteriorates to such a degree thatnegative estimates of marginal costs are obtained. Hence, observed negative marginal costs are a statisticalartifact. Consequently, one would not expect them to occur either in theory or in practice.

FRIEDLAENDER, WINSTON AND WANG / 17
TABLE 6 (Continued)
Ford (sample mean){small car} + {large car & truck}{large car} + {small car & truck}{truck} + {small car & large car}
Ford (1979){small car} + {large car & truck}{large car} + {small car & truck}{truck} + {small car & large car}
Chrysler (sample mean){small car} + {large car & truck}{large car} + {small car & truck}{truck} + {small car & large car}
Chrysler (1979){small car} + {large car & truck}{large car} + {small car & truck}{truck} + {small car & large car}
1% Output LevelWith General Motors' Product
Mix, Factor Prices, andHedonic Attributes
.01
.27
.09
.33
.67
.21
.13
.25
.08
.71
.81
.74
tion of trucks with the production of small and large cars, and varying economies anddiseconomies from combining the production of small cars with the production of largecars and trucks. It is interesting that by the 1979 period, at least Chrysler seems to haveachieved significant economies from the scope of its product lines."^ It is also worthpointing out that by this period Chrysler, in contrast to Ford, would not gain any additionalscope economies if it possessed General Motors' product mix (see Table 6b).'"'
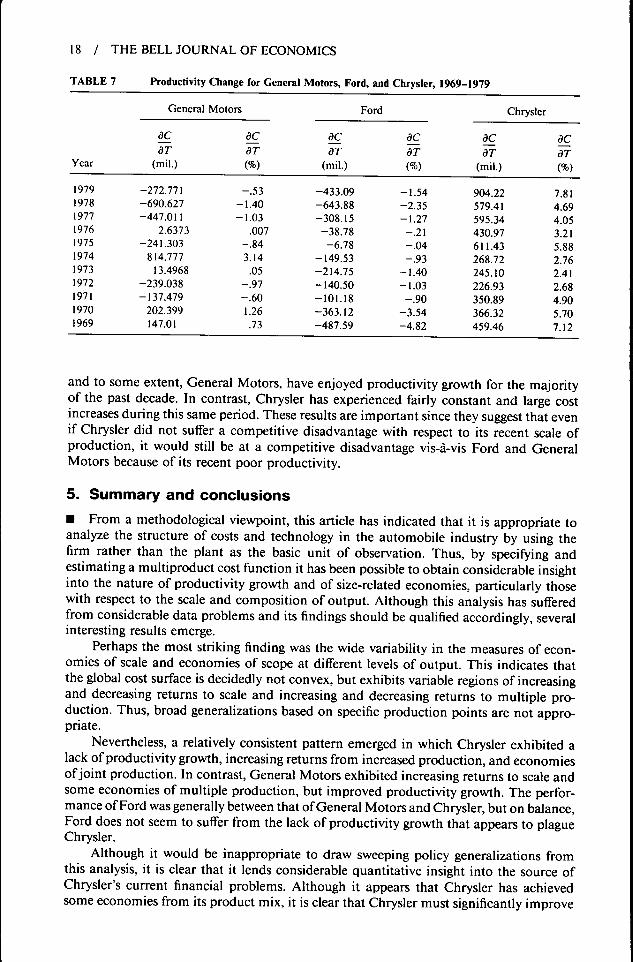
In addition to examining the size-related economies at a single point in time, it isalso useful to consider the degree of productivity growth in the industry. This can bemeasured by differentiating the estimated cost function with respect to time and calcu-lating the following expression:
+ 2 y, - y,) + 2 -Wj). ( 1 1 )^ = 6, + Z)7T(r - f) + 2 2 Duiqu -
Using the estimated coefficients and firm-specific mean values of the variables, we canuse equation (11) to simulate productivity changes for General Motors, Ford, and Chryslerthrough time. Note that since equation (11) represents the pure productivity effect, pro-ductivity growth can be said to have occurred only iidC/dT is negative. The productivityestimates for the last ten years are presented in Table 7. The results indicate that Ford,
•" This conclusion should admittedly be qualified, since the approximation upon which the calculationsare based may not be particularly accurate, given Chrysler's relatively low level of production during this period.
•"" As a somewhat related point, it is interesting to note that the industry would not become more efficient,from a cost perspective, if it were completely monopolized. Specifically, we find at the mean output that2 C,(Y) = 38021 (million) < C(2 Yj) = 38810(million), while in 1979 E Ci(Y) = 96557(million)
i i I
< C(2 y,) = 127779(million). In short, the industry cost function does not exhibit subadditivity, which is a
necessary and sufficient condition for the presence of natural monopoly (Baumol, 1977).
18 / THE BELL JOURNAL OF ECONOMICS
TABLE 7
Year
19791978197719761975197419731972197119701969
Productivity Change for General
General Motors
dCdT
(mil.)
-272.771-690.627-447.011
2.6373-241.303
814.77713.4968
-239.038-137.479
202.399147.01
dC
ar(%)- .53
-1.40-1.03
.007- .843.14
.05- .97- .601.26.73
Motors, Ford, and
Ford
dCdT
(mil.)
-433.09-643.88-308.15
-38.78-6.78
-149.53-214.75-140.50-101.18-363.12-487.59
Chrysler,
dCdT(%)
-1.54-2.35-1.27
- .21- .04- .93
-1.40-1.03-.90
-3.54-4.82
1969-1979
Chrysler
dCdT
(mil.)
904.22579.41595.34430.97611.43268.72245.10226.93350.89366.32459.46
dCdT(%)
7.814.694.053.215.882.762.412.684.905.707.12
and to some extent, General Motors, have enjoyed productivity growth for the majorityof the past decade. In contrast, Chrysler has experienced fairly constant and large costincreases during this same period. These results are important since they suggest that evenif Chrysler did not suffer a competitive disadvantage with respect to its recent scale ofproduction, it would still be at a competitive disadvantage vis-a-vis Ford and GeneralMotors because of its recent poor productivity.
5. Summary and conclusions
• From a methodological viewpoint, this article has indicated that it is appropriate toanalyze the structure of costs and technology in the automobile industry by using thefirm rather than the plant as the basic unit of observation. Thus, by specifying andestimating a multiproduct cost function it has been possible to obtain considerable insightinto the nature of productivity growth and of size-related economies, particularly thosewith respect to the scale and composition of output. Although this analysis has sufferedfrom considerable data problems and its findings should be qualified accordingly, severalinteresting results emerge.
Perhaps the most striking finding was the wide variability in the measures of econ-omies of scale and economies of scope at different levels of output. This indicates thatthe global cost surface is decidedly not convex, but exhibits variable regions of increasingand decreasing returns to scale and increasing and decreasing returns to multiple pro-duction. Thus, broad generalizations based on specific production points are not appro-priate.
Nevertheless, a relatively consistent pattern emerged in which Chrysler exhibited alack of productivity growth, increasing returns from increased production, and economiesof joint production. In contrast. General Motors exhibited increasing returns to scale andsome economies of multiple production, but improved productivity growth. The perfor-mance of Ford was generally between that of General Motors and Chrysler, but on balance,Ford does not seem to suffer from the lack of productivity growth that appears to plagueChrysler.
Although it would be inappropriate to draw sweeping policy generalizations fromthis analysis, it is clear that it lends considerable quantitative insight into the source ofChrysler's current financial problems. Although it appears that Chrysler has achievedsome economies from its product mix, it is clear that Chrysler must significantly improve

FRIEDLAENDER, WINSTON AND WANG / 19
its productivity if it is to compete successfully in the domestic market. In contrast, ourquantitative findings support the view that General Motors' U.S. operations are generallymore efficient than those of its domestic competitors; apparently, it has evolved into adomestic firm whose scale and product mix are relatively efficient at existing and increasedoutput levels. This suggests that General Motors will play an increasingly dominant rolein the domestic industry and that in the United States it should be able to competeeffectively with its foreign competitors. Although the quantitative results for Ford givesomewhat mixed signals, its strong productivity performance is encouraging; on balance,it should continue to be a relatively weak, but effective competitor on the domestic scene.
Of course, the preliminary nature of these findings should be stressed. Ideally, itwould be useful to obtain comprehensive data on the costs of foreign operations; thecapital stock utilized by each firm; and supplier relationships and the degree of verticalintegration. In addition, it would be useful to incorporate into the analysis the effect uponcosts of specific product or process innovations, market behavior, and governmentalregulation concerning emissions, safety, and mileage. Therefore, these results should beviewed as a first step toward a fuller analysis of the costs of automobile production in amore realistic international context.
Consequently, in addition to continued work to improve upon the analysis of thecosts of domestic producers, it would be highly desirable to extend this analysis to foreignproducers. If it were possible to obtain comparable data for foreign firms, it would bepossible to compare their technologies with those of domestic U.S. producers and toanalyze their relative efficiencies.
Finally, as indicated in the introduction, a full analysis of the eventual structure ofthe automobile industry requires an analysis of demand and market behavior as well asof costs. Thus, this analysis should be viewed as a first step in a larger quantitative analysisof the industry. Nevertheless, the present results indicate that an econometric analysis ofthe costs of the automobile industry can yield considerable insight into the nature of itscosts, its technology, and its productivity growth.
ReferencesABERNATHY, W.J. The Productivity Dilemma: Roadblock to Innovation in the Automobile Industry. Baltimore:
Johns Hopkins Press, 1978.AND CLARK, K. The Status of the U.S. Automotive Industry, Report for the National Academy of
Engineering. 1980.BAIN, J.S. Barriers to New Competition. Cambridge: Harvard University Press, 1956.BAUMOL, W.J. "On the Proper Cost Tests for Natural Monopoly in a Multiproduct Industry." American
Economic Review (December 1977)., PANZAR, J., AND WILLIG, R. Contestable Markets and the Theory of Industry Structure. New York:
Harcourt Brace Jovanovich, 1982.BEN-AKIVA, M. "Passenger Travel Demand Forecasting: Application of Disaggregate Models and Directions
for Research." Proceedings ofthe Third World Conference on Transport Research. Martins Nijhoff: TheHague, 1977.
BERNDT, E. AND KHALED, M. "Parametric Productivity Measurement and Choice among Flexible FunctionalForms." Journal of Political Economy, Vol. 87, No. 6 (1979).
, Fuss, M., AND WAVERMAN, L. "A Dynamic Model of Cost Adjustment and Interrelated FactorDemands with Empirical Applications to Energy Demand in U.S. Manufacturing." Discussion Paper No.79-30, University of British Columbia, 1979.
-, HALL, B.H., HALL, R.E., AND HAUSMAN, J.A. "Estimation and Inference in Nonlinear StructuralModels." Annals of Social and Economic Measurement, Vol. 3 (1974), pp. 653-668.
BREALEY, R. AND MYERS, S. Principles of Corporate Finance. New York: McGraw-Hill, 1981.CAVES, D., CHRISTENSEN, L., AND TRETHEWAY, M. "Flexible Cost Functions for Multiproduct Firms." Review
of Economics and Statistics (August 1980), pp. 477-481.COHEN, R.B. "Economic Crisis, National Industrial Strategies and Multinational Corporations." Unpublished
manuscript, Columbia University, 1979.EDWARDS, C. Dynamics ofthe United States Automobile Industry. Columbia: University of South Carolina
Press, 1965.

20 / THE BELL JOURNAL OF ECONOMICS
Fuss, M. AND WAVERMAN, L. "Regulation and the Multiproduct Firm: The Case of Telecommunications inCanada" in G. Fromm, ed.. Studies in Public Regulation. Cambridge: MIT Press, 1981.
GOLDSCHMIDT, N. "The U.S. Automobile Industry, 1980: Report to the President from the Secretary of Trans-portation," Report DOT-P-10-81-02. Washington, D.C: Office of the Secretary of Transportation, andCambridge, Massachusetts: Office of the Assistant Secretary of Policy and International Affairs, Transpor-tation Systems Center, 1980.
GRILICHES, Z. "Hedonic Price Indexes for Automobiles: An Econometric Analysis of Ouality Change" in ThePrice Statistics of the Federal Government. General Series No. 73, New York: National Bureau of EconomicResearch, 1961, pp. 137-196.
HALL, R.E. "The Specification of Technology with Several Kinds of Output." Journal of Political EconomyVol. 31, No. 4 (1973).
HAUSMAN, J.A. "Specification Tests in Econometrics." Econometrica. Vol. 46 (1978), pp. 1251-1271.JOHNSON, T. "A Cross Section Analysis of the Demand for New and Used Automobiles in the United States."
Economic Inquiry (\97S).JONES, D. "Maturity and Crisis in the European Car Industry: Structural Change and Public Policy." Unpub-
lished manuscript, Sussex European Research Centre, University of Sussex, 1980.LAVE, C. AND TRAIN, K. "A Behavioral Disaggregate Model of Auto Type Choice." Repon prepared for the
Energy Research and Development Agency. University of California at Irvine, 1977.LEONE, R.A., et at. "Regulation and Technical Innovation in the Automobile Industry." Contract 933-5800-0.
Washington, D.C: U.S. Office of Technology Assessment, May 1980.MANSKI, C F . AND SHERMAN, L. "An Empirical Analysis of Household Choice among Motor Vehicles." Trans-
portation Research. Vol. 14A (1980).MCFADDEN, D. "Cost, Revenue and Profit Functions" in M. Fuss and D. McFadden, eds.. Production Eco-
nomics. Amsterdam: North-Holland Press. 1978.MONTEVERDE, K. AND TEECE, D. "Supplier Switching Costs and Vertical Integration in the Automobile In-
dustry." Bell Journal of Econon^ics. Vol. 13, No. 1 (Spring 1982), pp. 206-213.Moody's Industrial Manual.PANZAR, J. AND WILLIG, R.D. "Economies of Scale in Multioutput Production." Quarterly Journal of Economics
(August 1977).PRATTEN, C.F. Economies of Scale in Manufacturing Industry. Cambridge: Cambridge University Press, 1971.RHYS, D.G. The Motor Industry. An Economic Survey. London: Butterworth, 1972.SANFORD C. BERNSTEIN & Co., INC. The Automobile Industry. New York: 1981.SPADY, R.H. AND FRIEDLAENDER, A.F. "Hedonic Cost Functions for the Regulated Trucking Industry." Bell
Journal of Economics. Vol. 9, No. 1 (Spring 1978).STEVENSON, R. "Measuring Technological Bias." American Economic Review. (March 1980), pp. 162-173.TODER, E.J. Trade Policy and the U.S. Automobile Industry. New York: Praeger, 1978.WANG CHIANG, J.S. AND FRIEDLAENDER, A.F. "Mergers, Competition, and Monopoly in the Regulated Truck-
ing Industry." Massachusetts Institute of Technology, Department of Economics Working Paper 289October, 1981.
Ward's Automobile Yearbook.WHARTON ECONOMETRIC FORECASTING ASSOCIATES, INC. "An Analysis of the Automobile Market: Modelling
the Long-Run Determinants of the Demand for Automobiles." Prepared for the U.S. DOT, TransportationSystems Center. 1977.
WHITE, L. The Automobile Industry since 1945. Cambridge: Harvard University Press, 1971.WINSTON, C , JARA-DIAZ, S., AND KRAVTIN, P. "Multiproduct Transportation Cost Functions." MIT Working
Paper, September 1982.YOUNG, S. AND HOOD, N. Chrysler U.K.: A Corporation in Transition. New York: Praeger, 1977.