costs, returns and profitability of soybean cultivation in...
TRANSCRIPT

Address for correspondence
ICAR- Indian Institute of Soybean Research, Madhya Pradesh, India
E-mail: [email protected]
Access this article online
PublisherWebsite:http://www.ndpublisher.in
DOI: 10.5958/0976-4666.2016.00052.8
Costs, returns and profitability of soybean cultivation in India: Trends and prospects
Purushottam Sharma
Department of Agricultural Economics, ICAR-Indian Institute of Soybean Research, Khandwa Road, Indore-452001, MP, India
ABSTRACT
Soybean has emerged as a leading oilseed crop in India which accounts for 55.6 per cent of area under kharif oilseeds and 38 per cent of area under total oilseeds during TE 2012-13, 42.5 per cent of total oilseeds production, and contributing to 28.6 percent of the total vegetable oils production in the country. Input use, cost, returns and profitability of soybean cultivation for major soybean growing states was analysed by using CACP data. The results revealed that farmers use higher than recommended seed rate and lower than advised fertilizers and manures, impacting the yield realisation by the farmers. The operational cost of soybean cultivation has increased gradually indicates that soybean cultivation is turning capital intensive. Growth in real cost of cultivation of soybean outpaced the growth in real returns from soybean in all major states. The decrease in price realised was faster than the real cost of production, indicating declining profitability of soybean cultivation, though started improving recently. The inverse relationship in cost of production and productivity of soybean was observed in major growing states. As the productivity of crop is the major factor in reducing the relative cost of production government should focus on the non-price incentives to increase the productivity and also to reduce the cost of cultivation, apart from price incentives.
Keywords: Input use, cost of cultivation, profitability, Soybean
Agricultural price policy is one of the important drivers of achieving growth in agricultural economy of India, and a key instrument in achieving food security by
improving production, employment and farmers income (Dev and Rao, 2010). The remunerative prices received by farmers’ plays a key role in maintaining food security and farmers income. Although, price and non-price factors are complements rather than substitutes with regards to increasing agricultural production (Dev and Ranade 1998; Rao 2004, 2006; Schiff and Montenegro 1997). The crop diversification and cropping mix by farmers is largely governed by price policy along with resource endowments at hand,
Economic AffairsCitation: EA: 61(3): 413-425, September 2016©2016 New Delhi Publishers. All rights reserved

414
Sharma
technology and institutional factors (Hazra, 2001). The thrust given on some crops over time, like creation of Technology Mission on Oilseeds for improving self-sufficiency in oilseeds, played a great role in increasing production and productivity.
Oilseeds and edible oils play a significant role in the Indian agricultural economy and food basket. Oilseed crops accounts for 13% of gross cropped area, 3% of gross national product, 10% of total value of output from agricultural crops and 6.0% of value of output from agriculture and allied sector. The per capita availability of edible oils had increased from 3.5 kg/person/year in 1970-71 to 15.8 kg in 2012-13 (GOI, 2014). India is one of the major consumers of oilseeds and their products, which accounts for approximately 10.2 per cent of global consumption of edible oils as well as oilcake meals. Further, per capita consumption of edible oils has been increasing. Rapid urbanisation and sustained growth in per capita income of increasing population accelerated the demand for edible oils and oilcake meals in the country (Birthal et. al. 2010; Gowda et. al. 2009). This increase in demand for oilseeds and their products has been accompanied by increases in their domestic production (Sharma and Dupare, 2016). Low productivity of oilseed crops, fragmented and under-utilised processing facilities, and lack of technological inputs hampered the edible oil production in the country (EPW, 2003) coupled with higher demand growth than the production growth resulted in heavy reliance on imports of edible oils.
Soybean (Glycine max) plays an important role in edible oil economy and is the fastest growing oilseed crop globally. During 1961-2013, global area under soybean increased at an annual compound rate of 2.97 per cent and production by about 4.46 percent, higher than the growth in area and production of most other food crops. Soybean accounts for 37.4 percent of the global area under oilseeds, and contributes to 28 percent of vegetable oil production (Sharma and Dupare, 2016). The crop’s adaptability to varied agro-ecological environments- the tropics, subtropics and temperate - has been responsible for its rapid spread across the globe. Soybean is a high-value nutritive crop, hence plays a significant role in overcoming problems of food and nutritional insecurity, especially in developing countries (Thoenes 2004).
In India, soybean has emerged as a leading oilseed crop within about four decades of its introduction for commercial cultivation. The share of the crop in total oilseed production increased from around 5 percent in the early 1980s to 37 percent in recent years. The area share of soybeans increased from less than 0.5 percent in the early 1980s to about 5 percent of gross cropped area in the country during the period TE 2011 because of its economic superiority of soybeans over other kharif crops (Dovring et al., 1973; Bapna et al., 1992; Chand, 2007, and Jaiswal and Hugar, 2011). The reasons for the expansion in area despite stagnant productivity are: (a) the suitability of soybeans for cultivation in fallow land; (b) the yield and price advantage over other crops, mainly coarse cereals and pulses (Chand, 2007).
Sustained growth in crop production can be achieved provided the sustainable growth in profitability, fuelled with higher yield increase, outpaces the growth in cost of production. Sufficient returns from the crop encourage farmers to continue with the crop over the years in the cropping system and also affect changes in crop mix in the non-traditional areas. The question arises that whether cost of cultivation of soybean is rising or profitability shrinking from crop? Against this backdrop, it is pertinent to understand the changes in cost of cultivation and profitability from soybean cultivation over time. The specific objectives of the paper are to find out the trends in the costs and returns from soybean to throw light on the impact on the profitability of farming in most important oilseed crops of the country.
Data and Methodology
The paper is based on secondary data collected from publications of Commission on Agricultural Cost and Prices (CACP), and Directorate of Economics and Statistics, Department of Agriculture and Cooperation, Ministry of Agriculture, Govt. of India. State-wise area, production and yield data for soybean for the period 1980-81 to 2012-13, and input-wise costs and returns data for major states from 1981-82 to 2011-12 have been analysed. All the cost of cultivation of soybean and income related data have been converted into constant prices by deflating data using wholesale price index (with base year 2004-05).

Costs, returns and profitability of soybean cultivation in India: Trends and prospects
415
The compound annual growth rates (CAGR) of area, production and yield of soybean for each decade were estimated by fitting a semi-log trend equation of the form
ln Y = a + bt (1)
Where, y is the time series data (response variable) of area, production and yield of soybean, t is the trend term (explanatory variable) and a is the constant coefficient. The slope coefficient b measures the relative change in y for a given absolute change in the value of the explanatory variable t. If we multiply the relative change in y by 100, we get the percentage change or growth rate in y for an absolute change in variable t. The slope coefficient b measures the instantaneous rate of growth. We calculate the compound growth rate r as follows:
r = [(Anti ln of b)-1] × 100 (2)
Cost and productivity relationship
The inverse relationship between cost of production of soybean and the yield levels is expected (Vishandass and Lukka, 2013). This hypothesis was tested by fitting the following regression model:
Log CoP = a+ e*log y (3)
Where,
a = constant,
e = elasticity,
CoP = real Cost of Production; and
y = yield levels.
Growth in Area, Production and Yield of Soybean in India
Area under soybean cultivation has grown tremendously in India, albeit from a low base. Soybean was a little known crop until 1970 and now has become an important oilseed crop in the country. The crop was introduced in rainfed regions of Madhya Pradesh in the early 1970s to utilize rainy season fallow lands, and since then its cultivation has expanded rapidly
(Dupare et al. 2008). The area under soybean in India was merely 0.30 lakh hectares during early seventies producing about 0.10 lakh tonnes of soybean. During TE 2012-13, the soybean area in the country had increased to 101.83 lakh ha, of which about 56 per cent is shared by Madhya Pradesh, nearly 29 per cent by Maharashtra, and 9 per cent by Rajasthan. Except in Uttar Pradesh and Gujarat, soybean cultivation has grown rapidly. During the initial period of growth and expansion in area under soybean cultivation, there was rapidity and selectivity in expansion of soybean (Bisaliah, 1986). It is interesting to note that, the soybean area has decreased significantly in the traditional soybean growing state, i.e. Uttar Pradesh, and expanded in Madhya Pradesh and in nearby areas of Rajasthan and Maharashtra that have similar climatic conditions as the soybean growing regions of Madhya Pradesh. These three states together currently accounts for about 95 per cent of total area under soybean cultivation in the country.
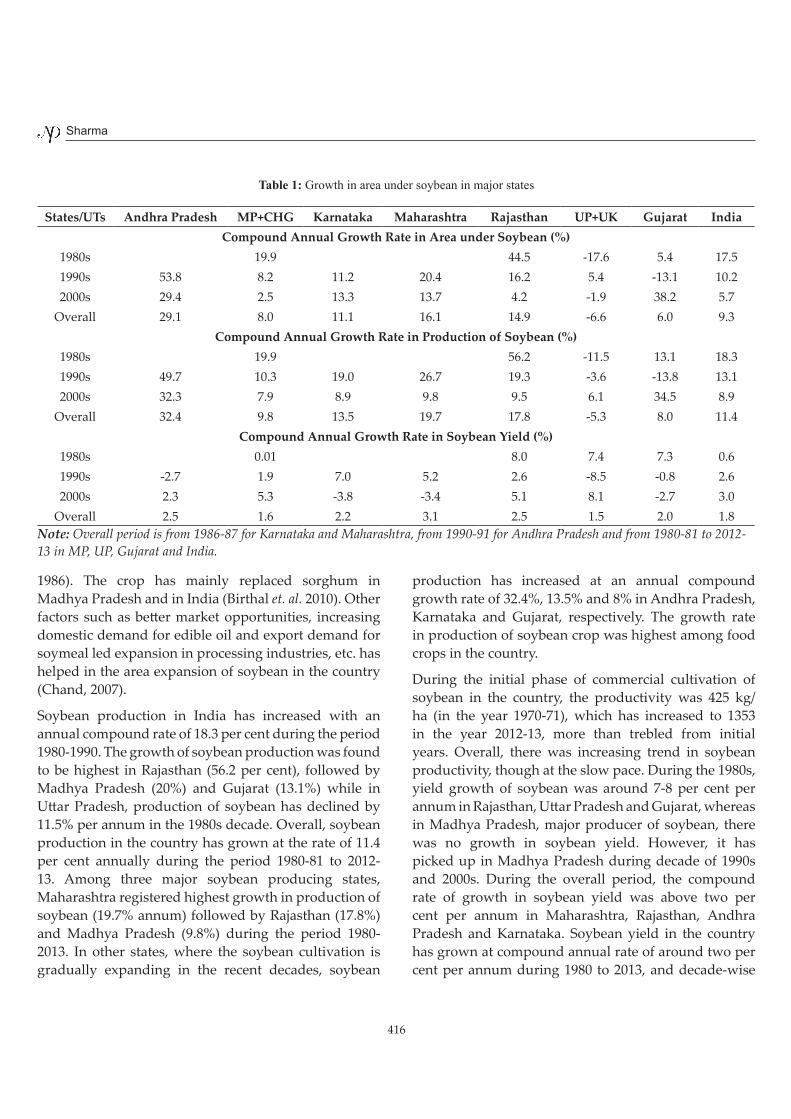
Overall, the soybean area has grown at the rate of 9.3 per cent in the country during the period 1980-2012 (Table 1). The annual compound growth rate in area under soybean in the country was 17.5 per cent during decade of 1980s. The rate of growth in area under soybean during 1980s was highest in Rajasthan (44.5%) followed by undivided Madhya Pradesh (20%) and Gujarat (5.4%), while in Uttar Pradesh soybean area has declined significantly (-17.6 per cent). The growth in soybean area in the country as well as in major soybean growing states has slowed down in subsequent decades. It is interesting to note that the crop area is now expanding in other states, like Andhra Pradesh, Karnataka, and Gujarat states, and hence, high growth rate of soybean area in recent decade.
During 1960s, there were large fallow lands during kharif season, which was kept fallow for preserving moisture for rabi (sowing) season, in Madhya Pradesh. The short duration of new varieties of soybeans did not affect the sowing time of the second crop after the monsoon season. Thus, rapid expansion of area under soybean crop during the initial years was from fallow lands (Bisaliah 1986, and Chand 2007). Subsequently, the crop has replaced other less profitable foodgrain crops such as sorghum, pearl millet and black gram (Bisaliah,
416
Sharma
production has increased at an annual compound growth rate of 32.4%, 13.5% and 8% in Andhra Pradesh, Karnataka and Gujarat, respectively. The growth rate in production of soybean crop was highest among food crops in the country.
During the initial phase of commercial cultivation of soybean in the country, the productivity was 425 kg/ha (in the year 1970-71), which has increased to 1353 in the year 2012-13, more than trebled from initial years. Overall, there was increasing trend in soybean productivity, though at the slow pace. During the 1980s, yield growth of soybean was around 7-8 per cent per annum in Rajasthan, Uttar Pradesh and Gujarat, whereas in Madhya Pradesh, major producer of soybean, there was no growth in soybean yield. However, it has picked up in Madhya Pradesh during decade of 1990s and 2000s. During the overall period, the compound rate of growth in soybean yield was above two per cent per annum in Maharashtra, Rajasthan, Andhra Pradesh and Karnataka. Soybean yield in the country has grown at compound annual rate of around two per cent per annum during 1980 to 2013, and decade-wise
1986). The crop has mainly replaced sorghum in Madhya Pradesh and in India (Birthal et. al. 2010). Other factors such as better market opportunities, increasing domestic demand for edible oil and export demand for soymeal led expansion in processing industries, etc. has helped in the area expansion of soybean in the country (Chand, 2007).
Soybean production in India has increased with an annual compound rate of 18.3 per cent during the period 1980-1990. The growth of soybean production was found to be highest in Rajasthan (56.2 per cent), followed by Madhya Pradesh (20%) and Gujarat (13.1%) while in Uttar Pradesh, production of soybean has declined by 11.5% per annum in the 1980s decade. Overall, soybean production in the country has grown at the rate of 11.4 per cent annually during the period 1980-81 to 2012-13. Among three major soybean producing states, Maharashtra registered highest growth in production of soybean (19.7% annum) followed by Rajasthan (17.8%) and Madhya Pradesh (9.8%) during the period 1980-2013. In other states, where the soybean cultivation is gradually expanding in the recent decades, soybean
Table 1: Growth in area under soybean in major states
States/UTs Andhra Pradesh MP+CHG Karnataka Maharashtra Rajasthan UP+UK Gujarat IndiaCompound Annual Growth Rate in Area under Soybean (%)
1980s 19.9 44.5 -17.6 5.4 17.51990s 53.8 8.2 11.2 20.4 16.2 5.4 -13.1 10.22000s 29.4 2.5 13.3 13.7 4.2 -1.9 38.2 5.7
Overall 29.1 8.0 11.1 16.1 14.9 -6.6 6.0 9.3Compound Annual Growth Rate in Production of Soybean (%)
1980s 19.9 56.2 -11.5 13.1 18.31990s 49.7 10.3 19.0 26.7 19.3 -3.6 -13.8 13.12000s 32.3 7.9 8.9 9.8 9.5 6.1 34.5 8.9
Overall 32.4 9.8 13.5 19.7 17.8 -5.3 8.0 11.4Compound Annual Growth Rate in Soybean Yield (%)
1980s 0.01 8.0 7.4 7.3 0.61990s -2.7 1.9 7.0 5.2 2.6 -8.5 -0.8 2.62000s 2.3 5.3 -3.8 -3.4 5.1 8.1 -2.7 3.0
Overall 2.5 1.6 2.2 3.1 2.5 1.5 2.0 1.8Note: Overall period is from 1986-87 for Karnataka and Maharashtra, from 1990-91 for Andhra Pradesh and from 1980-81 to 2012-13 in MP, UP, Gujarat and India.

Costs, returns and profitability of soybean cultivation in India: Trends and prospects
417
analysis revealed that rate of growth in soybean yield is increasing.
Farm level demonstrations with adoption of full technology are being carried out across states each year, and the results indicate the average yield achieved was around 18-20 quintal per hectare, and there exists the yield potential to be tapped (Bhatnagar and Joshi, 2004; Billore et al., 2004 and Billore et al., 2009). The yield gap in soybean is mainly extension gap. Studies indicate that adoption of the improved soybean production technology is not prudent resulting in low yield realisation and higher yield gap (Sharma, et. al. 2006; Dupare, et. al. 2011; Kumar, et. al. 2012; Singh, et. al. 2013). Adoption of full package of improved practices for soybean resulted in 48 per cent higher yield over farmers practices.
Cost and profitability of soybean in major states
The analysis of different cost components in cultivation
of crops reveals and compares the changes in input mix and cost of cultivation over time. The change in input use pattern in soybean have been captured by comparing the per hectare use of inputs for cultivation of soybean in major states over the period of time and presented on Table 2. The input use pattern revealed that the seed rate used by farmers of Madhya Pradesh has increased from 69 kg/ha during triennium ending (TE) 1983-84 to 95.88 kg/ha during TE 2001-02 and decreased thereafter to 87.26 kg/ha during TE 2011-12. In Rajasthan, farmers were using 84.47 kg/ha soybean seed during TE 1996-97, which has increased to about 96.36 kg/ha during TE 2006-07, and marginally declined recently to 92.62 kg/ha. The use of soybean seed in Rajasthan and Madhya Pradesh was found to be higher than the recommended, i.e. average 75-80 kg/ha. The higher seed use may be on account of low germination of farm saved seed (Nahatkar, 2014), and farmers practice of narrow row spacing to keep dense population to suppress weeds. The higher seed rate not only adds to the cost of
Table 2: Changing level of input use per hectare for cultivation of soybean
Inputs TE 1983-84 TE 1991-92 TE 1996-97 TE 2001-02 TE 2006-07 TE 2011-12Madhya Pradesh
Seed (Kg.) 69.04 89.00 97.14 95.98 89.23 87.26Fertilizer (Kg. Nutrients) 23.99 51.14 49.29 39.64 41.84 42.43
Manure (Qtl.) 1.74 9.92 5.61 4.14 5.22 6.00Human Labour (Man Hrs.) 452.80 372.89 398.31 347.33 342.36 287.96Animal Labour (Pair Hrs.) 133.88 89.81 57.67 48.12 46.63 26.86
MaharashtraSeed (Kg.) 82.46* 77.52 78.49 77.54
Fertilizer (Kg. Nutrients) 47.60* 79.30 63.33 80.56Manure (Qtl.) 0.61* 6.94 5.79 7.97
Human Labour (Man Hrs.) 442.78* 613.00 477.91 464.32Animal Labour (Pair Hrs.) 72.14* 81.17 82.02 70.98
RajasthanSeed (Kg.) 84.47 89.44 96.36 92.62
Fertilizer (Kg. Nutrients) 24.10 16.58 7.16 6.64Manure (Qtl.) 0.54 0.67 2.00 2.21
Human Labour (Man Hrs.) 349.70 323.70 376.91 347.68Animal Labour (Pair Hrs.) 38.38 36.05 15.45 6.13
TE: triennium average ending, * data pertains to the year 1996-97.

418
Sharma
per annum) even though the use of human labour has declined significantly. The cost of human labour has increased by 1.8 per cent per annum in Rajasthan. The increase in real cost of human labour was fast in major soybean growing states particularly during the 2006-07 to 2011-12 period, may be due to less availability of labour at critical stages after implementation of National Rural Employment Guarantee Act and scheme and higher wage rates. Human labour constitutes about 35 per cent of operational cost of soybean cultivation in Madhya Pradesh and Maharashtra, while about 46.4 per cent in Rajasthan. The share of human labour in operational cost is increasing in Rajasthan.
The cost of animal labour has decreased in Madhya Pradesh and Rajasthan, while it has increased in Maharashtra (Table 3), as per the use of animal labour (Table 2). The real cost of machine power used in soybean cultivation increased by more than 8 per cent per annum in Madhya Pradesh and Maharashtra and about 4.7 per cent in Rajasthan (Table 4), so as the share in operational cost, signifying that the gradual shift towards mechanisation of soybean cultivation. Since, the mechanisation of agriculture is increasing and it is obvious that the animal labour has been replaced by machine power in this process. Seed is another important item accounting for more than one-fifth of the operational cost of soybean cultivation in Rajasthan and Madhya Pradesh and about 13 per cent in Maharashtra. The real cost of seed also has increased from ` 922.5/ha during TE 1983-84 to ` 1654/ha during TE 2011-12 in Madhya Pradesh and from ` 1675/ha during TE 1996-97 to ` 2043/ha recently in Rajasthan.
The real cost of plant protection chemicals increased by more than 18 per cent in Madhya Pradesh and Maharashtra and by 50 per cent per annum in Rajasthan and also the share of plant protection chemicals in operational cost of soybean cultivation. The increase in expenditure on and proportion of cost for plant protection chemicals may be mainly on account of mono-cropping of soybean. The continuous mono-cropping of soybean-wheat or soybean-gram in major soybean growing areas leading to fast depletion of soil health as well as providing opportunity as host for fast spread
production but also affects yield realisation. In the state of Madhya Pradesh and Maharashtra, farmers use more of farm yard manure (FYM) than in Rajasthan.
Although, the use of FYM was found to be very low in major soybean growing states. With regards to use of fertilizers for cultivation of soybean, farmers in Rajasthan use lowest as compared to farmers in MP and Maharashtra. The application of plant nutrients was found to be less in MP and Rajasthan than the recommended dose of nutrients (20:60:40:20 NPKS), and is declining continuously. The decreasing and lower use of farm yard manure and fertilizers (nutrients), is affecting the yield and thus, farmers are not able to realise the full yield potential. The policy planners and extension agencies need to take a note of this phenomenon and correct to increase the yield realisation of soybean in the country. The lower than recommended and imbalanced use of fertilizers and manures also reported by Nahatkar, (2014), and Sharma, et al. (2015) and also application of nutrients like potash, sulphur, and zinc was negligible. The use of human labour for soybean cultivation is continuously declining in Madhya Pradesh, while in Maharashtra the soybean crop is turning out to labour intensive one. The animal labour use is also decreasing in Madhya Pradesh and Rajasthan mainly due to increase in machine power use.
Cost structure of soybean cultivation
The cost incurred on different cost components of soybean cultivation and their share in operational cost is presented in tables 3 and 4. It is evident from the table 3 that real the operational cost of soybean cultivation has increased gradually in major soybean growing states. The real operational cost of soybean cultivation (at 2004-05 constant prices) in Madhya Pradesh has increased from ` 3909/ha in TE 1983-84 to ` 9594/ha in TE 2011-12. Similarly, it has increased from ` 8567.8/ha during TE 1998-99 to ` 14050/ha recently in Maharashtra, and from ` 6827/ha in TE 1996-97 to ` 8682.6/ha in TE 2011-12 in Rajasthan.
The real cost of human labour in cultivation of soybean has increased fast in Madhya Pradesh (3.3 per cent

Costs, returns and profitability of soybean cultivation in India: Trends and prospects
419
of insects and micro-organisms leading to higher insect and disease infestation in the crop resulting in higher use of plant protection chemicals. The expenditure on irrigation was found negligible in major soybean growing states, signifies that the crop is mainly grown rainfed and farmers generally does not apply irrigation at critical stage in case of moisture stress, which is reducing the productivity realisation.
Fast growth in cost of plant protection chemicals, cost of machine power used, cost of seed and human labour was observed in cultivation of soybean in major producing states implying thereby that crop cultivation now requires more capital. The growth in real operational cost of soybean cultivation was about 2.8 per cent per annum in Madhya Pradesh and Maharashtra, and 1.3 per cent in Rajasthan. The continuously increasing real
Table 3: Changes in real operational cost of soybean cultivation
Inputs TE 1983-84 TE 1991-92 TE 1996-97 TE 2001-02 TE 2006-07 TE 2011-12 CGR (%)Madhya Pradesh
Human labour 1442.6 1828.1 2750.6 2745.2 2541.5 3421.9 3.3Bullock labour 760.1 783.5 968.1 992.6 943.1 672.3 0.5Machine labour 83.0 583.8 877.3 864.6 1195.2 2002.5 8.5
Seed 922.5 1531.0 1750.7 1337.2 1443.8 1654.1 1.2Fertilizers & manures 593.0 1143.7 1204.8 888.5 877.5 894.5 0.9
Insecticides 13.9 36.7 130.5 137.1 194.0 703.5 18.1Others 2.5 63.3 24.2 48.2 39.7 14.5 0.7
Int. on working capital 91.5 168.7 194.2 171.7 181.0 230.7 2.5Total Operational Cost 3909.1 6138.9 7900.5 7185.3 7415.8 9594.1 2.8
MaharashtraHuman labour 3125.7* 4117.6 2947.1 4768.6 1.0Bullock labour 1630.8* 2404.4 3766.9 2791.3 5.1Machine labour 475.0* 1332.6 1531.4 2246.3 8.3
Seed 1950.4* 1547.2 1581.9 1817.2 0.1Fertilizers & manures 1105.4* 1642.9 1216.7 1487.4 0.6
Insecticides 46.1* 57.9 166.0 480.1 18.4Others 1.7* 129.9 31.3 86.8 7.2
Int. on working capital 232.6* 310.9 324.2 372.4 2.8Total Operational Cost 8567.8* 11543.4 11565.5 14050.1 2.8
RajasthanHuman labour 2767.4 2709.4 3035.0 4026.6 1.8Bullock labour 842.3 967.2 404.6 156.3 -10.5Machine labour 891.4 1092.8 1670.1 1636.3 4.7
Seed 1674.6 1289.7 1520.4 2043.2 1.1Fertilizers & manures 446.2 296.9 177.4 155.9 -7.8
Insecticides 0.0 16.0 128.3 404.4 50.2Others 64.7 67.7 83.8 67.5 5.1
Int. on working capital 140.5 139.2 161.9 192.4 2.1Total Operational Cost 6827.1 6579.0 7181.6 8682.6 1.3
TE: triennium average ending, * data pertains to the TE 1998-99.

420
Sharma
operational cost of soybean cultivation signifies that its cultivation is gradually turning out to capital intensive (Sharma and Dupare, 2016) and needs to be subsided by similar yield increase. The real operational cost of cultivation of soybean was almost identical in Madhya Pradesh and Rajasthan, whereas it was found to be on higher side in Maharashtra mainly on account of higher use of both productive and protective inputs.
The higher proportion of labour inputs and lower share of productive and protective inputs in operational cost of soybean cultivation in major soybean growing states was observed. This signifies that there was increase in operational inputs due to increase in wage rate, hiring charges of tractor and hike in diesel prices leading to curtail in expenditure on productive or protective inputs or higher dependency on farm saved inputs (especially
Table 4: Share of inputs in operational cost of soybean cultivation
Inputs TE 1983-84 TE 1991-92 TE 1996-97 TE 2001-02 TE 2006-07 TE 2011-12Madhya Pradesh
Human labour 36.9 29.8 34.8 38.2 34.3 35.7Bullock labour 19.4 12.8 12.3 13.8 12.7 7.0Machine labour 2.1 9.5 11.1 12.0 16.1 20.9
Seed 23.6 24.9 22.2 18.6 19.5 17.2Fertilizers & manures 15.2 18.6 15.2 12.4 11.8 9.3
Insecticides 0.4 0.6 1.7 1.9 2.6 7.3Others 0.1 1.0 0.3 0.7 0.5 0.2
Int. on working capital 2.3 2.7 2.5 2.4 2.4 2.4Total Operational Cost 100.0 100.0 100.0 100.0 100.0 100.0
MaharashtraHuman labour 36.5 35.7 25.5 33.9Bullock labour 19.0 20.8 32.6 19.9Machine labour 5.5 11.5 13.2 16.0
Seed 22.8 13.4 13.7 12.9Fertilizers & manures 12.9 14.2 10.5 10.6
Insecticides 0.5 0.5 1.4 3.4Others 0.0 1.1 0.3 0.6
Int. on working capital 2.7 2.7 2.8 2.7Total Operational Cost 100.0 100.0 100.0 100.0
RajasthanHuman labour 40.5 41.2 42.3 46.4Bullock labour 12.3 14.7 5.6 1.8Machine labour 13.1 16.6 23.3 18.8
Seed 24.5 19.6 21.2 23.5Fertilizers & manures 6.5 4.5 2.5 1.8
Insecticides 0.0 0.2 1.8 4.7Others 0.9 1.0 1.2 0.8
Int. on working capital 2.1 2.1 2.3 2.2Total Operational Cost 100.0 100.0 100.0 100.0
TE: triennium average ending.

Costs, returns and profitability of soybean cultivation in India: Trends and prospects
421
seeds) due to poor resource base. This phenomenon may also be adding to slow growth in soybean productivity.
Soybean Profitability
The total cost and returns (at constant 2004-05 prices) from cultivation of soybean for major growing states were worked out and presented on Table 5. The results indicated that growth in real cost of cultivation of soybean outpaced the growth in real returns from soybean in all major states. The real paid out cost (cost A2) in cultivation of soybean in Madhya Pradesh has increased from ` 3295/ha in TE 1983-84 to ` 7857/ha in TE 2011-12, grown at the annual rate of 2.3 per cent. The
real total cost of cultivation has increased from ` 7179/ha to ` 15564/ha, with an annual rate of 2.2 per cent. Whereas, the real gross returns from soybean cultivation in Madhya Pradesh has grown at the rate of 1.8 per cent per annum. The real net returns shown decreasing trend upto TE 2001-02, even turned negative in TE 2002-03, and started increasing thereafter in Madhya Pradesh, due mainly to fast growth in yield realised from 9 qt/ha in TE 2002-03 to 14 qt/ha in TE 2011-12 (as per CACP survey results).
In Maharashtra, the real paid out cost in soybean cultivation has increased from ` 7987/ha in TE 1998-99 to ` 12758/ha in TE 2011-12, grew by 2.8 per cent per
Table 5. Changes in real cost and returns (Rs/ha) from soybean cultivation
Cost & returns (`/ha) TE 1983-84 TE 1991-92 TE 1996-97 TE 2001-02 TE 2006-07 TE 2011-12 CGR (%)Madhya Pradesh
Cost A2 3295.0 6012.1 6697.5 6020.3 6263.6 7856.7 2.3Cost C2 7179.4 10801.8 12651.0 11292.8 11585.8 15564.0 2.2
Gross Returns 10676.1 13988.1 15504.7 11693.1 12991.4 20435.4 1.8Returns over Cost A2 7381.1 7976 8807.2 5672.8 6727.8 12578.7 1.4Returns over Cost C2 3496.7 3186.3 2853.7 400.3 1405.6 4871.4 -
Rate of returns over cost A2 3.24 2.33 2.31 1.94 2.07 2.60 -Rate of returns over cost C2 1.49 1.29 1.23 1.04 1.12 1.31 -
MaharashtraCost A2 7986.8* 10653.9 11037.1 12758.3 2.8Cost C2 12019.5* 15538.5 15434.4 19154.0 2.7
Gross Returns 14297.9* 16856.9 14863.5 19812.0 1.8Returns over Cost A2 6311.1* 6203 3826.4 7053.7 0.2Returns over Cost C2 2278.4* 1318.4 -570.9 658 -
Rate of returns over cost A2 1.79* 1.58 1.35 1.55 -Rate of returns over cost C2 1.19* 1.08 0.96 1.03 -
RajasthanCost A2 5272.5 5186.3 6147.5 6535.5 1.7Cost C2 10174.6 9310.0 10880.1 12997.4 1.4
Gross Returns 14355.5 10631.2 14975.4 15921.5 0.6Returns over Cost A2 9083.0 5444.9 8827.9 9386.0 -0.03Returns over Cost C2 4180.9 1321.2 4095.3 2924.1 -
Rate of returns over cost A2 2.72 2.05 2.44 2.44 -Rate of returns over cost C2 1.41 1.14 1.38 1.22 -
TE: triennium average ending, * data pertains to the TE 1998-99. FL denotes family labour. Growth rate of net returns over total cost could not be worked out as the net returns were negative for few years.

422
Sharma
annum. The real total cost cultivation was ` 12019/ha in which has increased to ` 19154/ha in the corresponding period. Whereas, the real gross returns from soybean has increased from ` 14298/ha to ` 19812/ha, with an annual rate of 1.8 per cent, resulting in declining net returns over the period. The net returns over paid out cost from soybean cultivation in Maharashtra were declining, though increased in the recent period. The real paid out and real total cost of cultivation of soybean in Rajasthan has increased by 1.7 and 1.4 per cent per annum, respectively from TE 1996-97 to TE 2011-12. Whereas the real gross returns increased only by 0.6 per cent and real net returns has even declined from ` 4181/ha in TE 1996-97 to ` 2924/ ha in TE 2011-12.
When the increase in cost of cultivation is more than the rate of growth in value of output from crop, farmers may not be inclined to adopt recommended inputs mix for crop cultivation (Narayanamoorthy, 2007). Lower than recommended use of fertilizers and manures, main productive inputs, in soybean (Table 2) signifies this phenomenon. Reduction in use of yield increasing inputs leads to decline in crop productivity. This has impacted the profit margin of the crop. This necessitates the constant watch on movement of cost of cultivation and value of output by policy makers.
Earlier studies reported that the farmers have suffered losses both due to increased cost of cultivation in some crops and due to reduction in value of output in some other crops (Narayanamoorthy, 2013). Lower remuneration from agriculture also reported in Situation Assessment Survey, where more than one-third of the farmers have desired to quit agriculture citing poor remuneration as the reason (NSSO, 2005). If the losses or low profit margin prevailed continuously from the cultivation of crops, farmers would be discouraged from engaging in agriculture (Swaminathan, 2008).
The rate of returns has been worked out as the ratio of gross value of output to cost A2 and total cost of cultivation. The results indicated that the rate of returns from soybean cultivation in Madhya Pradesh and Rajasthan over cost A2 and over total cost of cultivation has declined till TE 2001-02 and started improving thereafter. While in Maharashtra the rate of returns has declined upto TE 206-07 and improved in
the recent period. The trend in cost of production and price realised (at constant 2004-05 prices) for soybean in Madhya Pradesh shows that both moved upwards upto 1989-90 and started declining thereafter (Fig. 1a). The decline in price realised was faster than the real cost of production, and moved in a narrow range.
Fig 1a: CoP and Price Realised of Soybean in MP (`/qt at constant prices)
Fig 1b: CoP and Price Realised of Soybean in Maharashtra (`/qt at constant prices)
Fig. 1c: CoP and Price Realised of Soybean in Rajasthan (`/qt at constant prices)
Later the prices realised were almost similar to the CoP without any margin except in 2002-03. After 2004-05, the price realised for soybean were again turned higher than the cost of production in Madhya Pradesh, leaving out sufficient margin for farmers. Similar movements in

Costs, returns and profitability of soybean cultivation in India: Trends and prospects
423
cost of production and price realised by farmers were observed in Rajasthan (Fig. 1c), but the difference was found narrowing recently. In case of Maharashtra (Fig. 1b), the difference in price realised by farmers and cost of production of soybean was observed to be low and even negligible in the years 2004-05, 2005-06 and recently.
Cost of production and soybean productivity relationship
It was hypothesised that the increase in yield would reduce the cost of production, thus expected an inverse relationship between cost of production of soybean and its yield changes. This hypothesis was tested using regression analysis and results are presented on Table 6.
Table 6: Impact of change in yield on cost of production
State Maharashtraa Rajasthanb Madhya Pradesh
1981-82 to 1991-92
- - -0.68
1991-92 to 2001-02
- - -0.50***
2001-02 to 2011-12
-0.97* -0.93* -0.73*
1981-82 to 2011-12
-0.51** -0.78* -0.29**
Note: a. for data period 1996-97 to 2011-12, b. for data period 1994-95 to 2011-12.
*, ** and *** indicates that coefficients are statistically significant at 1, 5 and 10 per cent respectively.
The results of the analysis revealed that there was inverse relationship in cost of production and productivity of soybean in major growing states. The real cost of production of soybean can be reduced by about 2.9, 7.8 and 5.1 per cent with the 10 per cent increase in the yield level of soybean in Madhya Pradesh, Rajasthan and Maharashtra, respectively. The analysis for the recent decade revealed that the elasticity of yield increase was found to be higher on the real cost of production in three major soybean growing states, where more than 9 per cent of the real cost of production can be reduced by increasing 10 per cent in yield of soybean in Maharashtra and Rajasthan. Vishandass and Lukka (2013) also reported that real cost of production of soybean can be
reduced to 5.7 per cent with 10 per cent increase in yield level in India.
ConclusionIn India, soybean has emerged from a little known crop until the early 1970s to an important oilseed crop. Soybean, however, is a more important crop than any other oilseed crops. The crop accounted for 55.6 per cent of area under kharif oilseeds and 38 per cent of area under total oilseeds in the country during Triennium average Ending (TE) 2012-13. It accounted for 62.5 percent of the kharif oilseed production and 42.5 per cent of total oilseeds production in the country, contributing to about 28.6 percent of the total vegetable oils and two-thirds of the oil meals supplies during the corresponding period.
Input use, cost, returns and profitability of soybean cultivation for major soybean growing states was analysed by using CACP data. The results of analysis indicated that farmers in Rajasthan and Madhya Pradesh use higher seed rate than the recommended, while, use of fertilizers, plant nutrients, for was found to be lower in both these states and it was declining continuously. The decreasing and lower use of farm yard manure and fertilizers is impacting the yield realisation by the farmers. The use of human labour for soybean cultivation is continuously declining in MP, while in Maharashtra the soybean crop is turning out to labour intensive one.
Fast growth in cost of plant protection chemicals, cost of machine power used, cost of seed and human labour was observed in cultivation of soybean in major producing states implying thereby that crop cultivation now requires more capital. The real cost of plant protection chemicals increased in three major soybean producing states and also the share of plant protection chemicals in operational cost of soybean cultivation. The expenditure on irrigation was found negligible in major soybean growing states. The operational cost of soybean cultivation has increased gradually in major soybean growing states. The continuously increasing real operational cost of soybean cultivation indicates increasing capital intensiveness of soybean cultivation, which needs to be subsided by similar yield increase. Growth in real cost of cultivation of soybean outpaced

424
Sharma
the growth in real returns from soybean in all major states. The rate of returns from soybean cultivation was declining till mid 2000s in major soybean growing states, although started improving thereafter, mainly on account of higher productivity realised in these years.
The trend in real cost of production and price realised (at constant 2004-05 prices) for soybean shows that both moved upwards upto 1989-90 in MP and started declining thereafter. The decline in price realised was faster than the real cost of production, indicating declining profitability of soybean cultivation, though started improving recently. Similar movements in cost of production and price realised by farmers were observed in Rajasthan, but the difference was found narrowing recently. In case of Maharashtra, the difference in price realised by farmers and cost of production of soybean was observed to be low and even negligible in the years 2004-05, 2005-06 and recently. The inverse relationship in cost of production and productivity of soybean was found in major growing states. The real cost of production of soybean can be reduced by about 2.9, 7.8 and 5.1 per cent with the 10 per cent increase in the yield level of soybean in Madhya Pradesh, Rajasthan and Maharashtra, respectively. As the productivity of crop is the major factor in reducing the relative cost of production government should focus on the non-price incentives to increase the productivity and also to reduce the cost of cultivation, apart from price incentives. In this regards, creating irrigation facility for providing irrigation at critical stages in case of abnormal monsoon conditions, ensuring timely and cost effective quality input supply are of paramount importance.
ReferencesBapna, S.L., Seetharaman S.P. and Pichholiya, K.R. 1992. Soybean
System in India. Oxford & IBH Publishing Co., Pvt. Ltd., New Delhi.
Bhatnagar, P.S., and Joshi, O.P. 2004. Current Status of Soybean Production and Utilization in India. In: Proceedings of VII World Soybean Research Conference, IV International Soybean Processing and Utilization Conference, III Congresso Mundial de Soja (Brazilian Soybean Congress), Embrapa Soybean, Londina, Brazil, pp. 26–37.
Billore, S.D., Joshi O.P. and Dupare, B.U. 2004. Impact of Frontline Demonstrations on Augmenting the Soybean (Glycine max L.) Productivity, J. Oilseeds Res., 21: 352–353.
Billore, S.D., Vyas, A.K. and Joshi, O.P. 2009. Assessment of Improved Production Technologies of Soybean on Production and Economic Potentials in India, Journal of Food Legumes, 22(1): 49-52.
Birthal, P.S., Parthasarathy Rao P., Nigam S.N., Bantilan M.C.S. and Bhagavatula, S. 2010. Groundnut and Soybean Economies of Asia: Facts, Trends and Outlook. International Crops Research Institute for the Semi-Arid Tropics, Patancheru 502 324, Andhra Pradesh, India.
Bisaliah, S. 1986. Soybean Development in India. CGPRT Paper No.5 UN/ESCAP CGPRT Centre: Bogor, Indonesia.
Chand Ramesh 2007. Agro-industries Characterization and Appraisal: Soybeans in India, Agricultural Management, Marketing and Finance Working Document 20, Food and Agriculture Organisation of the United Nations, Rome.
Dev, S.M. and Ranade, A. 1998. Rising Food Prices And Rural Poverty: Going Beyond Correlations, Economic & Political Weekly 33(39): 2529-36.
Dev, S.M. and Rao, N.C. 2010. Agricultural Price Policy, Farm Profitability and Food Security, Economic and Political Weekly 45(26 & 27): 174-182.
Dovring F., Jindia J.R. and Misra, R.S. 1974. Economic Production Possibilities of Soybeans in Northern India: A Preliminary Study. Publication Series No. 1, University of Illinois, Urbana- Champaign Office of International Agriculture.
Dupare, B.U., Billore S.D., Joshi O.P. and Hussain, S.M. 2008. Origin, Domestication, Introduction and Success of Soybean in India, Asian Agri-History 12(3): 179-195.
Dupare, B.U., Billore S.D., Joshi O.P. and Verma, S.K. 2011. Adoption of Improved Soybean Production Technology in Madhya Pradesh: A Critique, Journal of Oilseeds Research, 28(2): 125-130.
EPW 2003. Edible Oils: Beyond Imports, editorial in Economic and Political Weekly 38(51&52): 5308.
GOI 2014. Economic Survey—2013-14, Ministry of Finance, Government of India, New Delhi.
Gowda, C.L.L., Rao, P. Parthasarathy and Bhagvatulu, S. 2009. Global Trends in Production and Trade of Major Grain Legumes, paper presented in International Conference on Grain Legumes: Quality Improvement, Value Addition and Trade, February 14-16, 2009, Indian Society of Pulses Research and Development, Indian Institute of Pulses Research, Kanpur, India, (http://oar.icrisat.org/5350/1/Global_trends_in_production_and%20trade.pdf)
Hazra, C.R. 2001. Crop Diversification in India, in Papademetriou and Dent (eds.) Crop diversification in the Asia-Pacific region, RAP Publication 2001/03, Food and Agricultural Organisation of the United Nations, Regional office for Asia and the Pacific, Bankok, Thailand.
Jaiswal, A. and Hugar, L B. 2011. An Economic Analysis of Soybean Cultivation vis-à-vis its Competing Crops in Madhya Pradesh, Karnataka Jn. of Agri. Sci., 24(4): 591-592.

Costs, returns and profitability of soybean cultivation in India: Trends and prospects
425
Kumar, A., Rathod M.K. and Kalantri, L B. 2012. Behaviour of Farmers in Adoption of Recommended Technology for Soybean, Indian Research Journal of Extension Education, Special issue (II): 223-227.
Nahatkar, S.B.R. 2014. Dynamics of Profitability from Soybean in Central India, Soybean Research 12(conf. Spl. 1): 144-155.
Narayanamoorthy, A. 2007. Deceleration in Agricultural Growth: Technology Fatigue or Policy Fatigue?, Economic and Political Weekly 42(25): 2375-2379.
Narayanamoorthy, A. 2013. Profitability in Crops Cultivation in India: Some Evidence from Cost of Cultivation Survey Data, Indian Journal of Agricultural Economics 68(1): 104-121.
NSSO 2005. Situation Assessment Survey of Farmers: Income, Expenditure and Productive Assets of Farmer Households, Report No. 497, National Sample Survey Organisation, Ministry of Statistics and Programme Implementation, Government of India, New Delhi.
Rao N.C. 2004. Aggregate Agricultural Supply Response in Andhra Pradesh, Indian Journal of Agricultural Economics 59(1): 91-104.
Rao N.C. 2006. Agrarian Crisis in Andhra Pradesh, Journal of Indian School of Political Economy 18(1&2): 35-75.
Schiff, M. and Montenegro, C.E. 1997. Aggregate Agricultural Supply Response in Developing Countries: A Survey of Selected Issues, Economic Development and Cultural Change 45(2): 393-410.
Sharma, H.O., Patidar, M. and Nahatkar, S.B. 2006. Constraints of Soybean Production Technology in Vindhyan Plateau Agro-Climatic Region of Madhya Pradesh, Research on Crops 7(1): 100-110.
Sharma, P. and Dupare, B.U. 2016. Total Factor Productivity Growth and Returns from Research Investment on Soybean in India. Agricultural Economics Research Review 29(1): 41-51.
Sharma, P., Patel, R.M. and Dupare, B.U. 2015. Profitability of Soybean vis-a-vis Major Kharif Crops in Madhya Pradesh, Soybean Research 13(2): 65-77.
Singh, Ishwar and Singh, K.K. 2013. Knowledge Level of Soybean Growers Regarding Recommended Soybean Production Technology and Constraints There Off, Journal of Community Mobilization and Sustainable Development 8(2): 209-211.
Swaminathan, M.S. 2008. Ending the Debt Trap and Attaining Food Security, The Hindu, March 3. Accessed in February, 2015 from http://www.thehindu.com/todays-paper/tp-opinion/ending-the-debt-trap-attaining-food-security/article1213179.ece.
Thoenes, P. 2004. The role of soybeans in fighting world hunger. Paper presented at the VIIth World Soybean Research Conference, 1-5 Mar 2004, Foz do Iguassu, Brazil.
Vishandass, A. and Lukka, B. 2013. Pricing, costs, returns and productivity in Indian crop sector during 2000s, Discussion Paper No. 7, Commission for Agricultural Costs and Prices, Department of Agriculture and Cooperation, Ministry of Agriculture, Govt. of India, New Delhi.
