costs and utilization in the housing choice voucher … and utilization in the housing choice...
TRANSCRIPT

Costs and Utilization in the Housing
Choice Voucher Program
Prepared for:
U.S. Department of Housing and Urban Development Office of Policy Department and Research
Prepared by:
Meryl Finkel Jill Khadduri Victoria Main Linda Pistilli
Claudia Solari Kristin Winkel Michelle Wood
Abt Associates Inc.
Cambridge, Massachusetts
July 2003


Table of Contents
Acknowledgements ................................................................................................................ iii
Executive Summary................................................................................................................ v Study Background and Overview ................................................................................... v Definitions...................................................................................................................... vi Findings on Utilization................................................................................................. viii Findings on Subsidy Costs .............................................................................................. x Relationship between Utilization and Costs................................................................... xi
Chapter One – Introduction .................................................................................................. 1 1.1 Background and Report Organization ................................................................... 1 1.2 Key Definitions...................................................................................................... 2 1.3 Study Sample ......................................................................................................... 3 1.4 Study Data ............................................................................................................. 5
Chapter Two – Utilization Rates in the Housing Choice Voucher Program..................... 7 2.1 Defining Utilization ............................................................................................... 7 2.2 Factors Affecting Utilization ............................................................................... 10 2.3 Conclusions.......................................................................................................... 30
Chapter Three – Costs in the Voucher Program ............................................................... 33 3.1 Defining Subsidy Costs ....................................................................................... 33 3.2 Factors Affecting Subsidy Costs ......................................................................... 35 3.3 Conclusions.......................................................................................................... 49
Chapter Four – Paired Sites: Comparisons of High and Low Utilization Voucher Programs in the Same Housing Markets ............................................................................ 51
4.1 Background.......................................................................................................... 51 4.2 Findings ............................................................................................................... 52 4.3 Conclusions.......................................................................................................... 74
Appendix A – How the Voucher Program Works ............................................................. 82
Appendix B – Unit Utilization at the End of FY2001 ........................................................ 88
Table of Contents i


Acknowledgements
This assessment of Costs and Utilization in the Housing Choice Voucher Program was prepared under HUD Contact No. C-OPC-21702, Task Order DEN-T0003. The report authors are Meryl Finkel, Jill Khadduri, Victoria Main, Linda Pistilli, Claudia Solari, Kristin Winkel and Michelle Wood. This study has been made possible with the help of numerous persons and organizations. First we would like to thank the site visitors who collected the data for the study. In addition to the report authors, the site visitors included, Ophelia Basgal, Roberta Graham, Eliza Kean, Judy Meyers, William Riley, Gene Rizor, Jennifer Turnham, Penny VanderWall, and Roy Zeigler. We would also like to thank the staff at the 48 PHAs we visited for providing the time and information needed for the study. We appreciate the input from HUD staff who provided guidance, feedback and assistance for this study, including Robert Dalzell and Robert Leonard, the Co-Government Technical Monitors, Bernice Unland, who coordinated collection of FMC input, and Jerry Benoit, William Gilliland, Deborah Hernandez, Jeff Lubell and Kevin Neary, and Roma Suller who provided comments on a draft of the study report. The report benefited greatly from their insights.
Acknowledgements iii

Executive Summary
Study Background and Overview
HUD, Congress, voucher program managers, researchers and housing advocacy groups have focused on voucher utilization and the related issues of success rates and program costs for several years. Because under-utilization of vouchers results in fewer families receiving housing assistance each year than could be served with available resources, HUD would like to make all possible efforts to maximize the utilization of vouchers allocated to local programs. Understanding the drivers of utilization can help voucher program administrators determine whether controllable factors (e.g., PHA policies and practices) or uncontrollable factors (e.g., market conditions or waiting list characteristics) are at work when allocations are not fully used. They can then take appropriate actions to improve utilization when needed and when the factors affecting utilization are under their control. Similarly, understanding drivers of program subsidy costs can help program operators and policy makers develop more accurate budget projections and can help them understand potential trade-offs—for example, between the numbers of families served on the one hand and the types of families served and the quality of the housing they rent on the other. This study is intended to provide insights into the factors that affect Housing Choice Voucher (HCV) program utilization rates and costs in a sample of sites nationwide. The data for the study were derived from existing computerized HUD files, other secondary data sources, and primary data collected on site at a sample of 48 PHAs. The bulk of the information was gathered during on-site interviews with voucher program staff as part of one- to two-day visits we made to each of the study sites between December 2001 and April 2002. While on site, we discussed aspects of each PHA’s local housing market, participant characteristics and PHA policies, to assess their impacts on subsidy costs and voucher utilization. In addition to interviewing key PHA staff in person, we spoke by telephone with local HUD staff, landlords, participants, and community representatives regarding the programs. A sample of participant files was also reviewed on site to determine the time required for each of the several activities that lead to getting a voucher under lease and to assess the completeness of the files. The sample was selected purposively to include PHAs with high and low utilization rates and PHAs with high and low costs across a range of program sizes and locations. A subset of 28 of the PHAs were selected as pairs. A pair was defined as two PHAs that served either the same or similar housing markets and had at least a 10-point difference in the utilization rate. By looking at pairs, we hoped to separate the factors affecting utilization from the more general market-related factors.
Executive Summary v
The sample was purposive rather than random, so we cannot derive precise national estimates of the impacts of various factors on program costs and utilization. While the results from this study cannot be generalized to the entire universe of PHAs, they should provide HUD with sufficient information to support program decision-making and help identify areas for technical assistance that can improve utilization rates and assist PHAs in using their increased flexibility to optimize local programs. Definitions
A description of how the voucher program works and definitions of terms associated with the voucher program are presented in Appendix A. Here we define the two key concepts used in this report: utilization and costs. Utilization is the measure of how successful a PHA has been in using the resources provided by HUD. For this study we have defined utilization as the number of units leased with voucher assistance at the time of the site visit as a percentage of the number of units that were under the Annual Contributions Contract (ACC) between HUD and the PHA at the beginning of the PHA’s current fiscal year. This is slightly different from the definition used by HUD as of this writing (July 2002). HUD defines utilization as the higher of unit utilization and budget utilization. Budget utilization is defined as total annual program costs as a percentage of annual budget authority. Unit utilization is defined as the average number of units leased during a PHA’s fiscal year as a percentage of the ACC units at the beginning of the fiscal year. If, during the course of the year, the PHA receives one or more additional funding increments, the PHA may begin leasing the units, but the new units (and their associated budget authority) do not count toward the determination of the PHA’s utilization rate until the beginning of the next fiscal year. Since new funding increments are typically awarded in the final months of the calendar year, this allows PHAs with fiscal years beginning in October and January sufficient time to lease their new units, but gives April and July PHAs less time to lease the new units before they are counted toward their utilization rates. For the purpose of this study, we have defined the utilization rate only in terms of unit utilization because we found that few of the agencies in the study monitored budget utilization closely, and that would have made it extremely difficult to measure budget utilization consistently across sites. Under the Section 8 Management Assessment Program (SEMAP), utilization rates of 98 percent or higher are considered full performance. PHAs with utilization rates of 95 to 97 percent are adequately utilized, and PHAs with rates below 95 percent are not adequately utilized.1
1 Utilization rates can exceed 100 percent if a PHA leases more than the number of units under its ACC. For example, PHAs may have a rate greater than 100 percent at some point during a fiscal year in order to ensure that the average rate for the fiscal year is close to 100 percent.
vi Executive Summary

Specifically, we have defined utilization as:
Total units under lease Total number of units in ACC minus new units received in the current fiscal year
where units under lease and total units were estimated as of the time of the site visit (early 2002). A full discussion of the calculation of unit utilization is contained in Chapter2. Subsidy Costs measure the amount of government funds spent for each voucher unit under lease. The average subsidy per unit equals the total contributions divided by the number of units under lease, where total contributions include HAP payments, fees earned and annual audit costs. The largest component of costs is the HAP payment, which is the difference between the lower of the payment standard or unit gross rent and the participant portion of the rent. Participants typically pay 30 percent of their income for rent, and thus the subsidy equals the payment standard or unit rent (whichever is lower) minus 30 percent of participant income. (If the rent for the unit is above the payment standard, the family can pay the difference, as long as the initial payment is no more than 40 percent of income). In order to identify factors (other than prevailing rents and incomes) that affect subsidy costs, we developed a measure of cost that neutralizes the effects of local rents and local income levels. The measure starts with the average monthly cost per unit, which equals total contributions as of the end of the PHA’s most recently completed fiscal year (generally 2000) divided by the average number of leased units divided by 12. Because we know that key drivers of costs are local market rents and local incomes, we wanted to control for these, so that we could identify other factors that affect program subsidy costs. To do so, we normalized the average subsidy by dividing it by the local 2-bedroom Fair Market Rent (FMR). We used the 40th percentile FMR for 2001 for all PHAs. In order to control for local income variations, we also normalized by local median income. The definition of the normalized subsidy cost used for this analysis is:
Average actual monthly subsidy cost per unit The subsidy for a 3-person household earning 30 percent of the median income,
if the PHA uses a payment standard set equal to the FMR Costs were generally provided as of the end of FY2000, and FMRs and median incomes were for 2001. A full discussion of the calculation of normalized subsidy costs is contained in Chapter 3.
Executive Summary vii

Findings on Utilization
We used the data obtained from the study to look at a range of possible factors that might be related to utilization and found that the key factors that affect utilization rate appear to be:
• Rental market conditions – Utilization rates are generally higher in loose markets and lower in tight markets.
• Condition of the affordable housing stock – Utilization rates are higher in locations with better quality housing stocks.
• PHA management – Well-managed PHAs have higher utilization rates.
• Method used to determine voucher issuance – PHAs that have a systematic method for determining the number of vouchers to issue each month have higher utilization rates.
• Leasing success rates – Sites with high success rates also tend to have high utilization rates.2
• Frequency of updating wait lists – Sites that review and update their waiting lists more often tend to have higher utilization rates.
It should be noted that this study focuses on identifying factors that affect utilization within the context of the existing HCV program model. It is based on comparison of sites with high and low utilization rates in order to identify practices and/or factors that drive utilization in the current environment. Various features of the HCV model, including a range of regulatory and compliance requirements, affect the lease-up process and ultimately utilization. While programmatic or regulatory changes, including efforts to streamline or simplify the program would likely improve utilization, an examination of such factors was outside the scope of this study. We also found that utilization rates tend to fluctuate over time, with the utilization rates of 16 agencies changing enough from the time of sample selection to the time of the site visit to result in their shifting categories from high utilization to low utilization (6 PHAs) or from low utilization to high utilization (10 PHAs). Utilization rates are adversely affected for PHAs that received vouchers in the last two years, particularly for PHAs that received a special allocation of vouchers. Finally, by examining several exceptions to these general patterns, we found that PHA-controllable factors, such as using systematic procedures for issuing vouchers, realigning staff to use new allocations of vouchers, providing additional
2 The success rate is defined as the percentage of new voucher holders that successfully lease a qualifying
unit in the program. Factors associated with success rates are discussed in detail in “Study on Section 8 Voucher Success Rate”, (Abt Associates, August 2001)
viii Executive Summary

search assistance to families, and focusing on landlord relations, can help to compensate for unfavorable market conditions. By contrast, inattention to such controllable factors can lead to low utilization, even under favorable market conditions. From the paired study sites, we were able to obtain additional information on why two housing authorities in the same or very similar housing markets may have very different capacity to use their full allocation of voucher units. In particular:
• Programs with higher utilization rates typically have strong leadership. We found that in many cases the lower utilization PHA had a hiatus in program leadership. The lack of leadership often meant little attention to issuance of vouchers (and sometimes to no issuance at all for a period of time), and therefore led to low utilization.
• Administrators of programs with higher rates of utilization have better ability to perform the data analysis and calculations needed to determine program flow and allocate staff to achieve full utilization, or at least have the ability to make reasonable judgments about how to adjust the number of vouchers to issue each month.
• Programs with higher utilization rates are typically administered more strategically, with an eye to both serving additional clients and to maximizing administrative income for the program.
• In some cases, the paired program with the higher rate of utilization provided more housing search assistance, concentrated more heavily on outreach to landlords and/or provided better service to owners of rental housing.
While this was not intended to be a study of how housing authorities handle overlapping service areas, issues related to the coordination of overlapping programs came up repeatedly among the paired sites (which were chosen for the study precisely because they shared some geography) and among the other study sites. Staff from programs with low utilization often attributed their program’s problems to competition from other housing authorities that serve the same market. Conversely, there were some pairs where it turned out that both agencies had high utilization rates or that the lower utilizing program easily achieved full utilization in a short time. In these pairs, both PHAs have managed jurisdictional overlap in a way that minimizes program disruptions and threats to full utilization. Two of the pairs of programs were operating in very difficult housing markets, and yet three of these four programs had fairly high rates of utilization at the time of the site visit. Each of the three achieved high utilization in a somewhat different way: one by very aggressive outreach to owners of rental housing, one by linking its program to the production of rental housing, and one by simply issuing a very large number of vouchers for the number of available slots.
Executive Summary ix

Findings on Subsidy Costs
Several themes emerged as we looked at normalized subsidy costs. Program operators generally do not think in terms of subsidy costs. If anything, they worry about administrative costs. In conversations with PHA staff, we found that most did not focus on subsidy costs, nor could they directly identify factors other than local rents that affect their average subsidy costs. Thus, program operators may need to be educated about the importance for planning and budgeting purposes of understanding the factors that affect subsidy costs. When we compared raw average subsidy costs with market rents, we found a very high correlation between subsidy costs and local rents. Subsidy costs were higher in PHAs with higher 2-bedroom FMRs. However, once we controlled for local rents and prevailing incomes, normalized subsidy costs are not correlated with market rent levels. Factors that affect normalized subsidy costs include:
• Participant income distributions – PHAs with larger concentrations of extremely low-income households have higher normalized subsidy costs (and conversely, PHAs with higher concentrations of households with incomes between 30 and 50 percent of median have lower subsidy costs).
• Age/disability status – PHAs with larger concentrations of elderly and disabled households have lower normalized subsidy costs.
• Use of exception payment standards – PHAs that use exception payment standards or pays rents above the payment standard have higher normalized subsidy costs.
• Enforcement of rent reasonableness – PHAs that are more rigorous about enforcement of rent reasonableness have lower normalized subsidy costs.
• Standards for assigning bedroom sizes – PHAs that apply stricter than average standards for assigning bedroom sizes to families have lower normalized subsidy costs.
• Special programs – Higher concentrations of opt-out vouchers (vouchers used to replace Section 8 projects that leave the assisted housing system) lead to higher normalized subsidy costs, because the allowable rent paid for these units is often above the regular payment standard. This was the only special program that was positively correlated with costs.
x Executive Summary
Relationship between Utilization and Costs
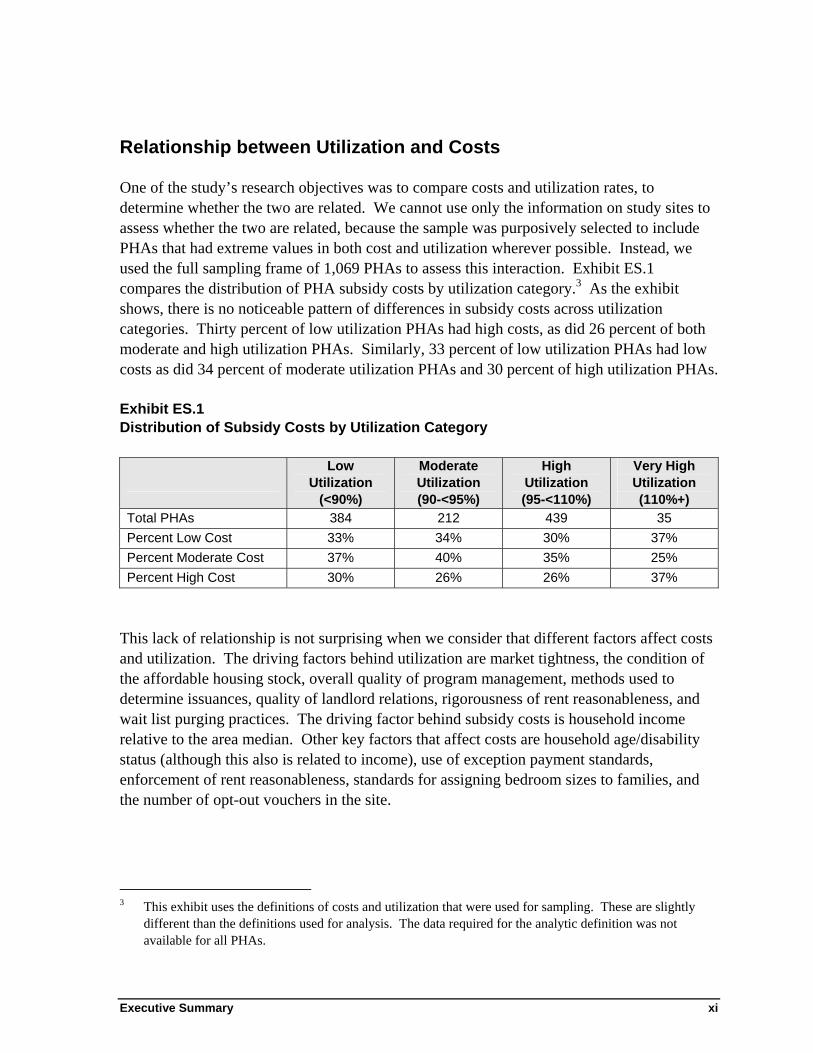
One of the study’s research objectives was to compare costs and utilization rates, to determine whether the two are related. We cannot use only the information on study sites to assess whether the two are related, because the sample was purposively selected to include PHAs that had extreme values in both cost and utilization wherever possible. Instead, we used the full sampling frame of 1,069 PHAs to assess this interaction. Exhibit ES.1 compares the distribution of PHA subsidy costs by utilization category.3 As the exhibit shows, there is no noticeable pattern of differences in subsidy costs across utilization categories. Thirty percent of low utilization PHAs had high costs, as did 26 percent of both moderate and high utilization PHAs. Similarly, 33 percent of low utilization PHAs had low costs as did 34 percent of moderate utilization PHAs and 30 percent of high utilization PHAs. Exhibit ES.1 Distribution of Subsidy Costs by Utilization Category
Low Utilization
(<90%)
Moderate Utilization (90-<95%)
High Utilization (95-<110%)
Very High Utilization (110%+)
Total PHAs 384 212 439 35 Percent Low Cost 33% 34% 30% 37% Percent Moderate Cost 37% 40% 35% 25% Percent High Cost 30% 26% 26% 37%
This lack of relationship is not surprising when we consider that different factors affect costs and utilization. The driving factors behind utilization are market tightness, the condition of the affordable housing stock, overall quality of program management, methods used to determine issuances, quality of landlord relations, rigorousness of rent reasonableness, and wait list purging practices. The driving factor behind subsidy costs is household income relative to the area median. Other key factors that affect costs are household age/disability status (although this also is related to income), use of exception payment standards, enforcement of rent reasonableness, standards for assigning bedroom sizes to families, and the number of opt-out vouchers in the site.
3 This exhibit uses the definitions of costs and utilization that were used for sampling. These are slightly
different than the definitions used for analysis. The data required for the analytic definition was not available for all PHAs.
Executive Summary xi

Chapter One Introduction
1.1 Background and Report Organization
HUD, Congress, voucher program operators, researchers and housing advocacy groups have all been focusing on voucher utilization and the related issues of success rates and program cost for several years. Because under-utilization of vouchers results in fewer families receiving housing assistance each year than could be served with available resources, HUD wishes to make all possible efforts to maximize voucher utilization at local housing authorities. While some initial work has been done to explore the reasons behind under-use of program resources and HUD has initiated several strategies to encourage maximum utilization, the current study has been undertaken to provide more detailed evidence of the factors contributing to under-utilization. This information will be helpful in determining whether controllable (for example, PHA policies and practices) or non-controllable (for example, market conditions or waiting list characteristics) factors appear to be at work. The information gathered for the study from a range of different housing authorities can be used to provide guidance to voucher program administrations that are seeking effective strategies for improving their utilization rates. Similarly, understanding drivers of program subsidy costs can help program operators and policy makers develop more accurate budget projections, and can help in developing potential trade-offs in terms of numbers versus types of families served. This study is intended to provide insights into the factors that affect voucher program costs and utilization rates and how these factors interact in a sample of sites nationwide. Given the changes taking place in the voucher program, and the pressures for maximum utilization of voucher program resources and accurate budget projections, HUD requires an in-depth investigation to understand the complex factors at work within particular PHAs and to identify the major factors that influence utilization and costs. The data for the study were obtained from existing computerized HUD files, other secondary data sources, and primary data collected directly for a sample of 48 PHAs.4 The sample was purposive rather than random, so we cannot make direct estimates of changes in utilization rates and costs for the voucher program as a whole. But the study had a different purpose. This in-depth investigation is the best way to understand the complex factors at work within particular PHAs and to identify the major factors that influence these issues. This will permit
4 Throughout the document we refer to voucher program administrators as public housing agencies, or
PHAs. In fact, entities other than a PHA may run a voucher program such as local non-profits, county-wide agencies, or state-wide agencies.
Chapter 1 – Introduction 1

HUD to develop policies and guidance to achieve higher rates of utilization of program funds and to make careful cost estimates based on reasonable assumptions about the policy choices of PHAs and the behavior of housing markets and assisted families. The report is organized into four chapters. Chapter One provides a description of the background of the study, definitions of utilization and subsidy costs, a description of the sample of PHAs studied, and a summary of the data used for the study. Subsequent chapters discuss each of the study’s three research areas. Chapter 2 provides information on utilization in the voucher program, describing how market factors, household characteristics and PHA policies affect utilization. Chapter 3 focuses on subsidy costs. The chapter first looks at how to define subsidy costs and then describes how market factors, household characteristics, and PHA policies relate to program subsidy costs. Chapter 4 presents the findings from the study of paired sites. The goal of this chapter is to provide a better understanding of factors affecting utilization, by comparing policies in a subset of PHA that operate in overlapping or similar markets. By comparing outcomes and PHA policies in these paired sites, we can, at least to some extent, assess the importance of factors other than market condition that affect utilization. The report also includes two appendices. The first appendix provides a description of how the voucher program works. The second appendix looks at the utilization at the end of FY2001. 1.2 Key Definitions
Definition of Utilization: We calculated a unit utilization rate for each of the study PHAs using the number of units under lease at the time of the site visit compared to the total number of units in the ACC at the time of the site visit. The formula is:
Total units under lease Total # units in ACC minus new units received in the current fiscal year
Consistent with HUD practices, any new units received during the current fiscal year were removed from the calculation. In addition, we subtracted new units received in the final months of the preceding fiscal year, in those agencies that were in the early months of a new fiscal year at the time of the site visit. This adjustment was necessary in four of the study PHAs and was made to ensure that recently awarded units in the process of being leased were not counted against the agency in calculating utilization rates. Further details are presented in Chapter 2. Definition of Normalized Subsidy Cost: In order to identify cost drivers other than local market rents and prevailing incomes, we developed a definition of normalized subsidy costs that controls for differences in local FMRs and median incomes. The normalized subsidy cost equals the actual average monthly subsidy per unit divided by the HAP payment for a 2-
2 Chapter 1 – Introduction

bedroom unit rented by a 3 person household with income at exactly 30 percent of the local area median for that household size if the payment standard is set to the FMR. The formula for normalized subsidy costs is:
Average actual monthly subsidy cost per unit The subsidy for a 3-person household earning 30 percent of the median income,
if the PHA uses a payment standard set equal to the FMR The numerator is the actual average monthly subsidy payment per unit during the year. The denominator is the HAP payment for a 3-person household earning 30 percent of the median income, if the PHA uses a payment standard set equal to the FMR. Further details are presented in Chapter 3. 1.3 Study Sample
The sampling method was designed to draw a sample of PHAs stratified across a variety of factors, including size of voucher program, unit utilization, subsidy cost, and geographic location. The goal of the sampling plan was to select at least 10 pairs of sites for the paired-utilization study sample, at least 25 PHAs that would be either high or low-cost and at least 25 PHAs that would be either high or low-utilization.5 The sample was to be distributed across three size categories, and was to be geographically diverse. HUD provided Abt Associates with a file that contained program size, cost, and utilization information for 2,506 housing agencies that operate a voucher program. In order to create the sampling frame, several categories of PHAs were excluded: PHAs with fewer than 250 units, Moving to Work (MTW) PHAs, Statewide and regional PHAs with more than one FMR, PHAs with large ongoing lawsuits6, and PHAs for which no FMR could be identified (i.e. 14 PHAs where no MSA or county code matched the FMR file).
5 The definitions of utilization and costs used for sampling were slightly different than those used in analysis.
For sampling, utilization was defined as the higher between unit utilization and cost utilization, where unit utilization was defined as leased units divided by adjusted units. (Adjusted units equal ACC units minus new units minus litigation units). Budget utilization is defined as total program costs divided by adjusted annual budget authority. Adjusted annual budget authority equals total annual budget authority minus new budget authority minus litigation budget authority. Cost was defined as program subsidy costs divided by leased units divided by the 2-bedroom FMR divided by 12. (The 2BR FMR is the 40th percentile FMR for all jurisdictions.)
6 We excluded PHAs that were involved in litigation because utilization could be affected by the lawsuits.
Chapter 1 – Introduction 3
The remaining file included 1,069 PHAs, which were divided into three size categories for sampling:
435 PHAs with fewer than 500 voucher units 323 PHAs with 500 – 999 voucher units 311 PHAs with at least 1,000 voucher units
We began by selecting 28 PHAs as pairs. Pairs were defined as two PHAs that served either the same or similar housing markets and had at least a 10 point difference in unit utilization rate, so that factors affecting utilization could be separated from market related factors.7 Candidate sites were identified by study team members and by HUD staff, and were included if they met the above requirements. Second, all of the paired sites were categorized based on their utilization rate and costs. Once the high/low utilization study sites among the pairs were identified, additional high and low utilization PHAs were selected so that we had a minimum of 25 high- and low-utilization sites distributed as follows:
5 high/ 5 low utilization among the large PHAs 4 high/ 4 low utilization among the medium PHAs 4 high/ 3 low utilization among the small PHAs
For sampling purposes, a PHA was considered a high utilization site if either budget or unit utilization was between 95 to under 110 percent, and neither was 110 percent or higher. A PHA was considered a low utilization site if the both budget and unit utilization were below 90 percent. Once the paired study sites and the utilization study sites were selected and categorized based on costs, we selected additional high and low cost PHAs so that we had a total of at least 25 high- and low-cost PHAs distributed as follows:
5 high/ 5 low cost among the large PHAs 4 high/ 4 low cost among the medium PHAs 4 high/ 3 low cost among the small PHAs
In keeping with the categorization of high- and low-utilization that categorized about one third of the sampling frame as high and one third as low utilization, we classified costs so that about one third of PHAs were categorized as high cost and one third as low cost. Thus,
7 In a few pairs the difference in utilization rates was slightly smaller than 10 percent.
4 Chapter 1 – Introduction

high cost was defined as above 72 percent of FMR, and low cost was below 62 percent for small PHAs and below 65 percent for medium and large PHAs.8
Within each of the 12 size/utilization/cost categories required for sampling, sites were ordered by utilization rate (or cost for the cost samples) and then the appropriate number were selected randomly. Exceptions to the random sampling were:
• Sometimes we selected a PHA above or below the randomly selected PHA in order to try to get PHAs that could qualify both as high or low utilization and high or low cost sites.
• We also strayed from the random selection to make sure we had good geographic dispersion, and to make sure we had a few regional PHAs.
Exhibit 1.1 illustrates the geographic location of the study sites. 1.4 Study Data
Information on the sample PHAs were obtained from a range of secondary and primary data sources described below. Site Visits
The bulk of the information used in the study was gathered from interviews with staff from the sample PHAs. We conducted these interviews during one- to two-day site visits to each of the study sites between December 2001 and April 2002. In addition to interviewing key PHA staff, including the Executive Director and voucher program staff, we spoke with local HUD staff, participating landlords, tenant advocacy groups, and community planning agencies. A sample of participant files was also reviewed on site to determine the time required between leasing activities and to assess the completeness of the files. Data were also collected from HUD’s Financial Management Center staff (FMCs) on issues such as drawing down reserves, annual budget authority, and other factors.9
8 The cutoff for low cost for small PHAs was set at 62 percent because half of all small PHAs (215) had
costs under 65 percent of FMR. Setting the cut-off at 62 percent classified about 1/3 of the sample of small PHAs as low cost. For the larger size categories, about 1/3 of the PHAs had costs below 65 percent of FMR.
9 HUD headquarters coordinated the FMC data collection. Initially we had planned on collecting these data by telephone.
Chapter 1 – Introduction 5

Exhibit 1.1 Number of PHA’s Visited and Paired Sites in Each Region
Regions States Included in Each Region # PHA’s Visited
# Paired Sites
New England MA, VT, NH, ME, RI, CT 5 1 New York/New Jersey NY, NJ 3 1 Mid-Atlantic PA, DE, MD, VA, WV, DC 6 2 Southeast/Caribbean GA, FL, AL, SC, NC, MS, TN, KY, PR, VI 6 2 Midwest IL, OH, MI, WI, MN, IN 6 1 Southwest TX, NM, AR, LA, OK 7 3 Great Plains KS, NE, MO, IA 4 1 Rocky Mountains CO, ND, SD, UT, MT, WY, ID 2 1 Pacific/Hawaii CA, AZ, NV, HI 8 2 Northwest/Alaska WA, OR, AK 1 0
Total 48 14 A team of fourteen site visitors conducted the visits. Because a lot of the information used in this study is judgmental and requires detailed understanding of the operations of the voucher program, very experienced staff were assigned to the site visits. Site visitors prepared written summaries of each visits along with a detailed data collection protocol that recorded information about the number of units under lease, types of voucher units, reasons for turnover, success rates, staffing levels, and many other topics. The information collected in the protocols was entered into a database to facilitate analysis of the data. These quantitative data were supplemented by more qualitative assessments of key aspects of the voucher programs, including rigor of rent reasonableness calculations, methods for determining numbers of vouchers to issue each month, an overall assessment of management practices, provision of search assistance, quality of landlord relations, and rental housing market conditions. To analyze the information, we created categories of unit utilization (high utilization and low utilization) and categories of subsidy costs (high subsidy costs and low subsidy costs) and then explored the patterns of PHA characteristics across a multitude of factors that were expected to affect the level of costs and the unit utilization. Secondary data sources
We used several sources of secondary data to assess utilization and costs in the study PHAs. For sampling and for estimating program costs, we used an extract of the HUDCAPS file that provided information on program costs and units under contract and units under lease. The data were extracted in June 2001, and include year-end data for the most recently completed fiscal year (generally December 1999, or March, June or September 2000). MTCS data from 2001 were used to provide descriptions of participant demographics at each selected site. We also downloaded the 2001 FMRs and median incomes from HUD’s web site.
6 Chapter 1 – Introduction

Chapter Two Utilization Rates in the Housing Choice Voucher Program
In this chapter we describe the unit utilization across the 48 study PHAs, comparing the rates at the time of site selection to rates observed at the time of the site visit. We then explore what we call external factors, or those conditions that are beyond the control of a PHA that may affect utilization rates. Included in these external factors are voucher program size, local rental market conditions, condition of local housing stock, and the recent receipt of new voucher allocations. Next, we look at things that are within a PHA’s control, namely management priorities and procedures that are also expected to play a role in utilization. By comparing the proportion of low and high utilization PHAs among groups of characteristics, we have developed a profile of high and low utilization agencies based on the factors that appear most strongly related to utilization rates. 2.1 Defining Utilization
Utilization is the measure of how successful a PHA has been in maximizing its use of the resources provided by HUD. For years, the certificate and voucher programs have set various standards for acceptable levels of utilization, swung back and forth between “unit” and “budget” utilization, and imposed (or not) various sanctions for under-utilization. For this study we have defined utilization as the number of units leased with voucher assistance as a percentage of the number of units under the Annual Contributions Contract (ACC) between HUD and the PHA at the beginning of the PHA’s fiscal year. This is slightly different from the definition used by HUD as of this writing (July 2002). HUD defines utilization as the higher of unit utilization and budget utilization, where unit utilization is as defined above, and budget utilization is defined as total program costs as a percentage of annual budget authority. If, during the course of the year, the PHA receives one or more additional funding increments, the PHA may begin leasing the units, but these do not, strictly speaking, count toward the determination of the PHA’s utilization rate until the beginning of the next fiscal year. The PHA gets credit for any new units leased in their count of units under lease for the numerator but the number is not included in the denominator for units in the ACC. Since new funding increments are typically awarded in the final months of the calendar year, this allows PHAs with fiscal years beginning in October and January sufficient time to lease their new units, but gives April and July PHAs less time to lease the new units before they are counted toward their utilization.
Chapter 2 – Utilization Rates in the Housing Choice Voucher Program 7

Under the Section 8 Management Assessment Program (SEMAP) that HUD uses to measure the performance of the public housing agencies that administer the housing choice voucher program10, utilization rates of 98 percent or higher are considered full performance. PHAs with utilization rates of 95-97 percent are adequately utilized, and PHAs below 95 percent are not. For SEMAP and other purposes, the PHA’s utilization rate is calculated for the fiscal year, based on “unit months under lease” figures submitted on the PHA’s year-end statement. This means that under- (or over-) leasing at the beginning of the fiscal year can be compensated for by over- (or under-) leasing at the end of the year. If a PHA ends its fiscal year with more units leased than are provided for under the ACC, the PHA can stop issuing new vouchers and let its unit total drop through attrition. During the period covered by this study, PHAs were occasionally constrained (by HUD’s Financial Management Center) to limit their leasing to the number of units that could be supported by their annual budget authority (ABA), even if that number was lower than the number of units authorized under the ACC. PHAs that had experienced sharp increases in HAP costs were particularly susceptible. These PHAs were generally considered adequately utilized, as their budget utilization, if not their unit utilization, met or exceeded acceptable levels. HUD has since amended its policy to allow PHAs with high utilization that are in danger of exceeding their ABA to amend their budgets and draw on reserves and/or additional funds. Recently, HUD has also encouraged “optimized” leasing of additional units beyond the number authorized if the ABA is sufficient. Under the Quality Housing and Work Responsibility Act of 1998 (QHWRA), a PHA’s annual renewal funding is based on its actual per-unit costs during the preceding year and the actual number of units authorized in the ACC. Because the PHA’s funding for the following year will be based on the PHA’s actual per-unit costs during the current year, however, any surplus in funding is likely to be short-lived, and the optimized units will eventually have to be reduced through attrition. 10 SEMAP is used to measure performance using 14 key indicators: 1) proper selection of applicants from the
waiting list; 2) sound determination of reasonable rent for each unit leased; 3) establishment of payment standards within the required range of the HUD fair market rent; 4) accurate verification of family income; 5) timely annual reexaminations of family income; 6) correct calculation of the tenant share of the rent and the housing assistance payment; 7) maintenance of a current schedule of allowances for tenant utility costs; 8) ensure units comply with the housing quality standards before families enter into leases and PHAs enter into housing assistance contracts; 9) timely annual housing quality inspections; 10) performing of quality control inspections to ensure housing quality; 11) ensure that landlords and tenants promptly correct housing quality deficiencies; 12) ensure that all available housing choice vouchers are used; 13) expand housing choice outside areas of poverty or minority concentration; and 14) enroll families in the Family Self-Sufficiency (FSS) program as required and help FSS families achieve increases in employment income.
8 Chapter 2 – Utilization Rates in the Housing Choice Voucher Program

For the purposes of the analysis presented here, we have calculated a unit utilization rate for each of the study PHAs using the number of units under lease at the time of the site visit compared to the total number of units in the ACC.11 The formula we have used to calculate a utilization rate for each PHA is:
Total units under lease Total # units in ACC (excluding new units received in the current fiscal year)
Consistent with HUD practices, any new units received during the current fiscal year were removed from the denominator in the above calculation. In addition, we subtracted new units received in the final months of the preceding fiscal year, in those agencies that were in the early months of a new fiscal year at the time of the site visit. This adjustment was necessary in four of the study PHAs and was made to ensure that recently awarded units still in the process of being leased were not counted against the agency in calculating utilization rates. At the time the PHAs were selected for the study, we obtained information on unit utilization and budget utilization percentages from HUD, based on year-end statements for fiscal year 2000. We used this information to select the study sites.12 Consistent with the threshold established by HUD, agencies with utilization rates of 95 percent or higher were considered to have high utilization. During the site visits we collected updated information on the total number of units under lease, total ACC units, and the total number of new units added to the program during the current and preceding fiscal years. On the basis of this point in time estimate at the time of the site visit, we have sorted the 48 study sites by utilization rate. At the time of the site visit, a total of 25 of the study PHAs had utilization rates above 95 percent, and 23 had utilization below 95 percent. For the most part the distribution of high and low-utilization agencies remained constant from the time of sampling to the site visit. However, six agencies experienced declines in utilization rates over this period, and ten increased utilization. The variation in rates over the period between sample selection and the site visit underscores one of the dominant themes of the analysis, namely that utilization rates can fluctuate fairly substantially over time.
11 The utilization rate calculated for the study is a point-in-time estimate of utilization as of the date of the site
visit. In Appendix B, we present analysis of utilization calculated based on year-end statements for fiscal year 2001.
12 For the analysis of utilization presented here, we focus only on unit utilization, exploring budget utilization only for those agencies in which unit utilization is low. We found that few of the agencies in the study monitor budget utilization closely, making it difficult to measure budget utilization consistently across sites.
Chapter 2 – Utilization Rates in the Housing Choice Voucher Program 9

To provide additional comparison of utilization rates, in Appendix B we present utilization rates based on year-end statements from 2001, the most recently completed fiscal year. The disadvantage of the rates shown in the Appendix is that they are less recent than the site visit figures, but they provide an additional point of comparison and further evidence of the extent of fluctuation observed in utilization rates across the study sites. 2.2 Factors Affecting Utilization
There are potentially many factors that could affect an agency’s ability to fully use its allocation of vouchers. To organize the analysis, we grouped possible factors into external circumstances that are outside the control of a PHA, and internal factors that a PHA can control. The external factors we examined include:
• rental market conditions (availability of affordable rental housing as indicated by rental vacancy rates);
• condition of the local affordable housing stock; and
• the receipt of new voucher allocations in the previous two years, particularly for PHAs that received a special allocation of vouchers.
The internal, or “controllable” factors refer to PHA management practices and policies that can be expected to affect an agency’s ability to fully use voucher program resources. In particular, we examined:
• the overall quality of program management;
• methods used to determine number of vouchers to issue each month;
• quality of landlord relations;
• degree of rigor in rent reasonableness calculations;
• level of housing search assistance offered to participants;
• staffing resources;
• leasing success rates;
• level of payment standards relative to fair market rents;
• emphasis placed on deconcentration; and
• waiting list management.
10 Chapter 2 – Utilization Rates in the Housing Choice Voucher Program
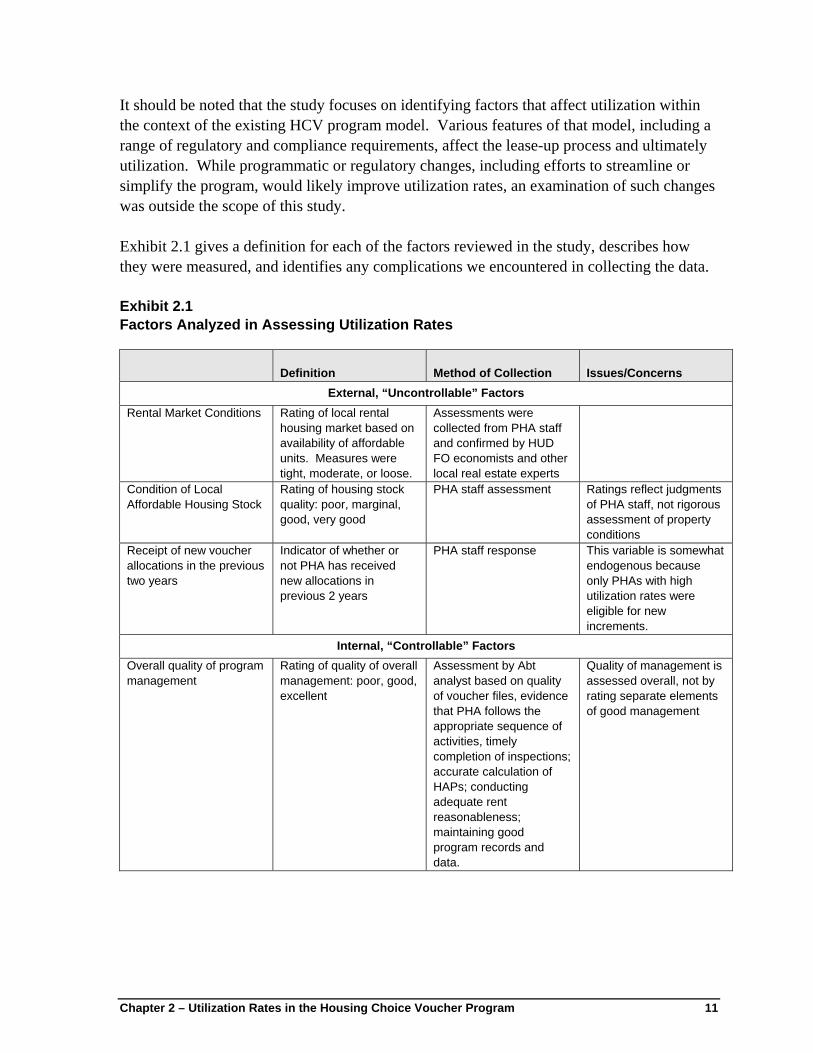
It should be noted that the study focuses on identifying factors that affect utilization within the context of the existing HCV program model. Various features of that model, including a range of regulatory and compliance requirements, affect the lease-up process and ultimately utilization. While programmatic or regulatory changes, including efforts to streamline or simplify the program, would likely improve utilization rates, an examination of such changes was outside the scope of this study. Exhibit 2.1 gives a definition for each of the factors reviewed in the study, describes how they were measured, and identifies any complications we encountered in collecting the data. Exhibit 2.1 Factors Analyzed in Assessing Utilization Rates
Definition Method of Collection Issues/Concerns External, “Uncontrollable” Factors
Rental Market Conditions Rating of local rental housing market based on availability of affordable units. Measures were tight, moderate, or loose.
Assessments were collected from PHA staff and confirmed by HUD FO economists and other local real estate experts
Condition of Local Affordable Housing Stock
Rating of housing stock quality: poor, marginal, good, very good
PHA staff assessment Ratings reflect judgments of PHA staff, not rigorous assessment of property conditions
Receipt of new voucher allocations in the previous two years
Indicator of whether or not PHA has received new allocations in previous 2 years
PHA staff response This variable is somewhat endogenous because only PHAs with high utilization rates were eligible for new increments.
Internal, “Controllable” Factors Overall quality of program management
Rating of quality of overall management: poor, good, excellent
Assessment by Abt analyst based on quality of voucher files, evidence that PHA follows the appropriate sequence of activities, timely completion of inspections; accurate calculation of HAPs; conducting adequate rent reasonableness; maintaining good program records and data.
Quality of management is assessed overall, not by rating separate elements of good management
Chapter 2 – Utilization Rates in the Housing Choice Voucher Program 11

Definition Method of Collection Issues/Concerns Methods used to determine issuance
Rating of extent to which monthly issuance is based on a systematic review of factors: not systematic; somewhat systematic; very systematic
Assessment by field visitors about the extent to which a systematic method is used to determine the number of vouchers to issue each month based on turnover, leasing success, number of available vouchers
Quality of landlord relations
Rating of landlord relations: poor, good, excellent
Assessment by Abt analyst based on interviews with PHA staff and landlords regarding the number and types of complaints from landlords
12 Chapter 2 – Utilization Rates in the Housing Choice Voucher Program

Exhibit 2.1 (Continued) Factors Analyzed in Assessing Utilization Rates
Definition Method of Collection Issues/Concerns Degree of rigor in rent reasonableness calculations
Rating of rigorousness of rent reasonableness: not rigorous, moderately rigorous; extremely rigorous
Assessment by Abt analyst based on PHA staff interviews regarding the practices used to determine rent reasonableness
Level of housing search assistance provided to participants
Rating of level of housing search assistance: no or minimal assistance offered; extensive assistance offered
Assessment by Abt analyst based on results of interviews with PHA staff reporting on the types of assistance provided.
Staffing Resources Ratio of #voucher administered/Full Time Equivalent staff in the voucher program
PHA staff reported number of vouchers and number of staff dedicated to voucher program
Leasing Success Rates Percentage of voucher recipients who are successful in leasing a unit
PHA reported leasing success rate (not measured empirically)
PHA staff may not be able to provide an accurate measure of leasing success
Level of payment standard compared to FMR
PS/FMR PHA reported Payment Standard; HUD FMR from published data
Emphasis on deconcentration
Rating of the level of priority placed on deconcentration by the PHA: low priority; high priority
Assessment by Abt analyst based on interviews with PHA staff regarding whether the PHA has received SEMAP bonus points for deconcentration; types of activities undertaken to promote deconcentration and mobility of tenants
Waiting List Management Frequency of wait list purges; annual or more frequent purges; less than annual purges
PHA staff reports on the frequency of wait list purges
In the sections below, each of these external and internal factors are explored in relation to utilization rates. We present cross tabulations that compare distributions of explanatory factors with the distributions of utilization rates. The exhibits present the number and the percent of high/low utilization PHAs in each category. For example, the second row of Exhibit 2.2 shows that among the 23 PHAs with utilization below 95 percent, 15 (65 percent) are operating in a tight or difficult rental market, and 8 (35 percent) are operating in moderate to loose market conditions. Among the PHAs with utilization above 95 percent, 11 (44 percent) are operating in tight market conditions, and 14 (56 percent) in moderate markets.
Chapter 2 – Utilization Rates in the Housing Choice Voucher Program 13

In addition the last column of each table presents the average utilization rate for the group of PHAs with a particular characteristic. 13
To test the statistical significance of the relationships found, we conducted Chi-square tests on each comparison.14 Differences that are statistically significant at the 0.1 level are noted by “**”. In some cases, although the patterns seem apparent, the differences may not be statistically significant due to small sample sizes.15 When differences in averages are statistically significant at the 0.1 level, values are bolded and italicized. 2.2.1 External Factors Affecting Utilization Rates
PHA Size The sample selection strategy for the study involved selecting at least 13 high and 12 low utilization agencies from among large, medium, and small PHAs (PHAs with programs of fewer than 250 units were excluded from the sampling frame). The proportion of high and low utilization agencies calculated at the time of the site visit in each of the program size categories is shown in the first panel of Exhibit 2.2. (At the time of the site visit, there were 25 PHAs with high utilization and 23 with low utilization based on the definition of utilization used in the analysis). We cannot use the sample to comment on the relationship between utilization and PHA size because the sites were selected to include a specific number of high and low utilization sites within each size category. Rental Market Conditions Perhaps the factor most commonly cited as affecting utilization is the availability of affordable rental units in a PHA’s jurisdiction. A lack of units, or market tightness, would seem to be a clear contributor to low rates of utilization. We collected information about the availability of affordable rental properties from interviews with PHA staff, local real estate experts, and HUD field office staff. We characterized each site as having either a tight rental market with low rental vacancy rates, or a loose to moderate market, with an ample supply of affordable units available to program participants. The results of comparing market characteristics for low and high utilization sites are shown in the second row of Exhibit 2.2.
13 It is important to keep in mind that the tables reflect only the distributions for the study sample, and are not
representative of the all PHAs. For example, about one quarter of the study PHAs are small, another quarter medium, and half large. This is not the way the universe of PHAs looks.
14 In cases where cross tabulations show a three-way breakdown of a characteristic (e.g., poor/good/excellent relations with landlords), chi-square tests were performed on two-by-two comparison (e.g., poor/good or excellent relation with landlords).
15 Statistical significance at the 0.1 level means that given the sample sizes and distributions found, there is a 90 percent chance that the distributions (or means) are in fact different, and only a 10 percent chance that with the sample size and distribution found, the distributions (or the mean) are in fact the same. However, because of our relatively small samples in some category cells, often the observed results are not statistically significant.
14 Chapter 2 – Utilization Rates in the Housing Choice Voucher Program

Exhibit 2.2
Chapter 2 – U
tilization Rates in the Section 8 H
ousing Choice Voucher Program
15
External Factors by PHA Utilization Rate
Low Utilization PHAs (<95% Units Utilized)
(N=23)
High Utilization PHAs (>=95% Units Utilized)
(N=25) All PHAs
(N=48) Number Percent Number Percent Number Percent
Average Utilization in this Group of
PHAs PHA Size
Small PHAs (250-499 units) 5 22% 6 24% 11 23% 95.0 Medium PHAs (500-999 units) 8 35% 3 12% 11 23% 88.1 Large PHAs (1000+ units) 10 43% 16 64% 26 54% 95.1
Market Tightness Tight Market 15 65% 11 44% 26 54% 93.8Moderate/Loose Market 8 35% 14 56% 22 46% 93.2
Condition of Housing Stock Poor 3 13% 1 4% 4 8% 83.416
Good 16 70% 21 84% 37 77% 94.5 Very Good 4 17% 3 12% 7 15% 93.9
Receipt of New Voucher Allocations**
Have received new allocations in the past two years 13 57% 20 80% 33 69% 96.3 Have not received new allocations in the past two years 10 43% 5 20% 15 31% 87.3
Source: MTCS data, site visits; interviews with PHA staff, corroborated by interviews with EMAD, others.
** Signifies that the difference in distributions is statistically significance at the 0.1 confidence level. Statistically significant differences in averages (at the 0.1 level) are bolded and italicized. Observations with missing data are excluded from the calculations.
16 Difference between poor versus good statistically significant.

If market conditions act as an obstacle to voucher leasing, we would expect to see low utilization PHAs clustered in tight or difficult rental markets, with most high utilization agencies in loose or moderate markets. Our findings appear consistent with this hypothesis. Overall, the 48 study PHAs are evenly distributed among tight and moderate rental markets (54 percent in tight markets, 46 percent in moderate/loose markets). Among high utilization sites, however, 56 percent are operating in moderate/loose markets, compared to only 35 percent of low utilization PHAs in similar market conditions. Sixty-five percent of the low utilization PHAs fall in the tight market category, while 44 percent of the high utilization sites are in tight rental markets. With a larger percentage of low utilization PHAs than high utilization PHAs in tight markets, it appears that the condition of the rental market is a factor that determines voucher utilization. Although a higher proportion of high utilizing agencies operate in moderate to loose housing markets than do low utilizing agencies, the average utilization rate among PHAs in tight markets is higher than among PHAs in more favorable market conditions. This is because the average utilization among high utilizers in tight markets (104.7) is higher than among high utilizers in moderate markets (99.2). There are several agencies with very high rates of utilization (over 100 percent) that operate in tight rental markets.17
Our findings with respect to market conditions are constrained to some extent by the sampling method used for the study. Among the 48 PHAs selected for the study, 28 were selected as part of pairs operating in similar market conditions but with different utilization rates. As a result, by definition the sample includes both high and low utilization agencies operating in tight and in loose rental markets. To explore the relationship between market conditions and utilization further, we assessed utilization by market conditions for the 20 study sites that are not part of pairs. This analysis confirms the importance of market condition as a factor influencing utilization rates. Eight of the ten low utilizing PHAs that are not included in the paired site sample operate in tight markets, whereas only 2 operate in loose or moderate markets. Five of the nine high utilizing PHAs are in loose or moderate markets, while four are in tight markets. Later in this chapter, and again in Chapter 4, we explore the issue further, in particular examining internal PHA practices that may help agencies operating in difficult markets to achieve high utilization. A comparison of the characteristics of high utilization agencies in tight rental markets to low utilization agencies operating in similarly difficult markets, indicates that management practices in general and rigorous voucher issuance procedures in particular, help to overcome difficult market conditions.
17 The mean utilization rate by market tightness and utilization category are: low utilizer/tight market (N=15):
85.7, low utilizer/loose market (N=8) 82.7, high utilizer/tight market (N=11) 104.7, high utilizer/loose market (N=14) 99.2
16 Chapter 2 – Utilization Rates in the Housing Choice Voucher Program
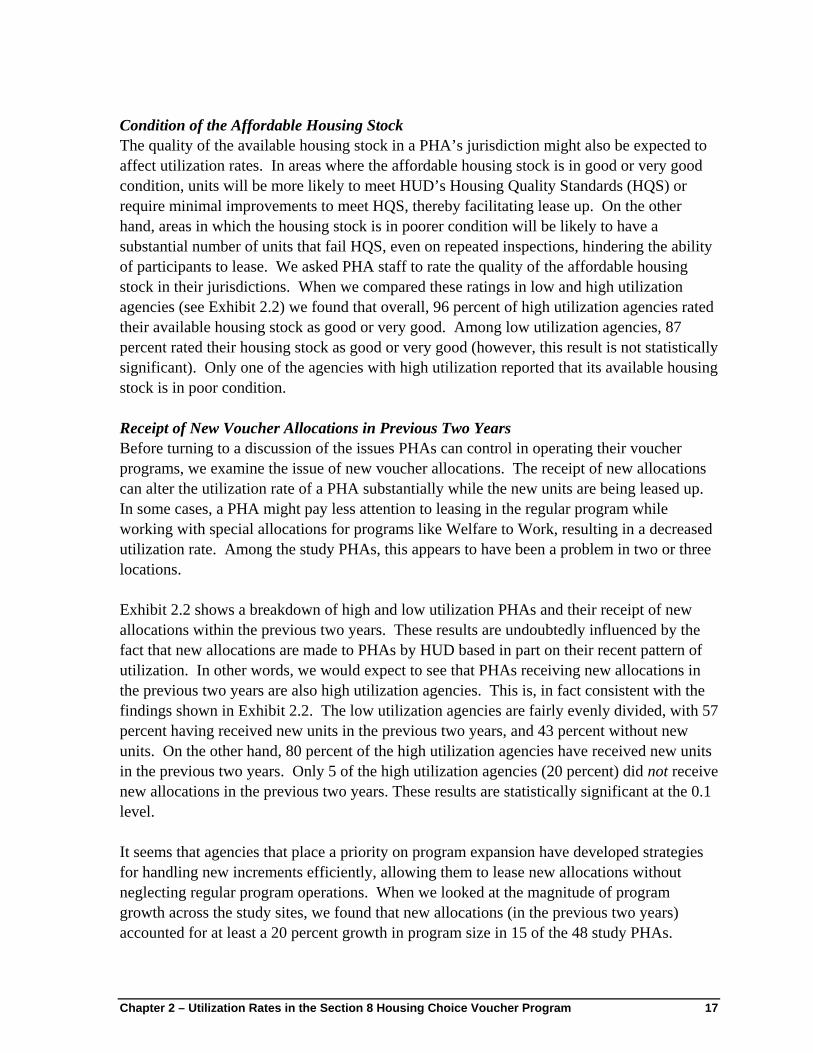
Condition of the Affordable Housing Stock The quality of the available housing stock in a PHA’s jurisdiction might also be expected to affect utilization rates. In areas where the affordable housing stock is in good or very good condition, units will be more likely to meet HUD’s Housing Quality Standards (HQS) or require minimal improvements to meet HQS, thereby facilitating lease up. On the other hand, areas in which the housing stock is in poorer condition will be likely to have a substantial number of units that fail HQS, even on repeated inspections, hindering the ability of participants to lease. We asked PHA staff to rate the quality of the affordable housing stock in their jurisdictions. When we compared these ratings in low and high utilization agencies (see Exhibit 2.2) we found that overall, 96 percent of high utilization agencies rated their available housing stock as good or very good. Among low utilization agencies, 87 percent rated their housing stock as good or very good (however, this result is not statistically significant). Only one of the agencies with high utilization reported that its available housing stock is in poor condition. Receipt of New Voucher Allocations in Previous Two Years Before turning to a discussion of the issues PHAs can control in operating their voucher programs, we examine the issue of new voucher allocations. The receipt of new allocations can alter the utilization rate of a PHA substantially while the new units are being leased up. In some cases, a PHA might pay less attention to leasing in the regular program while working with special allocations for programs like Welfare to Work, resulting in a decreased utilization rate. Among the study PHAs, this appears to have been a problem in two or three locations. Exhibit 2.2 shows a breakdown of high and low utilization PHAs and their receipt of new allocations within the previous two years. These results are undoubtedly influenced by the fact that new allocations are made to PHAs by HUD based in part on their recent pattern of utilization. In other words, we would expect to see that PHAs receiving new allocations in the previous two years are also high utilization agencies. This is, in fact consistent with the findings shown in Exhibit 2.2. The low utilization agencies are fairly evenly divided, with 57 percent having received new units in the previous two years, and 43 percent without new units. On the other hand, 80 percent of the high utilization agencies have received new units in the previous two years. Only 5 of the high utilization agencies (20 percent) did not receive new allocations in the previous two years. These results are statistically significant at the 0.1 level. It seems that agencies that place a priority on program expansion have developed strategies for handling new increments efficiently, allowing them to lease new allocations without neglecting regular program operations. When we looked at the magnitude of program growth across the study sites, we found that new allocations (in the previous two years) accounted for at least a 20 percent growth in program size in 15 of the 48 study PHAs.
Chapter 2 – Utilization Rates in the Section 8 Housing Choice Voucher Program 17
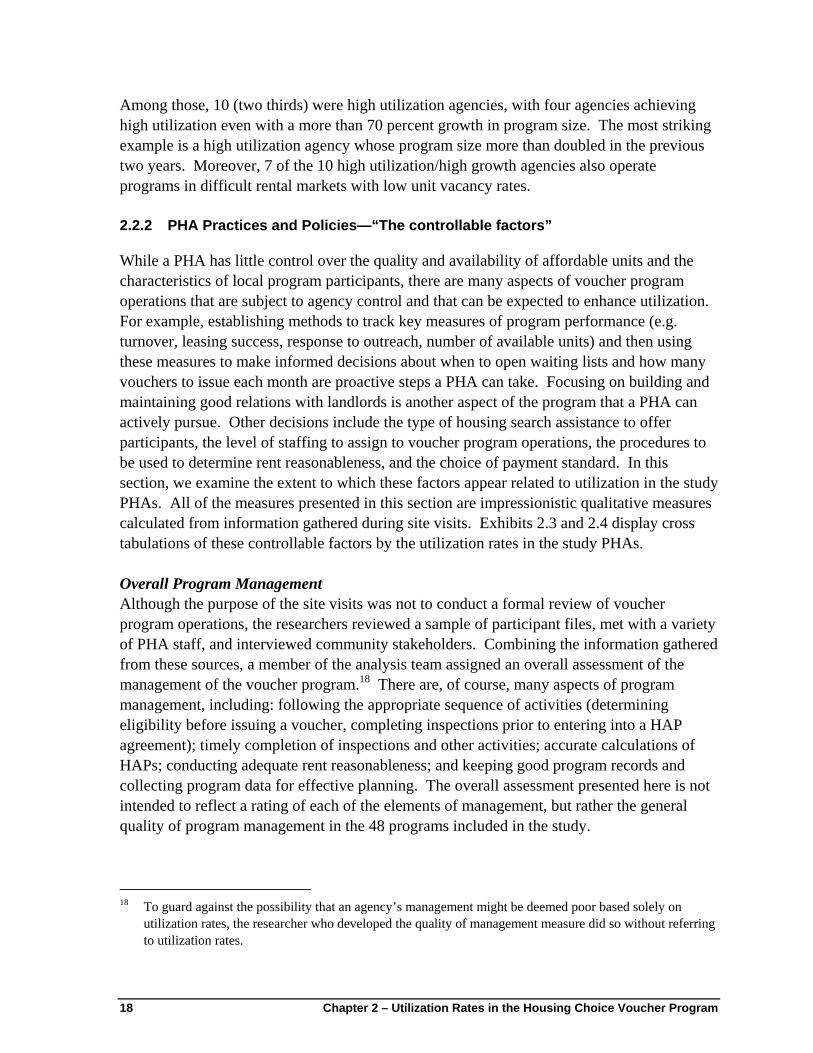
Among those, 10 (two thirds) were high utilization agencies, with four agencies achieving high utilization even with a more than 70 percent growth in program size. The most striking example is a high utilization agency whose program size more than doubled in the previous two years. Moreover, 7 of the 10 high utilization/high growth agencies also operate programs in difficult rental markets with low unit vacancy rates. 2.2.2 PHA Practices and Policies—“The controllable factors”
While a PHA has little control over the quality and availability of affordable units and the characteristics of local program participants, there are many aspects of voucher program operations that are subject to agency control and that can be expected to enhance utilization. For example, establishing methods to track key measures of program performance (e.g. turnover, leasing success, response to outreach, number of available units) and then using these measures to make informed decisions about when to open waiting lists and how many vouchers to issue each month are proactive steps a PHA can take. Focusing on building and maintaining good relations with landlords is another aspect of the program that a PHA can actively pursue. Other decisions include the type of housing search assistance to offer participants, the level of staffing to assign to voucher program operations, the procedures to be used to determine rent reasonableness, and the choice of payment standard. In this section, we examine the extent to which these factors appear related to utilization in the study PHAs. All of the measures presented in this section are impressionistic qualitative measures calculated from information gathered during site visits. Exhibits 2.3 and 2.4 display cross tabulations of these controllable factors by the utilization rates in the study PHAs. Overall Program Management Although the purpose of the site visits was not to conduct a formal review of voucher program operations, the researchers reviewed a sample of participant files, met with a variety of PHA staff, and interviewed community stakeholders. Combining the information gathered from these sources, a member of the analysis team assigned an overall assessment of the management of the voucher program.18 There are, of course, many aspects of program management, including: following the appropriate sequence of activities (determining eligibility before issuing a voucher, completing inspections prior to entering into a HAP agreement); timely completion of inspections and other activities; accurate calculations of HAPs; conducting adequate rent reasonableness; and keeping good program records and collecting program data for effective planning. The overall assessment presented here is not intended to reflect a rating of each of the elements of management, but rather the general quality of program management in the 48 programs included in the study.
18 To guard against the possibility that an agency’s management might be deemed poor based solely on
utilization rates, the researcher who developed the quality of management measure did so without referring to utilization rates.
18 Chapter 2 – Utilization Rates in the Housing Choice Voucher Program

Chapter 2 – U
tilizatio
Exhibit 2.3
n Rates in the Section 8 H
ousing Choice Voucher Program
19
Management, Issuance Methods, Search Assistance and Landlord Relations in the 48 Study PHAs, by PHA Utilization Rate
Low Utilization PHAs (<95% Units Utilized)
(N=23)
High Utilization PHAs (>=95% Units Utilized)
(N=25) All PHAs
(N=48) Number Percent Number Percent Number Percent
Average Utilization in
This Group of PHAs
Overall Impression of Management** Excellent Management 0 0% 7 28% 7 15% 99.619
Satisfactory Management 14 61% 16 64% 30 63% 94.5 Poor Management 9 39% 2 8% 11 23% 86.9
Voucher Issuance Method** No system for determining issuance 9 39% 5 20% 14 29% 89.520
Somewhat systematic approach 9 39% 9 36% 18 38% 91.8 Very systematic approach for determining issuance 5 22% 11 44% 16 33% 98.9
Level of Search Assistance Offered No search assistance/minimal assistance offered 13 57% 12 48% 25 52% 93.9More extensive search assistance offered 10 43% 13 52% 23 48% 93.0
Quality of Landlord Relations Poor Landlord Relations 4 17% 2 8% 6 13% 91.321
Good Landlord Relations 17 74% 11 44% 28 58% 91.5 Excellent Landlord Relations 2 14% 12 48% 14 29% 98.4
19 Differences between poor and excellent and poor and satisfactory statistically significant. 20 Differences between very systematic versus not systematic and between very systematic versus somewhat systematic statistically significant. 21 Differences between excellent versus good and between excellent versus poor statistically significant.
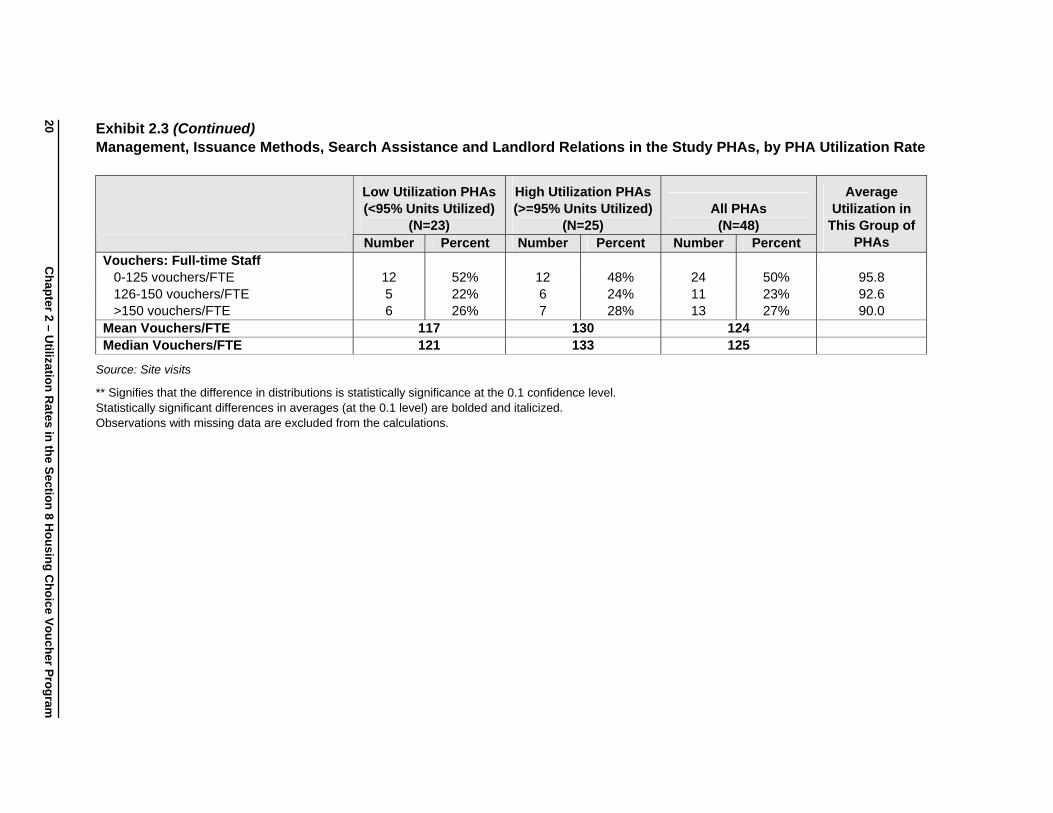
Exhibit 2.3 (Continued)
20
Chapter 2 – U
tilization Rates in the
Section 8 Housing C
hoice Voucher Program
Management, Issuance Methods, Search Assistance and Landlord Relations in the Study PHAs, by PHA Utilization Rate
Low Utilization PHAs (<95% Units Utilized)
(N=23)
High Utilization PHAs (>=95% Units Utilized)
(N=25) All PHAs
(N=48) Number Percent Number Percent Number Percent
Average Utilization in
This Group of PHAs
Vouchers: Full-time Staff 0-125 vouchers/FTE 12 52% 12 48% 24 50% 95.8126-150 vouchers/FTE 5 22% 6 24% 11 23% 92.6>150 vouchers/FTE 6 26% 7 28% 13 27% 90.0
Mean Vouchers/FTE 117 130 124 Median Vouchers/FTE 121 133 125
Source: Site visits
** Signifies that the difference in distributions is statistically significance at the 0.1 confidence level. Statistically significant differences in averages (at the 0.1 level) are bolded and italicized. Observations with missing data are excluded from the calculations.

Chapter 2 – U
tilizatio
Exhibit 2.4
n Rates in the Section 8 H
ousing Choice Voucher Program
21
Other PHA Controllable Factors in the Study PHAs, by PHA Utilization Rate
Low Utilization PHAs (<95% Units Utilized)
(N=23)
High Utilization PHAs (>=95% Units Utilized)
(N=25) All PHAs
(N=48)
Average Utilization in
This Group of PHAs
Number Percent Number Percent Number Percent Rigorousness of Rent Reasonableness
Not rigorous 4 17% 1 4% 5 10% 89.3Basic process satisfies regulations 13 57% 16 64% 29 60% 94.6Rigorous system 6 26% 8 32% 14 29% 92.7
Estimated Leasing Success Rate** 0-70% 14 64% 6 29% 20 47% 90.671-100% 8 36% 15 71% 23 53% 95.9
PS/FMR Comparison** PS<FMR 0 0% 2 8% 2 4% 102.0PS=FMR 5 22% 9 36% 14 29% 93.5PS>FMR 18 78% 14 56% 32 67% 93.0
Deconcentration Deconcentration is not a high priority 10 50% 12 48% 22 49% 94.6 Deconcentration is a high priority 10 50% 13 52% 23 51% 93.3
Frequency of Wait List Purges** Purging wait list is not necessary because applicants are processed within one year 1 5% 4 17% 5 11% 93.4Wait list purged annually or more frequently 11 50% 14 61% 25 56% 94.3Wait list purged less often than annually 10 45% 5 22% 15 33% 91.6
Source: Site visits
** Signifies that the difference in distributions is statistically significance at the 0.1 confidence level. Statistically significant differences in averages (at the 0.1 level) are bolded and italicized. Observations with missing data are excluded from the calculations.
We would expect that agencies with good management would also have high rates of utilization, and our findings show a strong relationship between management quality and utilization. In Exhibit 2.3 we compare the quality of program management in high and low-utilization PHAs. Overall, 7 of the 48 study PHAs were considered to have excellent program management, and all of these are high utilization agencies. On the other hand, 11 of the 48 were found overall to be managed poorly, and 9 of these are low utilization PHAs.22 Among the high utilization PHAs in our sample, a full 92 percent are managed excellently or satisfactorily, while none of the low utilization agencies had excellent management, and 61 percent had satisfactory management (these results are statistically significant at the .01 level). It appears then, that good management is indeed a key ingredient in high utilization. Methods Used to Determine Issuance One of the critical decisions a PHA makes in the course of operating the voucher program is the number of vouchers to issue each month. The number of vouchers a PHA issues is the key to whether — or how quickly — a PHA is able is able to lease up new funding increments and/or achieve (or maintain) an acceptable level of utilization. The formula for determining how many vouchers a PHA should issue on a regular basis is relatively straightforward. At the beginning of the period in question — generally the PHA’s fiscal year, or some shorter period when new vouchers are available — the PHA must determine:
• How many new or currently available vouchers must be leased, and
• How many currently leased vouchers will become available during the period through normal program turnover.
The former is generally easy to quantify. The latter, however, can be tricky because many PHAs have data processing systems that aggregate contract terminations for families who vacate one program unit to lease another one (unit, but not voucher, turnover) with contract terminations for families who leave the program permanently and whose vouchers become available for leasing by another family. The number of “true” turnover vouchers is added to the number of new or available units to determine the number of lease-ups needed. Once this number has been determined, the PHA must calculate how many vouchers should be issued to achieve those lease-ups. If all applicants from the waiting list showed up for their eligibility interviews, all interviewed applicants were eligible (and met any preference 22 The fact that 11 of the 48 sample PHAs (23 percent) were classified as poorly managed does not mean that
overall we would 23 percent of all PHAs to be poorly managed. We purposively selected the sample to consist of about half low utilizers. In addition, the paired sites included both high and utilizers in a particular market. Both of these factors make it likely that the sample includes a higher fraction of poorly managed PHAs that the universe as a whole.
22 Chapter 2 – Utilization Rates in the Housing Choice Voucher Program

criteria established by the PHA), and all voucher holders found units to lease, the calculation would stop here and the number of letters of invitation the PHA sent out would be the same as the number of leases needed. But in the real world, some percentage of applicants do not show, some percentage of interviewees are not eligible and/or do not qualify for the preferences that caused them to be called in when they were, and some percentage of voucher holders never find a suitable unit, or port-out to another jurisdiction are lost to the original PHA. Based on (ideally) good data regarding the actual experience of program applicants in their locality, or the staff’s best guess, the PHA will have to decide how many vouchers to issue to achieve the required number of leases. The application of the following formula allows the PHA to adjust its issuance to allow for less than optimal (<100%) success rates at key stages in the eligibility and leasing process:
IF A is the number of letters of invitation sent B is the percentage of applicants who show up for eligibility interviews C is the percentage of interviewees who meet preference criteria D is the percentage of interviewees who are eligible for vouchers E is the percentage of voucher holders succeed in leasing in the jurisdiction
THEN A x B x C x D x E equals the number of vouchers leased.
For example, if a PHA typically has a 50 percent response rate to its letters of invitation, most (90 percent) are eligible and the PHA has no preferences, and 80 percent of their voucher holders are able to find units, sending out 50 letters of invitation can be expected to result in approximately 18 leases (50 x .50 x .90 x 1.00 x .80 = 18). Or to put it another way, the PHA must send out approximately 3 letters (18/50) for every unit it needs to lease. If the same PHA has 9 months to lease a new increment of 75 vouchers, has 30 units currently available, and loses 6 units a month through turnover, the number of units that need to be leased in the 9 month period to reach full utilization is 159 (75+30+(9x6)). To lease 159 units, the PHA must issue 477 letters of invitation. Most PHAs have a fairly accurate idea of how many applicants respond to letters of invitation. However, fewer monitor the number of applicants interviewed who are eligible for assistance and/or meet the PHA’s preferences, and how many voucher holders are able to lease-up (the PHA’s “success rate”). By keeping better data at each step of the eligibility and leasing process, and monitoring changes over time, a PHA can plan more effectively and modify its projections as necessary to meet its utilization goals. We examined the practices of each PHA in issuing vouchers to determine the extent to which the relevant factors are tracked and taken into consideration. We found that some agencies do not track turnover or success rates, making it impossible to base the number of issuances
Chapter 2 – Utilization Rates in the Section 8 Housing Choice Voucher Program 23

on these factors. Others are constrained in the number of staff available to the program, and issue only as many vouchers as available staff are able to process, regardless of the number of vouchers available, turnover, and success rates. Other agencies report monitoring turnover, success rates, and number of available vouchers, but the number of vouchers issued each month does not appear sufficient given estimates of the relevant factors. Others track and monitor the key factors, and have developed a system for determining the number of vouchers to be issued each month that appears accurate and sufficient to reach and maintain utilization goals. Using this information, we developed a qualitative measure of the rigorousness of the issuance method using three categories — not systematic, somewhat systematic, and very systematic. We then compared the distribution along these measures for both high- and low- utilization PHAs in the study (see Exhibit 2.3). Overall, 44 percent of the high utilization agencies in the study use a very systematic approach in issuing vouchers, while only 22 percent of the low utilization agencies use a very systematic approach. In fact, 80 percent of the high utilizers use a somewhat or very systematic approach, while only 61 percent of the low utilizers do the same. These differences in distributions are statistically significant at the 0.1 level. It appears that tracking key aspects of program performance and using these measures to make systematic decisions about issuance does influence the utilization rate. As we discuss in later sections, a very systematic issuance method appears to be an important strategy that high utilizing agencies use, both to process large numbers of new allocations and to compensate for difficult market conditions. Level of Housing Search Assistance With respect to providing housing search assistance to voucher recipients, PHAs must provide a briefing that meets the requirements of 24 CFR 982.301. This includes telling the family where units may be leased (both inside and outside the jurisdiction), explaining how portability works, telling them about the advantages of living in low poverty areas, providing a list of landlords or other parties who may be willing to lease a unit to the family, or helping the family find a unit. We might expect that more extensive search assistance would enhance the ability of families to locate and lease units, thereby contributing to high rates of utilization. We collected information on the level of search assistance offered to voucher program participants in the study PHAs. We created a qualitative assessment of search assistance reflecting no or minimal assistance provided vs. more extensive assistance for each of the PHAs included in the study. Sites in the “no or minimal assistance category” include those both those who offer no assistance and those offering only lists of landlords or units. More extensive assistance included counseling to families, moving assistance, transportation, referrals to social service agencies, and referrals to sources of assistance with security
24 Chapter 2 – Utilization Rates in the Housing Choice Voucher Program

deposits. We would expect that more extensive housing search assistance would result in higher utilization rates because with more assistance families would be more likely to be able to lease units. The PHAs included in the study were evenly divided among those providing no or minimal assistance and those providing more extensive assistance. These distributions are similar among the low and high utilization PHAs, with a slightly higher percentage of high utilization agencies offering extensive assistance than low utilization agencies (52 percent compared with 43 percent—See Exhibit 2.3). This indicates that level of search assistance is probably not an important factor in achieving high utilization.23 Quality of Landlord Relations Efforts made to reach out to new landlords and to maintain good relations with existing landlords may also be expected to affect utilization. If landlords are satisfied with the voucher program operations it may be easier for voucher recipients to locate and lease units, and to encourage new landlords to participate in the program. We created a qualitative measure of the status of landlord relations in each of the study PHAs based on interviews with participating landlords, tenant advocacy groups, and PHA staff. We categorized landlord relations as being poor, good, or excellent. The results are shown in Exhibit 2.3. Overall, 48 percent of the high utilization agencies were considered to have excellent relations with their landlords, compared with only 14 percent of the low utilization agencies. Only two high utilization agencies had poor landlord relations, compared with four of the low utilization agencies. Agencies with excellent landlord relations take a variety of steps both to reach out to new landlords and to respond to the concerns of existing owners. We found three general categories of things that PHAs are doing to maintain good relations with landlords. One is reaching out on an individual basis to landlords, by emphasizing to all staff (particularly inspectors) to be sensitive and responsive to landlords issues, and bring concerns to the attention of Section 8 director and other staff. This personal outreach serves to make landlords feel that program staff know them and are willing to intervene with problems that may arise with tenants or with units. Other programs focus on reaching out to large groups of landlords by attending meetings of landlord groups to explain the voucher program. This allows the PHA to get the message out to groups of old and new landlords, to ensure that accurate information about the voucher program is provided to owners and to respond to issues or concerns. Other examples of outreach to larger groups of landlords include newsletters and open houses at the PHA for new and existing landlords.
23 On the other hand, it could also be the case that agencies can achieve high utilization by substantially over-
issuing vouchers, without attention to housing search assistance and leasing success. A lack of relationship between utilization and search assistance would be expected under these circumstances.
Chapter 2 – Utilization Rates in the Section 8 Housing Choice Voucher Program 25

A third category of actions include attention to the “nuts and bolts” of program operations, ensuring that HAP checks are accurate and timely, and that inspections, rent reasonableness, and other functions are conducted consistently, timely and well. Along these lines, one agency has instituted direct deposit of HAP checks, which has reportedly been received very favorably by participating owners. Developing good relationships with landlords seems to be an important step PHAs can take to enhance their utilization of vouchers. This issue is explored in more detail in Chapter 4 on paired site comparisons. Level of Staffing All of the voucher program functions, including maintaining the program’s wait list, calling families off the list, determining eligibility, conducting briefings, executing leases, completing inspections, conducting rent reasonableness, and conducting annual re-examinations require a certain level of staffing. One potential reason an agency might be underutilized is if staffing levels are insufficient to operate the program. We assessed the level of staffing by calculating the ratio of program vouchers to full time voucher program staff in each of the study PHAs. If staffing limitations are an obstacle to utilization, we would expect to see low utilization agencies clustered in the high voucher/staff category. The results of this analysis are shown in Exhibit 2.3 and run contrary to this hypothesis. Among the low utilization agencies, the average number of vouchers to full time staff is 117, compared to 130 among high utilization agencies and to 124 across all study PHAs. The distribution of the ratio of vouchers/staff is actually quite similar among the two groups of PHAs, and there is no indication that low utilization agencies have more difficult staffing situations. Differences in the distribution of high and low utilization agencies along various categories of staffing levels are not statistically significant. Rent Reasonableness Every time a unit is leased with voucher assistance or a rent increase for an assisted unit is approved, housing agencies are required to certify that the rent for the unit is reasonable based on the rents for comparable, unassisted units in the rental market. In making this determination, the PHA must consider the location, quality, size, type and age of the unit that will be assisted, and any amenities, services, maintenance or utilities provided by the owner. If the requested rent is determined not reasonable, the HA must negotiate a lower rent with the owner or disapprove the unit. Housing agencies generally conduct this “rent reasonableness” review by direct, factor by factor comparison of the unit to be assisted with comparable units in the immediate area. A few use hedonic regressions that adjust average rents for units in the market area in accordance with the value to the renter (based on market data) of specific characteristics and amenities of the unit. To conduct effective rent reasonableness reviews, PHAs need good up-to-date information about market rents in their jurisdiction, as well as good information about the unit that the
26 Chapter 2 – Utilization Rates in the Housing Choice Voucher Program

voucher holder wants to lease, and procedures that ensure that the market data are used correctly in determining the reasonable rent for the unit to be assisted. For PHAs using direct comparison, this will usually require the compilation (and periodic updating) of a rental data base that is large enough to allow the user to identify comparable units by area, type, and size, and that provides sufficient detail about the units to determine that they are in fact comparable. For PHAs using a regression method, a database with current rental market data is also necessary for calculating and periodically re-calibrating allowable rents. Some PHAs have established no database, and rely on the expertise of their inspectors or rental data collected informally for each unit and filed in the participant file or discarded once a decision is made. These methods are at best inefficient, and at worst inadequate to meet HUD’s requirements. A housing agency must walk a fine line when it certifies that requested or negotiated rents are reasonable. If the PHA is too inflexible in its enforcement of rent reasonableness, and/or does not include a wide range of housing in its rental survey, rents determined reasonable will be too low, owners of marketable higher quality units in better locations will be unwilling to lease units to program families, and assisted families will be concentrated in less desirable, low-rent areas of the market. If the PHA is too lax in its enforcement of rent reasonableness, HAP costs will be higher than they need to be, voucher holders will consistently outbid unassisted renters in low-rent areas (leading to concentration), and the PHA will lose its ability to use higher rents as an incentive to improve unit quality. Based on information collected during the site visits, we sorted the study PHAs based on the degree of rigor in their rent reasonableness procedures. If rigorous rent reasonableness processes are indeed a hindrance to utilization, we would expect that a relatively high proportion of the low utilization agencies would have rigorous rent reasonableness procedures when compared to high utilization agencies. As shown in Exhibit 2.4 however, we find that a higher percentage of high utilization agencies use rigorous rent reasonableness procedures (32 percent) and a lower percentage (4 percent) use less rigorous procedures than their counterparts in the low utilization agencies. Overall, though, these differences in distributions are not statistically significant, indicating at least that the rigor of rent reasonableness calculations does not appear to be an obstacle to high utilization. Many of the agencies that use rigorous procedures for determining rent reasonableness also were rated as having good program management. It may well be that even though rigorous rent reasonableness could potentially impede utilization, good management helps to overcome this effect. Since the sample size does not allow for multivariate analysis of the factors that contribute to utilization we cannot make conclusions of the relative importance of the factors explored in the study. Leasing Success Rates Another key factor that would be expected to influence utilization is the proportion of voucher recipients who are able to use their vouchers to lease a unit — or leasing success
Chapter 2 – Utilization Rates in the Section 8 Housing Choice Voucher Program 27

rates. We would expect that agencies with higher success rates would have higher unit utilization since it should be easier to reach full utilization in a situation where voucher recipients are more likely to be successful at leasing up. We compared the leasing success rate reported to us by PHA staff (see Exhibit 2.4). To measure accurately the leasing success rate in the PHAs we would need to track the results of housing search among actual voucher recipients. The success rates assessed here are not such measures, but rather are estimates of the leasing success rates that were reported to us by PHA staff. Using these estimates, we found that reported success rates are a significant factor in utilization rates. We observed that among the high utilization PHAs, 71 percent reported leasing success rates of over 71 percent (the national average leasing success rate), while only 36 percent of low utilization agencies reported similar success rates. High utilization agencies were also less likely than low utilizers to report success rates of 70 percent or lower.24 These results are statistically significant at the 0.1 level. Level of Payment Standard Relative to Fair Market Rents Another aspect of the program left to the discretion of the PHA is the level of the payment standard to be established for the voucher program. Every year, HUD publishes Fair Market Rents (FMRs) for localities across the nation. These FMRs are used to determine the eligibility of rental housing units for the program. HUD sets FMRs to assure that a sufficient supply of rental housing is available to program participants. The level at which FMRs are set is expressed as a percentile point within the distribution of standard-quality rental housing. Historically, the FMR has represented the 40th percentile housing cost for rental housing in the locality. In 1999, HUD also published 50th percentile FMRs for approximately 40 localities where it determined that voucher holders had lower than average success rates finding decent rental housing that they could afford. Other PHAs with low success rates were also permitted to request 50th percentile FMRs. For the Housing Choice Voucher program, PHAs are permitted to set their payment standards — the allowances, for each unit size, that will be used to determine a family’s HAP subsidy — within the “basic range”, 90 – 110 percent of the published (40th or 50th percentile) FMR. PHAs may adopt multiple payment standards within the basic range to reflect higher or lower rental costs in various market areas within their jurisdictions. A higher payment standard results in higher subsidy costs and also allows higher rent units to be leased under the program. We might expect to see higher payment standards in high utilization agencies compared to low utilization agencies, if setting a higher payment standard makes it easier for participants to lease units. In Exhibit 2.4, we compare payment standards (relative to FMRs) in the high utilization agencies to those in low utilization agencies, and our findings run contrary to this hypothesis. We find that a majority (78
24 However, 16 percent of the high utilization agencies did not know their leasing success rate.
28 Chapter 2 – Utilization Rates in the Housing Choice Voucher Program
percent) of low utilization agencies have payment standards greater than FMRs and none have payment standards set below FMRs. Among high utilization agencies, more than half (56 percent) have payment standards above FMRs, 36 percent have payment standards equal to FMRs and 2 (8 percent) have payment standards less than FMR (differences in distributions are significant at the 0.1 level). In other words, PHAs with higher payment standards do not necessarily have higher utilization rates. It is possible that setting a higher payment standard is a relatively straightforward change for a PHA to make (easier for example than improving landlord relations or changing staffing practices). As a result, raising the payment standard may be a change that low utilization agencies make in an effort to improve their utilization but this change may not be sufficient to raise utilization rates. The results might also reflect the fact that even in jurisdictions where PHAs have set the payment standard above the FMR, local rents are not necessarily at the level of the payment standard in all cases. Deconcentration We collected information on the efforts made in the study PHAs to encourage deconcentration of voucher program participants across the agencies’ jurisdictions. In particular, we asked about whether the PHAs in this study collect information for the SEMAP bonus indicator on deconcentration and whether they have been awarded bonus points for deconcentration. We also gathered data on efforts in place to encourage mobility of voucher participants and asked PHA staff to rate how high a priority they place on deconcentration. We used this information to develop a qualitative assessment variable indicating that deconcentration is or is not a high priority for the PHA. However, no patterns were observed to indicate that high utilization PHAs in this study are more likely than low utilization agencies to encourage deconcentration. (See Exhibit 2.4) Waiting List Management A final factor we examined is waiting list management. We collected information on the frequency that PHAs update or purge their voucher program waiting lists. Purging the lists refers to contacting families on the list to ascertain whether they are still interested in the program and removing the names of those no longer interested or who cannot be reached. This results in an updated waiting list with accurate contact information, so that when people on the waiting list are invited to apply for a voucher, presumably a high proportion will respond. When we compared frequency of wait list purging in the low and high-utilization PHAs we found that a higher proportion of high utilization agencies (61 percent) than low utilization agencies (50 percent) purge their waiting lists annually or more frequently (see Exhibit 2.4). Conversely, a higher proportion of low utilization PHAs (45 percent) report purging their waiting lists less frequently than annually, compared with 22 percent of high utilization agencies. High utilization agencies appear more likely to conduct regular updates to their waiting list than low utilization agencies.
Chapter 2 – Utilization Rates in the Section 8 Housing Choice Voucher Program 29

In some instances low utilization may result from low demand. Communities with decreasing populations, very low housing costs or over-built affordable housing may have difficulties in attracting families to the voucher program waiting list. Housing agencies with little or no waiting list can make extensive marketing and outreach efforts. However, if the outreach efforts are unproductive, and no increase in demand is forecasted, the PHA may explore reducing its ACC units with HUD.25
2.3 Conclusions
An examination of a variety of external and internal factors and their relation to utilization rates in the study PHAs, yields several themes. First, we find that utilization rates are not static, but rather subject to a fairly substantial degree of fluctuation over time. In terms of external factors, market conditions and condition of affordable housing stock seem most likely to affect utilization in the study PHAs. The receipt of new allocations in the previous two years is another important factor, however in recent years HUD has conditioned the receipt of new allocations on high utilization, so this finding is expected. With respect to PHA management practices, overall quality of program management, methods used to determine issuances, quality of landlord relations, rigorousness of rent reasonableness, leasing success rates, and wait list purging are the factors that are associated with high rates of utilization. Finally, it appears that controllable factors like using systematic procedures for issuing vouchers and quality of program management can help to compensate for unfavorable market conditions, as evidenced by several PHAs with high utilization operating in difficult markets. Conversely, PHAs with low rates of utilization in loose or moderate markets indicate that inattention to internal factors can lead to low utilization, even under favorable market conditions. Changes in Utilization Rates Over Time
For the most part, the utilization rate calculated at the time of sample selection was similar to the rate calculated at the time of the site visit, so that the distribution of the 48 PHAs in the low- and high-utilization categories remained the same. There were some notable exceptions, however, with six agencies shifting from high utilization to low utilization, and ten having increased utilization sufficient to move from the low to the high utilization category (a threshold of 95 percent is used to define high utilization). This illustrates the point that utilization rates can fluctuate even in a relatively short period of time. Sample selection utilization rates were calculated using data from year-end statements for FY2000
25 None of the study sites were experiencing low demand.
30 Chapter 2 – Utilization Rates in the Housing Choice Voucher Program
and updated rates were calculated based on point-in-time estimates of utilization as of early 2002. All but one of the sites with high utilization at the time of sampling, but low utilization at the site visit, are operating their programs in tight rental markets, with low unit vacancy rates and high rental prices. In addition, however, in at least one of the locations, an insufficient number of issuances each month appears to be partly responsible for the change in utilization status. Problems leasing new allocations while simultaneously maintaining utilization in the regular program also appear to be a factor in some of these agencies. At the other end of the spectrum, ten agencies with low utilization rates at the time of sample selection were found to have high utilization at the time of the site visit. Three potential reasons may be behind these increases in unit utilization over time: (1) new voucher allocations, (2) an intensified effort to lease, and (3) loosening of the affordable housing market. Surprisingly, an increase in voucher allocations—i.e. a new increment—resulted in some sites shifting from low utilization at sample selection to high utilization at the time of the site visit. Half of the sites that experienced a substantial increase in their utilization rates from the time of sample selection to the site visit had received new voucher allocations near the time of sample selection. The new units resulted in a calculation of low utilization at the time of sample selection, but by the time of the site visit the agencies had leased many of the new units, and their utilization rates had increased. When assessing a PHA’s utilization, it is therefore important to look not only at the unit utilization rate, but also to consider the timing of any new voucher allocations. A second theme in this group of PHAs that can alter utilization over time is an intensified focus on leasing efforts. At the time of sample selection, one of the PHAs had received a new allocation of Mainstream vouchers. In focusing on that program, they were distracted from the regular program, failing to draw people from the regular waiting list, and resulting in a low utilization rate. Since then, the PHA has made concerted efforts to lease up. While they previously called in two people for every available voucher, they now issue as many vouchers each month as their staff can process. While the PHA had previously been available to take calls from searchers, they now are proactive and call their searchers if they have not communicated with them. Finally, several of the PHAs reported that the loosening of the affordable rental market in recent months is making it easier now than at the time of sample selection for voucher-holders to locate and secure a unit for lease. Exceptions to the General Patterns
The exceptions to the general patterns, namely high utilization agencies in unfavorable markets and low utilization agencies in favorable markets, illustrate another theme of the study. It appears that internal factors subject to PHA control can help an agency to overcome
Chapter 2 – Utilization Rates in the Section 8 Housing Choice Voucher Program 31

difficult market conditions and achieve high rates of utilization, while favorable markets alone are not sufficient to ensure adequate utilization, if PHA practices and policies are not conducive to high utilization. While market conditions do seem associated with utilization rates, there are eleven PHAs with high utilization rates that operate in tight rental markets. What steps are these agencies taking to overcome difficult market conditions? Most use systematic methods to determine the number of vouchers to issue each month, with only two that base issuance only on staff available or historic practices. Only one of these agencies has poor landlord relations, most have excellent or good relations with landlords, and take special steps to ensure that landlords are satisfied with the program and willing to continue participating. Only one of these agencies was considered to have poor overall management, most were considered to be managed well or very well. (Among the low utilizers in tight markets (15), five are considered to have poor management and none to have very good overall management). In general, while market conditions do appear to affect an agency’s ability to use its allocation of vouchers, quality of program management can mitigate the challenges of a difficult market. In addition, six of these high utilization/tight market PHAs have experienced substantial (more than 20 percent) growth in their programs in the previous two years, with two agencies having more than 50 percent increase in program size. These agencies typify the expansion-focused, entrepreneurial model in which utilization is emphasized and achieved, despite difficult market conditions. On the other hand, there are eight agencies that are low utilizers despite operating in loose to moderate rental markets. Several characteristics of these agencies help to underscore the theme that PHA practices can affect utilization. Agencies that are low utilizers despite loose to moderate markets tend to use no method or only a somewhat systematic method for determining the number of vouchers to issue each month. Only one of the low utilization/favorable market PHAs uses a very systematic approach to issuance. Attention to issuance appears especially crucial in difficult market conditions, but even in a favorable market, most high utilizing agencies use a systematic approach. Landlord relations in the low utilization/favorable market agencies are most frequently rated good, rather than excellent, with no special emphasis placed on building relations with owners. Finally, for the most part it appears that agencies with low utilization in difficult markets (a total of 15 PHAs are in this category) are not pursuing practices that might help them compensate for the difficult market conditions. For example, nearly three quarters of these agencies are not using a very systematic system for determining the number of vouchers to issue, and only one is considered to have excellent relations with landlords.
32 Chapter 2 – Utilization Rates in the Housing Choice Voucher Program

Chapter Three Costs in the Voucher Program
In addition to understanding factors that affect utilization, it is also important to understand how various market conditions, demographics and PHA policies interact to affect program subsidy costs. Understanding cost drivers can help policy makers and program operators develop budget projections for future years that are reasonably accurate and create neither shortfalls that require supplemental appropriations nor surpluses to be recaptured by Congress. Program operators need to understand which cost drivers might be controlled without affecting other program goals, and when trade-offs might be appropriate in terms of deciding on numbers versus types of households to serve. This chapter looks at the factors that explain variations in the subsidy costs across PHAs. A key factor affecting subsidy costs is the local rent level. Clearly subsidy costs will be higher in markets with higher rents. However, other factors also affect program costs. Some of these factors are beyond the control of the PHA such as the availability of affordable rental units in the local market, local income levels, and to some extent resident demographics. Other factors that may affect subsidy costs are within the control of the PHA including enforcement of rent reasonableness, minimum rent policies, standard for assigning bedroom sizes to household size and composition, payment standards relative to local FMR, income targeting, and local preferences. 3.1 Defining Subsidy Costs
Subsidy costs measure the amount of government funds spent for each voucher unit under lease. The average subsidy per unit equals the total contributions divided by the number of units under lease, where total contributions include housing assistance payments (HAP payments), fees earned and annual audit costs. The largest component of costs equals the HAP payment, which is the difference between the lower of the payment standard or unit gross rent and the participant portion of the rent. Participants typically pay the highest of 30 percent of adjusted income, 10 percent of gross income, welfare rent, or minimum rent, and thus the HAP equals the payment standard or gross rent (whichever is lower) minus 30 percent of participant income. (If the rent for the unit is above the payment standard, the family can pay the difference, as long as the initial payment is no more than 40 percent of income). In order to identify factors (other than prevailing rents and incomes) that affect subsidy costs we developed a measure of cost that neutralizes the effects of local rents and local income levels. The measure starts with the average monthly cost per unit, which equals total
Chapter 3 – Costs in the Voucher Program 33
contributions as of the end of the PHA’s most recently completed fiscal year (generally 2000) divided by the total number of leased units divided by 12. The average subsidy cost across the 48 sample PHAs was $457 per unit per month. Because we know that key drivers of costs are local market rents and local incomes, we want to control for these, so that we can identify other factors that affect program subsidy costs. The average subsidy was $363 per unit per month in the 24 PHAs with 2-bedroom FMRs at or below $635 per month, and $551.4 in the 24 PHAs with 2-bedroom FMRs above $635 per month.26 We first normalized the average subsidy by dividing it by the local 2-bedroom FMR. We used the 40th percentile FMR for 2001 for all PHAs.27 Because local markets also have different prevailing income levels, which also affect subsidy costs, the final adjusted normalized subsidy costs must also account for local incomes. Thus, the definition of the normalized subsidy cost used for this analysis is:
Average monthly subsidy payment per unit The HAP payment for a 2-bedroom unit rented by a 3 person households with income at exactly 30 percent of the local area median for that household size
if the payment standard is set to the 2-bedroom FMR.
Or:
Average monthly subsidy payment per unit 2 BR FMR minus 30% of 30% of median income for a 3-person household
The numerator is the actual average monthly subsidy payment per unit during the year. The denominator is the HAP payment for a 3-person household earning 30 percent of the median income, if the PHA uses a payment standard set equal to the FMR.
26 The average subsidy was $405 per unit per month in the 24 PHAs where 30 percent of the median income
for a 3-person household was at or below $1,235 per month and $510 per unit per month in the 24 PHAs where 30 percent of the median income for a 3-person household was above $1,235 per month. Local incomes and local FMRs are highly correlated. Eighteen of the 24 low-FMR PHAs were in areas with low median incomes. Similarly 18 of the 24 high-FMR PHAs were in areas with high median incomes.
27 For PHAs that are in metro areas that had FMRs set to the 50th percentile rent, the preliminary FMRs for 2001 were used because the preliminary FMRs were set at the 40th percentile rent and the final FMRs were set at the 50th percentile. For all other PHAs, the final FMRs for 2001 were used.
34 Chapter 3 – Costs in the Voucher Program

3.2 Factors Affecting Subsidy Costs
We would expect the normalized cost to be higher to the extent that:
• The PHA uses a higher payment standard (or gets billed for families who port to jurisdictions with higher payment standards)
• The PHA uses the new 50th percentile FMR28
• The PHA uses exception payment standards, that is, allows rents above 110 percent of the FMR
• The incomes of the households are lower than 30 percent of area median
• The bedroom size distribution is predominantly larger units
• The PHA has no or a low minimum rent
In contrast, normalized costs will tend to be lower to the extent that:
• The PHA uses a lower payment standard (or gets billed for families who port to jurisdictions with lower payment standards)
• Participant incomes are higher
• Program units are smaller (which would be the case in an agency with a large concentration of elderly or disabled families, which tend to be small)
• The PHA typically reduces rents through rigorous enforcement of rent reasonableness.
• The PHA has a high minimum rent
• The PHA tends to offer smaller than average sized units to given family compositions.
The following sections of this chapter describe the relationship between normalized subsidy costs and market rents, participant characteristics, and PHA policies and procedures. 3.2.1 Relationship Between Market Rents and Normalized subsidy costs
As indicated above, the normalized subsidy cost was developed in phases. First, we looked at the nominal average subsidy payment. We then normalized by FMRs, and, finally, we also normalized by local income levels.
28 This would likely not show an effect on subsidy costs in our sample because the financial data for most
PHAs in the study are from a period prior to the introduction of the higher FMRs.
Chapter 3 – Costs in the Voucher Program 35

To compare average monthly subsidy payment per unit with local FMRs, FMRs and subsidy payments were each divided into two groups — high and low. In each case the highest 50 percent were defined as “high”, and the lower 50 percent as “low”. Two-bedroom FMRs above $635 were considered high, as were subsidies payments at above $425. Average subsidy payments are closely related to local market rent levels. All but three low-subsidy PHAs are in low FMR areas. Similarly, all but three high subsidy-PHAs are in high FMR areas.29 When we normalize subsidy payments by dividing them by the local 2-bedroom FMR we partially account for differences in market rents. The average subsidy to FMR ratio is not correlated with market rent levels. Thirteen PHAs that have low normalized subsidy payments are in low FMR areas, while 11 are in high FMR areas. Similarly, thirteen PHAs that have high- normalized subsidy payments are in high FMR areas, while 11 are in low FMR areas. When we completely normalize costs to account for local incomes as well as local rents we find that only nine low cost PHAs are in low FMR areas, while 15 are in high FMR areas. Similarly, only 9 high cost PHAs are in high FMR areas, while 15 are in low FMR areas. 3.2.2 Relationship Between Participant Characteristics and Subsidy Costs
Below we present cross tabulations that compare distributions of the explanatory variables described above with the distributions of normalized subsidy costs. The exhibits present the number and the percent of high/low cost PHAs in each category. For example, the first row of Exhibit 3.1 shows that in 14 low cost PHAs, under three quarters of families had extremely low incomes (under 30 percent of local median), as was the case in 6 high cost PHAs. Fourteen equals 58 percent of the low cost PHAs, and 6 equals 25 percent of the high cost PHAs.30
29 The FMRs and subsidy payments for the high-subsidy PHAs in low FMR areas typically have borderline
FMRs and or subsidies. For example the 2-bedroom FMRs in these three PHAs range from $608 to $628, while the subsidies range from $425 to $489. Two of the three low- subsidy PHAs in high FMR areas have borderline subsidies of $410 and $415 per unit. The third is in a market with high welfare rents that reduce the subsidy portion of the rent payment.
30 Alternatively, the exhibits could have shown the percent of PHAs in each category that are high or low-cost. This would have meant presenting row percents. That is, of the 20 PHAs where fewer than three quarters of the families had extremely low incomes, 14 or 70 percent had low costs, and 6 or 30 percent had high costs.
36 Chapter 3 – Costs in the Voucher Program

Ch
apter 3 – Costs in the Voucher Program
37
Exhibit 3.1 Incomes in Study PHAs by Normalized Subsidy Costs
Low Cost PHAs High Cost PHAs All PHAs
Number
Percent of Low Cost
PHAs Number
Percent of High Cost
PHAs Number Percent of All PHAs
Average Cost in This Group
of PHAs Percent of Households with Income <30% of Median for their Household Size **
< 75% of all Households 14 58% 6 25% 20 42% 1.72 75%+ of all Households 10 42% 18 75% 28 58% 1.91
Percent of Households with Income 30-50% of Median for their Household Size **
25%+ of all Households 12 50% 3 12% 15 31% 1.53 <25% of all Households 12 50% 21 88% 33 69% 1.97
Percent of ELI Households admitted in past FY
<75% ELI 6 27% 5 23% 11 25% 1.8975%+ ELI 16 73% 17 77% 33 75% 1.81
Percent of Households with at least 50% of Income from Wages **
<40% of households 18 75% 8 33% 26 54% 1.76 40%+ of households 6 25% 16 67% 22 46% 1.92
Source: HUD data on subsidy costs. MTCS data on income characteristics
** Signifies that the difference in distributions is statistically significance at the 0.1 confidence level. Statistically significant differences in averages (at the 0.1 level) are bolded and italicized. All missing observations are excluded from the percentage calculations

To test the statistical significance of the relationships found, we conducted Chi-square tests on each comparison. Differences that are statistically significant at the 0.1 level are noted by “**”. In some cases, although the patterns seem apparent, the differences may not be statistically significant due to small sample sizes.31
In addition, the last column of each table presents the average normalized subsidy cost for the group of PHAs with a particular characteristic. For example, the first row shows that the average cost across PHAs where under three quarters of residents have extremely low incomes is 1.72, compared with 1.91 in PHAs where over three quarters have extremely low incomes. When the differences in means are statistically significant at the 0.1 level the values are bolded and italicized. Again, although some patterns may appear obvious, they may not be statistically significant due to small sample sizes. Participant incomes are expected to have a significant effect on subsidy costs. An important part of the subsidy equals the HAP payment which is the difference between the lower of payments standard for the family’s household size and composition or the gross rent, and 30 percent of household income. Thus, the lower the relative incomes of program participants, the higher the expected subsidy costs. The distribution of voucher unit sizes is also expected to be related to subsidy costs. We might expect PHAs with more large units to have higher subsidy costs if the incomes of households that require large units do not rise in proportion to the payment standards for the larger units. Conversely, we might expect PHAs with more small units to have relatively lower subsidy costs. Participant Income To qualify for admission to the voucher program, households must generally have gross annual incomes at or below HUD’s very low-income (VLI) limit — 50 percent of the median income for the area in which they lease their first assisted unit. The VLI limit does not apply to households entering the voucher program who have been continuously assisted under other 1937 Act programs (typically public housing relocatees), or to households displaced from other HUD-assisted low-income housing by prepayments or owner opt-outs. These households may qualify for assistance with incomes up to the low-income limit — 80 percent of the area median. PHAs may also admit other low-income households who meet local criteria specified in their Administrative Plan. During any fiscal year, however, at least 75 percent of the families admitted to the voucher program from the waiting list must be extremely low income (ELI) — at or below 30 percent of the area median. Public housing is generally required to admit 40 percent ELI families,
31 Statistical significance at the 0.1 level means that given the sample sizes and distributions found, there is a
90 percent chance that the distributions (or means) are in fact different, and only a 10 percent chance that with the study’s sample size distribution found, the distributions (or the mean) are in fact the same.
38 Chapter 3 – Costs in the Voucher Program

but may lower that requirement by increasing the percentage of ELI families the PHA admits to the voucher program. The PHA may not transfer their ELI obligation from the voucher program to public housing, and may not target less than 75 percent of its vouchers without HUD approval. (HUD has approved, for example, waivers that exclude Welfare to Work admissions from the income targeting requirement.) These mandatory targeting provisions were included in the Quality Housing and Work Responsibility Act of 1998. Many PHAs report that increasing the number of ELI families admitted has increased their HAP costs, and several claim that other program costs have increased because ELI households require more services and/or have lower leasing success rates.32 Other PHAs — who served primarily ELI families prior to QHWRA, have not experienced any change. Once an applicant family has become a participating family (by leasing an assisted unit), the family remains eligible — regardless of income — until its income increases to the point that the computed HAP subsidy is $0. If the family completes the reexamination process, the HAP contract remains in effect for six months at $0 subsidy. During this time, if the family’s income changes, HAP payments may be resumed. However, the PHA must terminate the HAP contract — and the family’s participation — 180 days after the last HAP payment Participant incomes were measured from MTCS by comparing distribution of income relative to the local median income by household size in each of three income categories: income under 30 percent of median (ELI), between 30 and 50 percent of median (VLI), and over 50 percent of median.33 Exhibit 3.1 shows that, as expected, normalized subsidy costs are higher in PHAs with more low-income households, and lower in PHAs with higher income residents. Subsidies are significantly correlated with income distributions relative to the median. High cost PHAs have much higher concentrations of ELI families compared with low cost PHAs, and lower concentrations of families with incomes between 30 and 50 percent of median. For example, in 42 percent of the low cost PHAs, at least three quarters of families had extremely low incomes (below 30% of median), compared with 75 percent of high cost
32 In fact, a recent report prepared for HUD's Office of Policy Development and Research shows that ELI
households have higher success rates than households with income above 30 percent of the local median. See Finkel, Meryl and Larry Buron. 2001. Study on Section 8 Voucher Success Rates, Volume 1: Quantitative Study of Success Rates in Metropolitan Areas p. 3-8.
33 Very few PHAs had significant numbers of participants with incomes over 50 percent of the median, thus these numbers are not included in the exhibit.
Chapter 3 – Costs in the Voucher Program 39
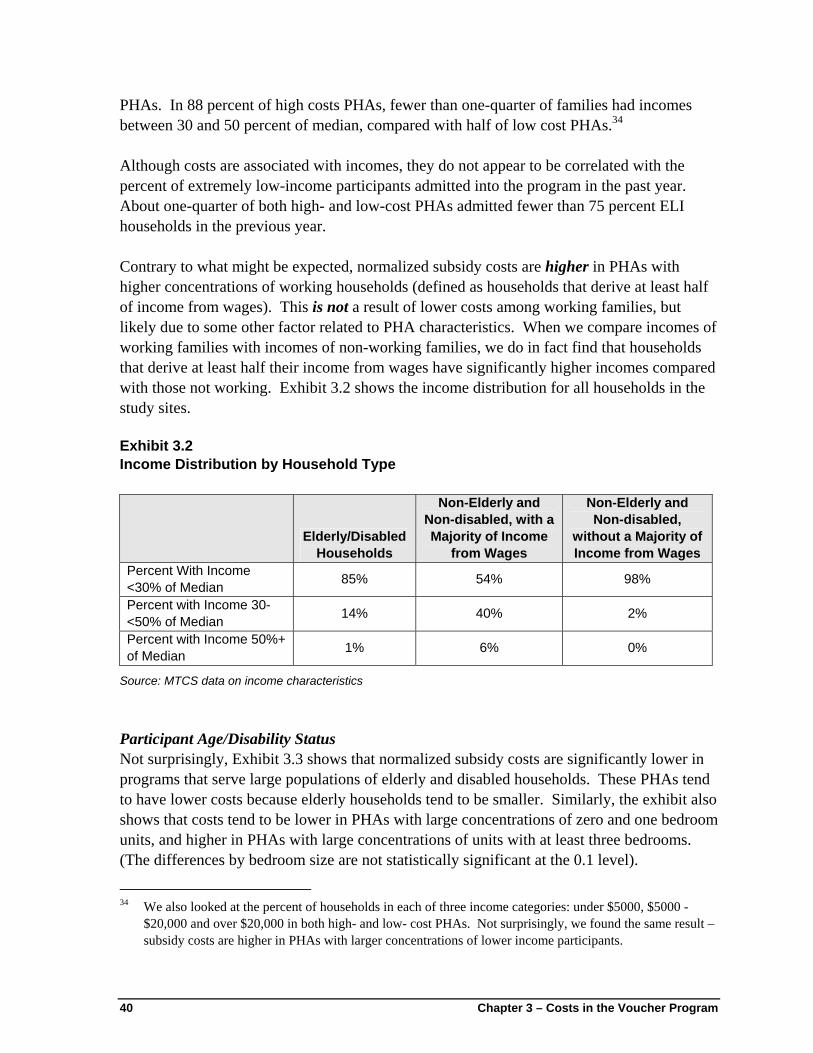
PHAs. In 88 percent of high costs PHAs, fewer than one-quarter of families had incomes between 30 and 50 percent of median, compared with half of low cost PHAs.34
Although costs are associated with incomes, they do not appear to be correlated with the percent of extremely low-income participants admitted into the program in the past year. About one-quarter of both high- and low-cost PHAs admitted fewer than 75 percent ELI households in the previous year. Contrary to what might be expected, normalized subsidy costs are higher in PHAs with higher concentrations of working households (defined as households that derive at least half of income from wages). This is not a result of lower costs among working families, but likely due to some other factor related to PHA characteristics. When we compare incomes of working families with incomes of non-working families, we do in fact find that households that derive at least half their income from wages have significantly higher incomes compared with those not working. Exhibit 3.2 shows the income distribution for all households in the study sites. Exhibit 3.2 Income Distribution by Household Type
Elderly/Disabled Households
Non-Elderly and Non-disabled, with a Majority of Income
from Wages
Non-Elderly and Non-disabled,
without a Majority of Income from Wages
Percent With Income <30% of Median 85% 54% 98%
Percent with Income 30-<50% of Median 14% 40% 2%
Percent with Income 50%+ of Median 1% 6% 0%
Source: MTCS data on income characteristics Participant Age/Disability Status Not surprisingly, Exhibit 3.3 shows that normalized subsidy costs are significantly lower in programs that serve large populations of elderly and disabled households. These PHAs tend to have lower costs because elderly households tend to be smaller. Similarly, the exhibit also shows that costs tend to be lower in PHAs with large concentrations of zero and one bedroom units, and higher in PHAs with large concentrations of units with at least three bedrooms. (The differences by bedroom size are not statistically significant at the 0.1 level).
34 We also looked at the percent of households in each of three income categories: under $5000, $5000 -
$20,000 and over $20,000 in both high- and low- cost PHAs. Not surprisingly, we found the same result – subsidy costs are higher in PHAs with larger concentrations of lower income participants.
40 Chapter 3 – Costs in the Voucher Program

3.2.3 Relationship Between PHA Policies and Normalized Subsidy Costs
This section looks at the relationship between several PHA policies and normalized subsidy costs. We first look at the policies relating to rents, and then at other PHA policies. Rent Policies It can be expected that several decisions regarding rents would affect subsidy costs.
• The level where the PHA sets its payment standard relative to the FMR
• Policies regarding exception payment standards
• The degree to which the PHA enforces rent reasonableness
• Minimum rents in the program
• Policies regarding billing for versus absorbing families that use vouchers from other jurisdictions to serve families that lease units in their jurisdiction.
Exhibit 3.4 compares normalized subsidy costs with the rent-related policies described above. Payment Standard as a Percent of Fair Market Rent As discussed in Chapter 2, PHAs are permitted to set their payment standards — the allowances for each unit size that will be used to determine a family’s HAP subsidy — within the “basic range”, 90 – 110% of the published (40th or 50th percentile) FMR. PHAs may adopt multiple payment standards within the basic range to reflect higher or lower rental costs in various market areas within their jurisdictions. Most PHAs in the study (67 percent) set their payment standard above the FMR, typically at 110 percent. Our analysis did not find any significant relationship between the payment standards/FMR ratio and normalized subsidy costs. This may be for several reasons. First, subsidy costs were generally measured as of the end of fiscal year 2000, and the PS/FMR ratios were estimated at the time of the site visits, which were typically conducted in early 2002. Second, local market rents are not always at the payment standard. Several PHAs noted that rents are generally below the FMR. For example, one PHA that set its payment standard at 110% of FMR, did so to facilitate its Section 8 homeownership program, but noted that program rents were consistent with local market rents, which were generally at or below the FMR.
Chapter 3 – Costs in the Voucher Program 41

42 C
hapter 3 –C
osts in the Voucher Program
Exhibit 3.3 Participant Ages and Disability Status in Study PHAs by Normalized Subsidy Costs
Low Cost PHAs High Cost PHAs All PHAs
Number
Percent of Low Cost
PHAs Number
Percent of High Cost
PHAs Number Percent of All PHAs
Average Cost in This Group of
PHAs Percent of Households with Elderly or Disabled Heads of Household **
< 40% of all Households 10 42% 19 90% 29 64% 1.88 40%+ of all Households 14 58% 2 10% 16 36% 1.63
Percent of Units that are 0/1 BR <25% 11 46% 16 67% 27 56% 1.9125%+ 13 54% 8 33% 21 44% 1.73
Percent of Units that are 3+ BRs <40% 13 54% 9 38% 22 46% 1.7940%+ 11 46% 15 63% 26 54% 1.86
Source: HUD data on subsidy costs. MTCS data on income characteristics
** Signifies that the difference in distributions is statistically significance at the 0.1 confidence level. Statistically significant differences in averages (at the 0.1 level) are bolded and italicized. All missing observations are excluded from the percentage calculations.

Ch
Exhibit 3.4 apter 3 – Costs in the Voucher Program
43
Relationship Between Rent Setting Policies in Study PHAs by Normalized Subsidy Costs
Low Cost PHAs High Cost PHAs All PHAs
Number
Percent of Low Cost
PHAs Number
Percent of High Cost
PHAs Number Percent of All PHAs
Average Cost in This Group of
PHAs PS/FMR
PS <= FMR 8 33% 8 33% 16 33% 1.86 PS > FMR 16 67% 16 67% 32 67% 1.82
Percent of Jurisdiction with Higher PS or Exception payment standards **
0% 20 87% 13 62% 33 75% 1.71>0% 3 13% 8 38% 11 25% 2.00
Percent of Households with Higher PS or Exception payment standards
0% 19 90% 11 61% 30 77% 1.75>0% 2 10% 7 39% 9 23% 1.97
Enforcement of Rent Reasonableness Not Vigorously 2 8% 3 12% 5 10% 1.90 Enforced According to Regs 13 54% 16 67% 29 60%
Vigorously Enforced 9 38% 5 21% 14 29% 1.69 Minimum Rent
$0 5 21% 5 21% 10 21% 1.81$25 11 46% 11 46% 22 46%$50 8 33% 8 33% 16 33%
1.93
Percent of Households that Port-out <2% of all Households 5 23% 9 43% 14 33% 1.93 2-5% of all Households 9 41% 7 33% 16 37%
6%+ of all Households 8 36% 5 24% 13 30% 1.67
** Signifies that the difference in distributions is statistically significance at the 0.1 confidence level. Statistically significant differences in averages (at the 0.1 level) are bolded and italicized. All missing observations are excluded from the percentage calculations.

About thirteen of the PHAs in the study were eligible for, and twelve were using the 50th percentile FMRs at the time of our site visits in early 2002. Using our measure of cost that normalizes the FY2000 costs by the 40th percentile FMR, half were categorized as low cost PHAs and half as high cost PHAs. If we used the 50th percentile FMR to normalize costs (which are still using the pre-increased FMR total subsidy costs), only one of the high cost PHAs would have shifted to low cost. Use of Exception Payment Standards A PHA is not required to have the same payment standards throughout its jurisdiction. For areas of the PHA’s jurisdiction that have higher housing costs, the PHA has the ability to set higher payment standards within the basic range of up to 110 percent of the FMR. However, if the PHA determines that families with vouchers are still unable to find affordable housing using payment standards within the basic range in all, or in specific parts of its jurisdiction, the PHA may request HUD field office for approval to use exception payment standards up to 120 percent of the FMR. If, after six months, the PHA believes that these exception payment standards are still too low, it may request HUD headquarters approval for exception payment standards exceeding 120 percent of the FMR. The use of exception payment standards increases the PHA’s HAP expense for most families who lease units in areas where the exception payment standards apply. (Some may, of course, lease units that are below the payment standard.) If the exception standards are limited to a few “opportunity” areas, the impact will be negligible. If, on the other hand, the exceptions apply to all, or most of, the PHA’s jurisdiction, the increase in the PHA’s HAP costs could be considerable. We looked at the use of exception payment standards both in terms of the percent of the jurisdiction they cover, and the percent of families in those areas. One quarter of the PHAs in the study had higher payment standards or exception payment standards in at least a portion of their jurisdiction. Similarly nearly one quarter had at least some recipients living in those areas. Use of exception payments standards is related to subsidy costs. Exception payment standards were used in nearly 40 percent of high cost PHAs, but in only about 10 percent of low cost PHAs. Rent Reasonableness As we discussed in Chapter 2, every time a unit is leased with voucher assistance or a rent increase for an assisted unit is approved, the housing agency is required to certify that the rent for the unit is reasonable based on the rents for comparable, unassisted units in the rental market. The PHAs in the study were sorted based on the degree of rigor of their rent reasonableness determinations. Most (60 percent) of the study PHAs conducted rent reasonableness according to the regulations. A few (10 percent) did not meet the required standards their rent reasonableness determinations. These PHAs typically have no rent
44 Chapter 3 – Costs in the Voucher Program

database, and rely on the expertise of their inspectors or on rental data collected informally. About one third (30 percent) exceeded the rent reasonableness standards. These PHAs typically are very vigorous about finding comparable units for comparison, and may use more than three comparables. We found that costs were lower in PHAs that are more rigorous in their rent reasonableness determination, and higher in PHAs with looser rent reasonableness tests. For example, 40 percent of low cost PHAs vigorously enforced rent reasonableness compared with 21 percent of high cost PHAs. Minimum rent PHAs are permitted to establish minimum rents up to $50 for voucher program participants. In programs where a minimum rent has been established, the family pays the higher of the Total Tenant Payment (TTP) based on their income or the minimum rent. Typically, PHAs that have minimum rents set them at $25 or $50. For families whose TTPs exceed these amounts, the imposition of a minimum rent has no effect. Because it directly reduces the amount of HAP that is paid for the lowest income families, a minimum rent policy should reduce the PHA’s overall HAP costs, but the extent of any such reduction would depend on the number of families at the lowest income levels. Most PHAs in the sample apply a minimum rent — about half (46 percent) have a minimum rent of $25, and about one third have a minimum rent of $50. We would expect that minimum rents would be tied to program subsidy costs, with programs with higher minimum rents having lower subsidy costs. The data do not support this hypothesis. In fact, the distribution of PHAs by minimum rent level is identical among high and low cost PHAs. Presumably, this is because the minimum rent of $25 or $50 would only affect families with annual adjusted incomes below $1,000 and $2,000 respectively, and very few families have such low incomes. Policy Regarding Portability When a voucher holder chooses to use his or her voucher to lease a unit in another jurisdiction (port-out), the receiving PHA can choose to either bill the sending PHA for subsidy costs associated with the recipient, or it can absorb the recipient. That is, it can issue one of its own vouchers and release the sending PHA’s voucher so that it can be issued to another family. If the receiving PHA has a higher payment standard than the sending PHA, and the receiving PHA decides to bill for the family, then the sending PHA incurs additional subsidy costs. Conversely, if the receiving PHA has a lower payment standard and bills, then the sending PHA incurs lower subsidy costs. In this way, portability rules allow the payment standard and rent policies of a receiving PHA to affect subsidy costs in the originating PHA. In about one-third of study PHAs, very few families port-out. In another one-third of the PHAs between 2 and 5 percent of all families port-out, and in the remaining third, over 6 percent of households port-out. Costs are similar in PHAs regardless of the extent of port-
Chapter 3 – Costs in the Voucher Program 45

outs, and the extent to which port-outs are billed for. This may be due to canceling effects of portability to higher and lower cost areas. Other Policies
Several additional PHA policies might affect program subsidy costs, including preferences, special programs, and standards for assigning bedroom sizes to various family compositions. Exhibit 3.5 shows how costs vary depending on these other policies. Preferences PHAs can have selection preferences for households with a variety of characteristics, such as households who are involuntarily displaced, victims of domestic violence, living in substandard housing, homeless, ELI, highly rent burdened, residents of the jurisdiction, veterans, working, and/or in school or training. Preferences allow the PHA to select households with these characteristics for the program ahead of households without preferences. We might expect that PHAs with certain preferences would have higher average subsidy costs. For example, we might expect that a preference for ELI would result in participants with lower incomes, which in turn would lead to higher subsidy costs. Similarly, we might expect PHAs with preferences for homeless families to have higher costs due to the lower incomes of these families. Exhibit 3.5 shows that among the more common preferences, the only correlation was between subsidy costs and an ELI preference. Only one of the six PHAs with an ELI preference had low normalized subsidy costs, while five had high costs. Special Programs We would expect that voucher program costs might be higher if the PHA operates one or more “special programs” with higher costs. For example, we might expect programs with large numbers of opt-out units to have higher costs. Participants in properties where the owner “opts-out” of a project-based Section 8 contract receive vouchers that can rely on “enhanced payment standards” if the gross market rent for the unit is above the prevailing payment standard. Programs with large numbers of Welfare to Work Vouchers might also have higher costs because of the larger concentrations of family households (versus elderly households) in these PHAs. Conversely, PHAs with large mainstream programs would likely have more (small) elderly or disabled families than they might otherwise have. In fact, special programs account for very small percentages of programs so their impacts on costs are minimal. For example, the family unification program accounted for fewer than 10 percent of the program in all but one study PHA. Welfare to Work vouchers, and elderly or disabled mainstream vouchers each accounted for under 10 percent of the program in all but 5 PHAs, and opt-outs were under 10 percent in all but 6 PHAs. The only relationship we found between special programs and normalized subsidy costs, was that PHAs with higher concentrations of opt-outs tended to have higher costs (though these differences are not statistically significant, perhaps due to the small number of cases with large concentrations of opt-out vouchers).
46 Chapter 3 – Costs in the Voucher Program

Ch
apter 3 – Costs in the Voucher Program
47
Exhibit 3.5 Relationship Between Other PHA Policies and Normalized Subsidy Costs
Low Cost PHAs High Cost PHAs All PHAs
Number
Percent of Low Cost
PHAs Number
Percent of High Cost
PHAs Number Percent of All PHAs
Average Cost in This Group of
PHAs Preferences
Working Preference 8 33% 7 29% 15 31% 1.88Homeless Preference 3 13% 3 13% 6 13% 1.97Preference for ELI 1 4% 5 21% 6 13% 2.04Preference for in school/training 5 21% 7 29% 12 25% 2.04
Occupancy Standard Average 10 48% 13 65% 23 56% 1.99One standard tighter than average 4 19% 5 25% 9 22%More than one standard tighter than average 7 33% 2 10% 9 22%
1.61
Special Programs At least 10% Opt-out Vouchers 1 5% 5 21% 6 14% 2.03
** Signifies that the difference in distributions is statistically significance at the 0.1 confidence level. Statistically significant differences in averages (at the 0.1 level) are bolded and italicized. All missing observations are excluded from the percentage calculations.

Standards for Assigning Bedroom Sizes Each PHA sets its subsidy standards in the administrative plan. The subsidy standard is the policy the PHA adopts regarding the bedroom-size voucher a family will receive, which in turn determines the maximum subsidy the PHA will pay for the family.35 If a PHA is more restrictive than average in the application of its subsidy standards, we would expect average HAP costs to be somewhat lower. Conversely, if the subsidy standard were less restrictive, we would expect average HAP costs to be higher. Typically, the administrative plan contains a general rule, and gives the PHA the ability to grant exceptions in certain situations — disability or medical need are typical. How these standards — which in many instances are virtually identical — are applied, however, varies from PHA to PHA. To get at these differences, Abt obtained a description of 39 PHAs’ policies and data on the voucher size that would be issued to 4 hypothetical families with various characteristics. Typical voucher sizes (modes) were established for each family. PHAs whose policies resulted in the issuance of typical voucher sizes were considered “typical”. PHAs whose policies resulted in the issuance of smaller voucher sizes than typical were considered “restrictive”. No PHAs had policies that resulted in the issuance of larger voucher sizes than typical for any of the scenarios. Many PHAs were applied more restrictive standards in one or more situations and applied typical standards in the remaining situations. Accordingly, we assigned an overall restrictiveness indicator based on the number of instances (1-4) in which the PHAs policies were more restrictive than average. Scenario 1: Mother and infant daughter:
Typical voucher size: 2 BR 35 PHAs More restrictive: 1 BR 6 PHAs Scenario 2: Mother, infant daughter, 4 year-old son
Typical voucher size: 3 BR 22 PHAs More restrictive: 2 BR 19 PHAs 35 The family may in fact choose a smaller or larger unit than the size on their voucher In either case the
lower payment standard applies. In other words, if the family chooses a smaller unit than their voucher, the (lower) payment standard for the actual unit size is used to calculate the subsidy rather than the payment standard for the voucher. If the family chooses a larger unit than their voucher, the (lower) payment standard for the voucher size is used to calculate the subsidy and not the payment standard for the unit chosen.
48 Chapter 3 – Costs in the Voucher Program

Scenario 3: Mother, 7 year-old daughter, 11 year-old son
Typical voucher size: 3 BR 37 PHAs More restrictive: 2 BR 4 PHAs Scenario 4: Mother, Grandmother, 7 year-old daughter, 11 year-old son
Typical voucher size: 4 BR 34 PHAs More restrictive: 3 BR 7 PHAs Over half (23 of 41) of the responding PHS applied the typical standards in all four of the scenarios presented above. Nine applied the typical standard in three of the scenarios, and applied a more strict standard in one of the scenarios. Nine PHAs applied stricter than typical standards in two or more scenarios. PHAs standards for assigning bedroom sizes are related to program costs. PHAs that apply more restrictive standards have lower costs compared with PHAs that always apply the typical standard. Forty-eight percent of low cost PHAs use the typical standard for all four scenarios, 19 percent apply stricter standards in one of the four scenarios, and 33 percent of low cost PHA apply stricter standards in at least two of the scenarios presented. In contrast, 65 percent of high cost PHAs use the typical standard for all four scenarios, and only 10 percent apply stricter standards in two or more of the scenarios presented. 3.3 Conclusions
Several themes emerged from the analysis of normalized subsidy costs. Program Operators Do Not Focus on Subsidy Costs
First, program operators generally do not think in terms of subsidy costs. If anything, they worry about administrative costs. In conversations with PHA staff, very few focused on subsidy costs, nor could they directly identify factors other than local rents that might affect their average subsidy costs. Thus, program operators may need to be educated in the importance of this aspect of program management for planning and budgeting purposes. Factors Found to be Associated With Normalized Subsidy Costs
In order to understand cost drivers, subsidy costs need to be normalized relative to the local FMR and local incomes. Once they are normalized, subsidy cost are no longer tied to market rent levels. As discussed above, although unadjusted subsidy costs are clearly higher in higher cost markets, once we control for differences in local rents, subsidy costs are no longer associated with market rents. Factors that affect normalized subsidy costs include:
Chapter 3 – Costs in the Voucher Program 49
• Participant incomes – PHAs with larger concentrations of extremely low income households have higher normalized subsidy costs.
• Age/disability status – PHAs with larger concentrations of elderly/disabled households have lower normalized subsidy costs.
• Use of exception payment standards – PHAs that use exception payment standards, or have rents typically above the payment standard have higher normalized subsidy costs.
• Enforcement of rent reasonableness – PHAs that are more rigorous about enforcement of rent reasonableness have lower normalized subsidy costs.
• Standards for assigning bedroom sizes – PHAs that apply stricter than average standards have lower normalized subsidy costs.
• Special programs – higher concentrations of opt-out vouchers tend to lead to higher normalized subsidy costs. However, program costs are not associated with other programs such as Welfare to Work or Mainstream programs.
50 Chapter 3 – Costs in the Voucher Program

Chapter Four Paired Sites: Comparisons of High and Low Utilization Voucher Programs in the Same Housing Markets
4.1 Background
In addition to studying samples of high- and low-cost sites and high- and low-utilization sites, another goal of the study was to look at utilization across pairs of PHAs that served either the same or similar housing markets and had at least a 10-point difference in unit utilization rates. By looking at pairs, we hoped to separate other factors affecting utilization from the market-related factors that were assumed to have (and, as discussed in Chapter 2, were found to have) an effect on utilization. This chapter describes the methodology and findings of the paired-study analysis. 4.1.1 How Were the Paired Sites Selected?
The paired voucher programs were selected for this study so that each pair operated in close to the same housing market conditions and yet had at least a 10-percentage point difference in the utilization rate for FY2000 (where utilization was defined based on the higher of budget and unit utilization). The idea was to hold housing market conditions constant when attempting to explain differences in the utilization rate achieved by two programs. When possible, the programs selected as pairs had overlapping jurisdictions in the same metropolitan area. The pairs were not required to be similar along other dimensions, such as the size of the program or whether its service area was a central city. However, the very process of selecting the sites for the study revealed that there was no systematic pattern in which, for example, larger programs were more likely to have low utilization rates than smaller programs or central city housing authorities more likely to have low utilization rates than suburban programs. As often is the case when study sites are selected purposively, pairs were selected from a wide range of locations in the continental United States. 4.1.2 How Were the Comparisons Made?
The basic source of information for the comparison of paired sites is the interviews conducted by site visitors. Because a lot of the information used in these comparisons is judgmental, very experienced staff were assigned to the site visits. The same site visitor
Chapter 4 – Paired Sites: Comparisons of High and Low Utilization Voucher Programs in the Same Housing Markets 51

conducted the interviews at both sites and completed the file reviews at each. In addition to completing the site visit protocol and writing a site report for each member of the pair, the site visitor wrote a report comparing the voucher programs at the two sites and explaining the reasons for differences in utilization. Core project staff reviewed all of this information (protocols, site reports, and comparisons) in the light of factors affecting utilization that had emerged across all of the sites in the study, both pairs and non-pairs. Core project staff then interviewed the site visitor to confirm impressions and to ask for further evaluations of the reasons for differences in utilization. In a few cases, the site visitors spoke again with key informants at the sites to fill in gaps in information. When information on the housing market faced by a voucher program remained ambiguous, core staff interviewed HUD’s local field economist in order to understand better the nature of the housing stock and recent trends in the availability of rental housing. 4.2 Findings
4.2.1 Findings from Pairs Operating in Favorable Housing Markets
The comparisons of pairs of voucher programs are presented in three groups. This first group operates in “favorable” housing markets, in which families with vouchers should have no difficulty finding rental housing, and, therefore, market factors should not have led to a low rate of utilization at either member of the pair. In favorable markets, there is an ample quantity of housing at a variety of rent levels, and the rental vacancy rate is moderate or high. Seven of the fourteen pairs were located in favorable housing markets. They include metropolitan areas in the Northeast and Midwest with many rental units, both older units that have always been rental housing and units that have been converted from homeownership to rental. Pairs with favorable housing markets also were found in southwestern cities and counties in which there are few regulatory or other limitations on housing production. Growth in population and housing demand has been matched by production of rental housing in these markets. In every case, project staff concluded that the programs compared were in very similar housing markets. When they were not in exactly the same market, market differences were subtle and slight and did not explain the difference in the utilization rate. Exhibit 4.1 summarizes our findings about pairs of PHAs operating voucher programs in favorable market conditions. Three of the seven had a new program manager, and two of these three had experienced a drop in utilization during the period when the program manager position was vacant. One of the new managers was reluctant to issue vouchers in a community in which the program had gained a poor reputation. A history of poor management, affecting the reputation of the program among owners of rental housing, was evident at two other programs at which the leadership had not changed.
Chapter 4 – Paired Sites: Comparisons of High and Low Utilization Voucher 52 Programs in the Same Housing Markets

Exhibit 4.1 Pairs in Favorable Market Conditions
Unit utilization Pair Program
size FY2000 FY2001 Site visit Nature of pair Reasons for difference
in utilization
1 high Large 93.2% 94.1% 104%
1 low Large 70.6% 83.1% 93%
Overlapping jurisdictions: city and city/suburbs
Low utilizer has history of poor management and failure to adjust staff for new allocations; high utilizer has dynamic management by private contractor
2 high Large 99.6% 99.6% 95.5%
2 low Large 92.1% 77.8% 83.8%
Mid size cities in same part of state
Low utilizer has history of staffing problems and inexperienced new director; high utilizer has strong focus on utilization and aggressive search assistance
3 high Very large
80.4% 94.1% 96.4%
3 low Large 70.1% 76.4% 77.4%
Overlapping jurisdictions: city and city/suburbs
Low utilizer had hiatus in program leadership; other reasons for difference are not apparent
4 high Very large
88.3% 84.6% 100%
4 low Medium 55.4% 55.4% 61.3%
Adjacent cities in same metro area
Low utilizer had hiatus in program leadership and reluctance to issue vouchers in face of community hostility; high utilizer, a troubled PHA, has recovery team focusing on utilization of large new allocation
5 high Large 99.2% 93% 99.4%
5 low Large 81.9% 82.8% 85.5%
City and county in same metro area; not overlapping
Low utilizer had history of poor management, including budget problems that impeded ability to issue vouchers; high utilizer realigned staff to lease up new units and provide search assistance
6 high Large 106.3% 104.2% 100.2%
6 low Large 94.7% 99.6% 100%
Identical jurisdictions: city and suburbs
Historically higher utilizer tracks well and provides aggressive search assistance; both programs benefit from excellent coordination of 3 PHAs with identical jurisdictions
7 high Large 97.9% 103.4% 103.1%
7 low Large 72.8% 78% 94.5%
City and county in same metro area; not overlapping
Low utilizer tracks utilization poorly, has limited jurisdiction from which families port out to high utilizer and other nearby cities; high utilizer has good tracking and search assistance
Note: FY2000 and FY2001 are year average unit utilization rates, while the site visit rate is the rate for the point in time the site visit took place.
In some cases, the program with the higher unit utilization rate appeared particularly well run overall or exhibited strength in a particular area that affects utilization, such as tracking the components of utilization or providing extra assistance to families searching for housing. Following are more detailed observations about each of the seven pairs of voucher programs operating in favorable market conditions.
Chapter 4 – Paired Sites: Comparisons of High and Low Utilization Voucher Programs in the Same Housing Markets 53

Pair #1 This pair of voucher programs operates in overlapping jurisdictions in the same metropolitan area. However, the higher utilization program in Pair #1 has considerably greater program reach, with a jurisdiction that includes 29 towns surrounding the city. For more than two decades, a private firm has managed this program. The difference in the unit utilization rate between the two PHAs has been dropping since FY2000, but remained a substantial 11 percentage points at the time of the site visit. At the higher utilization PHA, maintaining a high voucher utilization rate is given high priority by the private firm managing the program in order to maximize the administrative fee earned. Program staff are given a checklist entitled “Ways to Support Effective Program Utilization” that outlines areas they must focus on to maintain high utilization rates, including landlord outreach and improving the housing search skills and marketability of program clients. The voucher program director carefully monitors factors that contribute to high utilization rates, including turnover and success rates. The higher utilization program has a long-standing emphasis on mobility and permitted families to use vouchers throughout the metropolitan area even before housing voucher subsidies became “portable.” The program has cultivated relationships with owners of rental housing in many of the towns surrounding the central city, and families often are able to lease units because of these landlord contacts. During the period relevant to this study, the lower utilization PHA program also had a mobility program, funded by a special HUD program Regional Opportunity Counseling or ROC that provided housing search funds to PHAs in partnership with non-profit counseling agencies. Under ROC, the lower utilization PHA was permitted for the first time to administer the voucher program in the suburbs. However, the ROC program had limited success at this PHA, resulting in only 54 units leased outside the city during the five-year life of the program. A history of poor management at the lower utilization program lingers in the memories of the landlords interviewed for this study. Their perception of the lower utilization’s voucher program was lukewarm at best, and owners cited problems with HAP payments and program staff who are not knowledgeable or responsive. Given the choice, owners of rental housing prefer to rent to voucher holders from the higher utilization PHA. The two programs have responded very differently to the receipt of new units. Additional vouchers allocated to the lower utilization PHA in the last three years expanded the program from 350 to almost 2000 vouchers, and for two years the program director did not make adjustments to staff allocations or hire new staff to handle the additional workload. During the most recent year, the PHA started using a contractor to help with the application and lease-up process. Contractor staff now conduct eligibility interviews and briefings, issue the
Chapter 4 – Paired Sites: Comparisons of High and Low Utilization Voucher 54 Programs in the Same Housing Markets

vouchers, and provide limited search counseling. In contrast, the higher utilization program has had no problem leasing new allocations immediately. Pair #2 While not in the same or adjacent housing markets, the places served by Pair #2 both are mid-sized cities and are in the same part of the same state. The higher utilization PHA has a loose housing market at all levels, because the closing of a manufacturing plant, the city’s largest employer, has resulted in vacancies in both rental and homeownership housing. The lower utilization PHA, in contrast, has a more stable economy and a more balanced housing market. However, both programs operate in favorable housing markets, and housing market conditions do not explain the difference in utilization rates. Much of the housing stock of the higher utilization PHA’s jurisdiction would not immediately pass the program’s Housing Quality Standards, which is not the case at the lower utilization PHA. The lower utilization PHA has a range of neighborhoods and of rental housing at various levels of price and quality. This pair of voucher programs provides a striking contrast in overall management style and capacity and in the management of key program areas that affect utilization. Both housing authorities are subject to state law that requires them to hire residents of the jurisdiction. The higher utilization PHA’s program responds to this restriction by using great care to hire entry-level staff with good basic skills and promoting from within. In contrast, the lower utilization PHA has had a history of staffing problems in its voucher program and currently has a voucher program director whose prior experience was primarily in public housing. Staff at the higher utilization PHA have focused on utilization as an important goal. They work closely with the PHA’s budget office to determine the number of vouchers that need to be issued, and they aim for utilization above the 100 percent level at the beginning of the fiscal year in order to achieve full utilization over the course of the year. At the lower utilization program, by contrast, no one appeared to be familiar with the concept of full utilization, its calculation, and its components. While the lower utilization PHA received an allocation of Welfare to Work vouchers and the higher utilization PHA did not, the lower utilization program was at less than full utilization for a long time before receiving this new allocation. Furthermore, while focusing on leasing the Welfare to Work vouchers, program staff ignored the regular voucher program and slipped further behind in keeping those units leased. Finally, the space problems of a cramped office, located in a public housing development, limit the number of households from the waiting list that can be called in for interviews and briefings each month. The number of vouchers issued each month at the time of the site visit was clearly insufficient to reach full utilization by the end of the housing authority’s current fiscal year.
Chapter 4 – Paired Sites: Comparisons of High and Low Utilization Voucher Programs in the Same Housing Markets 55

The higher utilization program provides housing search counseling for families attempting to use vouchers, counseling for overcoming barriers such as credit problems, and relocation cash grants for security and utilities deposits and for assistance in moving. Search assistance at the lower utilization PHA is much more limited. Pair #3 The source of the difference between the utilization rates in the third pair of programs was difficult to tease out. There were few differences in management practices. However, the lower utilization PHA of pair #3 had experienced a hiatus in program leadership, and this probably accounts for the difference in utilization rates. The two housing authorities have overlapping jurisdictions: the lower utilization PHA operates both in a city and in the rest of the county in which the city is located, while the higher utilization PHA’s jurisdiction is the city only. The entire housing market for this metropolitan area is loose, both overall and in the affordable rent range. If anything, the program with the higher utilization rate has characteristics that might lead one to expect that their utilization would be the lower of the two. The voucher turnover rate is higher (20 percent vs. 12 percent); the payment standard used is lower (100 percent of FMR vs. 110 percent); a lower portion of the client population is white, non-Hispanic (13 percent vs. 30 percent), more stringent housing quality standards are used; and rent reasonableness is enforced more rigorously.36 Overall, both programs appeared reasonably well run to the site visitor. However, neither had a particularly aggressive approach for outreach to landlords, and neither program manager was doing a particularly good job of tracking the components of utilization. The higher utilization PHA’s rate was an unimpressive 80.4 percent in FY2000, but its point-in-time rate had increased to 96.4 percent at the time of the site visit. Neither program had received new allocations of new units during FY2002-2002.37 When queried about leasing goals for the end of FY2002, the program director in the higher utilization PHA reported that he intended to lease close to100 percent of allocated units, while the lower utilization PHA, at 77.4 percent at the time of the site visit, had targeted only 88 percent. The program director in the lower utilization PHA is a recent hire brought in from the higher utilization PHA to “fix” the lower utilization program. He realized that 88 percent was an unacceptably low level of performance, but believed that it was the highest possible realistic goal given the relatively short time until the end of the fiscal year and the
36 Note that the analysis presented in Chapter 2 found that most of these factors do not in fact have a
systematic affect on the level of unit utilization. 37 With the exception of 115 vouchers at the higher utilizing PHA to replace subsidies at an “opt out” project .
Chapter 4 – Paired Sites: Comparisons of High and Low Utilization Voucher 56 Programs in the Same Housing Markets
number of staff he had to work with. The site visitor believes the program will reach an acceptable utilization rate by FY2003. Pair #4 The PHAs in Pair #4 serve adjacent cities in the same metropolitan area. They are quite different physically and economically, but both have housing markets that should be favorable for the voucher program. If anything, the program with the higher utilization rate is in a jurisdiction with a somewhat tighter housing market. In the city served by the lower utilization program, there is considerable community hostility to the voucher program, but no shortage of rental units that could, in theory, be rented with a voucher. The higher utilization program has had to work hard to maintain high utilization because it received nearly 3,500 new vouchers over the past three years — almost doubling the size of the voucher program, which now numbers close to 7,500 units. By contrast, the other site in this pair has historically been reluctant to apply for new voucher units because of the negative attitudes about the program in the community and in the city government. This PHA currently has just over 800 vouchers and has not applied for voucher funding for at least a decade. Both housing authorities have a history of administrative problems. The higher utilization housing authority has been in receivership for the last four years because of prior mismanagement. The receiver has brought in competent professionals in many areas, especially in the voucher program — which is four times as large as the public housing program and the housing authority’s main breadwinner—that is, voucher administrative fees are much more important than public housing subsidies for covering staff costs. Staff were extremely knowledgeable about program requirements and had good automated data available to monitor program activities. The other PHA in this pair had no voucher program director for most of FY2001, when utilization was at 55 percent. The new program director at the lower utilization site discussed her long-term plans to improve utilization by attaching 110 project-based vouchers to an assisted living facility for senior citizens and by implementing a voucher homeownership program. Nevertheless, it appeared that this PHA has set low short-term goals for addressing under-utilization and will not become fully leased in FY2002. The program director appears be reluctant to make aggressive attempts to lease units under the regular tenant-based rental voucher program because of community hostility to the program. Pair #5 Pair #5 operates in the same part of a very large metropolitan area but without overlapping jurisdictions. The higher utilization PHA serves a central city, while the lower utilization PHA’s jurisdiction covers the balance of the county in which the city is located. The
Chapter 4 – Paired Sites: Comparisons of High and Low Utilization Voucher Programs in the Same Housing Markets 57
county’s housing market is slightly looser than that of the city, but both have rental vacancy rates in the 4-7 percent range and have ample supplies of units in a range of rent levels. The higher utilization (city) PHA has experienced huge program growth in the past three years. Its number of allocated units rose to nearly 4,800 during this period, a growth of almost 50 percent. The program’s utilization rate dropped from 99.2 percent to 93 percent between FY2000 and FY2001, but the PHA’s goal is to achieve 100 percent utilization, including these new units, by the end of FY2002, and the point-in-time utilization rate at the time of the site visit was 99.4 percent. To reach full utilization, the program has stepped up its voucher issuance rate from 100 per month to 150-225 per month, which appeared to the site visitor to be about the right number to reach full utilization. In support of this effort, the agency has created a “lease-up team” to track the lease-up process and to help families lease up through smaller briefings and more personalized search assistance. In contrast to the high utilization city program, the lower utilization county PHA’s program growth has been modest. The only new allocations of units to this PHA during FY2000-FY2002 were 200 vouchers for 3 separate preservation projects and 75 mainstream vouchers for people with disabilities. The immediate reason for the agency’s low utilization rate in fiscal years 2000 and 2001 was that the program had reached 100 percent budget utilization despite leasing less than 85 percent of allocated units. The program staff could not attempt to lease up their full allocation of vouchers until HUD gave them permission to use program reserves, which had happened just before the site visit. However, the PHA has had unit utilization in the 80 percent range for several years and reached 100 percent budget utilization only after several years during which program subsidy costs increased, so this does not explain the difference. Management of the lower utilization program appears to have been poor for some time, but most of the current staff is new and was unwilling or unable to provide details about past problems. Some of the creep in program costs that led to an imbalance between budget and unit utilization probably is attributable to poor management practices. The current pace of voucher issuance does not seem adequate to achieve full unit utilization by the end of FY2002. Pair #6 These two programs operate within exactly the same housing market: the city and its near suburbs. The higher utilization PHA is the city housing authority, while the lower utilization PHA is the housing authority for the county in which the city is located. However, the two housing authorities—along with a third program that also operates in this metropolitan area—have signed a Memorandum of Agreement under which each program can lease a unit anywhere in the three jurisdictions and administer the HAP contract directly, without using portability procedures.
Chapter 4 – Paired Sites: Comparisons of High and Low Utilization Voucher 58 Programs in the Same Housing Markets

Staff at both housing authorities describe the rental housing market in the metropolitan area as moderate. Other sources confirmed that the overall market is moderate to loose, and the affordable market is moderate Initally, these sites were picked because of a discrepancy in their utilization rates in FY2000: the city program had a very high utilization rate (106.3 percent) and the county program a lower—but not seriously low—rate (94.7 percent). However, by FY2001 and at the time of the site visit, both PHAs had very high utilization rates. The PHA with the historically higher utilization rate had received 1,500 new units during the preceding two years, which doubled the size of the program. During the same period, the low utilization PHA received no new units, perhaps because its utilization rate had dipped slightly below the level that would have made it eligible for new allocations. The high utilization PHA was able to sustain full utilization in a period of rapid program growth because of the program director’s aggressive emphasis on achieving high utilization. When he came to the program several years ago, unit utilization was at 69 percent and staff had long followed the practice of conducting one interview each day with a prospective voucher family. The program director proceeded to gather the information needed to analyze the program flow that would be needed to achieve full utilization. Utilization has been high ever since. It is the director’s intention to expand the program as much as possible, and to that end, he works with other agencies to gather up to date information on the housing needs of low-income renters and special population groups before each new HUD competition for an allocation of vouchers. The higher utilization PHA has adopted some practices aimed at achieving a high success rate for families seeking to use vouchers. The entire staff does paperwork in the morning and HQS inspections in the afternoon. This has them all out in the community, talking to current and prospective owners. Any staff member can take a phone call from a family or an owner and know enough about program operations as a whole to provide immediate assistance. This PHA provides a very atypical form of search assistance called the “buddy system.” When a family has an appointment with a landlord, a program staff member goes along to answer questions about the program and help the family member make a good impression. Finally, the program director believes that Welfare to Work and Mainstream vouchers were leased up quickly because the program had established close working relations with the welfare office and with agencies serving people with disabilities long before those special purpose vouchers were allocated. For example, welfare caseworkers had already been assigned responsibility for working with Welfare to Work voucher clients before the annual contributions contract was signed for the vouchers.
Chapter 4 – Paired Sites: Comparisons of High and Low Utilization Voucher Programs in the Same Housing Markets 59
The lower utilization PHA’s program is also well managed program and has earned the respect of local owners of rental housing and the families for whom they provide assistance. Although the PHA’s Executive Director did not explain why the program’s utilization rate was only 94.7 percent in FY2000, the average annual rate had increased to 99.6 percent in FY2001 and the program was 100 percent leased at the time of the site visit. The Executive director said that the housing authority had made an extensive effort to become fully leased so as not to risk losing any administrative funding. One of the factors that may have made it easy for the lower utilization PHA to increase its utilization quickly was the close coordination across the three voucher programs in this metropolitan area. In addition to agreeing that all three can sign HAP contracts anywhere in the metropolitan area, all three programs have agreed to use payment standards at 100 percent of the published FMR and they implement their new payment standards at the same time to avoid confusion among landlords and families. All three programs use the same rent reasonableness database, so that allowable rents also are consistent across the programs. Pair #7 The higher utilization PHA in Pair #7 serves a large central city of a metropolitan area. The jurisdiction of the lower utilization PHA includes only those portions of the surrounding county that are not in the central city or in other cities in the county that have their own housing authorities. Few units of rental housing were built in the lower utilization PHA’s jurisdiction during the 1990s, but rental construction has begun recently, and the market for rental housing is becoming looser. The high utilization PHA has a housing market that is favorable for families attempting to use vouchers, with a building boom of both sales and rental housing that has increased the availability of housing in all portions of the market. The higher utilization program has taken advantage of the new 50th percentile FMR available for the metropolitan area and has adjusted payment standards accordingly. The lower utilization program did not. Staff from the lower utilization PHA blamed their recent problems with utilization on the fact that, after receiving vouchers, families would find housing units outside the housing authority’s jurisdiction, in the central city and other nearby cities. The other housing authority would absorb the vouchers into its own program rather than billing lower utilization PHA for the subsidy costs. The Executive Director estimated that this had happened to one in four families successfully using a voucher. A new requirement that families who do not live in the PHA’s jurisdiction at the time of application must lease within the jurisdiction for one year has helped increase utilization. At the time of the site visit, only 18 percent of those leasing up using vouchers issued by this housing authority “ported-out” to another jurisdiction.
Chapter 4 – Paired Sites: Comparisons of High and Low Utilization Voucher 60 Programs in the Same Housing Markets

The fact that the new requirement has been effective in reducing “port-outs” suggests that families from other jurisdictions were applying for the lower utilization PHA program and coming to the top of the waiting list. Thus, the county’s need for vouchers may be relatively low compared with its program size and with greater need in the cities in that part of the state. However, differences in housing need and market conditions cannot entirely explain the difference in utilization rates between the two PHAs. The lower utilization PHA staff has done a poor job of tracking and understanding the factors that go into utilization and adjusting as needed the number of households called in for briefings. This may be why they discovered the effect port-outs were having on their utilization rate only after their utilization rate had plummeted. The rate was below 80 percent in FY2000 and 2001, and according to PHA staff had at one point been as low as 60 percent. Until recently, the housing authority made no attempt to issue additional vouchers to adjust either to the portability phenomenon or to other factors that affect utilization: e.g., the number of families invited to a briefing who come and are eligible to have vouchers issued, the success rate for families trying to use vouchers, and the program’s turnover rate. At the time of the site visit, such tracking had begun. The point-in-time rate was 94.5 percent at the time of the site visit, but was not clear that the calculations were good enough to lead to full utilization in FY2002. Staff at the lower utilization PHA pointed out that eligibility determinations for families who port-out and are absorbed by other voucher programs use administrative fee that is not offset by a fee earned for the units once they are leased. However, until recently the program manager was not sensitive to the overall huge loss of fee resulting from failure to reach full utilization. Like many housing authorities in this overall study, the staff at the lower utilization PHA did not think strategically about their administrative budget for the voucher program. Program staff at the higher utilization PHA, in contrast, track the factors that affect utilization, issuing each month a number of vouchers that reflects new vouchers received under ACC, current turnover, and the staff’s impressions of current portability and success rates. While such phenomena as the number of invitees who appear at the briefing and the success rate for those issued vouchers are not tracked systematically, vouchers are over-issued to an extent that was yielding a utilization rate over 100 percent. Another difference between the two programs that may help account for differences in utilization is the amount of search assistance provided to families attempting to use vouchers. The higher utilization PHA provides housing search counseling and counseling on housing search barriers such as credit repair to all families who want it, while the lower utilization PHA does not.
Chapter 4 – Paired Sites: Comparisons of High and Low Utilization Voucher Programs in the Same Housing Markets 61

4.2.2 Findings from Pairs operating in intermediate housing markets
The second group of pairs operates in “intermediate” or “typical” housing markets. In intermediate markets, there is a stock of rental housing at a variety of rent levels. However, rental vacancy rates in these markets were low during the period relevant to this study. We characterized five pairs (Pairs 8 through 12) as operating in intermediate, somewhat constrained, housing markets. The distinction between “favorable” and “intermediate” housing markets was not always clear-cut. We relied on a variety of sources of information: vacancy rates from the decennial census or from local rent surveys, assessments of the housing market by voucher program administrators and owners of rental housing, and opinions of the staff of local housing development agencies. In some cases, we sought the help of the HUD field economist in coming to a conclusion about the recent dynamics of the rental market. Four of the five intermediate housing markets are in southern metropolitan areas, and two are areas with substantial recent economic and population growth fueling competition for housing. Exhibit 4.2 summarizes our findings about pairs of PHAs operating voucher programs in intermediate market conditions. We saw that hiatus in program leadership was a key factor in the low utilization at some of the PHAs in favorable market conditions. Similarly, at two of these pairs with intermediate market conditions (Pairs 10 and 11), the PHA with the lower utilization rate had been without a voucher program director for an extended period. For another pair (#8), both voucher programs are reasonably well run overall, and both PHAs estimate that 75 percent of those issued vouchers succeed in leasing units. However, the PHA with the lower utilization rate makes three of the key mistakes that lead to utilization problems:
1) Failure to track the components of utilization; 2) Failure to realign staff to use large new allocations of units; and 3) Insufficient preparation for administering special programs that require PHAs to
collaborate with agencies that provide services other than housing. Pair #9 does not provide a good comparison between the two voucher programs, because one program operates in a city with a substantial amount of rental housing and the other in a rural setting with a limited supply of rental housing. However, special circumstances make both programs interesting for an analysis of factors that affect voucher utilization.
Chapter 4 – Paired Sites: Comparisons of High and Low Utilization Voucher 62 Programs in the Same Housing Markets

Exhibit 4.2 Pairs in Intermediate Market Conditions
Unit utilization Pair Program
size FY2000 FY2001 Site visit Nature of pair Reasons for difference
in utilization
8 high Large 98.5% 96.5% 100.6%
8 low Large 76.5% 63.6% 77.6%
Separate cities in large metro area
Low utilizer tracks utilization poorly, failed to realign staff for new units and to partner with other agencies for special purpose allocations
9 high Medium 86% 93.1% 96.7%
9 low Medium 75% 72.6% 78%
Not a good pair; city and rural portion of a different county
Low utilizer has limited rental market and also failed to request interim use of opt-out allocation; high utilizer has many families porting in with housing search already accomplished by relatives
10 high Small 108.1% 106.5% 96.9%
10 low Small 82.8% 82.9% 76.7%
Small cities 20 miles apart
Lower utilizer has rental competition from university, but also had hiatus in leadership following management problems
11 high Medium 101.8% 96.7% 99.7%
11 low Large 89.2% 90.6% 87%*
Adjacent cities in same metro area
Low utilizer had leadership hiatus and staff turnover; high utilizer has careful attention to program detail and staff stability
12 “high Large 80.3% 80.3% 119%
12 “low” Medium 83.8% 97.4% 103.5%
Identical jurisdictions: city and suburbs
Pair was chosen because of contrast in budget utilization; unit utilization was similar in 2000, as was program administration at site visit; lower utilizer in 2001 may have had budget constraint
Note: FY2000 and FY2001 are year average unit utilization rates, while the site visit rate is the rate for the point in time the site visit took place. *Rough estimate. See description of Pair #11 in text.
The city has a rental housing market favorable for the voucher program and, had it not been part of a pair, would have been grouped with other “favorable” markets for this analysis. The response to this favorable market has been an influx of voucher holders from a metropolitan area in a different state. The newcomers are Hispanic, as are the friends and relatives who are conducting the housing search process on their behalf. When housing vouchers were first made portable in the mid 1980s, it was believed that this might facilitate household mobility in response to economic opportunity. The voucher program may be playing that role for many of the households using vouchers to live in this community. A major factor in the low utilization rate for the other PHA in Pair #9 was an allocation of vouchers to replace a Section 8 project that had “opted out” of the assisted housing program. The opt out was delayed, but the voucher program manager did not request to use the vouchers on an interim basis, believing (probably mistakenly) that, if they were not needed to provide subsidies for households living in the Section 8 project, they would be taken back by
Chapter 4 – Paired Sites: Comparisons of High and Low Utilization Voucher Programs in the Same Housing Markets 63

HUD. For this small program, the failure to lease this relatively large allocation was a major reason for a utilization rate in the 70s. Pair #10 operates in two small cities with essentially similar housing markets. The PHA with the lower utilization rate is in a university town and, therefore, voucher holders face competition from students. On the other hand, as the more detailed description of that program will show, this housing market difference is a small factor compared with the administrative problems exhibited by the lower utilization program in this pair. Pair #12 was chosen because of a contrast in the budget rather than the unit utilization rate. The unit utilization rate in FY2000 and FY2001 was in fact higher at the PHA with the lower budget utilization rate. At the time of the site visit, we found unit utilization very high at both PHAs. The PHA that had previously had a budget constraint was working to catch up its unit utilization now that the constraint had been lifted. Thus, the apparent contrast between the PHAs in this pair probably is an artifact of the budgeting processes for the voucher program. During the period leading up to this study, HUD often was not permitting PHAs to use reserves and was not making immediate upward adjustments to budget authority in response to growth in program costs. The fact that we did not find a contrast between these two programs in the factors that led to low unit utilization at other PHAs is itself instructive. Without this contrast in administrative practices, there appears also not to be a contrast in these programs’ ability to lease up their allocations. Pair #8 The PHAs in Pair #8 operate in two large cities in the same metropolitan area. While the overall housing market in this metropolitan area is tight, as are some sub-markets in both of the cities, neither city has a difficult housing market for families attempting to use vouchers. Both cities have a large and diverse rental housing stock, and the payment standards are set at a level that should make that housing available to the program. The lower utilization PHA, with somewhat newer and more expensive rental housing, uses a payment standard at 110 percent of the published FMR, while the program with the higher utilization rate sets the payment standard at the FMR. The higher utilization PHA’s housing market may have a somewhat higher percentage of vacant rental units, but fewer of those units would pass the HQS than in the city in which the lower utilization PHA operates. Staffs at both programs believe the success rate for families issued vouchers is about 75 percent, and neither staff reports unusual difficulty recruiting landlords for the program. What, then accounts for the very different utilization rates for this pair of programs? A key distinction between the two programs is that the lower utilization PHA received substantial new allocations during the three years preceding the site visit of Welfare to Work vouchers and Mainstream vouchers for persons with disabilities, as well as Fair Share
Chapter 4 – Paired Sites: Comparisons of High and Low Utilization Voucher 64 Programs in the Same Housing Markets

vouchers. Altogether, the new allocations increased the PHA’s program size by 20 percent. The higher utilization PHA received no new increments of vouchers during this period. However, this leaves the question of why the lower utilization PHA was not able to absorb the increase in program size over a three-year period. The answer is that program staff did not change their practices to meet the new demands. As was the case for some other programs in the overall study, staff continued to call households in for briefings and to issue vouchers at the same rate as before. Faced with the extra time needed to coordinate special use vouchers with other agencies, the PHA did not step up intake of families from the waiting list for regular vouchers in order to keep the program at full utilization. In addition, it appears that HUD awarded both Welfare-to-Work vouchers and Mainstream vouchers to the lower utilization PHA without requiring a demonstration (other than by the formality of a joint application) that the PHA had formed a substantive partnership with another agency and was ready to begin administering a special purpose program. At the time of the site visit, the lower utilization PHA had just begun to step up the rate at which vouchers were issued, well over a year since receiving the most recent increment of vouchers. The program was still only 77.6 percent leased, and it was still not clear that they were issuing vouchers at a high enough rate to reach full utilization by the end of FY2002. This appears to reflect both an inability to make precise calculations of program flow and a lack of determination on the part of the housing authority leadership to make utilization a priority. Pair #9 The two voucher programs in Pair #9 have the least well-matched housing markets of any pair of programs we attempted to compare for this study. The higher utilization program serves a medium-sized city (just over 100,000 people). It has an ample supply of rental housing, including single-family units that have been converted from owner occupancy to rental. The rental market is moderate rather than tight. The lower utilization program operates in a nearby but different county in the same state and does not have—nor does the program director want—jurisdiction in the small to medium-sized cities in the county. There is little rental housing in the rural areas that constitute the lower utilization program’s service area. This is not a poor rural area; it is favored by retirees from urban areas because of its pleasant scenery and amenities. The voucher program has focused on providing assistance to senior citizens and people with disabilities, in some cases linking vouchers to housing that provides services to those groups. The low utilization rate at this PHA (78 percent at the time of the site visit) can be explained in part by an allocation of vouchers for an “opt-out” project. It turned out that these vouchers were not needed for the households they were intended to protect. The program director held these vouchers aside, believing that HUD would recapture them if they were not needed. In
Chapter 4 – Paired Sites: Comparisons of High and Low Utilization Voucher Programs in the Same Housing Markets 65

some sense, then, the failure of this program to lease up was associated with factors beyond its control. On the other hand, the program director did not try to persuade HUD to approve the use of these vouchers on an interim basis. Interim use would have ensured that these vouchers contributed to permanent growth in the size of the program, which—as replacement for project-based assisted housing—they are intended to do. The program director in this site is new and has no prior experience with the voucher program, but the site visitor believes that he is doing a reasonable job overall. The higher utilization program serves a population that is heavily made up of younger families of Hispanic origin who are either “porting in” with vouchers issued in a very large city in a different state in the same region or are coming to the top of the study PHA’s waiting list before moving to its jurisdiction. These families have an unusually high success rate for using vouchers. By the time the voucher is issued, their friends and relatives in the jurisdiction have already found them a place to rent that will pass program standards and has a willing landlord. There appears to be little discrimination either against Hispanics or against voucher families in the city. Program staff in the higher utilization PHA do not feel the need to reach out to owners or to help families with search assistance. Pair #10 This pair of programs serves small cities (with populations in the 20,000-50,000 range) about 20 miles apart. Together they make up a metropolitan area, so they have the same FMR. A notable difference is that the lower utilization PHA of Pair #10 is in a university town (the larger of the two places), and this has implications for the housing market and the voucher program. Most of our sources described a “student effect” — the extent to which a group of unrelated students with support from their parents can outbid families — especially low-income families — for available rental units. Some owners prefer students to families — especially families with vouchers. However, despite the differences between the two housing markets, it did not appear that market conditions were the primary source of differences between the utilization rates at the two housing authorities. Instead, there are sharp contrasts in program history and current management practices between the two PHAs. What almost certainly drove under-utilization at the lower utilization PHA was staffing problems that resulted in an extended period when no one was minding the store. First came not-too-aggressive issuance of vouchers by a program manager who was subsequently terminated. This was followed by the loss of program participants by attrition over the course of almost two years during which no vouchers were issued at all. Normal turnover in program households caused the utilization rate to drop. An additional factor, beyond households leaving the voucher program, was that the other PHA in this pair began absorbing
Chapter 4 – Paired Sites: Comparisons of High and Low Utilization Voucher 66 Programs in the Same Housing Markets
into its own program HAP contracts that had previously been administered by the lower utilization PHA.38 In contrast, what apparently drove high utilization and the higher utilizing PHA authority was a cost-conscious Executive Director who had definite ideas about what was required to operate the voucher program in a creditable fashion.39 He also had enough financial savvy to realize that many of these requirements were not affordable unless the housing authority maximized its administrative fee revenue from currently funded units and successfully competed for additional units. Pair #11 The programs in Pair #11 serve adjacent cities in the same metropolitan area. In the opinion of the site visitor, the two jurisdictions are an accident of history and probably could better be served by a single housing authority and voucher program. The metropolitan rental market has purely local (neighborhood) variations. There is a single job market, and households move freely between the two localities. The higher utilization program is managed in a way that focuses on containing program costs. Income verification is particularly rigorous (no one is believed when they claim to have zero income), and the “subsidy standard” — the basis for assigning a payment standard for a particular number of bedrooms depending on the household size and type — is tighter than is typical. (See Chapter 3 for more discussion of the subsidy standard.) Despite serving the same housing market, the PHA had established a lower payment standard than the other PHA in the pair. Its payment standard was 95 percent of FMR for most unit sizes, and 107 percent for 2-bedroom units, while the payment standard in the lower utilization PHA was 100 percent for most sizes, and 110 percent for two-bedroom units. Finally, the higher utilization PHA had a better developed system for determining rent reasonableness, based on comparability data for three housing types in three designated market areas from a rent survey (with photos) and the use of a formal point system. The low utilization PHA had an extremely informal system, in which rents were determined by clerks and inspectors based on their own knowledge of the rental market (or, in all likelihood, the payment standard).
38 These were voucher contracts with rents above the FMR in the jurisdiction of the higher utilization PHA.
Before the merger of the housing voucher and housing certificate programs into the Housing Choice Voucher Program, the higher utilization PHA had only certificates and could not sign HAP contracts for such units.
39 It was difficult for the site visitor to determine how the components of utilization were tracked at either PHA, in one case because no new vouchers had been issued recently, and in the other because files were poorly organized and a non-standard approach was used for the timing of the issuance of vouchers to households on the waiting list.
Chapter 4 – Paired Sites: Comparisons of High and Low Utilization Voucher Programs in the Same Housing Markets 67

Some of the higher utilization PHA’s policies that hold down subsidy costs might be expected to have a negative effect on the unit utilization rate, by making it more difficult for voucher families to offer a competitive rent to an owner of rental housing. Yet, this is the program with the higher utilization rate. The implication is that rigorous program administration overall may be associated with an ability to do analysis and manage staff to achieve high utilization. The lower utilization program is part of a housing authority that is recovering from troubled or near-troubled status for its public housing program and perhaps overall. The voucher program has experienced a 100 percent turnover in staff. The new program director first learned the program basics and, more recently, has begun to focus on improving the utilization rate. The site visitor was not able to obtain accurate numbers for numbers of ACC units and units leased, and it is possible that by the time of the site visit, the unit utilization rate had already begun to increase. Once utilization has recovered, the program manager intends to turn to rent reasonableness, as the next seriously flawed area of program administration. The program manager at the higher utilizing PHA is also relatively new in that job, but was promoted into that job upon the retirement of an individual who had directed the program for years and was responsible for its current level of administrative rigor. Pair #12 Pair #12 was originally chosen because of a contrast in the budget utilization rate rather than the unit utilization rate. In fact, the unit utilization rates were very similar in FY2000 (in the low 80s in both cases). The PHA with the lower budget utilization rate as of FY2000 increased its unit utilization to 97.4 percent in FY2001, and it stood at 103.5 percent at the time of the site visit. The PHA with the higher budget utilization rate until recently had been unable to issue additional vouchers because it had reached full budget utilization, and its unit utilization rate was 80.3 percent in both FY2000 and FY2001. HUD recently HUD gave the PHA approval to use budget reserves, and the unit utilization rate was 119 percent at the time of the site visit. The PHA with the historically higher budget and lower unit utilization rate serves the central city of a medium-sized metropolitan area. The other PHA serves the remainder of the county in which the city is located. However, the two programs in effect have chosen to have the same jurisdiction, as they allow their program participants to move anywhere within the two jurisdictions without exercising portability. We consider this an “intermediate” housing market because, while there are ample numbers of rental units at all levels of affordability, local informants believe the current housing market to be tight in this fast-growing metropolitan area.
Chapter 4 – Paired Sites: Comparisons of High and Low Utilization Voucher 68 Programs in the Same Housing Markets

While the two programs do not use identical payment standards, the payment standards are very close and, in both cases, reflect the somewhat challenging nature of the housing market. The payment standard for the PHA with that higher budget utilization PHA is 105 percent of the published (50th percentile) FMR. The payment standard in the PHA with lower budget utilization is a previously HUD-approved exception payment standard, which currently amounts to 108 percent of the published FMR. However, staff at the PHA with historically lower budget (and higher unit utilization in FY2001) appeared to have better data for rent reasonableness determinations, and this may help explain why it was able to stay within its allocated budget authority while the other program reached full budget utilization with less than full unit utilization.40 Evidence gathered during the site visit suggests that many aspects of voucher program administration are handled in a similar manner by both programs, and that both are moderately well run without being star performers. For example, neither program appeared to provide good service to owners of rental housing. Both program staffs reported that they allowed less than a week to elapse between the receipt of the Request for Tenancy Approval and the initial inspection. Our small file sample suggested, however, that actual times averaged at least a month at both programs. Furthermore, landlords given by the two program staffs as references were equivocal. They cited problems with late and inaccurate HAP checks and non responsiveness to owner concerns at both PHAs. Both PHAs reported that they monitored turnover monthly, used turnover figures to determine how many vouchers to issue, used group briefings for voucher holders, and provided unit and landlord lists and social service referrals to help families find units. Both program staffs claim to have relatively high leasing success rates (80 percent and 75 percent). In sum, this pair appears to demonstrate that programs that are not brilliantly managed can, nonetheless, achieve high unit utilization rates, once HUD removes the budget constraint on issuing additional vouchers. A contributing factor to both PHAs’ ability to become fully leased despite a somewhat constraining housing market may be that their completely overlapping jurisdictions and their very similar policies have protected them from the portability battles that have been associated with low utilization rates at some other programs in the study. 4.2.3 Paired sites in difficult housing markets
Finally, we have two pairs of voucher programs (Pairs 13 and 14) that clearly operate in difficult housing markets. Rental vacancy rates are very low, and the owner of virtually any rental-housing unit can easily find an unsubsidized tenant at a substantial rent. Rent levels are so high that FMRs, even with payment standards set at 110 percent of the FMR, severely 40 The two programs have not developed a substantially different clientele, and differences in household size
or income do not appear to account for the difference in budget utilization.
Chapter 4 – Paired Sites: Comparisons of High and Low Utilization Voucher Programs in the Same Housing Markets 69
limit the amount of housing potentially available to the voucher program. One pair operates in adjacent wealthy suburbs of a large metropolitan area, and the other pair is located in two nearby high cost and highly constrained housing markets. Both are in “coastal” areas, rather than in the middle of the United States. Exhibit 4.3 summarizes what we found in these two pairs of sites in difficult housing markets. One of the two pairs, #13, clearly operates in the same housing market, and the reason for the difference in unit utilization rates is clear-cut. The PHA with the lower utilization rate, faced with a difficult housing market and a low success rate for families trying to use vouchers, has been reluctant to step up the number of vouchers issued in order to reach full utilization. The program with the higher utilization rate “overissues” vouchers to a very substantial extent in order to reach full utilization despite a low success rate for individual families. There are some dissimilarities between the housing markets faced by the PHAs in Pair #14, which are in the same part of the state but do not have adjacent or overlapping jurisdictions. The program with the higher utilization rate serves the jurisdiction with a larger amount of rental housing, but the rental market is very tight and rental housing very expensive. That PHA takes the “standard” (but not always used) steps available to make a tenant-based rental program work in a very difficult: aggressively pursuing the highest payment standards HUD can be persuaded to approve and making the program as popular and painless as possible for owners of rental housing. The program with the lower utilization rate has a smaller amount of rental housing overall and pursues less “traditional” methods for using its allocation, including linkages to rental housing produced by supply subsidy programs, taking advantage of ordinances that require developers to include an “affordable component,” and permitting voucher holders whatever time it might take them to find units.
Chapter 4 – Paired Sites: Comparisons of High and Low Utilization Voucher 70 Programs in the Same Housing Markets

Exhibit 4.3 Pairs in Difficult Market Conditions
Unit utilization Pair Program
size FY2000 FY2001 Site visit Nature of pair Reasons for difference
in utilization
13 high Large 89.4% 95.6% 92.6%
13 low Large 77.3% 71.7% 85.5%
Adjacent suburban counties in major metro area
Low utilizer tracked utilization poorly and was reluctant to issue vouchers in face of low success rate; high utilizer issues large number of vouchers for each lease-up and focuses on earning fee
14 high Large 106% 104.1% 97.3%
14 low Large 89.3% 89% 94.2%
City and different county in same part of state
Low utilizer has limited rental housing stock, relies heavily on identification of specific developments; high utilizer reaches out to wide group of landlords and focuses on service to landlords
Note: FY2000 and FY2001 are year average unit utilization rates, while the site visit rate is the rate for the point in time the site visit took place.
Following are more detailed descriptions of the factors that affect utilization rates at the two pairs of programs that operate in difficult housing markets. Pair #13 The programs in Pair #13 serve wealthy suburban counties of a major metropolitan area and have very similar housing markets, with low vacancy rates and stiff competition for units at all rent levels. As the smaller county in both population and geographic area, the lower utilization PHA has a smaller overall stock of rental housing potentially available to voucher families. This is reflected in the fact that voucher holders from this PHA sometimes “port-out” to the higher utilization PHA’s jurisdiction, but voucher holders from the higher utilization PHA’s jurisdiction almost never rent units in the lower utilization PHA’s jurisdiction. Nonetheless, these adjacent counties essentially comprise a single housing market. They are in a 50th percentile FMR area and both are using payment standards at 110 percent of that FMR. The two-bedroom FMR for this metropolitan area is more than $1000. The difference in the unit utilization rate between these two PHAs reflects a different way of responding to a difficult market and a relatively low success rate for families attempting to use vouchers. Staff at the lower utilization PHA estimate their program’s success rate at about 40 percent, while staff at the higher utilization PHA believe only 30 percent of families issued vouchers succeed in leasing units. The program director at the lower utilization PHA, convinced that families will have difficulty finding housing units, said that in the past she issued fewer vouchers than needed to reach full utilization so as not to “flood the market.” In contrast, the program director at the higher utilization PHA considers a relatively low success rate as a fact of life and tries to issue as many vouchers as needed to make complete use of the program’s voucher allocation. Neither program staff does much to reach out to additional
Chapter 4 – Paired Sites: Comparisons of High and Low Utilization Voucher Programs in the Same Housing Markets 71

owners of rental housing to try to broaden the numbers of properties available to the program. There are some other differences in managerial style and practice between the two PHAs. In addition to being willing to anticipate a low success rate and issue as many vouchers as needed to reach full utilization, staff at the higher utilization PHA know how to make this calculation. They track the components of utilization and make adjustments each month to the number of vouchers issued. Staff at the lower utilization PHA make little attempt to determine the number of issuances that would be needed to reach full utilization. Both program directors have altered their behavior in response to recent HUD pressure for full utilization of voucher allocations. The higher utilization PHA was already focused on the unit utilization rate, in part because of a desire to earn the full administrative fee, some of which supports public housing operations at the same housing authority. The program further increased its emphasis on full utilization, because the housing authority’s leaders want to be eligible to apply for additional units in order to earn yet more administrative fee income, and indeed they met HUD’s standard for having a rate over 95 percent in FY2001. While not focused on maximizing fee income and less interested in additional units, the lower utilization PHA program director is concerned about the effect of a low utilization rate on her program’s SEMAP score. By the time of the site visit, her program’s point-in-time utilization rate had risen to 85.5 percent. Pair #14 The higher utilization program in Pair #14 is administered by a city housing authority that operates in the more urbanized half of a county. The lower utilization program is administered by a countywide housing authority in the same part of the state, but not the same county. The housing markets differ in that the county served by the lower utilization PHA, while not rural, has no heavily urbanized areas and very little rental housing overall, while the area served by the higher utilization PHA has a fair amount of rental housing. On the other hand, both are very high cost areas and have extremely low rental vacancy rates. Both programs are operating in housing markets in which virtually any rental unit could easily be rented to a market-rate tenant at a substantial rent. While originally chosen for comparison because their unit utilization rates differed, with the lower utilization PHA rate at 89.3 percent and the higher utilization PHA rate at 104.1 percent, by the time of the site visit the gap between utilization rates had narrowed substantially, to 94.2 percent vs. 97.3 percent. The most interesting thing about this pair of voucher programs is that both programs have found ways of meeting the challenges of a difficult housing market and achieving relatively high unit utilization rates. They have done so in ways that are somewhat similar but also have some differences.
Chapter 4 – Paired Sites: Comparisons of High and Low Utilization Voucher 72 Programs in the Same Housing Markets
Both programs serve an elderly clientele to a greater extent than a typical voucher program. Twenty-five percent of the lower utilization PHA’s program participants are elderly, as are 36 percent of the higher utilization PHA’s. Both programs have followed policies that take advantage of the greater likelihood that the elderly will already live in good quality housing units and will want to lease in place. HUD recently told the higher utilization PHA to stop using an explicit preference for in-place leasers, as this is a clear violation of program rules. The lower utilization PHA achieves the same objective in more subtle way, by preferring families who show that they are ready to present a Request for Tenancy Approval. Another unusual (and perhaps related) program practice is that the lower utilization program authority in effect has no time limit for a household’s attempt to use its voucher. The program director at the higher utilization PHA places a great emphasis on landlord relations. Staff is active in the local property owners’ association and attempts to inspect units within 24 hours of a request for tenancy approval. The program offers owners direct deposit of rent payments. The lower utilization program has placed less focus on building relationships with owners of rental property across the housing market and, instead, has developed access for voucher holders to units developed very recently under the Low Income Housing Tax Credit. The lower utilization PHA program director had just begun (not in time to affect the current utilization rate) a strategy that will combine project-based vouchers with city CDBG funds. Both program staffs are very conscious of how many vouchers they need to issue in order to reach full utilization and base their calculations on spreadsheets that analyze the components of this calculation. The success rates for families issued vouchers are difficult to compare across the two programs. The reported historical success rate of 80 percent at the higher utilization PHA was heavily influenced by the preference for households that would lease in place. The reported success rate of 11 percent at the lower utilization PHA may result from the practice of considering all outstanding vouchers, however long ago they were issued, as “live”—i.e., they all go into the denominator of the success rate. The higher utilization PHA has received approval for payment standards at 146 percent of the published FMR. The justification for this unusually high exception rent was that the county-wide rents that are used to estimate FMRs reflect rents in the northern part of the county that are in a completely different housing market. A factor motivating the request was the program’s receipt of almost 400 incremental units in FY2001 and concerns about the ability to lease them. The lower utilization program does not appear to have a similar case for “submarket” FMRs, since the program operates across the county. Nonetheless, the housing authority intends to request approval for payment standards above the current level, which is 110 percent of the FMR. The lower utilization PHA received 100 incremental units in FY2000. Most of these units have been leased, but the housing authority does not intend to ask for more.
Chapter 4 – Paired Sites: Comparisons of High and Low Utilization Voucher Programs in the Same Housing Markets 73

4.3 Conclusions
Across these 14 pairs of voucher programs, some common themes emerge to explain why housing authorities in the same or very similar housing markets have now, or have had in the recent past, very different capacity to use their full allocation of voucher units. The most clear-cut finding is that a hiatus in voucher program leadership and staffing is very damaging to a program’s ability to use its allocation of vouchers. Why do such gaps in program staffing occur? The voucher program may be relatively vulnerable, compared with other programs serving low-income populations.
• The voucher program is not an “entitlement” for any pre-defined set of clients, and families on the waiting list do not have a right to be served. This removes what would otherwise be a pressure to keep the program operating in response to an “automatic” inflow of clients. It would be interesting to find out how common long vacancies in key staff positions are for agencies administering food stamps or welfare programs and whether this has changed in recent years. (The comparison would be complicated by the fact that other programs providing benefits to low-income households typically are administered on the state level, where staffing may be more inherently stable. State agencies sometimes administer voucher programs, but this study of voucher utilization did not include state-level programs.)
• Because it provides assistance with rent payments and not physical units, the voucher program is relatively invisible. PHA Boards Directors may feel it less imperative to fill a leadership position in the voucher program compared with a public housing position, because a decline in the use of the program will be less immediately apparent for the voucher program.
In addition to the obvious (but troubling) finding that failure to provide continuity of staffing, and especially leadership, often is behind low voucher utilization, several other themes emerged from the analysis of voucher programs paired by housing market condition.
• Analyzing Utilization. Program administrators with higher rates of utilization have better ability to do the data analysis and calculations needed to determine program flow and allocation of staff to achieve full utilization, or at least they have the ability to make reasonable judgments about how to adjust the number of vouchers to issue each month.
• Service to Families and Owners. In some cases, the program with the higher rate of utilization provided more housing search assistance, concentrated more heavily on outreach to landlords, or provided better service to owners of rental housing.
Chapter 4 – Paired Sites: Comparisons of High and Low Utilization Voucher 74 Programs in the Same Housing Markets

• Strategic Program Administration. Programs with higher rates of utilization typically are administered strategically, with an eye both to serving additional clients and to maximizing administrative income for the program.
• Overlapping Service Areas. Coordination of programs with overlapping or nearby service areas can be important for achieving full utilization.
• Difficult Markets. While market conditions affect utilization, it is possible to achieve high rates of utilization even in the most difficult rental housing markets.
4.3.1 Analyzing Utilization
The program with the higher utilization rate almost always did a better job of figuring out how many families to call in for briefings and how many vouchers to issue. Sometimes the contrast was between “scientific” analyses based on good estimates of turnover, success rates, and “yields” of various stages of utilization. Sometimes the higher utilization housing authority was guided by history and ability to make judgments, and the key was that the program director was willing to adjust issuance to new circumstances (new units, shifts in portability patterns, changes in turnover). For example, the staff at the higher utilization PHA in Pair #2 successfully bases the decisions on how many vouchers to issue each month on past program experience and “feel” for how changes in turnover and other factors may affect the utilization rate. This appears to work well for a relatively small program operating in a favorable housing market. However, lack of good data and analysis may be dangerous for a new program director or when program size or other circumstances (such as patterns of portability) change rapidly. Capacity to analyze utilization is related to continuity of staffing. A number of programs with relatively low unit utilization rates compared to their pair had new program directors who were struggling to learn how to achieve full utilization. The higher utilization PHA at Pair #11 had a new director, but he was promoted from within and took over upon the retirement of a legendary (and colorful) director who had kept the program at full utilization. The lower utilization PHA in Pair #2, in contrast, has a new director who came from a different city, has no prior experience with the voucher program, and evidently took over a program already in trouble. The lower utilization PHAs in Pairs #4, #5, and #10 all suffered from a period in which there was no voucher program director at all. The lower utilization PHA in Pair #3 also has a relatively new program director, and the site visitor believes this helps explain why the number of issuances is still too low, despite a new emphasis on achieving full utilization. The director does not have the required prior knowledge of patterns in the program that (given that the program is not growing) might substitute for “scientific” calculations of the number of vouchers that must be issued each month.
Chapter 4 – Paired Sites: Comparisons of High and Low Utilization Voucher Programs in the Same Housing Markets 75

4.3.2 Service to Families and Owners
It often happened that the higher utilization program of a pair provided more search assistance to families seeking to use vouchers, placed more effort on outreach to owners of rental housing, or provided better service to owners. Better service to owners was manifested in faster inspections, more timely HAP payments, or better response to problems and complaints. For example, the higher utilization PHA in Pair #1 has a longstanding program of landlord outreach and housing search assistance, whereas the lower utilization PHA in the pair was unable to take advantage of a ROC program grant that should have enabled leasing of units in the same suburban towns as the higher utilization PHA. The program’s poor reputation for service to landlords appears to have been an important limitation. The higher utilization PHA in Pair #2 provides search assistance and cash assistance to help voucher holders find and rent housing units, while the lower utilization PHA provides only lists of rental property owners (i.e., the minimum required by program regulations). The higher utilization PHA in Pair #6 has program staff accompany a family to the interview with a prospective landlord, while the lower utilization PHA (with an historically lower utilization rate and no current program growth) follows the program norm for providing only lists of landlords or units. 4.3.3 Strategic Program Administration
Whether the voucher program is managed strategically often is a good way of summarizing differences in utilization rates across these pairs of sites. The program director with the higher utilization rate thought of the program in expansion mode. He or she had applied for and received new units during the past one to three years, while the PHA with the lower utilization rate had not. In some cases, this may have been because the PHA did not meet HUD’s standard for at least a 95 percent utilization rate, but it usually was apparent that the program director did not want new units or that the low rate of growth of the program preceded HUD’s policy limiting eligibility for new units to those with high utilization rates. For an extreme example, the higher utilization PHA in Pair #4 had a program that almost doubled in size in a very short time, while the PHA with the lower had applied for no new units in a decade. A similar contrast exists between huge program growth at the higher utilization PHA in Pair #5 and very modest growth at the program with the lower unit utilization rate in the pair. The lower utilization program in Pair #9, while not a good comparison with its higher utilization pair, is another program with both relatively low utilization and a program director who does not want a bigger program. Furthermore, staff at the program with the lower utilization rate often viewed their program statically in ways other than not applying for new units. The program continued to operate based on old practices after receiving new units or when faced with a declining utilization
Chapter 4 – Paired Sites: Comparisons of High and Low Utilization Voucher 76 Programs in the Same Housing Markets
rate. The program director hesitated to hire staff or realign staff and did not think about administrative funds strategically. Strategic managers understand how to use their new units, realigning staff and adopting new practices, while non-entrepreneurial managers continue business as usual. The higher utilization PHA in Pair #1, with a long-standing focus on how to lease up, easily absorbed new units. It took staff at the lower utilization program two years to figure out that they had to do something different. The lower utilization PHA in Pair #8, a program that recently had received substantial allocations of both regular and special purpose vouchers, had trouble using the special purpose vouchers because program staff had not set up in advance the necessary relationships with other agencies. Finally, strategic program managers view their administrative budgets dynamically and do not hesitate to hire staff and make other administrative/logistical adjustments needed to achieve full lease up and earn the administrative fee that will pay for the additional staff and improvements. The program director in the higher utilization PHA in Pair #10 operated in this mode, while the lower utilization had no director at all in the period in which the utilization rate fell. Maximizing administrative fee presumably is an important motivator for the private company that manages the higher utilization PHA in Pair #1. Other directors of programs with high unit utilization rates (higher utilization PHAs in Pairs #6, #10, and #13) talked explicitly during the site visit interviews about managing their programs to earn as much fee as possible. The importance of strategic program management for fully utilizing voucher allocations suggests that housing authorities need a different type of training for how to administer a voucher program. In addition to training for how to adhere to regulations and for how to achieve high scores on individual SEMAP performance measures, voucher program directors should receive training on how manage a program strategically. 4.3.4 Overlapping Jurisdictions
While this was not intended to be a study of how housing authorities handle overlapping service areas, issues related to the coordination of programs that operate in the same broad housing market (though not always the same jurisdiction) came up repeatedly. Voucher program staff with low utilization often attributed their program’s problems to competition from other housing authorities. Conversely, for some sites at which it turned out that both members had high utilization rates or that the lower utilizing program easily achieved full utilization in a short time, the pair has managed overlapping service areas in a way that minimizes program disruptions and threats to full utilization. In some pairs of sites, the program with the low utilization rate often “suffered” from competition with another program that insisted on absorbing “port-ins” of vouchers issued by the PHA with the lower utilization rate to housing units in the jurisdiction with the higher
Chapter 4 – Paired Sites: Comparisons of High and Low Utilization Voucher Programs in the Same Housing Markets 77
utilization rate. Program rules permit the “receiving” PHA to make the family who enters its jurisdiction part of its own program. In other cases, the PHA with the higher utilization rate was believed to be competing for owners by setting payment standards higher. Sometimes the program with the higher utilization rate provided better service to owners by making more timely HAP payments, inspecting units sooner, or handling landlord complaints in a superior way. Some interviewed landlords said explicitly that they would prefer to rent from the program with the higher utilization rate for one of these reasons. A program that shares jurisdiction with another might compete for owners of rental housing through less strict enforcement of Housing Quality Standards or rent reasonableness. Not surprisingly, this was not mentioned in the landlord interviews as a reason for preferring one program over another. However, information from the other people interviewed during the site interviews and from the site visitors’ observations and file reviews did not suggest that programs with higher utilization rates were competing for voucher lease-ups in this way. It is striking that two pairs for which both programs had high unit utilization rates by the time of the site visit (Pairs 6 and 12) had coordinated their programs so as to broaden effective program jurisdictions. Pair #6 is part of a three-program “consortium” that coordinates payment standards and permits a family from any of the three programs to sign a lease anywhere in the metropolitan area. Pair #12 also has a shared jurisdiction and similar payment standards, and the programs in this pair are administered in similar ways overall. 4.3.5 Difficult Markets
The paired sites were not chosen to concentrate on difficult markets, and only two of the 14 pairs were found to be in such housing markets. One of these pairs has a very strong contrast between utilization rates: Pair #13. The higher utilization PHA copes with a difficult market by doing what is necessary to use as many vouchers as possible and earn as much administrative fee as possible. The program issues many vouchers knowing success rate will be low. The lower utilization program director has been much more timid in issuing vouchers. Ironically, the leadership of the higher utilization housing authority wants to maximize the voucher administrative fee because some of it (a fairly modest amount in this case) is transferred to public housing. This is consistent with the original design of the voucher fee system, which was supposed to provide an incentive for both lease-up and efficient use of administrative funds. However, a this incentive seems less effective in motivating housing authorities across the other sites in the study than in the case of this PHA. The higher utilization PHA in Pair #13 also is more sensitive to relations with owners of rental housing than its lower utilization pair-mate. For example, staff have implemented
Chapter 4 – Paired Sites: Comparisons of High and Low Utilization Voucher 78 Programs in the Same Housing Markets
policies intended to help landlords avoid problem tenants and to solve problems with lease compliance, as this is a program that has had problems with community relations in the past. On the other hand, neither member of Pair #13 makes special efforts to assist families with their search for housing. Pair #14 includes one PHA that achieves a very high utilization rate despite operating in a housing market that is extraordinarily difficult for the voucher program. The other program has a relatively high utilization rate (94.2 percent at the time of the site visit) despite operating in a housing market that is in some ways even more difficult. The two programs go about it in different ways. The higher utilization program has an extensive focus on outreach to prospective owners in the rental housing market overall and has persuaded HUD to approve very high payment standards relative to the published FMR. The lower utilization program, operating in a service area with a much smaller stock of potentially available rental housing, has concentrated on linking vouchers to housing production programs such as the Low Income Housing Tax Credit and on taking advantage of local laws that require developers to offer a small fraction of new rental units to low income renters.
Chapter 4 – Paired Sites: Comparisons of High and Low Utilization Voucher Programs in the Same Housing Markets 79

Appendix A How the Voucher Program Works
Appendix A – How the Voucher Program Works A-81
Appendix A How the Voucher Program Works
For readers unfamiliar with the operation of the Housing Choice Voucher program, the following is an attempt to trace the sequence of activities that typically occur in a tenant-based voucher program and to define basic program concepts. How individual PHAs handle each of these activities will be discussed in greater detail later on in this report. Funding Increments When funding is available to support new tenant-based vouchers, HUD publishes a Notice of Funds Available (NOFA) in the Federal Register telling PHAs how and when to apply and what criteria will be used to select PHAs to receive funding. The funds received through this process at any one time are referred to as a funding increment. These funds are placed under an Annual Contributions Contract (ACC) between HUD and the PHA. The PHA is required to use the funds to support a certain number of assisted units, in accordance with HUD regulations, for the term of the contract – generally one year. At the end of the year, and each successive year, the funding for each increment is generally renewed by HUD without the PHA having to re-compete. Administrative Plan While HUD regulations dictate for the most part how the PHA’s voucher funds will be administered, there are a number of areas in which the PHA must establish local policies for the voucher program. These include such policies as the use – or not – of participant selection preferences, the standards used by the PHA to determine the voucher unit sizes that families will receive, the amount of time that families will have to search for suitable housing before their voucher expires, and the minimum rent, if any, that families will be required to pay. The Administrative Plan must be approved by the PHA’s Board, or other governing body, initially and whenever changes are made. Waiting List Families who wish to participate in a PHA’s tenant-based voucher program make application to the PHA and are generally placed on the PHA’s waiting list in accordance with the date and time of their application and any participant selection criteria adopted by the PHA. Some PHAs have adopted a lottery system in which families apply over a period of time and are then selected by lottery to receive a voucher. PHAs may keep their waiting lists open at all times, or may close the list when they have all the applicants they expect to serve in the next year and re-open it when additional applicants are needed. PHAs with long waiting lists generally purge the list periodically by sending applicants a request for confirmation of their continued interest in the voucher program and dropping them from the list if they do not reply. Income Targeting Families who satisfy the PHA’s selection requirements and whose incomes are below 50 percent of the area median are eligible to receive tenant-based
A-82 Appendix A – How the Voucher Program Works

vouchers. In any fiscal year, however, the PHA is required by regulation to ensure that no less than 75 percent of the families admitted are Extremely Low Income – at or below 30 percent of the median income for their area. This is a relatively recent requirement, which was established as a result of QHWRA (the Quality Housing and Work Responsibility Act of 1998), and one which, for some PHAs, has made a significant change in the incomes of families admitted to the program. Once a family is admitted, however, they can remain in the program until their income increases to the point that their Housing Assistance (HAP) payment is $0. Formal Application Most PHAs place applicants on the waiting list based solely on the information they provide, without verification of the information by third parties. Before a family receives a voucher, however, the PHA must verify all of the information provided by the family regarding their income, allowable deductions, preferences, and any other information required by the PHA in order to determine whether the family is eligible to receive voucher assistance. The process of interviewing the applicant, taking all pertinent information and securing third-party verification is generally referred to as the formal application process. Participant Briefing Once the PHA has determined that the family is eligible, HUD requires the PHA to give the family an oral briefing, explaining how the program works and what the family must do to find an eligible unit and begin receiving voucher assistance. Program regulations also require that certain documents be given to the family at this time in what is referred to as the briefing packet. Payment Standard The payment standard is the maximum subsidy that a PHA can pay for a family, based on the size of the unit the family will occupy. Payment standards are set by the PHA at levels between 90 percent and 110 percent of the HUD-published Fair Market Rent (FMR) for the metropolitan or other area, based on the PHA’s knowledge of the local rental market. When a participating family leases a unit, the amount of the subsidy is reduced by amounts paid by the family. Subsidy Standard The subsidy standard is the formula used by a PHA to determine the number of bedrooms on the family’s voucher, and the appropriate payment standard for the family. The family may, within certain guidelines, lease a unit that is larger or smaller than the unit size on the voucher, but any additional costs will be paid by the family. Tenant Rent Families participating in the voucher program make monthly payments based on their income. The tenant rent is calculated based on the gross income of all members of the household, adjusted to reflect the presence of elderly or disabled persons or dependent children in the household, the unreimbursed medical expenses of elderly or disabled family members, and the family’s expenses for dependent care required to allow family members to work. Most families pay 30 percent of their adjusted monthly income toward the cost of rent
Appendix A – How the Voucher Program Works A-83

and utilities, plus any amounts by which the rent and utility costs exceed the applicable payment standard. The family pays its portion of the rent directly to the landlord, and the balance is paid by the PHA. If the family pays for one or more utilities, a utility allowance based on the anticipated utility expense is deducted from the amount that the family pays the landlord. Housing Search In the tenant-based voucher program, families have the primary responsibility for finding suitable rental units. PHAs provide varying degrees of assistance to families searching for housing, from providing listings of owners who have indicated an interest in participating in the program and contact people at neighboring PHAs to providing credit counseling, teaching families how to present themselves to owners is a good light, checking in on the families’ progress, accompanying families to their meetings with prospective owners, and providing or locating funds for security and utility deposits. Almost all PHAs set some limits on the amount of time a family has to search before their voucher expires and is issued to another eligible family: most allow an initial search period of 60 days, with extensions up to 120 days. Success Rate A PHA’s leasing success rate is the percentage of families who receive a voucher and are able to find a suitable unit within the time allowed. Overissuance Because some percentage of families who receive vouchers will never succeed in finding a unit that qualifies for voucher assistance, many PHAs issue more vouchers than they have available in order to lease up the required number of units more quickly. This practice, which is generally acceptable to HUD, is referred to as overissuance. Alternatively, some PHAs prefer to wait until one family’s voucher expires before issuing the voucher to another family. This may result in the PHA’s taking a longer time to lease up its full quota of authorized units. Suitable Housing Once a voucher family has found a unit, the PHA must determine whether the unit is suitable for inclusion in the voucher program. Generally, the unit must be large enough for the family, meet HUD’s Housing Quality Standards (HQS), and rent for no more than the PHA determines is reasonable based on rents for comparable units in the market area. Affordability Units leased by program families must also be affordable for the family at the time they are leased. The payment standard for the unit size on the voucher that the family receives determines the maximum subsidy a family can receive. If the family rents a unit for which the gross rent – the monthly cost for rent and any tenant-paid utilities – is at or below the payment standard, the family will generally pay 30 percent of their income for rent and utilities and the PHA will pay the rest. If the unit costs more than the payment standard, the family pays the difference. However, no family may lease a unit that will initially require
A-84 Appendix A – How the Voucher Program Works

them to pay more than 40 percent of their monthly income for rent and utilities. The PHA would have to inform the family that such a unit does not meet the affordability test. Portability Voucher program participants may generally lease units anywhere in the United States where a PHA administers a tenant-based (voucher) assistance program. The only exception is that families who do not live in a PHA’s jurisdiction at the time they apply for assistance may be required by the PHA to live in the PHA’s jurisdiction for 12 months with voucher assistance before they can exercise portability. If a family “ports” their assistance to another jurisdiction, the receiving PHA performs all the initial and annual functions for the family, and decides whether to bill the sending PHA for the family’s HAP and administrative costs, or to absorb the family into their own program. Voucher holders who are absorbed by another PHA do not count toward the utilization of the PHA that issued the voucher. HAP Contract When a voucher family has found, and the PHA has approved, a unit for which the family will receive voucher assistance, the family signs a lease with the owner and the PHA signs a Housing Assistance Payments (HAP) contract. Under the HAP contract, the owner agrees to maintain the unit in accordance with HUD’s Housing Quality Standards and comply with other program requirements, and the PHA agrees to make HAP payments monthly until the family moves or becomes ineligible for voucher assistance. Utilization The PHA’s utilization rate is most commonly calculated as the number of unit months leased during the PHA’s fiscal year expressed as a percentage of the number of unit months available for the entire year. If, for example, a PHA has 100 units under ACC at the beginning of its fiscal year, the PHA is considered to have 1200 unit months available during the year. The PHA can achieve 100 percent utilization by having 100 units under lease each month, or by over- (or under-) leasing in some months to compensate for under- (or over-) leasing in others. Prior to the issuance of PIH Notice 2002-6, PHAs that had experienced sharp increases in HAP costs that resulted in their being unable to lease 100 percent of their authorized units were considered adequately utilized if their budget utilization, rather than their unit utilization, met or exceeded acceptable levels. HUD’s new policy allows PHAs with high utilization that are in danger of exceeding their ABA to amend their budgets mid-year and draw on reserves and/or additional funds to support their full complement of units. Utilization is measured by HUD at the end of the PHA’s fiscal year, using information provided by the PHA on its Year-End Statement. HAP Costs Under the ACC, HUD reimburses the PHA dollar-for-dollar for HAP payments made to eligible families. HUD also pays the PHA a monthly per-unit administrative fee for units under lease during the month, hard-to-house and lead-based paint testing fees as provided under program regulations, and the costs of an annual IPA audit. The cap on the amount that HUD will generally pay to the PHA in any fiscal year is the Annual Budget Authority (ABA), the sum of amounts provided annually under all of the PHA’s funding increments. Each year, when HUD renews the PHA’s funding, the amount of the ABA is re-
Appendix A – How the Voucher Program Works A-85
calculated based on the PHA’s actual per-unit costs during the preceding year. The renewal amount is expected to cover the PHA’s costs for the year ahead, for administration of the number of units provided for in the ACC. During the years preceding this study, PHAs were required to restrict their leasing if it appeared that the ABA was insufficient to support all of the unit under ACC. Since the issuance of PIH Notice 2002-6 in January 2002, however, if the ABA is insufficient to support all of the units, the PHA may request additional funding from HUD. Optimized Leasing PHAs may uses available ABA to support additional units during the fiscal year. Renewals will, however, be based on actual per-unit costs for the preceding year and the number of units awarded by HUD under the ACC. Optimized leasing can provide additional assistance to families in the short run, but does not make any permanent changes in the number of units covered under the ACC. SEMAP The Section 8 Management Assessment Program (SEMAP) is HUD’s system for evaluating the performance of PHAs administering the voucher program. Under SEMAP, PHA’s are scored yearly on fourteen mandatory and two optional performance indicators. Overall scores of 60 percent or higher are considered standard. PHAs that receive scores of 90 percent or higher are considered high performers, and PHAs that receive scores of 59 percent or lower are considered troubled. Program utilization is a key performance indicator, one of only three for which a PHA is awarded 20 points (out of 145) for full performance (98 percent or better) and 15 points for acceptable performance (95 – 97 percent). PHAs that fail the utilization (“lease-up”) indicator, or any other indicator, are required to develop and implement a corrective action plan. Recapture PHAs that fail to maintain at least 90 percent utilization are subject to the recapture of their un-utilized program units and funds. When a PHA reports utilization below 90 percent on its year-end financial statement, HUD issues a written warning to the PHA that it must improve its utilization leasing during the next year. If the PHA’s performance does not improve, authorized units – and the funds to support them – are recaptured by HUD and made available to other, high-performing PHAs through a competitive process.
A-86 Appendix A – How the Voucher Program Works

Appendix B
Unit Utilization at the End of FY2001
Appendix B – Unit Utilization at the End of FY2001 B-87
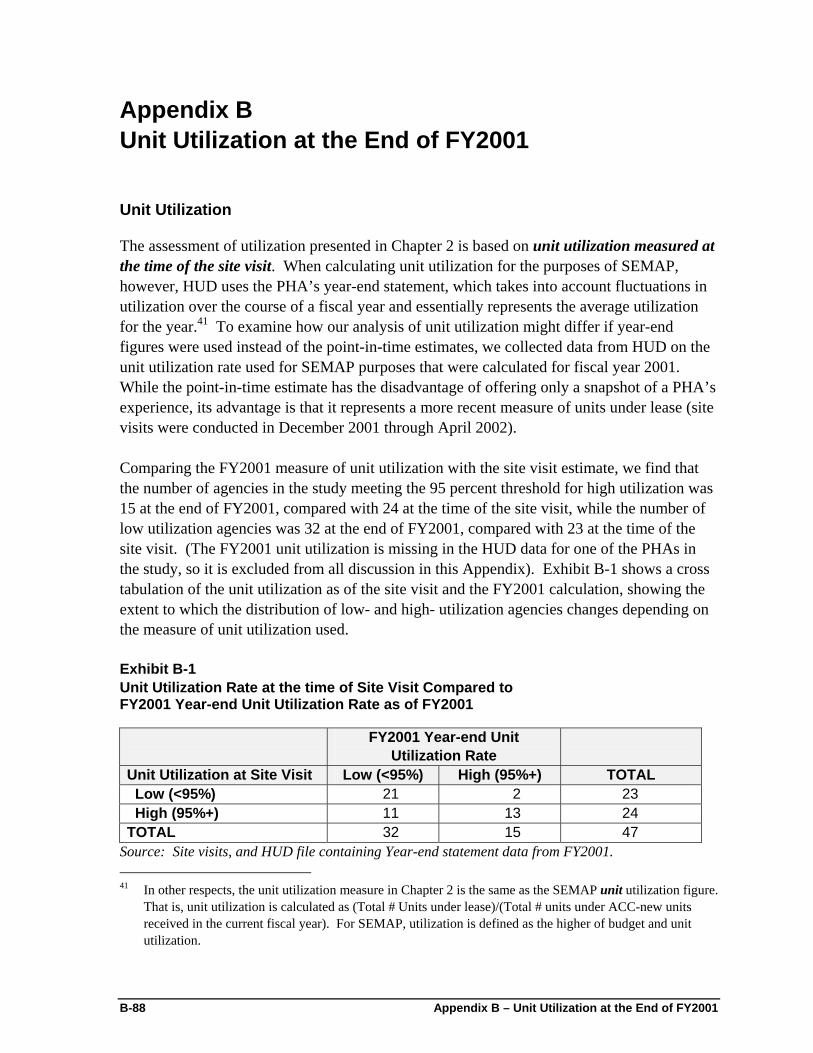
Appendix B Unit Utilization at the End of FY2001
Unit Utilization
The assessment of utilization presented in Chapter 2 is based on unit utilization measured at the time of the site visit. When calculating unit utilization for the purposes of SEMAP, however, HUD uses the PHA’s year-end statement, which takes into account fluctuations in utilization over the course of a fiscal year and essentially represents the average utilization for the year.41 To examine how our analysis of unit utilization might differ if year-end figures were used instead of the point-in-time estimates, we collected data from HUD on the unit utilization rate used for SEMAP purposes that were calculated for fiscal year 2001. While the point-in-time estimate has the disadvantage of offering only a snapshot of a PHA’s experience, its advantage is that it represents a more recent measure of units under lease (site visits were conducted in December 2001 through April 2002). Comparing the FY2001 measure of unit utilization with the site visit estimate, we find that the number of agencies in the study meeting the 95 percent threshold for high utilization was 15 at the end of FY2001, compared with 24 at the time of the site visit, while the number of low utilization agencies was 32 at the end of FY2001, compared with 23 at the time of the site visit. (The FY2001 unit utilization is missing in the HUD data for one of the PHAs in the study, so it is excluded from all discussion in this Appendix). Exhibit B-1 shows a cross tabulation of the unit utilization as of the site visit and the FY2001 calculation, showing the extent to which the distribution of low- and high- utilization agencies changes depending on the measure of unit utilization used. Exhibit B-1 Unit Utilization Rate at the time of Site Visit Compared to FY2001 Year-end Unit Utilization Rate as of FY2001 FY2001 Year-end Unit
Utilization Rate
Unit Utilization at Site Visit Low (<95%) High (95%+) TOTAL Low (<95%) 21 2 23 High (95%+) 11 13 24 TOTAL 32 15 47
Source: Site visits, and HUD file containing Year-end statement data from FY2001. 41 In other respects, the unit utilization measure in Chapter 2 is the same as the SEMAP unit utilization figure.
That is, unit utilization is calculated as (Total # Units under lease)/(Total # units under ACC-new units received in the current fiscal year). For SEMAP, utilization is defined as the higher of budget and unit utilization.
B-88 Appendix B – Unit Utilization at the End of FY2001
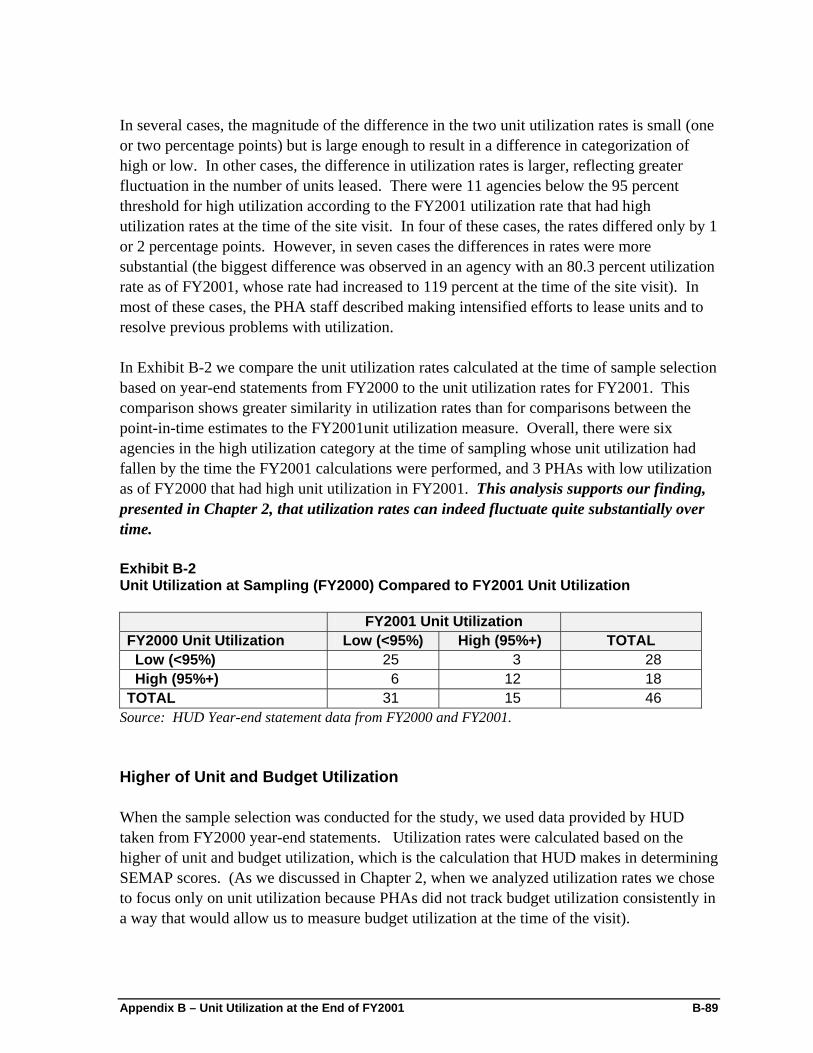
In several cases, the magnitude of the difference in the two unit utilization rates is small (one or two percentage points) but is large enough to result in a difference in categorization of high or low. In other cases, the difference in utilization rates is larger, reflecting greater fluctuation in the number of units leased. There were 11 agencies below the 95 percent threshold for high utilization according to the FY2001 utilization rate that had high utilization rates at the time of the site visit. In four of these cases, the rates differed only by 1 or 2 percentage points. However, in seven cases the differences in rates were more substantial (the biggest difference was observed in an agency with an 80.3 percent utilization rate as of FY2001, whose rate had increased to 119 percent at the time of the site visit). In most of these cases, the PHA staff described making intensified efforts to lease units and to resolve previous problems with utilization. In Exhibit B-2 we compare the unit utilization rates calculated at the time of sample selection based on year-end statements from FY2000 to the unit utilization rates for FY2001. This comparison shows greater similarity in utilization rates than for comparisons between the point-in-time estimates to the FY2001unit utilization measure. Overall, there were six agencies in the high utilization category at the time of sampling whose unit utilization had fallen by the time the FY2001 calculations were performed, and 3 PHAs with low utilization as of FY2000 that had high unit utilization in FY2001. This analysis supports our finding, presented in Chapter 2, that utilization rates can indeed fluctuate quite substantially over time. Exhibit B-2 Unit Utilization at Sampling (FY2000) Compared to FY2001 Unit Utilization FY2001 Unit Utilization FY2000 Unit Utilization Low (<95%) High (95%+) TOTAL Low (<95%) 25 3 28 High (95%+) 6 12 18 TOTAL 31 15 46
Source: HUD Year-end statement data from FY2000 and FY2001. Higher of Unit and Budget Utilization When the sample selection was conducted for the study, we used data provided by HUD taken from FY2000 year-end statements. Utilization rates were calculated based on the higher of unit and budget utilization, which is the calculation that HUD makes in determining SEMAP scores. (As we discussed in Chapter 2, when we analyzed utilization rates we chose to focus only on unit utilization because PHAs did not track budget utilization consistently in a way that would allow us to measure budget utilization at the time of the visit).
Appendix B – Unit Utilization at the End of FY2001 B-89

To compare the FY2000 sampling utilization rates to the more recent FY2001 figures, we compared sampling utilization to the higher of unit and budget utilization based on year-end statements from FY2001. Exhibit B-3 shows a cross tabulation of high- and low-utilization PHAs using these two measures. As the exhibit demonstrates, there is less variability in utilization estimates when the higher of budget and unit utilization is used as the measure. A total of three PHAs were considered high utilizers based on the sampling measure, but low utilizers using the 2001 measure. On the other hand, four PHAs had low utilization based on the sampling rate, but had high utilization rates as of the 2001 measure. Exhibit B-3 Utilization at Sampling (FY2000) Compared to FY2001 Utilization (Based on the maximum of unit and budget utilization rates) FY2001 Max Utilization Rate FY2000 Max Utilization Rate Low (<95%) High (95%+) TOTAL Low (<95%) 21 4 25 High (95%+) 3 18 21 TOTAL 24 22 46
Source: HUD Year-end statement data from FY2000 and FY2001. External and Internal Factors Related to SEMAP Unit Utilization In Exhibit B-4, we present cross tabulations of the same external and internal factors that we examined in Chapter 2, across PHAs in the study with high and low utilization using the FY2001 SEMAP unit utilization measure. As is clear from the table, given the smaller number of high utilization agencies (15 compared with 25), fewer of the distributions of factors are statistically significant than were found using the point-in-time estimate. However, consistent with the analysis in Chapter 2, overall program management and a systematic method of issuing vouchers are again found to be significant factors affecting utilization. In general, the patterns observed in Chapter 2 also hold when we use the FY2001 SEMAP unit utilization. That is, condition of housing stock, receipt of new allocations, and higher leasing success rates tend to be associated with high utilization rates. In addition, the average utilization rate among agencies in the study considered to have excellent landlord relations (95.9 percent) is significantly higher than for those considered to have either good landlord relations (84.8 percent) or poor landlord relations (85.5 percent). As we would expect, the average utilization rate among agencies that received new allocations in the previous two years (90.2) is significantly higher than among those who did not receive new allocations in the pervious two years (84.0).
B-90 Appendix B – Unit Utilization at the End of FY2001
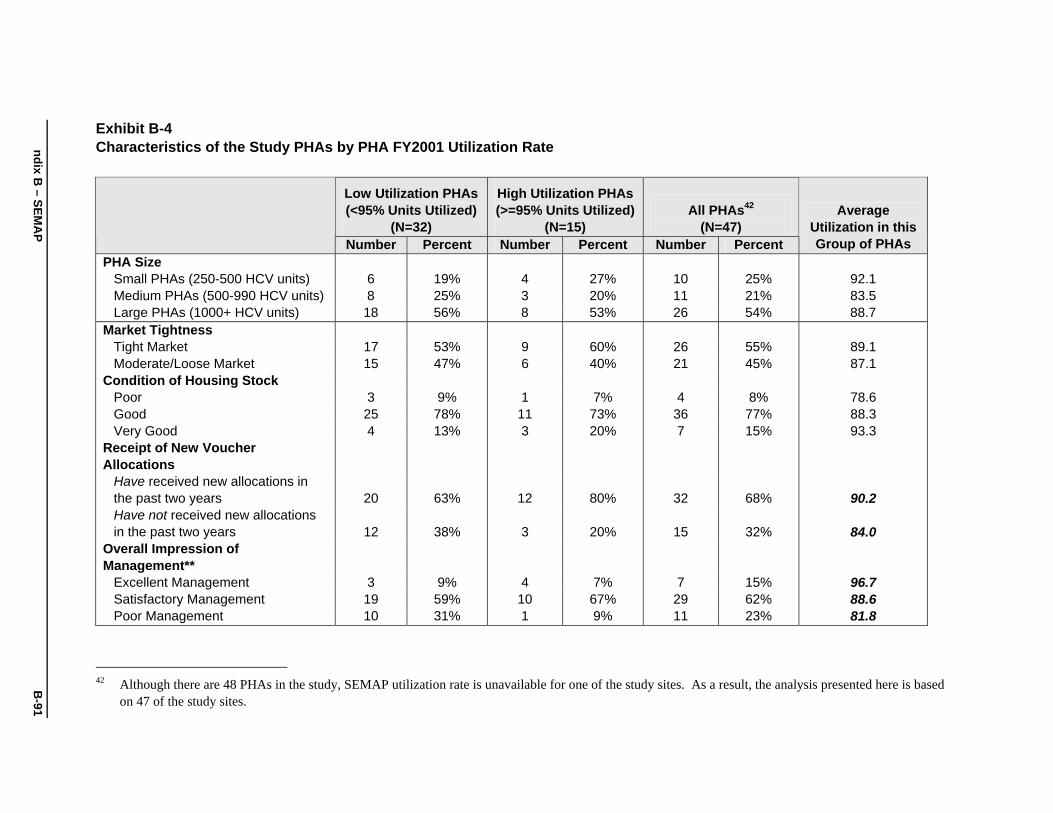
Appe
Exhibit B-4
ndix B – SEM
AP
B-91
Characteristics of the Study PHAs by PHA FY2001 Utilization Rate
Low Utilization PHAs (<95% Units Utilized)
(N=32)
High Utilization PHAs (>=95% Units Utilized)
(N=15) All PHAs42
(N=47) Number Percent Number Percent Number Percent
Average Utilization in this Group of PHAs
PHA Size Small PHAs (250-500 HCV units) 6 19% 4 27% 10 25% 92.1 Medium PHAs (500-990 HCV units) 8 25% 3 20% 11 21% 83.5 Large PHAs (1000+ HCV units) 18 56% 8 53% 26 54% 88.7
Market Tightness Tight Market 17 53% 9 60% 26 55% 89.1 Moderate/Loose Market 15 47% 6 40% 21 45% 87.1
Condition of Housing Stock Poor 3 9% 1 7% 4 8% 78.6Good 25 78% 11 73% 36 77% 88.3Very Good 4 13% 3 20% 7 15% 93.3
Receipt of New Voucher Allocations
Have received new allocations in the past two years 20 63% 12 80% 32 68% 90.2 Have not received new allocations in the past two years 12 38% 3 20% 15 32% 84.0
Overall Impression of Management**
Excellent Management 3 9% 4 7% 7 15% 96.7 Satisfactory Management 19 59% 10 67% 29 62% 88.6 Poor Management 10 31% 1 9% 11 23% 81.8
42 Although there are 48 PHAs in the study, SEMAP utilization rate is unavailable for one of the study sites. As a result, the analysis presented here is based
on 47 of the study sites.
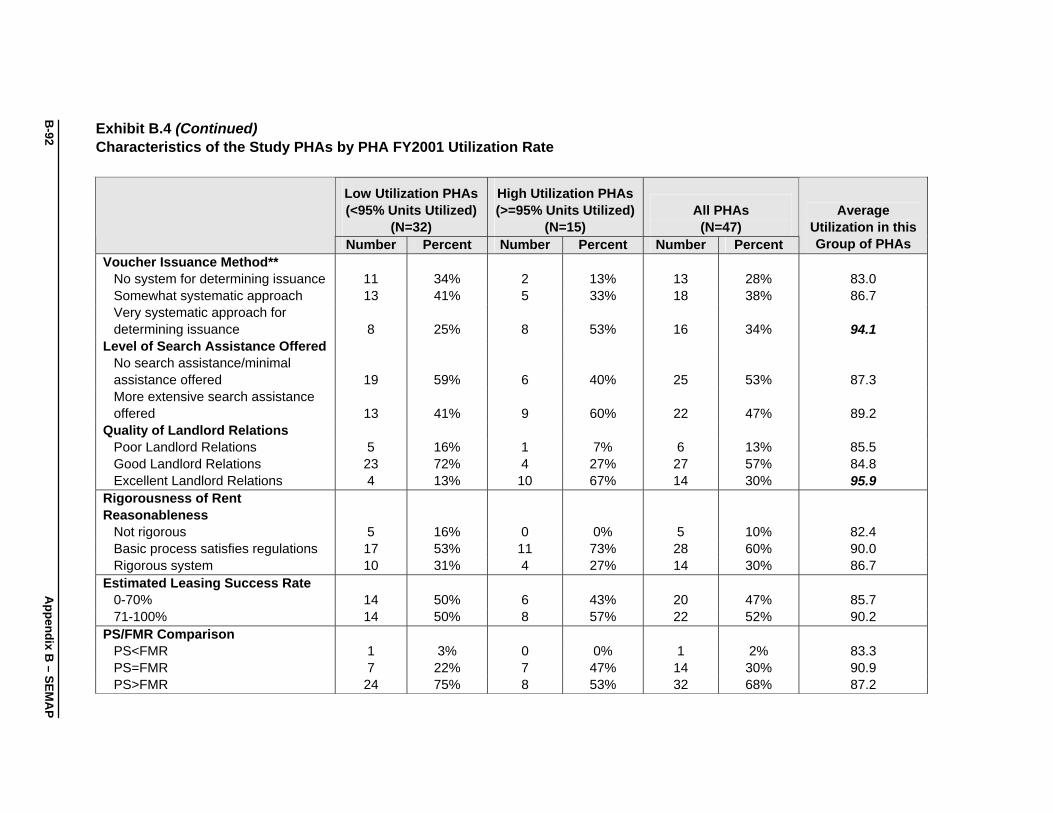
Exhibit B.4 (Continued)
B-92
Appendix B
–SEM
AP
Characteristics of the Study PHAs by PHA FY2001 Utilization Rate
Low Utilization PHAs (<95% Units Utilized)
(N=32)
High Utilization PHAs (>=95% Units Utilized)
(N=15) All PHAs
(N=47) Number Percent Number Percent Number Percent
Average Utilization in this Group of PHAs
Voucher Issuance Method** No system for determining issuance 11 34% 2 13% 13 28% 83.0Somewhat systematic approach 13 41% 5 33% 18 38% 86.7Very systematic approach for determining issuance 8 25% 8 53% 16 34% 94.1
Level of Search Assistance Offered No search assistance/minimal assistance offered 19 59% 6 40% 25 53% 87.3 More extensive search assistance offered 13 41% 9 60% 22 47% 89.2
Quality of Landlord Relations Poor Landlord Relations 5 16% 1 7% 6 13% 85.5 Good Landlord Relations 23 72% 4 27% 27 57% 84.8 Excellent Landlord Relations 4 13% 10 67% 14 30% 95.9
Rigorousness of Rent Reasonableness
Not rigorous 5 16% 0 0% 5 10% 82.4Basic process satisfies regulations 17 53% 11 73% 28 60% 90.0Rigorous system 10 31% 4 27% 14 30% 86.7
Estimated Leasing Success Rate 0-70% 14 50% 6 43% 20 47% 85.771-100% 14 50% 8 57% 22 52% 90.2
PS/FMR Comparison PS<FMR 1 3% 0 0% 1 2% 83.3PS=FMR 7 22% 7 47% 14 30% 90.9PS>FMR 24 75% 8 53% 32 68% 87.2

Appe
Exhibit B.4 (Continued)
ndix B – SEM
AP
B-93
Characteristics of the Study PHAs by PHA FY2001 Utilization Rate
Low Utilization PHAs (<95% Units Utilized)
(N=32)
High Utilization PHAs (>=95% Units Utilized)
(N=15) All PHAs
(N=47) Number Percent Number Percent Number Percent
Average Utilization in this Group of PHAs
Deconcentration Deconcentration is not a high priority
13 45% 8 53% 21 48% 89.3
Deconcentration is a high priority 16 55% 7 47% 23 52% 87.4 Frequency of Wait List Purges
Purging wait list is not necessary because applicants are processed within one year 3 10% 2 13% 5 11% 89.0Wait list purged annually or more frequently 15 52% 9 60% 24 55% 89.4Wait list purged less often than annually 11 38% 4 27% 15 34% 85.9
Vouchers: Full-time Staff 0-125 vouchers/FTE 14 44% 9 60% 23 49% 88.0126-150 vouchers/FTE 8 25% 3 20% 11 23% 89.3>150 vouchers/FTE 10 31% 3 20% 13 28% 87.7
Mean Vouchers/FTE 127 122 124 Median Vouchers/FTE 129 122 126
Source: Site visits, MTCS data, interviews with PHA staff
** Signifies that the difference in distributions is statistically significance at the 0.1 confidence level. Statistically significant differences in averages (at the 0.1 level) are bolded and italicized. Observations with missing data are excluded from the calculations.