costco wholesale corporation annual report 2020
TRANSCRIPT

Costco Wholesale Annual Report 2020Form 10-K (NASDAQ:COST)
Published: October 7th, 2020
PDF generated by stocklight.com
UNITED STATESSECURITIES AND EXCHANGE COMMISSION
Washington, D.C. 20549
FORM 10-K☒ ANNUAL REPORT PURSUANT TO SECTION 13 OR 15(d) OF THE SECURITIES EXCHANGE
ACT OF 1934For the fiscal year ended August 30, 2020
or
☐ TRANSITION REPORT PURSUANT TO SECTION 13 OR 15(d) OF THE SECURITIESEXCHANGE ACT OF 1934
Commission file number 0-20355Costco Wholesale Corporation(Exact name of registrant as specified in its charter)
Washington 91-1223280(State or other jurisdiction ofincorporation or organization)
(I.R.S. Employer Identification No.)
999 Lake Drive, Issaquah, WA 98027(Address of principal executive offices) (Zip Code)
Registrant’s telephone number, including area code: (425) 313-8100Securities registered pursuant to Section 12(b) of the Act:
Title of each class Trading Symbol Name of each exchange on
which registeredCommon Stock, $.01 Par Value COST The NASDAQ Global Select Market
Securities registered pursuant to Section 12(g) of the Act: None Indicate by check mark if the registrant is a well-known seasoned issuer, as defined in Rule 405 of the Securities Act. Yes ☒ No ☐Indicate by check mark if the registrant is not required to file reports pursuant to Section 13 or Section 15(d) of the Act. Yes ☐ No ☒ Indicate by check mark whether the registrant (1) has filed all reports required to be filed by Section 13 or 15(d) of the Securities Exchange Act of 1934 during thepreceding 12 months (or for such shorter period that the registrant was required to file such reports), and (2) has been subject to such filing requirements for the past90 days. Yes ☒ No ☐Indicate by check mark whether the registrant has submitted electronically every Interactive Data File required to be submitted pursuant to Rule 405 of Regulation S-T(§ 232.405 of this chapter) during the preceding 12 months (or for such shorter period that the registrant was required to submit such files). Yes ☒ No ☐Indicate by check mark whether the registrant is a large accelerated filer, an accelerated filer, a non-accelerated filer, a smaller reporting company, or an emerginggrowth company. See the definitions of “large accelerated filer,” “accelerated filer”, “smaller reporting company”, and "emerging growth company" in Rule 12b-2 of theExchange Act.
Large accelerated filer ☒ Accelerated filer ☐Non-accelerated filer ☐ Smaller reporting company ☐
Emerging growth company ☐If an emerging growth company, indicate by check mark if the registrant has elected not to use the extended transition period for complying with any new or revisedfinancial accounting standards provided pursuant to Section 13(a) of the Exchange Act. ☐Indicate by check mark whether the registrant has filed a report on and attestation to its management’s assessment of the effectiveness of its internal control overfinancial reporting under Section 404(b) of the Sarbanes-Oxley Act (15 U.S.C. 7262(b)) by the registered public accounting firm that prepared or issued its auditreport. ☒Indicate by check mark whether the registrant is a shell company (as defined in Rule 12b-2 of the Act). Yes ☐ No ☒The aggregate market value of the voting stock held by non-affiliates of the registrant as of February 16, 2020 was $140,245,657,604.The number of shares outstanding of the registrant’s common stock as of September 29, 2020 was 441,228,027.
DOCUMENTS INCORPORATED BY REFERENCEPortions of the Company’s Proxy Statement for the Annual Meeting of Shareholders to be held on January 21, 2021, are incorporated by reference into Part III of thisForm 10-K.

COSTCO WHOLESALE CORPORATIONANNUAL REPORT ON FORM 10-K FOR THE FISCAL YEAR ENDED AUGUST 30, 2020
TABLE OF CONTENTS
PagePART IItem 1. Business 3Item 1A. Risk Factors 8Item 1B. Unresolved Staff Comments 17Item 2. Properties 17Item 3. Legal Proceedings 18Item 4. Mine Safety Disclosures 18
PART IIItem 5. Market for Registrant’s Common Equity, Related Stockholder Matters and Issuer Purchases of Equity Securities 18Item 6. Selected Financial Data 19Item 7. Management’s Discussion and Analysis of Financial Condition and Results of Operations 21Item 7A. Quantitative and Qualitative Disclosures About Market Risk 30Item 8. Financial Statements and Supplementary Data 32Item 9. Changes in and Disagreements with Accountants on Accounting and Financial Disclosure 66Item 9A. Controls and Procedures 66Item 9B. Other Information 67
PART IIIItem 10. Directors, Executive Officers and Corporate Governance 67Item 11. Executive Compensation 67Item 12. Security Ownership of Certain Beneficial Owners and Management and Related Stockholder Matters 67Item 13. Certain Relationships and Related Transactions, and Director Independence 67Item 14. Principal Accounting Fees and Services 67
PART IVItem 15. Exhibits, Financial Statement Schedules 68Item 16. Form 10-K Summary 70
Signatures 71
2

INFORMATION RELATING TO FORWARD LOOKING STATEMENTS
Certain statements contained in this Report constitute forward-looking statements within the meaning of the Private Securities Litigation Reform Act of1995, Section 27A of the Securities Act of 1933 and Section 21E of the Securities Exchange Act of 1934. They include statements that address activities,events, conditions or developments that we expect or anticipate may occur in the future and may relate to such matters as sales growth, changes incomparable sales, cannibalization of existing locations by new openings, price or fee changes, earnings performance, earnings per share, stock-basedcompensation expense, warehouse openings and closures, capital spending, the effect of adopting certain accounting standards, future financialreporting, financing, margins, return on invested capital, strategic direction, expense controls, membership renewal rates, shopping frequency, litigation,and the demand for our products and services. Forward-looking statements may also be identified by the words “anticipate,” “believe,” “continue,” “could,”“estimate,” “expect,” “intend,” "likely," “may,” “might,” “plan,” “potential,” “predict,” “project,” “seek,” “should,” “target,” “will,” “would,” or similar expressionsand the negatives of those terms. Such forward-looking statements involve risks and uncertainties that may cause actual events, results, or performanceto differ materially from those indicated by such statements, including, without limitation, the factors set forth in the section titled “Item 1A-Risk Factors”,and other factors noted in the section titled “Item 7-Management's Discussion and Analysis of Financial Condition and Results of Operations ” and in theconsolidated financial statements and related notes in Item 8 of this Report. Forward-looking statements speak only as of the date they are made, and wedo not undertake to update these statements, except as required by law.
PART I
Item 1—Business
Costco Wholesale Corporation and its subsidiaries (Costco or the Company) began operations in 1983, in Seattle, Washington. We are principallyengaged in the operation of membership warehouses in the United States (U.S.) and Puerto Rico, Canada, United Kingdom (U.K.), Mexico, Japan,Korea, Australia, Spain, France, Iceland, China, and through a majority-owned subsidiary in Taiwan. Costco operated 795, 782, and 762 warehousesworldwide at August 30, 2020, September 1, 2019, and September 2, 2018, respectively. The Company operates e-commerce websites in the U.S.,Canada, Mexico, U.K., Korea, Taiwan, Japan, and Australia. Our common stock trades on the NASDAQ Global Select Market, under the symbol “COST.”
We report on a 52/53-week fiscal year, consisting of thirteen four-week periods and ending on the Sunday nearest the end of August. The first threequarters consist of three periods each, and the fourth quarter consists of four periods (five weeks in the thirteenth period in a 53-week year). The materialseasonal impact in our operations is increased net sales and earnings during the winter holiday season. References to 2020, 2019, and 2018 relate to the52-week fiscal years ended August 30, 2020, September 1, 2019, and September 2, 2018, respectively.
General
We operate membership warehouses based on the concept that offering our members low prices on a limited selection of nationally-branded and private-label products in a wide range of categories will produce high sales volumes and rapid inventory turnover. When combined with the operating efficienciesachieved by volume purchasing, efficient distribution and reduced handling of merchandise in no-frills, self-service warehouse facilities, these volumesand turnover enable us to operate profitably at significantly lower gross margins (net sales less merchandise costs) than most other retailers. Wegenerally sell inventory before we are required to pay for it, even while taking advantage of early payment discounts.
We buy most of our merchandise directly from manufacturers and route it to cross-docking consolidation points (depots) or directly to our warehouses.Our depots receive large shipments from manufacturers and quickly ship these goods to warehouses. This process creates freight volume and handlingefficiencies, lowering costs associated with traditional multiple-step distribution channels.

Our average warehouse space is approximately 146,000 square feet, with newer units being slightly larger. Floor plans are designed for economy andefficiency in the use of selling space, the handling of merchandise, and the control of inventory. Because shoppers are attracted principally by the qualityof merchandise and low prices, our warehouses are not elaborate. By strictly controlling the entrances and exits and using a membership format, webelieve our inventory losses (shrinkage) are well below those of typical retail operations.
Our warehouses on average operate on a seven-day, 70-hour week. Gasoline operations generally have extended hours. Because the hours ofoperation are shorter than other retailers, and due to other efficiencies inherent in a warehouse-type operation, labor costs are lower relative to thevolume of sales. Merchandise is generally stored on racks above the sales floor and displayed on pallets containing large quantities, reducing laborrequired. In general, with variations by country, our warehouses accept certain credit cards, including Costco co-branded cards, debit cards, cash andchecks, co-brand cardholder rebates, executive member 2% reward certificates and our proprietary stored-value card (shop card).
Our strategy is to provide our members with a broad range of high-quality merchandise at prices we believe are consistently lower than elsewhere. Weseek to limit most items to fast-selling models, sizes, and colors. We carry an average of approximately 3,700 active stock keeping units (SKUs) perwarehouse in our core warehouse business, significantly less than other broadline retailers. We average anywhere from 8,000 to 10,000 SKUs online,some of which are also available in our warehouses. Many consumable products are offered for sale in case, carton, or multiple-pack quantities only.
In keeping with our policy of member satisfaction, we generally accept returns of merchandise. On certain electronic items, we typically have a 90-dayreturn policy and provide, free of charge, technical support services, as well as an extended warranty. Additional third-party warranty coverage is sold oncertain electronic items.
We offer merchandise in the following categories:
• Food and Sundries (including dry foods, packaged foods, groceries, snack foods, candy, alcoholic and nonalcoholic beverages, and cleaningsupplies)
• Hardlines (including major appliances, electronics, health and beauty aids, hardware, and garden and patio)
• Fresh Foods (including meat, produce, deli, and bakery)
• Softlines (including apparel and small appliances)
• Ancillary (including gasoline and pharmacy businesses)
Ancillary businesses within or next to our warehouses provide expanded products and services, encouraging members to shop more frequently. Thesebusinesses include gas stations, pharmacies, optical dispensing centers, food courts, and hearing-aid centers. The number of warehouses with gasstations varies significantly by country, and we do not currently operate our gasoline business in Korea or China. We operated 615 gas stations at theend of 2020. Net sales for our gasoline business represented approximately 9% of total net sales in 2020.
Our e-commerce operations allow us to connect with our members online and provide additional products and services, many not found in ourwarehouses. Net sales for e-commerce represented approximately 6% of total net sales in 2020. This figure does not consider other services we offeronline in certain countries such as business delivery, travel, same-day grocery, and various other services.
We have direct buying relationships with many producers of national brand-name merchandise. We do not obtain a significant portion of merchandisefrom any one supplier. The COVID-19 pandemic created unprecedented supply constraints including disruptions and delays that have impacted andcould continue to impact the flow and availability of certain products. When sources of supply become unavailable, we seek alternative sources. We alsopurchase and manufacture private-label merchandise, as long as quality and member demand are high and the value to our members is significant.

Certain financial information for our segments and geographic areas is included in Note 12 to the consolidated financial statements included in Item 8 ofthis Report.
Membership
Our members may utilize their memberships at our warehouses worldwide. Gold Star memberships are available to individuals; Business membershipsare limited to businesses, including individuals with a business license, retail sales license or comparable document. Business members may addadditional cardholders (affiliates), to which the same annual fee applies. Affiliates are not available for Gold Star members. Our annual fee for thesememberships is $60 in our U.S. and Canadian operations and varies in other countries. All paid memberships include a free household card.
Our member renewal rate was 91% in the U.S. and Canada and 88% on a worldwide basis at the end of 2020. The majority of members renew within sixmonths following their renewal date. Our renewal rate is a trailing calculation that captures renewals during the period seven to eighteen months prior tothe reporting date.
Our membership counts include active memberships as well as memberships that have not renewed within the 12 months prior to the reporting date. Atthe end of 2020, we standardized our membership count methodology globally to be consistent with the U.S. and Canada, which resulted in the additionto the count of approximately 2.0 million total cardholders for 2020, of which 1.3 million were paid members. The change did not impact 2019 or 2018.Membership fee income and the renewal rate calculations were not affected. Our membership was made up of the following (in thousands):
2020 2019 2018
Gold Star 46,800 42,900 40,700 Business, including affiliates 11,300 11,000 10,900
Total paid members 58,100 53,900 51,600 Household cards 47,400 44,600 42,700
Total cardholders 105,500 98,500 94,300
Paid cardholders (except affiliates) are eligible to upgrade to an Executive membership in the U.S. and Canada, for an additional annual fee of $60.Executive memberships are also available in Mexico, the U.K., Japan, Korea, and Taiwan, for which the additional annual fee varies. Executive membersearn a 2% reward on qualified purchases (generally up to a maximum reward of $1,000 per year), which can be redeemed only at Costco warehouses.This program also offers (except in Mexico, Japan, and Korea), access to additional savings and benefits on various business and consumer services,such as auto and home insurance, the Costco auto purchase program, and check printing. These services are generally provided by third parties andvary by state and country. Executive members, who totaled 22.6 million and represented 39% of paid members at the end of 2020, generally shop morefrequently and spend more than other members.
Labor
Our employee count was as follows:
2020 2019 2018
Full-time employees 156,000 149,000 143,000 Part-time employees 117,000 105,000 102,000
Total employees 273,000 254,000 245,000
Approximately 17,100 employees are union employees. We consider our employee relations to be very good.

Competition
Our industry is highly competitive, based on factors such as price, merchandise quality and selection, location, convenience, distribution strategy, andcustomer service. We compete on a worldwide basis with global, national, and regional wholesalers and retailers, including supermarkets, supercenters,internet retailers, gasoline stations, hard discounters, department and specialty stores, and operators selling a single category or narrow range ofmerchandise. Walmart, Target, Kroger, and Amazon are among our significant general merchandise retail competitors. We also compete with otherwarehouse clubs (primarily Walmart’s Sam’s Club and BJ’s Wholesale Club), and many of the major metropolitan areas in the U.S. and certain of ourOther International locations have multiple clubs.
Intellectual Property
We believe that, to varying degrees, our trademarks, trade names, copyrights, proprietary processes, trade secrets, trade dress, domain names andsimilar intellectual property add significant value to our business and are important to our success. We have invested significantly in the development andprotection of our well-recognized brands, including the Costco Wholesale® trademarks and our private-label brand, Kirkland Signature ®. We believe thatKirkland Signature products are high quality, offered at prices that are generally lower than national brands, and help lower costs, differentiate ourmerchandise offerings, and generally earn higher margins. We expect to continue to increase the sales penetration of our private-label items.
We rely on trademark and copyright laws, trade-secret protection, and confidentiality, license and other agreements with our suppliers, employees andothers to protect our intellectual property. The availability and duration of trademark registrations vary by country; however, trademarks are generally validand may be renewed indefinitely as long as they are in use and registrations are maintained.
Available Information
Our U.S. website is www.costco.com. We make available through the Investor Relations section of that site, free of charge, our Annual Reports on Form10-K, Quarterly Reports on Form 10-Q, Current Reports on Form 8-K, Proxy Statements and Forms 3, 4 and 5, and any amendments to those reports, assoon as reasonably practicable after filing such materials with or furnishing such documents to the Securities and Exchange Commission (SEC). Theinformation found on our website is not part of this or any other report filed with or furnished to the SEC. The SEC maintains a site that contains reports,proxy and information statements, and other information regarding issuers, such as the Company, that file electronically with the SEC at www.sec.gov.
We have adopted a code of ethics for senior financial officers pursuant to Section 406 of the Sarbanes-Oxley Act. Copies of the code are available free ofcharge by writing to Secretary, Costco Wholesale Corporation, 999 Lake Drive, Issaquah, WA 98027. If the Company makes any amendments to thiscode (other than technical, administrative, or non-substantive amendments) or grants any waivers, including implicit waivers, to the CEO, chief financialofficer or principal accounting officer and controller, we will disclose (on our website or in a Form 8-K report filed with the SEC) the nature of theamendment or waiver, its effective date, and to whom it applies.

Information about our Executive Officers
The executive officers of Costco, their position, and ages are listed below. All executive officers have over 25 years of service with the Company.
Name Position
ExecutiveOfficerSince Age
W. Craig Jelinek President and Chief Executive Officer. Mr. Jelinek has been President andChief Executive Officer since January 2012 and a director since February2010. He was President and Chief Operating Officer from February 2010 toDecember 2011. Prior to that he was Executive Vice President, ChiefOperating Officer, Merchandising since 2004.
1995 68
Richard A. Galanti Executive Vice President and Chief Financial Officer. Mr. Galanti has been adirector since January 1995.
1993 64
Jim C. Klauer Executive Vice President, Chief Operating Officer, Northern Division. Mr.Klauer was Senior Vice President, Non Foods and E-commerce Merchandise,from 2013 to January 2018.
2018 58
Patrick J. Callans Executive Vice President, Administration. Mr. Callans was Senior VicePresident, Human Resources and Risk Management, from 2013 to December2018.
2019 58
Russ D. Miller Executive Vice President, Chief Operating Officer, Southern Division andMexico. Mr. Miller was Senior Vice President, Western Canada Region, from2001 to January 2018.
2018 63
Paul G. Moulton Executive Vice President, Chief Information Officer. Mr. Moulton wasExecutive Vice President, Real Estate Development, from 2001 until March2010.
2001 69
James P. Murphy Executive Vice President, Chief Operating Officer, International. Mr. Murphywas Senior Vice President, International, from 2004 to October 2010.
2011 67
Joseph P. Portera Executive Vice President, Chief Operating Officer, Eastern and CanadianDivisions. Mr. Portera has held these positions since 1994 and has been theChief Diversity Officer since 2010.
1994 68
Timothy L. Rose Executive Vice President, Ancillary Businesses, Manufacturing, and BusinessCenters. Mr. Rose was Senior Vice President, Merchandising, Food andSundries and Private Label, from 1995 to December 2012.
2013 68
Ron M. Vachris Executive Vice President, Chief Operating Officer, Merchandising. Mr. Vachriswas Senior Vice President, Real Estate Development, from August 2015 toJune 2016, and Senior Vice President, General Manager, Northwest Region,from 2010 to July 2015.
2016 55
7

Item 1A—Risk Factors
The risks described below could materially and adversely affect our business, financial condition and results of operations. We could also be affected byadditional risks that apply to all companies operating in the U.S. and globally, as well as other risks that are not presently known to us or that we currentlyconsider to be immaterial. These Risk Factors should be carefully reviewed in conjunction with Management's Discussion and Analysis of FinancialCondition and Results of Operations in Item 7 and our consolidated financial statements and related notes in Item 8 of this Report.
Business and Operating RisksWe are highly dependent on the financial performance of our U.S. and Canadian operations.
Our financial and operational performance is highly dependent on our U.S. and Canadian operations, which comprised 87% and 83% of net sales andoperating income in 2020, respectively. Within the U.S., we are highly dependent on our California operations, which comprised 29% of U.S. net sales in2020. Our California market, in general, has a larger percentage of higher volume warehouses as compared to our other domestic markets. Anysubstantial slowing or sustained decline in these operations could materially adversely affect our business and financial results. Declines in financialperformance of our U.S. operations, particularly in California, and our Canadian operations could arise from, among other things: slow growth or declinesin comparable warehouse sales (comparable sales); negative trends in operating expenses, including increased labor, healthcare and energy costs;failing to meet targets for warehouse openings; cannibalizing existing locations with new warehouses; shifts in sales mix toward lower gross marginproducts; changes or uncertainties in economic conditions in our markets, including higher levels of unemployment and depressed home values; andfailing to consistently provide high quality and innovative new products.
We may be unsuccessful implementing our growth strategy, including expanding our business in existing markets and new markets, andintegrating acquisitions, which could have an adverse impact on our business, financial condition and results of operations.
Our growth is dependent, in part, on our ability to acquire property and build or lease new warehouses and depots. We compete with other retailers andbusinesses for suitable locations. Local land use and other regulations restricting the construction and operation of our warehouses and depots, as wellas local community actions opposed to the location of our warehouses or depots at specific sites and the adoption of local laws restricting our operationsand environmental regulations, may impact our ability to find suitable locations and increase the cost of sites and of constructing, leasing and operatingwarehouses and depots. We also may have difficulty negotiating leases or purchase agreements on acceptable terms. In addition, certain jurisdictionshave enacted or proposed laws and regulations that would prevent or restrict the operation or expansion plans of certain large retailers and warehouseclubs, including us. Failure to effectively manage these and other similar factors may affect our ability to timely build or lease and operate newwarehouses and depots, which could have a material adverse effect on our future growth and profitability.
We seek to expand in existing markets to attain a greater overall market share. A new warehouse may draw members away from our existingwarehouses and adversely affect their comparable sales performance, member traffic, and profitability.
We intend to continue to open warehouses in new markets. Associated risks include difficulties in attracting members due to a lack of familiarity with us,attracting members of other wholesale club operators, our lesser familiarity with local member preferences, and seasonal differences in the market. Entryinto new markets may bring us into competition with new competitors or with existing competitors with a large, established market presence. We cannotensure that new warehouses and new e-commerce websites will be profitable and, as a result, future profitability could be delayed or otherwise materiallyadversely affected.
We have made and may continue to make investments and acquisitions to improve the speed, accuracy and efficiency of our supply chains. Theeffectiveness of these investments can be less predictable than opening new locations and might not provide the anticipated benefits or desired rates ofreturn.
Our failure to maintain membership growth, loyalty and brand recognition could adversely affect our results of operations.
Membership loyalty and growth are essential to our business. The extent to which we achieve growth in our membership base, increase the penetrationof Executive members, and sustain high renewal rates materially influences our profitability. Damage to our brands or reputation may negatively impactcomparable sales, diminish member trust, and reduce renewal rates and, accordingly, net sales and membership fee revenue, negatively impacting ourresults of operations.
We sell many products under our Kirkland Signature brand. Maintaining consistent product quality, competitive pricing, and availability of these products isessential to developing and maintaining member loyalty. These products also generally carry higher margins than national brand products and representa growing portion of our overall sales. If the Kirkland Signature brand experiences a loss of member acceptance or confidence, our sales and grossmargin results could be adversely affected.
Disruptions in merchandise distribution or processing, packaging, manufacturing, and other facilities could adversely affect sales andmember satisfaction.
We depend on the orderly operation of the merchandise receiving and distribution process, primarily through our depots. We also rely upon processing,packaging, manufacturing and other facilities to support our business, which includes the production of certain private-label items. Although we believethat our operations are efficient, disruptions due to fires, tornadoes, hurricanes, earthquakes, pandemics or other extreme weather conditions orcatastrophic events, labor issues or other shipping problems may result in delays in the production and delivery of merchandise to our warehouses, whichcould adversely affect sales and the satisfaction of our members. Our e-commerce business depends heavily on third-party logistics providers and thatbusiness is negatively affected when these providers are unable to provide services in a timely fashion.
We may not timely identify or effectively respond to consumer trends, which could negatively affect our relationship with our members, thedemand for our products and services, and our market share.
It is difficult to consistently and successfully predict the products and services that our members will desire. Our success depends, in part, on our ability toidentify and respond to trends in demographics and consumer preferences. Failure to identify timely or effectively respond to changing consumer tastes,preferences (including those relating to sustainability of product sources and animal welfare) and spending patterns could negatively affect ourrelationship with our members, the demand for our products and services, and our market share. If we are not successful at predicting our sales trendsand adjusting our purchases accordingly, we may have excess inventory, which could result in additional markdowns, or we may experience out-of-stockpositions and delivery delays, which could result in higher costs, both of which would reduce our operating performance. This could have an adverseeffect on net sales, gross margin and operating income.
Availability and performance of our information technology (IT) systems are vital for our business to operate efficiently. Failure to executecomplex IT projects, and have these IT systems available to our business will adversely impact our operations.
IT systems play a crucial role in conducting our business on a daily basis. These systems are utilized to process a very high volume of transactions,conduct payment transactions, track and value our inventory and produce reports which are critical for making business decisions on a daily, weekly andperiodic basis. Failure or disruption of these IT systems could have an adverse impact on our ability to buy products from our suppliers, produce goods inour manufacturing plants, move the products in an efficient manner to our warehouses and sell products to our members. We are undertaking largetechnology and IT transformation projects. The failure of these projects could adversely impact our business plans and

potentially impair our day to day business operations. Given the high volume of transactions we process, it is important that we build strong digitalresiliency for our business-critical systems to prevent disruption from events such as power outages, computer and telecommunications failures,computer viruses, internal or external security breaches, errors by employees, and catastrophic events such as fires, earthquakes tornadoes andhurricanes. Any debilitating failure of our critical IT systems, data centers and backup systems would require significant investments in resources torestore IT services and may cause serious impairment in our business operations including loss of business services, increased cost of movingmerchandise and failure to provide service to our members. We are currently making significant investments in enhancing our digital resiliency and failureor delay in execution of these projects could delay our ability to be resilient to disruptive events. Failure to deliver our IT transformation efforts efficientlyand effectively could result in the loss of our competitive position and adversely impact our financial condition and results of operations.
We are required to maintain the privacy and security of personal and business information amidst evolving threat landscapes and incompliance with emerging privacy and data protection regulations globally. Failure to meet the requirements could damage our reputationwith members, suppliers and employees, cause us to incur substantial additional costs, and become subject to litigation.
Increased IT security threats and more sophisticated computer crime pose a risk to our systems, networks, products and services. We rely upon ITsystems and networks, some of which are managed by third parties, in connection with a variety of business activities. Additionally, we collect, store andprocess sensitive information relating to our business, members, suppliers and employees. Operating these IT systems and networks, and processingand maintaining this data, in a secure manner, is critical to our business operations and strategy. The increased use of remote work infrastructure due tothe COVID-19 pandemic has also increased the possible attack surfaces. Security threats designed to gain unauthorized access to our systems,networks and data, are increasing in frequency and sophistication. Cybersecurity attacks may range from random attempts to coordinated and targetedattacks, including sophisticated computer crimes and advanced persistent threats. These threats pose a risk to the security of our systems and networksand the confidentiality, integrity, and availability of our data. It is possible that our IT systems and networks, or those managed by third parties such ascloud providers, could have vulnerabilities, which could go unnoticed for a period of time. While our cybersecurity and compliance posture seeks tomitigate such risks, there can be no guarantee that the actions and controls we and our third-party service providers have implemented and areimplementing, will be sufficient to protect our systems, information or other property.
The potential impacts of a future material cybersecurity attack includes reputational damage, litigation, government enforcement actions, penalties,disruption to systems, unauthorized release of confidential or otherwise protected information, corruption of data, diminution in the value of our investmentin IT systems and increased cybersecurity protection and remediation costs. This could adversely affect our competitiveness, results of operations andfinancial condition and loss of member confidence. Further, the amount of insurance coverage we maintain may be inadequate to cover claims orliabilities relating to a cybersecurity attack. In addition, data we collect, store and process is subject to a variety of U.S. and international laws andregulations, such as the European Union's General Data Protection Regulation, California Consumer Privacy Act, Health Insurance Portability andAccountability Act, China cybersecurity law and other emerging privacy and cybersecurity laws across the various states and around the globe, whichmay carry significant potential penalties for noncompliance.
We are subject to payment-related risks.
We accept payments using a variety of methods, including select credit and debit cards, cash and checks, co-brand cardholder rebates, executivemember 2% reward certificates, and our shop card. As we offer new payment options to our members, we may be subject to additional rules, regulations,compliance requirements, and higher fraud losses. For certain payment methods, we pay interchange and other related acceptance fees, along withadditional transaction processing fees. We rely on third parties to

provide payment transaction processing services for credit and debit cards and our shop card. It could disrupt our business if these parties becomeunwilling or unable to provide these services to us. We are also subject to evolving payment card association and network operating rules, including datasecurity rules, certification requirements and rules governing electronic funds transfers. For example, we are subject to Payment Card Industry DataSecurity Standards, which contain compliance guidelines and standards with regard to our security surrounding the physical and electronic storage,processing and transmission of individual cardholder data. If our internal systems are breached or compromised, we may be liable for card re-issuancecosts, subject to fines and higher transaction fees and lose our ability to accept card payments from our members, and our business and operating resultscould be adversely affected.
We might sell products that cause illness or injury to our members, harm to our reputation, and expose us to litigation.
If our merchandise, including food and prepared food products for human consumption, drugs, children 's products, pet products and durable goods, donot meet or are perceived not to meet applicable safety standards or our members' expectations regarding safety, we could experience lost sales,increased costs, litigation or reputational harm. The sale of these items involves the risk of illness or injury to our members. Such illnesses or injuriescould result from tampering by unauthorized third parties, product contamination or spoilage, including the presence of foreign objects, substances,chemicals, other agents, or residues introduced during the growing, manufacturing, storage, handling and transportation phases, or faulty design. Oursuppliers are generally contractually required to comply with product safety laws, and we are dependent on them to ensure that the products we buycomply with safety and other standards. While we are subject to governmental inspection and regulations and work to comply in all material respects withapplicable laws and regulations, we cannot be sure that consumption or use of our products will not cause illness or injury or that we will not be subject toclaims, lawsuits, or government investigations relating to such matters, resulting in costly product recalls and other liabilities that could adversely affectour business and results of operations. Even if a product liability claim is unsuccessful or is not fully pursued, negative publicity could adversely affect ourreputation with existing and potential members and our corporate and brand image, and these effects could be long-term.
If we do not successfully develop and maintain a relevant omnichannel experience for our members, our results of operations could beadversely impacted.
Omnichannel retailing is rapidly evolving, and we must keep pace with changing member expectations and new developments by our competitors. Ourmembers are increasingly using mobile phones, tablets, computers, and other devices to shop and to interact with us through social media, particularly inthe wake of COVID-19. We are making investments in our websites and mobile applications. If we are unable to make, improve, or develop relevantmember-facing technology in a timely manner, our ability to compete and our results of operations could be adversely affected.
Inability to attract, train and retain highly qualified employees could adversely impact our business, financial condition and results ofoperations.
Our success depends on the continued contributions of our employees, including members of our senior management and other key operations, IT,merchandising and administrative personnel. Failure to identify and implement a succession plan for senior management could negatively impact ourbusiness. We must attract, train and retain a large and growing number of qualified employees, while controlling related labor costs and maintaining ourcore values. Our ability to control labor and benefit costs is subject to numerous internal and external factors, including regulatory changes, prevailingwage rates, and healthcare and other insurance costs. We compete with other retail and non-retail businesses for these employees and invest significantresources in training and motivating them. There is no assurance that we will be able to attract or retain highly qualified employees in the future, whichcould have a material adverse effect on our business, financial condition and results of operations.

We may incur property, casualty or other losses not covered by our insurance.
Claims for employee health care benefits, workers’ compensation, general liability, property damage, directors’ and officers’ liability, vehicle liability,inventory loss, and other exposures are funded predominantly through self-insurance. Insurance coverage is maintained in certain instances to limitexposures arising from very large losses. The types and amounts of insurance may vary from time to time based on our decisions with respect to riskretention and regulatory requirements. Significant claims or events, regulatory changes, a substantial rise in costs of health care or costs to maintain ourinsurance or the failure to maintain adequate insurance coverage could have an adverse impact on our financial condition and results of operations.
Although we maintain specific coverages for catastrophic property losses, we still bear a significant portion of the risk of losses incurred as a result of anyphysical damage to, or the destruction of, any warehouses, depots, manufacturing or home office facilities, loss or spoilage of inventory, and businessinterruption. Such losses could materially impact our cash flows and results of operations.
Market and Other External Risks
We face strong competition from other retailers and warehouse club operators, which could adversely affect our business, financial conditionand results of operations.
The retail business is highly competitive. We compete for members, employees, sites, products and services and in other important respects with a widerange of local, regional and national wholesalers and retailers, both in the United States and in foreign countries, including other warehouse-cluboperators, supermarkets, supercenters, internet retailers, gasoline stations, hard discounters, department and specialty stores and operators selling asingle category or narrow range of merchandise. Such retailers and warehouse club operators compete in a variety of ways, including pricing, selectionand availability, services, location, convenience, store hours, and the attractiveness and ease of use of websites and mobile applications. The evolutionof retailing in online and mobile channels has improved the ability of customers to comparison shop, which has enhanced competition. Some competitorsmay have greater financial resources and technology capabilities, better access to merchandise, and greater market penetration than we do. Our inabilityto respond effectively to competitive pressures, changes in the retail markets and customer expectations could result in lost market share and negativelyaffect our financial results.
General economic factors, domestically and internationally, may adversely affect our business, financial condition, and results of operations.
Higher energy and gasoline costs, inflation, levels of unemployment, healthcare costs, consumer debt levels, foreign-currency exchange rates, unsettledfinancial markets, weaknesses in housing and real estate markets, reduced consumer confidence, changes and uncertainties related to government fiscaland tax policies including changes in tax rates, duties, tariffs, or other restrictions, sovereign debt crises, pandemics and other health crises, and othereconomic factors could adversely affect demand for our products and services, require a change in product mix, or impact the cost of or ability topurchase inventory. Additionally, actions in various countries, particularly China and the United States, have raised the cost of many items and createduncertainty with respect to tariff impacts on the costs of some of our merchandise. The degree of our exposure is dependent on (among other things) thetype of goods, rates imposed, and timing of the tariffs. The impact to our business, including net sales and gross margin, will be influenced in part bymerchandising and pricing strategies in response to potential cost increases by us and our competitors. While these potential impacts are uncertain, theycould have an adverse impact on our financial results.
Prices of certain commodities, including gasoline and consumable goods used in manufacturing and our warehouse retail operations, are historicallyvolatile and are subject to fluctuations arising from changes in domestic and international supply and demand, labor costs, competition, marketspeculation, government regulations, taxes and periodic delays in delivery. Rapid and significant changes in commodity prices and
our ability and desire to pass them through to our members may affect our sales and profit margins. These factors could also increase our merchandisecosts and selling, general and administrative expenses, and otherwise adversely affect our operations and financial results. General economic conditionscan also be affected by events like the outbreak of war or acts of terrorism.
Suppliers may be unable to timely supply us with quality merchandise at competitive prices or may fail to adhere to our high standards,resulting in adverse effects on our business, merchandise inventories, sales, and profit margins.
We depend heavily on our ability to purchase quality merchandise in sufficient quantities at competitive prices. As the quantities we require continue togrow, we have no assurances of continued supply, appropriate pricing or access to new products, and any supplier has the ability to change the termsupon which they sell to us or discontinue selling to us. Member demands may lead to out-of-stock positions causing a loss of sales and profits.
We buy from numerous domestic and foreign manufacturers and importers. Our inability to acquire suitable merchandise on acceptable terms or the lossof key suppliers could negatively affect us. We may not be able to develop relationships with new suppliers, and products from alternative sources, if any,may be of a lesser quality or more expensive. Because of our efforts to adhere to high quality standards for which available supply may be limited,particularly for certain food items, the large volumes we demand may not be consistently available.
Our suppliers (and those they depend upon for materials and services) are subject to risks, including labor disputes, union organizing activities, financialliquidity, natural disasters, extreme weather conditions, public health emergencies, supply constraints and general economic and political conditions thatcould limit their ability to timely provide us with acceptable merchandise. One or more of our suppliers might not adhere to our quality control, legal,regulatory, labor, environmental or animal welfare standards. These deficiencies may delay or preclude delivery of merchandise to us and might not beidentified before we sell such merchandise to our members. This failure could lead to recalls and litigation and otherwise damage our reputation and ourbrands, increase costs, and otherwise adversely impact our business.
Fluctuations in foreign exchange rates may adversely affect our results of operations.
During 2020, our international operations, including Canada, generated 27% and 33% of our net sales and operating income, respectively. Ourinternational operations have accounted for an increasing portion of our warehouses, and we plan to continue international growth. To prepare ourconsolidated financial statements, we translate the financial statements of our international operations from local currencies into U.S. dollars usingcurrent exchange rates. Future fluctuations in exchange rates that are unfavorable to us may adversely affect the financial performance of our Canadianand Other International operations and have a corresponding adverse period-over-period effect on our results of operations. As we continue to expandinternationally, our exposure to fluctuations in foreign exchange rates may increase.
A portion of the products we purchase is paid for in a currency other than the local currency of the country in which the goods are sold. Currencyfluctuations may increase our cost of goods and may not be passed on to members. Consequently, fluctuations in currency exchange rates mayadversely affect our results of operations.
Natural disasters, extreme weather conditions, public health emergencies or other catastrophic events could negatively affect our business,financial condition, and results of operations.
Natural disasters and extreme weather conditions, such as hurricanes, typhoons, floods, earthquakes; acts of terrorism or violence, including activeshooter situations; public health issues, including pandemics and quarantines, particularly in California or Washington state, where our centralizedoperating systems and administrative personnel are located, could negatively affect our operations and financial performance. Such events could result inphysical damage to our properties, limitations on store operating hours, less frequent visits by members to physical locations, the temporary closure ofwarehouses,
depots, manufacturing or home office facilities, the temporary lack of an adequate work force, disruptions to our IT systems, the temporary or long-termdisruption in the supply of products from some local or overseas suppliers, the temporary disruption in the transport of goods to or from overseas, delaysin the delivery of goods to our warehouses or depots, and the temporary reduction in the availability of products in our warehouses. Public health issues,whether occurring in the U.S. or abroad, could disrupt our operations, disrupt the operations of suppliers or members, or have an adverse impact onconsumer spending and confidence levels. These events could also reduce demand for our products or make it difficult or impossible to procure products.We may be required to suspend operations in some or all of our locations, which could have a material adverse effect on our business, financial conditionand results of operations.
The COVID-19 pandemic is affecting our business, financial condition and results of operations in many respects.
The continuing impacts of the COVID-19 pandemic are highly unpredictable and volatile, and are affecting certain business operations, demand for ourproducts and services, in-stock positions, costs of doing business, availability of labor, access to inventory, supply chain operations, our ability to predictfuture performance, exposure to litigation, and our financial performance, among other things.
The COVID-19 pandemic has resulted in widespread and continuing impacts on the global economy and on our employees, members, suppliers andother people and entities with which we do business. There is considerable uncertainty regarding the extent to which COVID-19 will continue to spreadand the extent and duration of measures to try to contain the virus, such as travel bans and restrictions, quarantines, shelter-in-place orders and businessand government shutdowns. We are taking precautionary measures intended to help minimize the risk of the virus to our employees, includingtemporarily requiring some employees to work remotely. To reward our employees for exemplary service in difficult times we temporarily increasedcompensation levels and otherwise incurred increased spending for wages and benefits, including overtime pay. The pandemic and any preventative orprotective actions that governments or we may take are likely to result in a period of business disruption, reduced member traffic and reduced sales incertain merchandise categories, and increased operating expenses.
The pandemic has significantly impacted the global supply chain, with restrictions and limitations on business activities causing disruption and delay.These disruptions and delays have strained certain domestic and international supply chains, which have affected and could continue to negatively affectthe flow or availability of certain products. Member demand for certain products has also fluctuated as the pandemic has progressed and memberbehaviors have changed, which has challenged our ability to anticipate and/or adjust inventory levels to meet that demand. These factors have resulted inhigher out-of-stock positions in certain products, as well as delays in delivering those products. Even if we are able to find alternate sources for certainproducts, they may cost more or require us to incur higher transportation costs, adversely impacting our profitability and financial condition. Similarly,increased demand for online purchases of products has impacted our fulfillment operations, resulting in delays in delivering products to members.
If we do not respond appropriately to the pandemic, or if our members do not participate in social distancing and other safety measures, the well-being ofour employees and members could be at risk, and a failure to appropriately respond, or the perception of an inadequate response, could causereputational harm to our brand and subject us to lost sales and claims from employees, members, suppliers, regulators or other parties. Additionally, afuture outbreak of confirmed cases of COVID-19 in our facilities could result in temporary or sustained workforce shortages or facility closures, whichwould negatively impact our business and results of operations. Some jurisdictions have taken measures intended to expand the availability of workerscompensation or to change the presumptions applicable to workers compensation measures. These actions may increase our exposure to claims andincrease our costs.
In an effort to strengthen our liquidity position, during the year we issued $4,000 million Senior Notes, a portion of which was used to repay, prior tomaturity, $1,500 million of our 2.150% and 2.250% Senior Notes. Financial and credit markets have experienced and may continue to experiencesignificant volatility and turmoil. Our continued access to external sources of liquidity depends on multiple factors, including the condition of debt capitalmarkets, our operating performance, and maintaining strong credit ratings. If the impacts of the pandemic continue to disrupt the financial markets, or ifrating agencies lower our credit ratings, it could adversely affect our ability to access the debt markets, our cost of funds, and other terms for new debt orother sources of external liquidity, if needed.
Other factors and uncertainties include, but are not limited to:
• The severity and duration of the pandemic, including whether there is a “second wave” caused by additional periods of increases or spikes in thenumber of COVID-19 cases, future mutations or related strains of the virus in areas in which we operate;
• Evolving macroeconomic factors, including general economic uncertainty, unemployment rates, and recessionary pressures;• Unknown consequences on our business performance and initiatives stemming from the substantial investment of time and other resources to
the pandemic response;• The pace of recovery when the pandemic subsides; and• The long-term impact of the pandemic on our business, including consumer behaviors.
To the extent that COVID-19 continues to adversely affect the U.S. and global economy, our business, results of operations, cash flows, or financialcondition, it may also heighten other risks described in this section, including but not limited to those related to consumer behavior and expectations,competition, brand reputation, implementation of strategic initiatives, cybersecurity threats, payment-related risks, technology systems disruption, supplychain disruptions, labor availability and cost, litigation, operational risk as a result of remote work arrangements and regulatory requirements.
Factors associated with climate change could adversely affect our business.
We use natural gas, diesel fuel, gasoline, and electricity in our distribution and warehouse operations. Government regulations limiting carbon dioxideand other greenhouse gas emissions may increase compliance and merchandise costs, and other regulation affecting energy inputs could materiallyaffect our profitability. Climate change, extreme weather conditions, and rising sea levels could affect our ability to procure commodities at costs and inquantities we currently experience. We also sell a substantial amount of gasoline, the demand for which could be impacted by concerns about climatechange and which face increased regulation.
Failure to meet financial market expectations could adversely affect the market price and volatility of our stock.
We believe that the price of our stock currently reflects high market expectations for our future operating results. Any failure to meet or delay in meetingthese expectations, including our warehouse and e-commerce comparable sales growth rates, membership renewal rates, new member sign-ups, grossmargin, earnings, earnings per share, new warehouse openings, or dividend or stock repurchase policies could cause the market price of our stock todecline.
Legal and Regulatory Risks
We are subject to risks associated with the legislative, judicial, accounting, regulatory, political and economic factors specific to the countriesor regions in which we operate, which could adversely affect our business, financial condition and results of operations.
At the end of 2020, we operated 243 warehouses outside of the U.S., and we plan to continue expanding our international operations. Future operatingresults internationally could be negatively affected by a variety of factors, many similar to those we face in the U.S., certain of which are beyond ourcontrol.
These factors include political and economic conditions, regulatory constraints, currency regulations, policy changes such as the withdrawal of the U.K.from the European Union, and other matters in any of the countries or regions in which we operate, now or in the future. Other factors that may impactinternational operations include foreign trade (including tariffs and trade sanctions), monetary and fiscal policies and the laws and regulations of the U.S.and foreign governments, agencies and similar organizations, and risks associated with having major facilities in locations which have been historicallyless stable than the U.S. Risks inherent in international operations also include, among others, the costs and difficulties of managing internationaloperations, adverse tax consequences, and difficulty in enforcing intellectual property rights.
We are exposed to risks relating to evaluations of controls required by Section 404 of the Sarbanes-Oxley Act.
Section 404 of the Sarbanes-Oxley Act of 2002 requires management assessments of the effectiveness of internal control over financial reporting anddisclosure controls and procedures. If we are unable to maintain effective internal control over financial reporting or disclosure controls and procedures,our ability to record, process and report financial information accurately and to prepare financial statements within required time periods could beadversely affected, which could subject us to litigation or investigations requiring management resources and payment of legal and other expenses,negatively affect investor confidence in our financial statements and adversely impact our stock price.
Changes in accounting standards and subjective assumptions, estimates and judgments by management related to complex accountingmatters could significantly affect our financial condition and results of operations.
Accounting principles and related pronouncements, implementation guidelines, and interpretations we apply to a wide range of matters that are relevantto our business, including self-insurance liabilities, are highly complex and involve subjective assumptions, estimates and judgments by our management.Changes in rules or interpretation or changes in underlying assumptions, estimates or judgments by our management could significantly change ourreported or expected financial performance and have a material impact on our consolidated financial statements.
We could be subject to additional tax liabilities.
We are subject to a variety of taxes and tax collection and remittance obligations in the U.S. and numerous foreign jurisdictions. Additionally, at any pointin time, we may be under examination for value added, sales-based, payroll, product, import or other non-income taxes. We may recognize additional taxexpense, be subject to additional tax liabilities, or incur losses and penalties, due to changes in laws, regulations, administrative practices, principles,assessments by authorities and interpretations related to tax, including tax rules in various jurisdictions. We compute our income tax provision based onenacted tax rates in the countries in which we operate. As tax rates vary among countries, a change in earnings attributable to the various jurisdictions inwhich we operate could result in an unfavorable change in our overall tax provision. Additionally, changes in the enacted tax rates or adverse outcomesin tax audits, including transfer pricing disputes, could have a material adverse effect on our financial condition and results of operations.
Significant changes in or failure to comply with regulations relating to the use, storage, discharge and disposal of hazardous materials,hazardous and non-hazardous wastes and other environmental matters could adversely impact our business, financial condition and resultsof operations.
We are subject to a wide and increasingly broad array of federal, state, regional, local and international laws and regulations relating to the use, storage,discharge and disposal of hazardous materials, hazardous and non-hazardous wastes and other environmental matters. Failure to comply with theselaws could result in harm to our members, employees or others, significant costs to satisfy environmental compliance, remediation or compensatoryrequirements, or the imposition of severe penalties or restrictions on operations by governmental agencies or courts that could adversely affect ourbusiness, financial condition and results of operations.
Operations at our facilities require the treatment and disposal of wastewater, stormwater and agricultural and food processing wastes, the use andmaintenance of refrigeration systems, including ammonia-based chillers, noise, odor and dust management, the operation of mechanized processingequipment, and other operations that potentially could affect the environment and public health and safety. Failure to comply with current and futureenvironmental, health and safety standards could result in the imposition of fines and penalties, illness or injury of our employees, and claims or lawsuitsrelated to such illnesses or injuries, and temporary closures or limits on the operations of facilities.
We are involved in a number of legal proceedings and audits and some of these outcomes could adversely affect our business, financialcondition and results of operations.
Our business requires compliance with many laws and regulations. Failure to achieve compliance could subject us to lawsuits and other proceedings,and lead to damage awards, fines, penalties, and remediation costs. We are or may become involved in a number of legal proceedings and audits,including grand jury investigations, government and agency investigations, and consumer, employment, tort, unclaimed property laws, and other litigation.We cannot predict with certainty the outcomes of these proceedings and other contingencies, including environmental remediation and other proceedingscommenced by governmental authorities. The outcome of some of these proceedings, audits, unclaimed property laws, and other contingencies couldrequire us to take, or refrain from taking, actions which could negatively affect our operations or could require us to pay substantial amounts of money,adversely affecting our financial condition and results of operations. Additionally, defending against these lawsuits and proceedings may involvesignificant expense and diversion of management's attention and resources.
Item 1B—Unresolved Staff Comments
None.
Item 2—Properties
Warehouse Properties
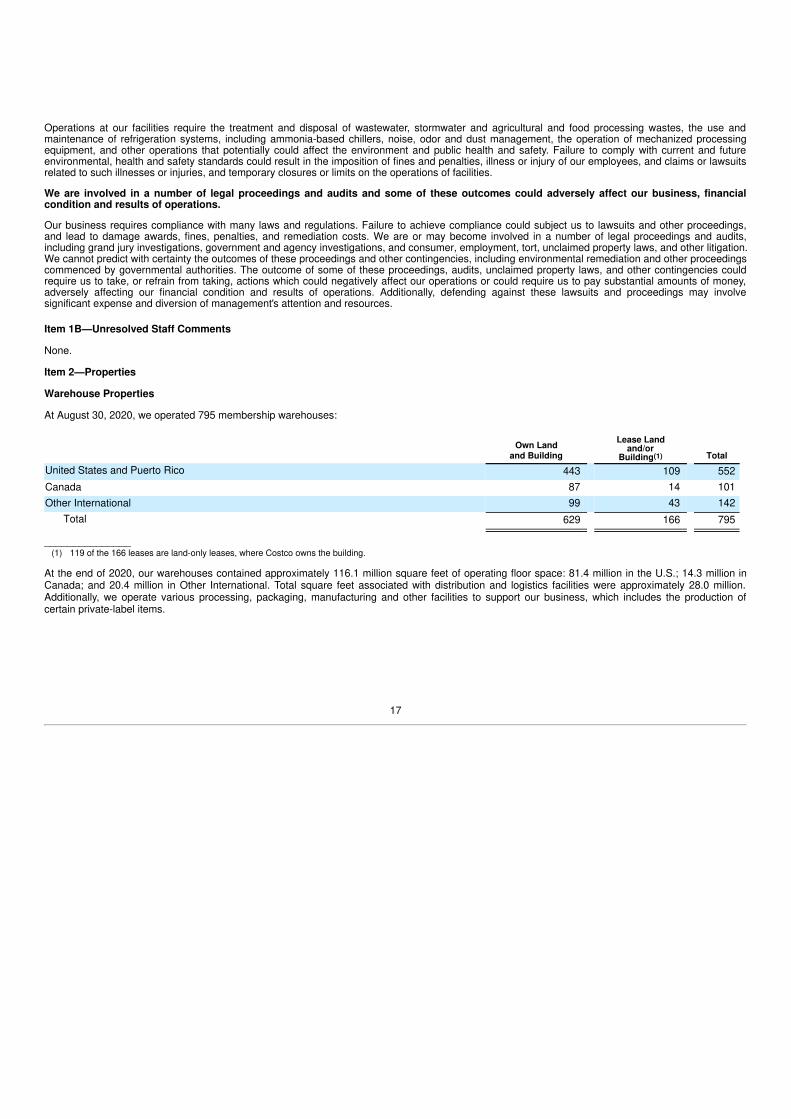
At August 30, 2020, we operated 795 membership warehouses:
Own Landand Building
Lease Landand/or
Building(1) Total
United States and Puerto Rico 443 109 552 Canada 87 14 101 Other International 99 43 142
Total 629 166 795
_______________(1) 119 of the 166 leases are land-only leases, where Costco owns the building.
At the end of 2020, our warehouses contained approximately 116.1 million square feet of operating floor space: 81.4 million in the U.S.; 14.3 million inCanada; and 20.4 million in Other International. Total square feet associated with distribution and logistics facilities were approximately 28.0 million.Additionally, we operate various processing, packaging, manufacturing and other facilities to support our business, which includes the production ofcertain private-label items.
17
Item 3—Legal Proceedings
See discussion of Legal Proceedings in Note 11 to the consolidated financial statements included in Item 8 of this Report.
Item 4—Mine Safety Disclosures
Not applicable.
PART II
Item 5—Market for Registrant’s Common Equity, Related Stockholder Matters and Issuer Purchases of Equity Securities
Market Information and Dividend Policy
Our common stock is traded on the NASDAQ Global Select Market under the symbol “COST.” On September 29, 2020, we had 9,690 stockholders ofrecord.
Payment of dividends is subject to declaration by the Board of Directors. Factors considered in determining dividends include our profitability andexpected capital needs. Subject to these qualifications, we presently expect to continue to pay dividends on a quarterly basis.
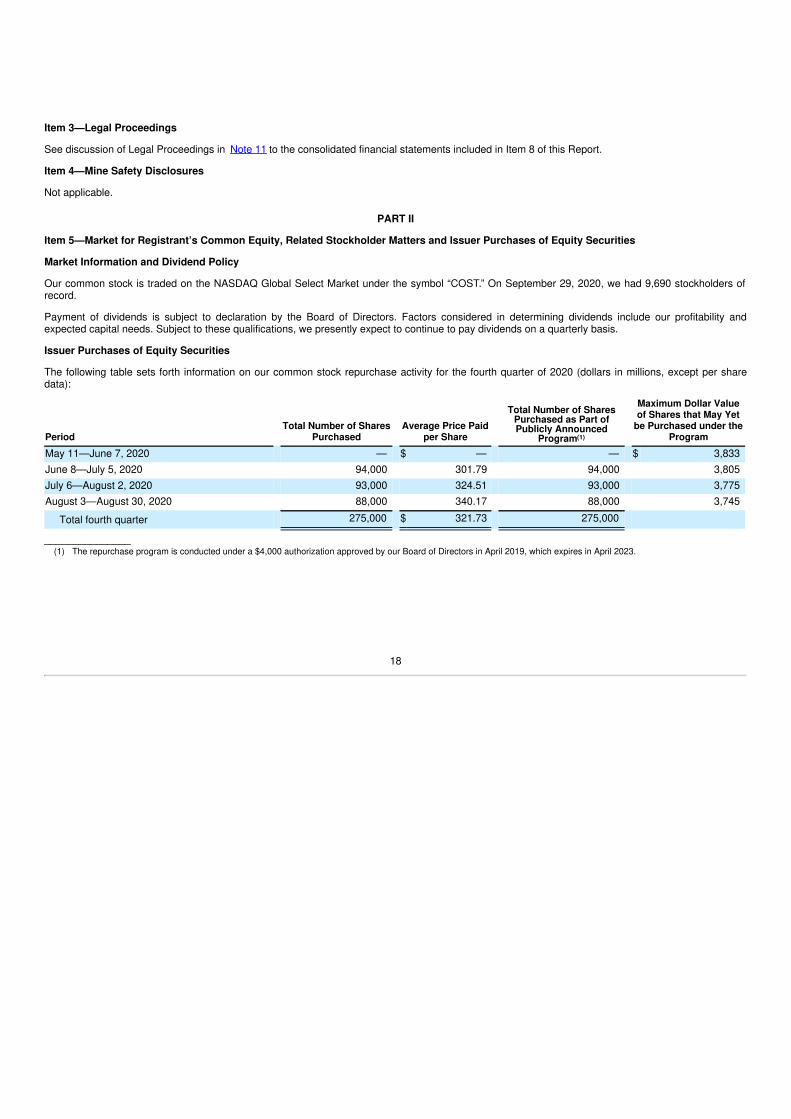
Issuer Purchases of Equity Securities
The following table sets forth information on our common stock repurchase activity for the fourth quarter of 2020 (dollars in millions, except per sharedata):
PeriodTotal Number of Shares
PurchasedAverage Price Paid
per Share
Total Number of SharesPurchased as Part ofPublicly Announced
Program(1)
Maximum Dollar Valueof Shares that May Yet
be Purchased under theProgram
May 11—June 7, 2020 — $ — — $ 3,833 June 8—July 5, 2020 94,000 301.79 94,000 3,805 July 6—August 2, 2020 93,000 324.51 93,000 3,775 August 3—August 30, 2020 88,000 340.17 88,000 3,745
Total fourth quarter 275,000 $ 321.73 275,000
_______________(1) The repurchase program is conducted under a $4,000 authorization approved by our Board of Directors in April 2019, which expires in April 2023.
18

Performance Graph
The following graph compares the cumulative total shareholder return (stock price appreciation and the reinvestment of dividends) on an investment of$100 in Costco common stock, S&P 500 Index, and the S&P 500 Retail Index over the five years from August 30, 2015, through August 30, 2020.cost-20200830_g1.jpg
Item 6—Selected Financial Data
The following graph provides information concerning average sales per warehouse over a 10 year period.
Average Sales Per Warehouse*(Sales In Millions)
Year Opened # of Whses2020 13 $ 132 2019 20 $ 129 $ 138 2018 21 $ 116 $ 119 $ 141 2017 26 $ 121 $ 142 $ 158 $ 176 2016 29 $ 87 $ 97 $ 118 $ 131 $ 145 2015 23 $ 83 $ 85 $ 94 $ 112 $ 122 $ 136 2014 30 $ 108 $ 109 $ 115 $ 125 $ 140 $ 144 $ 155 2013 26 $ 99 $ 109 $ 113 $ 116 $ 124 $ 137 $ 144 $ 158 2012 15 $ 105 $ 115 $ 124 $ 128 $ 130 $ 139 $ 152 $ 158 $ 173
2011 & Before 592 $ 146 $ 156 $ 164 $ 171 $ 171 $ 170 $ 176 $ 189 $ 196 $ 206 Totals 795 $ 146 $ 155 $ 160 $ 164 $ 162 $ 159 $ 163 $ 176 $ 182 $ 192
2011 2012 2013 2014 2015 2016 2017 2018 2019 2020Fiscal Year
*First year sales annualized.2012 and 2017 were 53-week fiscal years

The following table sets forth information concerning our consolidated financial condition, operating results, and key operating metrics. This informationshould be read in conjunction with Management’s Discussion and Analysis of Financial Condition and Results of Operations, included in Item 7 of thisReport, and our consolidated financial statements and notes thereto, included in Item 8 of this Report.
SELECTED FINANCIAL DATA(dollars in millions, except per share data)
Aug. 30, 2020 Sept. 1, 2019 Sept. 2, 2018 Sept. 3, 2017 Aug. 28, 2016As of and for the year ended (52 weeks) (52 weeks) (52 weeks) (53 weeks) (52 weeks)RESULTS OF OPERATIONS
Net sales $ 163,220 $ 149,351 $ 138,434 $ 126,172 $ 116,073 Membership fees 3,541 3,352 3,142 2,853 2,646 Gross margin(1) as a percentage of net sales 11.20 % 11.02 % 11.04 % 11.33 % 11.35 %Selling, general and administrative expenses as a
percentage of net sales 10.01 % 10.04 % 10.02 % 10.26 % 10.40 %Operating income $ 5,435 $ 4,737 $ 4,480 $ 4,111 $ 3,672 Net income attributable to Costco 4,002 3,659 3,134 2,679 2,350 Net income per diluted common share attributable to
Costco 9.02 8.26 7.09 6.08 5.33 Cash dividends declared per common share 2.70 2.44 2.14 8.90 1.70
Changes in comparable sales(2)
United States 8 % 8 % 9 % 4 % 1 %Canada 5 % 2 % 9 % 5 % (3)%Other International 9 % 2 % 11 % 2 % (3)%Total Company 8 % 6 % 9 % 4 % 0 %
Changes in Total Company comparable sales excluding theimpact of changes in foreign currency and gasoline prices (3) 9 % 6 % 7 % 4 % 4 %
BALANCE SHEET DATANet property and equipment $ 21,807 $ 20,890 $ 19,681 $ 18,161 $ 17,043 Total assets 55,556 45,400 40,830 36,347 33,163 Long-term debt, excluding current portion 7,514 5,124 6,487 6,573 4,061 Costco stockholders’ equity 18,284 15,243 12,799 10,778 12,079
WAREHOUSE INFORMATIONWarehouses in Operation
Beginning of year 782 762 741 715 686 Opened 16 25 25 28 33 Closed due to relocation (3) (5) (4) (2) (4)
End of year 795 782 762 741 715 MEMBERSHIP INFORMATION
Total paid members (000's) (4) 58,100 53,900 51,600 49,400 47,600 Total executive members (000's) (5) 22,600 20,800 19,300 18,500 17,400
______________
(1) Net sales less merchandise costs.(2) Includes net sales from warehouses and websites operating for more than one year. For 2017, the prior year includes the comparable 53 weeks.(3) Excluding the impact of the revenue recognition standard for the year ended September 1, 2019.(4) 2020 includes an additional 1.3 million due to standardizing our membership count methodology globally to be consistent with the U.S. and Canada. See Item 1.(5) Counts are included in total paid members
20
Item 7—Management's Discussion and Analysis of Financial Conditions and Results of Operations (amounts in millions, except per share, share,membership fee, and warehouse count data)
Overview
We believe that the most important driver of our profitability is increasing net sales, particularly comparable sales growth. Net sales includes our coremerchandise categories (food and sundries, hardlines, softlines, and fresh foods), warehouse ancillary and other businesses. We define comparablesales as net sales from warehouses open for more than one year, including remodels, relocations and expansions, and sales related to e-commercewebsites operating for more than one year. Comparable sales growth is achieved through increasing shopping frequency from new and existingmembers and the amount they spend on each visit (average ticket). Sales comparisons can also be particularly influenced by certain factors that arebeyond our control: fluctuations in currency exchange rates (with respect to the consolidation of the results of our international operations); and changesin the cost of gasoline and associated competitive conditions (primarily impacting our U.S. and Canadian operations). The higher our comparable salesexclusive of these items, the more we can leverage certain of our selling, general and administrative (SG&A) expenses, reducing them as a percentage ofsales and enhancing profitability. Generating comparable sales growth is foremost a question of making available to our members the right merchandiseat the right prices, a skill that we believe we have repeatedly demonstrated over the long-term. Another substantial factor in net sales growth is the healthof the economies in which we do business, including the effects of inflation or deflation, especially the United States. Net sales growth and gross marginsare also impacted by our competition, which is vigorous and widespread, across a wide range of global, national and regional wholesalers and retailers,including those with e-commerce operations. While we cannot control or reliably predict general economic health or changes in competition, we believethat we have been successful historically in adapting our business to these changes, such as through adjustments to our pricing and merchandise mix,including increasing the penetration of our private-label items and through online offerings.
Our philosophy is to provide our members with quality goods and services at competitive prices. We do not focus in the short-term on maximizing pricescharged, but instead seek to maintain what we believe is a perception among our members of our “pricing authority” on quality goods – consistentlyproviding the most competitive values. Our investments in merchandise pricing may include reducing prices on merchandise to drive sales or meetcompetition and holding prices steady despite cost increases instead of passing the increases on to our members, all negatively impacting gross marginas a percentage of net sales (gross margin percentage). We believe our gasoline business draws members, but it generally has a lower gross marginpercentage relative to our non-gasoline business. It also has lower SG&A expenses as a percent of net sales compared to our non-gasoline business. Ahigher penetration of gasoline sales will generally lower our gross margin percentage. Rapidly changing gasoline prices may significantly impact our near-term net sales growth. Generally, rising gasoline prices benefit net sales growth which, given the higher sales base, negatively impacts our gross marginpercentage but decreases our SG&A expenses as a percentage of net sales. A decline in gasoline prices has the inverse effect. Additionally, actions invarious countries, particularly China and the United States, have created uncertainty with respect to how tariffs will affect the costs of some of ourmerchandise. The degree of our exposure is dependent on (among other things) the type of goods, rates imposed, and timing of the tariffs. The impact toour net sales and gross margin will be influenced in part by our merchandising and pricing strategies in response to cost increases. While these potentialimpacts are uncertain, they could have an adverse impact on our results.
We also achieve net sales growth by opening new warehouses. As our warehouse base grows, available and desirable sites become more difficult tosecure, and square footage growth becomes a comparatively less substantial component of growth. The negative aspects of such growth, however,including lower initial operating profitability relative to existing warehouses and cannibalization of sales at existing warehouses when openings occur inexisting markets, are continuing to decline in significance as they relate to the results of our total operations. Our rate of operating floor space squarefootage growth is generally higher in foreign markets, due to the smaller base in those markets, and we expect that to

continue. Our e-commerce business growth, domestically and internationally, has also increased our sales but it generally has a lower gross marginpercentage relative to our warehouse business.
The membership format is an integral part of our business and has a significant effect on our profitability. This format is designed to reinforce memberloyalty and provide continuing fee revenue. The extent to which we achieve growth in our membership base, increase the penetration of our Executivemembers, and sustain high renewal rates materially influences our profitability. Our paid membership growth rate may be adversely impacted whenwarehouse openings occur in existing markets as compared to new markets.
Our financial performance depends heavily on controlling costs. While we believe that we have achieved successes in this area, some significant costsare partially outside our control, particularly health care and utility expenses. With respect to the compensation of our employees, our philosophy is not toseek to minimize their wages and benefits. Rather, we believe that achieving our longer-term objectives of reducing employee turnover and enhancingemployee satisfaction requires maintaining compensation levels that are better than the industry average for much of our workforce. This may cause us,for example, to absorb costs that other employers might seek to pass through to their workforces. Because our business operates on very low margins,modest changes in various items in the consolidated statements of income, particularly merchandise costs and selling, general and administrativeexpenses, can have substantial impacts on net income.
Our operating model is generally the same across our U.S., Canada, and Other International operating segments (see Note 12 to the consolidatedfinancial statements included in Item 8 of this Report). Certain countries in the Other International segment have relatively higher rates of square footagegrowth, lower wage and benefit costs as a percentage of country sales, less or no direct membership warehouse competition, and may lack an e-commerce business.
In discussions of our consolidated operating results, we refer to the impact of changes in foreign currencies relative to the U.S. dollar, which arereferences to the differences between the foreign-exchange rates we use to convert the financial results of our international operations from localcurrencies into U.S. dollars for financial reporting purposes. This impact of foreign-exchange rate changes is calculated based on the difference betweenthe current period's currency exchange rates and that of the comparable prior period. The impact of changes in gasoline prices on net sales is calculatedbased on the difference between the current period's average price per gallon sold and that of the comparable prior period.
Our fiscal year ends on the Sunday closest to August 31. References to 2020, 2019, and 2018 relate to the 52-week fiscal years ended August 30, 2020,September 1, 2019, and September 2, 2018, respectively. Certain percentages presented are calculated using actual results prior to rounding. Unlessotherwise noted, references to net income relate to net income attributable to Costco.
For discussion related to the results of operations and changes in financial condition for 2019 compared to 2018 refer to Part II, Item 7, Management'sDiscussion and Analysis of Financial Condition and Results of Operations in our fiscal year 2019 Form 10-K, which was filed with the United StatesSecurities and Exchange Commission on October 11, 2019.

Highlights for 2020 included:
• We opened 16 new warehouses, including 3 relocations: 9 new in the U.S., 3 new in our Other International segment, and 1 net new location in ourCanadian segment, compared to 25 new warehouses, including 5 relocations in 2019;
• Net sales increased 9% to $163,220 driven by a 8% increase in comparable sales and sales at new warehouses opened in 2019 and 2020;• Membership fee revenue increased 6% to $3,541, primarily due to membership sign-ups at existing and new warehouses;• Gross margin percentage increased 18 basis points, driven primarily by certain core merchandise categories, partially offset by certain ancillary and
other businesses, which were negatively impacted by COVID-19 related closures or restrictions;• SG&A expenses as a percentage of net sales decreased three basis points primarily due to leveraging increased sales and partial reversal of a
previous year tax assessment. These benefits were partially offset by incremental wage and sanitation costs as a result of COVID-19;• The effective tax rate in 2020 was 24.4% compared to 22.3% in 2019;• Net income increased 9% to $4,002, or $9.02 per diluted share compared to $3,659, or $8.26 per diluted share in 2019;• In February 2020, we acquired a 35% interest in Navitus Health Solutions, a pharmacy benefit manager. In March 2020, we acquired Innovel
Solutions, a company that provides final-mile delivery, installation and white-glove capabilities for big and bulky products across the United Statesand Puerto Rico;
• In April 2020, we issued $4,000 in aggregate principal amount of Senior Notes, some proceeds of which were used to repay $1,500 of Senior Notes;and
• In April 2020, the Board of Directors approved an increase in the quarterly cash dividend from $0.65 to $0.70 per share.
COVID-19
On March 11, 2020, the World Health Organization announced that COVID-19 infections had become a pandemic, and shortly afterward the U.S.declared a National Emergency. The outbreak has led to widespread and continuing impacts on the global economy and is affecting many aspects of ourbusiness and the operations of others with which we do business. In our response to the pandemic and in an effort to protect our members andemployees, we have taken several measures, as described in Item 1A Risk Factors, and their implications on our results of operations have impacted usacross all our reportable segments to varying degrees. Throughout the pandemic our warehouses have largely remained open as a result of beingdeemed an “essential business” in most markets and resulted in strong sales increases in our food and sundries and fresh foods merchandise categoriescompared to pre-pandemic time periods. This growth in certain of our core business categories has led to improved gross margin and SG&A percentagesas we leveraged these sales to achieve greater efficiency. Our e-commerce business has also benefited, as more members have shopped online duringthe pandemic. Conversely, we have experienced decreases in both the sales and profitability of many of our ancillary and other businesses due totemporary closures or limited demand. Additionally, we paid $564 in incremental wage and sanitation costs during 2020 related to COVID-19.
23

RESULTS OF OPERATIONS
Net Sales
2020 2019 2018
Net Sales $ 163,220 $ 149,351 $ 138,434 Changes in net sales:
U.S. 9 % 9 % 9 %Canada 5 % 3 % 10 %Other International 13 % 5 % 14 %Total Company 9 % 8 % 10 %
Changes in comparable sales:U.S. 8 % 8 % 9 %Canada 5 % 2 % 9 %Other International 9 % 2 % 11 %Total Company 8 % 6 % 9 %
Increases in comparable sales excluding the impact of changes in foreign currency andgasoline prices(1):
U.S. 9 % 6 % 7 %Canada 7 % 5 % 4 %Other International 11 % 6 % 7 %Total Company 9 % 6 % 7 %
_______________
(1) Excluding the impact of the revenue recognition standard for the year ended September 1, 2019.
Net Sales
Net sales increased $13,869 or 9% during 2020, primarily due to an 8% increase in comparable sales and sales at new warehouses opened in 2019 and2020. During the second half of 2020, we experienced a significant sales shift from certain of our ancillary and other businesses to our core merchandisecategories, primarily food and sundries and fresh foods, as a result of COVID-19. This shift was largely driven by price deflation and lower volume in ourgasoline business; temporary closures of most of our optical, hearing aid and photo departments; limited service in our food courts; and minimal demandin our travel business.
Changes in gasoline prices negatively impacted net sales by $1,504, or 101 basis points, compared to 2019, due to a 10% decrease in the average priceper gallon. The volume of gasoline sold decreased approximately 4%, negatively impacting net sales by $699, or 47 basis points. Changes in foreigncurrencies relative to the U.S. dollar negatively impacted net sales by approximately $663, or 44 basis points, compared to 2019, attributable to ourCanadian and Other International Operations.
Comparable Sales
Comparable sales increased 8% during 2020 and were positively impacted by increases in average ticket. While traffic increased slightly in 2020, itdecreased in the second half of the year due to capacity restrictions and regulations related to COVID-19. There was an increase of 50% in e-commercecomparable sales in 2020, with an increase of 80% in the second half of the year.
24
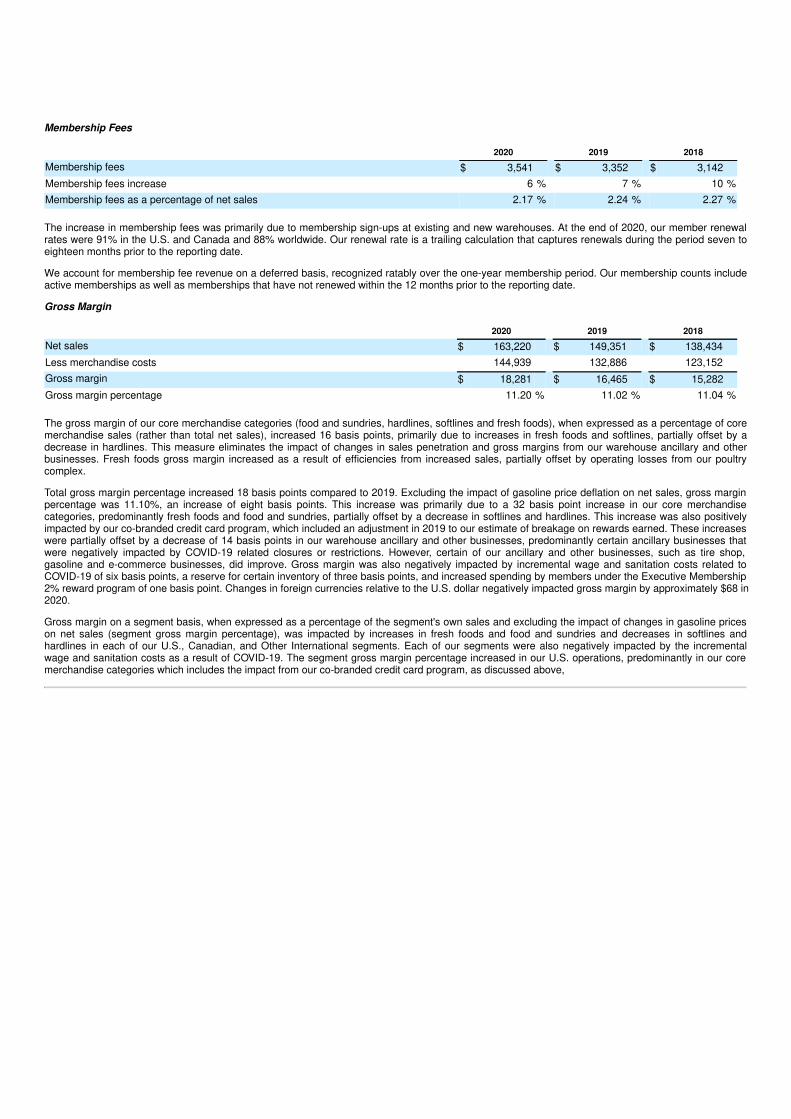
Membership Fees
2020 2019 2018
Membership fees $ 3,541 $ 3,352 $ 3,142 Membership fees increase 6 % 7 % 10 %Membership fees as a percentage of net sales 2.17 % 2.24 % 2.27 %
The increase in membership fees was primarily due to membership sign-ups at existing and new warehouses. At the end of 2020, our member renewalrates were 91% in the U.S. and Canada and 88% worldwide. Our renewal rate is a trailing calculation that captures renewals during the period seven toeighteen months prior to the reporting date.
We account for membership fee revenue on a deferred basis, recognized ratably over the one-year membership period. Our membership counts includeactive memberships as well as memberships that have not renewed within the 12 months prior to the reporting date.
Gross Margin
2020 2019 2018
Net sales $ 163,220 $ 149,351 $ 138,434 Less merchandise costs 144,939 132,886 123,152 Gross margin $ 18,281 $ 16,465 $ 15,282 Gross margin percentage 11.20 % 11.02 % 11.04 %
The gross margin of our core merchandise categories (food and sundries, hardlines, softlines and fresh foods), when expressed as a percentage of coremerchandise sales (rather than total net sales), increased 16 basis points, primarily due to increases in fresh foods and softlines, partially offset by adecrease in hardlines. This measure eliminates the impact of changes in sales penetration and gross margins from our warehouse ancillary and otherbusinesses. Fresh foods gross margin increased as a result of efficiencies from increased sales, partially offset by operating losses from our poultrycomplex.
Total gross margin percentage increased 18 basis points compared to 2019. Excluding the impact of gasoline price deflation on net sales, gross marginpercentage was 11.10%, an increase of eight basis points. This increase was primarily due to a 32 basis point increase in our core merchandisecategories, predominantly fresh foods and food and sundries, partially offset by a decrease in softlines and hardlines. This increase was also positivelyimpacted by our co-branded credit card program, which included an adjustment in 2019 to our estimate of breakage on rewards earned. These increaseswere partially offset by a decrease of 14 basis points in our warehouse ancillary and other businesses, predominantly certain ancillary businesses thatwere negatively impacted by COVID-19 related closures or restrictions. However, certain of our ancillary and other businesses, such as tire shop,gasoline and e-commerce businesses, did improve. Gross margin was also negatively impacted by incremental wage and sanitation costs related toCOVID-19 of six basis points, a reserve for certain inventory of three basis points, and increased spending by members under the Executive Membership2% reward program of one basis point. Changes in foreign currencies relative to the U.S. dollar negatively impacted gross margin by approximately $68 in2020.
Gross margin on a segment basis, when expressed as a percentage of the segment's own sales and excluding the impact of changes in gasoline priceson net sales (segment gross margin percentage), was impacted by increases in fresh foods and food and sundries and decreases in softlines andhardlines in each of our U.S., Canadian, and Other International segments. Each of our segments were also negatively impacted by the incrementalwage and sanitation costs as a result of COVID-19. The segment gross margin percentage increased in our U.S. operations, predominantly in our coremerchandise categories which includes the impact from our co-branded credit card program, as discussed above,
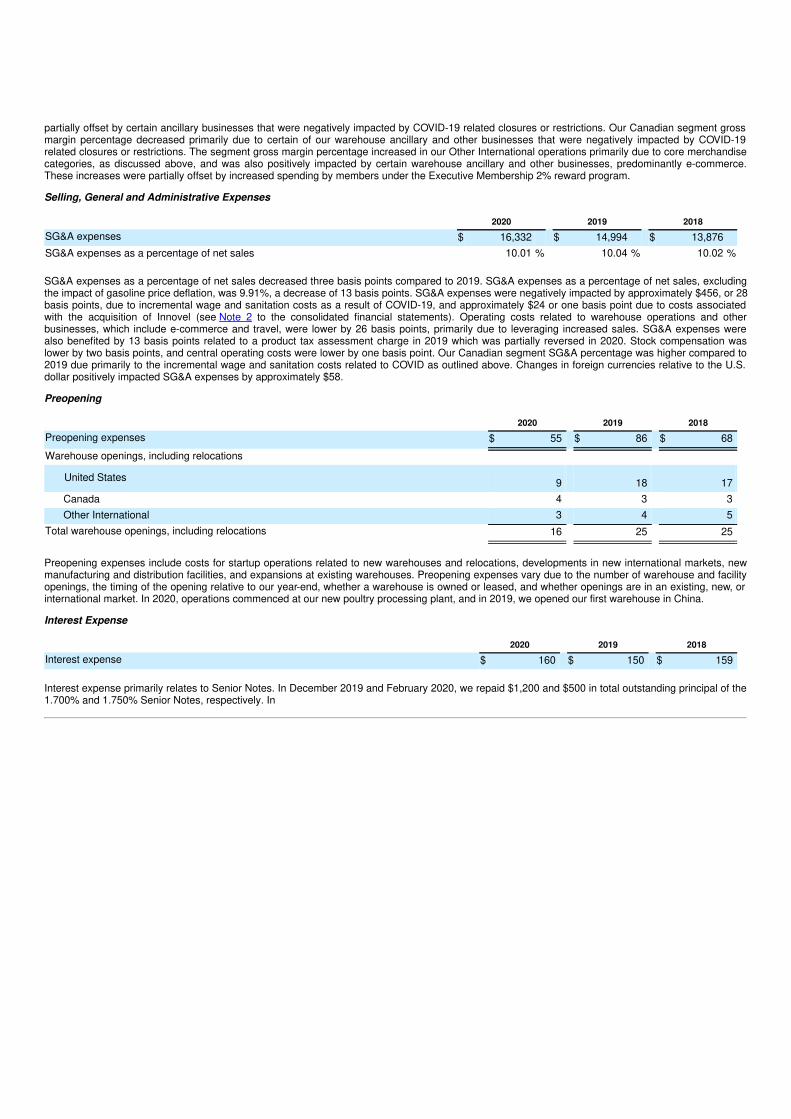
partially offset by certain ancillary businesses that were negatively impacted by COVID-19 related closures or restrictions. Our Canadian segment grossmargin percentage decreased primarily due to certain of our warehouse ancillary and other businesses that were negatively impacted by COVID-19related closures or restrictions. The segment gross margin percentage increased in our Other International operations primarily due to core merchandisecategories, as discussed above, and was also positively impacted by certain warehouse ancillary and other businesses, predominantly e-commerce.These increases were partially offset by increased spending by members under the Executive Membership 2% reward program.
Selling, General and Administrative Expenses
2020 2019 2018
SG&A expenses $ 16,332 $ 14,994 $ 13,876 SG&A expenses as a percentage of net sales 10.01 % 10.04 % 10.02 %
SG&A expenses as a percentage of net sales decreased three basis points compared to 2019. SG&A expenses as a percentage of net sales, excludingthe impact of gasoline price deflation, was 9.91%, a decrease of 13 basis points. SG&A expenses were negatively impacted by approximately $456, or 28basis points, due to incremental wage and sanitation costs as a result of COVID-19, and approximately $24 or one basis point due to costs associatedwith the acquisition of Innovel (see Note 2 to the consolidated financial statements). Operating costs related to warehouse operations and otherbusinesses, which include e-commerce and travel, were lower by 26 basis points, primarily due to leveraging increased sales. SG&A expenses werealso benefited by 13 basis points related to a product tax assessment charge in 2019 which was partially reversed in 2020. Stock compensation waslower by two basis points, and central operating costs were lower by one basis point. Our Canadian segment SG&A percentage was higher compared to2019 due primarily to the incremental wage and sanitation costs related to COVID as outlined above. Changes in foreign currencies relative to the U.S.dollar positively impacted SG&A expenses by approximately $58.
Preopening
2020 2019 2018
Preopening expenses $ 55 $ 86 $ 68 Warehouse openings, including relocations
United States 9 18 17 Canada 4 3 3 Other International 3 4 5
Total warehouse openings, including relocations 16 25 25
Preopening expenses include costs for startup operations related to new warehouses and relocations, developments in new international markets, newmanufacturing and distribution facilities, and expansions at existing warehouses. Preopening expenses vary due to the number of warehouse and facilityopenings, the timing of the opening relative to our year-end, whether a warehouse is owned or leased, and whether openings are in an existing, new, orinternational market. In 2020, operations commenced at our new poultry processing plant, and in 2019, we opened our first warehouse in China.
Interest Expense
2020 2019 2018
Interest expense $ 160 $ 150 $ 159
Interest expense primarily relates to Senior Notes. In December 2019 and February 2020, we repaid $1,200 and $500 in total outstanding principal of the1.700% and 1.750% Senior Notes, respectively. In

April 2020, we issued $4,000 in aggregate principal amount of long-term debt consisting of $ 1,250 of 1.375% Senior Notes due June 2027; $ 1,750 of1.600% Senior Notes due April 2030; and $ 1,000 of 1.750% Senior Notes due April 2032. A portion of the proceeds was used to repay, prior to maturity,$1,000 and $500 of the 2.150% and 2.250% Senior Notes. For more information on our debt arrangements refer to Note 5 to the consolidated financialstatements.
Interest Income and Other, Net
2020 2019 2018
Interest income $ 89 $ 126 $ 75 Foreign-currency transaction gains, net 7 27 23 Other, net (4) 25 23
Interest income and other, net $ 92 $ 178 $ 121
The decrease in interest income in 2020 was primarily due to lower interest rates in the U.S. and Canada, partially offset by higher average cash andinvestment balances. Foreign-currency transaction gains, net include the revaluation and settlement of monetary assets and liabilities and mark-to-market adjustments for forward foreign-exchange contracts by our Canadian and Other International operations. See Derivatives and Foreign Currencysections in Note 1 to the consolidated financial statements. Other, net was impacted by a $36 charge related to the repayment of certain Senior Notes, asdiscussed above and in Note 5.
Provision for Income Taxes
2020 2019 2018
Provision for income taxes $ 1,308 $ 1,061 $ 1,263 Effective tax rate 24.4 % 22.3 % 28.4 %
The effective tax rate for 2020 included discrete net tax benefits of $81, including a benefit of $77 due to excess tax benefits from stock compensation.Excluding these benefits, the tax rate was 25.9% for 2020.
The effective tax rate for 2019 included discrete net tax benefits of $221, including a benefit of $59 due to excess tax benefits from stock compensation.This also included a tax benefit of $105 related to U.S. taxation of deemed foreign dividends, offset by losses of foreign tax credits, which impacted theeffective tax rate. Excluding these benefits, the tax rate was 26.9% for 2019.
LIQUIDITY AND CAPITAL RESOURCES
The following table summarizes our significant sources and uses of cash and cash equivalents:
2020 2019 2018Net cash provided by operating activities $ 8,861 $ 6,356 $ 5,774 Net cash used in investing activities (3,891) (2,865) (2,947)Net cash used in financing activities (1,147) (1,147) (1,281)
Our primary sources of liquidity are cash flows generated from our operations, cash and cash equivalents, and short-term investments. Cash and cashequivalents and short-term investments were $13,305 and $9,444 at the end of 2020 and 2019, respectively. Of these balances, unsettled credit anddebit card receivables represented approximately $1,636 and $1,434 at the end of 2020 and 2019, respectively. These receivables generally settle withinfour days. Cash and cash equivalents were positively impacted by a change in exchange rates of $70 in 2020, and negatively impacted by $15 and $37 in2019 and 2018, respectively.
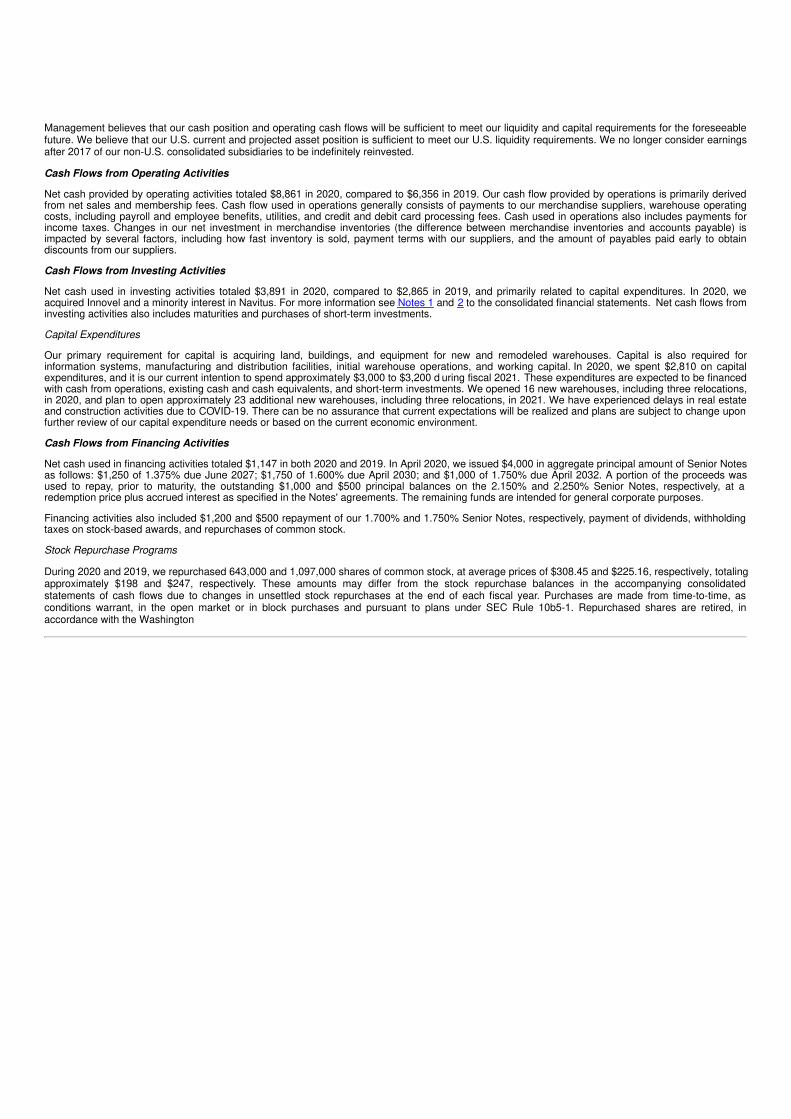
Management believes that our cash position and operating cash flows will be sufficient to meet our liquidity and capital requirements for the foreseeablefuture. We believe that our U.S. current and projected asset position is sufficient to meet our U.S. liquidity requirements. We no longer consider earningsafter 2017 of our non-U.S. consolidated subsidiaries to be indefinitely reinvested.
Cash Flows from Operating Activities
Net cash provided by operating activities totaled $8,861 in 2020, compared to $6,356 in 2019. Our cash flow provided by operations is primarily derivedfrom net sales and membership fees. Cash flow used in operations generally consists of payments to our merchandise suppliers, warehouse operatingcosts, including payroll and employee benefits, utilities, and credit and debit card processing fees. Cash used in operations also includes payments forincome taxes. Changes in our net investment in merchandise inventories (the difference between merchandise inventories and accounts payable) isimpacted by several factors, including how fast inventory is sold, payment terms with our suppliers, and the amount of payables paid early to obtaindiscounts from our suppliers.
Cash Flows from Investing Activities
Net cash used in investing activities totaled $3,891 in 2020, compared to $2,865 in 2019, and primarily related to capital expenditures. In 2020, weacquired Innovel and a minority interest in Navitus. For more information see Notes 1 and 2 to the consolidated financial statements. Net cash flows frominvesting activities also includes maturities and purchases of short-term investments.
Capital Expenditures
Our primary requirement for capital is acquiring land, buildings, and equipment for new and remodeled warehouses. Capital is also required forinformation systems, manufacturing and distribution facilities, initial warehouse operations, and working capital. In 2020, we spent $2,810 on capitalexpenditures, and it is our current intention to spend approximately $3,000 to $3,200 d uring fiscal 2021. These expenditures are expected to be financedwith cash from operations, existing cash and cash equivalents, and short-term investments. We opened 16 new warehouses, including three relocations,in 2020, and plan to open approximately 23 additional new warehouses, including three relocations, in 2021. We have experienced delays in real estateand construction activities due to COVID-19. There can be no assurance that current expectations will be realized and plans are subject to change uponfurther review of our capital expenditure needs or based on the current economic environment.
Cash Flows from Financing Activities
Net cash used in financing activities totaled $1,147 in both 2020 and 2019. In April 2020, we issued $4,000 in aggregate principal amount of Senior Notesas follows: $1,250 of 1.375% due June 2027; $1,750 of 1.600% due April 2030; and $1,000 of 1.750% due April 2032. A portion of the proceeds wasused to repay, prior to maturity, the outstanding $1,000 and $500 principal balances on the 2.150% and 2.250% Senior Notes, respectively, at aredemption price plus accrued interest as specified in the Notes' agreements. The remaining funds are intended for general corporate purposes.
Financing activities also included $1,200 and $500 repayment of our 1.700% and 1.750% Senior Notes, respectively, payment of dividends, withholdingtaxes on stock-based awards, and repurchases of common stock.
Stock Repurchase Programs
During 2020 and 2019, we repurchased 643,000 and 1,097,000 shares of common stock, at average prices of $308.45 and $225.16, respectively, totalingapproximately $198 and $247, respectively. These amounts may differ from the stock repurchase balances in the accompanying consolidatedstatements of cash flows due to changes in unsettled stock repurchases at the end of each fiscal year. Purchases are made from time-to-time, asconditions warrant, in the open market or in block purchases and pursuant to plans under SEC Rule 10b5-1. Repurchased shares are retired, inaccordance with the Washington

Business Corporation Act. The remaining amount available to be purchased under our approved plan was $3,745 at the end of 2020.
Dividends
Cash dividends declared in 2020 totaled $2.70 per share, as compared to $2.44 per share in 2019. Dividends totaling $1,479 were paid during 2020, ofwhich $286 related to the dividend declared in August 2019. In April 2020, the Board of Directors increased our quarterly cash dividend from $0.65 to$0.70 per share. In July 2020, the Board of Directors declared a quarterly cash dividend in the amount of $0.70 per share, which was paid on August 14,2020.
Bank Credit Facilities and Commercial Paper Programs
We maintain bank credit facilities for working capital and general corporate purposes. At August 30, 2020, we had borrowing capacity under thesefacilities of $967. Our international operations maintain $500 of the total borrowing capacity under bank credit facilities, of which $204 is guaranteed bythe Company. There were no outstanding short-term borrowings under the bank credit facilities at the end of 2020 and 2019.
The Company has letter of credit facilities, for commercial and standby letters of credit, totaling $183. The outstanding commitments under these facilitiesat the end of 2020 totaled $166, most of which were standby letters of credit which do not expire or have expiration dates within one year. The bank creditfacilities have various expiration dates, most of which are within one year, and we generally intend to renew these facilities. The amount of borrowingsavailable at any time under our bank credit facilities is reduced by the amount of standby and commercial letters of credit outstanding.
Contractual Obligations
At August 30, 2020, our commitments to make future payments under contractual obligations were as follows:
Payments Due by Fiscal Year
Contractual obligations 2021 2022 to 2023 2024 to 20252026 andthereafter Total
Purchase obligations(1) $ 12,575 $ 9 $ — $ — $ 12,584 Long-term debt(2) 241 1,163 1,475 5,776 8,655 Operating leases (3) (4) 273 499 388 2,410 3,570 Construction and land obligations 979 35 — — 1,014 Finance lease obligations(4) 61 128 197 742 1,128 Purchase obligations (equipment, services and other) (5) 674 205 72 187 1,138 Other(6) 60 36 28 108 232
Total $ 14,863 $ 2,075 $ 2,160 $ 9,223 $ 28,321
_______________(1) Includes open purchase orders primarily related to merchandise and supplies.(2) Includes contractual interest payments and excludes deferred issuance costs.(3) Operating lease payments have not been reduced by future sublease income of $101.(4) Includes amounts representing interest.(5) Excludes certain services negotiated at the individual warehouse or regional level that are not significant and generally contain clauses allowing for cancellation without
significant penalty.(6) Includes asset retirement obligations and deferred compensation obligations. The amount excludes $25 of non-current unrecognized tax contingencies and $48 of other
obligations due to uncertainty regarding the timing of future cash payments.
Off-Balance Sheet Arrangements
In the opinion of management, we have no off-balance sheet arrangements that have had or are reasonably likely to have a material current or futureeffect on our financial condition or financial statements.
Critical Accounting Estimates
The preparation of our consolidated financial statements in accordance with U.S. generally accepted accounting principles (U.S. GAAP) requires that wemake estimates and assumptions that affect the reported amounts of assets and liabilities and the disclosure of contingent assets and liabilities at thedate of the financial statements and the reported amounts of revenues and expenses during the reporting period. We base our estimates on historicalexperience and on assumptions that we believe to be reasonable, and we continue to review and evaluate these estimates. For further information onsignificant accounting policies, see discussion in Note 1 to the consolidated financial statements included in Item 8 of this Report.
Insurance/Self-insurance Liabilities
Claims for employee health-care benefits, workers’ compensation, general liability, property damage, directors’ and officers’ liability, vehicle liability,inventory loss, and other exposures are funded predominantly through self-insurance. Insurance coverage is maintained in certain instances to seek tolimit exposures arising from very large losses. We use different risk management mechanisms, including a wholly-owned captive insurance subsidiary,and participate in a reinsurance program. Liabilities associated with the risks that we retain are not discounted and are estimated by using historicalclaims experience, demographic factors, severity factors, and other actuarial assumptions. The costs of claims are highly unpredictable and can fluctuateas a result of inflation rates, regulatory or legal changes, and unforeseen developments in claims over time. While we believe our estimates arereasonable and provide for a certain degree of coverage to account for these variables, actual claims and costs could differ significantly from recordedliabilities. Historically, adjustments to our estimates have not been material.
Recent Accounting Pronouncements
See Note 1 to the consolidated financial statements included in Item 8 of this Report for a detailed description of recent accounting pronouncements.
Item 7A—Quantitative and Qualitative Disclosures About Market Risk (amounts in millions)
Our exposure to financial market risk results from fluctuations in interest rates and foreign currency exchange rates. We do not engage in speculative orleveraged transactions or hold or issue financial instruments for trading purposes.
Interest Rate Risk
Our exposure to market risk for changes in interest rates relates primarily to our investment holdings that are diversified among various instrumentsconsidered to be cash equivalents, as defined in Note 1 to the consolidated financial statements included in Item 8 of this Report, as well as short-terminvestments in government and agency securities with effective maturities of generally three months to five years at the date of purchase. The primaryobjective of our investment activities is to preserve principal and secondarily to generate yields. The majority of our short-term investments are in fixedinterest-rate securities. These securities are subject to changes in fair value due to interest rate fluctuations.
Our policy limits investments in the U.S. to direct U.S. government and government agency obligations, repurchase agreements collateralized by U.S.government and government agency obligations, U.S. government and government agency money market funds, and insured bank balances. Our wholly-owned captive insurance subsidiary invests in U.S. government and government agency obligations and U.S. government and government agencymoney market funds. Our Canadian and Other International subsidiaries’ investments are primarily in money market funds, bankers’ acceptances, andbank certificates of deposit, generally denominated in local currencies.
A 100 basis point change in interest rates as of the end of 2020 would have had an immaterial incremental change in fair market value. For thoseinvestments that are classified as available-for-sale, the unrealized gains or losses related to fluctuations in market volatility and interest rates arereflected within stockholders’ equity in accumulated other comprehensive income in the consolidated balance sheets.
The nature and amount of our long-term debt may vary as a result of business requirements, market conditions, and other factors. As of the end of 2020,long-term debt with fixed interest rates was $7,657. Fluctuations in interest rates may affect the fair value of the fixed-rate debt. See Note 5 to theconsolidated financial statements included in Item 8 of this Report for more information on our long-term debt.
Foreign Currency Risk
Our foreign subsidiaries conduct certain transactions in non-functional currencies, which exposes us to fluctuations in exchange rates. We manage thesefluctuations, in part, through the use of forward foreign-exchange contracts, seeking to economically hedge the impact of these fluctuations on knownfuture expenditures denominated in a non-functional foreign-currency. The contracts are intended primarily to economically hedge exposure to U.S. dollarmerchandise inventory expenditures made by our international subsidiaries whose functional currency is other than the U.S. dollar. We seek to mitigaterisk with the use of these contracts and do not intend to engage in speculative transactions. For additional information related to the Company's forwardforeign-exchange contracts, see Notes 1 and 4 to the consolidated financial statements included in Item 8 of this Report. A hypothetical 10%strengthening of the functional currency compared to the non-functional currency exchange rates at August 30, 2020, would have decreased the fairvalue of the contracts by $111 and resulted in an unrealized loss in the consolidated statements of income for the same amount.
Commodity Price Risk
We are exposed to fluctuations in prices for energy, particularly electricity and natural gas, and other commodities used in retail and manufacturingoperations, which we seek to partially mitigate through fixed-price contracts for certain of our warehouses and other facilities, predominantly in the U.S.and Canada. We also enter into variable-priced contracts for some purchases of electricity and natural gas, in addition to some of the fuel for our gasstations, on an index basis. These contracts meet the characteristics of derivative instruments, but generally qualify for the “normal purchases andnormal sales” exception under authoritative guidance and require no mark-to-market adjustment.
31

Item 8—Financial Statements and Supplementary Data
REPORT OF INDEPENDENT REGISTERED PUBLIC ACCOUNTING FIRM
To the Stockholders and Board of DirectorsCostco Wholesale Corporation:
Opinion on the Consolidated Financial Statements
We have audited the accompanying consolidated balance sheets of Costco Wholesale Corporation and subsidiaries (the Company) as of August 30,2020 and September 1, 2019, the related consolidated statements of income, comprehensive income, equity, and cash flows for the 52-week periodsended August 30, 2020, September 1, 2019 and September 2, 2018, and the related notes (collectively, the consolidated financial statements). In ouropinion, the consolidated financial statements present fairly, in all material respects, the financial position of the Company as of August 30, 2020 andSeptember 1, 2019, and the results of its operations and its cash flows for the 52-week periods ended August 30, 2020, September 1, 2019 andSeptember 2, 2018, in conformity with U.S. generally accepted accounting principles.
We also have audited, in accordance with the standards of the Public Company Accounting Oversight Board (United States) (PCAOB), the Company’sinternal control over financial reporting as of August 30, 2020, based on criteria established in Internal Control – Integrated Framework (2013) issued bythe Committee of Sponsoring Organizations of the Treadway Commission, and our report dated October 6, 2020 expressed an unqualified opinion on theeffectiveness of the Company’s internal control over financial reporting.
Change in Accounting Principle
As discussed in Note 1 to the consolidated financial statements, the Company has changed its method of accounting for leases as of September 2, 2019due to the adoption of Accounting Standards Update 2016-02 – Leases (ASC 842).
Basis for Opinion
These consolidated financial statements are the responsibility of the Company’s management. Our responsibility is to express an opinion on theseconsolidated financial statements based on our audits. We are a public accounting firm registered with the PCAOB and are required to be independentwith respect to the Company in accordance with the U.S. federal securities laws and the applicable rules and regulations of the Securities and ExchangeCommission and the PCAOB.
We conducted our audits in accordance with the standards of the PCAOB. Those standards require that we plan and perform the audit to obtainreasonable assurance about whether the consolidated financial statements are free of material misstatement, whether due to error or fraud. Our auditsincluded performing procedures to assess the risks of material misstatement of the consolidated financial statements, whether due to error or fraud, andperforming procedures that respond to those risks. Such procedures included examining, on a test basis, evidence regarding the amounts anddisclosures in the consolidated financial statements. Our audits also included evaluating the accounting principles used and significant estimates madeby management, as well as evaluating the overall presentation of the consolidated financial statements. We believe that our audits provide a reasonablebasis for our opinion.
Critical Audit Matter
The critical audit matter communicated below is a matter arising from the current period audit of the consolidated financial statements that wascommunicated or required to be communicated to the audit committee and that: (1) relates to accounts or disclosures that are material to theconsolidated financial statements and (2) involved our especially challenging, subjective, or complex judgments. The communication of a critical auditmatter does not alter in any way our opinion on the consolidated financial statements, taken as a whole, and we are not, by communicating the criticalaudit matter below, providing a separate opinion on the critical audit matter or on the accounts or disclosures to which it relates.

Evaluation of self-insurance liabilities
As discussed in Note 1 to the consolidated financial statements, the Company estimates its self-insurance liabilities by considering historicalclaims experience, demographic factors, severity factors, and other actuarial assumptions. The estimated insurance/self-insurance liabilities as ofAugust 30, 2020 were $1,188 million, a portion of which related to workers’ compensation and general liability self-insurance liabilities for theUnited States and Canadian operations.
We identified the evaluation of the Company’s workers’ compensation and general liability self-insurance liabilities for the United States andCanadian operations as a critical audit matter because of the extent of specialized skill and knowledge needed to evaluate the Company’sactuarial models and the judgments required to assess the underlying assumptions made by the Company. Specifically, subjective auditorjudgment was required to evaluate certain assumptions underlying the Company’s actuarial estimates, including reporting and payment patternsused in the projections of the ultimate loss; loss and exposure trends; the selected loss rates and initial expected losses used in the Paid andIncurred Bornhuetter-Ferguson methods; and the selection of the ultimate loss derived from the various methods.
The following are the primary procedures we performed to address this critical audit matter. We evaluated the design and tested operatingeffectiveness of certain internal controls over the Company’s self-insurance process. This included controls related to the development andselection of the assumptions listed above used in the actuarial calculation and review of the actuarial report. We involved actuarial professionalswith specialized skills and knowledge who assisted in:
• Assessing the actuarial models used by the Company for consistency with generallyaccepted actuarial standards
• Evaluating the Company’s ability to estimate self-insurance liabilities by comparing itshistorical estimate with actual incurred losses and paid losses
• Evaluating the above listed assumptions underlying the Company’s actuarial estimates bydeveloping an independent expectation of the self-insurance liabilities and comparing them to the amounts recorded by the Company
/s/ KPMG LLP
We have served as the Company’s auditor since 2002.
Seattle, WashingtonOctober 6, 2020

REPORT OF INDEPENDENT REGISTERED PUBLIC ACCOUNTING FIRM
To the Stockholders and Board of DirectorsCostco Wholesale Corporation:
Opinion on Internal Control Over Financial Reporting
We have audited Costco Wholesale Corporation and subsidiaries’ (the Company) internal control over financial reporting as of August 30, 2020, basedon criteria established in Internal Control – Integrated Framework (2013) issued by the Committee of Sponsoring Organizations of the TreadwayCommission. In our opinion, the Company maintained, in all material respects, effective internal control over financial reporting as of August 30, 2020,based on criteria established in Internal Control – Integrated Framework (2013) issued by the Committee of Sponsoring Organizations of the TreadwayCommission.
We also have audited, in accordance with the standards of the Public Company Accounting Oversight Board (United States) (PCAOB), the consolidatedbalance sheets of the Company as of August 30, 2020 and September 1, 2019, the related consolidated statements of income, comprehensive income,equity, and cash flows for the 52-week periods ended August 30, 2020, September 1, 2019 and September 2, 2018, and the related notes (collectively,the consolidated financial statements), and our report dated October 6, 2020 expressed an unqualified opinion on those consolidated financialstatements.
Basis for Opinion
The Company’s management is responsible for maintaining effective internal control over financial reporting and for its assessment of the effectivenessof internal control over financial reporting, included in the accompanying Management’s Annual Report on Internal Control Over Financial Reporting. Ourresponsibility is to express an opinion on the Company’s internal control over financial reporting based on our audit. We are a public accounting firmregistered with the PCAOB and are required to be independent with respect to the Company in accordance with the U.S. federal securities laws and theapplicable rules and regulations of the Securities and Exchange Commission and the PCAOB.
We conducted our audit in accordance with the standards of the PCAOB. Those standards require that we plan and perform the audit to obtainreasonable assurance about whether effective internal control over financial reporting was maintained in all material respects. Our audit of internalcontrol over financial reporting included obtaining an understanding of internal control over financial reporting, assessing the risk that a materialweakness exists, and testing and evaluating the design and operating effectiveness of internal control based on the assessed risk. Our audit alsoincluded performing such other procedures as we considered necessary in the circumstances. We believe that our audit provides a reasonable basis forour opinion.
Definition and Limitations of Internal Control Over Financial Reporting
A company’s internal control over financial reporting is a process designed to provide reasonable assurance regarding the reliability of financial reportingand the preparation of financial statements for external purposes in accordance with generally accepted accounting principles. A company’s internalcontrol over financial reporting includes those policies and procedures that (1) pertain to the maintenance of records that, in reasonable detail, accuratelyand fairly reflect the transactions and dispositions of the assets of the company; (2) provide reasonable assurance that transactions are recorded asnecessary to permit preparation of financial statements in accordance with generally accepted accounting principles, and that receipts and expendituresof the company are being made only in accordance with authorizations of management and directors of the company; and (3) provide reasonableassurance regarding prevention or timely detection of unauthorized acquisition, use, or disposition of the company’s assets that could have a materialeffect on the financial statements.
Because of its inherent limitations, internal control over financial reporting may not prevent or detect misstatements. Also, projections of any evaluation ofeffectiveness to future periods are subject to the risk that controls may become inadequate because of changes in conditions, or that the degree ofcompliance with the policies or procedures may deteriorate.
/s/ KPMG LLP
Seattle, WashingtonOctober 6, 2020
34

COSTCO WHOLESALE CORPORATIONCONSOLIDATED STATEMENTS OF INCOME(amounts in millions, except per share data)
52 Weeks Ended 52 Weeks Ended 52 Weeks EndedAugust 30,
2020September 1,
2019September 2,
2018REVENUE
Net sales $ 163,220 $ 149,351 $ 138,434 Membership fees 3,541 3,352 3,142
Total revenue 166,761 152,703 141,576 OPERATING EXPENSES
Merchandise costs 144,939 132,886 123,152 Selling, general and administrative 16,332 14,994 13,876 Preopening expenses 55 86 68
Operating income 5,435 4,737 4,480 OTHER INCOME (EXPENSE)
Interest expense (160) (150) (159)Interest income and other, net 92 178 121
INCOME BEFORE INCOME TAXES 5,367 4,765 4,442 Provision for income taxes 1,308 1,061 1,263 Net income including noncontrolling interests 4,059 3,704 3,179 Net income attributable to noncontrolling interests (57) (45) (45)
NET INCOME ATTRIBUTABLE TO COSTCO $ 4,002 $ 3,659 $ 3,134 NET INCOME PER COMMON SHARE ATTRIBUTABLE TO COSTCO:
Basic $ 9.05 $ 8.32 $ 7.15
Diluted $ 9.02 $ 8.26 $ 7.09 Shares used in calculation (000’s)
Basic 442,297 439,755 438,515 Diluted 443,901 442,923 441,834
The accompanying notes are an integral part of these consolidated financial statements.
35

COSTCO WHOLESALE CORPORATIONCONSOLIDATED STATEMENTS OF COMPREHENSIVE INCOME
(amounts in millions)
52 Weeks Ended 52 Weeks Ended 52 Weeks Ended
August 30,
2020September 1,
2019September 2,
2018NET INCOME INCLUDING NONCONTROLLING INTERESTS $ 4,059 $ 3,704 $ 3,179
Foreign-currency translation adjustment and other, net 162 (245) (192)Comprehensive income 4,221 3,459 2,987
Less: Comprehensive income attributable to noncontrolling interests 80 37 38 COMPREHENSIVE INCOME ATTRIBUTABLE TO COSTCO $ 4,141 $ 3,422 $ 2,949
The accompanying notes are an integral part of these consolidated financial statements.
36

COSTCO WHOLESALE CORPORATIONCONSOLIDATED BALANCE SHEETS
(amounts in millions, except par value and share data)
August 30,2020
September 1,2019
ASSETSCURRENT ASSETS
Cash and cash equivalents $ 12,277 $ 8,384 Short-term investments 1,028 1,060 Receivables, net 1,550 1,535 Merchandise inventories 12,242 11,395 Other current assets 1,023 1,111
Total current assets 28,120 23,485 OTHER ASSETS
Property and equipment, net 21,807 20,890 Operating lease right-of-use assets 2,788 — Other long-term assets 2,841 1,025
TOTAL ASSETS $ 55,556 $ 45,400 LIABILITIES AND EQUITY
CURRENT LIABILITIESAccounts payable $ 14,172 $ 11,679 Accrued salaries and benefits 3,605 3,176 Accrued member rewards 1,393 1,180 Deferred membership fees 1,851 1,711 Current portion of long-term debt 95 1,699 Other current liabilities 3,728 3,792
Total current liabilities 24,844 23,237 OTHER LIABILITIES
Long-term debt, excluding current portion 7,514 5,124 Long-term operating lease liabilities 2,558 — Other long-term liabilities 1,935 1,455
TOTAL LIABILITIES 36,851 29,816 COMMITMENTS AND CONTINGENCIESEQUITY
Preferred stock $0.01 par value; 100,000,000 shares authorized; no shares issued and outstanding — — Common stock $0.01 par value; 900,000,000 shares authorized; 441,255,000 and 439,625,000 shares issuedand outstanding 4 4
Additional paid-in capital 6,698 6,417 Accumulated other comprehensive loss (1,297) (1,436)Retained earnings 12,879 10,258
Total Costco stockholders’ equity 18,284 15,243 Noncontrolling interests 421 341
Total equity 18,705 15,584
TOTAL LIABILITIES AND EQUITY $ 55,556 $ 45,400
The accompanying notes are an integral part of these consolidated financial statements.
37

COSTCO WHOLESALE CORPORATIONCONSOLIDATED STATEMENTS OF EQUITY
(amounts in millions)
Common StockAdditional
Paid-inCapital
AccumulatedOther
ComprehensiveIncome (Loss)
RetainedEarnings
Total CostcoStockholders’
EquityNoncontrolling
InterestsTotal
Equity Shares(000’s) Amount
BALANCE AT SEPTEMBER 3, 2017 437,204 $ 4 $ 5,800 $ (1,014) $ 5,988 $ 10,778 $ 301 $ 11,079
Net income — — — — 3,134 3,134 45 3,179 Foreign-currency translation
adjustment and other, net — — — (185) — (185) (7) (192)
Stock-based compensation — — 547 — — 547 — 547 Release of vested restricted stock
units (RSUs), including tax effects 2,741 — (217) — — (217) — (217)
Repurchases of common stock (1,756) — (26) — (296) (322) — (322)
Cash dividends declared and other — — 3 — (939) (936) (35) (971)BALANCE AT SEPTEMBER 2, 2018 438,189 4 6,107 (1,199) 7,887 12,799 304 13,103
Net income — — — — 3,659 3,659 45 3,704 Foreign-currency translation
adjustment and other, net — — — (237) — (237) (8) (245)
Stock-based compensation — — 598 — — 598 — 598 Release of vested RSUs, including
tax effects 2,533 — (272) — — (272) — (272)
Repurchases of common stock (1,097) — (16) — (231) (247) — (247)
Cash dividends declared and other — — — — (1,057) (1,057) — (1,057)BALANCE AT SEPTEMBER 1, 2019 439,625 4 6,417 (1,436) 10,258 15,243 341 15,584
Net income — — — — 4,002 4,002 57 4,059 Foreign-currency translation
adjustment and other, net — — — 139 — 139 23 162
Stock-based compensation — — 621 — — 621 — 621 Release of vested RSUs, including
tax effects 2,273 — (330) — — (330) — (330)
Repurchases of common stock (643) — (10) — (188) (198) — (198)
Cash dividends declared — — — — (1,193) (1,193) — (1,193)
BALANCE AT AUGUST 30, 2020 441,255 $ 4 $ 6,698 $ (1,297) $ 12,879 $ 18,284 $ 421 $ 18,705
The accompanying notes are an integral part of these consolidated financial statements.
38

COSTCO WHOLESALE CORPORATIONCONSOLIDATED STATEMENTS OF CASH FLOWS
(amounts in millions)
52 Weeks Ended 52 Weeks Ended 52 Weeks EndedAugust 30,
2020September 1,
2019September 2,
2018CASH FLOWS FROM OPERATING ACTIVITIES
Net income including noncontrolling interests $ 4,059 $ 3,704 $ 3,179 Adjustments to reconcile net income including noncontrolling interests to net cash provided by
operating activities:Depreciation and amortization 1,645 1,492 1,437
Non-cash lease expense 194 — —
Stock-based compensation 619 595 544
Other non-cash operating activities, net 42 9 (6)
Deferred income taxes 104 147 (49)Changes in operating assets and liabilities:
Merchandise inventories (791) (536) (1,313)Accounts payable 2,261 322 1,561 Other operating assets and liabilities, net 728 623 421 Net cash provided by operating activities 8,861 6,356 5,774
CASH FLOWS FROM INVESTING ACTIVITIESPurchases of short-term investments (1,626) (1,094) (1,060)Maturities and sales of short-term investments 1,678 1,231 1,078 Additions to property and equipment (2,810) (2,998) (2,969)Acquisitions (1,163) — — Other investing activities, net 30 (4) 4
Net cash used in investing activities (3,891) (2,865) (2,947)CASH FLOWS FROM FINANCING ACTIVITIES
Change in bank payments outstanding 137 210 80 Proceeds from issuance of long-term debt 3,992 298 — Repayments of long-term debt (3,200) (89) (86)Tax withholdings on stock-based awards (330) (272) (217)Repurchases of common stock (196) (247) (328)Cash dividend payments (1,479) (1,038) (689)Other financing activities, net (71) (9) (41)
Net cash used in financing activities (1,147) (1,147) (1,281)
EFFECT OF EXCHANGE RATE CHANGES ON CASH AND CASH EQUIVALENTS 70 (15) (37)Net change in cash and cash equivalents 3,893 2,329 1,509
CASH AND CASH EQUIVALENTS BEGINNING OF YEAR 8,384 6,055 4,546
CASH AND CASH EQUIVALENTS END OF YEAR $ 12,277 $ 8,384 $ 6,055
SUPPLEMENTAL DISCLOSURE OF CASH FLOW INFORMATION:Cash paid during the year for:
Interest $ 124 $ 141 $ 143 Income taxes, net $ 1,052 $ 1,187 $ 1,204
SUPPLEMENTAL DISCLOSURE OF NON-CASH INVESTING AND FINANCING ACTIVITIES:Cash dividend declared, but not yet paid $ — $ 286 $ 250
The accompanying notes are an integral part of these consolidated financial statements.
39

COSTCO WHOLESALE CORPORATIONNOTES TO CONSOLIDATED FINANCIAL STATEMENTS
(amounts in millions, except share, per share, and warehouse count data)
Note 1—Summary of Significant Accounting Policies
Description of Business
Costco Wholesale Corporation (Costco or the Company), a Washington corporation, and its subsidiaries operate membership warehouses based on theconcept that offering members low prices on a limited selection of nationally-branded and private-label products in a wide range of merchandisecategories will produce high sales volumes and rapid inventory turnover. At August 30, 2020, Costco operated 795 warehouses worldwide: 552 in theUnited States (U.S.) located in 45 states, Washington, D.C., and Puerto Rico, 101 in Canada, 39 in Mexico, 29 in the United Kingdom (U.K.), 27 inJapan, 16 in Korea, 13 in Taiwan, 12 in Australia, three in Spain, and one each in Iceland, France and China. The Company operates e-commercewebsites in the U.S., Canada, Mexico, U.K., Korea, Taiwan, Japan, and Australia.
Basis of Presentation
The consolidated financial statements include the accounts of Costco, its wholly-owned subsidiaries, and subsidiaries in which it has a controllinginterest. The Company reports noncontrolling interests in consolidated entities as a component of equity separate from the Company’s equity. Allmaterial inter-company transactions between and among the Company and its consolidated subsidiaries have been eliminated in consolidation. InFebruary 2020, the Company acquired a 35% interest in Navitus Health Solutions, a pharmacy benefit manager. This investment is included in otherlong-term assets and is accounted for using the equity-method with earnings/losses recorded in other income in the consolidated statement of income.The Company’s net income excludes income attributable to the noncontrolling interest in Taiwan. Unless otherwise noted, references to net income relateto net income attributable to Costco.
Fiscal Year End
The Company operates on a 52/53 week fiscal year basis with the year ending on the Sunday closest to August 31. References to 2020, 2019, and 2018relate to the 52-week fiscal years ended August 30, 2020, September 1, 2019, and September 2, 2018, respectively.
Use of Estimates
The preparation of financial statements in conformity with U.S. generally accepted accounting principles (U.S. GAAP) requires management to makeestimates and assumptions that affect the reported amounts of assets and liabilities and the disclosure of contingent assets and liabilities at the date ofthe financial statements and the reported amounts of revenues and expenses during the reporting period. These estimates and assumptions take intoaccount historical and forward looking factors that the Company believes are reasonable, including but not limited to the potential impacts arising fromthe novel coronavirus (COVID-19) and related public and private sector policies and initiatives. Actual results could differ from those estimates andassumptions.
Cash and Cash Equivalents
The Company considers as cash and cash equivalents all cash on deposit, highly liquid investments with a maturity of three months or less at the date ofpurchase, and proceeds due from credit and debit card transactions with settlement terms of up to four days. Credit and debit card receivables were$1,636 and $1,434 at the end of 2020 and 2019, respectively.
The Company provides for the daily replenishment of major bank accounts as payments are presented. Included in accounts payable at the end of 2020and 2019 are $810 and $673, respectively, representing the excess of outstanding payments over cash on deposit at the banks on which the paymentswere drawn.
Short-Term Investments
Short-term investments generally consist of debt securities (U.S. Government and Agency Notes), with maturities at the date of purchase of three monthsto five years. Investments with maturities beyond five years may be classified, based on the Company’s determination, as short-term based on theirhighly liquid nature and because they represent the investment of cash that is available for current operations. Short-term investments classified asavailable-for-sale are recorded at fair value using the specific identification method with the unrealized gains and losses reflected in accumulated othercomprehensive income (loss) until realized. Realized gains and losses from the sale of available-for-sale securities, if any, are determined on a specificidentification basis and are recorded in interest income and other, net in the consolidated statements of income. Short-term investments classified asheld-to-maturity are financial instruments that the Company has the intent and ability to hold to maturity and are reported net of any related amortizationand are not remeasured to fair value on a recurring basis.
The Company periodically evaluates unrealized losses in its investment securities for other-than-temporary impairment, using both qualitative andquantitative criteria. In the event a security is deemed to be other-than-temporarily impaired, the Company recognizes the loss in interest income andother, net in the consolidated statements of income.
Fair Value of Financial Instruments
The Company accounts for certain assets and liabilities at fair value. The carrying value of the Company’s financial instruments, including cash and cashequivalents, receivables and accounts payable, approximate fair value due to their short-term nature or variable interest rates. See Notes 3, 4, and 5 forthe carrying value and fair value of the Company’s investments, derivative instruments, and fixed-rate debt, respectively.
Fair value is defined as the price that would be received to sell an asset or paid to transfer a liability in an orderly transaction between market participantsat the measurement date. Fair value is estimated by applying a fair value hierarchy, which requires maximizing the use of observable inputs whenmeasuring fair value. The three levels of inputs are:
Level 1: Quoted market prices in active markets for identical assets or liabilities.
Level 2: Observable market-based inputs or unobservable inputs that are corroborated by marketdata.
Level 3: Significant unobservable inputs that are not corroborated by market data.
The Company’s valuation techniques used to measure the fair value of money market mutual funds are based on quoted market prices, such as quotednet asset values published by the fund as supported in an active market. Valuation methodologies used to measure the fair value of all other non-derivative financial instruments are based on independent external valuation information. The pricing process uses data from a variety of independentexternal valuation information providers, including trades, bid price or spread, two-sided markets, quotes, benchmark curves including but not limited totreasury benchmarks and Libor and swap curves, discount rates, and market data feeds. All are observable in the market or can be derived principallyfrom or corroborated by observable market data. The Company reports transfers in and out of Levels 1, 2, and 3, as applicable, using the fair value of theindividual securities as of the beginning of the reporting period in which the transfer(s) occurred.
Current financial liabilities have fair values that approximate their carrying values. Long-term financial liabilities include the Company's long-term debt,which are recorded on the balance sheet at issuance price and adjusted for unamortized discounts or premiums and debt issuance costs, and are beingamortized to interest expense over the term of the loan. The estimated fair value of the Company's long-term debt is based primarily on reported marketvalues, recently completed market transactions, and estimates based upon interest rates, maturities, and credit.
Receivables, Net
Receivables consist primarily of vendor, reinsurance, credit card incentive, third-party pharmacy and other receivables. Vendor receivables includediscounts and volume rebates. Balances are generally presented on a gross basis, separate from any related payable due. In certain circumstances,these receivables may be settled against the related payable to that vendor, in which case the receivables are presented on a net basis. Reinsurancereceivables are held by the Company’s wholly-owned captive insurance subsidiary and primarily represent amounts ceded through reinsurancearrangements gross of the amounts assumed under reinsurance, which are presented within other current liabilities in the consolidated balance sheets.Credit card incentive receivables primarily represent amounts earned under the co-branded credit card arrangement in the U.S. Third-party pharmacyreceivables generally relate to amounts due from members’ insurers. Other receivables primarily consist of amounts due from governmental entities,mostly tax-related items.
Receivables are recorded net of an allowance for doubtful accounts. The allowance is based on historical experience and application of the specificidentification method. Write-offs of receivables were immaterial in 2020, 2019, and 2018.
Merchandise Inventories
Merchandise inventories consist of the following:
2020 2019
United States $ 8,871 $ 8,415 Canada 1,310 1,123 Other International 2,061 1,857
Merchandise inventories $ 12,242 $ 11,395
Merchandise inventories are stated at the lower of cost or market. U.S. merchandise inventories are valued by the cost method of accounting, using thelast-in, first-out (LIFO) basis. The Company believes the LIFO method more fairly presents the results of operations by more closely matching currentcosts with current revenues. The Company records an adjustment each quarter, if necessary, for the projected annual effect of inflation or deflation, andthese estimates are adjusted to actual results determined at year-end, after actual inflation or deflation rates and inventory levels have been determined.As of August 30, 2020, and September 1, 2019, U.S. merchandise inventories valued at LIFO approximated first-in, first-out (FIFO) after considering thelower of cost or market principle. Canadian and Other International merchandise inventories are predominantly valued using the cost and retail inventorymethods, respectively, using the FIFO basis.
The Company provides for estimated inventory losses between physical inventory counts using estimates based on experience. The provision isadjusted periodically to reflect physical inventory counts, which generally occur in the second and fourth fiscal quarters. Inventory cost, whereappropriate, is reduced by estimates of vendor rebates when earned or as the Company progresses towards earning those rebates, provided that theyare probable and reasonably estimable.

Property and Equipment, Net
Property and equipment are stated at cost. Depreciation and amortization expense is computed primarily using the straight-line method over estimateduseful lives. Leasehold improvements made after the beginning of the initial lease term are depreciated over the shorter of the estimated useful life of theasset or the remaining term of the initial lease plus any renewals that are reasonably certain at the date the leasehold improvements are made.
The Company capitalizes certain computer software and costs incurred in developing or obtaining software for internal use. During development, thesecosts are included in construction in progress. When the assets are ready for their intended use, these costs are included in equipment and fixtures andamortized on a straight-line basis over their estimated useful lives.
Repair and maintenance costs are expensed when incurred. Expenditures for remodels, refurbishments and improvements that add to or change the wayan asset functions or that extend the useful life are capitalized. Assets removed during the remodel, refurbishment or improvement are retired. Assetsclassified as held-for-sale at the end of 2020 and 2019 were immaterial. The following table summarizes the Company's property and equipment balancesat the end of 2020 and 2019:
Estimated Useful Lives 2020 2019
Land N/A $ 6,696 $ 6,417 Buildings and improvements 5-50 years 17,982 17,136 Equipment and fixtures 3-20 years 8,749 7,801 Construction in progress N/A 1,276 1,272
34,703 32,626 Accumulated depreciation and amortization (12,896) (11,736)
Property and equipment, net $ 21,807 $ 20,890
The Company evaluates long-lived assets for impairment on an annual basis, when relocating or closing a facility, or when events or changes incircumstances may indicate the carrying amount of the asset group, generally an individual warehouse, may not be fully recoverable. For asset groupsheld and used, including warehouses to be relocated, the carrying value of the asset group is considered recoverable when the estimated futureundiscounted cash flows generated from the use and eventual disposition of the asset group exceed the respective carrying value. In the event that thecarrying value is not considered recoverable, an impairment loss is recognized for the asset group to be held and used equal to the excess of thecarrying value above the estimated fair value of the asset group. For asset groups classified as held-for-sale (disposal group), the carrying value iscompared to the disposal group’s fair value less costs to sell. The Company estimates fair value by obtaining market appraisals from third party brokersor using other valuation techniques. There were no impairment charges recognized in 2020, 2019 or 2018.
Leases
The Company leases land and/or buildings at warehouses and certain other office and distribution facilities. Leases generally contain one or more of thefollowing options, which the Company can exercise at the end of the initial term: (a) renew the lease for a defined number of years at the then-fair marketrental rate or rate stipulated in the lease agreement; (b) purchase the property at the then-fair market value; or (c) a right of first refusal in the event of athird-party offer.

Some leases include free-rent periods and step-rent provisions, which are recognized on a straight-line basis over the original term of the lease and anyextension options that the Company is reasonably certain to exercise from the date the Company has control of the property. Certain leases provide forperiodic rent increases based on price indices or the greater of minimum guaranteed amounts or sales volume. Our leases do not contain any materialresidual value guarantees or material restrictive covenants.
The Company determines at inception whether a contract is or contains a lease. The Company initially records right-of-use (ROU) assets and leaseobligations for its finance and operating leases based on the discounted future minimum lease payments over the term. As the rate implicit in theCompany's leases is not easily determinable, the present value of the sum of the lease payments is calculated using the Company's incrementalborrowing rate. The rate is determined using a portfolio approach based on the rate of interest the Company would pay to borrow an amount equal to thelease payments on a collateralized basis over a similar term. The Company uses quoted interest rates from financial institutions to derive the incrementalborrowing rate. The lease term is defined as the noncancelable period of the lease plus any options to extend when it is reasonably certain that theCompany will exercise the option. Impairment of ROU assets is evaluated in a similar manner as described in Property and Equipment, Net above.
The Company's asset retirement obligations (ARO) primarily relate to leasehold improvements that at the end of a lease must be removed. Theseobligations are generally recorded as a discounted liability, with an offsetting asset at the inception of the lease term based upon the estimated fair valueof the costs to remove the improvements. These liabilities are accreted over time to the projected future value of the obligation. The ARO assets aredepreciated using the same depreciation method as the leasehold improvement assets and are included with buildings and improvements. EstimatedARO liabilities associated with these leases are included in other liabilities in the accompanying consolidated balance sheet.
Goodwill and Acquired Intangible Assets
Goodwill represents the excess of acquisition cost over the fair value of the net assets acquired and is not subject to amortization. The Company reviewsgoodwill annually in the fourth quarter for impairment or when circumstances indicate carrying value may exceed the fair value. This evaluation isperformed at the reporting unit level. If a qualitative assessment indicates that it is more likely than not that the fair value is less than carrying value, aquantitative analysis is completed using either the income or market approach, or a combination of both. The income approach estimates fair valuebased on expected discounted future cash flows, while the market approach uses comparable public companies and transactions to develop metrics tobe applied to historical and expected future operating results.
Goodwill is included in other long-term assets in the consolidated balance sheets. The following table summarizes goodwill by reportable segment:
United StatesOperations
CanadianOperations
Other InternationalOperations Total
Balance at September 1, 2019 $ 13 $ 27 $ 13 $ 53 Changes in currency translation — — 1 1 Acquisition 934 — — 934
Balance at August 30, 2020 $ 947 $ 27 $ 14 $ 988
Definite-lived intangible assets, which are not material, are included in other long-term assets on the consolidated balance sheets and are amortized on astraight-line basis over their estimated lives, which approximates the pattern of expected economic benefit.

Insurance/Self-insurance Liabilities
Claims for employee health care benefits, workers’ compensation, general liability, property damage, directors’ and officers’ liability, vehicle liability,inventory loss, and other exposures are funded predominantly through self-insurance. Insurance coverage is maintained in certain instances to limitexposures arising from very large losses. It uses different risk management mechanisms, including a wholly-owned captive insurance subsidiary (thecaptive) and participates in a reinsurance program. Liabilities associated with the risks that are retained by the Company are not discounted and areestimated, in part, by considering historical claims experience, demographic factors, severity factors, and other actuarial assumptions. The estimatedaccruals for these liabilities could be significantly affected if future occurrences and claims differ from these assumptions and historical trends. At the endof 2020 and 2019, these insurance liabilities were $1,188 and $1,222 in the aggregate, respectively, and were included in accrued salaries and benefitsand other current liabilities in the consolidated balance sheets, classified based on their nature.
The captive receives direct premiums, which are netted against the Company’s premium costs in selling, general and administrative expenses, in theconsolidated statements of income. The captive participates in a reinsurance program that includes other third-party participants. The reinsuranceagreement is one year in duration, and new agreements are entered into by each participant at their discretion at the commencement of the next calendaryear. The participant agreements and practices of the reinsurance program limit a participating members’ individual risk. Income statement adjustmentsrelated to the reinsurance program and related impacts to the consolidated balance sheets are recognized as information becomes known. In the eventthe Company leaves the reinsurance program, the Company retains its primary obligation to the policyholders for prior activity.
Derivatives
The Company is exposed to foreign-currency exchange-rate fluctuations in the normal course of business. It manages these fluctuations, in part, throughthe use of forward foreign-exchange contracts, seeking to economically hedge the impact of fluctuations of foreign exchange on known futureexpenditures denominated in a non-functional foreign-currency. The contracts relate primarily to U.S. dollar merchandise inventory expenditures made bythe Company’s international subsidiaries with functional currencies other than the U.S. dollar. Currently, these contracts do not qualify for derivativehedge accounting. The Company seeks to mitigate risk with the use of these contracts and does not intend to engage in speculative transactions. Someof these contracts contain credit-risk-related contingent features that require settlement of outstanding contracts upon certain triggering events. Theaggregate fair value amounts of derivative instruments in a net liability position and the amount needed to settle the instruments immediately if the credit-risk-related contingent features were triggered were immaterial at the end of 2020 and 2019. The aggregate notional amounts of open, unsettled forwardforeign-exchange contracts were $1,036 and $704 at the end of 2020 and 2019, respectively. See Note 4 for information on the fair value of unsettledforward foreign-exchange contracts at the end of 2020 and 2019.
The unrealized gains or losses recognized in interest income and other, net in the accompanying consolidated statements of income relating to the netchanges in the fair value of unsettled forward foreign-exchange contracts were immaterial in 2020, 2019 and 2018.
The Company is exposed to fluctuations in prices for energy, particularly electricity and natural gas, and other commodity products used in retail andmanufacturing operations, which it seeks to partially mitigate through the use of fixed-price contracts for certain of its warehouses and other facilities,primarily in the U.S. and Canada. The Company also enters into variable-priced contracts for some purchases of natural gas, in addition to fuel for its gasstations, on an index basis. These contracts meet the characteristics of derivative instruments, but generally qualify for the “normal purchases andnormal sales” exception under authoritative guidance and require no mark-to-market adjustment.

Foreign Currency
The functional currencies of the Company’s international subsidiaries are the local currency of the country in which the subsidiary is located. Assets andliabilities recorded in foreign currencies are translated at the exchange rate on the balance sheet date. Translation adjustments are recorded inaccumulated other comprehensive loss. Revenues and expenses of the Company’s consolidated foreign operations are translated at average exchangerates prevailing during the year.
The Company recognizes foreign-currency transaction gains and losses related to revaluing or settling monetary assets and liabilities denominated incurrencies other than the functional currency in interest income and other, net in the consolidated statements of income. Generally, these include theU.S. dollar cash and cash equivalents and the U.S. dollar payables of consolidated subsidiaries revalued to their functional currency. Also included arerealized foreign-currency gains or losses from settlements of forward foreign-exchange contracts. These items were immaterial in 2020, 2019, and 2018.
Revenue Recognition
The Company adopted Accounting Standards Update (ASU) 2014-09 in 2019, which provided for changes in the recognition of revenue from contractswith customers. The Company recognizes sales for the amount of consideration collected from the member, which includes gross shipping fees whereapplicable, and is net of sales taxes collected and remitted to government agencies and member returns. The Company reserves for estimated returnsbased on historical trends in merchandise returns and reduces sales and merchandise costs accordingly. The Company records, on a gross basis, arefund liability and an asset for recovery, which are included in other current liabilities and other current assets, respectively, in the consolidated balancesheets.
The Company offers merchandise in the following core merchandise categories: food and sundries, hardlines, softlines, and fresh foods. The Companyalso provides expanded products and services through warehouse ancillary and other businesses. The majority of revenue from merchandise sales isrecognized at the point of sale. Revenue generated through e-commerce or special orders is generally recognized upon shipment to the member. Formerchandise shipped directly to the member, shipping and handling costs are expensed as incurred as fulfillment costs and included in merchandisecosts in the consolidated statements of income. In certain ancillary businesses, revenue is deferred until the member picks up merchandise at thewarehouse. Deferred sales are included in other current liabilities in the consolidated balance sheets.
The Company is the principal for the majority of its transactions and recognizes revenue on a gross basis. The Company is the principal when it hascontrol of the merchandise or service before it is transferred to the member, which generally is established when Costco is primarily responsible formerchandising decisions, maintains the relationship with the member, including assurance of member service and satisfaction, and has pricingdiscretion.
The Company accounts for membership fee revenue, net of refunds, on a deferred basis, ratably over the one-year membership period. Deferredmembership fees at the end of 2020 and 2019 were $1,851 and $1,711, respectively.
In most countries, the Company's Executive members qualify for a 2% reward on qualified purchases (up to a maximum of approximately $1,000 peryear), which does not expire and can be redeemed only at Costco warehouses. The Company accounts for this reward as a reduction in sales, net of theestimated impact of non-redemptions (breakage), with the corresponding liability classified as accrued member rewards in the consolidated balancesheets. Estimated breakage is computed based on redemption data. For 2020, 2019 and 2018, the net reduction in sales was $1,707, $1,537, and$1,394 respectively.
The Company sells and otherwise provides proprietary shop cards that do not expire and are redeemable at the warehouse or online for merchandise ormembership. Revenue from shop cards is recognized upon redemption, and estimated breakage is recognized based on redemption data. The Companyaccounts for outstanding shop card balances as a shop card liability, net of estimated breakage.
Citibank, N.A. (“Citi”) became the exclusive issuer of co-branded credit cards to U.S. members in June 2016. The Company receives various forms ofconsideration, including a royalty on purchases made on the card outside of Costco, a portion of which, after giving rise to estimated breakage, is used tofund the rebate that cardholders receive. The rebates are issued in February and expire on December 31. Breakage is estimated based on redemptiondata.
Merchandise Costs
Merchandise costs consist of the purchase price or manufacturing costs of inventory sold, inbound and outbound shipping charges and all costs relatedto the Company’s depot, fulfillment and manufacturing operations, including freight from depots to selling warehouses, and are reduced by vendorconsideration. Merchandise costs also include salaries, benefits, depreciation, and utilities in fresh foods and certain ancillary departments.
Vendor Consideration
The Company has agreements to receive funds from vendors for discounts and a variety of other programs. These programs are evidenced by signedagreements that are reflected in the carrying value of the inventory when earned or as the Company progresses towards earning the rebate or discount,and as a component of merchandise costs as the merchandise is sold. Other vendor consideration is generally recorded as a reduction of merchandisecosts upon completion of contractual milestones, terms of the related agreement, or by another systematic approach.
Selling, General and Administrative Expenses
Selling, general and administrative expenses consist primarily of salaries, benefits and workers’ compensation costs for warehouse employees (otherthan fresh foods departments and certain ancillary businesses which are reflected in merchandise costs) as well as all regional and home officeemployees, including buying personnel. Selling, general and administrative expenses also include substantially all building and equipment depreciation,stock compensation expense, credit and debit card processing fees, utilities, as well as other operating costs incurred to support warehouse and e-commerce website operations.
Retirement Plans
The Company's 401(k) retirement plan is available to all U.S. employees over the age of 18 who have completed 90 days of employment. The plan allowsparticipants to make wage deferral contributions, a portion of which the Company matches. In addition, the Company provides each eligible participant anannual discretionary contribution. The Company also has a defined contribution plan for Canadian employees and contributes a percentage of eachemployee's wages. Certain subsidiaries in the Company's Other International operations have defined benefit and defined contribution plans that are notmaterial. Amounts expensed under all plans were $676, $614, and $578 for 2020, 2019, and 2018, respectively, and are predominantly included inselling, general and administrative expenses in the consolidated statements of income.
Stock-Based Compensation
RSUs granted to employees generally vest over five years and allow for quarterly vesting of the pro-rata number of stock-based awards that would veston the next anniversary of the grant date in the event of retirement or voluntary termination. Actual forfeitures are recognized as they occur.

Compensation expense for stock-based awards is predominantly recognized using the straight-line method over the requisite service period for the entireaward. Awards for employees and non-employee directors provide for accelerated vesting based on cumulative years of service with the Company.Compensation expense for the accelerated shares is recognized upon achievement of the long-service term. The cumulative amount of compensationcost recognized at any point in time equals at least the portion of the grant-date fair value of the award that is vested at that date. The fair value of RSUsis calculated as the market value of the common stock on the measurement date less the present value of the expected dividends forgone during thevesting period.
Stock-based compensation expense is predominantly included in selling, general and administrative expenses in the consolidated statements of income.Certain stock-based compensation costs are capitalized or included in the cost of merchandise. See Note 8 for additional information on the Company’sstock-based compensation plans.
Preopening Expenses
Preopening expenses include costs for startup operations related to new warehouses and relocations, developments in new international markets, newmanufacturing and distribution facilities, and expansions at existing warehouses and are expensed as incurred.
Income Taxes
The Company accounts for income taxes using the asset and liability method. Deferred tax assets and liabilities are recognized for the future taxconsequences attributed to differences between the financial statement carrying amounts of existing assets and liabilities and their respective tax basesand tax credits and loss carry-forwards. Deferred tax assets and liabilities are measured using enacted tax rates expected to apply to taxable income inthe years in which those temporary differences and carry-forwards are expected to be recovered or settled. The effect on deferred tax assets andliabilities of a change in tax rates is recognized in income in the period that includes the enactment date. A valuation allowance is established whennecessary to reduce deferred tax assets to amounts that are more likely than not expected to be realized.
The timing and amounts of deductible and taxable items and the probability of sustaining uncertain tax positions requires significant judgment. Thebenefits of uncertain tax positions are recorded in the Company’s consolidated financial statements only after determining a more-likely-than-notprobability that the uncertain tax positions will withstand challenge from tax authorities. When facts and circumstances change, the Company reassessesthese probabilities and records any changes as appropriate.
Net Income per Common Share Attributable to Costco
The computation of basic net income per share uses the weighted average number of shares that were outstanding during the period. The computationof diluted net income per share uses the weighted average number of shares in the basic net income per share calculation plus the number of commonshares that would be issued assuming vesting of all potentially dilutive common shares outstanding using the treasury stock method for shares subject toRSUs.
Stock Repurchase Programs
Repurchased shares of common stock are retired, in accordance with the Washington Business Corporation Act. The par value of repurchased shares isdeducted from common stock and the excess repurchase price over par value is deducted by allocation to additional paid-in capital and retainedearnings. The amount allocated to additional paid-in capital is the current value of additional paid-in capital per share outstanding and is applied to thenumber of shares repurchased. Any remaining amount is allocated to retained earnings. See Note 7 for additional information.
Recent Accounting Pronouncements Adopted
In February 2016, the Financial Accounting Standards Board (FASB) issued ASU 2016-02 - Leases (ASC 842), which required recognition on thebalance sheet for the rights and obligations created by leases with terms greater than 12 months. The Company adopted ASC 842, using the modifiedretrospective transition method and used September 2, 2019, as the date of initial application. Consequently, the comparative periods presented continueto be in accordance with ASC 840, Leases, previously in effect.
The Company elected the package of practical expedients permitted under the transition guidance, allowing the Company to carry forward conclusionsrelated to: (a) whether expired or existing contracts contain leases; (b) lease classification; and (c) initial direct costs for existing leases. The Companyhas elected not to record operating lease right-of-use assets or lease liabilities associated with leases with durations of 12 months or less. The Companyelected the practical expedient allowing aggregation of non-lease components with related lease components when evaluating the accounting treatmentfor all classes of underlying assets.
Adoption of the new standard resulted in an initial increase to assets and liabilities of $ 2,632, related to recognition of operating lease right-of-use assetsand operating lease obligations as of September 2, 2019. Other impacts in the Company's consolidated balance sheet were not material. The standarddid not materially impact the consolidated statements of income and cash flows. For more information on the Company's lease arrangements refer toNote 6.
Note 2—Acquisition of Innovel
On March 17, 2020, the Company acquired Innovel Solutions for $ 998, using existing cash and cash equivalents. Cash paid excludes the final settlementof certain holdbacks and provisional amounts, discussed below. As part of the acquisition, in the fourth quarter of 2020, a payment of $25 was maderelating to certain holdbacks. Innovel provides final-mile delivery, installation and white-glove capabilities for big and bulky products across the UnitedStates and Puerto Rico. Its financial results have been included in the Company's consolidated financial statements from the date of acquisition. Innovel'sresults of operations were not material to the Company's consolidated results during 2020. Pro forma results are thus not considered meaningful.
As of August 30, 2020, the initial accounting for the acquisition was incomplete, pending determination of the final purchase price, working capitaladjustments, the fair value of operating lease right-of-use assets, operating lease liabilities, and other assumed obligations. The net purchase price of$998 was allocated to tangible and intangible assets of $ 283 and liabilities assumed of $ 219, based on their preliminary fair values on the acquisitiondate. The remaining unallocated net purchase price of $934 was recorded as goodwill. Goodwill represents the acquisition's benefits to the Company,which include the ability to serve more members and improve delivery times, enabling growth in certain segments of our U.S. e-commerce operations.The Company assigned this goodwill, which is deductible for tax purposes, to reporting units within the U.S. segment. The changes to the purchase priceallocation originally recorded in the third quarter of 2020 were not material. As additional information becomes available, the provisional fair valueestimates will be refined.
49

Note 3—Investments
The Company’s investments were as follows:
2020:CostBasis
UnrealizedGains, Net
RecordedBasis
Available-for-sale:Government and agency securities $ 436 $ 12 $ 448
Held-to-maturity:Certificates of deposit 580 — 580
Total short-term investments $ 1,016 $ 12 $ 1,028
2019:CostBasis
UnrealizedGains, Net
RecordedBasis
Available-for-sale:Government and agency securities $ 716 $ 6 $ 722
Held-to-maturity:Certificates of deposit 338 — 338
Total short-term investments $ 1,054 $ 6 $ 1,060
Gross unrecognized holding gains and losses on available-for-sale securities were not material for the years ended August 30, 2020, and September 1,2019. At the end of 2020, there were no available-for-sale securities in a continuous unrealized-loss position. At the end of 2019, available-for-salesecurities that were in a continuous unrealized-loss position were not material. There were no sales of available-for-sale securities during 2020 or 2019.
The maturities of available-for-sale and held-to-maturity securities at the end of 2020 are as follows:
Available-For-SaleHeld-To-Maturity Cost Basis Fair Value
Due in one year or less $ 172 $ 173 $ 580 Due after one year through five years 264 275 — Total $ 436 $ 448 $ 580
50

Note 4—Fair Value Measurement
Assets and Liabilities Measured at Fair Value on a Recurring Basis
The table below presents information regarding the Company’s financial assets and financial liabilities that are measured at fair value on a recurring basisand indicate the level within the hierarchy reflecting the valuation techniques utilized to determine such fair value.
Level 22020 2019
Investment in government and agency securities (1) $ 508 $ 766 Forward foreign-exchange contracts, in asset position (2) 1 15 Forward foreign-exchange contracts, in (liability) position (2) (21) (4)
Total $ 488 $ 777
____________
(1) At August 30, 2020, $60 cash and cash equivalents and $448 short-term investments are included in the accompanying consolidated balance sheets. At September 1, 2019,$44 cash and cash equivalents and $722 short-term investments are included in the consolidated balance sheets.
(2) The asset and the liability values are included in other current assets and other current liabilities, respectively, in the consolidated balance sheets.
At August 30, 2020, and September 1, 2019, the Company did not hold any Level 1 or 3 financial assets or liabilities that were measured at fair value ona recurring basis. There were no transfers between levels during 2020 or 2019.
Assets and Liabilities Measured at Fair Value on a Nonrecurring Basis
Assets and liabilities recognized and disclosed at fair value on a nonrecurring basis include items such as financial assets measured at amortized costand long-lived nonfinancial assets. These assets are measured at fair value if determined to be impaired. There were no fair value adjustments to theseitems during 2020 or 2019.
Note 5—Debt
Short-Term Borrowings
The Company maintains various short-term bank credit facilities, with a borrowing capacity of $ 967 and $865, in 2020 and 2019, respectively. Borrowingson these short-term facilities were immaterial during 2020 and 2019, and there were no outstanding borrowings at the end of 2020 and 2019.
Long-Term Debt
The Company's long-term debt consists primarily of Senior Notes, described below. The Company at its option may redeem the Senior Notes at anytime, in whole or in part, at a redemption price plus accrued interest. The redemption price is equal to the greater of 100% of the principal amount or thesum of the present value of the remaining scheduled payments of principal and interest to maturity. Additionally, upon certain events, the holder has theright to require the Company to purchase this security at a price of 101% of the principal amount plus accrued and unpaid interest to the date of theevent. Interest on all outstanding long-term debt is payable semi-annually. The estimated fair value of Senior Notes is valued using Level 2 inputs.

In April 2020, the Company issued $4,000 in aggregate principal amount of Senior Notes as follows: $ 1,250 of 1.375% due June 2027; $1,750 of 1.600%due April 2030; and $1,000 of 1.750% due April 2032. In May 2020, a portion of the proceeds from the issuance were used to repay, prior to maturity, theoutstanding $1,000 and $500 principal balances and interest on the 2.150% and 2.250% Senior Notes, respectively. The early redemption resulted in a$36 charge which was recorded in interest income and other, net in 2020. The remaining funds are intended for general corporate purposes.
In December 2019, the Company paid the outstanding $ 1,200 principal balance and interest on the 1.700% Senior Notes, with existing sources of cashand cash equivalents and short-term investments. In February 2020, the Company paid the outstanding $500 principal balance and interest on the1.750% Senior Notes, with existing sources of cash and cash equivalents and short-term investments.
Other long-term debt consists of Guaranteed Senior Notes issued by the Company's Japanese subsidiary, valued using Level 3 inputs. In August 2019,the Company's Japanese subsidiary issued approximately $200 and $100 of Guaranteed Senior Notes at fixed interest rates of 0.28% and 0.42%,respectively. Interest is payable semi-annually, and principal is due in August 2029 and August 2034, respectively.
At the end of 2020 and 2019, the fair value of the Company's long-term debt, including the current portion, was approximately $ 7,987 and $6,997,respectively. The carrying value of long-term debt consisted of the following:
2020 2019
1.700% Senior Notes due December 2019 $ — $ 1,200 1.750% Senior Notes due February 2020 — 500 2.150% Senior Notes due May 2021 — 1,000 2.250% Senior Notes due February 2022 — 500 2.300% Senior Notes due May 2022 800 800 2.750% Senior Notes due May 2024 1,000 1,000 3.000% Senior Notes due May 2027 1,000 1,000 1.375% Senior Notes due June 2027 1,250 — 1.600% Senior Notes due April 2030 1,750 — 1.750% Senior Notes due April 2032 1,000 — Other long-term debt 857 852
Total long-term debt 7,657 6,852 Less unamortized debt discounts and issuance costs 48 29 Less current portion(1) 95 1,699 Long-term debt, excluding current portion $ 7,514 $ 5,124
_______________(1) Net of unamortized debt discounts and issuance costs.
Maturities of long-term debt during the next five fiscal years and thereafter are as follows:
2021 $ 95 2022 800 2023 95 2024 1,114 2025 142
Thereafter 5,411
Total $ 7,657
52
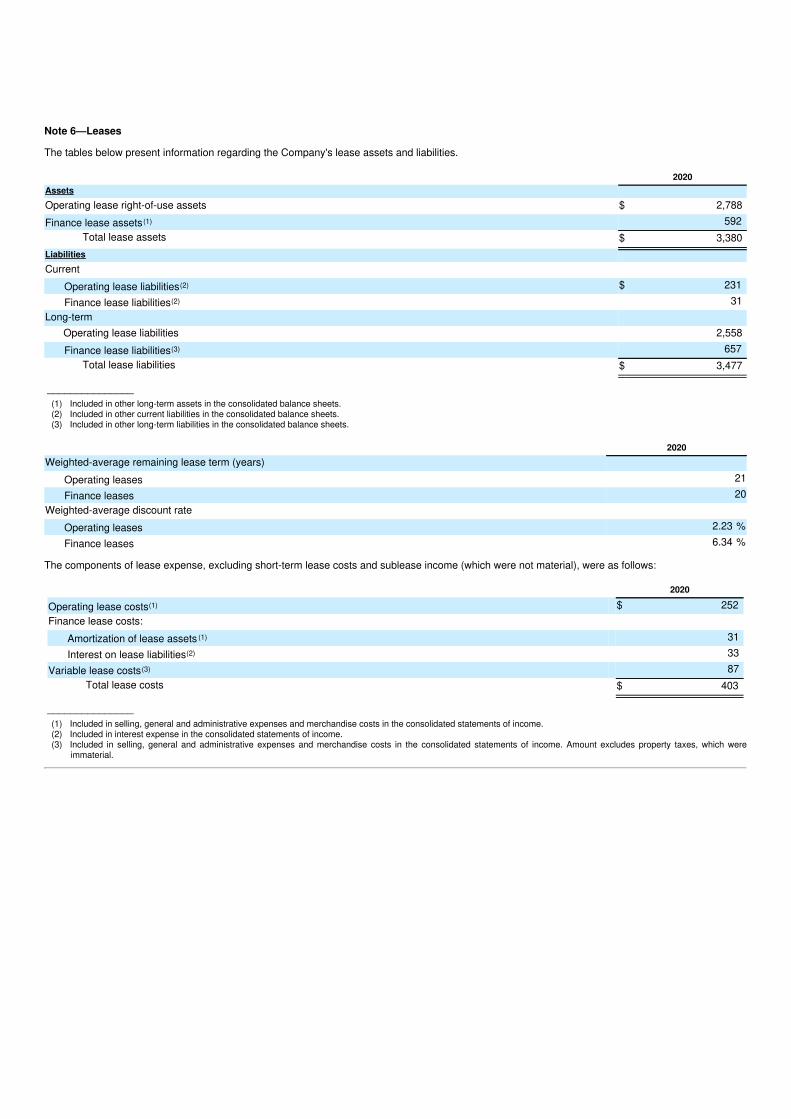
Note 6—Leases
The tables below present information regarding the Company's lease assets and liabilities.
2020Assets
Operating lease right-of-use assets $ 2,788 Finance lease assets (1) 592
Total lease assets $ 3,380 Liabilities
CurrentOperating lease liabilities(2) $ 231 Finance lease liabilities(2) 31
Long-termOperating lease liabilities 2,558 Finance lease liabilities(3) 657
Total lease liabilities $ 3,477
_______________(1) Included in other long-term assets in the consolidated balance sheets.(2) Included in other current liabilities in the consolidated balance sheets.(3) Included in other long-term liabilities in the consolidated balance sheets.
2020
Weighted-average remaining lease term (years)Operating leases 21Finance leases 20
Weighted-average discount rateOperating leases 2.23 %Finance leases 6.34 %
The components of lease expense, excluding short-term lease costs and sublease income (which were not material), were as follows:
2020
Operating lease costs(1) $ 252 Finance lease costs:
Amortization of lease assets (1) 31 Interest on lease liabilities(2) 33
Variable lease costs(3) 87 Total lease costs $ 403
_______________(1) Included in selling, general and administrative expenses and merchandise costs in the consolidated statements of income.(2) Included in interest expense in the consolidated statements of income.(3) Included in selling, general and administrative expenses and merchandise costs in the consolidated statements of income. Amount excludes property taxes, which were
immaterial.
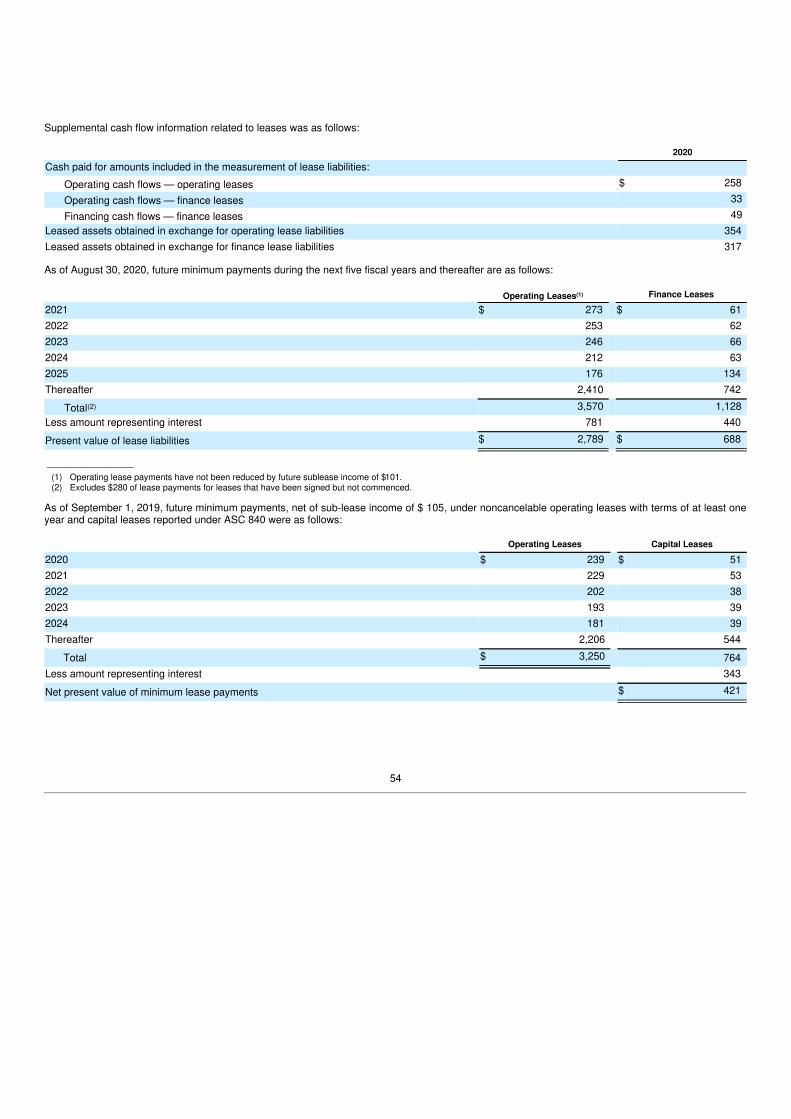
Supplemental cash flow information related to leases was as follows:
2020
Cash paid for amounts included in the measurement of lease liabilities:Operating cash flows — operating leases $ 258 Operating cash flows — finance leases 33 Financing cash flows — finance leases 49
Leased assets obtained in exchange for operating lease liabilities 354 Leased assets obtained in exchange for finance lease liabilities 317
As of August 30, 2020, future minimum payments during the next five fiscal years and thereafter are as follows:
Operating Leases(1) Finance Leases
2021 $ 273 $ 61 2022 253 62 2023 246 66 2024 212 63 2025 176 134 Thereafter 2,410 742
Total(2) 3,570 1,128 Less amount representing interest 781 440
Present value of lease liabilities $ 2,789 $ 688
_______________(1) Operating lease payments have not been reduced by future sublease income of $101.(2) Excludes $280 of lease payments for leases that have been signed but not commenced.
As of September 1, 2019, future minimum payments, net of sub-lease income of $ 105, under noncancelable operating leases with terms of at least oneyear and capital leases reported under ASC 840 were as follows:
Operating Leases Capital Leases
2020 $ 239 $ 51 2021 229 53 2022 202 38 2023 193 39 2024 181 39 Thereafter 2,206 544
Total $ 3,250 764 Less amount representing interest 343
Net present value of minimum lease payments $ 421
54
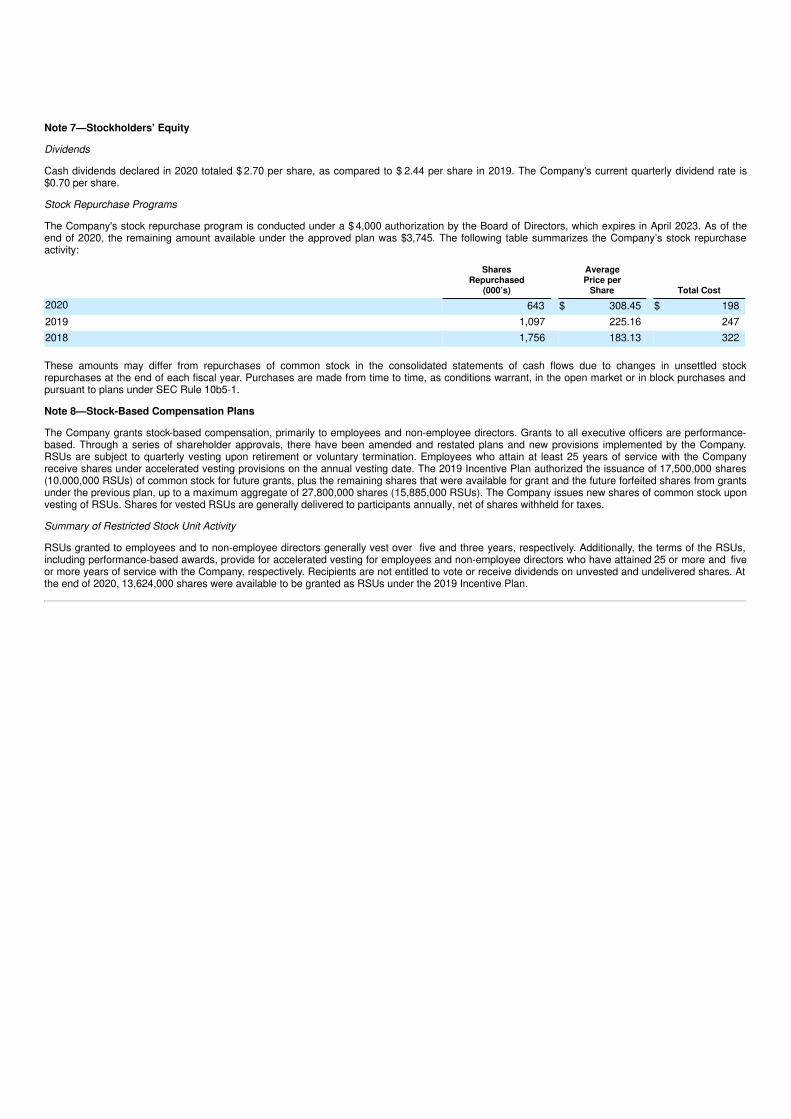
Note 7—Stockholders’ Equity
Dividends
Cash dividends declared in 2020 totaled $ 2.70 per share, as compared to $ 2.44 per share in 2019. The Company's current quarterly dividend rate is$0.70 per share.
Stock Repurchase Programs
The Company's stock repurchase program is conducted under a $ 4,000 authorization by the Board of Directors, which expires in April 2023. As of theend of 2020, the remaining amount available under the approved plan was $3,745. The following table summarizes the Company’s stock repurchaseactivity:
SharesRepurchased
(000’s)
AveragePrice per
Share Total Cost
2020 643 $ 308.45 $ 198 2019 1,097 225.16 247 2018 1,756 183.13 322
These amounts may differ from repurchases of common stock in the consolidated statements of cash flows due to changes in unsettled stockrepurchases at the end of each fiscal year. Purchases are made from time to time, as conditions warrant, in the open market or in block purchases andpursuant to plans under SEC Rule 10b5-1.
Note 8—Stock-Based Compensation Plans
The Company grants stock-based compensation, primarily to employees and non-employee directors. Grants to all executive officers are performance-based. Through a series of shareholder approvals, there have been amended and restated plans and new provisions implemented by the Company.RSUs are subject to quarterly vesting upon retirement or voluntary termination. Employees who attain at least 25 years of service with the Companyreceive shares under accelerated vesting provisions on the annual vesting date. The 2019 Incentive Plan authorized the issuance of 17,500,000 shares(10,000,000 RSUs) of common stock for future grants, plus the remaining shares that were available for grant and the future forfeited shares from grantsunder the previous plan, up to a maximum aggregate of 27,800,000 shares (15,885,000 RSUs). The Company issues new shares of common stock uponvesting of RSUs. Shares for vested RSUs are generally delivered to participants annually, net of shares withheld for taxes.
Summary of Restricted Stock Unit Activity
RSUs granted to employees and to non-employee directors generally vest over five and three years, respectively. Additionally, the terms of the RSUs,including performance-based awards, provide for accelerated vesting for employees and non-employee directors who have attained 25 or more and fiveor more years of service with the Company, respectively. Recipients are not entitled to vote or receive dividends on unvested and undelivered shares. Atthe end of 2020, 13,624,000 shares were available to be granted as RSUs under the 2019 Incentive Plan.

The following awards were outstanding at the end of 2020:
• 5,021,000 time-based RSUs that vest upon continued employment over specified periods of time;
• 153,000 performance-based RSUs, of which 123,000 were granted to executive officers subject to the determination of the attainment ofperformance targets for 2020. This determination occurred in September 2020, at which time at least 33% of the units vested, as a result of thelong service of all executive officers. The remaining awards vest upon continued employment over specified periods of time.
The following table summarizes RSU transactions during 2020:
Number ofUnits
(in 000’s)
Weighted-AverageGrant Date Fair
Value
Outstanding at the end of 2019 6,496 $ 167.55 Granted 2,252 294.08 Vested and delivered (3,374) 188.92 Forfeited (200) 197.45
Outstanding at the end of 2020 5,174 $ 207.55
The weighted-average grant date fair value of RSUs granted was $ 294.08, $224.00, and $156.19 in 2020, 2019, and 2018, respectively. The remainingunrecognized compensation cost related to non-vested RSUs at the end of 2020 was $697 and the weighted-average period of time over which this costwill be recognized is 1.6 years. Included in the outstanding balance at the end of 2020 were approximately 1,733,000 RSUs vested but not yet delivered.
Summary of Stock-Based Compensation
The following table summarizes stock-based compensation expense and the related tax benefits under the Company’s plans:
2020 2019 2018
Stock-based compensation expense $ 619 $ 595 $ 544 Less recognized income tax benefit 128 128 116
Stock-based compensation expense, net $ 491 $ 467 $ 428
Note 9— Taxes
Income Taxes
Income before income taxes is comprised of the following:
2020 2019 2018
Domestic $ 4,204 $ 3,591 $ 3,182 Foreign 1,163 1,174 1,260
Total $ 5,367 $ 4,765 $ 4,442

The provisions for income taxes are as follows:
2020 2019 2018
Federal:Current $ 616 $ 328 $ 636 Deferred 77 222 (35)
Total federal 693 550 601 State:
Current 230 178 190 Deferred 8 26 22
Total state 238 204 212 Foreign:
Current 372 405 487 Deferred 5 (98) (37)
Total foreign 377 307 450 Total provision for income taxes $ 1,308 $ 1,061 $ 1,263
Except for certain provisions, the Tax Cuts and Jobs Act (2017 Tax Act) is effective for tax years beginning on or after January 1, 2018. The Company isa fiscal-year taxpayer, so most provisions became effective for fiscal 2019, including limitations on the Company’s ability to claim foreign tax credits,repeal of the domestic manufacturing deduction, and limitations on certain business deductions. Provisions with significant impacts that were effectivestarting in the second quarter of fiscal 2018 and throughout fiscal 2019 included: a decrease in the U.S. federal income tax rate, remeasurement ofcertain net deferred tax liabilities, and a transition tax on deemed repatriation of certain foreign earnings. The decrease in the U.S. federal statutoryincome tax rate to 21.0% was effective for all of 2020 and 2019 and resulted in a blended rate for the Company of 25.6% for 2018.
The reconciliation between the statutory tax rate and the effective rate for 2020, 2019, and 2018 is as follows:
2020 2019 2018
Federal taxes at statutory rate $ 1,127 21.0 % $ 1,001 21.0 % $ 1,136 25.6 %State taxes, net 190 3.6 171 3.6 154 3.4 Foreign taxes, net 92 1.7 (1) — 32 0.7 Employee stock ownership plan (ESOP) (24) (0.5) (18) (0.4) (14) (0.3)2017 Tax Act — — (123) (2.6) 19 0.4 Other (77) (1.4) 31 0.7 (64) (1.4)
Total $ 1,308 24.4 % $ 1,061 22.3 % $ 1,263 28.4 %
During 2019, the Company recognized net tax benefits of $ 123 related to the 2017 Tax Act. This benefit primarily included $ 105 related to U.S. taxationof deemed foreign dividends, partially offset by losses of current year foreign tax credits. During 2018, the Company recognized a net tax expense of $19related to the 2017 Tax Act. This expense included $142 for the estimated tax on deemed repatriation of foreign earnings, and $ 43 for the reduction inforeign tax credits and other immaterial items, largely offset by a tax benefit of $166 for the remeasurement of certain deferred tax liabilities.

The Company recognized total net tax benefits of $ 81, $221 and $57 in 2020, 2019 and 2018, respectively. These amounts include a benefit of $ 77, $59and $33, respectively, related to the stock-based compensation accounting standard adopted in 2018 in addition to the impacts of the 2017 Tax Act notedabove.
The components of the deferred tax assets (liabilities) are as follows:
2020 2019
Deferred tax assets:Equity compensation $ 80 $ 74 Deferred income/membership fees 144 180 Foreign tax credit carry forward 101 65 Operating lease liabilities 832 — Accrued liabilities and reserves 639 566
Total deferred tax assets 1,796 885 Valuation allowance (105) (76)Total net deferred tax assets 1,691 809 Deferred tax liabilities:
Property and equipment (800) (677)Merchandise inventories (228) (187)Operating lease right-of-use assets (801) — Foreign branch deferreds (81) (69)Other (40) (21)
Total deferred tax liabilities $ (1,950) $ (954) Net deferred tax liabilities $ (259) $ (145)
The deferred tax accounts at the end of 2020 and 2019 include deferred income tax assets of $ 406 and $398, respectively, included in other long-termassets; and deferred income tax liabilities of $665 and $543, respectively, included in other long-term liabilities.
In 2020 and 2019, the Company recorded valuation allowances of $ 105 and $76, respectively, primarily related to foreign tax credits that the Companybelieves will not be realized due to limitations on the ability to claim the credits during the carry forward period. The foreign tax credit carry forwards areset to expire beginning in fiscal 2030.
The Company no longer considers fiscal year earnings of non-U.S. consolidated subsidiaries after 2017 to be indefinitely reinvested and has recordedthe estimated incremental foreign withholding (net of available foreign tax credits) on fiscal year earnings and state income taxes payable assuming ahypothetical repatriation to the U.S. The Company continues to consider undistributed earnings of certain non-U.S. consolidated subsidiaries prior to2018, which totaled $2,955, to be indefinitely reinvested and has not provided for withholding or state taxes.

A reconciliation of the beginning and ending amount of gross unrecognized tax benefits for 2020 and 2019 is as follows:
2020 2019
Gross unrecognized tax benefit at beginning of year $ 27 $ 36 Gross increases—current year tax positions 1 5 Gross increases—tax positions in prior years 8 2 Gross decreases—tax positions in prior years (3) — Settlements — (4)Lapse of statute of limitations (3) (12)
Gross unrecognized tax benefit at end of year $ 30 $ 27
The gross unrecognized tax benefit includes tax positions for which the ultimate deductibility is highly certain but there is uncertainty about the timing ofsuch deductibility. At the end of 2020 and 2019, these amounts were immaterial. Because of the impact of deferred tax accounting, other than interestand penalties, the disallowance of these tax positions would not affect the annual effective tax rate but would accelerate the payment of cash to thetaxing authority. The total amount of such unrecognized tax benefits that, if recognized, would favorably affect the effective income tax rate in futureperiods is $28 and $24 at the end of 2020 and 2019, respectively.
Accrued interest and penalties related to income tax matters are classified as a component of income tax expense. Accrued interest and penaltiesrecognized during 2020 and 2019 and accrued at the end of each respective period were not material.
The Company is currently under audit by several jurisdictions in the United States and in several foreign countries. Some audits may conclude in the next12 months and the unrecognized tax benefits recorded in relation to the audits may differ from actual settlement amounts. It is not practical to estimatethe effect, if any, of any amount of such change during the next 12 months to previously recorded uncertain tax positions in connection with the audits.The Company does not anticipate that there will be a material increase or decrease in the total amount of unrecognized tax benefits in the next 12months.
The Company files income tax returns in the United States, various state and local jurisdictions, in Canada, and in several other foreign jurisdictions. Withfew exceptions, the Company is no longer subject to U.S. federal, state or local examination for years before fiscal 2017. The Company is currentlysubject to examination in California for fiscal years 2013 to present.
Other Taxes
The Company is subject to multiple examinations for value added, sales-based, payroll, product, import or other non-income taxes in various jurisdictions.In certain cases, the Company has received assessments from the authorities. Subsequent to the end of 2019, the Company received an assessmentrelated to a product tax audit covering multiple years. The Company recorded a charge of $123 in 2019. In the fourth quarter of 2020, the Companyreached an agreement with the tax authority on this matter, resulting in a benefit of $84. Other possible losses or range of possible losses associatedwith these matters are either immaterial or an estimate of the possible loss or range of loss cannot be made at this time. If certain matters or a group ofmatters were to be decided adversely to the Company, it could result in a charge that might be material to the results of an individual fiscal quarter oryear.
59

Note 10—Net Income per Common and Common Equivalent Share
The following table shows the amounts used in computing net income per share and the weighted average number of shares of basic and of potentiallydilutive common shares outstanding (shares in 000’s):
2020 2019 2018
Net income attributable to Costco $ 4,002 $ 3,659 $ 3,134
Weighted average basic shares 442,297 439,755 438,515 RSUs 1,604 3,168 3,319
Weighted average diluted shares 443,901 442,923 441,834
Note 11—Commitments and Contingencies
Legal Proceedings
The Company is involved in a number of claims, proceedings and litigation arising from its business and property ownership. In accordance withapplicable accounting guidance, the Company establishes an accrual for legal proceedings if and when those matters reach a stage where they presentloss contingencies that are both probable and reasonably estimable. There may be exposure to loss in excess of any amounts accrued. The Companymonitors those matters for developments that would affect the likelihood of a loss (taking into account where applicable indemnification arrangementsconcerning suppliers and insurers) and the accrued amount, if any, thereof, and adjusts the amount as appropriate. As of the date of this Report, theCompany has recorded immaterial accruals with respect to certain matters described below, in addition to other immaterial accruals for matters notdescribed below. If the loss contingency at issue is not both probable and reasonably estimable, the Company does not establish an accrual, but willcontinue to monitor the matter for developments that will make the loss contingency both probable and reasonably estimable. In each case, there is areasonable possibility that a loss may be incurred, including a loss in excess of the applicable accrual. For matters where no accrual has been recorded,the possible loss or range of loss (including any loss in excess of the accrual) cannot, in the Company's view, be reasonably estimated because, amongother things: (i) the remedies or penalties sought are indeterminate or unspecified; (ii) the legal and/or factual theories are not well developed; and/or(iii) the matters involve complex or novel legal theories or a large number of parties.
The Company is a defendant in an action under the California Labor Code Private Attorneys General Act (PAGA) alleging violation of California WageOrder 7-2001 for failing to provide seating to member service assistants who act as greeters in the Company’s California warehouses. Canela v. CostcoWholesale Corp., et al. (Case No. 5:13-CV-03598; N.D. Cal.; filed July 1, 2013). The complaint seeks relief under the California Labor Code, includingcivil penalties and attorneys’ fees. The Company filed an answer denying the material allegations of the complaint. The action has been remanded tostate court.
In January 2019, an employee brought similar claims for relief concerning Costco employees engaged at member services counters inCalifornia. Rodriguez v. Costco Wholesale Corp. (Case No. RG19001310; Alameda Superior Court). The Company filed an answer denying the materialallegations of the complaint. In December 2018, a depot employee raised similar claims, alleging that depot employees in California did not receivesuitable seating or appropriate workplace temperature conditions. Lane v. Costco Wholesale Corp. (Dec. 6, 2018 Notice to California Labor andWorkforce Development Agency). The Company filed an answer denying the material allegations of the complaint. In October 2019, the parties reachedan agreement to settle the seating claims on a representative basis, which received court approval in February 2020.

In January 2019, a former seasonal employee filed a class action, alleging failure to provide California seasonal employees meal and rest breaks, properwage statements, and appropriate wages. Jadan v. Costco Wholesale Corp. (Case No. 19-CV-340438; Santa Clara Superior Court). The complaintseeks relief under the California Labor Code, including civil penalties and attorneys’ fees. In October 2019, the parties reached an agreement on a classsettlement, which received preliminary court approval in July 2020.
In March 2019, employees filed a class action against the Company alleging claims under California law for failure to pay overtime, to provide meal andrest periods and itemized wage statements, to timely pay wages due to terminating employees, to pay minimum wages, and for unfair business practices.Relief is sought under the California Labor Code, including civil penalties and attorneys' fees. Nevarez v. Costco Wholesale Corp. (Case No. 2:19-cv-03454; C.D. Cal.). The Company filed an answer denying the material allegations of the complaint. In December 2019, the court issued an order denyingclass certification. In January 2020, the plaintiffs dismissed their Labor Code claims without prejudice, and the court remanded the action to state court.The remand is being appealed.
In May 2019, an employee filed a class action against the Company alleging claims under California law for failure to pay overtime, to provide itemizedwage statements, to timely pay wages due to terminating employees, to pay minimum wages, and for unfair business practices. Rough v. CostcoWholesale Corp. (Case No. 2:19-cv-01340; E.D. Cal.). Relief is sought under the California Labor Code, including civil penalties and attorneys' fees. InAugust 2019, Rough filed a companion case in state court seeking penalties under PAGA. Rough v. Costco Wholesale Corp. (Case No. FCS053454;Sonoma County Superior Court). Relief is sought under the California Labor Code, including civil penalties and attorneys' fees. The state court action hasbeen stayed pending resolution of the federal action.
In June 2019, an employee filed a class action against the Company alleging claims under California law for failure to pay overtime, to provide meal andrest periods, itemized wage statements, to timely pay wages due to terminating employees, to pay minimum wages, and for unfair business practices.Martinez v. Costco Wholesale Corp . (Case No. 3:19-cv-05624; N.D. Cal.). The Company filed an answer denying the material allegations of thecomplaint.
In April 2020, an employee, alleging underpayment of sick pay, filed a class and representative action against the Company, alleging claims underCalifornia law for failure to pay all wages at termination and for Labor Code penalties under PAGA. Kristy v. Costco Wholesale Corp. (Case No.20CV366341; Santa Clara County Superior Court). A motion to dismiss was filed as to plaintiff's amended complaint, the case has been stayed due tothe plaintiff's bankruptcy.
In July 2020, an employee filed an action under PAGA on behalf of all California non-exempt employees alleging violations of California Labor Codeprovisions regarding meal and rest periods, minimum wage, overtime, wage statements, reimbursement of expenses, and payment of wages attermination. Schwab v. Costco Wholesale Corporation (Case No. 37-2020-00023551-CU-OE-CTL; San Diego County Superior Court). In August 2020,the Company filed a motion to strike portions of the complaint.
In December 2017, the United States Judicial Panel on Multidistrict Litigation consolidated numerous cases concerning the impacts of opioid abuses filedagainst various defendants by counties, cities, hospitals, Native American tribes, third-party payors, and others. In re National Prescription OpiateLitigation (MDL No. 2804) (N.D. Ohio). Included are federal cases that name the Company, including actions filed by counties and cities in Michigan,New Jersey, Oregon, Virginia and South Carolina, a third-party payor in Ohio, and class actions filed on behalf of infants born with opioid-related medicalconditions in 40 states, and class actions and individual actions filed on behalf of individuals seeking to recover alleged increased insurance costsassociated with opioid abuse in 43 states and American Samoa. In 2019, similar actions were commenced against the Company in state court in Utah.Claims against the Company in state courts in New Jersey, Oklahoma, and Arizona have been dismissed. The Company is defending all of thesematters.

The Company and its CEO and CFO are defendants in putative class actions brought on behalf of shareholders who acquired Company stock betweenJune 6 and October 25, 2018. Johnson v. Costco Wholesale Corp., et al. (W.D. Wash.; filed Nov. 5, 2018); Chen v. Costco Wholesale Corp., et al. (W.D.Wash.; filed Dec. 11, 2018). The complaints allege violations of the federal securities laws stemming from the Company’s disclosures concerning internalcontrol over financial reporting. They seek unspecified damages, equitable relief, interest, and costs and attorneys’ fees. On January 30, 2019, an orderwas entered consolidating the actions, and a consolidated amended complaint was filed on April 16, 2019. On November 26, 2019, the court entered anorder dismissing the consolidated amended complaint and granting the plaintiffs leave to file a further amended complaint. A further amended complaintwas filed on March 9, which the court dismissed with prejudice on August 19, 2020. Plaintiffs filed a notice of appeal in September 2020.
Members of the Board of Directors, one other individual, and the Company are defendants in a shareholder derivative action related to the internalcontrols and related disclosures identified in the putative class actions, alleging that the individual defendants breached their fiduciary duties. Wedekindv. Hamilton James, Susan Decker, Kenneth Denman, Richard Galanti, Craig Jelinek, Richard Libenson, John Meisenbach, Charles Munger, JeffreyRaikes, John Stanton, Mary Agnes Wilderotter, and Costco Wholesale Corp. (W.D. Wash.; filed Dec. 11, 2018). The complaint seeks unspecifieddamages, disgorgement of compensation, corporate governance changes, and costs and attorneys' fees. Because the complaint is derivative in nature, itdoes not seek monetary damages from the Company, which is a nominal defendant. By agreement among the parties the action has been stayedpending further proceedings in the class action. Similar actions were filed in King County Superior Court on February 20, 2019, Elliott v. Hamilton James,Susan Decker, Kenneth Denman, Richard Galanti, Craig Jelinek, Richard Libenson, John Meisenbach, Charles Munger, Jeffrey Raikes, John Stanton,Mary Agnes Wilderotter, and Costco Wholesale Corp. (Case No. 19-2-04824-7), April 16, 2019, Brad Shuman, et ano. v. Hamilton James, Susan Decker,Kenneth Denman, Richard Galanti, Craig Jelinek, John Meisenbach, Charles Munger, Jeffrey Raikes, John Stanton, Mary Agnes Wilderotter, and CostcoWholesale Corp. (Case No. 19-2-10460-1), and June 12, 2019, Rahul Modi v. Hamilton James, Susan Decker, Kenneth Denman, Richard Galanti, CraigJelinek, John Meisenbach, Charles Munger, Jeffrey Raikes, John Stanton, Mary Agnes Wilderotter, and Costco Wholesale Corp. (Case No. 19-2-15514-1). These actions have also been stayed.
On June 23, 2020, a putative class action was filed against the Company, the "Board of Directors," the "Costco Benefits Committee" and others underthe Employee Retirement Income Security Act, in the United States District Court for the Eastern District of Wisconsin. Dustin S. Soulek v. CostcoWholesale, et al., Case No. 20-cv-937. The class is alleged to be beneficiaries of the Costco 401(k) plan from June 23, 2014, and the claims are that thedefendants breached their fiduciary duties in the operation and oversight of the plan. The complaint seeks injunctive relief, damages, interest, costs, andattorneys' fees. On September 11, the defendants filed a motion to dismiss the complaint, and on September 21 the plaintiffs filed an amendedcomplaint.
The Company does not believe that any pending claim, proceeding or litigation, either alone or in the aggregate, will have a material adverse effect onthe Company’s financial position, results of operations or cash flows; however, it is possible that an unfavorable outcome of some or all of the matters,however unlikely, could result in a charge that might be material to the results of an individual fiscal quarter or year.
62
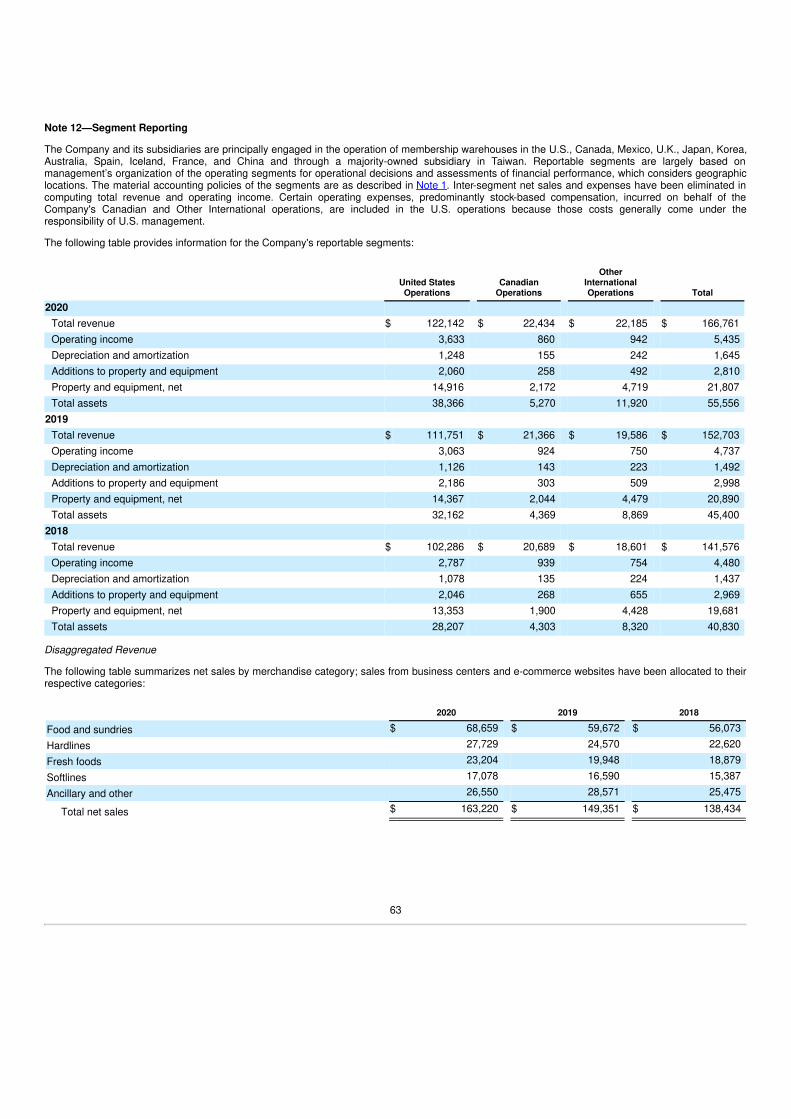
Note 12—Segment Reporting
The Company and its subsidiaries are principally engaged in the operation of membership warehouses in the U.S., Canada, Mexico, U.K., Japan, Korea,Australia, Spain, Iceland, France, and China and through a majority-owned subsidiary in Taiwan. Reportable segments are largely based onmanagement’s organization of the operating segments for operational decisions and assessments of financial performance, which considers geographiclocations. The material accounting policies of the segments are as described in Note 1. Inter-segment net sales and expenses have been eliminated incomputing total revenue and operating income. Certain operating expenses, predominantly stock-based compensation, incurred on behalf of theCompany's Canadian and Other International operations, are included in the U.S. operations because those costs generally come under theresponsibility of U.S. management.
The following table provides information for the Company's reportable segments:
United StatesOperations
CanadianOperations
OtherInternationalOperations Total
2020Total revenue $ 122,142 $ 22,434 $ 22,185 $ 166,761 Operating income 3,633 860 942 5,435 Depreciation and amortization 1,248 155 242 1,645 Additions to property and equipment 2,060 258 492 2,810 Property and equipment, net 14,916 2,172 4,719 21,807 Total assets 38,366 5,270 11,920 55,556
2019Total revenue $ 111,751 $ 21,366 $ 19,586 $ 152,703 Operating income 3,063 924 750 4,737 Depreciation and amortization 1,126 143 223 1,492 Additions to property and equipment 2,186 303 509 2,998 Property and equipment, net 14,367 2,044 4,479 20,890 Total assets 32,162 4,369 8,869 45,400
2018Total revenue $ 102,286 $ 20,689 $ 18,601 $ 141,576 Operating income 2,787 939 754 4,480 Depreciation and amortization 1,078 135 224 1,437 Additions to property and equipment 2,046 268 655 2,969 Property and equipment, net 13,353 1,900 4,428 19,681 Total assets 28,207 4,303 8,320 40,830
Disaggregated Revenue
The following table summarizes net sales by merchandise category; sales from business centers and e-commerce websites have been allocated to theirrespective categories:
2020 2019 2018
Food and sundries $ 68,659 $ 59,672 $ 56,073 Hardlines 27,729 24,570 22,620 Fresh foods 23,204 19,948 18,879 Softlines 17,078 16,590 15,387 Ancillary and other 26,550 28,571 25,475
Total net sales $ 163,220 $ 149,351 $ 138,434
63
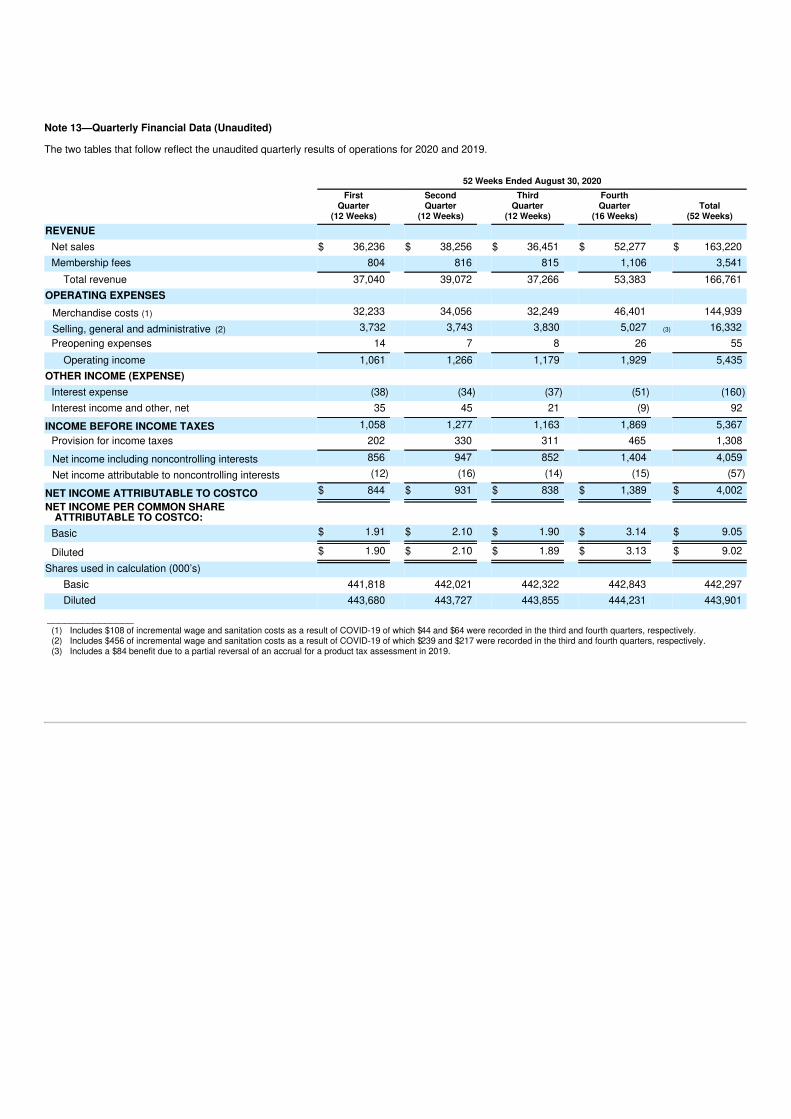
Note 13—Quarterly Financial Data (Unaudited)
The two tables that follow reflect the unaudited quarterly results of operations for 2020 and 2019.
52 Weeks Ended August 30, 2020
FirstQuarter
(12 Weeks)
SecondQuarter
(12 Weeks)
ThirdQuarter
(12 Weeks)
FourthQuarter
(16 Weeks)Total
(52 Weeks)
REVENUENet sales $ 36,236 $ 38,256 $ 36,451 $ 52,277 $ 163,220 Membership fees 804 816 815 1,106 3,541
Total revenue 37,040 39,072 37,266 53,383 166,761 OPERATING EXPENSES
Merchandise costs (1) 32,233 34,056 32,249 46,401 144,939 Selling, general and administrative (2) 3,732 3,743 3,830 5,027 (3) 16,332 Preopening expenses 14 7 8 26 55
Operating income 1,061 1,266 1,179 1,929 5,435 OTHER INCOME (EXPENSE)
Interest expense (38) (34) (37) (51) (160)Interest income and other, net 35 45 21 (9) 92
INCOME BEFORE INCOME TAXES 1,058 1,277 1,163 1,869 5,367 Provision for income taxes 202 330 311 465 1,308
Net income including noncontrolling interests 856 947 852 1,404 4,059 Net income attributable to noncontrolling interests (12) (16) (14) (15) (57)
NET INCOME ATTRIBUTABLE TO COSTCO $ 844 $ 931 $ 838 $ 1,389 $ 4,002 NET INCOME PER COMMON SHARE
ATTRIBUTABLE TO COSTCO:Basic $ 1.91 $ 2.10 $ 1.90 $ 3.14 $ 9.05
Diluted $ 1.90 $ 2.10 $ 1.89 $ 3.13 $ 9.02 Shares used in calculation (000’s)
Basic 441,818 442,021 442,322 442,843 442,297 Diluted 443,680 443,727 443,855 444,231 443,901
_______________(1) Includes $108 of incremental wage and sanitation costs as a result of COVID-19 of which $44 and $64 were recorded in the third and fourth quarters, respectively.(2) Includes $456 of incremental wage and sanitation costs as a result of COVID-19 of which $239 and $217 were recorded in the third and fourth quarters, respectively.(3) Includes a $84 benefit due to a partial reversal of an accrual for a product tax assessment in 2019.
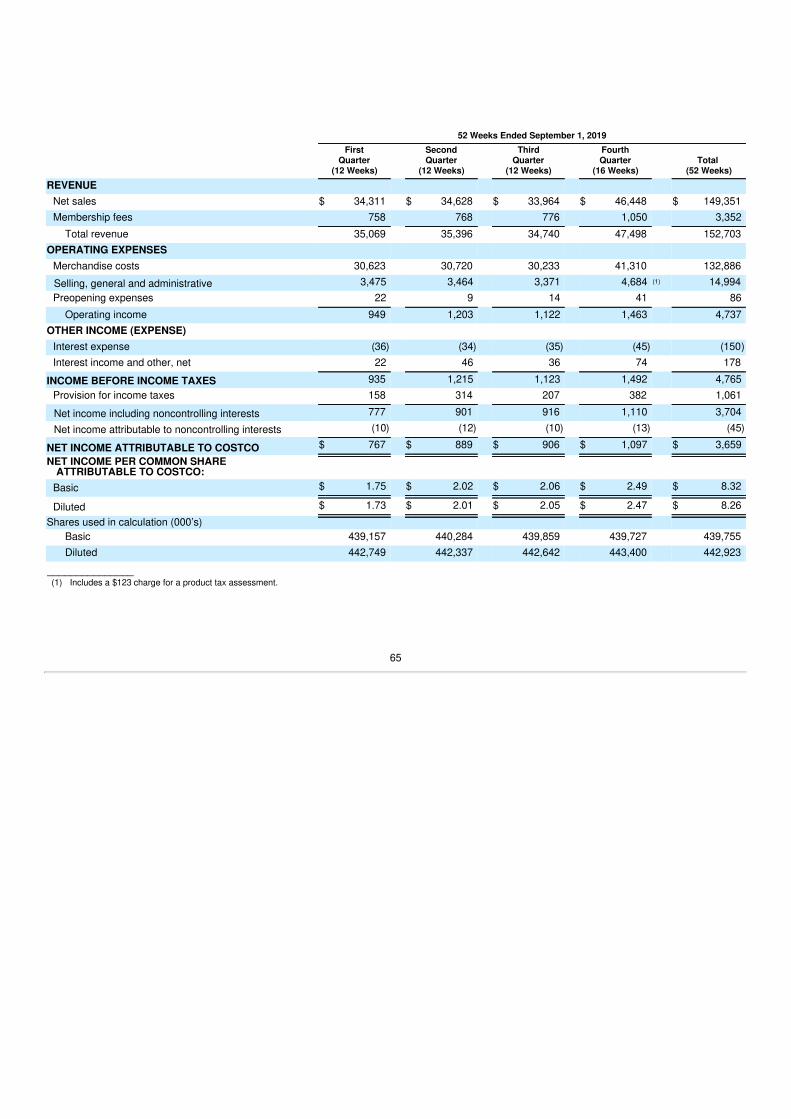
52 Weeks Ended September 1, 2019
FirstQuarter
(12 Weeks)
SecondQuarter
(12 Weeks)
ThirdQuarter
(12 Weeks)
FourthQuarter
(16 Weeks)Total
(52 Weeks)
REVENUENet sales $ 34,311 $ 34,628 $ 33,964 $ 46,448 $ 149,351 Membership fees 758 768 776 1,050 3,352
Total revenue 35,069 35,396 34,740 47,498 152,703 OPERATING EXPENSES
Merchandise costs 30,623 30,720 30,233 41,310 132,886 Selling, general and administrative 3,475 3,464 3,371 4,684 (1) 14,994 Preopening expenses 22 9 14 41 86
Operating income 949 1,203 1,122 1,463 4,737 OTHER INCOME (EXPENSE)
Interest expense (36) (34) (35) (45) (150)Interest income and other, net 22 46 36 74 178
INCOME BEFORE INCOME TAXES 935 1,215 1,123 1,492 4,765 Provision for income taxes 158 314 207 382 1,061
Net income including noncontrolling interests 777 901 916 1,110 3,704 Net income attributable to noncontrolling interests (10) (12) (10) (13) (45)
NET INCOME ATTRIBUTABLE TO COSTCO $ 767 $ 889 $ 906 $ 1,097 $ 3,659 NET INCOME PER COMMON SHARE
ATTRIBUTABLE TO COSTCO:Basic $ 1.75 $ 2.02 $ 2.06 $ 2.49 $ 8.32
Diluted $ 1.73 $ 2.01 $ 2.05 $ 2.47 $ 8.26 Shares used in calculation (000’s)
Basic 439,157 440,284 439,859 439,727 439,755 Diluted 442,749 442,337 442,642 443,400 442,923
_______________(1) Includes a $123 charge for a product tax assessment.
65
Item 9—Changes in and Disagreements with Accountants on Accounting and Financial Disclosure
None.
Item 9A—Controls and Procedures
Evaluation of Disclosure Controls and Procedures
Our disclosure controls and procedures (as defined in Rules 13a-15(e) or 15d-15(e) under the Securities Exchange Act of 1934, as amended) aredesigned to ensure that information required to be disclosed in the reports that we file or submit under the Exchange Act is recorded, processed,summarized, and reported within the time periods specified in the rules and forms of the SEC and to ensure that information required to be disclosed isaccumulated and communicated to management, including our principal executive and financial officers, to allow timely decisions regarding disclosure.The Chief Executive Officer and the Chief Financial Officer, with assistance from other members of management, have reviewed the effectiveness of ourdisclosure controls and procedures as of August 30, 2020 and, based on their evaluation, have concluded that the disclosure controls and procedureswere effective as of such date.
Management's Annual Report on Internal Control Over Financial Reporting
Our management is responsible for establishing and maintaining adequate internal control over financial reporting as defined in Rule 13a-15(f) under theExchange Act. Our internal control over financial reporting is designed to provide reasonable assurance regarding the reliability of financial reporting andthe preparation of financial statements for external purposes in accordance with U.S. GAAP and includes those policies and procedures that: (1) pertainto the maintenance of records that in reasonable detail accurately and fairly reflect our transactions and the dispositions of our assets; (2) providereasonable assurance that our transactions are recorded as necessary to permit preparation of financial statements in accordance with generallyaccepted accounting principles and that our receipts and expenditures are being made only in accordance with appropriate authorizations; and (3) providereasonable assurance regarding prevention or timely detection of unauthorized acquisition, use or disposition of our assets that could have a materialeffect on our financial statements.
Because of its inherent limitations, internal control over financial reporting may not prevent or detect misstatements. Projections of any evaluation ofeffectiveness for future periods are subject to the risk that controls may become inadequate because of changes in conditions, or that the degree ofcompliance with the policies or procedures may deteriorate.
Under the supervision of and with the participation of our management, we assessed the effectiveness of our internal control over financial reporting as ofAugust 30, 2020, using the criteria set forth by the Committee of Sponsoring Organizations of the Treadway Commission in Internal Control—IntegratedFramework (2013).
Based on its assessment, management has concluded that our internal control over financial reporting was effective as of August 30, 2020. Theattestation of KPMG LLP, our independent registered public accounting firm, on the effectiveness of our internal control over financial reporting isincluded with the consolidated financial statements in Item 8 of this Report.

Changes in Internal Control Over Financial Reporting
There have been no changes in our internal control over financial reporting (as defined in Rules 13a-15(f) or 15d-15(f) of the Exchange Act) that occurredduring the fourth quarter of 2020 that have materially affected, or are reasonably likely to materially affect, the Company’s internal control over financialreporting.
/s/ W. CRAIG JELINEK
W. Craig JelinekPresident, Chief Executive Officer and Director
/s/ RICHARD A. GALANTI
Richard A. GalantiExecutive Vice President, Chief Financial Officer andDirector
Item 9B—Other Information
None.
PART III
Item 10—Directors, Executive Officers and Corporate Governance
Information relating to the availability of our code of ethics for senior financial officers and a list of our executive officers appear in Part I, Item 1 of thisReport. The information required by this Item concerning our directors and nominees for director is incorporated herein by reference to the sectionsentitled “Proposal 1: Election of Directors,” “Directors” and “Committees of the Board” in Costco’s Proxy Statement for its 2021 annual meeting ofshareholders, which will be filed with the SEC within 120 days of the end of our fiscal year (“Proxy Statement”).
Item 11—Executive Compensation
The information required by this Item is incorporated herein by reference to the sections entitled “Compensation of Directors,” “Executive Compensation,”and “Compensation Discussion and Analysis” in Costco’s Proxy Statement.
Item 12—Security Ownership of Certain Beneficial Owners and Management and Related Stockholder Matters
The information required by this Item is incorporated herein by reference to the section entitled “Principal Shareholders” and “Equity Compensation PlanInformation” in Costco’s Proxy Statement.
Item 13—Certain Relationships and Related Transactions, and Director Independence
The information required by this Item is incorporated herein by reference to the sections entitled “Proposal 1: Election of Directors,” “Directors,”“Committees of the Board,” “Shareholder Communications to the Board,” “Meeting Attendance,” “Report of the Compensation Committee of the Board ofDirectors,” “Certain Relationships and Transactions” and “Report of the Audit Committee” in Costco’s Proxy Statement.
Item 14—Principal Accounting Fees and Services
The information required by this Item is incorporated herein by reference to the sections entitled “Independent Public Accountants” in Costco’s ProxyStatement.
67
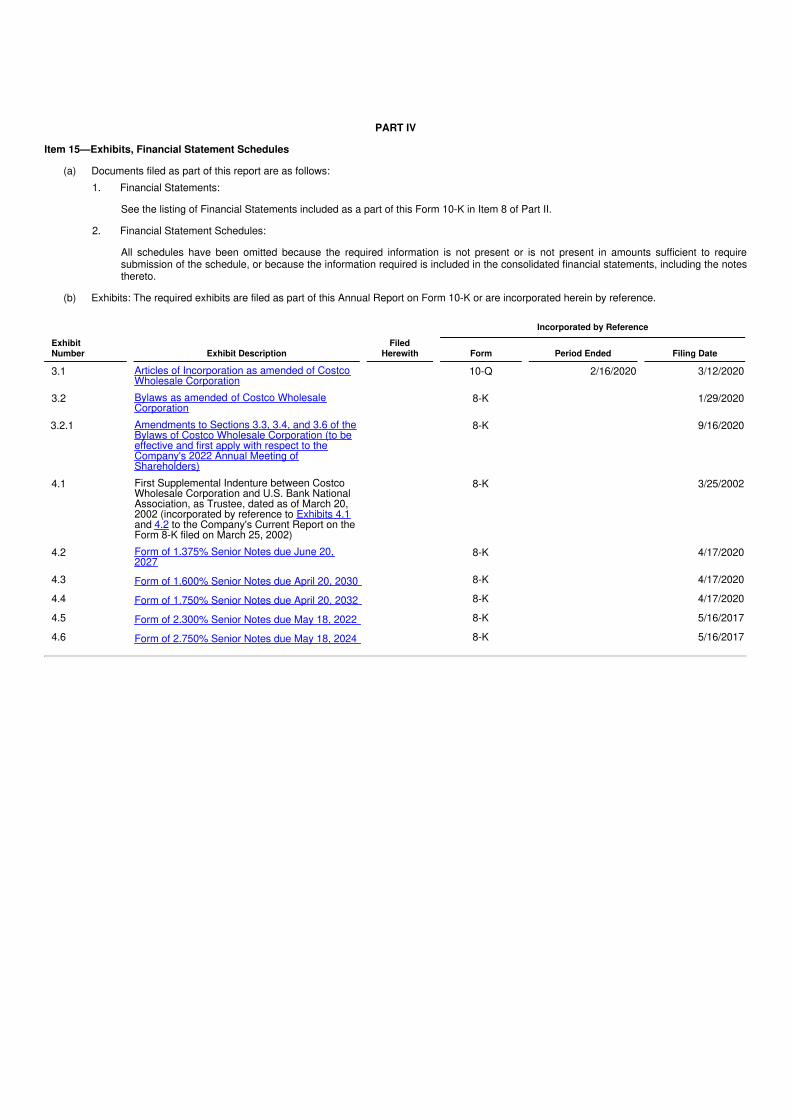
PART IV
Item 15—Exhibits, Financial Statement Schedules
(a) Documents filed as part of this report are as follows:1. Financial Statements:
See the listing of Financial Statements included as a part of this Form 10-K in Item 8 of Part II.
2. Financial Statement Schedules:
All schedules have been omitted because the required information is not present or is not present in amounts sufficient to requiresubmission of the schedule, or because the information required is included in the consolidated financial statements, including the notesthereto.
(b) Exhibits: The required exhibits are filed as part of this Annual Report on Form 10-K or are incorporated herein by reference.
Incorporated by Reference
ExhibitNumber Exhibit Description
FiledHerewith Form Period Ended Filing Date
3.1 Articles of Incorporation as amended of CostcoWholesale Corporation
10-Q 2/16/2020 3/12/2020
3.2 Bylaws as amended of Costco WholesaleCorporation
8-K 1/29/2020
3.2.1 Amendments to Sections 3.3, 3.4, and 3.6 of theBylaws of Costco Wholesale Corporation (to beeffective and first apply with respect to theCompany's 2022 Annual Meeting ofShareholders)
8-K 9/16/2020
4.1 First Supplemental Indenture between CostcoWholesale Corporation and U.S. Bank NationalAssociation, as Trustee, dated as of March 20,2002 (incorporated by reference to Exhibits 4.1and 4.2 to the Company's Current Report on theForm 8-K filed on March 25, 2002)
8-K 3/25/2002
4.2 Form of 1.375% Senior Notes due June 20,2027
8-K 4/17/2020
4.3 Form of 1.600% Senior Notes due April 20, 2030 8-K 4/17/2020
4.4 Form of 1.750% Senior Notes due April 20, 2032 8-K 4/17/2020
4.5 Form of 2.300% Senior Notes due May 18, 2022 8-K 5/16/2017
4.6 Form of 2.750% Senior Notes due May 18, 2024 8-K 5/16/2017
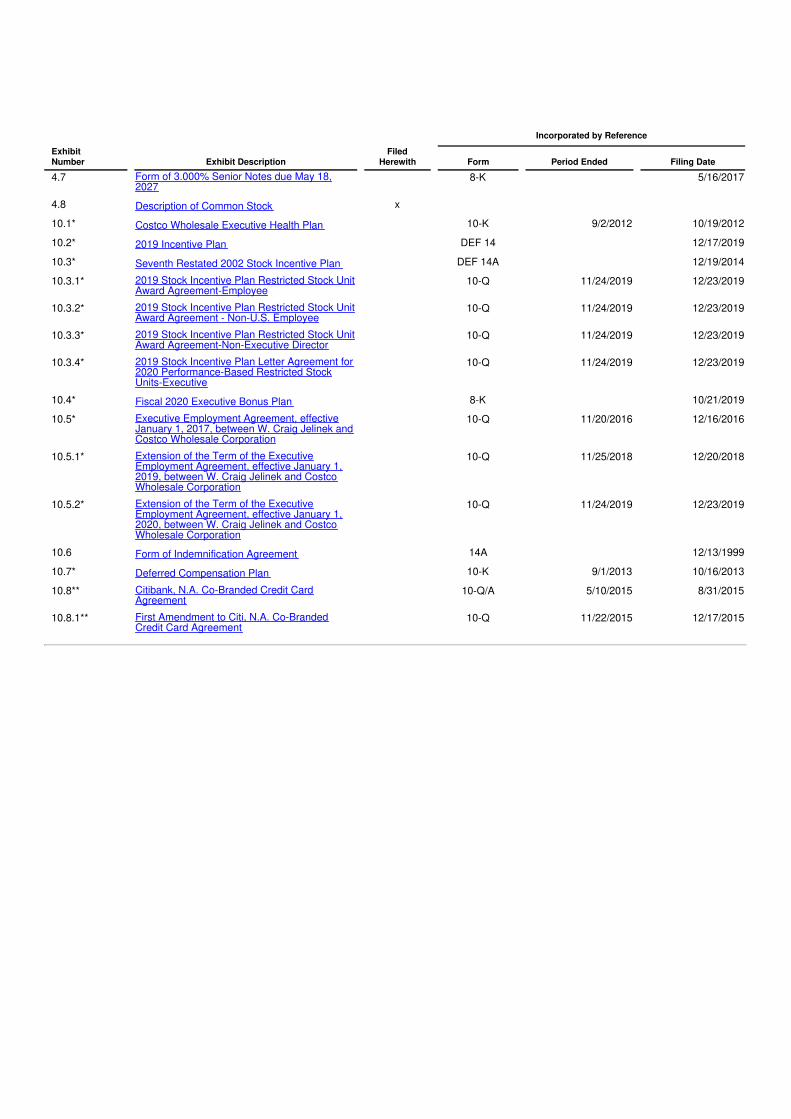
Incorporated by Reference
ExhibitNumber Exhibit Description
FiledHerewith Form Period Ended Filing Date
4.7 Form of 3.000% Senior Notes due May 18,2027
8-K 5/16/2017
4.8 Description of Common Stock x
10.1* Costco Wholesale Executive Health Plan 10-K 9/2/2012 10/19/2012
10.2* 2019 Incentive Plan DEF 14 12/17/2019
10.3* Seventh Restated 2002 Stock Incentive Plan DEF 14A 12/19/2014
10.3.1* 2019 Stock Incentive Plan Restricted Stock UnitAward Agreement-Employee
10-Q 11/24/2019 12/23/2019
10.3.2* 2019 Stock Incentive Plan Restricted Stock UnitAward Agreement - Non-U.S. Employee
10-Q 11/24/2019 12/23/2019
10.3.3* 2019 Stock Incentive Plan Restricted Stock UnitAward Agreement-Non-Executive Director
10-Q 11/24/2019 12/23/2019
10.3.4* 2019 Stock Incentive Plan Letter Agreement for2020 Performance-Based Restricted StockUnits-Executive
10-Q 11/24/2019 12/23/2019
10.4* Fiscal 2020 Executive Bonus Plan 8-K 10/21/2019
10.5* Executive Employment Agreement, effectiveJanuary 1, 2017, between W. Craig Jelinek andCostco Wholesale Corporation
10-Q 11/20/2016 12/16/2016
10.5.1* Extension of the Term of the ExecutiveEmployment Agreement, effective January 1,2019, between W. Craig Jelinek and CostcoWholesale Corporation
10-Q 11/25/2018 12/20/2018
10.5.2* Extension of the Term of the ExecutiveEmployment Agreement, effective January 1,2020, between W. Craig Jelinek and CostcoWholesale Corporation
10-Q 11/24/2019 12/23/2019
10.6 Form of Indemnification Agreement 14A 12/13/1999
10.7* Deferred Compensation Plan 10-K 9/1/2013 10/16/2013
10.8** Citibank, N.A. Co-Branded Credit CardAgreement
10-Q/A 5/10/2015 8/31/2015
10.8.1** First Amendment to Citi, N.A. Co-BrandedCredit Card Agreement
10-Q 11/22/2015 12/17/2015
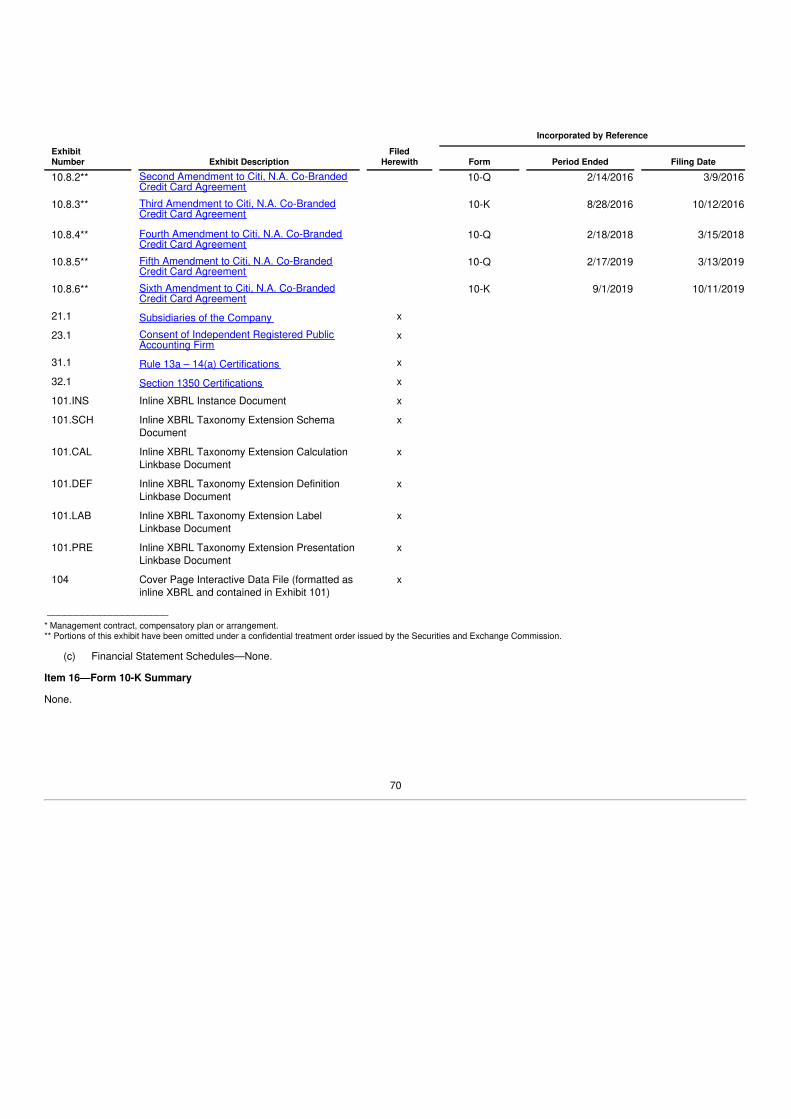
Incorporated by Reference
ExhibitNumber Exhibit Description
FiledHerewith Form Period Ended Filing Date
10.8.2** Second Amendment to Citi, N.A. Co-BrandedCredit Card Agreement
10-Q 2/14/2016 3/9/2016
10.8.3** Third Amendment to Citi, N.A. Co-BrandedCredit Card Agreement
10-K 8/28/2016 10/12/2016
10.8.4** Fourth Amendment to Citi, N.A. Co-BrandedCredit Card Agreement
10-Q 2/18/2018 3/15/2018
10.8.5** Fifth Amendment to Citi, N.A. Co-BrandedCredit Card Agreement
10-Q 2/17/2019 3/13/2019
10.8.6** Sixth Amendment to Citi, N.A. Co-BrandedCredit Card Agreement
10-K 9/1/2019 10/11/2019
21.1 Subsidiaries of the Company x
23.1 Consent of Independent Registered PublicAccounting Firm
x
31.1 Rule 13a – 14(a) Certifications x
32.1 Section 1350 Certifications x
101.INS Inline XBRL Instance Document x
101.SCH Inline XBRL Taxonomy Extension SchemaDocument
x
101.CAL Inline XBRL Taxonomy Extension CalculationLinkbase Document
x
101.DEF Inline XBRL Taxonomy Extension DefinitionLinkbase Document
x
101.LAB Inline XBRL Taxonomy Extension LabelLinkbase Document
x
101.PRE Inline XBRL Taxonomy Extension PresentationLinkbase Document
x
104 Cover Page Interactive Data File (formatted asinline XBRL and contained in Exhibit 101)
x
_____________________* Management contract, compensatory plan or arrangement.** Portions of this exhibit have been omitted under a confidential treatment order issued by the Securities and Exchange Commission.
(c) Financial Statement Schedules—None.
Item 16—Form 10-K Summary
None.
70

SIGNATURES
Pursuant to the requirements of Section 13 or 15(d) of the Securities Exchange Act of 1934, the registrant has duly caused this report to be signed on itsbehalf by the undersigned, thereunto duly authorized.
October 6, 2020
COSTCO WHOLESALE CORPORATION(Registrant)
By /s/ RICHARD A. GALANTIRichard A. Galanti
Executive Vice President, Chief Financial Officer and Director
Pursuant to the requirements of the Securities Exchange Act of 1934, this report has been signed below by the following persons on behalf of theregistrant and in the capacities and on the dates indicated.
October 6, 2020
By /s/ W. CRAIG JELINEK By /s/ HAMILTON E. JAMES
W. Craig Jelinek
President, Chief Executive Officer and Director Hamilton E. James
Chairman of the Board
By /s/ RICHARD A. GALANTI By /s/ DANIEL M. HINES
Richard A. GalantiExecutive Vice President, Chief Financial Officer and Director
(Principal Financial Officer)
Daniel M. HinesSenior Vice President and Corporate Controller
(Principal Accounting Officer)
By /s/ SUSAN L. DECKER By /s/ KENNETH D. DENMAN
Susan L. Decker
DirectorKenneth D. Denman
Director
By /s/ SALLY JEWELL By /s/ CHARLES T. MUNGER
Sally Jewell
Director Charles T. Munger
Director
By /s/ JEFFREY S. RAIKES By /s/ JOHN W. STANTON
Jeffrey S. Raikes
Director John W. Stanton
Director
By /s/ MARY (MAGGIE) A. WILDEROTTERMary (Maggie) A. Wilderotter
Director
71