cost reporting for patient access and patient financial...
TRANSCRIPT

Cost Reporting for Patient Access
and Patient Financial Services
Presented by:
Shar Sheaffer, CPA
What is the purpose of a
Medicare Cost Report?
•Informational
•Determination of Medicare’s share of costs
•Determination of cost settlement

Medicare Cost Report – Summary
Worksheet
S Information, settlement, days, discharges,
observation hours, wage index, old 339
A Cost by department
B Allocation of support (overhead) costs
C Charges by department, calculation of the cost
to charge ratio
D Determination of Medicare’s costs, including
Medicare bad debts
E Medicare settlement, EHR calculation
G Financial statements
H Home health
I Renal Dialysis
K Hospice
M Rural health clinic
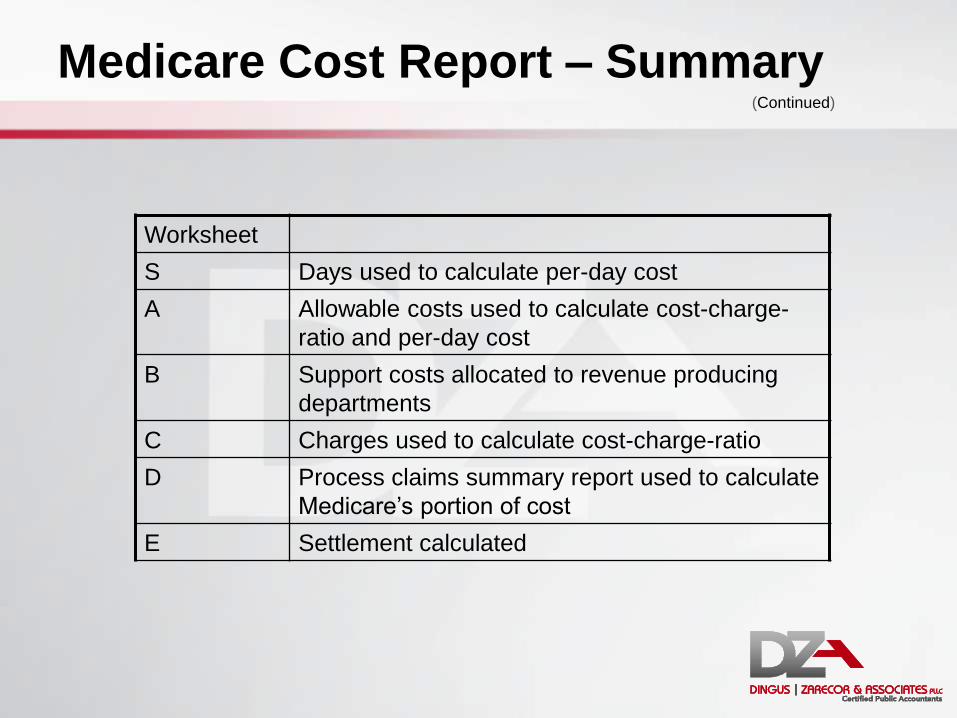
Medicare Cost Report – Summary
Worksheet
S Days used to calculate per-day cost
A Allowable costs used to calculate cost-charge-
ratio and per-day cost
B Support costs allocated to revenue producing
departments
C Charges used to calculate cost-charge-ratio
D Process claims summary report used to calculate
Medicare’s portion of cost
E Settlement calculated
(Continued)

S Series Worksheets
Purpose: To report the statistics and general information of the hospital.
Goal: To properly capture patient days used in calculating cost per day.
Process: Utilizing internal statistics and PS&R data.

Worksheet S-3 – Statistical Data
• Set up beds
Set up vs. licensed beds
• Bed days available
• CAH patient hours
96 hour rule

Worksheet S-3 – Statistical Data
• Patient days
Medicare (Title XVIII) • Report HMO separately
Medicaid (Title XIX) • Report HMO separately
Total
• Labor and delivery days by payor
• Observation hours/days
(Continued)
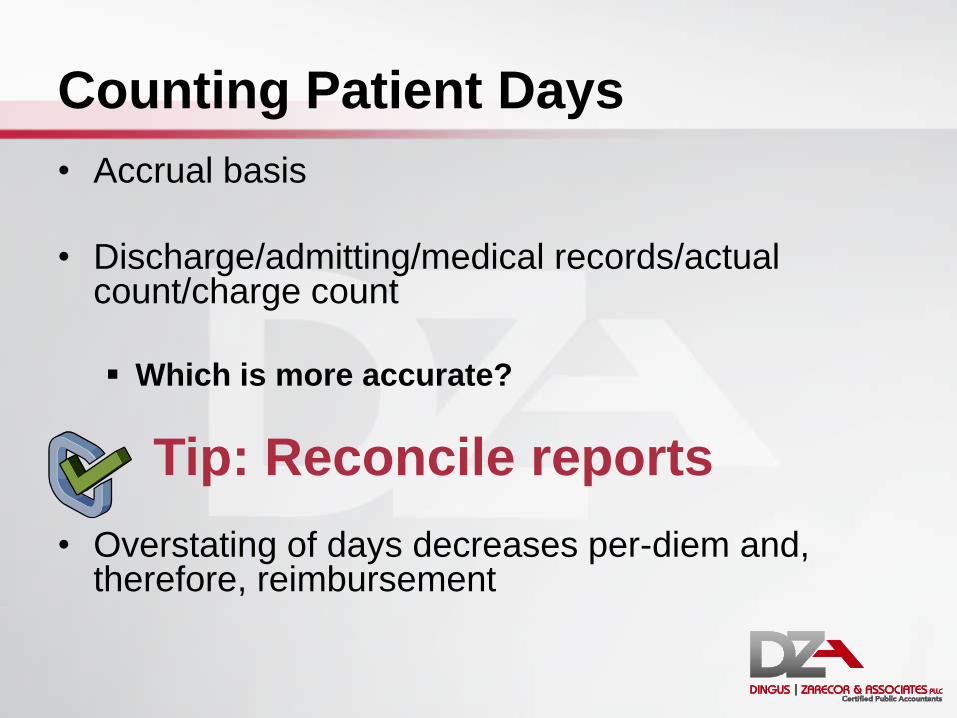
Counting Patient Days
• Accrual basis
• Discharge/admitting/medical records/actual count/charge count
Which is more accurate?
• Tip: Reconcile reports
• Overstating of days decreases per-diem and, therefore, reimbursement
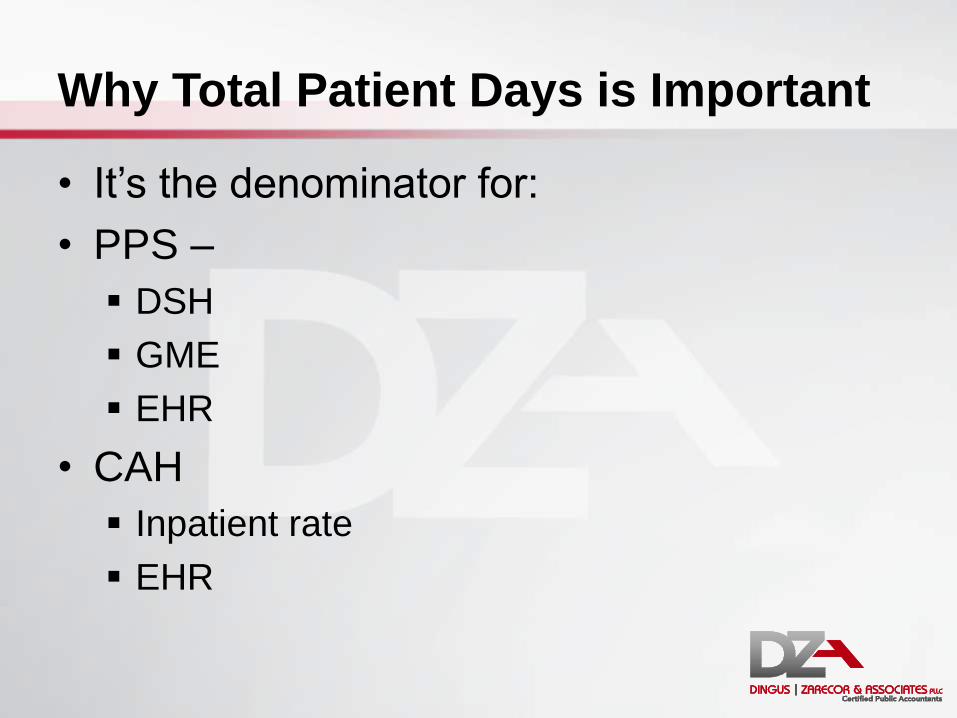
Why Total Patient Days is Important
• It’s the denominator for:
• PPS –
DSH
GME
EHR
• CAH
Inpatient rate
EHR
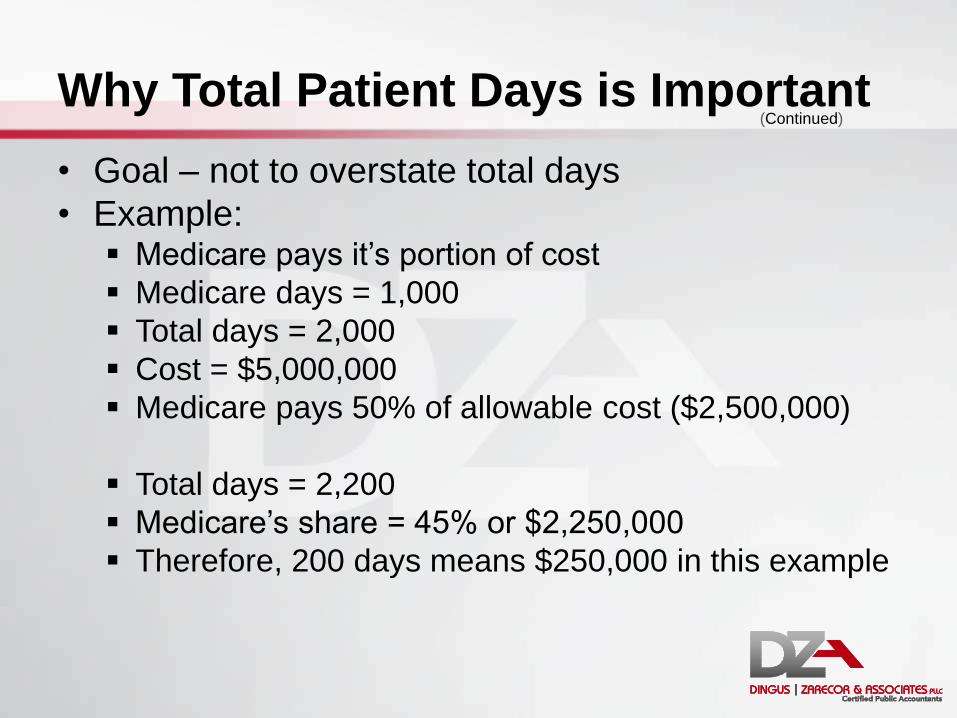
Why Total Patient Days is Important
• Goal – not to overstate total days
• Example: Medicare pays it’s portion of cost
Medicare days = 1,000
Total days = 2,000
Cost = $5,000,000
Medicare pays 50% of allowable cost ($2,500,000)
Total days = 2,200
Medicare’s share = 45% or $2,250,000
Therefore, 200 days means $250,000 in this example
(Continued)

Worksheet S-3, Part I – Patient Days
• Total acute care days
Acute care days
Possibly ICU (may be a separate cost center)
NICU
PICU
CCU
Observation bed equivalent days
Swing bed SNF days (CAH)
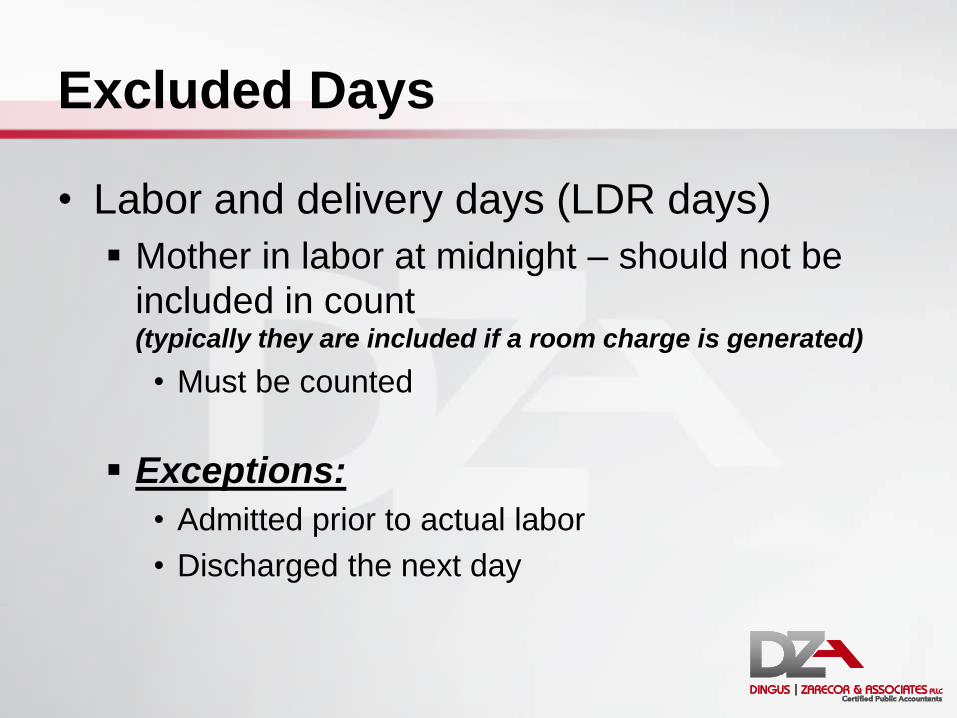
Excluded Days
• Labor and delivery days (LDR days)
Mother in labor at midnight – should not be
included in count (typically they are included if a room charge is generated)
• Must be counted
Exceptions:
• Admitted prior to actual labor
• Discharged the next day

Excluded Days (Continued)
• Hospice days (CAH specific)
Identify separately
Count as swing bed NF days (admit to swing bed program)
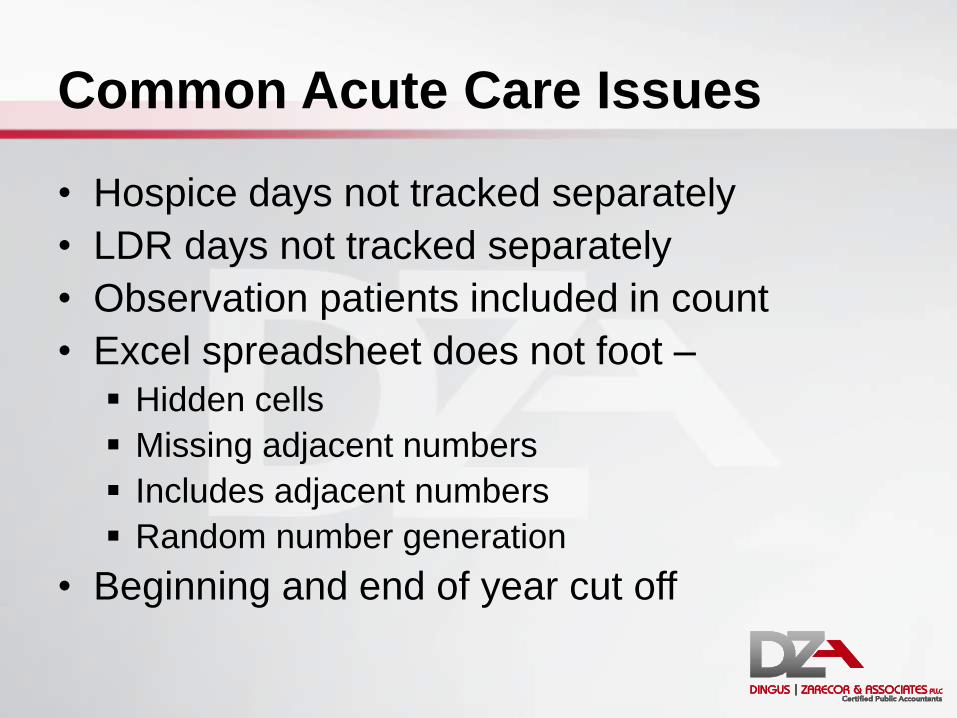
Common Acute Care Issues
• Hospice days not tracked separately
• LDR days not tracked separately
• Observation patients included in count
• Excel spreadsheet does not foot –
Hidden cells
Missing adjacent numbers
Includes adjacent numbers
Random number generation
• Beginning and end of year cut off
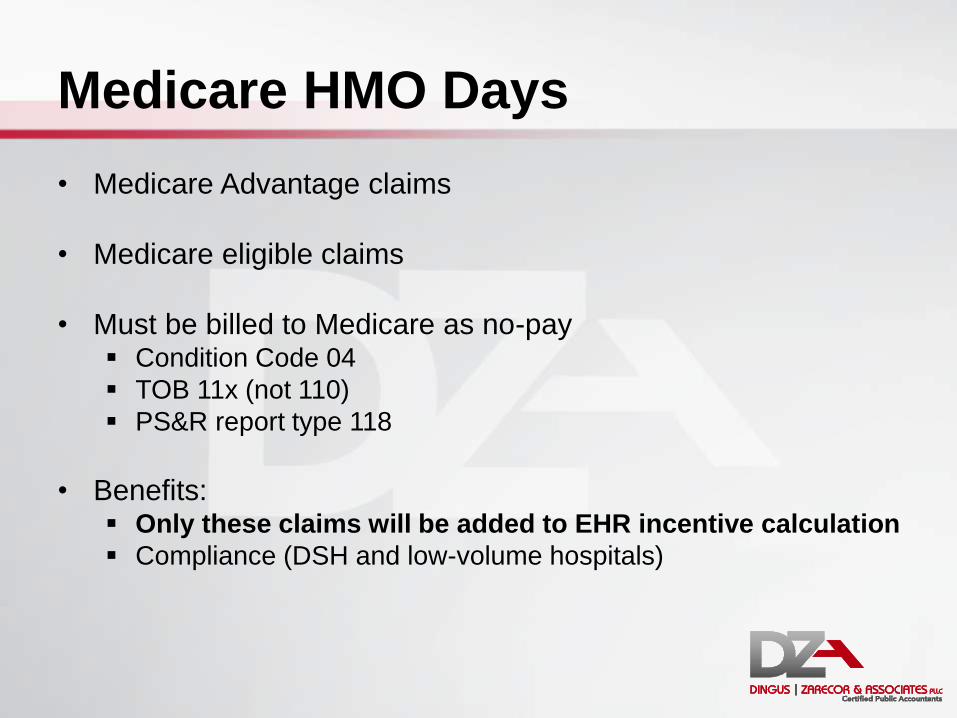
Medicare HMO Days
• Medicare Advantage claims
• Medicare eligible claims
• Must be billed to Medicare as no-pay Condition Code 04
TOB 11x (not 110)
PS&R report type 118
• Benefits: Only these claims will be added to EHR incentive calculation
Compliance (DSH and low-volume hospitals)
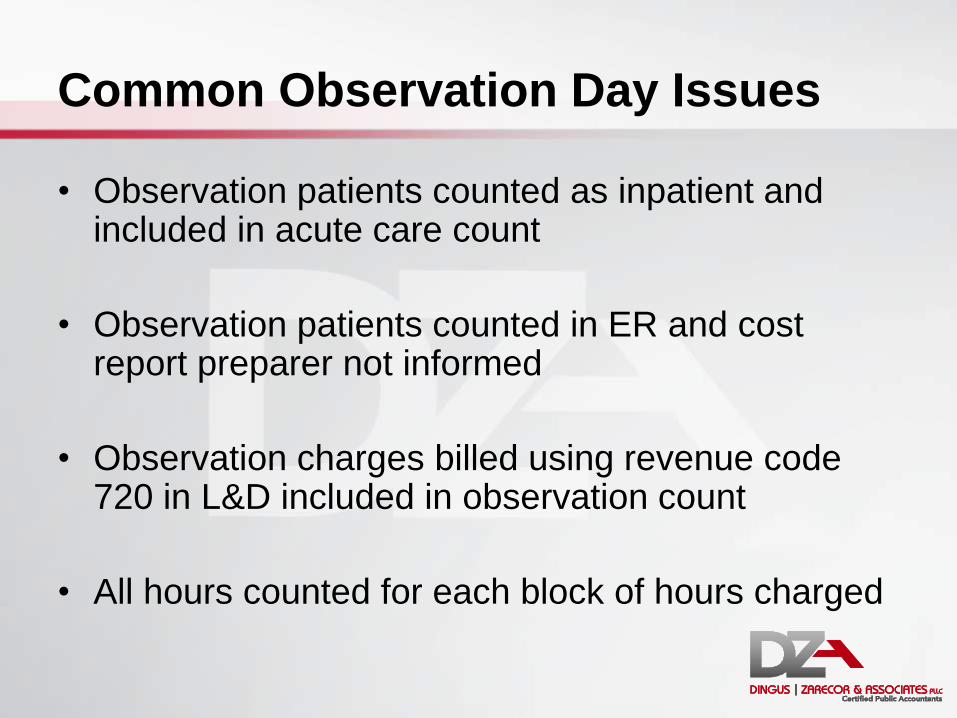
Common Observation Day Issues
• Observation patients counted as inpatient and included in acute care count
• Observation patients counted in ER and cost report preparer not informed
• Observation charges billed using revenue code 720 in L&D included in observation count
• All hours counted for each block of hours charged

Observation Issues the Calculation
• Observation hours/24 = equivalent days
• Example:
Observation hours = 6,000 (250 days)
Observation in ER = 1,200 (50 days)
Acute care days = 8,000
Acute care costs = $10,625,000
Medicare days = 6,400

Observation Issues the Calculation
• $13,612,500/8,250 = $1,650 per day
• $13,612,500/8,300 = $1,640 per day
• Remember Medicare days = 6,400
• Difference in per-diem = $10 per day
($1,650 less $1,640)
• $64,000 reimbursement effect
($10 times 6,400 Medicare days)
(Continued)

CAH Swing Beds
• Skilled vs. non-skilled level of care
• Skilled = Medicare (and Medicare Advantage)
• Medicare pays cost
• Medicaid pays prospectively
• Non Medicare days “carved out”
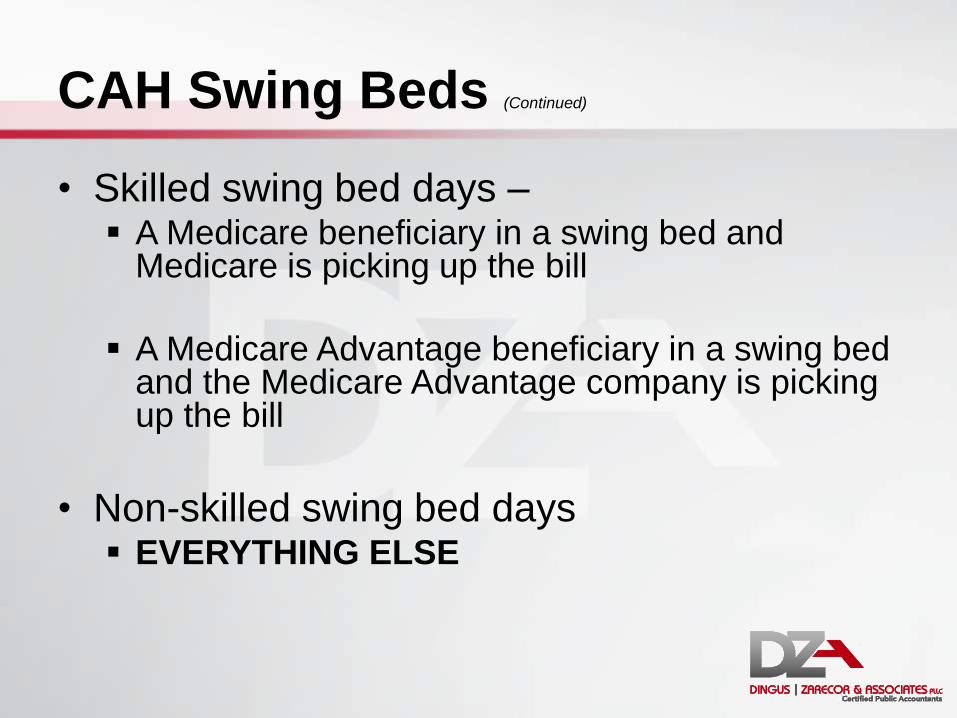
CAH Swing Beds (Continued)
• Skilled swing bed days – A Medicare beneficiary in a swing bed and
Medicare is picking up the bill
A Medicare Advantage beneficiary in a swing bed and the Medicare Advantage company is picking up the bill
• Non-skilled swing bed days EVERYTHING ELSE
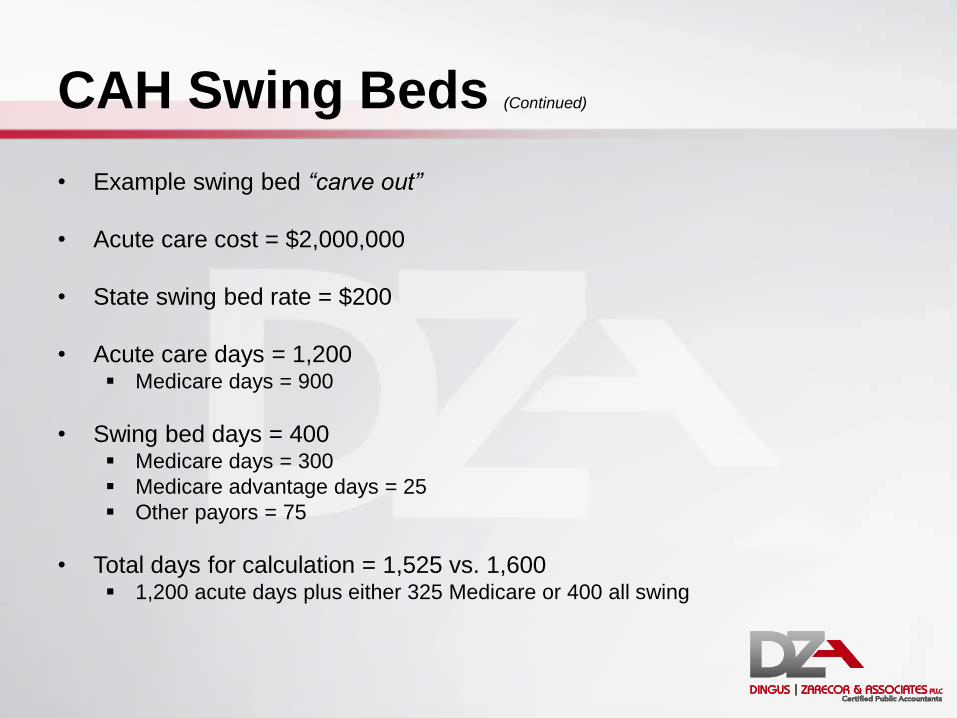
CAH Swing Beds (Continued)
• Example swing bed “carve out”
• Acute care cost = $2,000,000
• State swing bed rate = $200
• Acute care days = 1,200 Medicare days = 900
• Swing bed days = 400 Medicare days = 300
Medicare advantage days = 25
Other payors = 75
• Total days for calculation = 1,525 vs. 1,600 1,200 acute days plus either 325 Medicare or 400 all swing

CAH Swing Beds (Continued)
Swing NF days not identified:
Cost $ 2,000,000
Days 1,600
Cost per day $ 1,250
Medicare days 1,200
Medicare cost $ 1,500,000
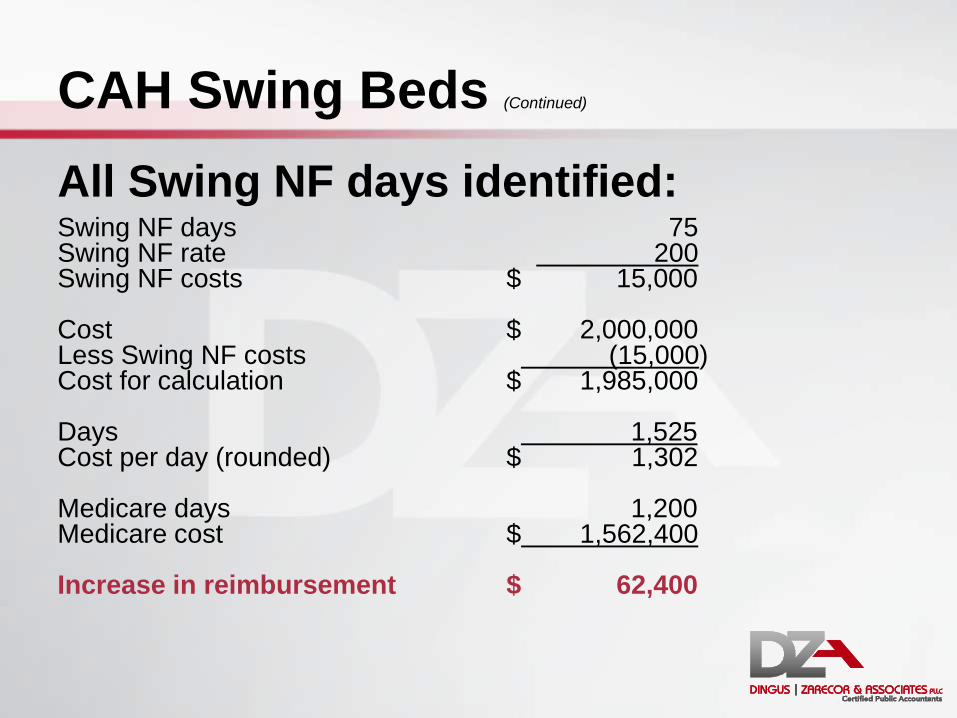
CAH Swing Beds (Continued)
All Swing NF days identified: Swing NF days 75 Swing NF rate 200 Swing NF costs $ 15,000 Cost $ 2,000,000 Less Swing NF costs (15,000) Cost for calculation $ 1,985,000 Days 1,525 Cost per day (rounded) $ 1,302 Medicare days 1,200 Medicare cost $ 1,562,400 Increase in reimbursement $ 62,400
CAH Swing Beds (Continued)
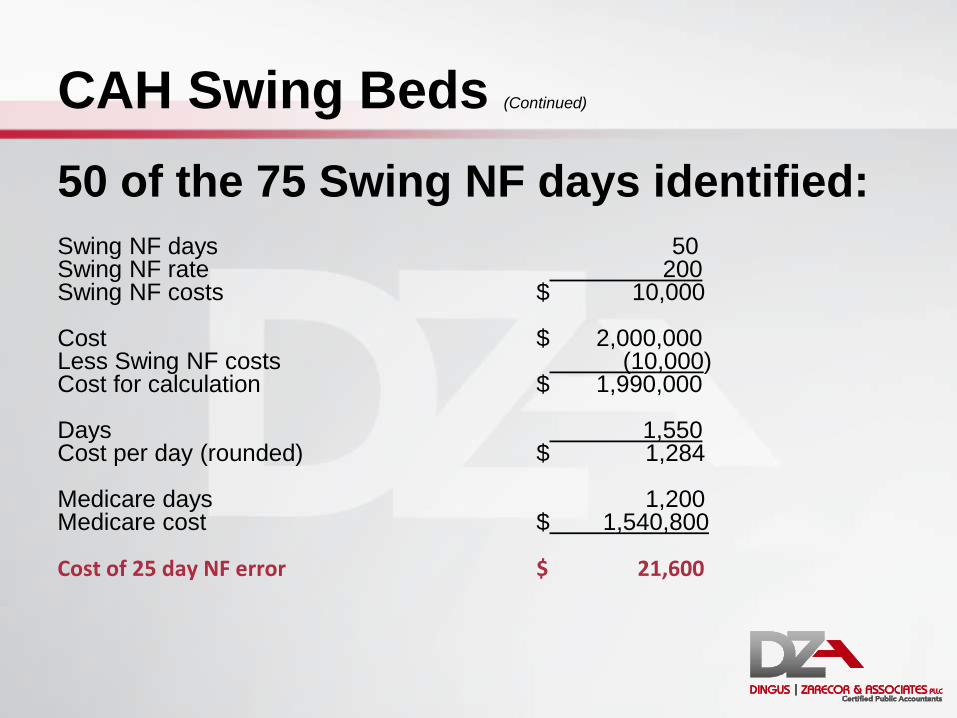
50 of the 75 Swing NF days identified: Swing NF days 50 Swing NF rate 200 Swing NF costs $ 10,000 Cost $ 2,000,000 Less Swing NF costs (10,000) Cost for calculation $ 1,990,000 Days 1,550 Cost per day (rounded) $ 1,284 Medicare days 1,200 Medicare cost $ 1,540,800 Cost of 25 day NF error $ 21,600

CAH Swing Beds (Continued)
• Tip: Verify all swing bed days by payor
• Patients change payor status after admission
• To correct at desk review requires additional support
Common Swing-Bed Issues
• More swing-bed days reported on PS&R than internal statistics
• Days counted as Medicare after skilled portion of stay
• Patients reflected as Medicare after benefits exhausted
• Swing-bed charges billed under hospital provider number
• Started as skilled but didn’t meet qualifications
• Non Medicare swing beds called Medicare to cost report preparer – usually with much conviction

CAH Skilled Swing Beds Defined
• Skilled swing bed days – A Medicare beneficiary in a swing bed and
Medicare is picking up the bill
A Medicare Advantage beneficiary in a swing bed and the Medicare Advantage company is picking up the bill
• Non-skilled swing bed days EVERYTHING ELSE
Other Worksheet S’s
• S-3, Parts II and III – Wage Index
(not applicable to CAHs)
• S-3, Part IV – Wage related costs
This schedule was on the CMS Form 339
• S-3, Part V – Contract labor and benefits

Other Worksheet S’s (Continued)
• S-4: Home health
• S-5: Renal dialysis
• S-7: SNF
• S-8: RHC and FQHC
• S-9: Hospice
• S-10: Uncompensated and indigent care

S Series - Summary
Report accurately
50% of the acute care formula
Affects EHR calculation Affects DSH calculation
Internal review of information = easy money
Questions?
Worksheet A Series
Purpose: To report the departmental expenses of the hospital
Goal: To match expenses to charges (and Medicare)
Process: Utilize hospital departmental data and care location
Worksheet A Series
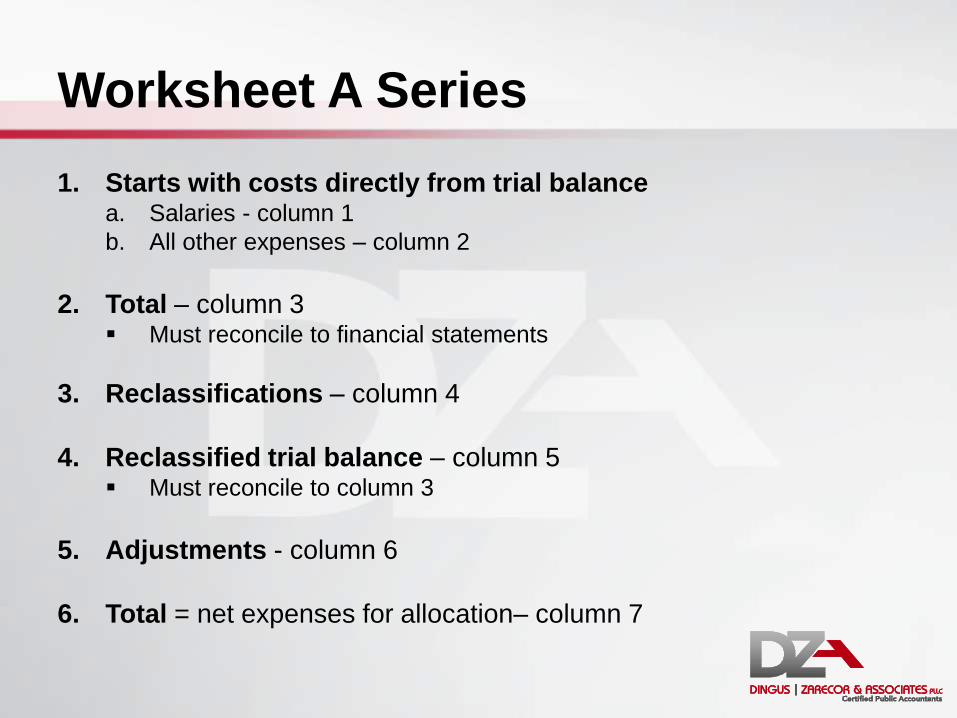
1. Starts with costs directly from trial balance a. Salaries - column 1
b. All other expenses – column 2
2. Total – column 3 Must reconcile to financial statements
3. Reclassifications – column 4
4. Reclassified trial balance – column 5 Must reconcile to column 3
5. Adjustments - column 6
6. Total = net expenses for allocation– column 7

Worksheet A (Continued)
• Grouped in specific order:
General support cost centers (overhead)
• Capital (lines 1-3) – Old forms were line numbers1-4
– Eliminated the “old capital” cost center
• Other overhead departments (lines 4-23)
Revenue producing
• Inpatient departments (lines 30-46)
• Ancillary departments (lines 50-76)
• Outpatient services (lines 88-92)
• Other reimbursable cost centers (lines 94-101)
Special purpose and non-reimbursable cost centers (line 105-194)
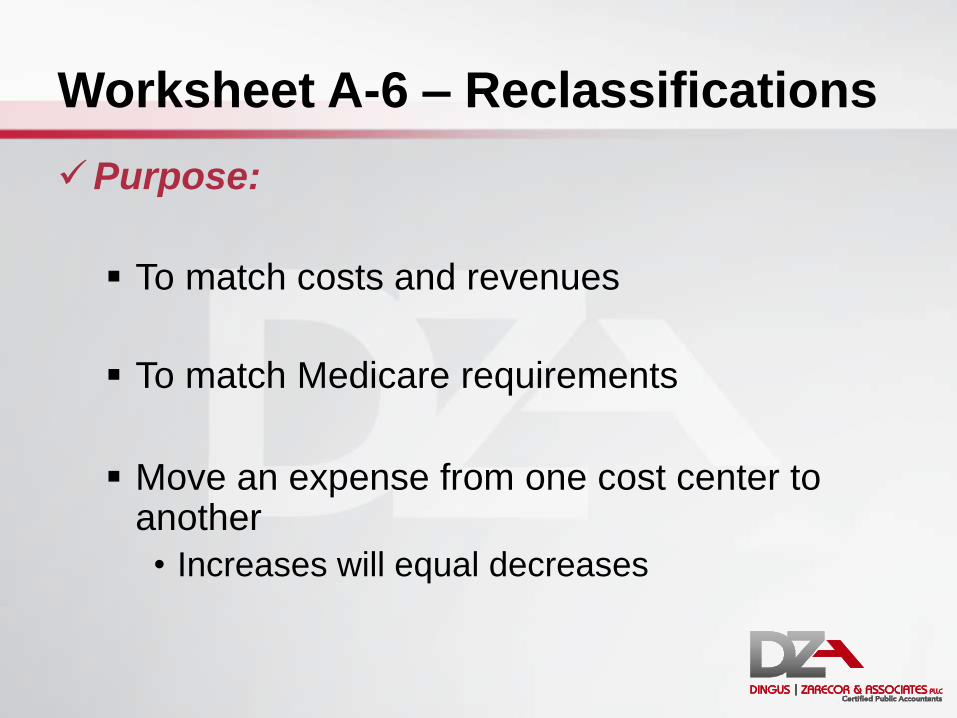
Worksheet A-6 – Reclassifications
Purpose:
To match costs and revenues
To match Medicare requirements
Move an expense from one cost center to another
• Increases will equal decreases

A-6 Examples
• Example:
To reclassify chargeable supplies:
• 71.0 Medical supplies charged to patients $60,000
• 50.0 Operating room (20,000)
• 69.0 EKG $(20,000)
• 91.0 ER $(20,000)

Worksheet A-8 – Adjustments
Purpose:
To adjust trial balance to reflect Medicare
allowable expenses.
• Basis:
Expense adjustments – “A”
Revenue offset – “B”

Worksheet A-8 – Adjustments (Continued)
• Examples:
Cost recoveries or revenue offsets (any miscellaneous revenue)
Investment income
Nonallowable expenses:
• Patient telephones or televisions
• Lobbying expense
• Physician recruitment (unless administrative or RHC)
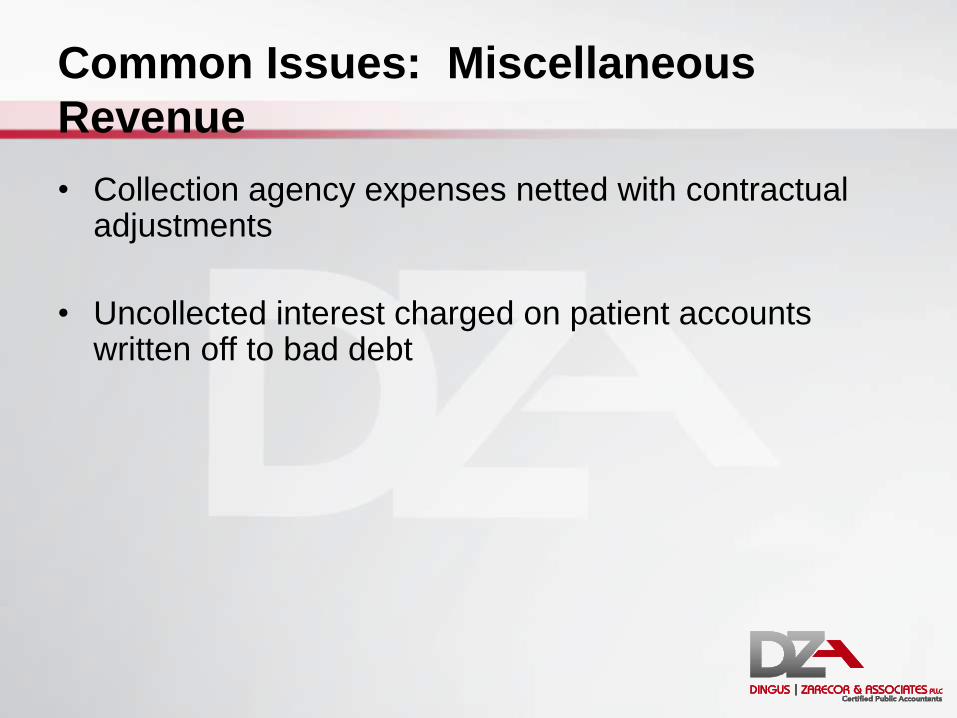
Common Issues: Miscellaneous
Revenue
• Collection agency expenses netted with contractual adjustments
• Uncollected interest charged on patient accounts written off to bad debt
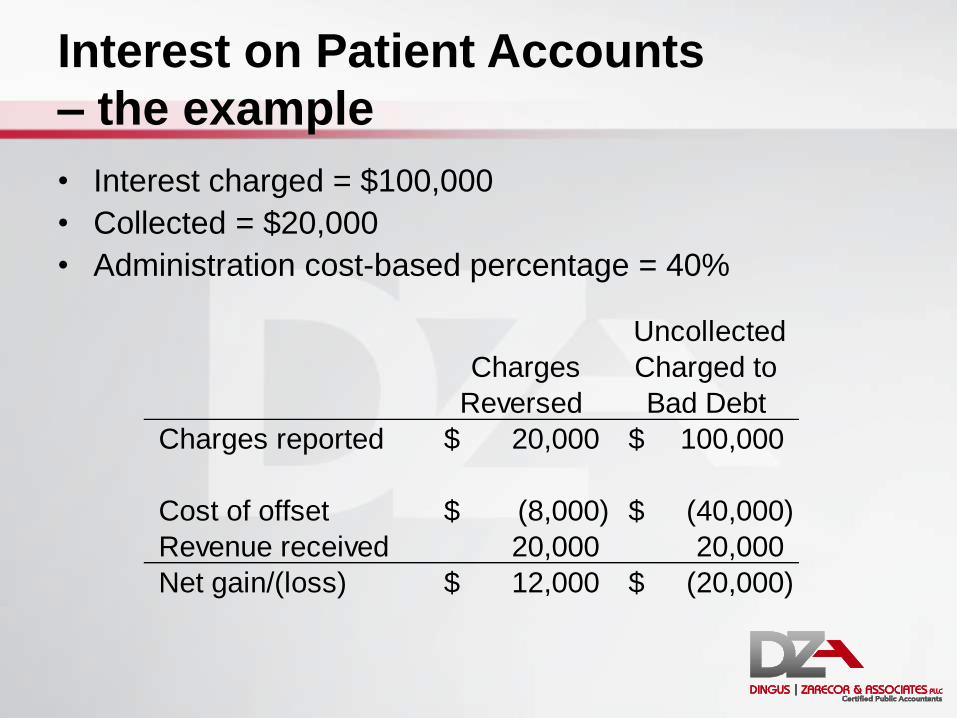
Interest on Patient Accounts
– the example
• Interest charged = $100,000
• Collected = $20,000
• Administration cost-based percentage = 40%
Charges
Reversed
Uncollected
Charged to
Bad Debt
Charges reported 20,000$ 100,000$
Cost of offset (8,000)$ (40,000)$
Revenue received 20,000 20,000
Net gain/(loss) 12,000$ (20,000)$
B Series Worksheets
Purpose: Allocate support (overhead) cost to revenue producing and
non-allowable departments
Goal: Match overhead use by department
Process: Step-down approach
Worksheet B Series – Overview
• B, Part I – total cost allocation
• B, Part II – capital cost allocation
• B-1 – allocation statistical basis
• B-2 – post stepdown adjustments
Worksheet B-1 – Statistical Basis
• Used to calculate allocated overhead costs on B, Part I & II
• Uses allocation statistic specific to each overhead department
• Overhead allocated (stepped down) to:
Revenue producing
Non-allowable

Overhead Departments
• Building costs
• Moveable equipment costs
• Employee benefits
• Communications
• Information technology (IT)
• Admitting
• Purchasing
• Business office
• Other administrative
• Maintenance
• Plant
• Laundry
• Housekeeping
• Dietary
• Cafeteria
• Nursing administration
• Medical records
• Social services
• Activities
• CRNA
• Resident training costs
Overhead Strategies
• Review current allocations: Does allocated costs match department’s
utilization?
Is there a more accurate method?
Does that department really take up that much space?

Common Overhead (OH) Issues
• Directly-assigned OH Costs
Admitting
Patient billing
Medical records
Insurance
Nurse administration
Housekeeping or maintenance directly assigned to medical office buildings
• Avoid double-allocation

Administration Costs
• Fragmented departments:
Communications: number of phones
Information technology: number of computer terminals or workstations
Admissions: gross revenue or number of admits
Purchasing: supplies expenses or requisitions
Business office (patient accounting): gross revenue
All other: accumulated cost

Time Studies
• In case you are preparing a time study
• OR think your facility would benefit from
one…
Time Studies (Continued)
• At least one full week per month
• A full work week (e.g. 7 days)
• Equally distributed among the months (e.g. 3 months use 1st week; 3 months use 2nd week; etc.)
• No two consecutive months may use the same week
• Contemporaneous with the costs
• Provider specific
Time Studies (Continued)
• Designate one responsible person
• Must be prepared accurately and consistently
• Preparers must understand how each “cost center” is defined The cost report preparer and/or CFO should
provide guidance
The one responsible person should then review/monitor

C Series Worksheets
Purpose: Calculate cost-to-charge ratio
Goal: Match revenues to costs
Process: Internal revenue by revenue code report
Gross Revenues
• Reports gross hospital revenues
• Calculates the cost-to charge ratio 50% of the cost-to-charge ratio
• Expenses = numerator
• Charges = denominator
• Higher expenses, higher cost-to-charge ratio
• Higher revenues, lower cost-to-charge ratio
Gross Revenues (Continued)
• Remember the matching principle:
Charges matched to costs
Costs match with their charges
Medicare charges matched to costs
Medicare charges matched to total charges
• General ledger matches the first two
• Revenue code report helps match the other two
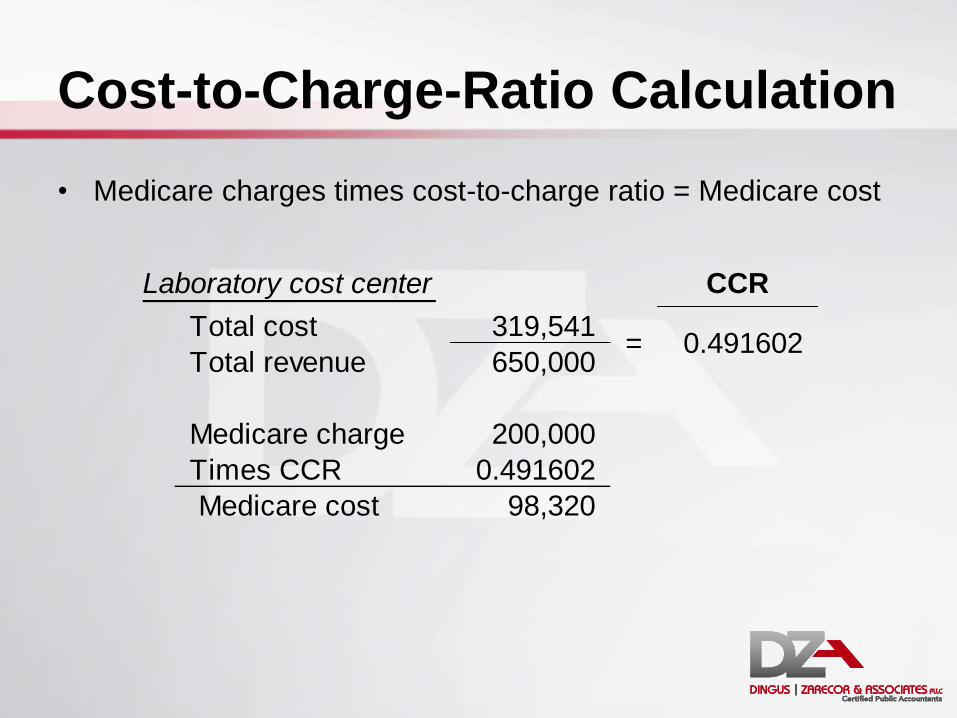
Cost-to-Charge-Ratio Calculation
• Medicare charges times cost-to-charge ratio = Medicare cost
CCR
Total cost 319,541
Total revenue 650,000
Medicare charge 200,000
Times CCR 0.491602
Medicare cost 98,320
Laboratory cost center
= 0.491602
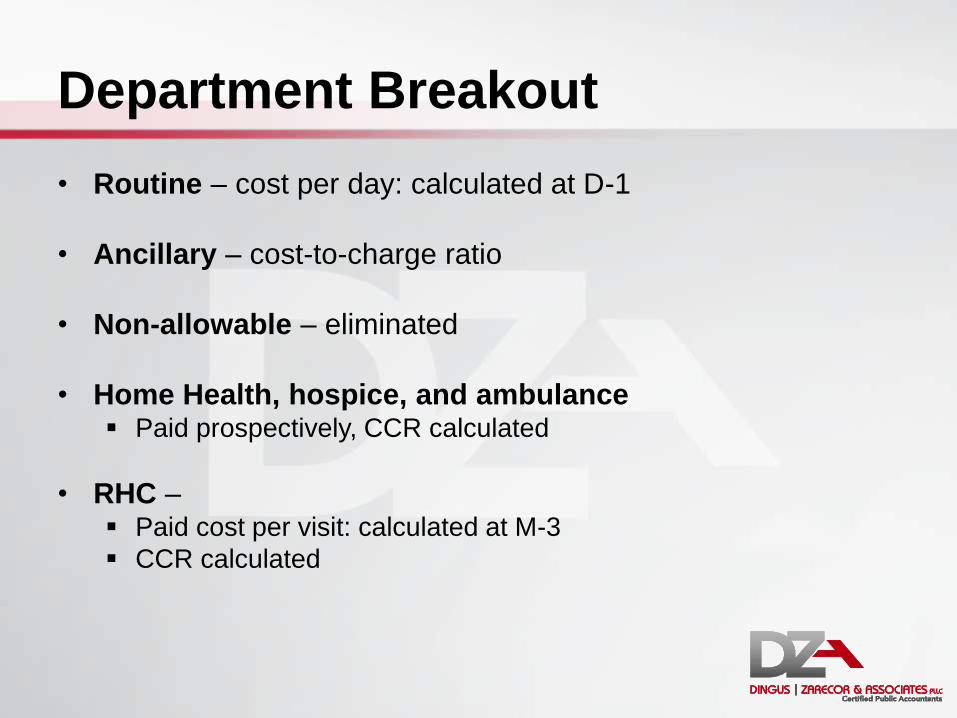
Department Breakout
• Routine – cost per day: calculated at D-1
• Ancillary – cost-to-charge ratio
• Non-allowable – eliminated
• Home Health, hospice, and ambulance Paid prospectively, CCR calculated
• RHC – Paid cost per visit: calculated at M-3
CCR calculated

Computation of Charges
• Revenue by revenue code report
Reconcile to general ledger
By revenue code and by department
Use to match revenue codes to the correct department versus using the general ledger
Remove professional charges
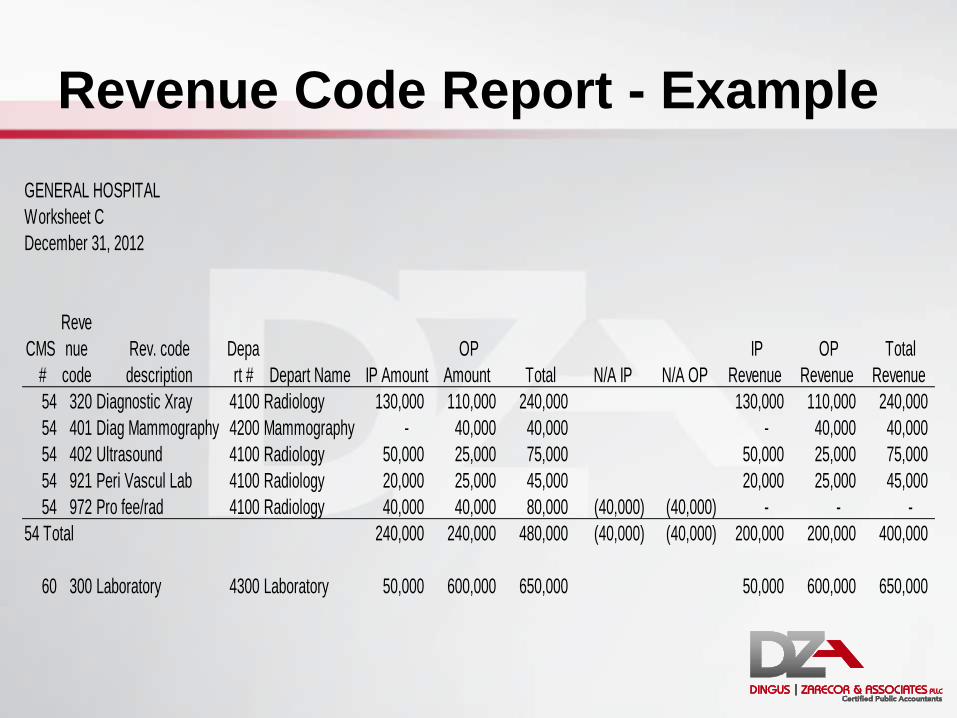
Revenue Code Report - Example
GENERAL HOSPITAL
Worksheet C
December 31, 2012
CMS
#
Reve
nue
code
Rev. code
description
Depa
rt # Depart Name IP Amount
OP
Amount Total N/A IP N/A OP
IP
Revenue
OP
Revenue
Total
Revenue
54 320 Diagnostic Xray 4100 Radiology 130,000 110,000 240,000 130,000 110,000 240,000
54 401 Diag Mammography 4200 Mammography - 40,000 40,000 - 40,000 40,000
54 402 Ultrasound 4100 Radiology 50,000 25,000 75,000 50,000 25,000 75,000
54 921 Peri Vascul Lab 4100 Radiology 20,000 25,000 45,000 20,000 25,000 45,000
54 972 Pro fee/rad 4100 Radiology 40,000 40,000 80,000 (40,000) (40,000) - - -
54 Total 240,000 240,000 480,000 (40,000) (40,000) 200,000 200,000 400,000
60 300 Laboratory 4300 Laboratory 50,000 600,000 650,000 50,000 600,000 650,000
Supplies
• Types of supplies:
Medical supplies not separately charged
Medical supplies charged to a patient using
27X
Implantables (typically charged using 275,
276, 278, and 624)
Supplies (Continued)
• One revenue code, many departments
• Two options
Reclass costs (may or may not be that easy)
Split the Medicare revenue based on
department

One Revenue Code, Many
Departments
• Other offenders:
IV therapy
Blood administration
Infusions
Chemo (and chemo drugs)
Treatment room
Clinic (510)

Computation of Charges
• Strive for a one to one relationship
(1 revenue code = 1 cost center)
• Option: be able to track the charge by the
department
Common Issues with Gross Revenue
• Using one revenue code in several locations
• Providing services in several locations and
not tracking revenue codes to those locations
• Billing implantables using the wrong revenue
code
Provider Based Clinic Revenue
• Typically four types of revenues
Hospital services tracked back to clinic
Global clinic charges
Professional clinic charges
Technical clinic charges

Provider Based Clinic Revenue
• Hospital services must be removed first
• Method II split charges to Medicare
• Global charge billed to other payors
• Must make the two match on cost report Basis for split (Medicare)
• Set amount per charge
• Percentage of charge
(Continued)

Provider Based Clinic Revenue
• Example:
99213 standard charge • Professional = $100
• Technical = $25
• Total = $125
Medicare billed 75 patients
Blue cross billed 75 patients
Clinic also billed $10,000 hospital professional charges (revenue code 983)
(Continued)

Provider Based Clinic Revenue
• Example:
(Continued)
% Medicare Other Hospital Total
Revenue
code
Professional charge 44% 7,500 16,875 10,000 34,375 983
Technical charge 56% 9,375 9,375 510
Total gross charge 16,875 16,875 10,000 43,750
Medicare Other Total
Revenue
code
Professional charge 44% 7,500 16,875 24,375 983
Technical charge 56% 9,375 9,375 510
Total gross charge 16,875 16,875 33,750

Provider Based Clinic Revenue
• Example:
(Continued)
With
Hospital
Hospital
Omitted
Total charge imputed 24,306 18,750
Total cost 10,000 10,000
CCR 0.411421 0.533333
Medicare charge 7,500 7,500
Medicare reimbursement 3,086 4,000
Increased reimbursement 914
Per patient 12.19$
CRNA Pass-through
• Elect annually prior to January 1 (exemption is on a calendar year)
• Less than 800 procedures requiring anesthesia and less than 2,080 productive CRNA hours
• Nearly all that qualify should elect CRNA exemption
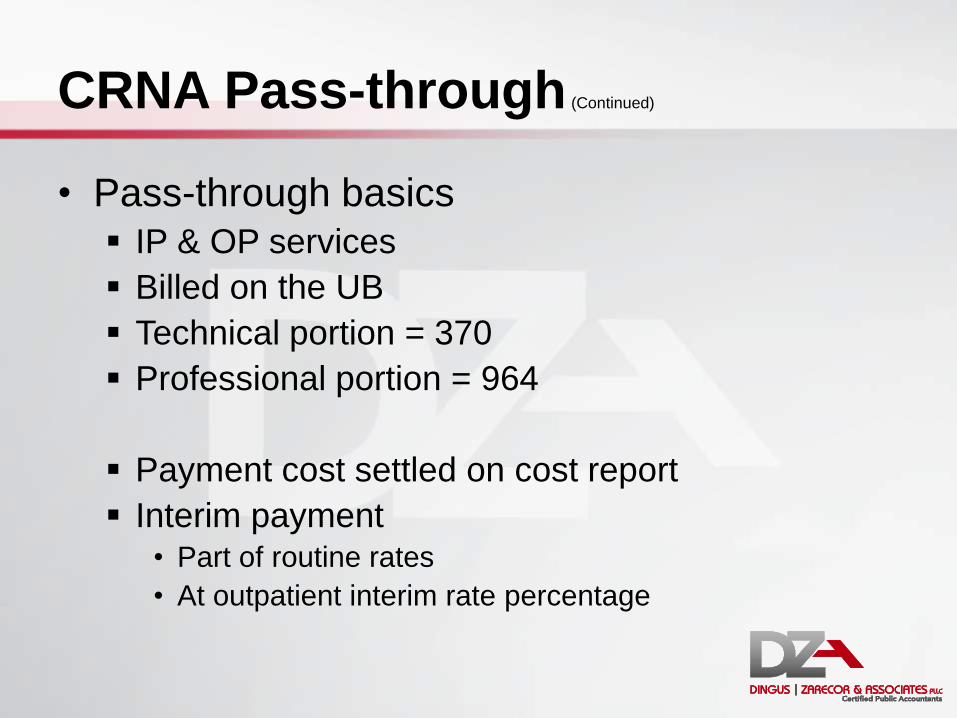
CRNA Pass-through (Continued)
• Pass-through basics
IP & OP services
Billed on the UB
Technical portion = 370
Professional portion = 964
Payment cost settled on cost report
Interim payment • Part of routine rates
• At outpatient interim rate percentage
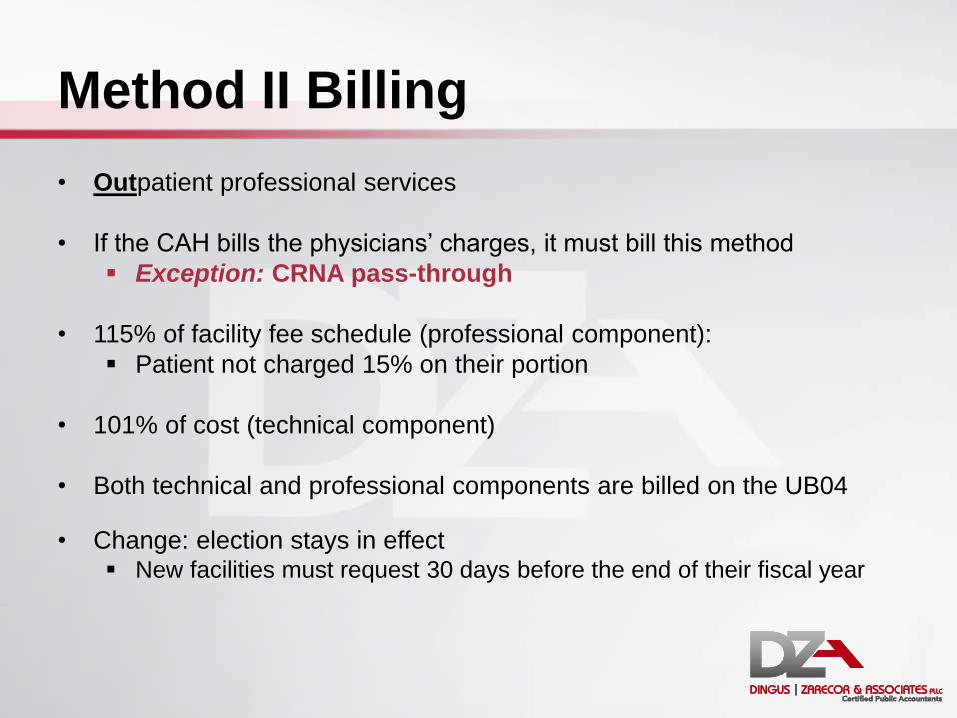
Method II Billing
• Outpatient professional services
• If the CAH bills the physicians’ charges, it must bill this method
Exception: CRNA pass-through
• 115% of facility fee schedule (professional component):
Patient not charged 15% on their portion
• 101% of cost (technical component)
• Both technical and professional components are billed on the UB04
• Change: election stays in effect New facilities must request 30 days before the end of their fiscal year
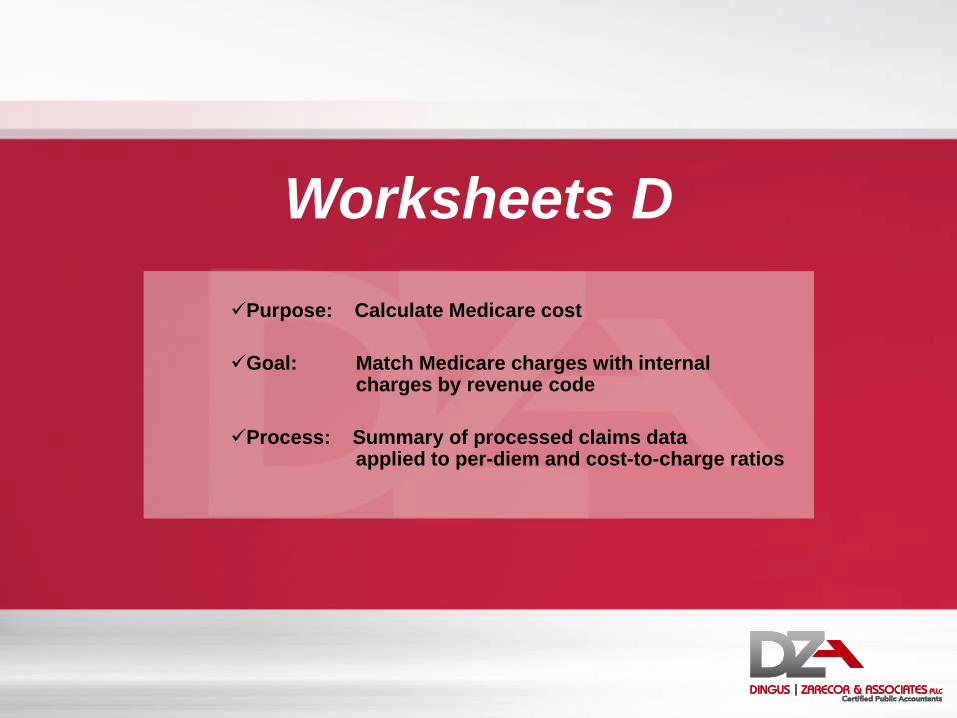
Worksheets D
Purpose: Calculate Medicare cost
Goal: Match Medicare charges with internal charges by revenue code
Process: Summary of processed claims data applied to per-diem and cost-to-charge ratios

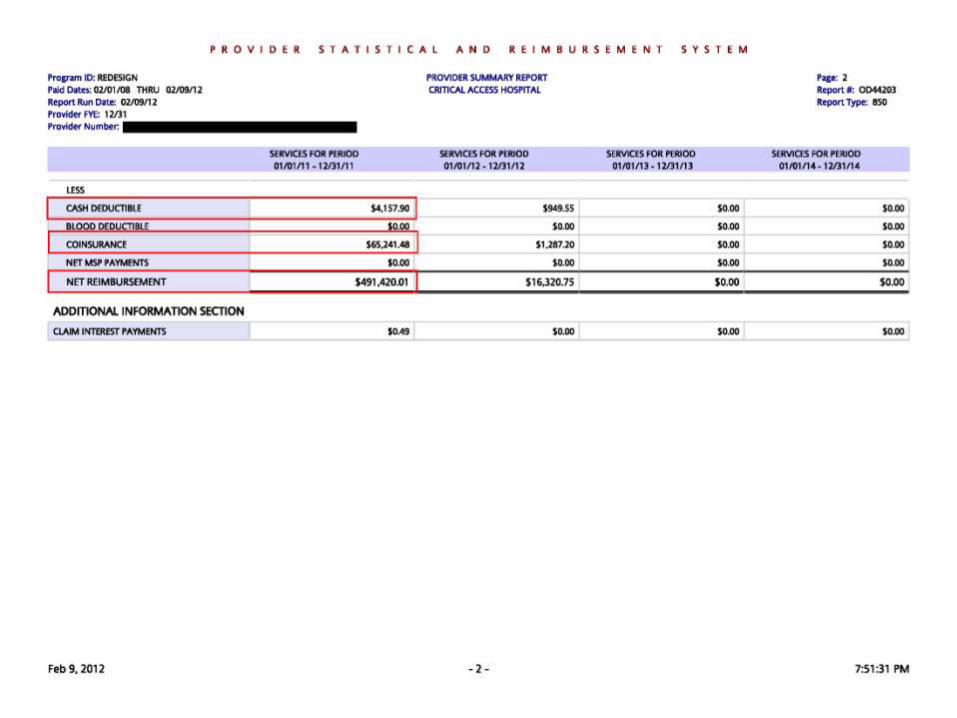
PS&R
• What is a PS&R?
Summary of Medicare paid charges and
payments
• Based on DATES OF SERVICE
• Paid claims only

PS&R (Continued)
• How to read:
Significant dates
Types of reports
Medicare days
Charges
Gross reimbursement
Deductibles and Coinsurance
Net reimbursement


Worksheet D-1
• Purpose:
Calculation of Medicare’s share of routine cost (inpatient)
Add acute ancillary costs to arrive at total Medicare inpatient cost
Calculation of Medicare swing (SNF) routine cost

Worksheet D-1 (Continued)
• Calculation of Routine Costs
Total costs from B, Col 26 for acute
Carve out cost related to Swing-NF days
Remaining costs are related to acute, swing SNF and
observation
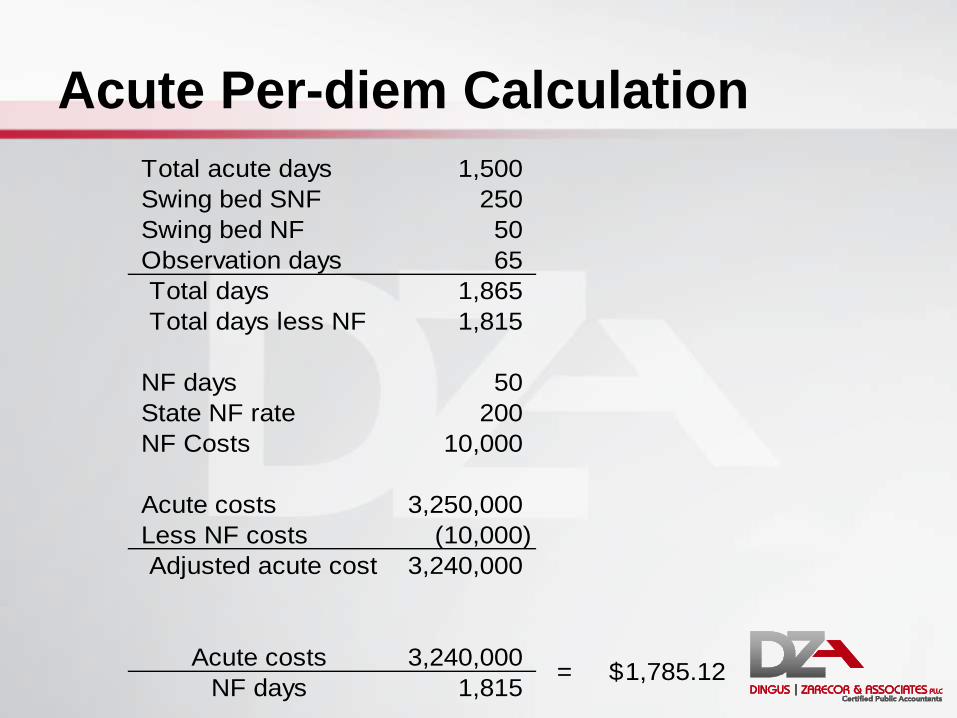
Acute Per-diem Calculation
Total acute days 1,500
Swing bed SNF 250
Swing bed NF 50
Observation days 65
Total days 1,865
Total days less NF 1,815
NF days 50
State NF rate 200
NF Costs 10,000
Acute costs 3,250,000
Less NF costs (10,000)
Adjusted acute cost 3,240,000
Acute costs 3,240,000
NF days 1,815 = 1,785.12$

Worksheet D-3
• Calculation of inpatient and swing bed ancillary costs:
Column 1 – CCRs (from Worksheet C)
Column 2 – Inpatient charges (from PS&R)
Column 3 – Calculation of cost (Col. 1 x Col. 2)
• Two worksheets:
Acute
Swing

Sample Worksheet D-3
INPATIENT ANCILLARY SERVICE COST APPORTIONMENT Period
From: 10/1/2010
To: 9/30/2011
Cost
Ratio of Cost
To Charges
Inpatient
Program
Charges
Inpatient
Program
Costs (col. 1
x col. 2)
1.00 2.00 3.00
INPATIENT ROUTINE SERVICE COST CENTERS
30.00 3000 ADULTS & PEDIATRICS 20,000 30.00
ANCILLARY SERVICE COST CENTERS
50.00 5000 OPERATING ROOM 0.774957 20,000 15,499 50.00
54.00 5400 RADIOLOGY-DIAGNOSTIC 0.634535 40,000 25,381 54.00
60.00 6000 LABORATORY 0.491602 35,000 17,206 60.00
66.00 6600 PHYSICAL THERAPY 0.529268 15,000 7,939 66.00
71.00 7100 MEDICAL SUPPLIES CHARGED TO PATIENTS 1.094567 10,000 10,946 71.00
73.00 7300 DRUGS CHARGED TO PATIENTS 1.735825 15,000 26,037 73.00
OUTPATIENT SERVICE COST CENTERS
88.00 8800 RURAL HEALTH CLINIC 0 0 88.00
91.00 9100 EMERGENCY 0.461273 0 0 91.00
92.00 9200 OBSERVATION BEDS (NON-DISTINCT PART) 8.7078 0 0 92.00
200.00 Total (sum of lines 50-94 and 96-98) 135,000 103,008 200.00
201.00 Less PBP Clinic Laboratory Services-Program only charges (line 61) 0 201.00
202.00 Net Charges (line 200 minus line 201) 135,000 202.00
Cost Center Description
HospitalTitle XVIII
Worksheet D-3
Provider
CCN:131300
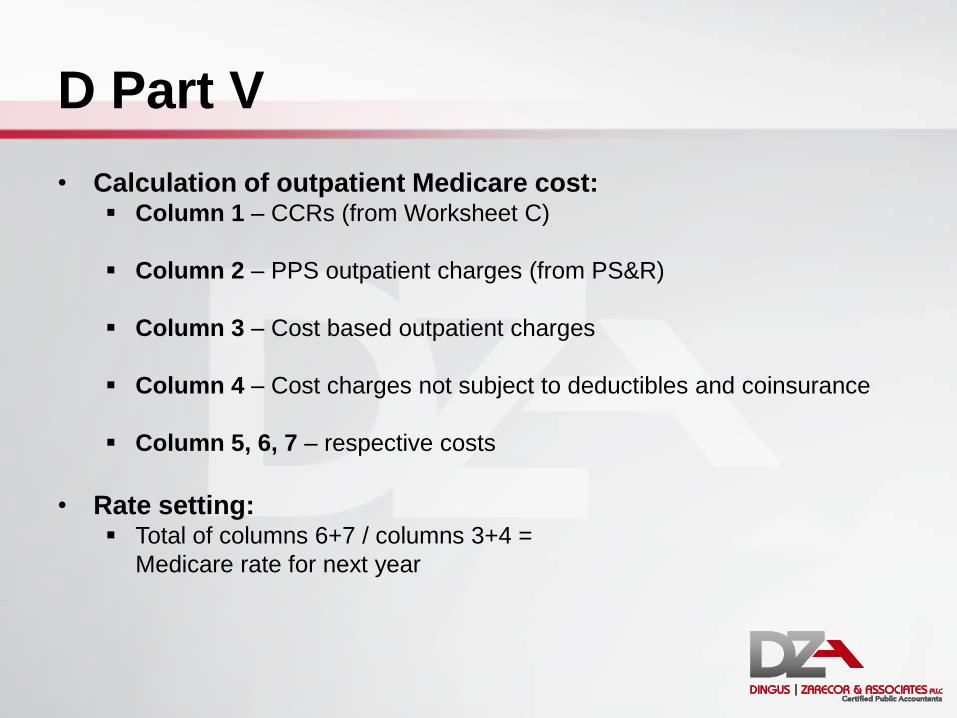
D Part V
• Calculation of outpatient Medicare cost: Column 1 – CCRs (from Worksheet C)
Column 2 – PPS outpatient charges (from PS&R)
Column 3 – Cost based outpatient charges
Column 4 – Cost charges not subject to deductibles and coinsurance
Column 5, 6, 7 – respective costs
• Rate setting: Total of columns 6+7 / columns 3+4 =
Medicare rate for next year

Interim Rates
• Rates are set from filed Medicare cost reports
• Separate rates for IP, swing bed, and OP
• Actual reimbursement is calculated at year end and settled based on cost to charge ratios
• Intermediaries always round rates down
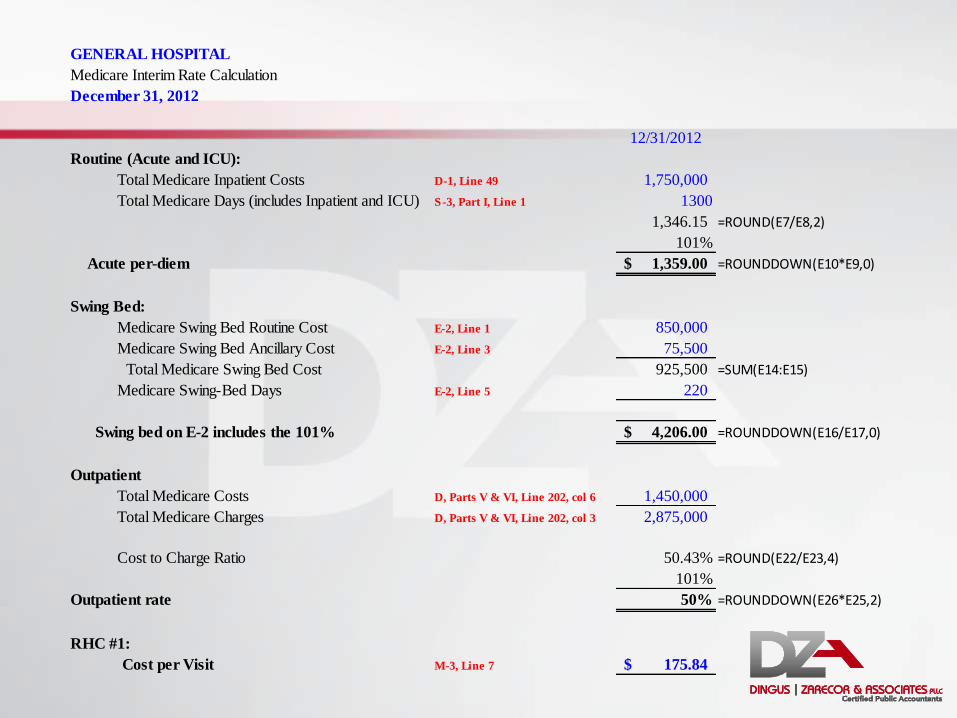
GENERAL HOSPITAL
Medicare Interim Rate Calculation
December 31, 2012
12/31/2012
Routine (Acute and ICU):
Total Medicare Inpatient Costs D-1, Line 49 1,750,000
Total Medicare Days (includes Inpatient and ICU) S-3, Part I, Line 1 1300
1,346.15 =ROUND(E7/E8,2)
101%
Acute per-diem 1,359.00$ =ROUNDDOWN(E10*E9,0)
Swing Bed:
Medicare Swing Bed Routine Cost E-2, Line 1 850,000
Medicare Swing Bed Ancillary Cost E-2, Line 3 75,500
Total Medicare Swing Bed Cost 925,500 =SUM(E14:E15)
Medicare Swing-Bed Days E-2, Line 5 220
Swing bed on E-2 includes the 101% 4,206.00$ =ROUNDDOWN(E16/E17,0)
Outpatient
Total Medicare Costs D, Parts V & VI, Line 202, col 6 1,450,000
Total Medicare Charges D, Parts V & VI, Line 202, col 3 2,875,000
Cost to Charge Ratio 50.43% =ROUND(E22/E23,4)
101%
Outpatient rate 50% =ROUNDDOWN(E26*E25,2)
RHC #1:
Cost per Visit M-3, Line 7 175.84$

Worksheets E
Purpose: Calculate Medicare settlement
Goal: Match payments with services
Process: Summary of processed claims data and lump sum payments
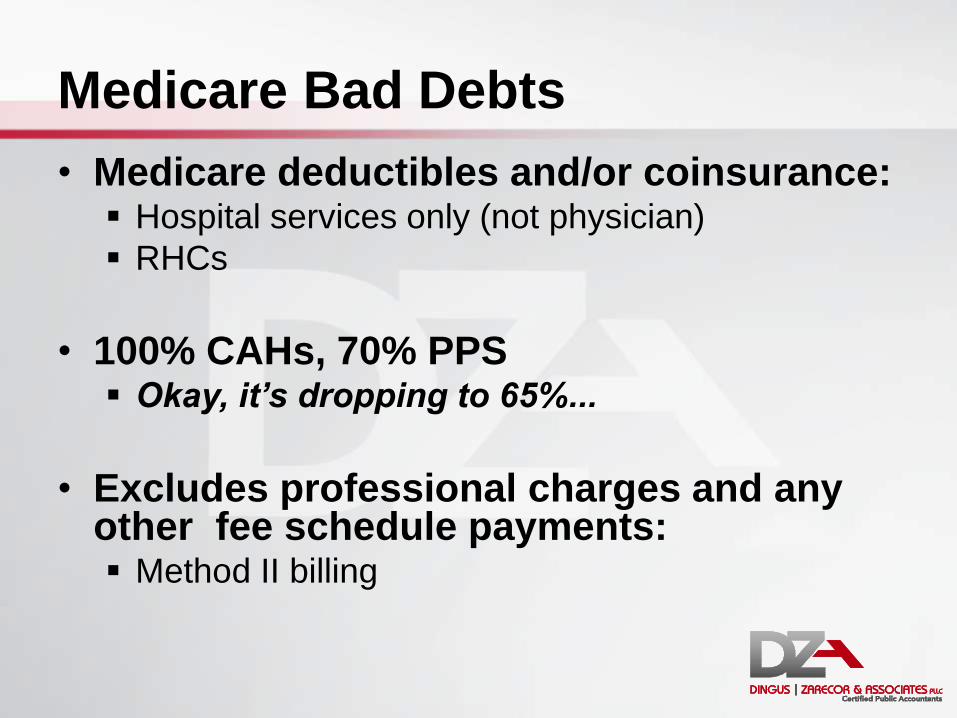
Medicare Bad Debts
• Medicare deductibles and/or coinsurance: Hospital services only (not physician)
RHCs
• 100% CAHs, 70% PPS Okay, it’s dropping to 65%...
• Excludes professional charges and any other fee schedule payments: Method II billing

Medicare Bad Debts (Continued)
• Three types:
1. Reasonable collection efforts
2. Medicaid secondary payor (crossovers)
3. Written off under charity care policy
(indigent)

Reasonable Collection Effort
• Deemed uncollectible using the hospital’s normal collection efforts
• Treated similarly to other payors, and billed with the intention of receiving payment for at least 120 days:
120 days from date the bill was first sent to beneficiary, to date it was deemed uncollectible and written off of the Hospital’s books
Collection agencies strategy
• Sound business judgment established that there was no likelihood of recovery at any time in the future

Crossovers
• Type of indigent bad debt:
Medicaid is responsible for payment of deductible and coinsurance
Must be billed and denied by Medicaid
Not subject to the 120-day rule
Tip: Can claim partial and full write-offs

Medicare Bad Debt – Charity Care
• Type of indigent bad debt: Written off under the hospital’s
charity care policy
This is often overlooked by hospitals
Not subject to the 120-day rule
Tip: Can claim partial and full write-offs
Worksheets M
Purpose: Calculate cost-per-visit and settlement for RHC
Goal: Expand worksheet A information, apply physician visits and hours
Process: Utilize internal statistics and PS&R
M Series - Summary
• Separate M series for each RHC
• Key Calculation – Cost per visit (Total Costs / Total Visits)
Costs • Direct costs and indirect allocated costs
Visits • Greater of productivity standard visits or actual visits

Worksheet M-2
• Visits Medically necessary, face-to-face encounter with
a physician or mid-level • Does not include nursing visits
Fewer visits creates a higher adjusted cost per visit (denominator)
A higher adjusted cost per visit increases reimbursement though the cost report
• Also means clinic is likely inefficient
Worksheet M-2 (Continued)
• Things to include and bill as an RHC visit:
Office visits
Home visits
Assisted living visits
Nursing home visits
Swing-bed visits
Worksheet M-2 (Continued)
• Things NOT to include in RHC visit count:
Nurse visits
Physician visits not medically necessary
Hospital visits such as:
• Emergency room visits
• Observation
• Inpatient days

Effect of Including Nurse Visits
Medicare visits per the PS&R 4,210
Total encounters 9,500
Nurse visits 750
Total if nurse included 10,250
Total costs 1,662,500$
Medicare cost per visit 175.00$
Medicare cost per visit with nurse 162.20$
Decrease in cost-per-visit 12.80$
Times Medicare visits 4,210
Cost of nurse visits 53,888$

Worksheet M-2 (Continued)
• Minimum visits
[Productivity standard x FTE]
• Productivity standard:
Consistent between facilities and years
4200 visits per physician FTE
2100 visits per mid-level FTE

Worksheet M-2 (Continued)
• Determination of FTEs Actual hours worked vs. paid hours
• Include PTO hours
Time excluded: • Supervisory
• Hospital time
• ER time
Lower FTEs lowers the minimum visits
Lower minimum visits reduces the risk of having productivity issues
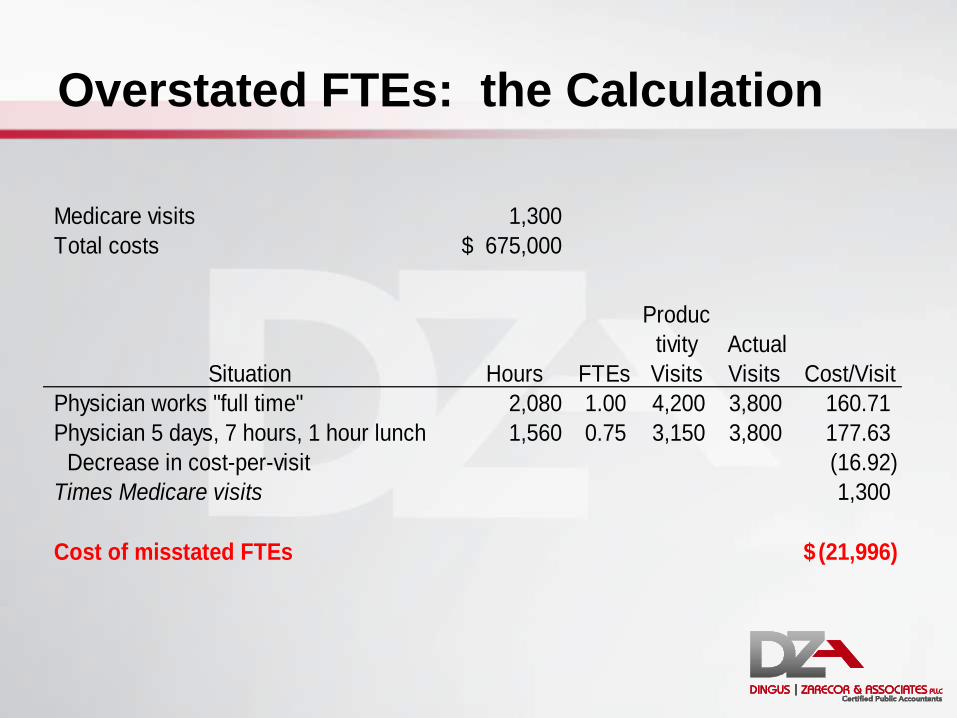
Overstated FTEs: the Calculation
Medicare visits 1,300
Total costs 675,000$
Situation Hours
FTEs
Produc
tivity
Visits
Actual
Visits Cost/Visit
Physician works "full time" 2,080 1.00 4,200 3,800 160.71
Physician 5 days, 7 hours, 1 hour lunch 1,560 0.75 3,150 3,800 177.63
Decrease in cost-per-visit (16.92)
Times Medicare visits 1,300
Cost of misstated FTEs (21,996)$

What did we learn today?
Worksheet
Cost reports are fun
S Information, settlement
A Expenses
B Allocation of overhead costs
C Revenues and cost to charge ratios
D Determination of Medicare’s costs
E Medicare settlement (Medicare bad debts)
G Summary financial statements
M Rural health clinics

Questions?

Contact Information
Shar Sheaffer, CPA, Owner [email protected]
Dingus, Zarecor & Associates PLLC
12015 E. Main Street, Suite A
Spokane Valley, Washington 99206
509.242.0874
www.dzacpa.com