cost of solid waste
TRANSCRIPT

8/8/2019 Cost of Solid Waste
http://slidepdf.com/reader/full/cost-of-solid-waste 1/8
54
Costof Solid
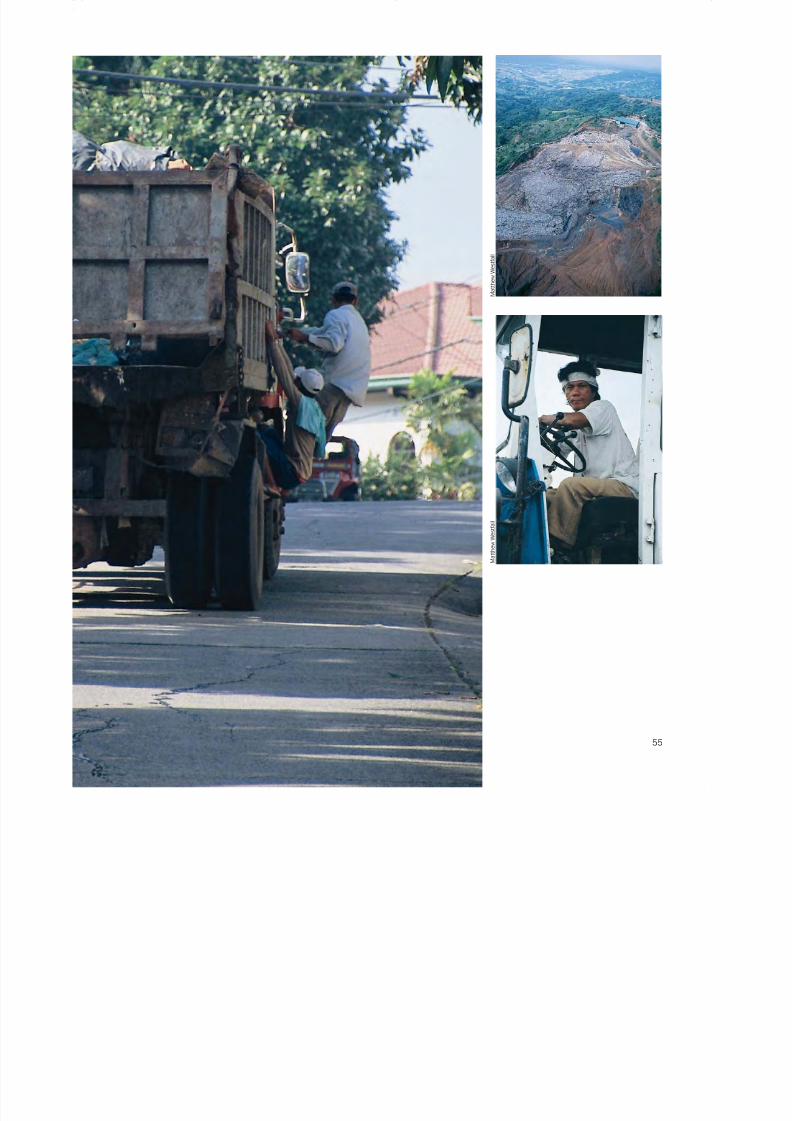
WasteOver P3.54 billion (US$64 million) is spent
annually on the collection and disposal of Metro
Manila’s solid waste, at an average cost of about
P1,450 ($26.40) per ton. Despite this high level
of spending, the system requires significant im-
provement. Sound financial management is key to
efficient and sustainable operations.Local governments are mandated by the
Local Government Code to collect fees for ser-
vices. One of these is the collection of waste
management fees from business establishments,
where the charges are incorporated in the annual
application for a business permit. Although local
governments are allowed to adjust fees
every 5 years, most have not.
Rates remain unrealistically low. For example,a typical fast food restaurant in one city pays only
P17 per day for waste disposal, far below the
actual cost.
Collection of waste management fees at the
household level is being implemented only in a
handful of wealthier barangays, but overall the
willingness of households to pay is limited.
In 2001, Metro Manila’s local government
expenses for solid waste management variedsignificantly, from about 5% to an astonishing
24% of their total expenditures, with an average
of approximately 13%. The majority of these
expenditures are spent on private hauling
contracts.
M a t t h e w W e s t f a l l
8/8/2019 Cost of Solid Waste
http://slidepdf.com/reader/full/cost-of-solid-waste 2/8
55
M a t t h e w W e s t f a l l
M a t t h e w W e s t f a l l

8/8/2019 Cost of Solid Waste
http://slidepdf.com/reader/full/cost-of-solid-waste 3/8
56
56
D o u b l e S l a s h

8/8/2019 Cost of Solid Waste
http://slidepdf.com/reader/full/cost-of-solid-waste 4/8
5757

8/8/2019 Cost of Solid Waste
http://slidepdf.com/reader/full/cost-of-solid-waste 5/8
58
Local governments are not recovering
the full cost of garbage collection ser-
vice. Since it is only the business sector
that is paying garbage fees, the rate of
recovery of expenses is very low, ranging from only 2% to 24%. The large balance
is subsidized by local government.
Per capita cost for solid waste man-
agement varies widely, from P64 per
person in Pateros to P1,164 per person
in Makati. The same is true for the cost
per ton of solid waste collected and dis-
posed.
Annual Per Capita SWM Cost, 2001
Total Percentagec Per Capita
LGU SWM Expensesa
Populationb
Cost
Caloocan 357,077 1,190,087 100% 300
Las Piñas 76,360 477,791 100% 160
Makati 418,577 449,583 80% 1,164
Malabon 22,067 342,447 100% 64
Mandaluyong 94,123 281,426 95% 352
Manila 574,990 1,597,841 100% 360
Marikina 52,804 395,316 100% 134
Muntinlupa 91,377 383,331 85% 280
Navotas 43,974 232,845 95% 199
Parañaque 182,893 454,579 100% 402
Pasay 243,807 358,670 100% 680Pasig 160,458 510,412 100% 314
Pateros 2,988 58,016 80% 64
Quezon City 941,828 2,196,874 100% 429
San Juan 46,701 118,927 90% 436
Taguig 120,949 472,329 100% 256
Valenzuela 42,716 490,579 80% 109
Average All LGUs 98% 393
LGU = local government unit, SWM = solid waste management.a Total expenses for SWM, in P’000.b Source: National Statistics Office, 2000 Census of Population and Housing. A growthrate of 2.36% was used to estimate 2001.c
Percentage of population serviced by LGU waste collection.
Per capita cost for solid waste management varies widely, from P64 per person in Pateros to P1,164 per person in Makati.
Collection of Business Garbage Fees vis-à-vis Total SWM
Expenses, 2001 (P’000)
SWM Rate of LGU Garbage Feesa Expensesb Recovery (%)c
Caloocan 20,714 357,007 6%
Las Piñas 12,820 76,361 17%
Makati 13,835 418,577 3%
Malabon 3,777 22,067 17%
Mandaluyong 7,247 94,123 8%
Manila 57,589 574,990 10%
Marikina 7,053 52,804 13%
Muntinlupa 7,012 91,377 8%
Navotas 1,850 43,974 4%
Parañaque 3,114 182,893 2%Pasay 5,473 243,807 2%
Pasig 11,414 160,458 7%
Pateros 406 2,988 14%
Quezon City 56,107 941,828 6%
San Juan 3,137 46,701 7%
Taguig 4,040 52,370 8%
Valenzuela 10,426 42,716 24%
Average All LGUs 226,014 3,558,345 7%
LGU = local government unit, SWM = solid waste management.a Total garbage fees collected from business establishments.b Total expenses for SWM.c
Percentage of total garbage fees collected as to total expenses for SWM.
M
a t t h e w W e s t f a l l
58

8/8/2019 Cost of Solid Waste
http://slidepdf.com/reader/full/cost-of-solid-waste 6/8
59
SWM Expenses vis-à-vis Total LGU Expenditures, 2001 (P’000)
LGU SWM Expensesa Total Expenses b Percentagec
Caloocan 357,077 1,491,883 24%
Las Piñas 76,361 850,009 9%
Makati 418,577 5,270,998 8%
Malabond 22,067 348,800 6%
Mandaluyong 94,123 1,129,801 8%
Manilae 574,990 4,558,818 13%
Marikina 52,804 778,475 7%
Muntinlupad 91,377 1,059,651 9%
Navotas 43,974 292,836 15%
Parañaque 182,893 1,358,644 13%
Pasay 243,807 1,219,353 20%
Pasig 160,458 1,814,072 9%Pateros 2,988 62,186 5%
Quezon City 941,828 4,467,316 21%
San Juan 46,701 430,373 11%
Taguig 52,370 432,394 12%
Valenzuelad 42,716 734,606 6%
Average All LGUs 3,558,345 26,300,215 13%
LGU = local government unit, SWM = solid waste management.a Total expenses for SWM.b Total current year expenditures of LGU.cPercentage total SWM expenses vis-à-vis total current year expense of LGU.dGarbage collection was done by administration.e
Garbage collection was done partly by administration and partly by privatehauling contractors.
Collection of Business Garbage Fees vis-à-vis Total Local
Income, 2001 (P’000)
Percentage
Share of
LGU Garbage Feesa Local Incomeb Garbage Feesc
Caloocan 20,714 657,435 3.2%
Las Piñas 12,820 414,004 3.1%
Makati 13,835 3,187,442 0.4%
Malabon 3,777 136,081 2.8%
Mandaluyong 7,247 730,947 1.0%
Manila 57,589 2,815,984 2.0%
Marikina 7,053 460,673 1.5%
Muntinlupa 7,012 491,287 1.4%
Navotas 1,850 94,290 2.0%
Parañaque 3,114 730,607 0.4%
Pasay 5,473 609,778 0.9%
Pasig 11,414 1,519,402 0.8%Pateros 406 22,551 1.8%
Quezon City 56,107 2,368,986 2.4%
San Juan 3,137 292,276 1.1%
Taguig 4,040 275,560 1.5%
Valenzuela 10,427 429,423 2.4%
Average All LGUs 1.5%
LGU = local government unit.a Total garbage fees collected from business establishments.bLocal Income includes taxes, fees, and charges collected by the LGU(excludes IRA, borrowings, and grants).cPercentage share of total garbage fees collected as to total local income.
E r i c S a l e s
E r i c S a l e s
59
The rate of recovery of expensesis very low, ranging from only 2% to 24%. The large balance issubsidized by local government.

8/8/2019 Cost of Solid Waste
http://slidepdf.com/reader/full/cost-of-solid-waste 7/8
6060
D o u b l e S l a s h

8/8/2019 Cost of Solid Waste
http://slidepdf.com/reader/full/cost-of-solid-waste 8/8
6161