cost of phosphorus removal at wisconsin publically-owned treatment works
TRANSCRIPT
COST OF PHOSPHORUS REMOVALAT
WISCONSIN PUBLICALLY-OWNEDTREATMENT WORKS
PREPARED BY
MARK B. WILLIAMS, P.E.Professional Consultant
WISCONSIN DEPARTMENT OF NATURAL RESOURCESDivision of Customer and Employee ServicesBureau of Community Financial Assistance
Environmental Loans Section
DECEMBER 2012

TABLE OF CONTENTS
EXECUTIVE SUMMARY . . . . . . . . . . . . . . . . . . . . . . . . . . . . . . . . . . . . . . . . . . . . . . . . . . . . . . i
1.0 INTRODUCTION . . . . . . . . . . . . . . . . . . . . . . . . . . . . . . . . . . . . . . . . . . . . . . . . . . . . . . . . . 1
2.0 DESCRIPTION OF STUDY . . . . . . . . . . . . . . . . . . . . . . . . . . . . . . . . . . . . . . . . . . . . . . 22.1 Project Work Plan . . . . . . . . . . . . . . . . . . . . . . . . . . . . . . . . . . . . . . . . . . . . . . . . . 22.2 Literature Review . . . . . . . . . . . . . . . . . . . . . . . . . . . . . . . . . . . . . . . . . . . . . . . . . 22.3 Development of Cost Curves . . . . . . . . . . . . . . . . . . . . . . . . . . . . . . . . . . . . . . . . . 2
3.2.1 CAPDETWorks Software . . . . . . . . . . . . . . . . . . . . . . . . . . . . . . . . . . . . . 23.2.2 Cost Comparison Study . . . . . . . . . . . . . . . . . . . . . . . . . . . . . . . . . . . . . . . 3
2.4 Assumed Effluent Limits . . . . . . . . . . . . . . . . . . . . . . . . . . . . . . . . . . . . . . . . . . . . 42.5 Estimating Discharger-Specific Phosphorus Removal Costs . . . . . . . . . . . . . . . . 5
2.5.1 Technology Applications for Various Levels of Phosphorus Removal . . 52.5.2 Costing Methodology . . . . . . . . . . . . . . . . . . . . . . . . . . . . . . . . . . . . . . . . 62.5.3 Information Used in Estimating Discharger Specific Phosphorus Removal
Costs . . . . . . . . . . . . . . . . . . . . . . . . . . . . . . . . . . . . . . . . . . . . . . . . . . . . . . 62.5.4 Evaluation of Treatment System Performance . . . . . . . . . . . . . . . . . . . . . 62.5.5 Working with CAPDETWorks . . . . . . . . . . . . . . . . . . . . . . . . . . . . . . . . . 7
2.6 Record Keeping . . . . . . . . . . . . . . . . . . . . . . . . . . . . . . . . . . . . . . . . . . . . . . . . . . . 9
3.0 DISCUSSION OF RESULTS . . . . . . . . . . . . . . . . . . . . . . . . . . . . . . . . . . . . . . . . . . . . . . . . 103.1 Estimated Capital Costs of Phosphorus Removal . . . . . . . . . . . . . . . . . . . . . . . . 103.2 Data Charts . . . . . . . . . . . . . . . . . . . . . . . . . . . . . . . . . . . . . . . . . . . . . . . . . . . . . 103.3 Extrapolated Statewide Phosphorus Removal Cost . . . . . . . . . . . . . . . . . . . . . . . 11
4.0 STUDY ASSUMPTIONS . . . . . . . . . . . . . . . . . . . . . . . . . . . . . . . . . . . . . . . . . . . . . . . . . . . 14
5.0 REFERENCES . . . . . . . . . . . . . . . . . . . . . . . . . . . . . . . . . . . . . . . . . . . . . . . . . . . . . . . . . . . 17
TABLES
TABLE 2.1 . . . . . . . . . . . . . . . . . . . . . . . . . . . . . . . . . . . . . . . . . . . . . . . . . . . . . . . . . . . . . . . . . . . 3TABLE 2.2 . . . . . . . . . . . . . . . . . . . . . . . . . . . . . . . . . . . . . . . . . . . . . . . . . . . . . . . . . . . . . . . . . . . 8TABLE 3.1 . . . . . . . . . . . . . . . . . . . . . . . . . . . . . . . . . . . . . . . . . . . . . . . . . . . . . . . . . . . . . . . . . . 10TABLE 3.2 . . . . . . . . . . . . . . . . . . . . . . . . . . . . . . . . . . . . . . . . . . . . . . . . . . . . . . . . . . . . . . . . . . 12
APPENDICESAppendix A: Summary List of Dischargers EvaluatedAppendix B: Data Graphs - <0.1 mg/l Effluent GroupAppendix C: Data Graphs - 0.1 to <0.5 mg/l Effluent GroupAppendix D: Data Graphs - 0.5 to < 1.0 mg/l Effluent GroupAppendix E: Data Statistics

i
EXECUTIVE SUMMARY
This report presents the result of a study to estimate the cost of providing capacity atpublically-owned treatment works (POTWs) in Wisconsin to reduce effluent phosphorusconcentrations to meet the water quality standards required in NR 217 of the WisconsinAdministrative Code. This study evaluated 217 POTWs that discharge treated effluent to surfacewater. The estimated cost of providing phosphorus removal at these treatment systems over the next10 years is $702,305,000 in 2012 dollars. A state wide estimated for all surface water dischargerscan be extrapolated from the data generated during this study. The extrapolated total cost ofphosphorus removal in Wisconsin could be as high as $1.35 billion, but more likely is in the rangeof $860 million to $953 million.

1
1.0 INTRODUCTION
Due to the documented adverse water quality issues caused by phosphorus in surface waters,the Wisconsin Department of Natural Resources (WDNR) has limited the effluent phosphorusconcentration in discharges from publically-owned treatment works (POTW) to 1.0 mg/l.Implementation of the regulatory requirements has been through the dischargers’ WisconsinPollutant Discharge Elimination System (WPDES) permit. There are limited exemptions to thisrequirement for small communities and dischargers of less than 150 pounds of phosphorus permonth.
Responding to national objectives set by the U.S. Environmental Protection Agency(USEPA), the WDNR revised Ch. 217 of the Wisconsin Administrative Code in 2010 to requiremore stringent effluent phosphorus limits in POTW discharges. As before, the new administrativecode and discharge requirements includes exemptions and variances for small communities.
This study was undertaken to estimate site-specific capital costs of providing the treatmentcapacity at POTWs for the removal of phosphorus in compliance with the new dischargerequirements. This study looked at POTWs only; privately-owned wastewater treatment systemssuch as those serving mobile home parks, privately-owned campgrounds, and nursing homes werenot included in this study.

2
2.0 DESCRIPTION OF STUDY
2.1 Project Work Plan
The first work component of this study was the development of a project work plan whichwas used to guide the study effort in a logical sequence of work tasks. The work plan called for thefollowing activities:
• Literature Search• Development of cost curves for estimating phosphorus removal costs• Assumed phosphorus effluent limitations for dischargers based on watersheds• Estimation of discharger-specific phosphorus removal costs• Record keeping
Each of these work activities is discussed below.
2.2 Literature Review
An internet-based literature search was conducted for the purposes of identifying treatmenttechnologies for the removal of phosphorus from wastewater, the removal efficacy of varioustreatment technologies, and costs associated with phosphorus removal. A listing of the literatureobtained and reviewed is contained in the Bibliography.
2.3 Development of Cost Curves
3.2.1 CAPDETWorks Software
Initially, the work plan suggested that a series of cost curves based on the literature and costinformation obtained from the Environmental Loans Oracle System (ELOS) database would bedeveloped to assist with the evaluation of site-specific phosphorus removal costs based in individualtreatment systems, treatment design capabilities, and treatment system performance. However thisapproach was abandoned early in the study based on cost curves contained in the 2008 EPAMunicipal Nutrient Removal Technologies Reference Document (Shin 2008). These costs curvesfor nutrient removal, including phosphorus and nitrogen removal, were developed by the USEPAusing available software called CAPDETWorks. CAPDETWorks was initially developed by theUSEPA in conjunction with the US Army Corps of Engineerd. It has since been purchased, andis maintained, by Hydomantis Environmental Software Solutions, Inc., Hamilton, Ontario, Canada.
CAPDETWorks is a planning software which allows rapid cost estimates and comparisonsof various treatment trains when planning for new or upgraded treatment works. The software allowsthe designer to construct a treatment facility schematic showing individual treatment units. It alsoallows input of influent and effluent flow characteristics, unit operating parameters, and selection
3
of equipment, cost, and financial indices. The software then calculates the number and size of thetreatment units and calculates the capital costs, annual O&M costs, annual chemical and energycosts, and total present worth of the conceptual schematic.
Based on the USEPA and manufacturer’s description of the software, it was determined thatCAPDETWorks would be a suitable for estimating phosphorus removal costs in Wisconsin. Useof the software eliminated the need to develop cost curves and provided a greater degree of certaintyto the cost estimates.
3.2.2 Cost Comparison Study
Hydromantis claims the CAPDETWorks software will estimate the construction cost oftreatment plants to within ± 20%. The EPA Municipal Nutrient Removal Technologies ReferenceDocument Volume I (Shin 2008)) contains case studies of 20 treatment systems including the actualcosts of construction and operation. The actual costs from the case studies are compared toCAPDETWorks estimates for identical treatment works. The comparisons demonstrated that theconstruction costs estimated by CAPDETWorks were within the claimed 20% margin.
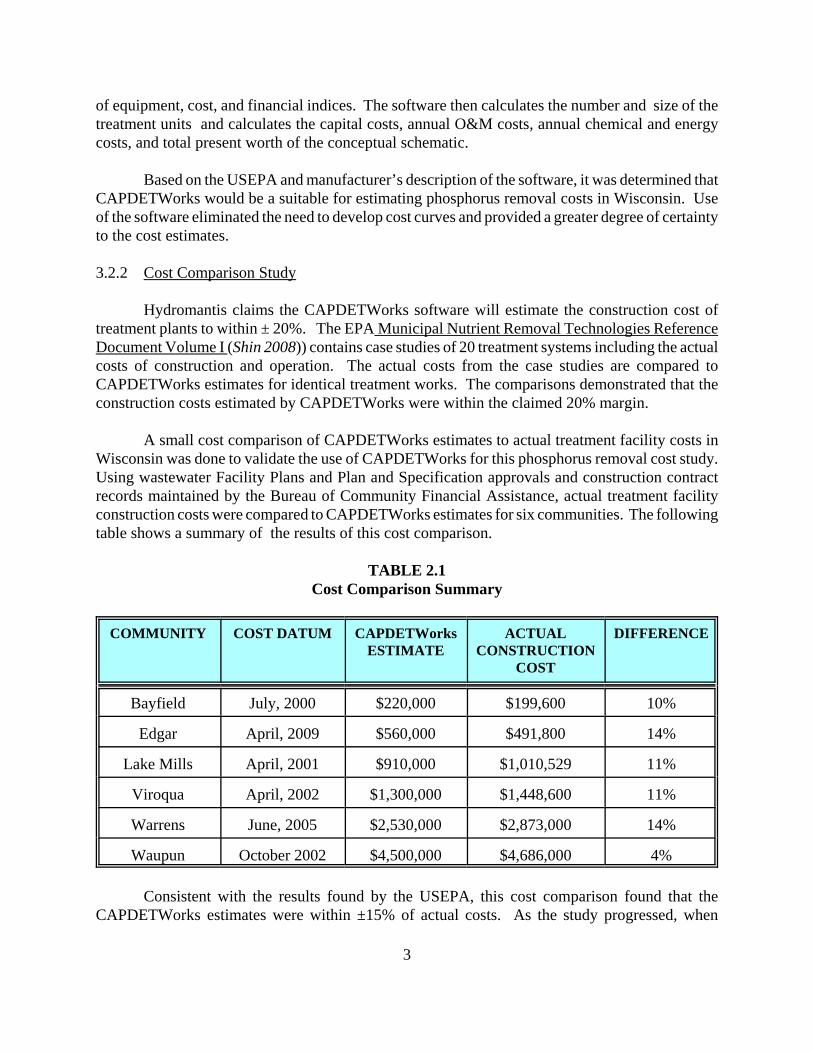
A small cost comparison of CAPDETWorks estimates to actual treatment facility costs inWisconsin was done to validate the use of CAPDETWorks for this phosphorus removal cost study.Using wastewater Facility Plans and Plan and Specification approvals and construction contractrecords maintained by the Bureau of Community Financial Assistance, actual treatment facilityconstruction costs were compared to CAPDETWorks estimates for six communities. The followingtable shows a summary of the results of this cost comparison.
TABLE 2.1Cost Comparison Summary
COMMUNITY COST DATUM CAPDETWorksESTIMATE
ACTUALCONSTRUCTION
COST
DIFFERENCE
Bayfield July, 2000 $220,000 $199,600 10%
Edgar April, 2009 $560,000 $491,800 14%
Lake Mills April, 2001 $910,000 $1,010,529 11%
Viroqua April, 2002 $1,300,000 $1,448,600 11%
Warrens June, 2005 $2,530,000 $2,873,000 14%
Waupun October 2002 $4,500,000 $4,686,000 4%
Consistent with the results found by the USEPA, this cost comparison found that theCAPDETWorks estimates were within ±15% of actual costs. As the study progressed, when

4
facilities planning cost data or actual construction data was available, the CAPDETWorks estimatewas compared to that cost information as a continuing validation of the CAPDETWorks costingaccuracy. For example it was found that the CAPDETWorks estimate for the City of Rhinelanderwas $16,619,000; actual construction contract costs were $16,710,080, a difference of less than1.0%. In 2008 the Bristol Utility District provided the Department with an estimate for phosphorusremoval of $2,381,000. This 2008 cost is within 15% of the 2012 CAPDETWorks cost estimate of$2,727,000 (personal communication Becky Scott; September 29, 2012).
2.4 Assumed Effluent Limits
Early in this study, the Bureau of Watershed Management provided a categorized list of themajor river watersheds in Wisconsin. A category designation was assigned to each watershed basedon phosphorus loading, assimilative capacity, and available phosphorus stream data. Category 1watersheds consisted of those river basins where surface water quality consistently meetsphosphorus water quality standards and criteria. Category 2 watersheds were those where somestreams within the watershed meet phosphorus water quality standards and some streams exceed thephosphorus water quality standards. Category 3 watersheds were those where water qualityconsistently exceeds phosphorus water quality standards and criteria.
There are 131 POTWs in Category 1 watersheds, 198 POTWs in Category 2 watersheds, and202 POTWs in Category 3 watersheds.
For this study, it was assumed that dischargers in the Category 1 watersheds would not berequired to improve phosphorus removal and no change, or limited changes, in current permittedphosphorus discharge limitations would be likely to occur. For Category 2 dischargers it wasassumed that some changes in phosphorus discharge limits are likely. For the Category 2watersheds, it was assumed that the upper 50% of the dischargers (based on influent flow rate andtotal phosphorus loading) would have to meet a 0.1 mg/l phosphorus limit; the remainingdischargers would have to meet a 0.5 mg/l limit. For the category 3 watersheds it was assumed thatall dischargers in the watershed would be required to meet very stringent phosphorus limits of 0.05mg/l.
There were two exceptions to the assumed phosphorus limitations. Lagoon systems wouldhave an assumed discharge limit of 1.0 mg/l. Finally, it was assumed that any direct discharge tothe Great Lakes would have to meet a 0.5 mg/l effluent limit.
These effluent limit assumptions were adjusted, however, for dischargers within the LowerRock River watershed and the Lower Fox River watershed to recognize the potential limits that arebeing determined through the Total Maximum Daily Loading (TMDL) studies that have beenapproved for these two watersheds. In these instances, Jim Baumann of the Bureau of WatershedManagement suggested specific effluent limits for these dischargers. For the most part, thesuggested limits varied from 0.075 mg/l to about 0.2 mg/l.

5
The assumed effluent limit for each POTW evaluated in this study is shown on the summarylist contained in Appendix A.
2.5 Estimating Discharger-Specific Phosphorus Removal Costs
2.5.1 Technology Applications for Various Levels of Phosphorus Removal
Based on the treatment descriptions and efficacies gleaned from the literature, the followingconceptual treatment trains were assumed for each level of phosphorus removal needed to achievethe assumed phosphorus effluent limits discussed above.
• Effluent Standard: 1.0 mg/l: Standard activated sludge process.• Effluent Standard: 0.5 mg/l: Enhanced Biological Phosphorus removal with mult-
point chemical injection and enhance biosolids handling.• Effluent Standard: 0.1 mg/l: Enhanced Biological Phosphorus removal with rapid
mix and flocculation chemical addition followed by sand filtration with enhancedbiosolids handling.
• Effluent Standard: 0.05 mg/l: Enhanced Biological Phosphorus removal with rapidmix and flocculation chemical addition followed by advance filtration with enhancedbiosolids handling.
During the course of the study, the noted conceptual treatment trains were considered to beupgrades and made to fit with the existing treatment works. The evaluation of each individualPOTW was very brief and the practicalities of the assumed upgrades were not evaluated. In reality,for some treatment systems a more detailed analysis might find it more cost-effective to replace anaging treatment system with a new system specifically designed for phosphorus reduction rather thanretrofitting with upgraded unit treatment processes to improve phosphorus reduction from the wastestream.
The stated treatment process assumptions were modified slightly through the course of thisstudy. For example for communities served by a lagoon treatment system, the lagoon system wasnot replaced with an activated sludge system as would be suggested by the treatment requirementsnoted above. Instead, chemical addition and settling units were added to the treatment schematicfollowing the lagoon(s) and prior to disinfection and discharge. Likewise, standard activated sludgetreatment systems were assumed to be capable of being operated in an enhanced biologicalphosphorus removal manner and the additional needed phosphorus removal was achieved strictlythrough chemical addition, coagulation / flocculation, and subsequent filtration. However, in acouple of instances, e.g. Forest Junction Sanitary District, the Town of Plymouth Sanitary District#1, and the Wrightstown Sanitary District #2, a new treatment system was assumed over retrofittingthe existing wastewater facility when it was perceived that a new system would be required to meetstringent effluent limits as determined by TMDL.

6
2.5.2 Costing Methodology
The estimated capital cost of phosphorus removal was calculated by (1) estimating the year2010 construction cost of the existing treatment system; (2) estimating the year 2010 cost of theupgraded treatment system; and (3) subtracting the cost of the existing system from the cost of theupgraded system. With the exception of the City of Waukesha, all costs were estimated using theCAPDETWorks software. Costs for phosphorus removal for Waukesha were taken from a May 2011Facilities Plan for Waukesha prepared by Strand Associates, Madison, Wisconsin.
2.5.3 Information Used in Estimating Discharger Specific Phosphorus Removal Costs
For the most part, technical and regulatory information used in evaluating individualtreatment plant performance was obtained from the Department’s System for WastewaterApplications, Monitoring and Permits (SWAMP) database. This information included influent andeffluent data, treatment system design information, treatment facility description, and the currentWPDES discharge permit. In cases where information was not available – or only partially available– from SWAMP, other sources of information were consulted included discharger websites,regional planning commission documents (obtainable on line), Department district staff, and directcommunications with treatment plant operators, engineers, or directors of public works.
Current (2010) service populations were generally obtained from population projectionsprepared by the Wisconsin Department of Administration (WDOA 2010). Year 2022 populationswere estimated by extrapolation. In cases of larger regional treatment systems the estimated servicepopulations were based on the individual populations of the municipalities or communities projectedby the DOA population document. For dischargers such as sanitary districts or unincorporatedpopulation centers where the current service population was not available from the DOA data,population estimates were obtained from online sources such community websites, city/countycensus data, or regional planning documents.
2.5.4 Evaluation of Treatment System Performance
For each treatment facility, the treatment system performance was evaluated based on thefive-year influent and effluent monitoring record. For cost estimates done early in the studybeginning in 2011, the influent and effluent records for the years 2006 through 2010 weredownloaded from SWAMP. Beginning in January 2012, influent and effluent records for the years2007 through 2011 were used.
Evaluation of treatment plant performance included:
• 5-year monthly average and monthly average peak influent flow rates versus designflow rates;
• Current BOD5 and total suspended solids loading (lbs/day) versus design loading;

7
• Current phosphorus and ammonia nitrogen loading (lbs/day) (when availableotherwise influent PO4 and NH3 concentrations were assumed to be 8.0 mg/l and28.0 mg/l, respectively) versus design loadings;
• 5-year monthly average BOD5 effluent concentrations versus permit limitations;• 5-year monthly average total suspended solids (TSS) effluent concentrations versus
permit limitations;• 5-year average phosphorus effluent concentrations versus permit limitations; and• 5-year average ammonia nitrogen effluent concentrations versus permit limitations.
While this study was focused on the costs of upgrading treatment systems to meet assumed effluentphosphorus limits, when other monitoring data indicated that the system also needed upgrading toimprove hydraulic capacity and/or BOD5, TSS, and NH4 removal to meet permit limits, the cost ofthe needed upgrades were also calculated. When a system upgrade was evaluated, the designconditions for the upgrade were assumed for the year 2022 based on population growth estimates.
2.5.5 Working with CAPDETWorks
As previously noted, CapdetWorks is cost-estimating software that allows rapid facilityplanning-level cost evaluation of wastewater treatment systems. CAPDETWorks is based on theCAPDET cost estimating model developed in the early 1970s by the U.S. Army Corps of Engineersfor the USEPA. The Capdet model used cost curves developed for standard wastewater treatementsystem unit processes. Hydromantis has improved the CAPDET model by adding more standardtreatment process units and incorporated algorithms and statistically generated cost curves based onaverage cost and specified design and operational parameters. CAPDETWorks Version 2.5,purchased in April 2011 was used for this study.
CAPDETWorks provides default design parameters for each unit treatment process. Thesedefaults can be overridden, however, by the software user allowing estimates based on specificinfluent characteristic, unit process parameters, and effluent goals. For the most part, the defaultparameters provided by the software were accepted for this study. Exceptions were made, however,to input specific influent and system design information, and minor changes to some unit processesto match design requirements specified in Wisconsin Administrative Code Chapter NR 110.
CAPDETWorks allows manipulation of various unit cost information used in making thetreatment facility cost estimate. Unit Costs include construction and material costs, labor costs,chemical costs, financial factors such as interest rate, length of construction, and the operating lifeof the treatment facility. CAPDETWorks includes in it’s calculations other costs such asmobilization, site preparation, site electrical, yard piping, instrumentation and controls, lab andadministration building, contractor profit, legal costs, engineering fees, contingency, and land. TheCAPDETWorks default values for each financial parameter can also be overridden by the softwareuser by substituting alternate values.
CAPDETWorks cost estimates are based on one of three equipment cost databases: USAAverage July 1977, USA Average July 2000, and USA Average September 2007. In addition, the

8
software allows adjustment of three construction indices: Engineering News Record (ENR),Marshall and Swift (M&S), and the pipes, valve, and fitting (PIPE) component of the ChemicalEngineering Plant Cost Index. These indexes allow an estimate of the changes in equipment andother construction costs over time and are used to update cost estimates from one point in time toanother point in time. The following table shows adjustments made to the default costing parameterfor this phosphorus removal cost study.
TABLE 2.2CAPDETWorks COSTING PARAMETERS
COST PARAMETER CAPDETWorks DEFAULTVALUE
ADJUSTED VALUE USED FORPHOSPHORUS COST STUDY
Equipment Cost Database September, 2007 September, 2007
Cost Indices ENR Construction Index: 7930.8
Marshall & Swift: 1383.6
Chemical Engineering PIPE Index:738.8
Adjusted to average year 2010value: 8802.4
Adjusted to December 2010 value:1457.4
Adjusted to December 2010 value: 819.04
Financial Parameters - Interest
- Construction Period
- Operating life of plant
8%
3 years
40 years
Adjusted to February 2010discounted rate value: 0.75%
1 year for influent flow rate <0.1mgd2 years for influent flow rate >0.1,<1.0 mgd3 years for influent flow rate >1.0.,<10.0 mgd4 years for influent flow rate >10mgd
40 years.
Other Costing Parameter - Miscellaneous Costs - Legal Costs - Engineering Design Fee* - Inspection Costs* - Contingency* - Other Technical Costs* - Contractor Profit
5%2%
15%2%
10%2%
15%
5%2%0%0%0%0%
15%
Cost of Land $20,000 / acre $0 / acre (land ignored)
* Note: Engineering / technical / inspection and contingencies were calculated separately based on the CapdetWorkscost estimate. Engineering fees were calculated at 20% and contingency allowance was calculated at 10%.

9
Output from CAPDETWorks includes the estimated construction cost, annual operation andmaintenance costs; annual material, chemical and energy costs; and the total present worth of thesystem based on the either the CAPDETWorks default financial values or those selected by the user.For the purpose of this cost study only the construction costs estimates were useful.
2.6 Record Keeping
Results of this study were compiled and maintained in a Microsoft Excel 2010 spreadsheetdatabase. The database included a summary tab which showed basic information about eachdischarger, the presumed phosphorus effluent limit used in the cost estimate, the estimated capitalcosts, engineering costs, and contingency costs. As discussed above, costs were estimated in 2010dollars, but have been converted to 2012 dollars using the January 2012 Engineering New Record(ENR) construction cost index.
The project database also included a separate tab for each discharger. The discharger tabswere based on a standardized worksheet that included individual tables for summarizing the 5-yearinfluent and effluent data, permit discharge limit information, calculation of reserve capacity of thetreatment system. Each tab also contained work areas for a description of the existing treatmentsystem, present system performance, and a description of upgrades necessary to meet the assumedphosphorus effluent limit; visual presentation of the existing and upgraded treatment systemschematic diagrams, and estimated unit process costs obtained from CAPDETworks.

10
3.0 DISCUSSION OF RESULTS
3.1 Estimated Capital Costs of Phosphorus Removal
There are 530 permitted POTW surface water dischargers in the State of Wisconsin. Twohundred and seventeen of these (41%) were evaluated during this phosphorus removal cost study.Twenty-two of the evaluated POTW surface water dischargers were found not to require phosphorusremoval upgrades based on current treatment performance and the assumed phosphorus effluentlimits. For the remaining 195 facilities, phosphorus removal costs (including engineering andcontingency) ranges from $164,000 for the Village of Cascade (design population 670 persons) to$161,117,000 for the Milwaukee Metropolitan Sewerage District Jones Island Treatment Facility(design population 652,100). The total estimated capital cost of phosphorus removal for these 195facilities is $702,305,000. All costs are in January 2012 dollars.
The following table shows the range of estimated costs and total costs for groupings ofassumed effluent phosphorus concentrations.
TABLE 3.1PHOSPHORUS REMOVAL COSTS BY EFFLUENT GROUP
EFFLUENTPHOSPHORUS
CONCENTRATION
NUMBER OFEVALUATED
FACILITIES INEFFLUENT
GROUP
LOWEST COST HIGHEST COST TOTAL COSTFOR EFFLUENT
GROUP
<0.1 mg/l 146 $466,000 $161,117,000 $547,684,000
0.1 to <0.5 mg/l 25 $465,000 $25,809,000 $143,005,000
0.5 to <1.0 mg/l 24 $164,000 $580,000 $11,616,000
TOTALS 195 $702,305,000
An alphabetical listing of the POTWs evaluated in this study is contained in Appendix A.
3.2 Data Charts
Appendices B To D contain data graphs showing the study results is various visualpresentations. Appendix B contains the charts for the <0.1 mg/l effluent group. Appendix Ccontains the charts for the 0.1 to <0.5 mg/l effluent group. And Appendix D contains the charts forthe 0.5 to <1.0 mg/l group. Following are descriptions of the data graphs.
• Graphs B.1, C.1, and D.1 show the Capital Cost of phosphorus removal versus thedesign Influent Flow Rate for each effluent group.

11
• Graphs B.2, C.2, and D.2 show Capital Cost versus Design Population.• Graphs B.3, C.3, and D.3 show the unit Per Capita Cost versus Design Population.• Graphs B.4, C.4, D.4 show the unit Phosphorus Removal Capital Cost (dollars/pound
phosphorus removed per day) versus the Design Population.• Graphs B.5, C.5, D.5 show the Capital Cost versus Influent Phosphorus Loading
(lbs/day)• Graphs B.6, C.6, D.6 show the unit Phosphorus Removal Capital Costs versus the
Influent Phosphorus Loading.
Because of the large variations in costs and facility sizes of the surface water dischargesevaluated in this study, all the data graphs are shown on logarithmic scales. Each data graphs showsthe best fit line for the data as determined by the Excel software. The formula for each line and thecoefficient of determination is shown on each graph. These lines constitute cost curves that wouldallow the calculation of capital costs or unit capital costs when only the population, influent flowrate, or influent phosphorus loading is known.
As a group these graphs show that the capital cost of phosphorus removal increases withincreasing population, influent flow rate, and influent phosphorus loading. The rate of increase ofthe capital costs is asymptotic and the slope of the curve of the best fit line approaches zero for verylarge facilities.
When expressed in unit costs of dollars per pound phosphorus removed per day, this studykeenly illustrates the economies of scale at play between the phosphorus removal costs for smallcommunities versus those for large discharges. The unit cost of phosphorus removal varied fromabout $3.8 million per pound phosphorus removed per day at a treatment facility with a designservice population of about 140 people (Wrightstown Sanitary District #2) to about $11,300 perpound phosphorus removed per day at a treatment facility with a design service population of about11,500 persons (City of Monroe). For the Milwaukee Metropolitan Sewerage District Jones IslandTreatment facility (design service population: 652,100) the unit cost is estimated to be $31,800 perpound phosphorus removed per day. The unit rate for the Madison Metropolitan Sewerage District(design service population: 379,100) is $20,800 per pound phosphorus removed per day.
When describing the unit phosphorus removal cost for a given POTW, the influentphosphorus mass in pounds per day is calculated based on the assumed design influent flow rate (inmillion gallons per day) and either the known or assumed influent phosphorus concentration (inmg/l). Likewise the effluent mass loading is calculated based on the assumed design flow rate andthe assumed phosphorus effluent limit for that POTW.
3.3 Extrapolated Statewide Phosphorus Removal Cost
The phosphorus removal costs estimated by this study are not the entire picture, however,because only 41% of the permitted POTW surface water dischargers were evaluated. Of the 217POTWs evaluated, cost estimates were made for all 202 Category 3 watershed POTWs (watershed

12
categories were previously defined in Section 2.4 of this report). However, time permittedevaluation of only 15 Category 2 POTWs; no Category 1 POTWs were reviewed. Using the datafrom Table 3.1, it is possible to extrapolate an estimate of the state wide cost of phosphorus removalby multiplying the average cost of phosphorus removal for each effluent grouping shown in Table3.1 by the total number of dischargers which fall into that effluent category. The results of thisextrapolation are shown in Table 3.2. Note that the number of facilities listed for the 0.1 to <0.5mg/l group includes both one-half of the Category 2 watershed dischargers and 33 dischargers fromthe Category 3 watersheds which were determined would have less stringent effluent limits basedon TMDL studies than the 0.05 mg/l phosphorus limit assumed for that watershed category. Thenumber of dischargers shown for the 0.5 to <1.0 mg/l effluent group consists of the other half of theCategory 2 watershed dischargers. It is assumed that there is no costs or only marginal costsassociated with phosphorus removal for the Category 1 watershed dischargers.
TABLE 3.2ESTIMATED STATEWIDE COST OF PHOSPHORUS REMOVAL
EFFLUENTPHOSPHORUS
CONCENTRATION
TOTAL NUMBER OFFACILITIES IN
EFFLUENT GROUP
AVERAGE COST OFPHOSPHORUS
REMOVAL FOREFFLUENT GROUP
TOTAL COSTFOR EFFLUENT
GROUP
<0.1 mg/l 146 $3,752,000 $547,684,000
0.1 to <0.5 mg/l 132 $5,720,200 $755,066,400
0.5 to <1.0 mg/l 99 $484,000 $47,916,000
TOTALS 377 $1,350,666,000 [Note: 377 facilities + 22 no cost facilities + 131 Category 1 watershed dischargers = 530 facilities]
This extrapolated value is skewed, however, because of the higher average cost for the 0.1to < 0.5 mg/l effluent group when compared to the average cost for the <0.1 mg/l group. The datastatistics presented in Appendix E show that the 25 dischargers in the 0.1 to <0.5 mg/l effluent groupwere, as a group, larger facilities than the 146 facilities in the <0.1 mg/l effluent group. Since the costof phosphorus removal is a function of both technology cost to meet effluent requirements andfacility size, the costs associated with the facility size make up for the less sophisticated technologiesneeded to meet the less stringent effluent limits of the 0.1 to <0.5 mg/l group.
Given that the 25 facilities evaluated in the 0.1 to <0.5 mg/l group is only 20% of the totalnumber of facilities in that effluent group, it is reasonable to expect that if all facilities in this effluentgroup were evaluated, the average cost of phosphorus removal would decrease and ultimately be lessthan the average for the <0.1 mg/l effluent group. If it is assumed that the average cost of phosphorusremoval for the 0.1 to <0.5 mg/l group is somewhere between the average cost of the <0.1 mg/l groupand the last effluent group, the expected average cost would be in the range of $2,000,000 to$2,500,000 for each facility. Based on this, the extrapolated cost of the 0.1 to <0.5 mg/l effluent

13
group would range from $264,000,000 to $330,000,000. Using assumption, the total capital cost ofphosphorus removal in Wisconsin would range from $859,600,000 to $925,600,000.
14
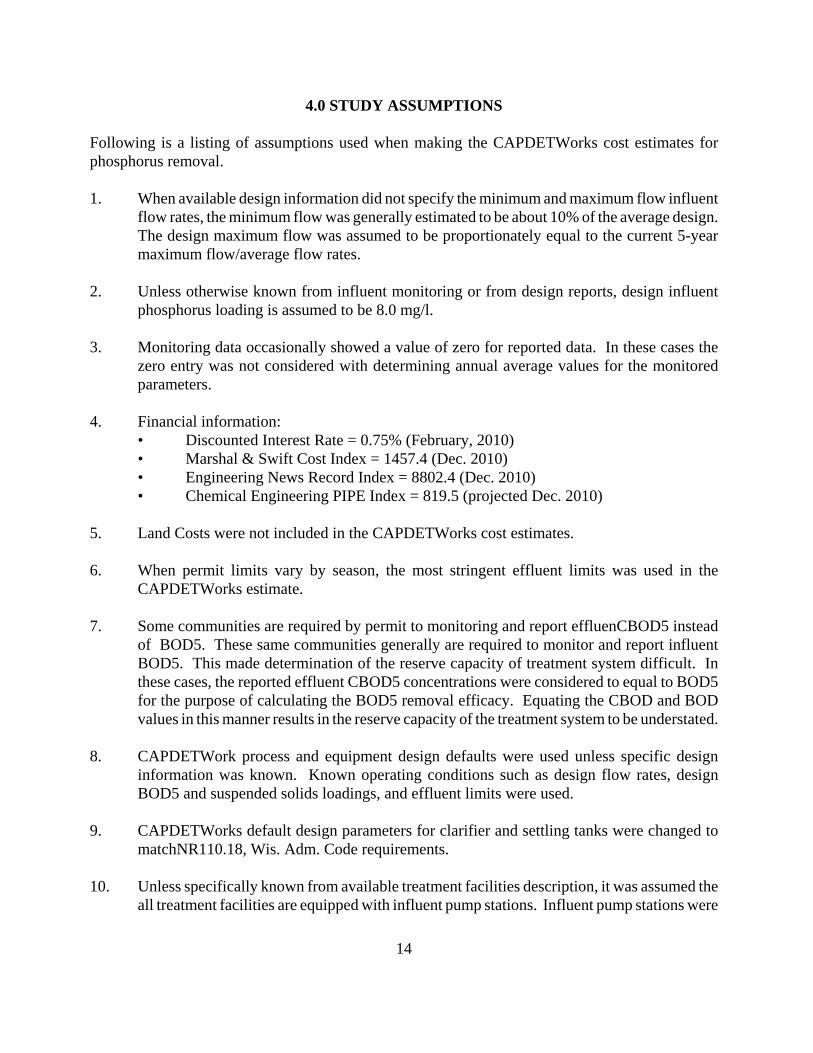
4.0 STUDY ASSUMPTIONS
Following is a listing of assumptions used when making the CAPDETWorks cost estimates forphosphorus removal.
1. When available design information did not specify the minimum and maximum flow influentflow rates, the minimum flow was generally estimated to be about 10% of the average design.The design maximum flow was assumed to be proportionately equal to the current 5-yearmaximum flow/average flow rates.
2. Unless otherwise known from influent monitoring or from design reports, design influentphosphorus loading is assumed to be 8.0 mg/l.
3. Monitoring data occasionally showed a value of zero for reported data. In these cases thezero entry was not considered with determining annual average values for the monitoredparameters.
4. Financial information:• Discounted Interest Rate = 0.75% (February, 2010)• Marshal & Swift Cost Index = 1457.4 (Dec. 2010)• Engineering News Record Index = 8802.4 (Dec. 2010)• Chemical Engineering PIPE Index = 819.5 (projected Dec. 2010)
5. Land Costs were not included in the CAPDETWorks cost estimates.
6. When permit limits vary by season, the most stringent effluent limits was used in theCAPDETWorks estimate.
7. Some communities are required by permit to monitoring and report effluenCBOD5 insteadof BOD5. These same communities generally are required to monitor and report influentBOD5. This made determination of the reserve capacity of treatment system difficult. Inthese cases, the reported effluent CBOD5 concentrations were considered to equal to BOD5for the purpose of calculating the BOD5 removal efficacy. Equating the CBOD and BODvalues in this manner results in the reserve capacity of the treatment system to be understated.
8. CAPDETWork process and equipment design defaults were used unless specific designinformation was known. Known operating conditions such as design flow rates, designBOD5 and suspended solids loadings, and effluent limits were used.
9. CAPDETWorks default design parameters for clarifier and settling tanks were changed tomatchNR110.18, Wis. Adm. Code requirements.
10. Unless specifically known from available treatment facilities description, it was assumed theall treatment facilities are equipped with influent pump stations. Influent pump stations were

15
assumed to be equipped with constant speed pumps. Smaller system (<0.1 mgd) wereassumed to be equipped with two pumps, systems with design influent rates between 0.1 and0.5 mgd were assumed to be equipped with three pumps. Larger systems were assumed tobe equipped with four pumps for influent flow rates between 0.5 and 1.0 mgd, and facilitieslarger than 1.0 mgd were equipped with five pumps.
11. The project Work plan called for sand filtration for treatment facilities meeting a 0.1 mg/leffluent phosphorus limitation while advanced filtration would be required for systemsmeeting a more stringent effluent phosphorus limit of <0.1 mg/l. Unfortunately,CAPDETWorks provided effluent limits for sand filtration and does not contain costinformation for advanced filtration equipment and thus was non-distinguishing for the twoeffluent conditions. A difference was forced, however, by reducing the allowable hydraulicloading rate to the sand filters for systems meeting <0.1 mg/l effluent phosphorus and a largerhydraulic loading rate for those facilities meeting 0.1 mg/l. This resulted in large sand filtersand thus a higher cost of filtration equipment for the more stringent effluent situation.
12. Unless otherwise specified, alum addition was assumed for chemical precipitation ofphosphorus.
13. Most Wisconsin wastewater treatment facilities dispose of treated waste biosolids byapplication to agricultural lands. CAPDETWorks only provides equipment cost for disposalof waste sludge by landfilling. The landfilling equipment costs were assumed to equal to theequipment costs of land application.
14. Sludge handling facilities were determined based on the current configuration of the treatmentfacility. For smaller facilities with aerobic digestion and storage units, the cost estimatedassumed an increase in the size of these facilities based on predicted sludge generation. Forlarger facilities, generally using anaerobic digestion, the cost estimate assumed expandedanaerobic digestion with dewatering process to reduce sludge volume for storage and ultimatedisposal.
15. For very small treatment facilities, it is assumed that the facility would not purchase sludgehauling equipment for disposing of sludge, but would have the hauling done by contract orwith existing equipment. For these facilities, the equipment cost associated with sludgedisposal has not been included in the CAPDETWorks cost estimate.
16. Sludge storage tanks assume where assumed to have a 180 days storage capacity. Storagetanks were assumed to be circular concrete tanks with variable sludge storage depths and a2-foot freeboard. Tank wall and floors were assumed to be one foot thick. Tank covers wereassumed to be 10% of the tank construction costs.
17. Septage receiving stations/tanks were assume to have a volume equal to 1% of design averageflow and a 24-hour holding time. The calculated volume was equated to equivalent 5,000-

16
gallon septic tanks at an assumed cost of $6,000 per septic tank.
18. Dechlorination tanks and equipment were assumed to be 30% of the costs of chlorinationtanks and equipment based on a based on a 10-minute contact time in dechlorinationcompared to 30 minutes for chlorination.
17
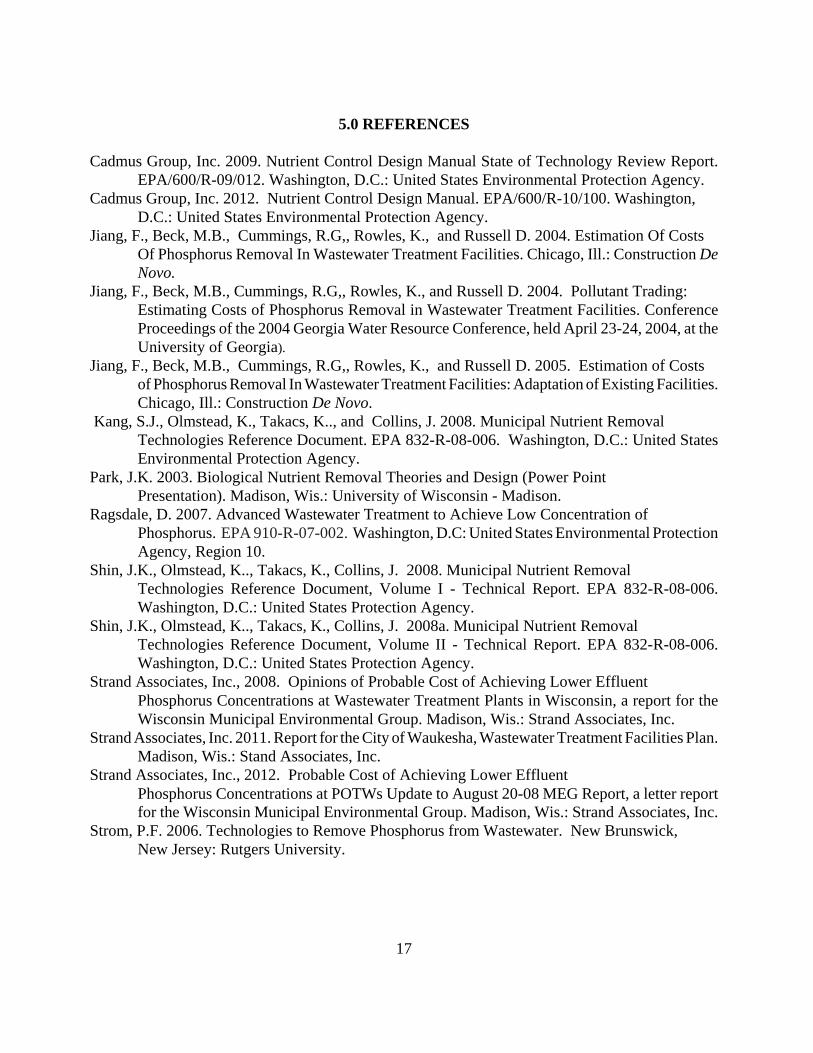
5.0 REFERENCES
Cadmus Group, Inc. 2009. Nutrient Control Design Manual State of Technology Review Report.EPA/600/R-09/012. Washington, D.C.: United States Environmental Protection Agency.
Cadmus Group, Inc. 2012. Nutrient Control Design Manual. EPA/600/R-10/100. Washington,D.C.: United States Environmental Protection Agency.
Jiang, F., Beck, M.B., Cummings, R.G,, Rowles, K., and Russell D. 2004. Estimation Of CostsOf Phosphorus Removal In Wastewater Treatment Facilities. Chicago, Ill.: Construction DeNovo.
Jiang, F., Beck, M.B., Cummings, R.G,, Rowles, K., and Russell D. 2004. Pollutant Trading:Estimating Costs of Phosphorus Removal in Wastewater Treatment Facilities. ConferenceProceedings of the 2004 Georgia Water Resource Conference, held April 23-24, 2004, at theUniversity of Georgia).
Jiang, F., Beck, M.B., Cummings, R.G,, Rowles, K., and Russell D. 2005. Estimation of Costsof Phosphorus Removal In Wastewater Treatment Facilities: Adaptation of Existing Facilities.Chicago, Ill.: Construction De Novo.
Kang, S.J., Olmstead, K., Takacs, K.., and Collins, J. 2008. Municipal Nutrient RemovalTechnologies Reference Document. EPA 832-R-08-006. Washington, D.C.: United StatesEnvironmental Protection Agency.
Park, J.K. 2003. Biological Nutrient Removal Theories and Design (Power PointPresentation). Madison, Wis.: University of Wisconsin - Madison.
Ragsdale, D. 2007. Advanced Wastewater Treatment to Achieve Low Concentration ofPhosphorus. EPA 910-R-07-002. Washington, D.C: United States Environmental ProtectionAgency, Region 10.
Shin, J.K., Olmstead, K.., Takacs, K., Collins, J. 2008. Municipal Nutrient RemovalTechnologies Reference Document, Volume I - Technical Report. EPA 832-R-08-006.Washington, D.C.: United States Protection Agency.
Shin, J.K., Olmstead, K.., Takacs, K., Collins, J. 2008a. Municipal Nutrient RemovalTechnologies Reference Document, Volume II - Technical Report. EPA 832-R-08-006.Washington, D.C.: United States Protection Agency.
Strand Associates, Inc., 2008. Opinions of Probable Cost of Achieving Lower EffluentPhosphorus Concentrations at Wastewater Treatment Plants in Wisconsin, a report for theWisconsin Municipal Environmental Group. Madison, Wis.: Strand Associates, Inc.
Strand Associates, Inc. 2011. Report for the City of Waukesha, Wastewater Treatment Facilities Plan.Madison, Wis.: Stand Associates, Inc.
Strand Associates, Inc., 2012. Probable Cost of Achieving Lower EffluentPhosphorus Concentrations at POTWs Update to August 20-08 MEG Report, a letter reportfor the Wisconsin Municipal Environmental Group. Madison, Wis.: Strand Associates, Inc.
Strom, P.F. 2006. Technologies to Remove Phosphorus from Wastewater. New Brunswick,New Jersey: Rutgers University.

18
WDOA (Wisconsin Department of Administration. 2010. Wisconsin Department of AdministrationExcel Spreadsheet "Final Population Projections for Wisconsin Municipalities: 2000 - 2025".Madison, Wis.: Wisconsin Department of Administration.
WDNR (Wisconsin Department of Natural Resources). 1999. Biological Phosphorus RemovalPotential Test, Research Report 179. Madison, Wis.: Wisconsin Department of NaturalResources.
WDNR (Wisconsin Department of Natural Resources). 1997. Wastewater Characterization forEvaluation of Biological Phosphorus Removal, Research Report 174. Madison, Wis.:Wisconsin Department of Natural Resources.
Weston (Roy F.), Inc.. 1985. Emerging Technology Assessment of Phostrip, A/O, and BardenphoProcesses for Biological Phosphorus Removal. PB85-165744. Washington, D.C.: UnitedStates Environmental Protection Agency.
Zahreddine, P. 2008. EPA’s Municipal Nutrient Removal Technologies Reference Document.Power Point Presentation: Nutrient Reduction and Efficiency Workshop, November 18–20,2008, Ft. Mitchell, Kentucky.

APPENDIX ALIST OF EVALUATED FACILITIES
SEWERAGE AUTHORITY
PRESUMED
PHOSPHORUS
EFFLUENT LIMIT FOR
STUDY (mg/l)
PHOSPHORUS
REMOVAL COST
ESTIMATE (2012
DOLLARS) (ENR
CCI: 9171.73)
Total Needs Estimate $ 702,305,000
ABBOTSFORD WASTEWATER TREATMENT FACILITY 0.05 1,057,000$
ADAMS WASTEWATER TREATMENT FACILITY 0.05 1,867,000$
ALGOMA WASTEWATER TREATMENT FACILITY 0.05 1,152,000$
ANTIGO CITY OF 0.05 1,589,000$
APPLETON WASTEWATER TREATMENT FACILITY 0.200 25,809,000$
ARGYLE WASTEWATER TREATMENT FACILITY 0.05 1,303,000$
ARLINGTON WASTEWATER TREATMENT FACILITY 0.04 1,155,000$
ARPIN WASTEWATER TREATMENT FACILITY 1.00 497,000$
ATHENS WASTEWATER TREATMENT FACILITY 1.00 580,000$
AUBURNDALE WASTEWATER TREATMENT FACILITY 1.00 527,000$
BAGLEY WASTEWATER TREATMENT FACILITY 0.05 759,000$
BAILEYS HARBOR WASTEWATER TREATMENT FACILITY 0.50 No phosphorus removal updgrade is neces
BARABOO WASTEWATER TREATMENT FACILITY 0.10 2,311,000$
BARNEVELD WASTEWATER TREATMENT FACILITY 1.00 569,000$
BELGIUM WASTEWATER TREATMENT FACIL 0.05 907,000$
BELMONT WASTEWATER TREATMENT FACILITY 0.05 1,074,000$
BELOIT TOWN WASTEWATER TREATMENT FACILITY 0.199 1,889,000$
BELOIT WASTEWATER TREATMENT FACILITY 0.204 4,163,000$
BENTON WASTEWATER TREATMENT FACILITY 0.05 1,503,000$
BLANCHARDVILLE WASTEWATER TREATMENT FACILITY 0.05 1,290,000$
BLENKER SHERRY SANITARY DISTRICT WWTP 0.05 777,000$
BLOOMINGTON WASTEWATER TREATMENT FACILITY 0.05 1,192,000$
BLUE MOUNDS WASTEWATER TREATMENT FACILITY 0.05 938,000$
BRILLION WASTEWATER TREATMENT FACILITY 0.05 1,336,000$
BRISTOL UTILITY DISTRICT 1 0.05 2,727,000$
BROKAW WASTEWATER TREATMENT FACILITY 0.05 810,000$
BROOKFIELD, CITY OF 0.05 8,373,000$
BROWNTOWN WASTEWATER TREATMENT FACILITY 1.00 528,000$
BURLINGTON WATER POLLUTION CONTROL 0.05 5,821,000$
CAMBRIDGE OAKLAND WASTEWATER COMMISSION 0.075 2,011,000$
CAMPBELLSPORT WASTEWATER TREATMENT FACILITY 0.05 1,271,000$
CASCADE WASTEWATER TREATMENT FACILITY 1.00 164,000$
CASCO WASTEWATER TREATMENT FACILITY 0.05 699,000$
CASSVILLE WASTEWATER TREATMENT FACILITY 0.05 1,978,000$
CEDAR GROVE WASTEWATER TRTMNT FACIL 0.05 1,473,000$
CEDARBURG WASTEWATER TREATMENT FACILITY 0.05 4,453,000$
CHILI WASTEWATER TREATMENT FACILITY 1.0 554,000$
CHILTON WASTEWATER TREATMENT FACILITY 0.05 2,765,000$
CHIPPEWA FALLS WWTP 0.10 8,833,000$
CLARKS MILLS SANITARY DISTRICT 1.00 458,000$
CLEVELAND WASTEWATER TREATMENT FACILITY 0.50 515,000$
CLINTON WASTEWATER TREATMENT FACILITY 0.082 578,000$

COLBY CITY WWTF 0.05 1,687,000$
CONSOLIDATED KOSHKONONG SANITARY DIST WWTF 0.431 637,000$
CUBA CITY WASTEWATER TREATMENT FACILITY 0.05 1,553,000$
DARLINGTON WASTEWATER TREATMENT FACILITY 0.05 1,302,000$
DEERFIELD WASTEWATER TREATMENT FACILITY 0.075 1,937,000$
DELAFIELD HARTLAND POLLUTION CONTROL COMM 0.127 8,959,000$
DENMARK WASTEWATER TREATMENT FACILITY 0.05 1,583,000$
DICKEYVILLE WASTEWATER TREATMENT FACILITY 0.05 1,168,000$
DODGEVILLE WASTEWATER TREATMENT FACILITY 0.05 2,460,000$
DOUSMAN WASTEWATER TREATMENT FACILITY 0.127 1,394,000$
EAGLE LAKE SEWER UTILITY 0.05 1,385,000$
EAGLE RIVER CITY OF 1.0 No phosphorus removal updgrade is neces
EAST TROY WASTEWATER TREATMENT FACILITY 0.05 2,284,000$
EDGERTON WASTEWATER TREATMENT FACILITY 0.431 No phosphorus removal updgrade is neces
EGG HARBOR WASTEWATER TREATMENT FACILITY 0.50 No phosphorus removal updgrade is neces
EPHRAIM WASTEWATER TREATMENT FACILITY 0.50 No phosphorus removal updgrade is neces
FENNIMORE WASTEWATER TREATMENT FACILITY 0.05 2,021,000$
FENWOOD WASTEWATER TREATMENT FACILITY 1.0 527,000$
FISH CREEK SD1 WASTEWATER TREATMENT FACILITY 0.50 No phosphorus removal updgrade is neces
FONTANA WALWORTH WATER POLLUTION CONT. COMM 0.075 2,824,000$
FOOTVILLE WASTEWATER TREATMENT FACILITY 0.075 1,272,000$
FOREST JUNCTION SANITARY DISTRICT 0.075 4,024,000$
FORESTVILLE WASTEWATER TREATMENT FACILITY 1.00 398,000$
FORT ATKINSON WASTEWATER TREATMENT FACILITY 0.465 586,000$
FREDONIA MUNICIPAL SEWER AND WATER UTILITY 0.05 2,512,000$
GBMSD ‐ DE PERE 0.200 No phosphorus removal updgrade is neces
GENOA CITY VILLAGE 0.05 1,141,000$
GIBBSVILLE SANITARY DISTRICT 0.05 472,000$
GRAFTON VILLAGE WATER & WASTEWATER UTILITY 0.05 4,581,000$
GRAND CHUTE MENASHA WEST SEWERAGE COMMISSION 0.200 6,050,000$
GRATIOT WASTEWATER TREATMENT FACILITY 0.05 814,000$
GREEN BAY METROPOLITAN SEWERAGE DISTRICT 0.200 23,329,000$
HARTFORD WATER POLLUTION CONTROL FACILITY 0.075 2,834,000$
HAZEL GREEN WASTEWATER TREATMENT FACILITY 0.05 1,353,000$
HEART OF VALLEY MSD WW TRTMNT FAC 0.200 5,821,000$
HEWITT SANITARY DISTRICT WWTP 0.05 1,076,000$
HILBERT WASTEWATER TREATMENT FACILITY 0.05 1,234,000$
HOLLAND SD 1 WASTEWATER TREATMENT FACILITY 0.075 2,196,000$
HOLLANDALE WASTEWATER TREATMENT FACILITY 0.075 3,212,000$
HOWARDS GROVE WASTEWATER TRTMT FAC 0.05 660,000$
HUDSON WASTEWATER TREATMENT FACILITY 0.6 No phosphorus removal updgrade is neces
JACKSON (VILLAGE) WASTEWATER TREATMENT PLANT 0.05 1,977,000$
JAMESTOWN SANITARY DISTRICT NO 2 WWTF 0.05 721,000$
JAMESTOWN SANITARY DISTRICT NO 3 WWTF 1.00 573,000$
JANESVILLE WASTEWATER UTILITY 0.107 17,045,000$
JEFFERSON WASTEWATER TREATMENT FACILITY 0.10 4,588,000$
JUNCTION CITY WASTEWATER TREATMENT FACILITY 0.05 1,131,000$
KENOSHA WASTEWATER TREATMENT FACILITY 0.50 No phosphorus removal updgrade is neces
KEWASKUM VILLAGE 0.05 2,120,000$
KEWAUNEE WASTEWATER TREATMENT FACILITY 0.05 1,853,000$
KIEL WASTEWATER TREATMENT FACILITY 0.05 4,630,000$
KIELER SANITARY DISTRICT NO 1 WWTF 0.05 1,075,000$
KOSSUTH SANITARY DISTRICT NO. 2 WWTF 0.05 727,000$
LAKE TOMAHAWK TOWNSHIP SANITARY DISTRICT 1 0.05 800,000$
LAKELAND SANITARY DISTRICT 0.05 1,576,000$

LANCASTER WASTEWATER TREATMENT FACILITY 0.05 2,093,000$
LINDEN WASTEWATER TREATMENT FACILITY 0.05 855,000$
LIVINGSTON WASTEWATER TREATMENT FACILITY 0.05 1,509,000$
LYONS SANITARY DISTRICT NO 2 0.05 1,623,000$
MADISON METROPOLITAN SEWERAGE DISTRICT WWTF 0.075 68,607,000$
MANITOWOC WASTEWATER TREATMENT FACILITY 0.50 No phosphorus removal updgrade is neces
MARATHON WATER & SEWER DPT WW TREATMNT PLANT 0.05 1,289,000$
MARIBEL WASTEWATER TREATMENT FACILITY 0.05 1,248,000$
MARSHFIELD WASTEWATER TREATMENT FACILITY 0.05 6,342,000$
MAUSTON WASTEWATER TREATMENT FACILITY 1.0 No phosphorus removal updgrade is neces
MEDFORD CITY OF 0.10 1,758,000$
MENOMONIE WASTEWATER TREATMENT FACILITY 0.10 9,055,000$
MERRILL CITY OF 0.05 5,003,000$
MILAN S D WASTEWATER TREATMENT FACILITY 1.0 526,000$
MILLADORE WASTEWATER TREATMENT FACILITY 0.05 1,320,000$
MILTON WASTEWATER TREATMENT FACILITY 0.431 958,000$
MILWAUKEE METRO SEW DIST: JONES ISLAND 0.05 161,117,000$
MILWAUKEE METRO SEW DIST: SOUTH SHORE 0.05 No phosphorus removal updgrade is neces
MINERAL POINT WASTEWATER TREATMENT FACILITY 0.05 1,661,000$
MONROE WASTEWATER TREATMENT FACILITY 0.05 2,762,000$
MORRISON SANITARY DISTRICT NO 1 0.05 895,000$
MOSINEE WASTEWATER TREATMENT FACILITY 0.05 4,772,000$
MOUNT CALVARY WASTEWATER TREATMENT FACILITY 0.05 1,194,000$
MOUNT HOPE WASTEWATER TREATMENT FACILITY 0.05 966,000$
MOUNT HOREB WASTEWATER TREATMENT FACILITY 0.10 1,066,000$
MUKWONAGO WASTEWATER TREATMENT PLANT 0.05 3,639,000$
NEENAH MENASHA SEWER COMMISSION WWTF 0.200 8,155,000$
NEKOOSA WASTEWATER TREATMENT FACILITY 0.05 1,058,000$
NEW HOLSTEIN WASTEWATER TREATMENT FACILITY 0.05 2,750,000$
NEW RICHMOND WASTEWATER TREATMENT FACILITY 0.6 No phosphorus removal updgrade is neces
NEWBURG VILLAGE 0.05 1,165,000$
NORWAY TN SANITARY DISTRICT 1 WWTF 0.05 4,553,000$
O DELL BAY SANITARY DISTRICT 1 1.0 499,000$
ONION RIVER WASTEWATER COMMISSION 0.05 1,161,000$
OOSTBURG WASTEWATER TREATMENT PLANT 0.05 1,100,000$
ORCHARD MANOR WASTEWATER TREATMENT FACILITY 0.05 883,000$
OREGON WASTEWATER TREATMENT FACILITY 0.075 3,049,000$
PADDOCK LAKE WASTEWATER TRTMNT FAC 0.05 2,436,000$
PALMYRA WASTEWATER TREATMENT FACILITY 0.228 904,000$
PATCH GROVE WASTEWATER TREATMENT FACILITY 0.05 918,000$
PELL LAKE SANITARY DISTRICT NO. 1 0.05 1,539,000$
PEPIN WASTEWATER TREATMENT FACILITY 0.1 1,274,000$
PHELPS SANITARY DISTRICT #1 1.0 522,000$
PITTSVILLE WATER AND SEWER DEPT WWTF 1.0 545,000$
PLATTEVILLE WASTEWATER TREATMENT FACILITY 0.05 4,237,000$
PLOVER WASTEWATER TREATMENT FACILITY 0.05 2,907,000$
PLYMOUTH CITY UTIL COMMISSION WWTF 0.05 2,109,000$
PLYMOUTH TOWN SANITARY DISTRICT #1 WWTF 0.075 3,134,000$
PORT EDWARDS WASTEWATER TREATMENT FACILITY 0.05 1,825,000$
PORT WASHINGTON WWTP 0.50 No phosphorus removal updgrade is neces
POTOSI‐TENNYSON SEWAGE COMMISSION WWTF 0.05 1,611,000$
POTTER WASTEWATER TREATMENT FACILITY 0.05 813,000$
RACINE WASTEWATER UTILITY 0.50 No phosphorus removal updgrade is neces
RANDOM LAKE VILLAGE 0.05 727,000$
REEDSVILLE WASTEWATER TREATMENT FACILITY 0.05 1,612,000$

REWEY WASTEWATER TREATMENT FACILITY 0.05 787,000$
RHINELANDER CITY OF 0.05 4,734,000$
RIB LAKE VILLAGE OF 0.05 1,222,000$
RIB MOUNTAIN METRO SEWAGE DISTRICT WWTF 0.05 13,815,000$
RIDGEWAY WASTEWATER TREATMENT FACILITY 0.05 964,000$
ROCKDALE WASTEWATER TREATMENT FACILITY 0.075 720,000$
ROCKLAND SD1 WASTEWATER TREATMENT FACILITY 0.05 466,000$
RUDOLPH WASTEWATER TREATMENT FACILITY 1.0 508,000$
RUSSELL SANITARY DISTRICT #1 TOWN OF 0.05 936,000$
SALEM UTILITY DISTRICT 0.05 4,358,000$
SAUKVILLE VILLAGE SEWER UTILITY 0.05 2,769,000$
SEVASTOPOL SD NO 1 WWTF 0.05 513,000$
SHARON WASTEWATER TREATMENT FACILITY 0.075 992,000$
SHEBOYGAN WASTEWATER TREATMENT PLANT 0.50 No phosphorus removal updgrade is neces
SHERWOOD WASTEWATER TREATMENT FACILITY 0.05 1,068,000$
SHULLSBURG WASTEWATER TREATMENT FACILITY 0.05 1,690,000$
SILVER LAKE SANITARY DISTRICT 0.1 1,331,000$
SILVER LAKE VILLAGE 0.05 2,095,000$
SISTER BAY WASTEWATER TREATMENT FACILITY 0.50 No phosphorus removal updgrade is neces
SOUTH MILWAUKEE WASTEWATER TREAT FACILITY 0.50 No phosphorus removal updgrade is neces
SOUTH WAYNE WASTEWATER TREATMENT FACILITY 0.05 964,000$
SPENCER WASTEWATER TREATMENT FACILITY 0.05 1,438,000$
ST CLOUD VILLAGE UTILITY COMMISSION 1.0 476,000$
ST NAZIANZ WASTEWATER TREATMENT FACILITY 0.05 924,000$
STETSONVILLE, VILLAGE OF 0.05 1,112,000$
STEVENS POINT WASTEWATER TREATMENT FACILITY 0.05 6,572,000$
STITZER SANITARY DISTRICT WWTF 0.05 827,000$
STOUGHTON WASTEWATER TREATMENT FACILITY 0.075 4,977,000$
STRATFORD WASTEWATER TREATMENT FACILITY 0.05 2,517,000$
STURGEON BAY UTILITIES WWTF 0.50 No phosphorus removal updgrade is neces
SULLIVAN TWN SANITARY DISTRICT #1 WWTF 0.660 380,000$
SULLIVAN WASTEWATER TREATMENT FACILITY 0.075 932,000$
SUN PRAIRIE WASTEWATER TREATMENT FACILITY 0.075 3,991,000$
SUSSEX WASTEWATER TREATMENT FACILITY 0.05 3,086,000$
THREE LAKES SANITARY DISTRICT #1 0.05 880,000$
TOMAHAWK CITY OF 0.05 1,431,000$
TWIN LAKES WASTEWATER TREATMENT FAC 0.05 3,826,000$
TWO RIVERS WASTEWATER TREATMENT FACILITY 0.50 No phosphorus removal updgrade is neces
UNION GROVE VILLAGE 0.05 3,807,000$
UNITY WASTEWATER TREATMENT FACILITY 1.0 469,000$
VALDERS WASTEWATER TREATMENT FACILITY 0.05 1,382,000$
VESPER WASTEWATER TREATMENT FACILITY 1.0 512,000$
WALDO WASTEWATER UTILITY 0.05 1,279,000$
WALWORTH COUNTY METRO 0.075 5,072,000$
WARRENS 0.50 305,000$
WATERLOO WASTEWATER TREATMENT FACILITY 0.075 790,000$
WATERTOWN WASTEWATER TREATMENT FACILITY 0.10 4,931,000$
WAUKESHA CITY 0.05 6,974,000$
WAUPUN WASTEWATER TREATMENT FACILITY 0.05 4,592,000$
WAUSAU WATER WORKS WW TREATMENT FACILITY 0.05 5,427,000$
WEST BEND CITY 0.05 7,235,000$
WESTERN RACINE COUNTY SEWERAGE DISTRICT 0.05 6,400,000$
WHITELAW WASTEWATER TREATMENT FACILITY 0.05 1,115,000$
WHITEWATER WASTEWATER TREATMENT FACIL 0.204 465,000$
WHITING WASTEWATER TREATMENT FACILITY 0.05 1,033,000$

WI DELLS LK DELTON SEWERAGE COMMISSION WWTF 0.10 1,694,000$
WI DNR PENINSULA STATE PARK WWTF 0.05 874,000$
WI DNR RICHARD BONG RECREATION AREA 1.00 431,000$
WI DNR YELLOWSTONE LAKE STATE PARK WWTF 0.05 No phosphorus removal updgrade is neces
WI DOC LINCOLN HILLS SCHOOL 1.0 553,000$
WISCONSIN RAPIDS WWTF 0.05 4,714,000$
WRIGHTSTOWN SANITARY DISTRICT 1 0.075 1,003,000$
WRIGHTSTOWN SANITARY DISTRICT 2 0.075 2,559,000$
WRIGHTSTOWN SEWER & WATER UTILITY 0.382 No phosphorus removal updgrade is neces
YORKVILLE SEWER UTILITY DISTRICT NO 1 0.05 1,287,000$

APPENDIX BDATA GRAPHS
<0.1 mg/l Phosphorus Effluent Group

COST OF PHOSPHORUS REMOVAL AT WISCONSIN PUBLICALLY‐OWNED TREATMENT WORKS
DATA GRAPH B.1
EFFLUENT GROUP: <0.1 mg/l
CAPITAL COST VS. DESIGN INFLUENT FLOW RATE
y = 3E+06x0.3883
R² = 0.645
$100,000
$1,000,000
$10,000,000
$100,000,000
$1,000,000,000
0.01 0.10 1.00 10.00 100.00 1000.00
CAPITAL COSTS
DESIGN INFLUENT FLOW RATE(mgd)
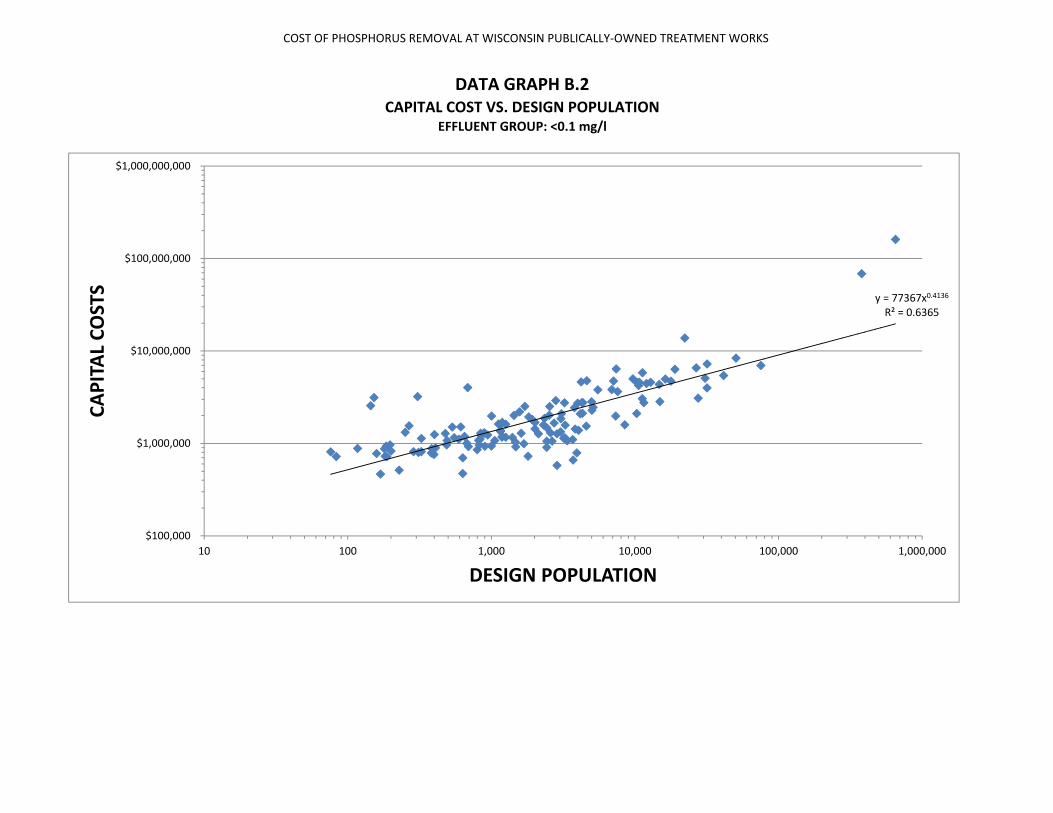
COST OF PHOSPHORUS REMOVAL AT WISCONSIN PUBLICALLY‐OWNED TREATMENT WORKS
DATA GRAPH B.2CAPITAL COST VS. DESIGN POPULATION
EFFLUENT GROUP: <0.1 mg/l
y = 77367x0.4136
R² = 0.6365
$100,000
$1,000,000
$10,000,000
$100,000,000
$1,000,000,000
10 100 1,000 10,000 100,000 1,000,000
CAPITAL COSTS
DESIGN POPULATION

COST OF PHOSPHORUS REMOVAL AT WISCONSIN PUBLICALLY‐OWNED TREATMENT WORKS
DATA GRAPH B.3PER CAPITA COST VS. DESIGN POPULATION
EFFLUENT GROUP: <0.1 mg/l
y = 77367x‐0.586
R² = 0.7787
$1
$10
$100
$1,000
$10,000
$100,000
10 100 1,000 10,000 100,000 1,000,000
PER
CAPITA COST
(Dollars/design
person)
DESIGN POPULATION
CHART 2PHOSPHORUS REMOVAL COSTS

COST OF PHOSPHORUS REMOVAL AT WISCONSIN PUBLICALLY‐OWNED TREATMENT WORKS
DATA GRAPH B.4UNIT PHOSPHORUS REMOVAL COST VS. DESIGN POPULATION
EFFLUENT GROUP: <0.1 mg/l
y = 6E+06x‐0.579
R² = 0.6575
$10,000
$100,000
$1,000,000
$10,000,000
10 100 1,000 10,000 100,000 1,000,000
UNIT REM
OVAL COST
(Dollars/Lb. Phosphorus Removed/day)
DESIGN POPULATION
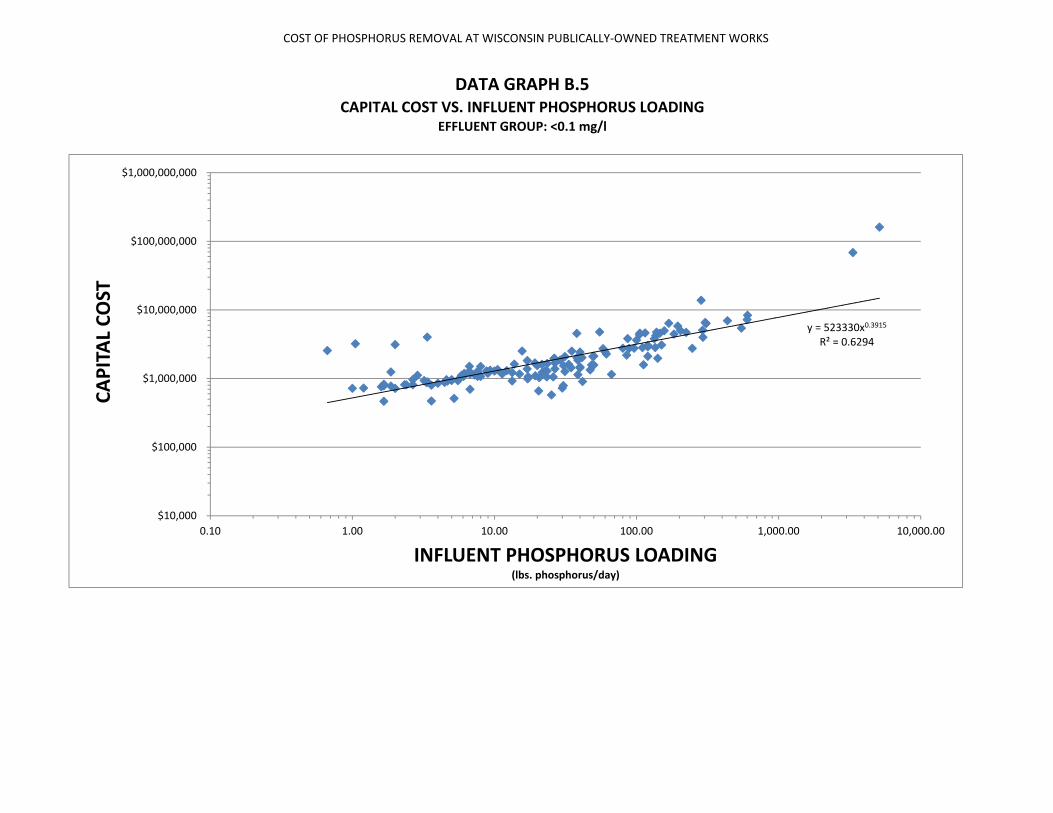
COST OF PHOSPHORUS REMOVAL AT WISCONSIN PUBLICALLY‐OWNED TREATMENT WORKS
DATA GRAPH B.5CAPITAL COST VS. INFLUENT PHOSPHORUS LOADING
EFFLUENT GROUP: <0.1 mg/l
y = 523330x0.3915
R² = 0.6294
$10,000
$100,000
$1,000,000
$10,000,000
$100,000,000
$1,000,000,000
0.10 1.00 10.00 100.00 1,000.00 10,000.00
CAPITAL COST
INFLUENT PHOSPHORUS LOADING(lbs. phosphorus/day)

COST OF PHOSPHORUS REMOVAL AT WISCONSIN PUBLICALLY‐OWNED TREATMENT WORKS
UNIT PHOSPHORUS REMOVAL COST VS. INFLUENT PHOSPHORUS LOADINGEFFLUENT GROUP: <0.1 mg/l
DATA GRAPH B.6
y = 530808x‐0.61
R² = 0.8052
$10,000
$100,000
$1,000,000
$10,000,000
0.10 1.00 10.00 100.00 1,000.00 10,000.00
UNIT REM
OVAL COST
(Dollars/Lb. Phosphorus Removed/D
ay)
INFLUENT PHOSPHORUS LOADING(lb.phosphorus/day)

APPENDIX CDATA GRAPHS
0.1 to <0.5 mg/l Phosphorus Effluent Group
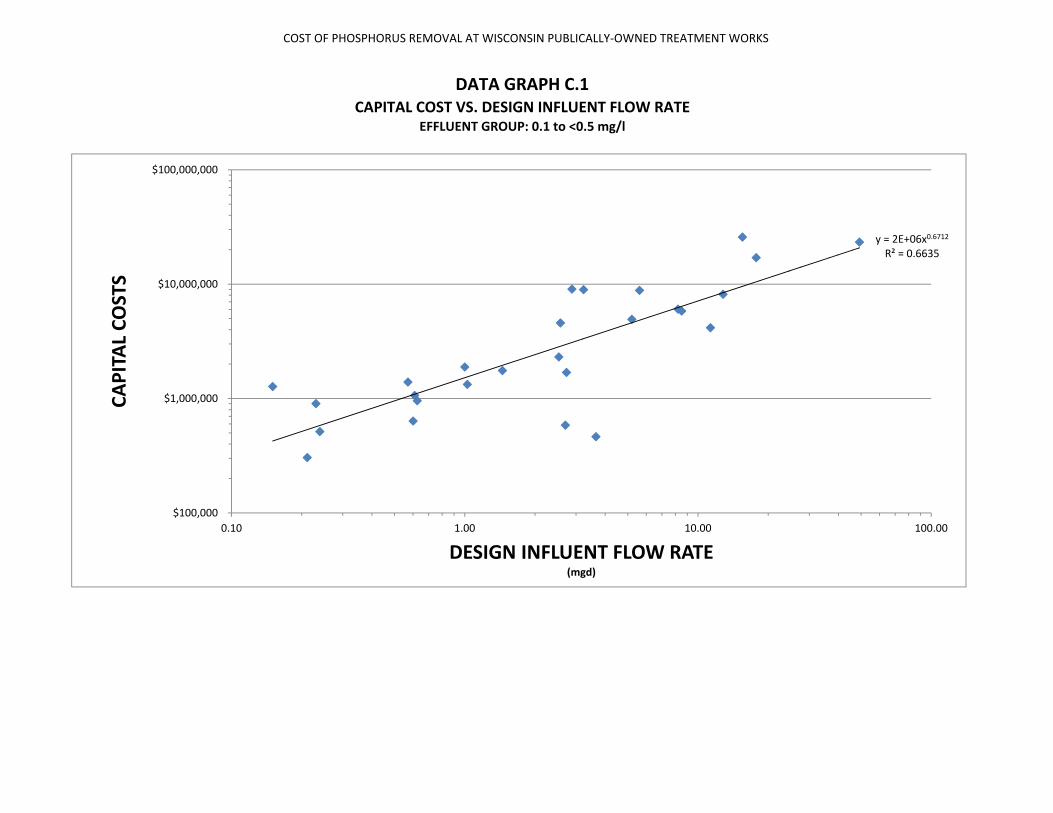
COST OF PHOSPHORUS REMOVAL AT WISCONSIN PUBLICALLY‐OWNED TREATMENT WORKS
EFFLUENT GROUP: 0.1 to <0.5 mg/l
DATA GRAPH C.1CAPITAL COST VS. DESIGN INFLUENT FLOW RATE
y = 2E+06x0.6712
R² = 0.6635
$100,000
$1,000,000
$10,000,000
$100,000,000
0.10 1.00 10.00 100.00
CAPITAL COSTS
DESIGN INFLUENT FLOW RATE(mgd)

COST OF PHOSPHORUS REMOVAL AT WISCONSIN PUBLICALLY‐OWNED TREATMENT WORKS
EFFLUENT GROUP: 0.1 to <0.5 mg/l
DATA GRAPH C.2CAPITAL COST VS. DESIGN POPULATION
y = 5045.7x0.6792
R² = 0.6578
$100,000
$1,000,000
$10,000,000
$100,000,000
100 1,000 10,000 100,000 1,000,000
CAPITAL COSTS
DESIGN POPULATION

COST OF PHOSPHORUS REMOVAL AT WISCONSIN PUBLICALLY‐OWNED TREATMENT WORKS
EFFLUENT GROUP: 0.1 to <0.5 mg/l
DATA GRAPH C.3PER CAPITA COST VS. DESIGN POPULATION
y = 5045.7x‐0.321
R² = 0.3002
$1
$10
$100
$1,000
$10,000
100 1,000 10,000 100,000 1,000,000
PER
CAPITA COST
(Dollars/design
person)
DESIGN POPULATION
CHART 2PHOSPHORUS REMOVAL COSTS
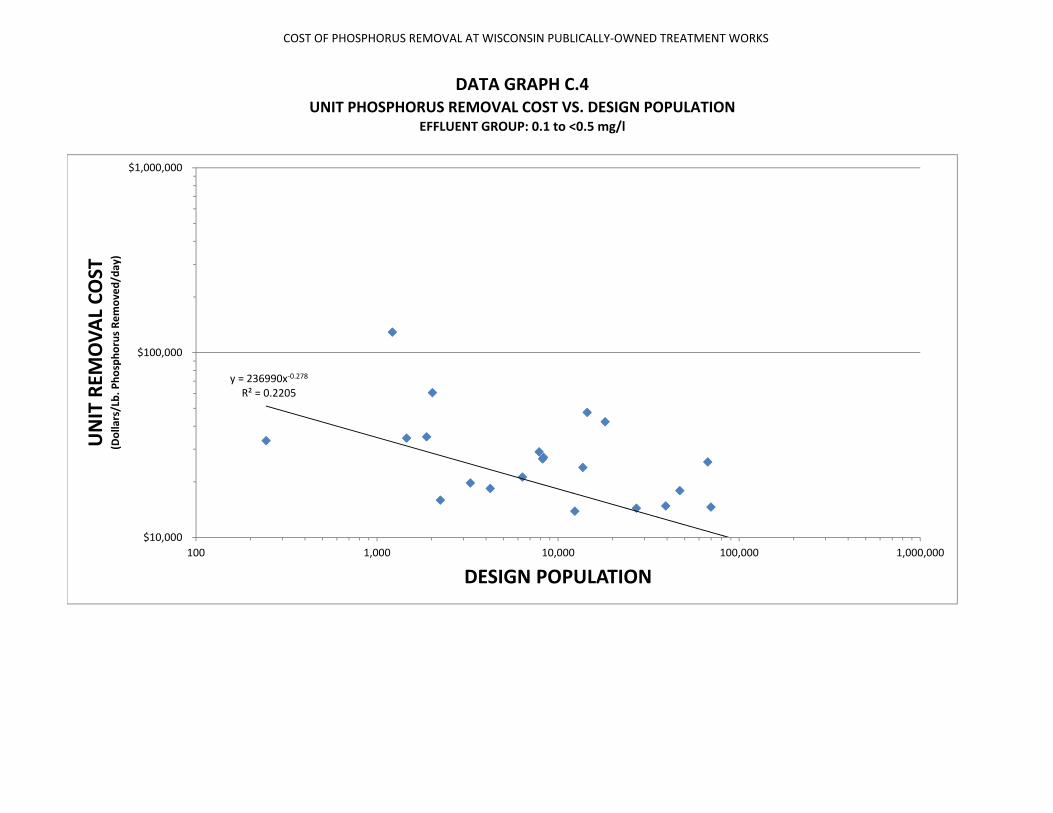
COST OF PHOSPHORUS REMOVAL AT WISCONSIN PUBLICALLY‐OWNED TREATMENT WORKS
DATA GRAPH C.4UNIT PHOSPHORUS REMOVAL COST VS. DESIGN POPULATION
EFFLUENT GROUP: 0.1 to <0.5 mg/l
y = 236990x‐0.278
R² = 0.2205
$10,000
$100,000
$1,000,000
100 1,000 10,000 100,000 1,000,000
UNIT REM
OVAL COST
(Dollars/Lb. Phosphorus Removed/day)
DESIGN POPULATION

COST OF PHOSPHORUS REMOVAL AT WISCONSIN PUBLICALLY‐OWNED TREATMENT WORKS
CAPITAL COST VS. INFLUENT PHOSPHORUS LOADINGEFFLUENT GROUP: 0.1 to <0.5 mg/l
DATA GRAPH C.5
y = 92802x0.6697
R² = 0.6583
$10,000
$100,000
$1,000,000
$10,000,000
$100,000,000
1.00 10.00 100.00 1,000.00 10,000.00
CAPITAL COST
INFLUENT PHOSPHORUS LOADING(lbs. phosphorus/day)

COST OF PHOSPHORUS REMOVAL AT WISCONSIN PUBLICALLY‐OWNED TREATMENT WORKS
UNIT PHOSPHORUS REMOVAL COST VS. INFLUENT PHOSPHORUS LOADINGEFFLUENT GROUP: 0.1 to <0.5 mg/l
DATA GRAPH C.6
y = 96863x‐0.334
R² = 0.3274
$10,000
$100,000
$1,000,000
1.00 10.00 100.00 1,000.00 10,000.00
UNIT REM
OVAL COST
(Dollars/Lb. Phosphorus Removed/D
ay)
INFLUENT PHOSPHORUS LOADING(lb.phosphorus/day)

APPENDIX DDATA GRAPHS
0.5 to <1.0 mg/l Phosphorus Effluent Group

COST OF PHOSPHORUS REMOVAL AT WISCONSIN PUBLICALLY‐OWNED TREATMENT WORKS
EFFLUENT GROUP: 0.5 TO <1.0 mg/l
DATA GRAPH D.1CAPITAL COST VS. DESIGN INFLUENT FLOW RATE
y = 459522x‐0.015
R² = 0.0023
$100,000
$1,000,000
0.01 0.10 1.00
CAPITAL COSTS
DESIGN INFLUENT FLOW RATE(mgd)

COST OF PHOSPHORUS REMOVAL AT WISCONSIN PUBLICALLY‐OWNED TREATMENT WORKS
EFFLUENT GROUP: 0.5 TO <1.0 mg/l
DATA GRAPH D.2CAPITAL COST VS. DESIGN POPULATION
y = 621673x‐0.045
R² = 0.0239
$100,000
$1,000,000
10 100 1,000 10,000
CAPITAL COSTS
DESIGN POPULATION

COST OF PHOSPHORUS REMOVAL AT WISCONSIN PUBLICALLY‐OWNED TREATMENT WORKS
EFFLUENT GROUP: 0.5 TO <1.0 mg/l
DATA GRAPH D.3PER CAPITA COST VS. DESIGN POPULATION
y = 621673x‐1.045
R² = 0.9295
$1
$10
$100
$1,000
$10,000
$100,000
10 100 1,000 10,000
PER
CAPITA COST
(Dollars/design
person)
DESIGN POPULATION
CHART 2PHOSPHORUS REMOVAL COSTS

COST OF PHOSPHORUS REMOVAL AT WISCONSIN PUBLICALLY‐OWNED TREATMENT WORKS
DATA GRAPH D.4UNIT PHOSPHORUS REMOVAL COST VS. DESIGN POPULATION
EFFLUENT GROUP: 0.5 TO <1.0 mg/l
y = 4E+06x‐0.596
R² = 0.3363
$10,000
$100,000
$1,000,000
10 100 1,000 10,000
UNIT REM
OVAL COST
(Dollars/Lb. Phosphorus Removed/day)
DESIGN POPULATION

COST OF PHOSPHORUS REMOVAL AT WISCONSIN PUBLICALLY‐OWNED TREATMENT WORKS
CAPITAL COST VS. INFLUENT PHOSPHORUS LOADINGEFFLUENT GROUP: 0.5 TO <1.0 mg/l
DATA GRAPH D.5
y = 514049x‐0.045
R² = 0.021
$100,000
$1,000,000
0.10 1.00 10.00 100.00
CAPITAL COST
INFLUENT PHOSPHORUS LOADING(lbs. phosphorus/day)

COST OF PHOSPHORUS REMOVAL AT WISCONSIN PUBLICALLY‐OWNED TREATMENT WORKS
UNIT PHOSPHORUS REMOVAL COST VS. INFLUENT PHOSPHORUS LOADINGEFFLUENT GROUP: 0.5 TO <1.0 mg/l
DATA GRAPH D.6
y = 591845x‐1.057
R² = 0.9154
$10,000
$100,000
$1,000,000
0.10 1.00 10.00 100.00
UNIT REM
OVAL COST
(Dollars/Lb. Phosphorus Removed/D
ay)
INFLUENT PHOSPHORUS LOADING(lb.phosphorus/day)

APPENDIX EDATA STATISTICS

DATA STATISTICS
DATA STATISTICSEFFLUENT GROUP
< 0.1 mg/l 0.1 to < 0.5 mg/l 0.5 to < 1.0 mg/l
Population
Minimum 76 1,214 39
Maximum 562,080 195,360 1,551
Median 1,524 13,690 358
Mean 12,362 26,511 505
Design Influent Flow(mgd)
Minimum .010 0.150 0.011
Maximum 123.000 49.200 0.240
Median .313 2.730 0.094
Mean 2.267 6.424 0.105
Design PhosphorusRemoved(lbs/day)
Minimum 0.66 9.87 0.64
Maximum 5,069.29 3,195.19 15.29
Median 20.09 190.63 5.57
Mean 121.49 407.76 6.28
Capital Cost
Minimum $466,000 $465,000 $164,000
Maximum $161,117,000 $25,809,000 $580,000
Median $1,311,500 $2,311,000 $513,000
Mean $3,751,260 $5,720,200 $484,000