cost of congestion to the trucking industry -...
TRANSCRIPT

April 2016
Cost of Congestion to the Trucking Industry

Estimating the Cost of Congestion to the Trucking Industry
April 2016
W. Ford Torrey, IV Research Associate
American Transportation Research Institute Atlanta, GA
950 N. Glebe Road, Suite 210 Arlington, Virginia 22203
www.atri-online.org

ATRI BOARD OF DIRECTORS
Ms. Judy McReynolds Chairman of the ATRI Board President & CEO ArcBest Corporation Fort Smith, AR Mr. Michael S. Card President Combined Transport, Inc. Central Point, OR Mr. Michael L. Ducker President & CEO FedEx Freight Memphis, TN Mr. Rich Freeland President & COO Cummins Inc. Columbus, IN Mr. Hugh H. Fugleberg President & COO Great West Casualty Company South Sioux City, NE Mr. Jack Holmes President UPS Freight Richmond, VA Mr. Dave Huneryager President & CEO Tennessee Trucking Association Nashville, TN Mr. Derek Leathers President and COO Werner Enterprises Omaha, NE
Mr. Chris Lofgren President & CEO Schneider National, Inc. Green Bay, WI Mr. Jeffrey J. McCaig President & CEO Trimac Transportation, Inc. Houston, TX Mr. Gregory L. Owen Head Coach & CEO Ability/ Tri-Modal Transportation Services Carson, CA Ms. Annette Sandberg President & CEO Transsafe Consulting, LLC Davenport, WA Mr. Steve Williams Chairman & CEO Maverick USA, Inc. Little Rock, AR Ms. Rebecca M. Brewster President & COO American Transportation Research Institute Atlanta, GA Hon. Bill Graves President & CEO American Trucking Associations Arlington, VA

ATRI RESEARCH ADVISORY COMMITTEE
Mr. Steve L. Niswander RAC Chairman VP, Safety Policy & Regulatory Relations Groendyke Transport, Inc.
Mr. Doug Bennett Director, Operations & Business Development U.S. AutoLogistics, L.L.C.
Ms. Amy Boerger Vice President – North American Engine Business Cummins Inc.
Mr. Andrew Boyle Executive VP & CFO Boyle Transportation
Mr. Randy Boyles Senior Vice President, Tailored Solutions PeopleNet
Ms. Cheryl Bynum Manager, SmartWay Transport Partnership U.S. Environmental Protection Agency
Mr. Louis Campion President Maryland Motor Truck Association, Inc.
Mr. Michael Conyngham Director of Research International Brotherhood of Teamsters
Mr. Bob Costello Chief Economist and Senior VP American Trucking Associations
Mr. Tom Cuthbertson Omnitracs, LLC Vice President, Regulatory Compliance Mr. Dennis Dellinger President Cargo Transporters
Mr. Duke Drinkard Energy Manager Southeastern Freight Lines
Mr. Chip Duden Vice President, Strategic Business Analytics Werner Enterprises
Mr. Chad England Chief Executive Officer C.R. England
Mr. Paul J. Enos Chief Executive Officer Nevada Trucking Association
Ms. Sherri Garner Brumbaugh President/CEO Garner Transportation Group
Dr. David W. Guess Executive Vice President, Safety and Regulatory Affairs Usher Transport, Inc.
Mr. Sanford Hodes Senior Vice President and Deputy General Counsel Ryder System, Inc.
Mr. Kevin X. Jones Vice President, Inbound Transportation Wal-Mart Stores, Inc.
Mr. Shannon Lively Vice President – Planning and Engineering ABF Freight System, Inc.
Ms. Michelle D. Livingstone Vice President – Transportation The Home Depot
Mr. Vladimir Livshits, Ph.D. System Analysis Program Manager Maricopa Association of Governments
Mr. Chris McLoughlin Cargo Risk Manager C.H. Robinson
Mr. Scott Mugno Vice President, Safety and Maintenance FedEx Ground
Ms. Brenda Neville President Iowa Motor Truck Association
Mr. Dean Newell Vice President, Safety Maverick USA, Inc.
Maj. David L. Palmer Major, Texas Hwy Patrol Division Texas Dept. of Public Safety
Mr. Jonathan R. Peters, PhD Professor of Finance, Department of Business College of Staten Island – The City University of New York Ms. Karen Rasmussen President and CEO HELP Inc. Ms. Barbara Robinson Director American Truck Dealers (ATD) McLean, VA Mr. Wellington F. Roemer, III President and CEO Wellington F. Roemer Insurance, Inc. Mr. Steve Rogers
Vice President, Truckload Operations J.B. Hunt Transport, Inc. Mr. Brett A. Sant VP, Safety and Risk Management Knight Transportation, Inc. Ms. Andrea Sequin Directory, Regulatory Services Schneider National, Inc. Mr. Brandon Shafer Director of Health and Safety UPS Freight Mr. Keith Tuttle Founder Motor Carrier Service Inc. Mr. Ronald Uriah Vice President, Safety Pitt-Ohio, LLC Mr. Tom Weakley Director of Operations Owner-Operator Independent Drivers Association Foundation
Mr. Rusty Weiss Director, External Research DriveCam-Lytx Mr. Geoffrey Wood VP, Operations & Safety Canadian Trucking Alliance

1 Estimating the Cost of Congestion to the Trucking Industry – 2016
TABLE OF CONTENTS INTRODUCTION ............................................................................................................. 2
METHODOLOGY ............................................................................................................ 3
Roadway Network ............................................................................................... 3
Marginal Truck Travel Time Delay ..................................................................... 6
Estimating Truck Volumes................................................................................. 9
Calculating Total Delay and Cost .................................................................... 13
RESULTS ..................................................................................................................... 14
National Highway System (NHS) Analysis ..................................................... 14
Local Roads Analysis ...................................................................................... 26
CONCLUSION .............................................................................................................. 28
APPENDIX A ................................................................................................................ 29
FIGURES AND TABLES Figure 1: United States NPMRDS Roadway Network ................................................. 4
Table 1: NHS Roadway Network Statistics ................................................................. 5
Table 2: Local Roadway Network Statistics ................................................................ 5
Figure 2: Example Segment - Establishing Congested Conditions .......................... 8
Figure 3: Example Segment - Establishing Marginal Delay Values .......................... 9
Figure 4: Example Segment - Hourly Truck Distribution ......................................... 12
Figure 5: Average Cost per Truck Based on Miles Driven ....................................... 15
Figure 6: Cost of Congestion by Month of the Year ................................................. 16
Figure 7: Cost and Mileage by Segment Network Intensity ..................................... 17
Figure 8: Cost of Congestion on a Per Mile Basis.................................................... 18
Table 3: Top Ten States by Total Cost of Congestion ............................................. 19
Figure 9: State Share of Total Cost of Congestion ................................................... 20
Table 4: Top Ten States Based on Cost per NHS Segment Mile ............................. 21
Table 5: Top Ten Metropolitan Areas by Total Cost of Congestion ........................ 22
Table 6: Top Ten Metropolitan Areas Based on Cost per NHS Segment Mile ....... 22
Figure 10: Metropolitan Area Cost of Congestion on a per-Mile Basis .................. 23
Table 7: Top Ten Counties by Total Cost of Congestion ......................................... 24
Table 8: Top Ten Counties Based on Cost per NHS Segment Mile ........................ 25
Figure 11: County Cost of Congestion on a Per Mile Basis .................................... 26
Table 9: Sample Cost of Congestion Database Information ................................... 28

Estimating the Cost of Congestion to the Trucking Industry – 2016 2
INTRODUCTION
Trucks transported nearly 10 billion tons of freight representing over two-thirds (68.8
percent) of total domestic tonnage shipped1, and traveled more than 279 billion miles on
the nation’s roadway network in 2014.2 Due to the critical role of safe and reliable truck
movements in sustainable economic growth, it is essential to continually monitor and
evaluate the efficiency of the national roadway system. A key impediment to nimble
supply chains is the level of traffic congestion experienced on U.S. roadways, and the
subsequent costs that are incurred due to this congestion.
In 2014 the American Transportation Research Institute (ATRI) conducted research
quantifying the amount of delay experienced by the trucking industry on the U.S.
Interstate Highway System (IHS) in 2012 and 2013.3 In an effort to continually monitor
and quantify congestion, ATRI has now implemented a number of standardization
procedures to enable the comparison of these figures on a year-over-year basis
including:
Utilizing publicly available highway usage figures for the year studied;
Utilizing the national trucking industry cost of operation figure specific to the year
studied;
Establishing a standardized methodology for quantifying the amount of delay;
and
Establishing a standardized methodology for estimating truck volumes.
Incorporating these new procedures will allow this 2014 report to become a benchmark
of comparison for future study years, as well as allow future year-over-year
comparisons. Additionally, the ever-growing nature of ATRI’s truck Global Positioning
System (GPS) and truck financial data allows the research team to expand the analysis
beyond the IHS. While the National Highway System (NHS) is the primary focus of the
analysis as its usage is more consistent, a high-level analysis of local road congestion
was also conducted and is described later in this report. Finally, it is important to note
that due to the changes utilized in standardizing the methodology for future studies, the
figures presented in this report are not directly comparable to those of the previous Cost
of Congestion study.
1 American Trucking Trends 2015. American Trucking Associations. Arlington, Virginia. 2 Table VM-1: Annual Vehicle Distance Traveled in Miles and Related Data by Highway Category and Vehicle Type – 2014. Highway Statistics Series 2014. U.S. Department of Transportation, Federal Highway Administration, Office of Highway Policy Information. December 2015. Available online: https://www.fhwa.dot.gov/policyinformation/statistics/2014/vm1.cfm 3 Pierce, Dave and Dan Murray. Cost of Congestion to the Trucking Industry. American Transportation Research Institute. Arlington, Virginia. April 2014.

3 Estimating the Cost of Congestion to the Trucking Industry – 2016
METHODOLOGY
Four data sources were used in this analysis to quantify the impact of traffic congestion
on the trucking industry:
(1) Commercial truck travel times from the Federal Highway Administration (FHWA)
National Performance Management Research Data Set (NPMRDS);
(2) Commercial truck volumes from FHWA’s Freight Analysis Framework (FAF);
(3) Commercial truck GPS data from ATRI’s Freight Performance Measures (FPM)
database; and
(4) Industry financial data from ATRI’s annual An Analysis of the Operational Costs
of Trucking publication.
Roadway Network
The NPMRDS network, published as a shape file in each monthly iteration of the
NPMRDS, was utilized as the foundational network in this analysis. The network is
made up of over 308,000 bi-directional roadway segments, the bulk of which are located
in the U.S. (with some segments falling in Canada, Mexico, and Puerto Rico). Each
roadway segment is identified by a unique traffic management channel (TMC) code,
and each TMC contains information on various jurisdiction levels (country, state,
county), the length in miles of the segment, the road name, the road direction, the route
type, and the latitude and longitude of the center of the segment.
The first step in defining the roadway network was to extract only those TMCs
corresponding to roads located within the 48 contiguous states as well as Alaska and
Hawaii. This resulted in the network depicted in Figure 1.

Estimating the Cost of Congestion to the Trucking Industry – 2016 4
Figure 1: United States NPMRDS Roadway Network
Next, using a combination of the route type indicator and the road name, the NHS was
defined and extracted from the full U.S. network for use in this analysis. This network
consists of numbered interstate, federal, state, and county highways. Detailed in Table
1, this generated just under 182,000 roadway segments, totaling over 444,000 bi-
directional miles.

5 Estimating the Cost of Congestion to the Trucking Industry – 2016
Table 1: NHS Roadway Network Statistics
NHS Road Network Profile
Total Segment Miles 444,343
Total Network Length (miles)4 222,171
Total Number of Segments 181,909
Longest segment (miles) 86.1
Shortest segment (miles) 0.002
Average segment (miles) 2.4
Median segment (miles) 1.4
As noted, local roads were also examined in this analysis. These are roads with
conventional street names and are predominantly found in urban areas. Highlighted in
Table 2, this network accounted for approximately 80,000 additional segments and
approximately 57,000 additional bi-directional miles.
Table 2: Local Roadway Network Statistics
Local Road Network Profile
Total Segment Miles 56,934
Total Roadway Length (miles) 28,467
Total Number of Segments 78,990
Longest segment (miles) 37.0
Shortest segment (miles) 0.003
Average segment (miles) 0.721
Median segment (miles) 0.518
Finally, the entirety of the network was spatially joined using ArcGIS software to reflect
a variety of features including metropolitan area5, county, and time zone for use in
subsequent steps in this analysis.
4 Total network length in miles is estimated by dividing the total segment miles figure in half. 5 Core Based Statistical Areas (CBSAs). United States Department of Commerce, United States Census Bureau. Available online: https://www.census.gov/geo/maps-data/data/cbf/cbf_msa.html. For the purposes of this report micropolitan areas are referred to as metropolitan.

Estimating the Cost of Congestion to the Trucking Industry – 2016 6
Marginal Truck Travel Time Delay
Truck Speeds
New iterations of the NPMRDS are published each month and contain travel times in
seconds for both passenger and commercial vehicles for each TMC across 288 five-
minute epochs which correspond to a certain time of day on a particular day of the
month. For example the average travel time for the 12:00-12:05 AM period corresponds
to epoch 0. For the purposes of this analysis, the truck travel times were extracted from
the full data set.
Next, weekdays were extracted from the truck travel time dataset as the majority of
truck traffic occurs during the week, and therefore are the days most impacted by
congestion. Due to the nature of the NPMRDS, the five-minute travel times were
aggregated into one-hour time periods yielding 24 average travel times in seconds for
each roadway segment. The intent of this task is to reduce the impact of outliers and
missing data. These average travel times were then converted from seconds to hours,
and subsequently converted to speeds in miles-per-hour (MPH) using the distance
corresponding to each TMC as follows:
𝑡𝑟𝑎𝑣𝑇𝑖𝑚𝑒̅̅ ̅̅ ̅̅ ̅̅ ̅̅ ̅̅ ̅𝑡,ℎ,𝑚 =
1𝑛 ∗ ∑ 𝑡𝑟𝑎𝑣𝑇𝑖𝑚𝑒𝑡,𝑖,𝑚
𝑛𝑖=0
3600
𝑠𝑝𝑒𝑒𝑑̅̅ ̅̅ ̅̅ ̅̅𝑡,ℎ,𝑚 =
𝑑𝑖𝑠𝑡𝑎𝑛𝑐𝑒𝑡
𝑡𝑟𝑎𝑣𝑇𝑖𝑚𝑒̅̅ ̅̅ ̅̅ ̅̅ ̅̅ ̅̅ ̅𝑡,ℎ,𝑚
Where:
𝑡 is TMC;
ℎ is hour of the day;
𝑚 is month of the year;
𝑖 is epoch;
𝑛 is the number of observations in an hour bin;
𝑡𝑟𝑎𝑣𝑇𝑖𝑚𝑒̅̅ ̅̅ ̅̅ ̅̅ ̅̅ ̅̅ ̅𝑡,ℎ,𝑚 is the calculated mean travel time in hours on TMC 𝑡 in hour bin ℎ
for month 𝑚;
𝑡𝑟𝑎𝑣𝑇𝑖𝑚𝑒𝑡,𝑖,𝑚 is the travel time for TMC 𝑡 in epoch 𝑖 for month 𝑚;
𝑠𝑝𝑒𝑒𝑑̅̅ ̅̅ ̅̅ ̅̅𝑡,ℎ,𝑚 is the calculated mean speed in MPH on TMC 𝑡 in hour bin ℎ for
month 𝑚; and
𝑑𝑖𝑠𝑡𝑎𝑛𝑐𝑒𝑡 is the distance of TMC 𝑡 in miles.
Free-flow Speed
To facilitate the congestion level calculation, a free-flow speed was established for each
roadway segment. While the posted speed limit of a particular segment can be used as
7 Estimating the Cost of Congestion to the Trucking Industry – 2016
free-flow speed, issues can arise with varying degrees of speed limit enforcement and
truck speed governor usage. As such, the empirical speeds found by the above
process were used in the establishment of a free-flow speed for each segment.
First, a maximum speed of 80 MPH was set to further reduce the impact of outlier
speeds. The fastest hourly speed was then found for each segment of each month
resulting in 12 fastest speeds for each segment. Finally, the median of these 12 fastest
speeds was set as the free-flow speed for the segment:
𝑓𝑟𝑒𝑒𝑓𝑙𝑜𝑤𝑡 = max 𝑠𝑝𝑒𝑒𝑑𝑡,𝑚̅̅ ̅̅ ̅̅ ̅̅ ̅̅ ̅̅̃
Where:
𝑓𝑟𝑒𝑒𝑓𝑙𝑜𝑤𝑡 is the calculated free flow speed for TMC 𝑡; and
max 𝑠𝑝𝑒𝑒𝑑𝑡,𝑚̅̅ ̅̅ ̅̅ ̅̅ ̅̅ ̅̅̃ is the median of the maximum average speeds for TMC 𝑡 in month
𝑚.
Congestion Threshold
Shown in Figure 2 below, a congestion threshold was calculated to flag instances of
congestion. The congestion threshold was set at 90 percent of the identified free-flow
speed as the trucking industry is generally flexible enough to adjust to minor congestion
in daily operations. By using a more conservative threshold in calculating marginal
delay, the results of the analysis provide a more accurate assessment of congestion
that is having a noticeable impact on industry operations:
𝑡ℎ𝑟𝑒𝑠ℎ𝑡 = 𝑓𝑟𝑒𝑒𝑓𝑙𝑜𝑤𝑡 ∗ .90
Where:
𝑡ℎ𝑟𝑒𝑠ℎ𝑡 is the calculated congestion threshold for TMC 𝑡 in MPH.

Estimating the Cost of Congestion to the Trucking Industry – 2016 8
Figure 2: Example Segment - Establishing Congested Conditions
Travel Time Delay
To quantify travel time delay, the observed speeds and congestion threshold speeds
were first converted back to travel times in hours:
𝑡𝑟𝑎𝑣𝑇𝑖𝑚𝑒̅̅ ̅̅ ̅̅ ̅̅ ̅̅ ̅̅ ̅𝑡,ℎ,𝑚 =
𝑑𝑖𝑠𝑡𝑎𝑛𝑐𝑒𝑡
𝑠𝑝𝑒𝑒𝑑𝑡,ℎ,𝑚̅̅ ̅̅ ̅̅ ̅̅ ̅̅ ̅̅ ̅
𝑡ℎ𝑟𝑒𝑠ℎ𝑡′ =
𝑑𝑖𝑠𝑡𝑎𝑛𝑐𝑒𝑡
𝑡ℎ𝑟𝑒𝑠ℎ𝑡
Where:
𝑡ℎ𝑟𝑒𝑠ℎ𝑡′ is the calculated congestion threshold travel time for TMC 𝑡 in hours.
The observed travel times were then compared to the congestion threshold to identify
when congestion was present. In instances where congestion was present, the actual
travel time was subtracted from the congestion threshold travel time to establish a
marginal delay value (Figure 3):
𝑐𝑜𝑛𝑔𝑡,ℎ,𝑚 = 𝑡𝑟𝑎𝑣𝑇𝑖𝑚𝑒𝑡,ℎ,𝑚̅̅ ̅̅ ̅̅ ̅̅ ̅̅ ̅̅ ̅̅ ̅̅ ̅̅ − 𝑡ℎ𝑟𝑒𝑠ℎ𝑡
′ ↔ 𝑡𝑟𝑎𝑣𝑇𝑖𝑚𝑒𝑡,ℎ,𝑚̅̅ ̅̅ ̅̅ ̅̅ ̅̅ ̅̅ ̅̅ ̅̅ ̅̅ > 𝑡ℎ𝑟𝑒𝑠ℎ𝑡
′
0
10
20
30
40
50
60
Ave
rage
Sp
eed
(M
PH
)
Freeflow Speed (60 MPH)
Congestion Threshold (54 MPH)
NormalConditions
CongestedConditions
9 Estimating the Cost of Congestion to the Trucking Industry – 2016
Where:
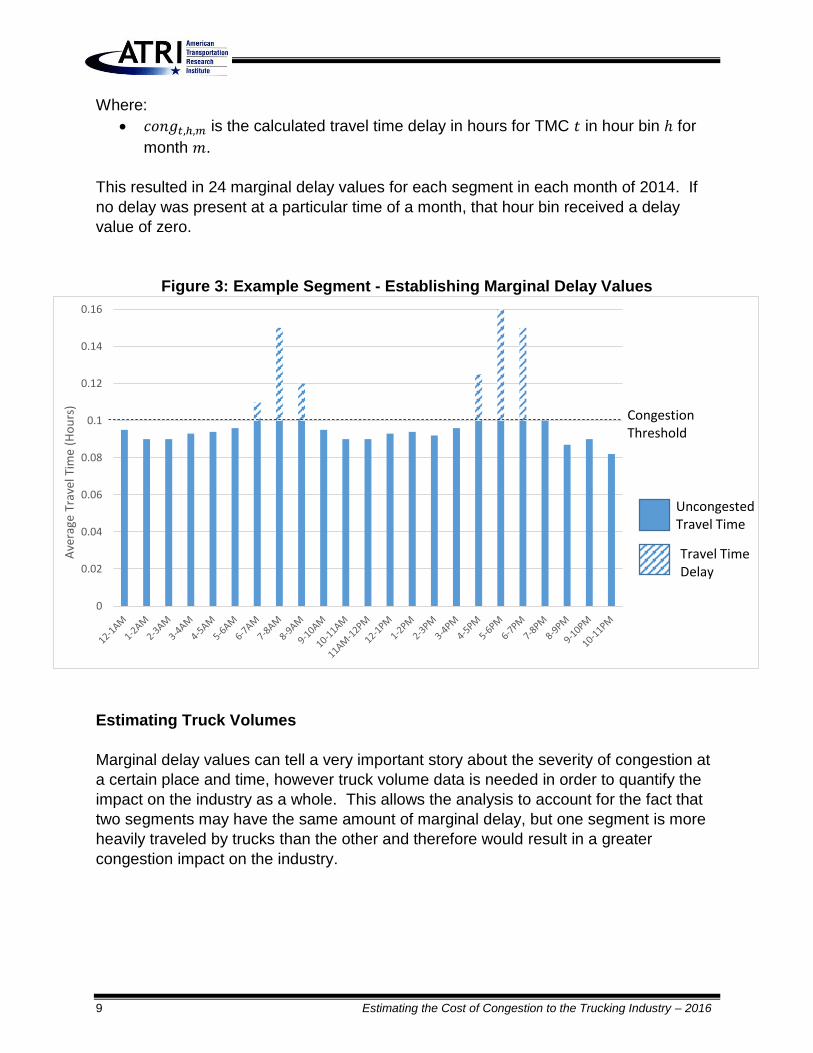
𝑐𝑜𝑛𝑔𝑡,ℎ,𝑚 is the calculated travel time delay in hours for TMC 𝑡 in hour bin ℎ for
month 𝑚.
This resulted in 24 marginal delay values for each segment in each month of 2014. If
no delay was present at a particular time of a month, that hour bin received a delay
value of zero.
Figure 3: Example Segment - Establishing Marginal Delay Values
Estimating Truck Volumes
Marginal delay values can tell a very important story about the severity of congestion at
a certain place and time, however truck volume data is needed in order to quantify the
impact on the industry as a whole. This allows the analysis to account for the fact that
two segments may have the same amount of marginal delay, but one segment is more
heavily traveled by trucks than the other and therefore would result in a greater
congestion impact on the industry.
0
0.02
0.04
0.06
0.08
0.1
0.12
0.14
0.16
Ave
rage
Tra
vel T
ime
(Ho
urs
)
CongestionThreshold
UncongestedTravel Time
Travel Time Delay

Estimating the Cost of Congestion to the Trucking Industry – 2016 10
Linking the FAF and NPMRDS Networks
One of the most commonly used government sources of truck volume estimates is
contained in FHWA’s FAF network shape file. The FAF data provides volume
estimates, or average annual daily truck traffic (AADTT), for large trucks with a gross
vehicle weight rating greater than 10,000 pounds on approximately 204,000 U.S.
roadway segments. However, due to FAF roadway segments differing in many ways
from those found in the NPMRDS, it was necessary to spatially join the two networks.
This resulted in each NPMRDS roadway segment with a TMC code receiving an
AADTT value from the FAF network.
Adjusting FAF Volume Estimates
Due to the nature of the FAF volume estimates associated with the NPMRDS network
through this research process, a number of adjustments were needed to produce
accurate hourly volume estimates for 2014. First, the AADTT estimates needed to be
adjusted to 2014 values as the base-year FAF estimates in the most recent publication
are for 2007. This was done by using truck vehicle miles traveled (VMT) figures
produced by FHWA for urban and rural roadways6 to calculate an adjustment factor as
follows:
∆𝑉𝑀𝑇𝑟 = 𝑉𝑀𝑇𝑟,14 − 𝑉𝑀𝑇𝑟,07
𝑉𝑀𝑇𝑟,07+ 1
Where:
𝑟 is the roadway type; urban or rural;
∆𝑉𝑀𝑇𝑟 is the calculated adjustment factor for roadway type 𝑟;
𝑉𝑀𝑇𝑟,14 is the total VMT for roadway type 𝑟 in 2014; and
𝑉𝑀𝑇𝑟,07 is the total VMT for roadway type 𝑟 in 2007.
The FAF estimates were further adjusted by a factor of two to account for the FAF
roadway segments being one-directional and the NPMRDS segments being bi-
directional. While more nuanced methodologies could have been developed,
constraints due to the national scope of this analysis as well as the lack of non-
proprietary national VMT data by direction led to the following calculation for
determining AADTT for 2014 for each TMC:
𝐴𝐴𝐷𝑇𝑇𝑡,𝑟,14 = 𝐴𝐴𝐷𝑇𝑇𝑡,𝑟,07 ∗ ∆𝑉𝑀𝑇𝑟
2
6 Table VM-1: Annual Vehicle Distance Traveled in Miles and Related Data by Highway Category and Vehicle Type – 2014. Highway Statistics Series 2014. U.S. Department of Transportation, Federal Highway Administration, Office of
Highway Policy Information. December 2015. Available online: https://www.fhwa.dot.gov/policyinformation/statistics/2014/vm1.cfm

11 Estimating the Cost of Congestion to the Trucking Industry – 2016
Where:
𝑡 is TMC segment;
𝐴𝐴𝐷𝑇𝑇𝑡,𝑟,14 is the calculated AADTT for TMC 𝑡 with roadway type 𝑟 for 2014; and
𝐴𝐴𝐷𝑇𝑇𝑡,𝑟,07 is AADTT for TMC 𝑡 with roadway type 𝑟 in 2007.
To account for seasonality, FHWA’s national volume statistics7 were used to estimate
how total volume fluctuates seasonally. A monthly utilization factor was calculated for
each month for urban and rural roadways by:
𝑢𝑡𝑖𝑙𝑚,𝑟 = 𝑉𝑀𝑇𝑚,𝑟,14
𝑉𝑀𝑇𝑟,14 * 12
Where:
𝑚 is month of the year;
𝑢𝑡𝑖𝑙𝑚,𝑟 is the calculated monthly utility factor for month 𝑚 and roadway type 𝑟;
𝑉𝑀𝑇𝑚,𝑟,14 is VMT for month 𝑚 and roadway type 𝑟 in 2014; and
𝑉𝑀𝑇𝑟,14 is the total VMT for roadway type 𝑟 in 2014.
Due to the granularity of the NPMRDS, AADTT estimates needed to be distributed
across the hours of the day for each month of the year. To perform this, ATRI’s
proprietary truck GPS database was utilized. A five weekday sample of GPS data was
extracted from each month of 2014. Each truck ping data point contains a unique truck
identification code, a date/time stamp recorded in Greenwich Mean Time (GMT), a
latitude/longitude location, a heading, and a spot speed; the total data sample used
equated to approximately 1.1 billion truck GPS points.
The NPMRDS network was then spatially joined with a U.S. time zone shape file8
resulting in each TMC receiving a time zone identifier. The truck GPS data was joined
to this network which resulted in each GPS point receiving a TMC code and a time zone
identifier. The date/time stamp of the GPS data was then converted from GMT to the
time zone in which the point fell, and binned hourly. Finally, the hourly volume
distribution for each TMC per month was found by (Figure 4):
𝑑𝑖𝑠𝑡𝑡,ℎ,𝑚 = 𝑡𝑟𝑢𝑐𝑘𝑠𝑡,ℎ,𝑚
𝑡𝑟𝑢𝑐𝑘𝑠𝑡,𝑚
Where:
ℎ is hour of the day;
𝑑𝑖𝑠𝑡𝑡,ℎ,𝑚 is the calculated volume distribution for TMC 𝑡 in hour bin ℎ for month 𝑚;
7 Traffic Volume Trends. Table – 1. Estimated Individual Monthly Motor Vehicle Travel in the United States. U.S. Department of Transportation, Federal Highway Administration, Office of Highway Policy Information. December 2015. Available online: http://www.fhwa.dot.gov/policyinformation/travel_monitoring/14dectvt/14dectvt.pdf 8 Muller, Eric. A Shapefile of the TZ Timezones of the United States Version 2016b. Last data update: 5 July 2013. Available online: http://efele.net/maps/tz/us/

Estimating the Cost of Congestion to the Trucking Industry – 2016 12
𝑡𝑟𝑢𝑐𝑘𝑠𝑡,ℎ,𝑚 is the number of trucks on TMC 𝑡 in hour bin ℎ for month 𝑚; and
𝑡𝑟𝑢𝑐𝑘𝑠𝑡,𝑚 is the total number of trucks on TMC 𝑡 for month 𝑚.
Figure 4: Example Segment - Hourly Truck Distribution
The volume estimates were then multiplied by a factor equal to the number of weekdays
in a month given that this analysis focuses on weekday congestion. Incorporating this
factor, the final volume estimates are calculated as:
𝑣𝑜𝑙𝑡,ℎ,𝑚,𝑟 = 𝐴𝐴𝐷𝑇𝑇𝑡,𝑟,14 ∗ 𝑢𝑡𝑖𝑙𝑚,𝑟 ∗ 𝑑𝑖𝑠𝑡𝑡,ℎ,𝑚 ∗ 𝑑𝑎𝑦𝑠𝑚
Where:
𝑣𝑜𝑙𝑡,ℎ,𝑚,𝑟 is the calculated volume estimate for TMC 𝑡 in hour bin ℎ for month 𝑚
with road type 𝑟;
𝐴𝐴𝐷𝑇𝑇𝑡,𝑟,14 is the calculated AADTT for TMC 𝑡 with roadway type 𝑟 for 2014;
𝑢𝑡𝑖𝑙𝑚,𝑟 is the calculated monthly utility factor for month 𝑚 and roadway type 𝑟;
𝑑𝑖𝑠𝑡𝑡,ℎ,𝑚 is the calculated volume distribution for TMC 𝑡 in hour bin ℎ for month 𝑚;
and
𝑑𝑎𝑦𝑠𝑚 is the number of weekdays in month 𝑚.
0
0.01
0.02
0.03
0.04
0.05
0.06
0.07
0.08
Pro
po
rtio
n o
f Tr
uck
Vo
lum
es

13 Estimating the Cost of Congestion to the Trucking Industry – 2016
Calculating Total Delay and Cost
With both marginal delay and volume estimates calculated for each TMC segment per
hour of the day and month of the year, the total delay calculation simply becomes:
𝑑𝑒𝑙𝑎𝑦𝑡,ℎ,𝑚 = 𝑐𝑜𝑛𝑔𝑡,ℎ,𝑚 ∗ 𝑣𝑜𝑙𝑡,ℎ,𝑚,𝑟
Where:
𝑑𝑒𝑙𝑎𝑦𝑡,ℎ,𝑚 is the calculated total delay on TMC 𝑡 in hour bin ℎ for month 𝑚;
𝑐𝑜𝑛𝑔𝑡,ℎ,𝑚 is the calculated travel time delay in hours for TMC 𝑡 in hour bin ℎ for
month 𝑚; and
𝑣𝑜𝑙𝑡,ℎ,𝑚,𝑟 is the calculated volume estimate for TMC 𝑡 in hour bin ℎ for month 𝑚
with road type 𝑟.
The final step of the analysis was to apply a monetary equivalent to the total delay
figures. ATRI annually produces a national average operating cost figure which is
derived from financial data obtained directly from representative motor carriers
throughout the country.9 Applying this national per-hour cost of operation to the
calculated hours of delay yields the total cost of delay incurred on the trucking industry
by traffic congestion:
𝑐𝑜𝑠𝑡𝑡,ℎ,𝑚 = 𝑑𝑒𝑙𝑎𝑦𝑡,ℎ,𝑚 ∗ 𝐶𝑃𝐻
Where:
𝑐𝑜𝑠𝑡𝑡,ℎ,𝑚 is the calculated cost of delay on TMC 𝑡 in hour bin ℎ for month 𝑚;
𝑑𝑒𝑙𝑎𝑦𝑡,ℎ,𝑚 is the calculated total delay on TMC 𝑡 in hour bin ℎ for month 𝑚; and
𝐶𝑃𝐻 is the national average cost per hour of operation.
These delay and cost figures were then aggregated across hours and months for each
TMC segment to produce the total delay and cost experienced on a particular segment
for the entire year. As presented in the next section of this report, further aggregation
can produce national delay and cost figures which can then be stratified at the state,
metropolitan area, and county level.
9 Torrey IV, W. Ford and Dan Murray. An Analysis of the Operational Cost of Trucking: A 2015 Update. American Transportation Research Institute. Arlington, VA. September 2015.

Estimating the Cost of Congestion to the Trucking Industry – 2016 14
RESULTS
National Highway System (NHS) Analysis
The first section of the results focuses on the U.S. NHS as this roadway network is the
most vital for freight truck movements throughout the country. The results are
presented as total cost, normalized cost-per-mile, and share of total cost figures where
applicable, and are stratified across four jurisdiction levels: national, state, metropolitan
area, and county.
National Level
Delay associated with weekday traffic congestion on the NHS totaled over 728 million
hours in 2014. This amount of delay is the equivalent of 264,781 commercial truck
drivers sitting idle for an entire working year.10 Applying the 2014 national average
operational cost per hour of $68.0911 equated to just over $49.6 billion in increased
operational costs to the trucking industry. Spreading this cost evenly across the 10.9
million registered large trucks in the U.S.12 results in an increased average cost per
truck of $4,546. However, the actual cost for any one truck is dependent on a variety of
factors such as location of operation, number of miles driven, and operating sector.
Using the 2014 total truck VMT figure13 it is possible to extrapolate how much
congestion delays impacted a truck based of the number of miles the truck traveled in
2014.14 Depicted in Figure 5 below, the impact of congestion varied greatly depending
an individual truck’s VMT for the year. For example, a truck that traveled 25,000 in
2014 incurred an increased cost of $4,438 while a truck that traveled 150,000 miles had
an average increased cost of $26,625.
10 A working year is defined as driving 11 hours a day, 5 days a week, for 50 weeks per year 11 Torrey IV, W. Ford and Dan Murray. An Analysis of the Operational Cost of Trucking: A 2015 Update. American Transportation Research Institute. Arlington, VA. September 2015. 12 Table VM-1: Annual Vehicle Distance Traveled in Miles and Related Data by Highway Category and Vehicle Type – 2014. Highway Statistics Series 2014. U.S. Department of Transportation, Federal Highway Administration, Office of Highway Policy Information. December 2015. Available online: https://www.fhwa.dot.gov/policyinformation/statistics/2014/vm1.cfm 13 Table VM-1: Annual Vehicle Distance Traveled in Miles and Related Data by Highway Category and Vehicle Type – 2014. Highway Statistics Series 2014. U.S. Department of Transportation, Federal Highway Administration, Office of Highway Policy Information. December 2015. Available online: https://www.fhwa.dot.gov/policyinformation/statistics/2014/vm1.cfm 14
2014 𝑇𝑜𝑡𝑎𝑙 𝐶𝑜𝑠𝑡
2014 𝑇𝑟𝑢𝑐𝑘 𝑉𝑀𝑇= 𝐴𝑣𝑒𝑟𝑎𝑔𝑒 𝐶𝑜𝑠𝑡 𝑝𝑒𝑟 𝑉𝑀𝑇

15 Estimating the Cost of Congestion to the Trucking Industry – 2016
Figure 5: Average Cost per Truck Based on Miles Driven
In addition, costs varied by the month of year. The first quarter of the year saw the
lowest relative level of congestion, while the third quarter saw the highest (Figure 6).
This is likely due to a number of factors including a decrease in U.S. Gross Domestic
Product (GDP) growth in the first quarter of 2014, and high growth in the second and
third quarters.15
Additionally, national VMT are generally higher in the second and third quarters of the
year compared to the first and fourth16 suggesting a greater number of vehicles on the
road and therefore more opportunity for congestion.
15 Table 1.1.1 Percent Change from Preceding Period in Real Gross Domestic Product. National Income and Product Accounts Tables. Bureau of Economic Analysis. U.S. Department of Commerce. Last Revised 26 February 2016. Available online: http://www.bea.gov/iTable/iTable.cfm?ReqID=9&step=1#reqid=9&step=1&isuri=1&903=1 16 Traffic Volume Trends. Table – 1. Estimated Individual Monthly Motor Vehicle Travel in the United States. U.S. Department of Transportation, Federal Highway Administration, Office of Highway Policy Information. December 2015. Available online: U.S. Department of Transportation, Federal Highway Administration, Office of Highway Policy Information. December 2014. Available online: http://www.fhwa.dot.gov/policyinformation/travel_monitoring/14dectvt/14dectvt.pdf
$0.00
$5,000.00
$10,000.00
$15,000.00
$20,000.00
$25,000.00
$30,000.00
25,000 50,000 75,000 100,000 125,000 150,000
Ave
rage
Co
st p
er T
ruck
Miles Driven

Estimating the Cost of Congestion to the Trucking Industry – 2016 16
Figure 6: Cost of Congestion by Month of the Year
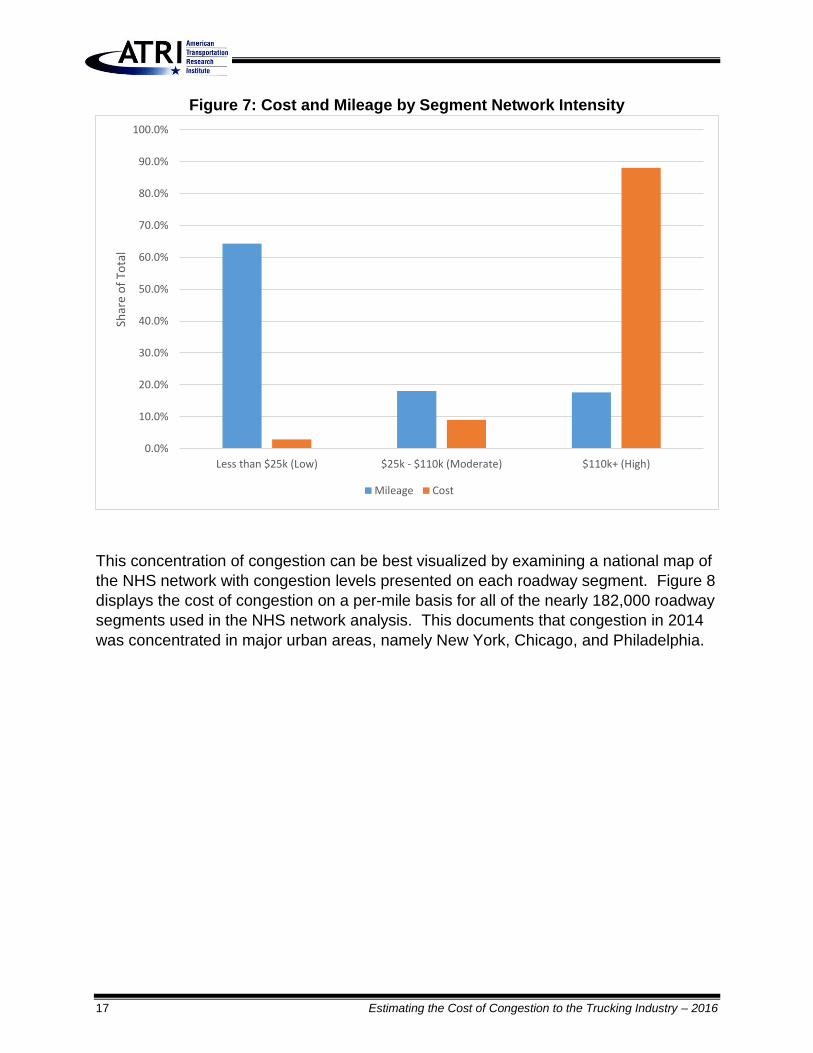
Further, the congestion impacts were not uniform across the NHS network, and were
mainly concentrated in urban areas. While the total congestion costs spread across the
NHS network averaged $111,578 per mile, relatively few segments met or exceeded
this national average suggesting congestion was concentrated on a comparatively small
portion of the network. Shown in Figure 7, a large majority of roadway segments (64.3
percent) experienced little to no congestion impacts, while those segments experiencing
the highest impacts were in fact a small portion of the NHS network (17.6 percent); 88.1
percent of the congestion found in the analysis occurred on this portion of the network.
$0.00
$1,000,000,000.00
$2,000,000,000.00
$3,000,000,000.00
$4,000,000,000.00
$5,000,000,000.00
$6,000,000,000.00
17 Estimating the Cost of Congestion to the Trucking Industry – 2016
Figure 7: Cost and Mileage by Segment Network Intensity
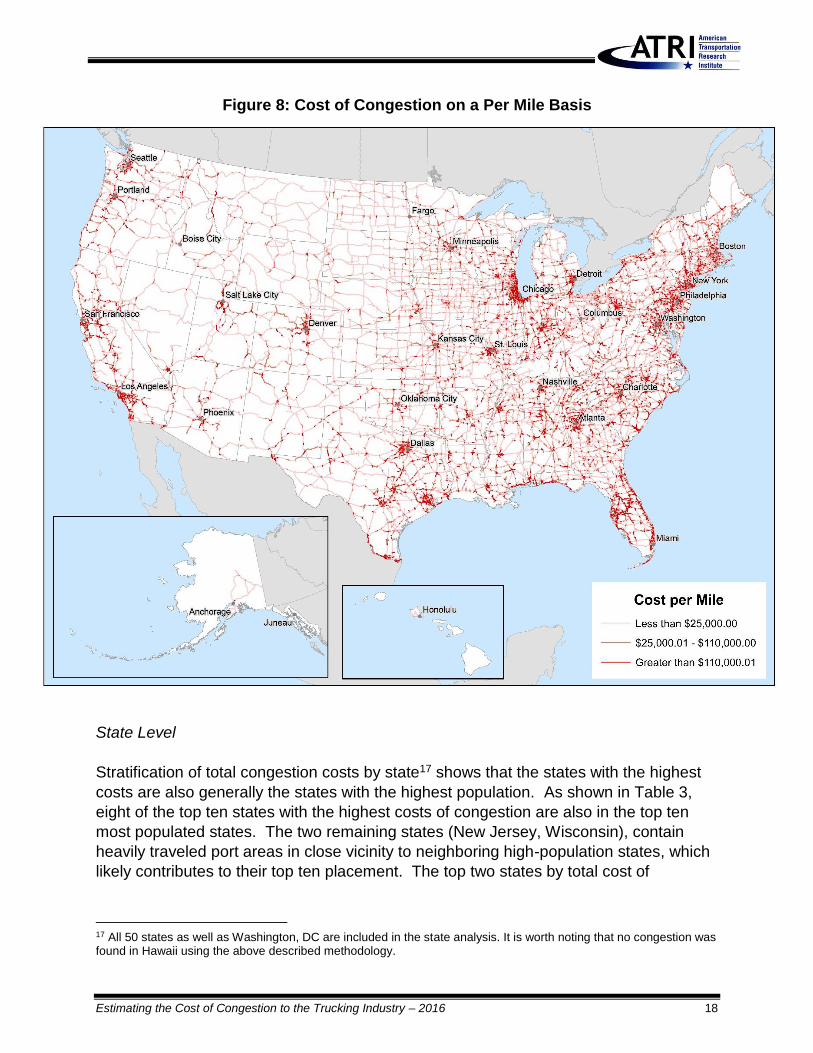
This concentration of congestion can be best visualized by examining a national map of
the NHS network with congestion levels presented on each roadway segment. Figure 8
displays the cost of congestion on a per-mile basis for all of the nearly 182,000 roadway
segments used in the NHS network analysis. This documents that congestion in 2014
was concentrated in major urban areas, namely New York, Chicago, and Philadelphia.
0.0%
10.0%
20.0%
30.0%
40.0%
50.0%
60.0%
70.0%
80.0%
90.0%
100.0%
Less than $25k (Low) $25k - $110k (Moderate) $110k+ (High)
Shar
e o
f To
tal
Mileage Cost
Estimating the Cost of Congestion to the Trucking Industry – 2016 18
Figure 8: Cost of Congestion on a Per Mile Basis
State Level
Stratification of total congestion costs by state17 shows that the states with the highest
costs are also generally the states with the highest population. As shown in Table 3,
eight of the top ten states with the highest costs of congestion are also in the top ten
most populated states. The two remaining states (New Jersey, Wisconsin), contain
heavily traveled port areas in close vicinity to neighboring high-population states, which
likely contributes to their top ten placement. The top two states by total cost of
17 All 50 states as well as Washington, DC are included in the state analysis. It is worth noting that no congestion was found in Hawaii using the above described methodology.

19 Estimating the Cost of Congestion to the Trucking Industry – 2016
congestion, Florida and Texas, both totaled over $4 billion in total cost, and together
accounted for 17.6 percent of the national cost of congestion value (Figure 9).
Table 3: Top Ten States by Total Cost of Congestion
Rank State Total Cost Share of
Total Cost
1 Florida $4,632,938,425 9.3%
2 Texas $4,119,079,262 8.3%
3 California $3,268,924,598 6.6%
4 New Jersey $2,995,602,210 6.0%
5 New York $2,507,749,879 5.1%
6 Illinois $2,406,760,528 4.9%
7 Pennsylvania $2,161,880,916 4.4%
8 North Carolina $2,039,569,226 4.1%
9 Georgia $1,791,108,802 3.6%
10 Wisconsin $1,526,754,282 3.1%

Estimating the Cost of Congestion to the Trucking Industry – 2016 20
Figure 9: State Share of Total Cost of Congestion
When normalizing costs on NHS miles contained within the state, the top ten list looks
very different. The District of Columbia had the highest cost of congestion on a per-mile
basis due to the high levels of congestion experienced on a very small number of NHS
segment miles. Additionally, many of the smaller Northeastern states appear on the list
as well for the same reason. Contrary to this trend, Florida and California remain on
this top ten list despite having the second and third highest NHS segment miles,
respectively (Table 4).

21 Estimating the Cost of Congestion to the Trucking Industry – 2016
Table 4: Top Ten States Based on Cost per NHS Segment Mile
Rank State Miles of
NHS Segments
Cost per Mile
1 District of Columbia 60 $1,045,978
2 New Jersey 5,692 $526,323
3 Delaware 1,001 $323,713
4 Maryland 4,762 $310,985
5 Florida 17,329 $267,354
6 Connecticut 3,462 $234,061
7 Massachusetts 5,616 $209,938
8 Utah 5,815 $188,915
9 New York 15,278 $164,140
10 California 20,013 $163,337
The full state congestion table, listed alphabetically, can be found in Appendix A of this
report.
Metropolitan Level
When costs are analyzed at the metropolitan level, similar trends emerge that were
prevalent at the state-level analysis, in that densely populated metropolitan areas
experienced the highest instances of delays, and subsequently the highest cost of those
delays. However, this level of analysis can offer deeper insight into the magnitude of
congestion in urban areas. For instance, the metropolitan area with the highest total
cost, New York-Newark-Jersey City, NY-NJ-PA, accounted for over half (53 percent) of
the combined total cost of the three states in which it is encompassed (Table 5).
Another notable example is the Atlanta-Sandy Springs-Roswell, GA metropolitan area
accounting for over 55 percent of the total cost found in the entire state. From a
national perspective, 95 percent of the total congestion cost occurred in metropolitan
areas, with just over $2.5 billion occurring outside of metropolitan areas.

Estimating the Cost of Congestion to the Trucking Industry – 2016 22
Table 5: Top Ten Metropolitan Areas by Total Cost of Congestion
Rank Metropolitan Area Total Cost
1 New York-Newark-Jersey City, NY-NJ-PA $4,060,571,449
2 Chicago-Naperville-Elgin, IL-IN-WI $1,915,070,975
3 Philadelphia-Camden-Wilmington, PA-NJ-DE-MD $1,539,185,875
4 Washington-Arlington-Alexandria, DC-VA-MD-WV $1,508,625,815
5 Miami-Fort Lauderdale-West Palm Beach, FL $1,331,032,562
6 Dallas-Fort Worth-Arlington, TX $1,001,066,579
7 Atlanta-Sandy Springs-Roswell, GA $991,678,664
8 Houston-The Woodlands-Sugar Land, TX $917,681,071
9 Los Angeles-Long Beach-Anaheim, CA $896,918,309
10 Boston-Cambridge-Newton, MA-NH $875,940,026
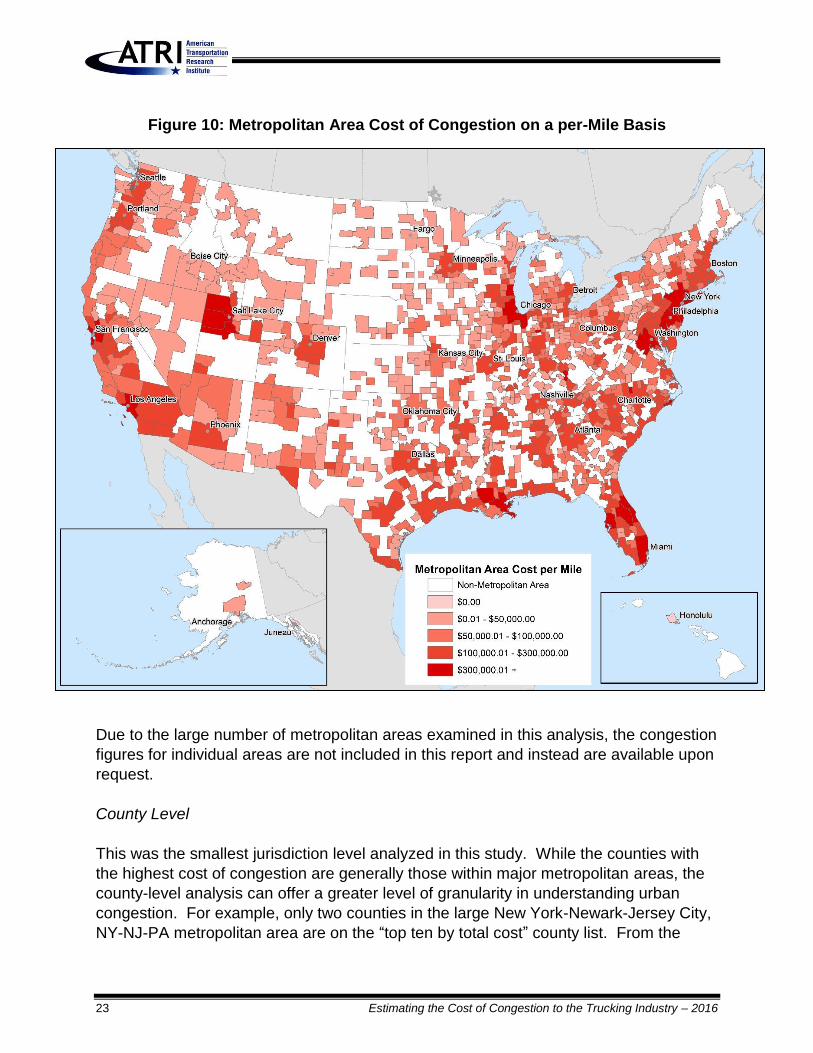
Despite having the most NHS segment miles of all of the metropolitan areas analyzed,
the New York-Newark-Jersey City, NY-NJ-PA metropolitan area also topped the list
when normalizing the total segment mile costs (Table 6). Similar to the state analysis,
smaller metropolitan areas appeared on the list due to high congestion intensity on a
relatively small number of NHS segment miles, despite having comparatively small
populations. Figure 10 below shows the national picture of urban congestion on a per
mile basis.
Table 6: Top Ten Metropolitan Areas Based on Cost per NHS Segment Mile
Rank Metropolitan Area Miles of
NHS Segments
Cost per Mile
1 New York-Newark-Jersey City, NY-NJ-PA 6,728 $603,552
2 Miami-Fort Lauderdale-West Palm Beach, FL 2,549 $522,080
3 Orlando-Kissimmee-Sanford, FL 1,393 $511,406
4 Ogden-Clearfield, UT 631 $497,400
5 Bridgeport-Stamford-Norwalk, CT 559 $471,535
6 San Francisco-Oakland-Hayward, CA 1,022 $468,075
7 Burlington, NC 103 $460,687
8 Washington-Arlington-Alexandria, DC-VA-MD-WV 3,294 $457,994
9 Los Angeles-Long Beach-Anaheim, CA 1,964 $456,715
10 Provo-Orem, UT 834 $395,268
23 Estimating the Cost of Congestion to the Trucking Industry – 2016
Figure 10: Metropolitan Area Cost of Congestion on a per-Mile Basis
Due to the large number of metropolitan areas examined in this analysis, the congestion
figures for individual areas are not included in this report and instead are available upon
request.
County Level
This was the smallest jurisdiction level analyzed in this study. While the counties with
the highest cost of congestion are generally those within major metropolitan areas, the
county-level analysis can offer a greater level of granularity in understanding urban
congestion. For example, only two counties in the large New York-Newark-Jersey City,
NY-NJ-PA metropolitan area are on the “top ten by total cost” county list. From the
Estimating the Cost of Congestion to the Trucking Industry – 2016 24
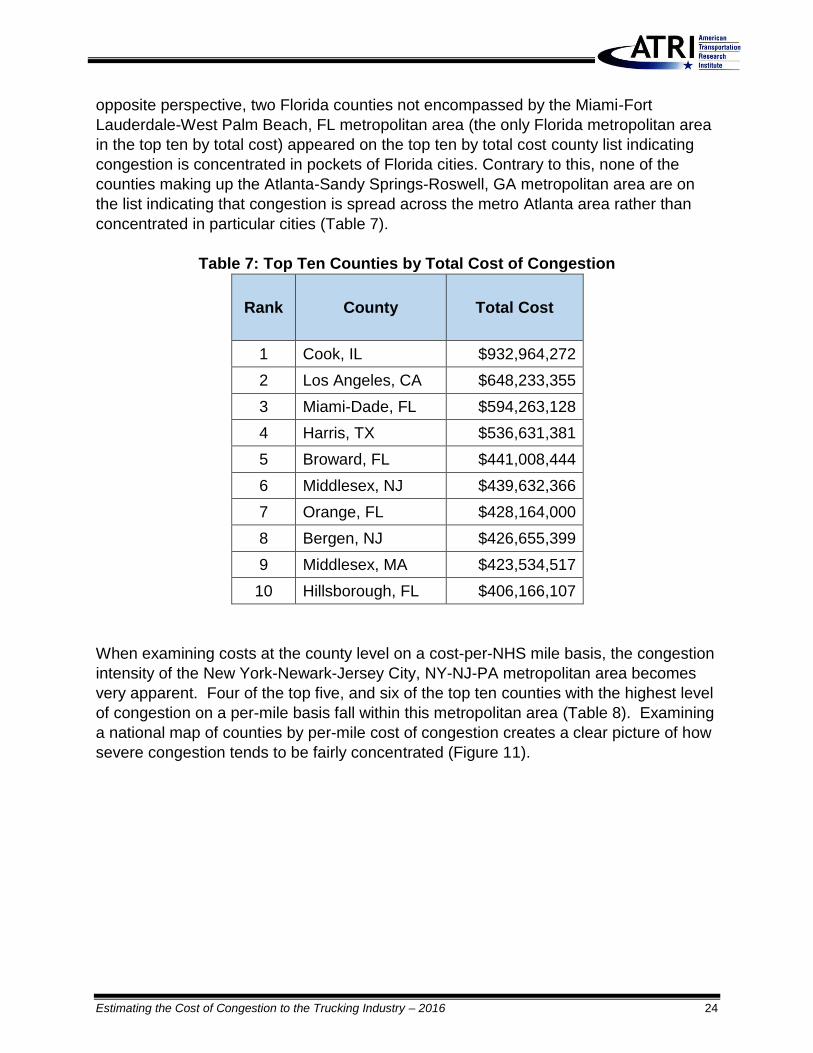
opposite perspective, two Florida counties not encompassed by the Miami-Fort
Lauderdale-West Palm Beach, FL metropolitan area (the only Florida metropolitan area
in the top ten by total cost) appeared on the top ten by total cost county list indicating
congestion is concentrated in pockets of Florida cities. Contrary to this, none of the
counties making up the Atlanta-Sandy Springs-Roswell, GA metropolitan area are on
the list indicating that congestion is spread across the metro Atlanta area rather than
concentrated in particular cities (Table 7).
Table 7: Top Ten Counties by Total Cost of Congestion
Rank County Total Cost
1 Cook, IL $932,964,272
2 Los Angeles, CA $648,233,355
3 Miami-Dade, FL $594,263,128
4 Harris, TX $536,631,381
5 Broward, FL $441,008,444
6 Middlesex, NJ $439,632,366
7 Orange, FL $428,164,000
8 Bergen, NJ $426,655,399
9 Middlesex, MA $423,534,517
10 Hillsborough, FL $406,166,107
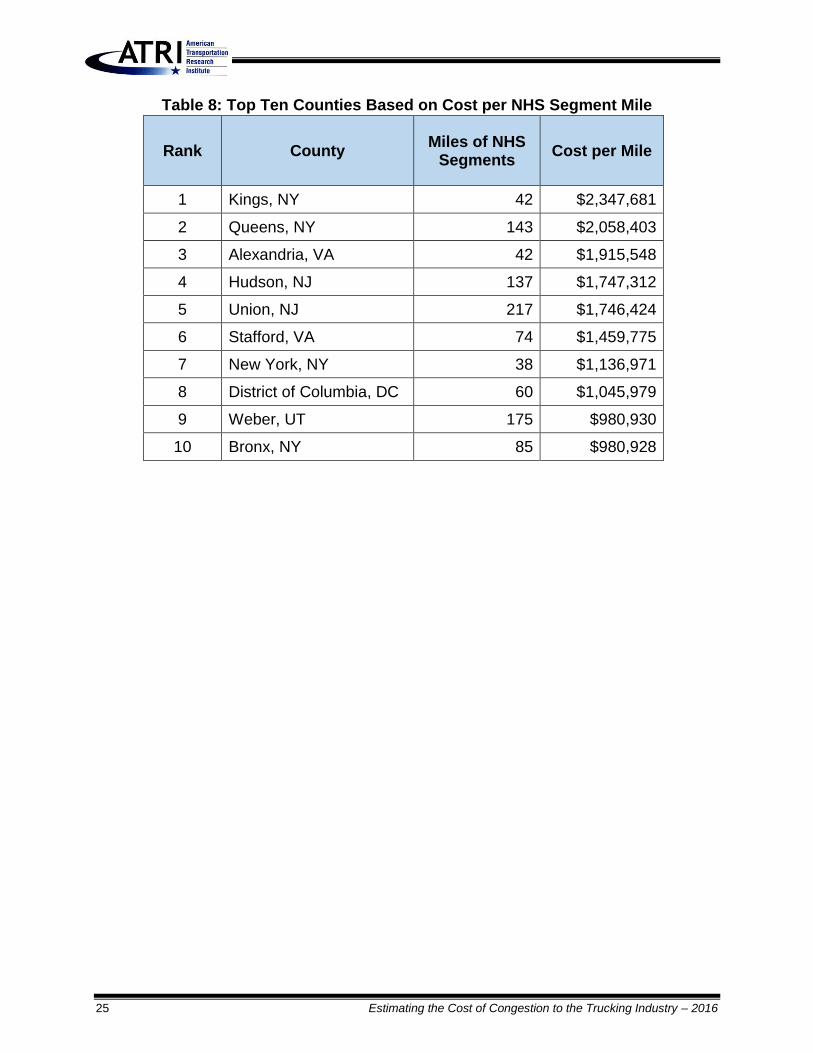
When examining costs at the county level on a cost-per-NHS mile basis, the congestion
intensity of the New York-Newark-Jersey City, NY-NJ-PA metropolitan area becomes
very apparent. Four of the top five, and six of the top ten counties with the highest level
of congestion on a per-mile basis fall within this metropolitan area (Table 8). Examining
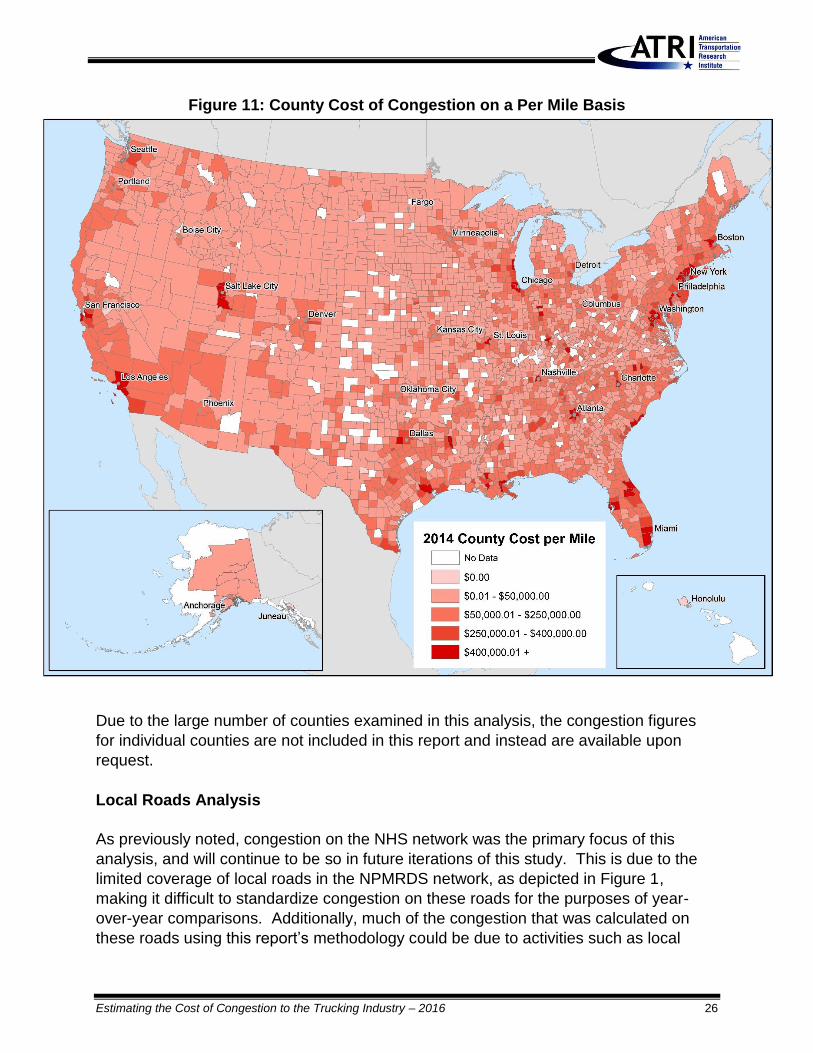
a national map of counties by per-mile cost of congestion creates a clear picture of how
severe congestion tends to be fairly concentrated (Figure 11).
25 Estimating the Cost of Congestion to the Trucking Industry – 2016
Table 8: Top Ten Counties Based on Cost per NHS Segment Mile
Rank County Miles of NHS
Segments Cost per Mile
1 Kings, NY 42 $2,347,681
2 Queens, NY 143 $2,058,403
3 Alexandria, VA 42 $1,915,548
4 Hudson, NJ 137 $1,747,312
5 Union, NJ 217 $1,746,424
6 Stafford, VA 74 $1,459,775
7 New York, NY 38 $1,136,971
8 District of Columbia, DC 60 $1,045,979
9 Weber, UT 175 $980,930
10 Bronx, NY 85 $980,928
Estimating the Cost of Congestion to the Trucking Industry – 2016 26
Figure 11: County Cost of Congestion on a Per Mile Basis
Due to the large number of counties examined in this analysis, the congestion figures
for individual counties are not included in this report and instead are available upon
request.
Local Roads Analysis
As previously noted, congestion on the NHS network was the primary focus of this
analysis, and will continue to be so in future iterations of this study. This is due to the
limited coverage of local roads in the NPMRDS network, as depicted in Figure 1,
making it difficult to standardize congestion on these roads for the purposes of year-
over-year comparisons. Additionally, much of the congestion that was calculated on
these roads using this report’s methodology could be due to activities such as local
27 Estimating the Cost of Congestion to the Trucking Industry – 2016
pick-up and delivery operations, or city repairs and maintenance using heavy duty
equipment. As such, cost figures on local roads covered by the network will be
presented at a high level as supplemental information in this and future reports, and
should be interpreted with caution.
Given these caveats, the cost of congestion information relating to these roads
elucidates the challenges involved in urban freight movements. The local roadway
network is predominantly made up of relatively short roadway segments in downtown
urban areas, with only one-quarter of the segments having a length of over one mile
long. These roads account for only 11 percent of the miles included in the entirety of
the NPMRDS network yet over 483 million hours of delay were accumulated on these
roads based on the methodology described earlier in this report. This is the equivalent
of an additional 174,369 commercial truck drivers sitting idle for a working year on these
roads, and resulted in increased costs of over $32.8 billion.
Due to the characteristics of this network, essentially the entirety of this cost occurred in
urban areas with only 0.13 percent of the cost existing in rural areas. The Los Angeles-
Long Beach-Anaheim, CA metropolitan area saw the highest total cost on local roads of
over $5.3 billion with more than $4 billion of that occurring in Los Angeles County – the
top county by this measure.

Estimating the Cost of Congestion to the Trucking Industry – 2016 28
CONCLUSION
In an effort to benchmark the impact that traffic congestion has on the trucking industry,
this report utilized a variety of data resources, and established a standardized
methodology to quantify the amount of delay and monetary equivalent of that delay in
2014. Additionally, the analysis was expanded to include the entire NHS network.
Delay on the NHS was calculated to be over 728 million hours equating to
approximately $49.6 billion in increased congestion-related costs to the trucking
industry. This congestion was heavily concentrated in urban areas, with 88.1 percent of
the total cost occurring on only 17.6 percent of the NHS network. This congestion in
urban areas has been extensively documented by ATRI’s annual list of the nation’s top
truck freight significant bottlenecks.18
This lost productivity is equivalent to 264,781 commercial truck drivers sitting idle for an
entire working year. Additionally, the average truck experienced an increased cost of
$4,546 due to congestion, with this figure varying widely depending on the number of
miles a particular truck traveled in a particular area.
Finally, as a direct result of this analysis, ATRI has a unique opportunity to be a
valuable source of congestion information to planners at every jurisdiction level.
Utilizing the output of this analysis, a congestion cost database has been built with the
intent of providing granular cost information. This information includes hours of delay
and the cost of those hours by major jurisdiction type and road level, and presents data
both yearly and on a month-by-month basis. Table 9 presents an example of the type
of information that can be extracted from the database for use by planning officials.
Table 9: Sample Cost of Congestion Database Information -
Interstates in Fulton County, Georgia
Road Hours of
Delay Total Cost
Miles of NHS
Cost per Mile
I-20 254,694 $17,341,946 23 $750,721
I-285 190,594 $12,977,411 43 $303,570
I-75 613,302 $41,759,378 35 $1,185,400
I-85 418,625 $28,503,939 45 $636,385
To request congestion information please contact ATRI at [email protected].
18 Short, Jeff and Dan Murray. Congestion Impacts Analysis of Freight Significant Highway Locations – 2015.
American Transportation Research Institute. Arlington, Virginia. November 2015. Available online: http://atri-online.org/2015/11/18/congestion-impact-analysis-of-freight-significant-highway-locations-2015/

29 Estimating the Cost of Congestion to the Trucking Industry – 2016
APPENDIX A: STATE CONGESTION TABLE
State Total Cost Share of
Total Cost
Miles of NHS Segments
Cost per Mile
Alabama $983,139,939 2.0% 10,079 $97,545
Alaska $29,438,498 0.1% 2,686 $10,962
Arizona $463,002,645 0.9% 6,527 $70,937
Arkansas $572,399,617 1.2% 7,931 $72,175
California $3,268,924,598 6.6% 20,013 $163,337
Colorado $694,152,939 1.4% 9,824 $70,658
Connecticut $810,435,099 1.6% 3,462 $234,061
Delaware $324,085,044 0.7% 1,001 $323,713
District of Columbia $62,455,752 0.1% 60 $1,045,978
Florida $4,632,938,425 9.3% 17,329 $267,354
Georgia $1,791,108,802 3.6% 15,149 $118,231
Hawaii $0 0.0% 129 $0
Idaho $124,476,989 0.3% 5,119 $24,316
Illinois $2,406,760,528 4.9% 16,482 $146,022
Indiana $1,133,095,429 2.3% 10,384 $109,117
Iowa $247,125,834 0.5% 10,564 $23,392
Kansas $265,813,733 0.5% 10,014 $26,545
Kentucky $520,344,743 1.0% 6,014 $86,520
Louisiana $1,084,754,304 2.2% 6,833 $158,756
Maine $191,936,913 0.4% 3,228 $59,452
Maryland $1,480,934,307 3.0% 4,762 $310,985
Massachusetts $1,178,981,930 2.4% 5,616 $209,938
Michigan $644,587,441 1.3% 10,235 $62,982
Minnesota $521,630,260 1.1% 12,127 $43,014
Mississippi $607,308,902 1.2% 7,657 $79,309
Missouri $1,103,811,575 2.2% 13,257 $83,261
Montana $124,866,712 0.3% 8,470 $14,742
Nebraska $206,566,006 0.4% 8,072 $25,589
Nevada $136,738,939 0.3% 4,766 $28,691
New Hampshire $250,318,794 0.5% 2,410 $103,866
New Jersey $2,995,602,210 6.0% 5,692 $526,323
New Mexico $284,166,056 0.6% 6,268 $45,337
New York $2,507,749,879 5.1% 15,278 $164,140
North Carolina $2,039,569,226 4.1% 13,632 $149,616
North Dakota $97,978,827 0.2% 7,474 $13,109
Ohio $920,086,079 1.9% 14,407 $63,865
Oklahoma $407,191,879 0.8% 8,866 $45,929

Estimating the Cost of Congestion to the Trucking Industry – 2016 30
State Total Cost Share of
Total Cost
Miles of NHS Segments
Cost per Mile
Oregon $578,553,721 1.2% 8,723 $66,327
Pennsylvania $2,161,880,916 4.4% 14,629 $147,782
Rhode Island $146,901,988 0.3% 1,064 $138,072
South Carolina $991,880,431 2.0% 8,528 $116,303
South Dakota $88,683,344 0.2% 7,615 $11,647
Tennessee $1,380,222,796 2.8% 10,960 $125,929
Texas $4,119,079,262 8.3% 33,835 $121,739
Utah $1,098,591,882 2.2% 5,815 $188,915
Vermont $93,835,564 0.2% 1,810 $51,829
Virginia $1,189,866,723 2.4% 9,358 $127,156
Washington $674,667,309 1.4% 7,519 $89,729
West Virginia $316,877,468 0.6% 3,988 $79,449
Wisconsin $1,526,754,282 3.1% 12,451 $122,623
Wyoming $96,882,596 0.2% 6,230 $15,551

April 2016
Cost of Congestion to the Trucking Industry