cost of capital, investment decisions and economic growth...
TRANSCRIPT

i
Cost of Capital, Investment
Decisions and Economic
Growth: Implications for Tax
Reform
Prepared by
Quantria Strategies, LLC
for the
CRANE Coalition
i
Cost of Capital, Investment Decisions and Economic Growth:
Implications for Tax Reform
Contents
EXECUTIVE SUMMARY .............................................................................................. 1
I. Introduction ............................................................................................... 2
II. Cost of Capital: Theory and Evidence .................................................... 3
III. Cost of Capital for Investment in Equipment Under Present Law ...... 4
IV. Cost of Capital by Industry Under Repeal of Accelerated
Depreciation for Equipment .................................................................... 8
V. Macroeconomic Effects of Tax Reform on Investment and Economic
Growth ....................................................................................................... 9
References ................................................................................................................... 13
Appendix A – Description of the Model and Data ....................................................... 15
Appendix B – Historical Context of Accelerated Cost Recovery ............................... 16
List of Tables
Table 1. Investment in Private Non-Residential Fixed Assets,
By Major Industry Group: 2013 ...........................................................5
Table 2. Total Investment in Private Non-Residential Fixed Assets,
By Major Industry Group: 2013 ...........................................................6
Table 3. Percent Distribution of Investment in Private Non-Residential Fixed
Assets, By Asset Type and Major Industry Group: 2013 ...................7
Table 4. Cost of Capital for Investment in Equipment,
Under Present Law .................................................................................8
Table 5. Cost of Capital for Investment in Equipment,
With Repeal of MACRS .........................................................................9
Table 6. Presence of Accelerated Depreciation in the
Federal Internal Revenue Code ...........................................................16
1
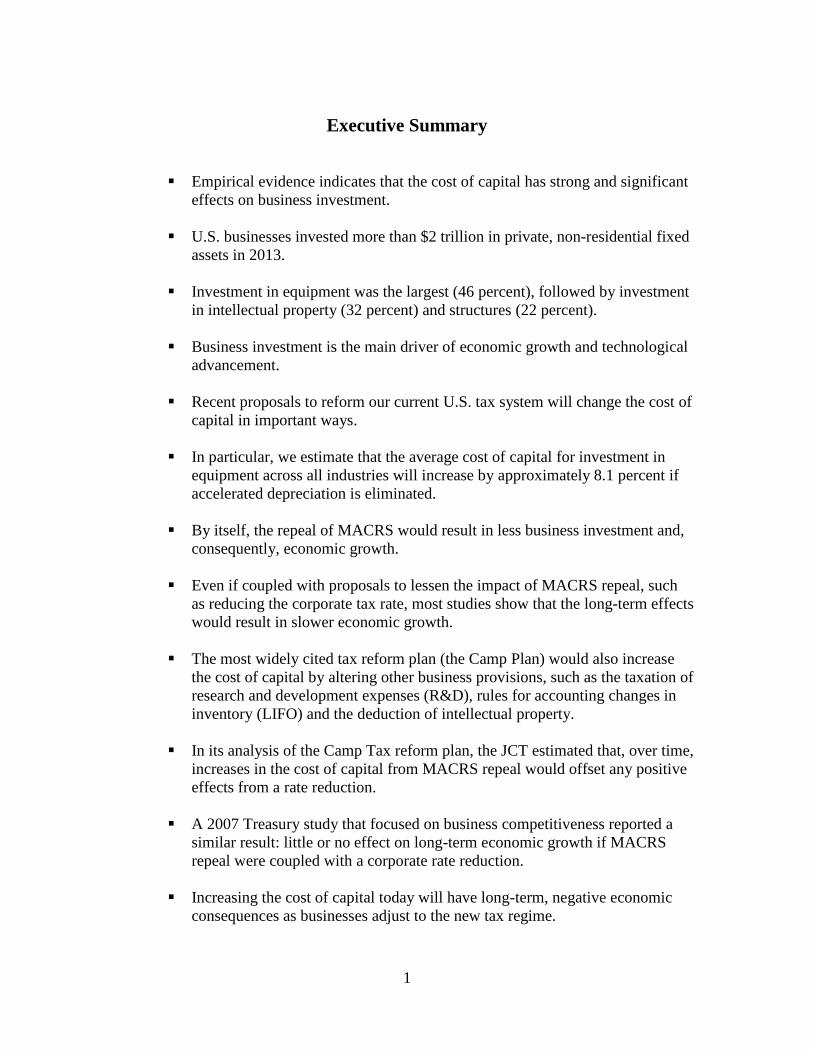
Executive Summary
Empirical evidence indicates that the cost of capital has strong and significant
effects on business investment.
U.S. businesses invested more than $2 trillion in private, non-residential fixed
assets in 2013.
Investment in equipment was the largest (46 percent), followed by investment
in intellectual property (32 percent) and structures (22 percent).
Business investment is the main driver of economic growth and technological
advancement.
Recent proposals to reform our current U.S. tax system will change the cost of
capital in important ways.
In particular, we estimate that the average cost of capital for investment in
equipment across all industries will increase by approximately 8.1 percent if
accelerated depreciation is eliminated.
By itself, the repeal of MACRS would result in less business investment and,
consequently, economic growth.
Even if coupled with proposals to lessen the impact of MACRS repeal, such
as reducing the corporate tax rate, most studies show that the long-term effects
would result in slower economic growth.
The most widely cited tax reform plan (the Camp Plan) would also increase
the cost of capital by altering other business provisions, such as the taxation of
research and development expenses (R&D), rules for accounting changes in
inventory (LIFO) and the deduction of intellectual property.
In its analysis of the Camp Tax reform plan, the JCT estimated that, over time,
increases in the cost of capital from MACRS repeal would offset any positive
effects from a rate reduction.
A 2007 Treasury study that focused on business competitiveness reported a
similar result: little or no effect on long-term economic growth if MACRS
repeal were coupled with a corporate rate reduction.
Increasing the cost of capital today will have long-term, negative economic
consequences as businesses adjust to the new tax regime.
2
Cost of Capital, Investment Decisions and Economic Growth:
Implications for Tax Reform
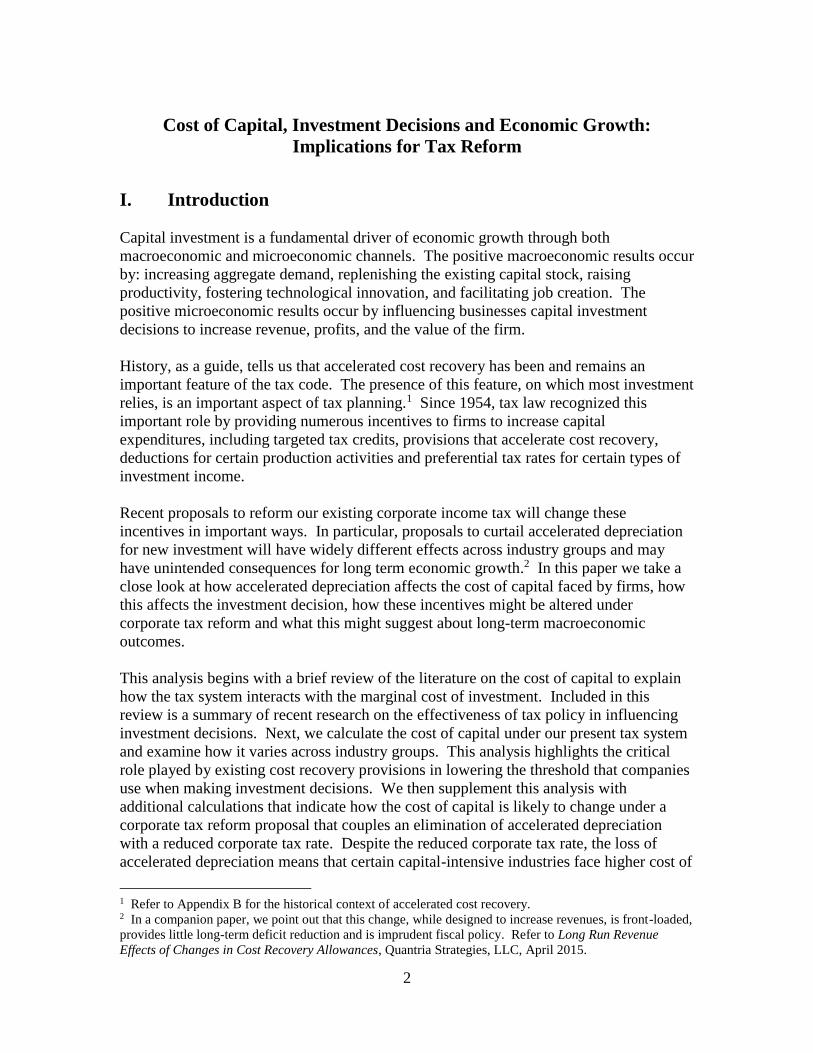
I. Introduction
Capital investment is a fundamental driver of economic growth through both
macroeconomic and microeconomic channels. The positive macroeconomic results occur
by: increasing aggregate demand, replenishing the existing capital stock, raising
productivity, fostering technological innovation, and facilitating job creation. The
positive microeconomic results occur by influencing businesses capital investment
decisions to increase revenue, profits, and the value of the firm.
History, as a guide, tells us that accelerated cost recovery has been and remains an
important feature of the tax code. The presence of this feature, on which most investment
relies, is an important aspect of tax planning.1 Since 1954, tax law recognized this
important role by providing numerous incentives to firms to increase capital
expenditures, including targeted tax credits, provisions that accelerate cost recovery,
deductions for certain production activities and preferential tax rates for certain types of
investment income.
Recent proposals to reform our existing corporate income tax will change these
incentives in important ways. In particular, proposals to curtail accelerated depreciation
for new investment will have widely different effects across industry groups and may
have unintended consequences for long term economic growth.2 In this paper we take a
close look at how accelerated depreciation affects the cost of capital faced by firms, how
this affects the investment decision, how these incentives might be altered under
corporate tax reform and what this might suggest about long-term macroeconomic
outcomes.
This analysis begins with a brief review of the literature on the cost of capital to explain
how the tax system interacts with the marginal cost of investment. Included in this
review is a summary of recent research on the effectiveness of tax policy in influencing
investment decisions. Next, we calculate the cost of capital under our present tax system
and examine how it varies across industry groups. This analysis highlights the critical
role played by existing cost recovery provisions in lowering the threshold that companies
use when making investment decisions. We then supplement this analysis with
additional calculations that indicate how the cost of capital is likely to change under a
corporate tax reform proposal that couples an elimination of accelerated depreciation
with a reduced corporate tax rate. Despite the reduced corporate tax rate, the loss of
accelerated depreciation means that certain capital-intensive industries face higher cost of
1 Refer to Appendix B for the historical context of accelerated cost recovery. 2 In a companion paper, we point out that this change, while designed to increase revenues, is front-loaded,
provides little long-term deficit reduction and is imprudent fiscal policy. Refer to Long Run Revenue
Effects of Changes in Cost Recovery Allowances, Quantria Strategies, LLC, April 2015.

3
capital under this scenario. The final section provides recent empirical evidence of the
potential effects that eliminating accelerated cost recovery would have on long-term
economic growth.
II. Cost of Capital: Theory and Evidence
Over the last sixty years, most studies that examined the effect of tax policy on capital
investment have used the Hall-Jorgenson (1967) derivation of the cost of capital to
measure the effectiveness of the tax system in influencing business investment decisions.
In this measure, a firm is assumed to make capital investments over time in order to
maximize its value. Hall and Jorgenson refer to the user cost of capital as:3
. (1)
In this formula:
r is the net-of-tax rate of return a company requires to attract investors;
is the inflation rate on capital goods;
is the rate of economic depreciation
is the statutory corporate tax rate;
k is the investment credit rate; and
z is the present value of depreciation deductions.
The term on the right summarizes the effect of taxes on this cost. Their fundamental
result is that the firm will invest as long as the marginal cost of the next dollar of
investment maximizes the value of the firm.4
In Hall and Jorgenson’s original paper, which drew from Jorgenson’s earlier work
(Jorgenson (1963)), they examine the effect on aggregate investment of three actual
changes in tax policy: (i) implementation of accelerated depreciation in 1952; (ii) the
shortening of asset lives in depreciation guidelines issued in1962; and (iii) the imposition
of an investment tax credit in 1962. In all cases the authors found significant effects in
aggregate investment from each tax policy.5
3 Gale and Orszag (2005) point out that, in arriving at this formula, many simplifying assumptions are
made with respect to expectations, adjustment costs, asset re-sales, the time pattern of economic
depreciation and the marginal cost of new capital goods. Much recent work has relaxed these assumptions. 4 Notice that in a tax system without an investment tax credit (e.g., under present law in the U.S.) and
where immediate expensing of investment is allowed (i.e., z = 1), this term disappears and taxes are
irrelevant to the firm’s decision. 5 The shortening of asset lives affected mostly investment in equipment and machinery. Critics of Hall and
Jorgenson’s results pointed out that it is difficult to distinguish the effects on investment due to tax policy
from other causes because of the high degree of correlation among the variables. Over the next twenty
years, researchers attempting similar analyses found much smaller effects: taxes appeared to have a very
small influence on business investment.
r 1 k z 1
4
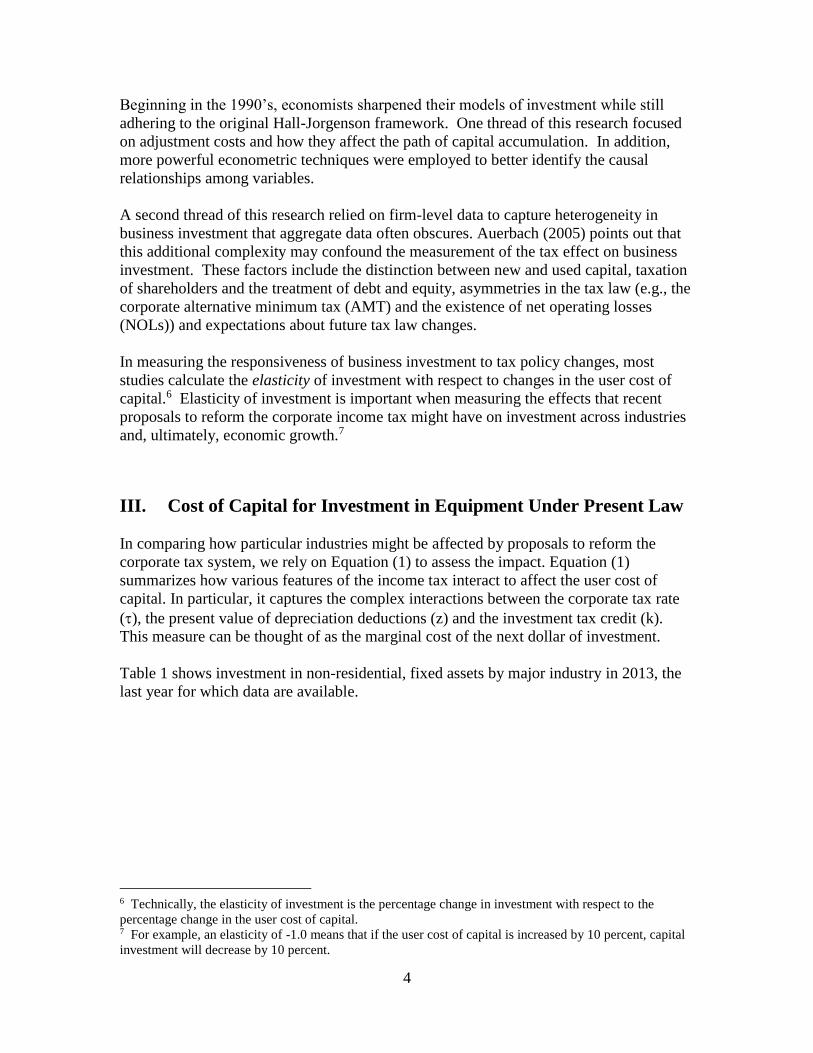
Beginning in the 1990’s, economists sharpened their models of investment while still
adhering to the original Hall-Jorgenson framework. One thread of this research focused
on adjustment costs and how they affect the path of capital accumulation. In addition,
more powerful econometric techniques were employed to better identify the causal
relationships among variables.
A second thread of this research relied on firm-level data to capture heterogeneity in
business investment that aggregate data often obscures. Auerbach (2005) points out that
this additional complexity may confound the measurement of the tax effect on business
investment. These factors include the distinction between new and used capital, taxation
of shareholders and the treatment of debt and equity, asymmetries in the tax law (e.g., the
corporate alternative minimum tax (AMT) and the existence of net operating losses
(NOLs)) and expectations about future tax law changes.
In measuring the responsiveness of business investment to tax policy changes, most
studies calculate the elasticity of investment with respect to changes in the user cost of
capital.6 Elasticity of investment is important when measuring the effects that recent
proposals to reform the corporate income tax might have on investment across industries
and, ultimately, economic growth.7
III. Cost of Capital for Investment in Equipment Under Present Law
In comparing how particular industries might be affected by proposals to reform the
corporate tax system, we rely on Equation (1) to assess the impact. Equation (1)
summarizes how various features of the income tax interact to affect the user cost of
capital. In particular, it captures the complex interactions between the corporate tax rate
(), the present value of depreciation deductions (z) and the investment tax credit (k).
This measure can be thought of as the marginal cost of the next dollar of investment.
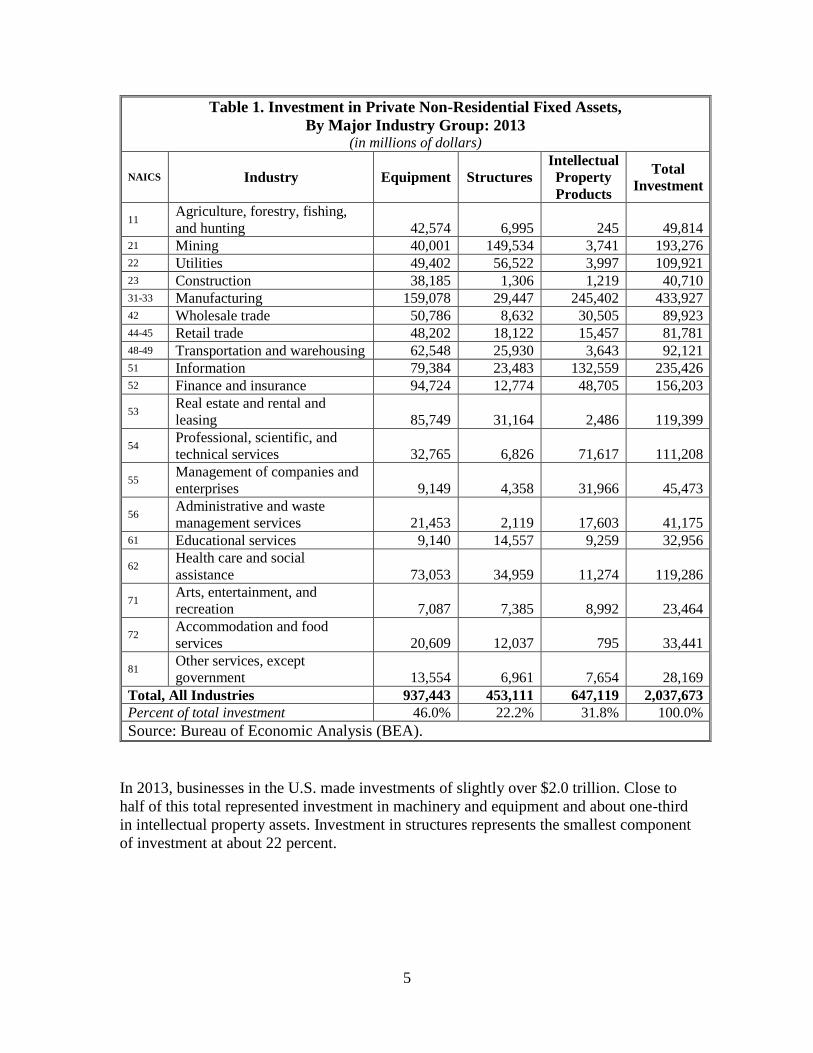
Table 1 shows investment in non-residential, fixed assets by major industry in 2013, the
last year for which data are available.
6 Technically, the elasticity of investment is the percentage change in investment with respect to the
percentage change in the user cost of capital. 7 For example, an elasticity of -1.0 means that if the user cost of capital is increased by 10 percent, capital
investment will decrease by 10 percent.
5
Table 1. Investment in Private Non-Residential Fixed Assets,
By Major Industry Group: 2013 (in millions of dollars)
NAICS Industry Equipment Structures
Intellectual
Property
Products
Total
Investment
11 Agriculture, forestry, fishing,
and hunting 42,574 6,995 245 49,814 21 Mining 40,001 149,534 3,741 193,276 22 Utilities 49,402 56,522 3,997 109,921 23 Construction 38,185 1,306 1,219 40,710 31-33 Manufacturing 159,078 29,447 245,402 433,927 42 Wholesale trade 50,786 8,632 30,505 89,923 44-45 Retail trade 48,202 18,122 15,457 81,781 48-49 Transportation and warehousing 62,548 25,930 3,643 92,121 51 Information 79,384 23,483 132,559 235,426 52 Finance and insurance 94,724 12,774 48,705 156,203
53 Real estate and rental and
leasing 85,749 31,164 2,486 119,399
54 Professional, scientific, and
technical services 32,765 6,826 71,617 111,208
55 Management of companies and
enterprises 9,149 4,358 31,966 45,473
56 Administrative and waste
management services 21,453 2,119 17,603 41,175 61 Educational services 9,140 14,557 9,259 32,956
62 Health care and social
assistance 73,053 34,959 11,274 119,286
71 Arts, entertainment, and
recreation 7,087 7,385 8,992 23,464
72 Accommodation and food
services 20,609 12,037 795 33,441
81 Other services, except
government 13,554 6,961 7,654 28,169
Total, All Industries 937,443 453,111 647,119 2,037,673
Percent of total investment 46.0% 22.2% 31.8% 100.0%
Source: Bureau of Economic Analysis (BEA).
In 2013, businesses in the U.S. made investments of slightly over $2.0 trillion. Close to
half of this total represented investment in machinery and equipment and about one-third
in intellectual property assets. Investment in structures represents the smallest component
of investment at about 22 percent.

6
Table 2 below shows the percentage distribution of investment in private, non-residential
fixed assets, by major industry in 2013.
Table 2. Total Investment in Private Non-Residential Fixed Assets,
By Major Industry Group: 2013
NAICS Industry Total Investment Percent
11 Agriculture, forestry, fishing, and hunting 49,814 2.4%
21 Mining 193,276 9.5%
22 Utilities 109,921 5.4%
23 Construction 40,710 2.0%
31-33 Manufacturing 433,927 21.3%
42 Wholesale trade 89,923 4.4%
44-45 Retail trade 81,781 4.0%
48-49 Transportation and warehousing 92,121 4.5%
51 Information 235,426 11.6%
52 Finance and insurance 156,203 7.7%
53 Real estate and rental and leasing 119,399 5.9%
54 Professional, scientific, and technical services 111,208 5.5%
55 Management of companies and enterprises 45,473 2.2%
56 Administrative and waste management services 41,175 2.0%
61 Educational services 32,956 1.6%
62 Health care and social assistance 119,286 5.9%
71 Arts, entertainment, and recreation 23,464 1.2%
72 Accommodation and food services 33,441 1.6%
81 Other services, except government 28,169 1.4%
Total, All Industries 2,037,673 100.0%
Source: Bureau of Economic Analysis (BEA).
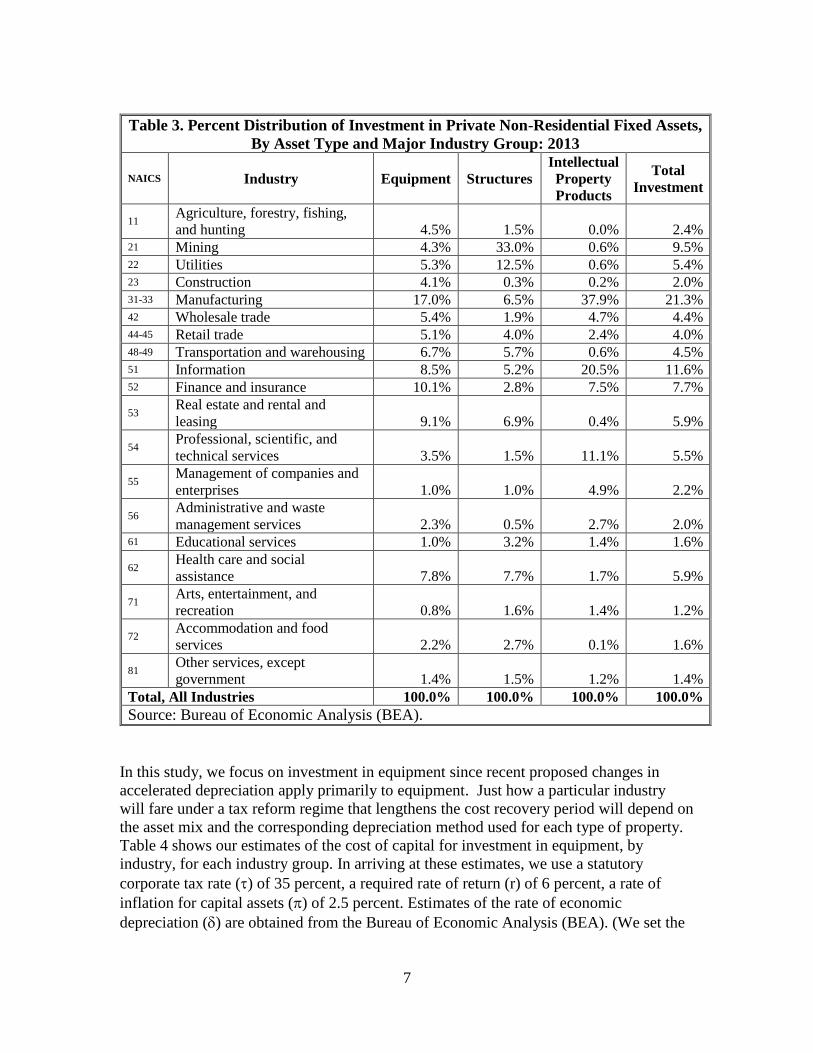
Table 3 below shows the percentage distribution of total investment by industry, across
equipment, structures and intellectual property.
7
Table 3. Percent Distribution of Investment in Private Non-Residential Fixed Assets,
By Asset Type and Major Industry Group: 2013
NAICS Industry Equipment Structures
Intellectual
Property
Products
Total
Investment
11 Agriculture, forestry, fishing,
and hunting 4.5% 1.5% 0.0% 2.4% 21 Mining 4.3% 33.0% 0.6% 9.5% 22 Utilities 5.3% 12.5% 0.6% 5.4% 23 Construction 4.1% 0.3% 0.2% 2.0% 31-33 Manufacturing 17.0% 6.5% 37.9% 21.3% 42 Wholesale trade 5.4% 1.9% 4.7% 4.4% 44-45 Retail trade 5.1% 4.0% 2.4% 4.0% 48-49 Transportation and warehousing 6.7% 5.7% 0.6% 4.5% 51 Information 8.5% 5.2% 20.5% 11.6% 52 Finance and insurance 10.1% 2.8% 7.5% 7.7%
53 Real estate and rental and
leasing 9.1% 6.9% 0.4% 5.9%
54 Professional, scientific, and
technical services 3.5% 1.5% 11.1% 5.5%
55 Management of companies and
enterprises 1.0% 1.0% 4.9% 2.2%
56 Administrative and waste
management services 2.3% 0.5% 2.7% 2.0% 61 Educational services 1.0% 3.2% 1.4% 1.6%
62 Health care and social
assistance 7.8% 7.7% 1.7% 5.9%
71 Arts, entertainment, and
recreation 0.8% 1.6% 1.4% 1.2%
72 Accommodation and food
services 2.2% 2.7% 0.1% 1.6%
81 Other services, except
government 1.4% 1.5% 1.2% 1.4%
Total, All Industries 100.0% 100.0% 100.0% 100.0%
Source: Bureau of Economic Analysis (BEA).
In this study, we focus on investment in equipment since recent proposed changes in
accelerated depreciation apply primarily to equipment. Just how a particular industry
will fare under a tax reform regime that lengthens the cost recovery period will depend on
the asset mix and the corresponding depreciation method used for each type of property.
Table 4 shows our estimates of the cost of capital for investment in equipment, by
industry, for each industry group. In arriving at these estimates, we use a statutory
corporate tax rate () of 35 percent, a required rate of return (r) of 6 percent, a rate of
inflation for capital assets () of 2.5 percent. Estimates of the rate of economic
depreciation () are obtained from the Bureau of Economic Analysis (BEA). (We set the

8
investment tax credit rate (k) to zero as under present law.) A more detailed description
of our model appears in Appendix A.
These figures represent the net cost of capital. We calculate that the average cost of
capital across all industry groups is 4.22 percent.
Table 4. Cost of Capital for Investment in Equipment,
Under Present Law
NAICS Industry Cost of Capital
11 Agriculture, forestry, fishing, and hunting 4.18%
21 Mining 4.08%
22 Utilities 4.29% 23 Construction 3.96%
31-33 Manufacturing 4.06%
42 Wholesale trade 4.16%
44-45 Retail trade 4.22%
48-49 Transportation and warehousing 4.10%
51 Information 4.83% 52 Finance and insurance 4.22% 53 Real estate and rental and leasing 4.11%
54 Professional, scientific, and technical services 4.35%
55 Management of companies and enterprises 4.33%
56 Administrative and waste management services 4.25%
61 Educational services 4.32% 62 Health care and social assistance 4.24% 71 Arts, entertainment, and recreation 4.21%
72 Accommodation and food services 4.12%
81 Other services, except government 4.19%
Total, All Industries 4.22%
Source: Quantria Strategies, LLC
IV. Cost of Capital by Industry Under Repeal of Accelerated
Depreciation for Equipment
In this section we examine how the cost of capital would change under the repeal of
accelerated depreciation (MACRS).8 Table 5 indicates that that change would raise the
industry-wide cost of capital by about 8 percent.
8 We assume that MACRS is replaced with the Alternative Depreciation System (ADS). Generally, ADS
lengthens the recovery period for most assets and eliminates accelerated depreciation.

9
Table 5. Cost of Capital for Investment in Equipment,
With Repeal of MACRS
NAICS Industry
Cost of Capital
After Repeal of
MACRS
Change from
Present Law
11 Agriculture, forestry, fishing, and hunting 4.43% 5.98%
21 Mining 4.53% 11.03%
22 Utilities 4.84% 12.82%
23 Construction 4.14% 4.55% 31-33 Manufacturing 4.51% 11.08%
42 Wholesale trade 4.38% 5.29%
44-45 Retail trade 4.51% 6.87%
48-49 Transportation and warehousing 4.60% 12.20%
51 Information 5.22% 8.07%
52 Finance and insurance 4.50% 6.44%
53 Real estate and rental and leasing 4.35% 5.84% 54 Professional, scientific, and technical services 4.63% 6.44%
55 Management of companies and enterprises 4.62% 6.70%
56 Administrative and waste management services 4.52% 6.35%
61 Educational services 4.55% 5.32%
62 Health care and social assistance 4.45% 4.95%
71 Arts, entertainment, and recreation 4.73% 12.35% 72 Accommodation and food services 4.62% 12.14% 81 Other services, except government 4.71% 12.41%
Total, All Industries 4.56% 8.06% Source: Quantria Strategies, LLC
V. Macroeconomic Effects of Tax Reform on Investment and
Economic Growth
Fundamental tax reform typically includes provisions that increase investment and
maximize economic growth. Maximizing economic growth typically involves reducing
tax rates and increasing cost recovery to increase investment.
Investment plays a crucial role in long-term growth, as a major contributor to our gross
domestic product. The contribution to growth occurs through achieving the optimal level
of capital in the productive economy (e.g. desired capital stock). The capital stock
contributes to economic productivity (through the marginal product of capital). The
theory of investment relies on attaining the desired stock of capital. However, the
demand for capital is the level that maximizes net worth (through productivity of capital).

10
For an investment to be worthwhile, the expected return on capital must exceed the cost
of capital. Given limited capital, business investors must choose between competing
investment opportunities to maximize the return. In other words, the cost of capital must
equal the rate of return that capital could be expected to earn in an alternative investment
of equivalent risk. If the cost of capital increases as a result of changes in tax provisions
(e.g., repeal of MACRS), this will distort the investment decisions that businesses face.
As the user cost of capital increases, this decreases the demand for capital. In other
words, to continue with the same level of investment, businesses would need to get a
higher rate of return to offset this increase. Economic research indicates that business
taxpayers will respond to increases in the user cost of capital by decreasing investment.
Studies conclude that there are significant substitution effects (i.e., elasticities) across
different types of equipment classes that, when included in the analysis, result in
measured elasticities that can be quite large.9
As businesses adjust downward their level of investment in response to the increase in the
user cost of capital (e.g., repeal of MACRS), the capital stock would begin to erode
contributing to lower economic growth and lower output. Increases in cost of capital
resulting from MACRS repeal creates incentives that reduce investment and dampen
future economic growth.
In addition to maximizing economic growth, the objectives of tax reform often include
creating a more efficient and equitable tax system, while maintaining the current level of
tax revenues. Unfortunately, these goals often have negative effects on economic growth
working in opposition to one another.10
The Camp proposal, like most comprehensive tax reform proposals, contains provisions
that reduce the cost of capital, as well as provisions that increase the cost of capital. The
Camp proposal would reduce the corporate rate, which reduces the cost of capital. At
the same time, it repeals MACRS, lengthens the recovery period for research and
experimentation expenses,11 repeals provisions that affect inventory valuation (LIFO),12
and makes other changes that could increase the overall cost of investment.
9 Lui found that, in some cases, the elasticity or behavioral response was above -2.0. In other words, a 1
percent increase in the cost of capital will result in a 2 percent decrease in investment. Hassett and Hubbard
(2002) provide a comprehensive review of the literature on the effect of tax policy on business investment
and conclude “Recent empirical studies appear to have reached a consensus that the elasticity of investment
with respect to the tax-adjusted user cost of capital is between -0.5 and -1.0.” 10 For instance, introducing provisions that maximize economic growth could reduce tax revenues.
Eliminating MACRS would broaden the tax base, but it would increase the cost of capital which would
decrease investment. 11 Research and experimentation expenses by businesses typically are deductible as incurred, like all
business expenses, but research is unusually important to innovation and job creation. The Camp plan
requires businesses to deduct these expenses over a five-year period. This treatment is mitigated slightly by
retaining a modified R&E tax credit. 12 Last-In First-Out (LIFO) accounting for inventories has been a permitted method for inventory
accounting since the 1930s. It prevents business from paying tax on increases in the value of inventories
attributable to inflation.

11
The Camp tax reform proposal sought to correct some of the structural deficiencies in the
current system while remaining budget neutral. However, based on analyses by the
Treasury Department, Joint Committee on Taxation, and others, it did not provide
fundamental tax reform to stimulate economic growth.
In a 2007 study on increasing the competitiveness of U.S. businesses, the Treasury
Department directly addressed the issue of how eliminating accelerated cost recovery
provisions, while lowering the corporate tax rate to 28 percent, might affect overall
economic growth.13 They rely on a multi-sector, macroeconomic model for their analysis
and they conclude:
“… the Treasury Department estimates that the combined
policy of base broadening and lowering the business tax rate to
28 percent might well have little or no effect on the level of
real output in the long run because the economic gain from the
lower corporate tax rate may well be largely offset by the
economic cost of eliminating accelerated depreciation (Office
of Tax Policy (2007), p. 48).”
More recent evidence of the dynamic effect of tax reform is contained in Bull, Dowd and
Moomau (2011) where the authors rely on the macroeconomic model presently used by
the Joint Committee on Taxation to evaluate the dynamic effects of tax law changes.
Specifically, the authors examine a policy scenario that couples a 5-percentage point
reduction in the corporate tax rate with a partial repeal of MACRS. They estimate that the
benefits of the rate cut are offset by the increase in the cost of capital from the repeal of
MACRS. Overall economic growth is substantially unchanged due to the reduction in
incentives to save that are a result of the increased cost of capital.
In 2014, the JCT (Joint Committee on Taxation (2014)) provided its own analysis of the
macroeconomic effects of Chairman Camp’s tax reform plan.14 While their simulations
showed a relatively small increase in gross domestic product (GDP) under the plan over a
10-year horizon, this effect is dominated by the reduction in individual income tax rates
that result in higher consumption.15
The JCT estimates that the combined effect of a lower corporate tax rate and repeal of
MACRS will, over time, result in a capital stock that grows more slowly than under
current law. In fact, much of the economic growth in the early years is because the repeal
of accelerated depreciation does not occur under the plan until the second five years of
13 Their proposal included several other base broadening provisions the largest being the repeal of
MACRS. 14 The Camp plan contained many other proposals that would interact with the corporate tax rate reduction
and repeal of MACRS. In addition, the corporate rate reduction was phased-in over several years and the
depreciable basis of certain property is indexed for inflation. Importantly, the plan also significantly lowers
individual income tax rates. 15 Joint Committee on Taxation (2014), Macroeconomic Analysis of the Tax Reform Act of 2014, JCX-22-
14, February, page 21 (detailed discussion pages 10 – 20).
12
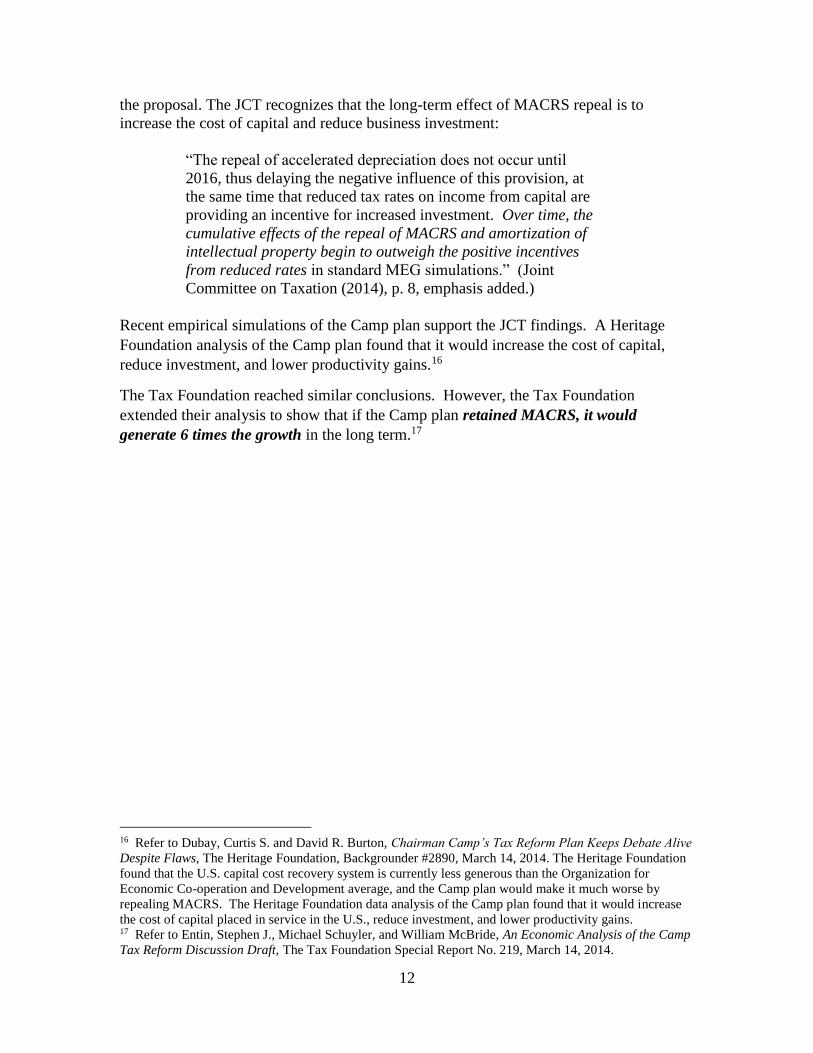
the proposal. The JCT recognizes that the long-term effect of MACRS repeal is to
increase the cost of capital and reduce business investment:
“The repeal of accelerated depreciation does not occur until
2016, thus delaying the negative influence of this provision, at
the same time that reduced tax rates on income from capital are
providing an incentive for increased investment. Over time, the
cumulative effects of the repeal of MACRS and amortization of
intellectual property begin to outweigh the positive incentives
from reduced rates in standard MEG simulations.” (Joint
Committee on Taxation (2014), p. 8, emphasis added.)
Recent empirical simulations of the Camp plan support the JCT findings. A Heritage
Foundation analysis of the Camp plan found that it would increase the cost of capital,
reduce investment, and lower productivity gains.16
The Tax Foundation reached similar conclusions. However, the Tax Foundation
extended their analysis to show that if the Camp plan retained MACRS, it would
generate 6 times the growth in the long term.17
16 Refer to Dubay, Curtis S. and David R. Burton, Chairman Camp’s Tax Reform Plan Keeps Debate Alive
Despite Flaws, The Heritage Foundation, Backgrounder #2890, March 14, 2014. The Heritage Foundation
found that the U.S. capital cost recovery system is currently less generous than the Organization for
Economic Co-operation and Development average, and the Camp plan would make it much worse by
repealing MACRS. The Heritage Foundation data analysis of the Camp plan found that it would increase
the cost of capital placed in service in the U.S., reduce investment, and lower productivity gains. 17 Refer to Entin, Stephen J., Michael Schuyler, and William McBride, An Economic Analysis of the Camp
Tax Reform Discussion Draft, The Tax Foundation Special Report No. 219, March 14, 2014.

13
References
Auerbach, A. J. (2001), “Taxation and Corporate Financial Policy”, National Bureau of
Economic Research (NBER), Working Paper 8203, April.
____________ (2005), “Taxation and Capital Spending”, prepared for the Academic
Consultants Meeting of the Board of Governors of the Federal Reserve System, October.
Brazell, D. W. and J. B. Mackie III (2000), “Depreciation Lives and Methods: Current
Issues in the U.S. Capital Cost Recovery System”, National Tax Journal, Volume 53, No.
3, Part I, pp. 531-562, September.
Bull, N., T. Dowd and P. Moomau (2011), “Corporate Tax Reform: A Macroeconomic
Perspective”, National Tax Journal, 64(4), 923-942.
Cronin, J. A., et al. (2012), “Distributing the Corporate Income Tax: Revised Treasury
Methodology”, Office of Tax Analysis, U. S. Department of Treasury, Technical Paper 5,
May.
Cummins, J. G., K. A. Hassett and R. G. Hubbard (1994), “A Reconsideration of
Investment Behavior Using Tax Reforms as Natural Experiments”, Brookings Papers on
Economic Activity, Volume 2, 1-74.
Dubay, Curtis S. and David R. Burton, Chairman Camp’s Tax Reform Plan Keeps
Debate Alive Despite Flaws, The Heritage Foundation, Backgrounder #2890, March 14,
2014.
Entin, Stephen J., Michael Schuyler, and William McBride, An Economic Analysis of the
Camp Tax Reform Discussion Draft, The Tax Foundation Special Report No. 219, March
14, 2014.
Fazzari, S. M. (1987), “Tax Reform and Investment: How Big An Impact?”, Federal
Reserve Bank of St. Louis, January, 15-27.
Fraumeni, B. M. (1997), “The Measurement of Depreciation in the U.S. National Income
and Product Accounts”, Survey of Current Business, July, 7-23.
Gale, W. G. and P. R. Orszag (2005), “Deficits, Interest Rates and the User Cost of
Capital: A Reconsideration of the Effects of Tax Policy on Investment”, Brookings
Institution, Washington, DC, July.
Hall, R. E. and D. W. Jorgenson (1967), “Tax Policy and Investment Behavior”,
American Economic Review, June, pp. 391-414.
Hassett, K. A. and R. G. Hubbard (1996), “Tax Policy and Investment”, National Bureau
of Economic Research (NBER), Working Paper 5683, July.
14
__________________________ (2001), “Tax Policy and Business Investment”, in
Handbook of Public Economics, Auerbach, A. and M. Feldstein editors.
Internal Revenue Service (2014), “How to Depreciate Property”, U. S. Department of the
Treasury, Publication 946, January.
Joint Committee on Taxation (2014), Macroeconomic Analysis of the Tax Reform Act of
2014, JCX-22-14, February.
Jorgenson, D. W. (1963), “Capital Theory and Investment Behavior”, American
Economic Review, Proceedings, May, 53, 247-59.
Liu, L. (2011), “Do Taxes Distort Corporations’ Investment Choices? Evidence from
Industry Level Data”, mimeo, Centre for Business Taxation, Oxford University.
Mackie, J.B. III (2002), “Unfinished Business of the 1986 Tax Reform Act: An Effective
Tax Rate Analysis of Current Issues in the Taxation of Capital Income, National Tax
Journal, Vol. LV, No. 2, June, 293-337.
Office of Tax Analysis (2014), “Effective Tax Rate Model”, U.S. Department of the
Treasury, July.
Office of Tax Policy (2007), “Approaches to Improve the Competitiveness of the U.S.
Business Tax System for the 21st Century”, U.S. Department of the Treasury, December.

15
Appendix A – Description of the Model and Data
Our starting point for calculating the cost of capital is investment flow data compiled by
the Bureau of Economic Analysis (BEA). The data represent investment in non-
residential fixed assets in 2013, the last year that data are available. The data is
disaggregated into 63 industrial sectors and 96 asset types.
For each industry-asset combination, we assign a depreciation life and depreciation
method based on instructions in IRS Publication 946, How to Depreciate Property. An
estimate of economic depreciation for all 96 asset types and for a limited number of
industries is also obtained from BEA. This results in three 63x96 matrices: (i) investment,
(ii) depreciation method, (iii) depreciation life, and (iv) economic depreciation which
form the basis of our model.
Our estimates rely on the Hall-Jorgenson (1967) user cost of capital formula, Equation
(1) in the text, which we reproduce here:
.
In this formula:
r is the net-of-tax rate of return a company requires to attract investors;
is the inflation rate on capital goods;
is the rate of economic depreciation
is the statutory corporate tax rate;
k is the investment credit rate; and
z is the present value of depreciation deductions.
We assume a 6 percent rate of return (r), an inflation rate () of 2.5 percent, a corporate
tax rate () of 35 percent and a zero investment tax credit (k).18
For each of the more than 6,000 industry-asset combinations, we calculate the present
value of depreciation deductions based on the asset’s depreciation life, depreciation
method and rate of inflation. We use the half-year convention as explained in Publication
946. For assets put in place after 1986, there are three types of depreciation method
available based on the asset type: 200 percent declining balance (200DB), 150 percent
declining balance (150DDB) and straight-line depreciation (SL).
For each industry-asset pair we calculate the cost of capital based on the Hall-Jorgenson
formula. Aggregated figures in the text are weighted by investment dollars for each
category.
18 We calculate the cost of capital net of economic depreciation () for comparison with other studies.
r 1 k z 1

16
Appendix B – Historical Context of Accelerated Cost Recovery
History, as a guide, tells us that accelerated cost recovery has been and remains an
important feature of the tax code. The presence of this feature, on which most investment
relies, is an important aspect of tax planning.
In 1954, the Congress allowed statutorily the use of accelerated depreciation methods.19
Since that time, despite many legislative changes, the presence of accelerated cost
recovery remains a fundamental feature of the tax code.
During the past 60 years, businesses could rely on recovery lives and methods that would
keep pace with their investment needs as well as help to stimulate investment. However,
the biggest impact on capital investment would occur with equipment and intellectual
property asset classes.20
Table 6 – Presence of Accelerated Depreciation in the
Federal Internal Revenue Code
Tax Year Recovery Life
Reference
Method of
Depreciation for
Equipment
Method of
Depreciation for
Structures
1954 – 1961 Bulletin F DDB/SL DDB/SL
1962 – 1970 Guidelines DDB/SL 1.5DB/SL
DDB/SL
1.5DB/SL 1971 – 1980
Asset Depreciation
Range
DDB/SL
DDB/SYD/SL
1981 – 1985 Accelerated Cost
Recovery System 1.5DB/SL 1.75DB/SL
1986 – present Modified Accelerated
Cost Recovery DDB/SL SL
19 Since the inception of the Internal Revenue Code in 1913, taxpayers were given leeway to determine
useful service lives over which to depreciation new investment. However, the need to pay for public works
programs (in 1933 and 1934) encouraged the Treasury to issue guidance on the appropriate service lives
and methods of depreciation. The transition to our modern cost recovery system began in 1942 with the
introduction of capital gains treatment of the sale of depreciable assets. 20 Currently, annual depreciation deductions for structures use the straight-line method and recovery
periods that are somewhat comparable to ADS periods. Therefore, while experiencing a loss of
acceleration with longer recovery periods, the effects will not be as pronounced as the effects on
equipment.
17
These two asset classes make significant contributions to our economic growth and
productivity. Equipment, generally, provides the foundation for productive services like
manufacturing concerns. Intellectual property, generally, provides the foundation for
technological change. Eliminating accelerated methods of cost recovery will increase the
cost of those investments and in many cases, will encourage businesses to delay or defer
investment decisions.
However, the need for accelerated cost recovery is not just important to stimulate
investment. It plays an important role in the decisions to invest in certain assets as well
as the decision making for more capital-intensive industries.