cost estimating methods for rc structures by quantity
TRANSCRIPT

65Journal of Asian Architecture and Building Engineering/January 2015/72
Cost Estimating Methods for RC Structures by Quantity Takeoff and Quantity Prediction in the Design Development Stage
Jaeho Cho1 and Jaeyoul Chun*2
1 Research Professor, Department of Architectural Engineering, Dankook University, Korea2 Professor, Department of Architectural Engineering, Dankook University, Korea
AbstractThe cost estimating methods for reinforced concrete structures based 3D design can be categorized into
quantity takeoff (estimation) and quantity prediction in the design development stage. The main estimating elements are concrete and formwork that can be considered in a quantity takeoff, whereas the quantity prediction element is the reinforcing bars in the design development stage.
This study proposes a cost estimation system that applies automatic quantity takeoff and quantity prediction with parameters. Firstly, the logic of a quantity takeoff calculates the quantity of formwork with the object information. The Standard Method of Measurement (SMM) automatically estimates the quantity of formwork upon receiving physical shape information from the 3D-object. Secondly, the logic of quantity prediction estimates the quantity of reinforcing bars with data mining tools such as the Decision Tree Model (DTM) and Case Based Reasoning (CBR). To predict the quantity of reinforcing bars, Information Gains (IG) of design attributes are evaluated, and then the valid attributes are selected as the parameters. The Parameters can statistically classify the quantity of reinforcing bars by generating decision tree nodes.
Keywords: quantity takeoff; prediction; Information Gain (IG); cost estimating; formwork; reinforcing bars
1. IntroductionThe parametric cost estimating method has been
used in a recent cost prediction study (Son 2005). The cost is estimated by utilizing the design features that can be retrieved in the corresponding design stages. Parametric cost estimating is widely used in the shipbuilding and other industries.
In the case of formwork, the quantity takeoff relies on the level of object information in structural frames. In order to realistically estimate the cost of formwork, additional object modeling has to be conducted on the existing structural frame elements. Otherwise, the quantity of formwork, too, can only be estimated based on statistical evidence, like reinforcing bars. Such approach may ultimately decrease the accuracy of the cost estimation of formwork; it might also generate an inefficient process and additional costs.
In the current state of the art, it is impossible to estimate by using 3D modeling directly, without additional formwork modeling. If object information of the structural frame cannot be used directly to estimate the formwork, the shape information to calculate the
quantity of formwork should be retrieved from the raw structural object.
Therefore, this study proposes a different approach to quantity estimation for the structural frame.
Firstly, to calculate the quantity of formwork, the physical shape information is retrieved based on the raw structural object. And then, the Standard Method of Measurement (SMM) is applied to the objects, based on the concept of the Information Delivery Manual (IDM) with Industry Foundation Classes (IFC).
Secondly, to estimate the quantity of reinforcing bars, a data mining technique is used, because reinforcing bars in 3D modeling cannot be carried out in the design development stage. The design features information is defined as the parameter, and an algorithm for predicting the quantity of reinforcing bars is set with decision trees with these features.
This study sets up a cost estimation system that integrates quantity takeoff logic, prediction logic, and unit price application logic for reinforced concrete structures based on 3D-object design. In this study, some contents of a doctorate thesis written by Cho (2012) are cited and re-analyzed.
2. MethodologyThis study mainly discusses the automatic quantity
takeoff method for formwork and the prediction algorithm for reinforcing bars. The unit price application process after the quantity takeoff can easily calculate costs through the system. Therefore, the unit
*Contact Author: Jaeyoul Chun, Professor, Department of Architectural Engineering, Dankook University, Engineering Building, 301 Yongin-si Gyeonggi-do, 448-701, KoreaTel: +82-31-8005-3736E-mail: [email protected] ( Received April 5, 2014 ; accepted November 14, 2014 )

66 JAABE vol.14 no.1 January 2015 Jaeho Cho
price application logic is omitted in this study.We conduct a literature review on the perspectives
of the two methods of quantity takeoff based on 3D-object and quantity prediction. The cost estimation system is used for a reinforced concrete structure. This study conducts research in accordance with the following Fig.1.
3. Literature ReviewThe existing study investigates from the perspectives
of automatic quantity takeoff and quantity prediction. Firstly, the following is explored from the perspective of automatic quantity takeoff.
Generally, an automatic quantity estimation approach in 3D-object design utilizes the information of the raw object directly without decomposition. In some cases, however, as an indirect way, the physical shape information should be extracted from the raw object, and then applied to the SMM logic to calculate the quantity. Once the quantity takeoff is complete, the cost information is inserted to calculate the final construction cost.
Oh et al. (2001) proposed an automatic estimation system that utilizes 3D CAD building element information. This system uses the raw object of each building element. Kim et al. (2003) proposed an automatic estimation algorithm that can calculate the quantities of concrete and formwork based on the original object information. Hwang (2004) conducted a study on an automatic quantity takeoff system using the raw object based on IFC. However, in the case of quantity takeoff for formwork, he did not provide a definition of the shape information from the raw object. Karshenas (2005) proposed a data-connected schema model based on an object-oriented concept. This model allows users to automatically estimate the relevant equipment, number of workers, and costs, once the quantity of each element has been calculated on the IFC model. Feng and Chen (2008) proposed MD CAD modeling. This model focuses on information delivery method and data reorganization, in order to produce suitable data for other application systems. Jun and Yun (2011) proposed a quantity estimating prototype model using object attributes in
the structural framework. To calculate the quantity of formwork, they proposed estimation logics using the object attributes of beams, slabs and columns. Kim et al. (2012) analyzed a problem with estimation errors in quantity takeoff based on the IFC format in building elements. They recognized a compatibility problem of IFC from the view of quantity takeoff.
It appears from a review of the above literature that physical shape information should be utilized from the raw object, in order to facilitate the quantity takeoff of formwork. Moreover, the required shape information needs to be defined from the raw object to perform a quantity takeoff. Such defined physical shape information should be used on the independent platform of an estimation system. To achieve this goal, an information delivery manual is required to transfer the shape information of the 3D-object into an estimation system.
Secondly, the following study is provided from the perspective of quantity prediction.
T h e p r e l i m i n a r y c o s t e s t i m a t i o n m e t h o d fundamentally starts from a CBR concept that utilizes libraries containing similar cases. The most commonly used estimation method is a statistical method. In the representative case, regression analysis, semi-log, correlation analysis, and probability distribution have been applied. Apart from this, a data mining technique is also applied as an advanced information analysis technique that can resolve the issues with predictions.
Kim et al. (2006) proposed a cost estimation method that uses a neural network using the Genetic Algorithm (GA). The neural network theory is mainly used in data classifications and predictions in data mining. The prediction method that uses a neural network is a combination of a statistical method and a syntactic approach. Doğan (2008) proposed another data mining technique that is called the decision tree model. Ji and Kim (2011) proposed a cost prediction algorithm that combines CBR and GA. Park et al. (2011) proposed a quantity prediction method for the design development stages that uses the standard database for quantities of reinforcing bars. This method allows users to directly connect to case-based data and perform cost estimations, since reinforcing bar objects are not employed in the design development stages.
The neural network consists of an input layer, a hidden layer, and an output layer with artificial neurons. The algori thm classif ies the data by calculating the weight of the connection strength. However, it is very difficult for users to understand the black box algorithm that calculates weight. CBR finds the information that meets the criteria using the same weights. After reviewing the above literature, it seems that CBR can be applied to the decision tree model in order to increase the accuracy of prediction. Applying CBR seems to be a reasonable way to solve the problem of scarcity of data that occurs in the decision tree model.
Fig.1. Flow Chart of the Research Methods

67JAABE vol.14 no.1 January 2015 Jaeho Cho
4. Estimation ItemsThis section analyzes the variations and deviations
of the major quantities of concrete, formwork, and reinforcing bars. Each item is further classified according to their construction type.
The specification of concrete is classified with 25-300-15, 25-270-15, 25-240-15, 25-240-12, 25-180-12, 25-180-8, etc. The specification of form is classified with plywood form (3 recycle), euro-form, circular form, etc.
The indirect cost of the material is classified into the quantity of cast-in-place concrete and the quantity of splicing reinforcing bars. The specification cast-in-place is classified with placing by ready-mix, boom distribution, pump distribution, etc. These items are calculated by applying the fixed rates to the quantities of concrete and reinforcing bars, respectively.
For example , the quant i ty of cas t - in-p lace concrete is typically estimated to be approximately 99% of the quantity of concrete. The quantity of splicing reinforcing bars is typically estimated to be approximately 97% of the total quantity of reinforcing bars. The other extra construction costs account for less than 1.5% of the total cost. Therefore, the final construction cost can be calculated, after all relevant costs have been accumulated, and their ratios have been added.
In examining the deviation of major items in the superstructure of buildings, the graphs in Fig.2. below show the deviation in the quantity of concrete, formwork and reinforcing bars, respectively. The ratio of concrete per 1m2 represents a change of between 0.39 and 0.48 in the quantity. The ratio of formwork per 1m2 demonstrates a change of between 2.2 and 3.4 in the quantity. The ratio of reinforcing bars per 1m3 of concrete illustrates a change of between 0.138 and 0.155. By assuming that the area of upper floors is 10,000m2, the scope of deviation for each quantity can be predicted. The deviation of the quantity of concrete is predicted to be approximately ±900m3, that of formwork around ±12,000m2, and that of reinforcing bars about ±17 ton.
5. Issues and Improvements in Cost EstimationsThis section analyzes some issues with the currently
used cost estimation methods for RC structures involved in a 3D design, and makes suggestions for their improvement. Unlike the conventional quantity takeoff method based on 2D design, a 3D design can automatically calculate quantity takeoff using the raw object, and easily recalculate them, if there is a change in the design. Moreover, as the object modeling approach can prevent overlapping design among elemental objects in advance, it minimizes interference errors. However, a 3D model cannot bring satisfactory results, because object modeling is too complicated. In some cases, an automatic quantity takeoff cannot be adequately performed using the raw object only. In such cases, another approach should be employed.
The volume information retrieved from the raw object is directly utilized for the quantity of concrete. In the case of formwork, however, additional modeling is required, in order to calculate the quantity from the raw object. This approach entails unnecessary work in the design development stage. It would be more beneficial to reorganize the existing object containing physical shape information, and utilize only the required shape information. For example, for formwork, the area of all four sides of a column is needed to estimate the quantity takeoff; whereas for beams, the area of the upper elements is unnecessary.
A quantity takeoff for reinforcing bars might be difficult in the design development stage, due to performance problems with graphic hardware and an immense working load to visualize 3D modeling. Therefore, utilizing the statistical method in the previous cost estimating study seems to be a more realistic and effective approach. After examining quantity takeoff for formwork and reinforcing bars, we decided to utilize a combined estimation method for performing a quantity takeoff. This method can improve the accuracy of cost estimation, and does not require additional modeling work. The combined estimation method should divide the quantity takeoff items and quantity prediction items.
Fig.2. The Deviation of Concrete, Formwork, and Reinforcing Bar

68 JAABE vol.14 no.1 January 2015 Jaeho Cho
Such a method has been used before in other studies. For instance, Son (2005) proposed a way to utilize a combined estimation method in early design stages by distinguishing quantity predictions from quantity takeoff. Table 1. below classifies the quantity takeoff items and quantity prediction items for each work involved in an RC structure construction.
The reinforcing bars cannot be subject to automatic quantity takeoff. Their quantity must be estimated by a prediction algorithm that utilizes the design features information in the corresponding design stage.
6. The Quantity Takeoff of Formwork with IDMThis section proposes a method for quantity takeoff
of formwork based on the IDM approach. Quantity takeoff in an object-oriented model offers a clearer division among objects, hence making an automatic quantity takeoff by linking the length, width, and volume information of the raw object. A quantity takeoff algorithm created by building element has been proposed in other similar studies (Kim et al. 2003). The method proposed in this study is to define the attributes that require the physical shape information from the raw object. The defined information is then delivered to the quantity takeoff logic of an independent estimation system. These attributes are then used to estimate the quantity of the structural element. The IDM description represents the linking system between the original data and other application systems. It applies the relevant defined information within the raw object model to fulfill the requirements of a particular system. Fig.3. below shows the information delivery diagram for Task 1 (the raw object model) and Task 2 (the requirement information) on exchange requests.
The IFC model contains properties needed for the performance, such as building geometry, construction
type, thermal information, and so on (Kim 2012). The IFC model proposed by Seo (2009) allows the sharing and exchanging of information.
The object-oriented models consist of objects and attributes. In the case of columns, the volume is directly expressed as the quantity of concrete. The attribute value consists of the height and cross sectional area of the column.
The quantity of formwork becomes the area of the four sides. The area is expressed as attribute values that consist of the width and the height. The form of the beam consists of the area of two sides, excluding the thickness of the slab on the beam. To calculate the area, the attribute value comprised of the width and height is expressed. The slab quantity does not require additional calculation logic because the area of each floor becomes the quantity of formwork. The total quantity of formwork is calculated by summing up the quantity of each element, such as the foundation, columns, beams, slabs, and retaining walls. And then the construction type of a form can be selected from euro-form, plywood form (3 recycle), and plywood form (4 recycle), etc. Table 2. below defines the required the physical shape information from the raw object based on an IFC model and the SMM.
7. The Quantity Prediction of Reinforcing BarsThis section analyzes the quantities of reinforcing
bars used in 27 public buildings in order to propose
Table 1. Classification of Quantity Prediction and Takeoff in the Design Development Stage
Work Reference Variable Unit Quantity Estimation Approach
Concrete Floor area (m2)
Concrete(m3/m2)
Standard measure of method by building element
Form Floor area (m2)
Formwork (m2/ m2)
Standard measure of method by building element
Re-bars Concrete (m3)
Reinforcing bars (Ton/m3)
Data mining approachby building structure unit
(case library)
Table 2. Description of Objects Based IFC FormatObject Raw Data Name : Value Type
Column
Nominal Length: Ifc Quantity LengthDescription: Total nominal length of the column, not taking into account any cut-out's or other processing features.SMM: Form area of the square column: (width+height)×2× unit height×number of place×repeat storiesform area of circular column: (2×π×width/2×unit height)×number of place×repeat stories
Beam
Nominal Width: Ifc Quantity LengthDescription: Total nominal length of the beam, not taking into account any cut-out's or other processing features.SMM: (beam depth - slab thickness)×2×length×repeat stories
Wall
Nominal Length: Ifc Quantity LengthDescription: Total nominal (or average) length of the wall along the wall path. The exact definition and calculation rules depend on the method of measurement used.Nominal Width: Ifc Quantity LengthDescription: Total nominal (or average) width (or thickness) of the wall perpendicular to the wall path. The exact definition and calculation rules depend on the method of measurement used.Nominal Height: Ifc Quantity LengthDescription: Total nominal (or average) height of the wall along the wall path. The exact definition and calculation rules depend on the method of measurement used.SMM: Core wall: (Wall thickness+length)×2×height×repeat stories retaining wall: (Wall thickness+length)×2×height× repeat stories×(1/2)
Slab
Net Area: Ifc Quantity AreaDescription: Total area of the extruded area of the slab, taking into account possible slab openings. The exact definition and calculation rules depend on the method of measurement used.SMM: Floor area
Fig.3. Information Delivery Model for Quantity Takeoff

69JAABE vol.14 no.1 January 2015 Jaeho Cho
an algorithm for predicting quantity. Table 3. below lists the design features and ratios of reinforcing bars. A data mining technique has been applied as the prediction algorithm.
This study proposes a decision tree model applied with CBR as a hierarchical clustering method, among other data mining techniques. Decision trees are used in categorizing and predicting data. They present interactions between variables in the shape of a tree. The structure of a tree has a root node at the top, a child node, and a leaf node. This hierarchy model of each node is set in accordance with a specific rule. In this case, Class Characterization (CC) or Attribute Relevance Analysis (ARA) is used. If too many attributes are used during the analysis, the resulting presented descriptions could be unstable. This problem could be solved by excluding the attributes that are statistically unrelated or have weaker connections through the ARA, and then applying the most relevant attributes in order.
Another problem with decision trees is that there are too many branches, as all attribute values have been taken into account, in order to categorize the nodes. This can also cause some sparse data problems to the bottom-most nodes. Therefore, the number of branches that are separated through the nodes should be minimized with CBR matching cases, and the mean attribute value of the bottom-most nodes should be used.
To analyze the validity of the attributes, the IG proposed by a Decision Tree Algorithms is used (Han, J. 2001). This method determines the importance of the attributes in accordance with a relative scale in the IG, while excluding the attributes with a small amount of IG. The information gain measure is used to select the test attribute at each node in the tree. The attribute with the highest IG is chosen as the test attribute for the current node.
Let S be a set consisting of s data samples. Suppose the class label attribute has m distinct values defining m distinct classes, Ci (for i = 1, 2, …, m).
Let si be the number of samples of S in class Ci. The Expected Information (EI) needed to classify a given sample is given by the Eq. (1).
Where pi is the probability that an arbitrary sample belongs to class Ci and is estimated by si/s. Note that a log function to the base 2 is used since the information is encoded in bits. Let attribute A have v distinct values, {a1, a2, …, av}. Attribute A can be used to partition S into v subsets, {s1, s2, …, sv}, where Sj contains those samples in S that have value aj of A. If A were selected as the test attribute (i.e., the best attribute for splitting), then these subsets would correspond to the branches grown from the node containing the set S. Let sij be the number of samples of class Ci in a subset Sj. The Entropy, or expected information based on the partitioning into subsets by A, is given by the Eq. (2).
The term acts as the weight of the jth subset and is the number of samples in the subset (i.e., having value aj of A) divided by the total number of samples in S. The smaller the entropy value the greater the purity of the subset partitions. Note that for a given subset Sj, EI (s1j, s2j, …, smj) is following the Eq. (3).
Where p!" =s!"S!
is the probability that a sample in Sj belongs to class Ci.
The encoding information that would be gained by branching on A is the flowing Eq. (4).
Table 3. Design Features Information and Ratio of Reinforcing Bars of BuildingNumber Year of Design Seismic Design Floor Area (m2) Story Column Module (m) Design Load (kg/m2) Exterior Type Ratio of Bars (ton/m3)
1 2001 Yes Great Middle 7~9 500 Stone Masonry High (0.167)2 2001 No Small Low 7~9 300 Stone Masonry Middle (0.143)3 2002 No Small Low 9~12 300 Stone Masonry High (0.147)4 2002 No Middle Low 5~7 300 Stone Masonry Low (0.092)5 2003 No Middle Low 7~9 500 Stone Masonry High (0.156)6 2003 No Middle Low 9~12 300 Stone Masonry High (0.155)7 2003 Yes Middle Middle 7~9 300 Metal Panel Middle (0.131)8 2003 No Middle Low 5~7 300 Stone Masonry Middle (0.139)… … … … … .. … … …23 2010 Yes Small Middle 7~9 300 Stone Masonry Middle (0.143)24 2002 No Small Low 9~12 300 Metal Panel High (0.207)25 2003 No Small Low 9~12 300 Metal Panel High (0.149)26 2003 No Small Low 7~9 500 Stone Masonry High (0.147)27 2004 No Small Low 7~9 500 Stone Masonry High (0.155)
Floor Area (m2): Small (below 4,000), Great (more than 14,000) Story: Low stories (1~4), Middle Stories (5~9), High Stories (10~20) Ratio of Reinforcing Bars: (High: more than 0.145), (Low: below 0.12)
(1)
(2)
(3)
(4)
70 JAABE vol.14 no.1 January 2015 Jaeho Cho
The Eq. (4) computes the IG of each attribute. The attribute with the highest IG is chosen as the test attribute for the given set S. A node is created and labeled with the attribute, branches are created for each value of the attribute, and the samples are portioned accordingly.
The data of 27 public office buildings is used to analyze relevant cases. The expected amount of the IG required to classify the given samples can be calculated, in accordance with the following Eq. (1).
EI (s1, s2, s3) = -(15/27)×LOG ((15/27), 3)-(9/27)×LOG (9/27), 3)-
(3/27) ×LOG ((3/27), 3) = 0.853
The attributes of class labels take three attribute values (High, Medium, and Low) for the ratios of reinforcing bars. To compute the IG of each attribute, the Eq. (1) is first used to compute the EI that classifies a given sample. Next, the Entropy of each attribute, E (A) should be computed with the Eq. (2).
Using the Eq. (4), the IG (A) that will classify the given sample, if the samples are partitioned according to 'column module', is:
IG (Column Module) = EI (s1, s2, s3) – E (Column Module) = 0.853 - 0.463 = 0.39
Similarly, we can compute IG (Design Load) = 0.10, IG (Floors Type) = 0.04, IG (Seismic Design) = 0.03,
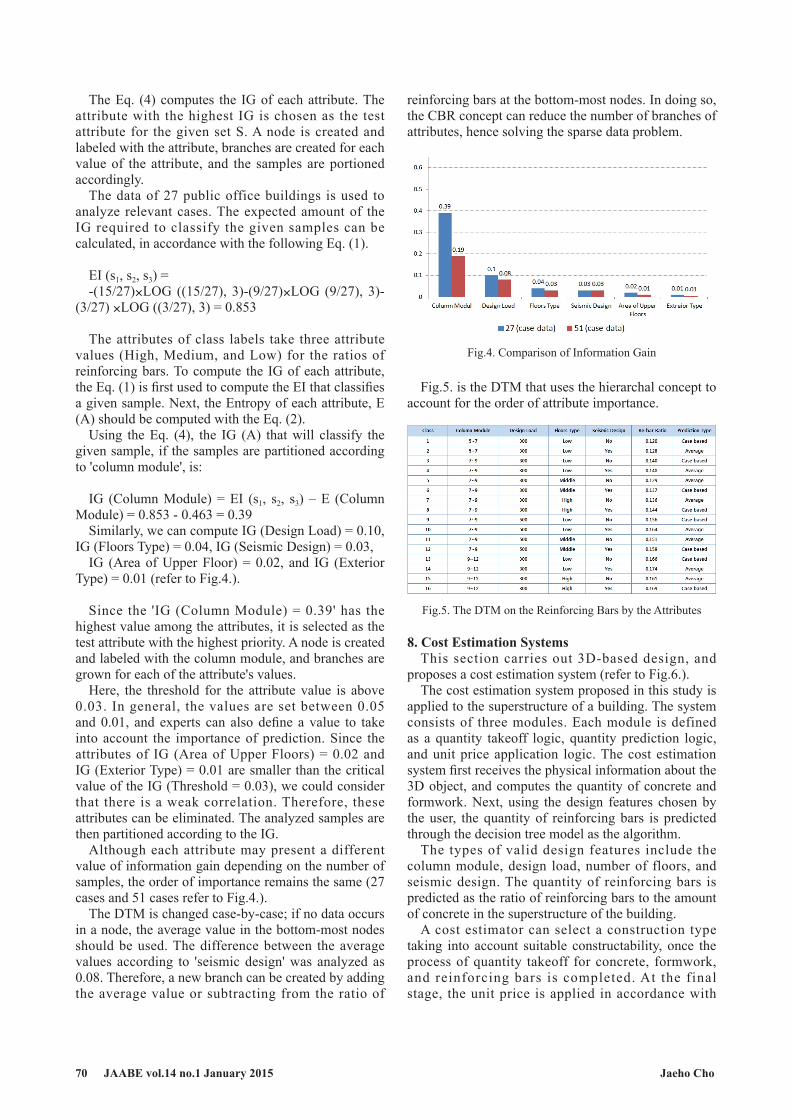
IG (Area of Upper Floor) = 0.02, and IG (Exterior Type) = 0.01 (refer to Fig.4.).
Since the 'IG (Column Module) = 0.39' has the highest value among the attributes, it is selected as the test attribute with the highest priority. A node is created and labeled with the column module, and branches are grown for each of the attribute's values.
Here, the threshold for the attribute value is above 0.03. In general, the values are set between 0.05 and 0.01, and experts can also define a value to take into account the importance of prediction. Since the attributes of IG (Area of Upper Floors) = 0.02 and IG (Exterior Type) = 0.01 are smaller than the critical value of the IG (Threshold = 0.03), we could consider that there is a weak correlation. Therefore, these attributes can be eliminated. The analyzed samples are then partitioned according to the IG.
Although each attribute may present a different value of information gain depending on the number of samples, the order of importance remains the same (27 cases and 51 cases refer to Fig.4.).
The DTM is changed case-by-case; if no data occurs in a node, the average value in the bottom-most nodes should be used. The difference between the average values according to 'seismic design' was analyzed as 0.08. Therefore, a new branch can be created by adding the average value or subtracting from the ratio of
reinforcing bars at the bottom-most nodes. In doing so, the CBR concept can reduce the number of branches of attributes, hence solving the sparse data problem.
Fig.5. is the DTM that uses the hierarchal concept to account for the order of attribute importance.
8. Cost Estimation SystemsThis section carries out 3D-based design, and
proposes a cost estimation system (refer to Fig.6.).The cost estimation system proposed in this study is
applied to the superstructure of a building. The system consists of three modules. Each module is defined as a quantity takeoff logic, quantity prediction logic, and unit price application logic. The cost estimation system first receives the physical information about the 3D object, and computes the quantity of concrete and formwork. Next, using the design features chosen by the user, the quantity of reinforcing bars is predicted through the decision tree model as the algorithm.
The types of valid design features include the column module, design load, number of floors, and seismic design. The quantity of reinforcing bars is predicted as the ratio of reinforcing bars to the amount of concrete in the superstructure of the building.
A cost estimator can select a construction type taking into account suitable constructability, once the process of quantity takeoff for concrete, formwork, and reinforcing bars is completed. At the final stage, the unit price is applied in accordance with
Fig.4. Comparison of Information Gain
Fig.5. The DTM on the Reinforcing Bars by the Attributes

71JAABE vol.14 no.1 January 2015 Jaeho Cho
the construction type, in order to calculate the final construction cost. The unit price applies to concrete, formwork, cast-in-place, and splicing reinforcing bars. The following process outlines the six-stages that the system goes through.
(1) 3D object model of the structure frame in the design development stage.
(2) The quantity takeoff for concrete and formwork used with the SMM by the building structure element.
(3) Prediction of the reinforcing bars quantity in the superstructure of a building.
(4) Calculate subtotals for the quantity of major elements and minor construction works in the intermediate estimating stage.
(5) Apply the unit price of each construction work and calculate subtotal for RC construction work.
(6) Calculate the other extra construction costs, and then set the final cost.
Fig.6. 3D Object Modeling for the RC Structure, Stage (1)
Fig.7. Quantity Take-off (Column), Stage (2)
Fig.8. Quantity Take-off (Beam), Stage (2)
Fig.9. Select Construction Type, Stage (2)
Fig.10. Prediction of Reinforcing Bars, Stage (3)

72 JAABE vol.14 no.1 January 2015 Jaeho Cho
9. ConclusionThis study proposes combined estimation method
for RC structure buildings and a cost estimation system based on 3D design in the design development stage. The methods of cost estimating can be classified into automatic quantity takeoff and quantity prediction. This classification is determined by the detail level of the 3D object in the design development stage.
The system is comprised of three modules. These are the quantity takeoff logic (quantities of concrete and formwork), quantity prediction logic (quantity of reinforcing bars), and unit price application logic. We confirmed that an estimation method that combines quantity takeoff and quantity prediction could improve the accuracy of cost estimation. Receiving only the pre-defined physical shape information from the raw object can permit the system to perform quantity takeoff for formwork.
Such automatic quantity takeoff is made possible by receiving the required length and width information to estimate the surface area of elements.
The quantity of reinforcing bars is predicted through the use of the features information of design as the parameters. The prediction model uses the DTM and CBR. The DTM evaluates information gains, and defines valid attributes, such as floors type, column module, design load, and seismic design as the parameters. The method for predicting the quantity of reinforcing bars proposed in this study is a 'data mining prototype,' and we prove its usefulness.
In future studies, we need to develop an application program that will directly connect with the required physical shape information within the Ifc.xml format, in order to make a completely automated quantity takeoff. Also, we need a parametric quantity estimation method that can be used for a Steel Reinforced Concrete (SRC) structure building.
AcknowledgementsThis research was supported by the National
Research Foundation of Korea (NRF) (No. NRF-2012R1A1A2043186).
References1) Cha, H.S. and Shin, K.Y. (2011) Predicting Project Cost Performance
Level by Assessing Risk Factors of Building Construction in South Korea, Journal of Asian Architecture and Building Engineering, 10 (2), pp.437-444.
2) Cho, J.H. and Chun, J.Y. (2011) Application of OLAP Information Model to Parametric Cost Estimate and BIM. Journal of Asian Architecture and Building Engineering, 10 (2), pp.319-326.
3) Cho, J.H. (2012) Parametric Cost Estimating Methods for Reinforced Concrete Structures Using Data Mining Technique in Design Development Stage, Dankook University. D.T.
4) Doğan, S.Z., Arditi, D., and Günaydin H.M. (2006) Determining Attribute Weights in a CBR Model for Early Cost Prediction of Structural Systems. Journal of Construction Engineering and Management, 132 (10), pp.1092-1098.
5) Doğan, S.Z., Arditi, D., and Günaydin H.M. (2008) Using Decision Trees for Determining Attribute Weights in a Case-Based Model of Early Cost Prediction. Journal of Construction Engineering and Management, 134 (2), pp.146-152.
6) Feng, C.W. and Chen, Y.J. (2008) Applying MD CAD Model to Streamline Information Transformation for Construction Project Planning. AEI 2008: Building Integration Solutions.
7) Han, J. (2001) Data Mining Concepts and Techniques. Morgan Kaufmann Publishers.
8) Hwang, Y.S. (2004) Automatic Quantity Take-off from Drawing through IFC Model. Architectural Institute of Korea, 20 (12), pp.89-98.
9) Ji, S.H., Park, M.S., Lee, H.S., Ahn J.S., Kim, N.H, and Son, B.S (2011) Military Facility Cost Estimation System Using Case-Based Reasoning in Korea. Journal of Computing in Civil Engineering. 25 (3), pp.218-231.
10) Jun, K.H. and Yun, S.H. (2011) The Case Study of BIM-based Quantity Takeoff for Concrete and Formwork, Korea Institute of Building Information Modeling, 1 (1), pp.13-18.
11) Karshenas, S. (2005) Cost Estimating in the Age of 3-D CAD Software and Object Databases, Construction Research Congress 2005, pp.1-8.
12) Kim, G.H., An, S.H., and Cho, H.K. (2006) Comparison of the Accuracy between Cost Prediction Models based on Neural Network and Genetic Algorithm. Architectural Institute of Korea, 22 (3), pp.111-119.
13) Kim, I.H., Kim, J.U., and Seo, J.C. (2012) Development of an IFC-based IDF Converter for Supporting Energy Performance Assessment in the Early Design Phase, Journal of Asian Architecture and Building Engineering, 11 (2), pp.313-320.
14) Kim, S. (2012) Interval Estimation of Construction Cost Using Case-Based Reasoning and Genetic Algorithms, Journal of Asian Architecture and Building Engineering, 11(2), pp.327-334.
15) Kim, T.H., Hong, C.G., and Kim, S.K. (2003) Algorithm for the Reinforced Concrete Framework Materials Take-off. Korea Institute of Construction Engineering and Management, 4 (1), pp.114-122.
16) Kim, Y.J., Kim, S.A., and Chin, S.Y. (2012) A Study of BIM based estimation Modeling Data Reliability Improvement, Korea Institute of Construction Engineering and Management, 13 (3), pp.43-56.
17) Lee, K.S., Kim, H.M., Lee, T.H., and Han, S.W. (2012) A Selection Methodology of Slab-form Construction Methods in Residential Buildings based on the Simulation and Delphi Techniques, Journal of Asian Architecture and Building Engineering, 11 (1) pp.39-46.
18) Oberlender, G.D. and Trost, S.M. (2001) Predicting Accuracy of Early Cost Estimates Based on Estimate Quality, Journal of Construction Engineering and Management. 127 (3), pp.173-182.
19) Oh, S.W., Sung, B.J. , Kim, Y.S. , and Kim, J .R. (2001) The Development of an Automated Cost Estimating System Using 3D CAD Building Element Information, Architectural Institute of Korea, 17 (6), pp.103-113.
20) Park, Y.J., Won, S.K., Han, C.H., and Lee, J.B. (2011) A Study on 3D BIM Collaborative Approximate Estimating Model of Structural Work for Apartment Projects, 27 (6), pp.123-131.
21) Seo, J.C. and Kim, I.H. (2009) Industry Foundation Classes-Based Approach for Managing and Using the Design Model and Planning Information in the Architectural Design, Journal of Asian Architecture and Building Engineering, 8(2), pp.431-438.
22) Son, B.S. (2005), Schematic Cost Estimating Model based on Quantity Variation by Influence Variables in Building Projects, Ph.D. thesis, Seoul National University.
23) Song, S.Y., Koo, B.K., and Lee, S.J. (2010) Cost Efficiency Analysis of Design Variables for Energy-efficient Apartment Complexes, Journal of Asian Architecture and Building Engineering, 9 (2), pp.515-522.
24) Stoy, C., Pollalis, S., and Schalcher, H.R. (2008) Drivers for Cost Estimating in Early Design: Case Study of Residential Construction. Journal of Construction Engineering and Management, 134 (1), pp.32-39.
Fig.11. Apply the Unit Price of Construction Work, Stage (4)~(6)