cost-effectiveness of varenicline, bupropion and … · propion is nok 78 880 per life year gained,...
TRANSCRIPT

Background: Smoking is an important risk factor for several diseases, including
different cancers, lung diseases and cardiovascular diseases. About 21% of the
Norwegian population are daily smokers. In Norway, two prescription drugs are
available for use in smoking cessation; varenicline (Champix ® or Chantix ®) and
bupropion (Zyban ®). In addition, several options for nicotine replacement the-
rapy (NRT) are available, such as nicotine-gum, patches and lozenges. • We were
commissioned to evaluate the cost-effectiveness of drugs for smoking cessation
in a Norwegian setting. The economic evaluation will inform a revised treat-
ment guideline for smoking cessation in primary care. Method: We preformed
a model based economic evaluation of nicotine replacement therapy (NRT), bu-
propion and varenicline for smoking cessation. The drugs were compared to pla-
cebo and to each other. Results: When NRT, bupropion and varenicline are each
compared to placebo, they will respectively yield 0.02, 0.09 and 0.14 additional
life years, at an additional cost of respectively NOK 4 141, NOK 5 729 and NOK
9 672. The net health benefi t (NHB) of nicotine replacement therapy
Cost-effectiveness of varenicline, bupropion and nicotine replace-ment therapy for smoking cessation Report from Kunnskapssenteret (Norwegian Knowledge Centre for the Health Services)
No 10–2010
Health economic evaluation
(continued)
Norwegian Knowledge Centre for the Health Services (Kunnskapssenteret)
PO Box 7004, St. Olavs plass
N-0130 Oslo
(+47) 23 25 50 00
www.kunnskapssenteret.no
Report: ISBN 978-82-8121-341-8 ISSN 1890-1298
no 10–2010
(NRT), bupropion and varenicline compared to placebo then be-
comes respectively 0.012, 0.079 and 0.121. Compared to bupropion, varenicline
gives 0.05 additional life years at an additional cost of 3 944. The incremental
cost-effectiveness ratio of varenicline compared to bupropion is NOK 78 880 per
life year gained, giving a net health benefi t of 0.042 life years. • In the scenario
analysis on alternative cost input, all treatments are more effective and cost
saving (dominant) compared to placebo. Varenicline yields the highest health
gains and the largest savings. • The sensitivity analyses indicate that the con-
clusions are robust. Conclusion: Nicotine replacement therapy (NRT), bupropion
and varenicline can all be considered cost-effective compared to placebo. When
the drugs are evaluated relative to each other, varenicline is the most cost-ef-
fective alternative.
(continued from page one)

1 Key messages
Title Cost-effectiveness of varenicline, bupropion and nicotine replacement
therapy for smoking cessation.
Norwegian title Kostnadseffektiviteten av vareniklin, bupropion og
nikotinerstatningspreparater for røykelsutt.
Institution Norwegian Knowledge Centre for the Health Services
(Nasjonalt kunnskapssenter for helsetjenesten)
John-Arne Røttingen, Director
Authors Hagen, Gunhild , Health Economist (project manager)
Wisløff, Torbjørn, Researcher
Klemp, Marianne, Research director
ISBN 978-82-8121-341-8
ISSN 1890-1298
Report nr 10 - 2010
Project number 535
Type of report Health economic evaluation
No. of pages 48
Client Directorate of Health (Helsedirektoratet)
Keywords Cost-effectiveness, economic evaluation, smoking cessation, varenicline,
bupropion, nicotine repacement therapy, NRT, Champix, Chantix,
Zyban, nicotine gum, nicotine patch, økonomisk evaluering, røykeslutt,
røyking, røyk, vareniklin, bupropion, nikotinerstatninspreparater,
nikotintyggegummi, nikotinplaster, kostnadseffektivitet.
Citation Hagen G, Wisløff T, Klemp M. Cost-effectiveness of varenicline,
bupropion and nicotine replacement therapy for smoking cessation.
Report nr 10-2010. Oslo: Norwegian Knowledge Centre for the Health
Services, 2010.
Norwegian Knowledge Centre for the Health Services summarizes and disseminates evidence
concerning the effect of treatments, methods, and interventions in health services, in
addition to monitoring health service quality. Our goal is to support good decision making in
order to provide patients in Norway with the best possible care. The Centre is organized
under The Directorate for Health, but is scientifically and professionally independent. The
Centre has no authority to develop health policy or responsibility to implement policies.
Norwegian Knowledge Centre for the Health Services assumes final responsibility for the
content of this report.
Norwegian Knowledge Centre for the Health Services
Oslo, May 2010
2 Key messages
Key messages
Background
Smoking is an important risk factor for several diseases, including different cancers,
lung diseases and cardiovascular diseases. About 21% of the Norwegian population
are daily smokers.
Interventions for smoking cessation are normally divided into counselling and drug
treatment support. In Norway, two prescription drugs are available for use in smok-
ing cessation; varenicline (Champix ® or Chantix ®) and bupropion (Zyban ®). In
addition, several options for nicotine replacement therapy are available, such as
nicotine-gum, patches and lozenges.
Commission
We were commissioned to evaluate the cost-effectiveness of drugs for smoking ces-
sation in a Norwegian setting. The economic evaluation will inform the revised
treatment guideline for smoking cessation in primary care.
Main findings
• Compared to no treatment, nicotine replacement therapy, bupropion and
varenicline can all be considered cost-effective.
• When the drugs are evaluated relative to each other, varenicline is the most
cost-effective alternative.

3 Executive summary
Executive summary
BACKGROUND
Smoking is an important risk factor for several diseases, including different cancers,
lung diseases and cardiovascular diseases. About 21% of the Norwegian population
are daily smokers. Interventions for smoking cessation are normally divided into
counselling and drug treatment support. In Norway, two prescription drugs are
available for use in smoking cessation; varenicline (Champix ® or Chantix ®) and
bupropion (Zyban ®). In addition, several options for nicotine replacement therapy
(NRT) are available, such as nicotine-gum, patches and lozenges. These do not re-
quire a prescription from a doctor.
We were commissioned to evaluate the cost-effectiveness of drugs for smoking ces-
sation in a Norwegian setting. The economic evaluation will inform a revised treat-
ment guideline for smoking cessation in primary care.
METHOD
We preformed a model based economic evaluation of nicotine replacement therapy
(NRT), bupropion and varenicline for smoking cessation. The drugs were compared
to placebo and to each other.
We constructed a Markov model with the health states “smoker”, “smoke free more
than five years (ex smoker)”, “smoke free less than five years (quitter)”, “resumed
smoking less than five years ago” and “dead”. A Markov model follows a hypothetical
cohort of patients over time, in our model we followed the individuals from a vari-
able age at treatment initiation and until they all were dead or 100 years old. In the
first year of the model, the individuals received treatment with NRT, bupropion or
varenicline or they received no treatment. The efficacies of the treatments were col-
lected from our systematic review of the literature. The model calculated the life
years gained and the costs associated with pharmacological treatments for smoking
cessation.
4 Executive summary
RESULTS
The baseline results presented in this part are for a 50 years old male. Sensitivity
analyses indicate that smoking cessation is slightly more cost-effective for men than
for women and for younger compared to older people, but the differences are so
small that conclusions will not be affected.
When NRT, bupropion and varenicline are each compared to placebo, they will re-
spectively yield 0.02, 0.09 and 0.14 additional life years, at an additional cost of re-
spectively NOK 4 141, NOK 5 729 and NOK 9 672. The net health benefit (NHB) of
nicotine replacement therapy (NRT), bupropion and varenicline compared to pla-
cebo then becomes respectively 0.012, 0.079 and 0.121.
All treatments have a positive net health benefit and can be considered cost-effective
compared to placebo assuming a Norwegian threshold value of NOK 500 000 per
life year gained. NRT is however extendedly dominated by bupropion, as the incre-
mental cost-effectiveness ratio (ICER) for NRT is higher than the ICER for bu-
propion, the second most effective alternative. The implication of this is that if the
NRT alternative were to be chosen, effectiveness would be bought at a higher mar-
ginal cost than necessary.
When several treatment options are available and they are mutually exclusive,
treatments should be compared to the next more effective option. We therefore or-
dered the treatments according to increasing effectiveness and recalculated the in-
cremental costs and effects. Since NRT was excluded based on extended dominance,
bupropion was compared to no treatment and varenicline to bupropion. Compared
to bupropion, varenicline gives 0.05 additional life years at an additional cost of
3 944. The incremental cost-effectiveness ratio of varenicline compared to bu-
propion is NOK 78 880 per life year gained, giving a net health benefit of 0.042 life
years. When the drugs are evaluated relative to each other, varenicline is the most
cost-effective option.
The one-way sensitivity analyses indicate that the base case results are most sensi-
tive to changes in age at treatment initiation, the price of varenicline, average health
care expenses per person per year and choice of discount rate. None of the changes
in the parameters will bring the ICER above the assumed willingness to pay per life
year of NOK 500 000.
In the probabilistic sensitivity analysis, varenicline was the optimal choice in terms
of cost-effectiveness as long as the willingness to pay per life year gained was above
NOK 116 000. If the willingness to pay was between NOK 100 000 and NOK
116 000, bupropion was optimal. If the willingness to pay was less than NOK
100 000 per life year gained, none of the treatments could be considered cost-
effective.

5 Executive summary
In the base case we assumed that smokers and ex-smokers had the same annual
health care costs and that health care costs were constant across age. This may not
be a valid assumption. We therefore constructed a scenario analysis based on Danish
data where smokers had higher annual health care costs than the ex-smokers and
where annual health care costs varied with age. In the scenario analysis all treatment
options were dominant, i.e. more effective and less expensive than no treatment.
Treatment with varenicline gave the highest health gains in terms of life years and
also the largest savings.
The analysis on perfect information on parameters indicated that perfect informa-
tion on the input parameters would not reduce the uncertainty in the decision, given
the assumed willingness to pay of NOK 500 000 per life year gained.
DISCUSSION
All models are simplifications of reality; hence, there is uncertainty associated with
the results. Some of the uncertainty is related to the model input, i.e. the parameter
estimates used. Our model input has been gathered from a range of sources and they
may not on their own represent true values for a Norwegian population in a real-life
setting. We have however conducted a range of sensitivity analyses on these parame-
ters and the conclusions appear robust to realistic changes in these values.
Another aspect of uncertainty is connected to the model structure. This model was
structured to capture the life years gained from smoking cessation. The model there-
fore only contains the health states necessary to capture costs and health effects of
being either dead or alive. In reality however, smoking will increase the risk of a va-
riety of diseases, most notably different cancers, lung diseases and cardiovascular
diseases. These diseases can lead to large reductions in health related quality of life.
It is therefore possible that we are underestimating the cost-effectiveness of these
drugs.
The published economic evaluations we have identified come to the same conclusion
as we have. Some of the studies do, however, find that varenicline is dominant
(higher health gains and lower costs) compared to bupropion. In our base case
analyses, varenicline have higher health gains, but do not have lower costs than bu-
propion. In our scenario analysis where smokers are more expensive than ex-
smokers, we do however find that varenicline is dominant compared to bupropion.
6 Executive summary
CONCLUSION
Nicotine replacement therapy (NRT), bupropion and varenicline can be considered
cost-effective compared to placebo. When the drugs are evaluated relative to each
other, varenicline is the most cost-effective alternative.
Norwegian Knowledge Centre for the Health Services summarizes and disseminates
evidence concerning the effect of treatments, methods, and interventions in health
services, in addition to monitoring health service quality. Our goal is to support good
decision making in order to provide patients in Norway with the best possible care.
The Centre is organized under The Directorate for Health, but is scientifically and
professionally independent. The Centre has no authority to develop health policy or
responsibility to implement policies.
Norwegian Knowledge Centre for the Health Services
PB 7004 St. Olavs plass
N-0130 Oslo, Norway
Telephone: +47 23 25 50 00
E-mail: [email protected]
Full report (pdf): www.kunnskapssenteret.no
7 Hovedfunn
Hovedfunn
Bakgrunn
Røyking er en sterk risikofaktor for en rekke sykdommer, blant annet ulike typer
kreft, lungesykdommer og hjerte- og karsykdommer. I Norge er det ca 21 % av be-
folkningen som røyker daglig. Tiltak for røykeslutt deles vanligvis inn i veiledning og
medikamentell støttebehandling. I Norge finnes det to reseptpliktige legemidler til
bruk ved røykeslutt, vareniklin (Champix® eller Chantix®) og bupropion (Zy-
ban®). I tillegg finnes det flere nikotinerstatningspreparater, som tyggegummi,
plaster og sugetabletter.
Oppdrag
Helsedirektoratet har bedt oss om å vurdere kostnadseffektiviteten av legemidler til
røykeslutt under norske forhold. Den økonomiske evalueringen er tenkt brukt som
en del av dokumentasjonsgrunnlaget for nye nasjonale faglige retningslinjer for røy-
keavvenning i primærhelsetjenesten.
Hovedfunn
• Sammenlignet med ingen behandling kan både nikotinerstatningspreparater,
bupropion og vareniklin ansees som kostnadseffektive.
• Når legemidlene sammenlignes med hverandre, kommer vareniklin ut som det
mest kostnadseffektive alternativet.

8 Sammendrag
Sammendrag
BAKGRUNN
Røyking er en risikofaktor for en rekke sykdommer, blant annet kreft, lungesyk-
dommer og hjerte- og karsykdommer. I Norge røyker ca 21 % av befolkningen dag-
lig. Tiltak for røykeslutt deles vanligvis inn i veiledning og medikamentell støttebe-
handling. I Norge finnes det to reseptpliktige legemidler til bruk ved røykeslutt, va-
reniklin (Champix® eller Chantix®) og bupropion (Zyban®). I tillegg finnes det en
rekke nikotinerstatningspreparater (NEP) i form av tyggegummi, sugetabletter, sub-
lingvaltabletter, plaster og inhalator som ikke er reseptbelagt.
På oppdrag fra Helsedirektoratet har vi vurdert kostnadseffektiviteten av legemidler
til røykeslutt. Rapporten er tenkt brukt som en del av dokumentasjonsgrunnlaget for
nye faglige retningslinjer for røykeavvenning i primærhelsetjenesten.
METODE
Vi utførte en modellbasert økonomisk evaluering av legemidler til røykeslutt. Lege-
midlene som ble evaluert var vareniklin, bupropion og nikotinerstatningspreparater
(NEP). Legemidlene ble sammenlignet med ingen behandling og med hverandre.
Vi utviklet en Markov-modell med helsetilstandene ”røyker”, ”røykfri i mer enn fem
år (eksrøyker)”, ”røykfri mindre enn fem år”, ”begynt å røyke igjen for mindre enn
fem år siden” og ”død”. En Markov-modell følger en tenkt kohort over tid, i vår mo-
dell fulgte vi individene fra en tenkt startalder og til alle personene var enten døde
eller hundre år gamle. I første år av modellen mottok individene behandling med
vareniklin, bupropion, nikotinerstatningspreparater eller ingen behandling. Effekter
av behandlingene som gikk inn i modellen ble hentet fra vår systematiske kunn-
skapsoppsummering (1).
Modellen beregner leveårsgevinsten og kostnadene ved å gi medikamentell støtte til
røykeslutt.
9 Sammendrag
RESULTATER
Resultatene presentert under er for en mann på 50 år. Sensitivitetsanalysene indike-
rer at røykeslutt er noe mer kostnadseffektivt for menn enn for kvinner og for yngre
sammenlignet med eldre, men forskjellene er så små at konklusjonene ikke påvirkes.
Sammenlignet med ingen behandling gir nikotinerstatningspreparater, bupropion
og vareniklin henholdsvis 0,02, 0,09 og 0,14 ekstra leveår per person til en mer-
kostnad på henholdsvis kr 4 141, 5 729 og 9 672. Netto helsenytte av henholdsvis ni-
kotinerstatningspreparater, bupropion og vareniklin blir da 0,012, 0,079 og 0,121.
Sammenlignet med ingen behandling, kan alle intervensjonene ansees som kost-
nadseffektive ettersom de gir en positiv netto helsenytte, gitt at vi antar at samfun-
nets betalingsvilje per leveår er kr 500 000. Nikotinerstatningspreparatene blir
imidlertid eksternt dominert av bupropion, hvilket vil si at man ved å velge nikotin-
erstatning vil kjøpe ekstra leveår til en høyere merkostnad enn nødvendig, nikotin-
erstatningspreparater bør derfor ekskluderes fra videre analyse av kostnadseffektivi-
tet.
Når flere alternativer er tilgjengelige og de er gjensidig utelukkende, bør legemidlene
sammenlignes med hverandre og ikke med ingen behandling. Vi rangerte derfor le-
gemidlene etter økende effekt og rekalkulerte mereffektene og merkostnadene. Si-
den nikotinerstatningspreparatene ble ekskludert, ble bupropion sammenlignet med
ingen behandling og vareniklin sammenlignet med bupropion. Sammenlignet med
bupropion vil vareniklin gi 0,05 ekstra leveår til en merkostnad på kr 3 944, dette gir
en inkrementell kostnad-effekt brøk på 78 880 kr per leveår og en netto helsenytte
på 0,042 leveår. Vareniklin ble det mest kostnadseffektive alternativet når legemid-
lene ble sammenlignet med hverandre.
En-veis sensitivitetsanalysene indikerte at base case resultatene var mest følsomme
for endringer i intervensjonsalder, prisen av vareniklin, gjennomsnittlig årlig helse-
kostnad per innbygger og valg av diskonteringsrate. Å endre disse parametrene en
og en, ga ikke tilstrekkelig utslag på kostnad-effektbrøken til at denne kom over den
antatte grensen på NOK 500 000 per leveår.
I den probabilistiske (stokastiske) sensitivitetsanalysen, ble vareniklin det optimale
i form av kostnadseffektivitet så lenge betalingsviljen per leveår var høyere enn kr
116 000. For en betalingsvilje mellom kr 100 000 og kr 116 000 var bupropion det
optimale valget. Dersom betalingsviljen per leveår var mindre enn kr 100 000, var
ingen av legemidlene kostnadseffektive sammenlignet med ingen behandling.
I hovedanalysen antok vi at røykerne og eksrøykerne hadde like store årlige helse-
kostnader. Dette er sannsynligvis ikke en realistisk forutsetning. Vi utførte derfor en
senarioanalyse basert på danske data, hvor røykerne hadde høyere årlige helsekost-
10 Sammendrag
nader enn eks-røykerne og hvor de årlige helsekostnadene varierte med alder. I det-
te scenarioet ble alle behandlingene mer effektive og kostnadsbesparende sammen-
lignet med ingen behandling. Behandling med vareniklin ga størst gevinst i form av
leveår og førte også til de største besparelsene.
Analysen på verdien av videre forskning indikerte at perfekt informasjon på para-
metrene i modellen ikke ville minke usikkerheten i beslutningen hvis vi antar en be-
talingsvilje per leveår på kr 500 000.
Sensitivitetsanalysene indikerer at konklusjonene er robuste.
DISKUSJON
Alle modeller er forenklinger av virkeligheten og det er derfor usikkerhet knyttet til
resultatene. Usikkerheten er delvis knyttet til modellstrukturen og delvis til verdien
av de ulike modellparametrene. De ulike parameterverdiene brukt i denne analysen
kommer fra en rekke kilder og er ikke nødvendigvis representative for norsk praksis.
Vi har imidlertid utført en rekke sensitivitetsanalyser for å kvantifisere effekten av
usikkerheten i modellparametrene og konklusjonene synes robuste.
Et annet aspekt av usikkerhet er forbundet med modellstrukturen. Denne modellen
ble bygd for å fange opp leveårsgevinsten ved røykeslutt. Modellen inneholder derfor
kun de helsetilstandene som er nødvendige for å fange opp kostnader og helseeffek-
ter av å være levende eller død. I virkeligheten vil røyking øke risikoen for en rekke
sykdommer, først og fremst ulike krefttyper, lungesykdommer og kardiovaskulære
sykdommer. Disse sykdommene kan føre til store tap i helserelatert livskvalitet. Det
er derfor mulig at vi i hovedanalysen har underestimert kostnadseffektiviteten av
disse legemidlene.
Andre publiserte økonomiske evalueringer vi har identifisert har den samme konk-
lusjon som vi finner i vår analyse. Noen av studiene finner imidlertid at vareniklin er
dominant (gir større helsegevinster og lavere kostnader) sammenlignet med bupro-
pion. Dette er resultatet vi også kommer til i scenarioanalysen når vi lar røykerne
pådra seg større kostnader i sine leveår enn eks-røykerne.
KONKLUSJON
Både nikotinerstatningspreparater, bupropion og vareniklin ansees som kostnadsef-
fektive sammenlignet med ingen behandling. Når legemidlene sammenlignes med
hverandre, kommer vareniklin ut som det mest kostnadseffektive alternativet.

11 Table of contents
Table of contents
KEY MESSAGES 2 Background 2 Commission 2 Main findings 2
EXECUTIVE SUMMARY 3 Background 3 Method 3 Results 4 Discussion 5 Conclusion 6
HOVEDFUNN 7 Bakgrunn 7 Oppdrag 7 Hovedfunn 7
SAMMENDRAG 8 Bakgrunn 8 Metode 8 Resultater 9 Diskusjon 10 Konklusjon 10
TABLE OF CONTENTS 11
GLOSSARY 13
PREFACE 15
OBJECTIVE 16
BACKGROUND 17 Prevalence 17 Health and economic costs of smoking 18 Pharmacological treatment options 18 Introduction to the methods of Economic evaluation 18 Economic evaluation and priority setting 21
12 Table of contents
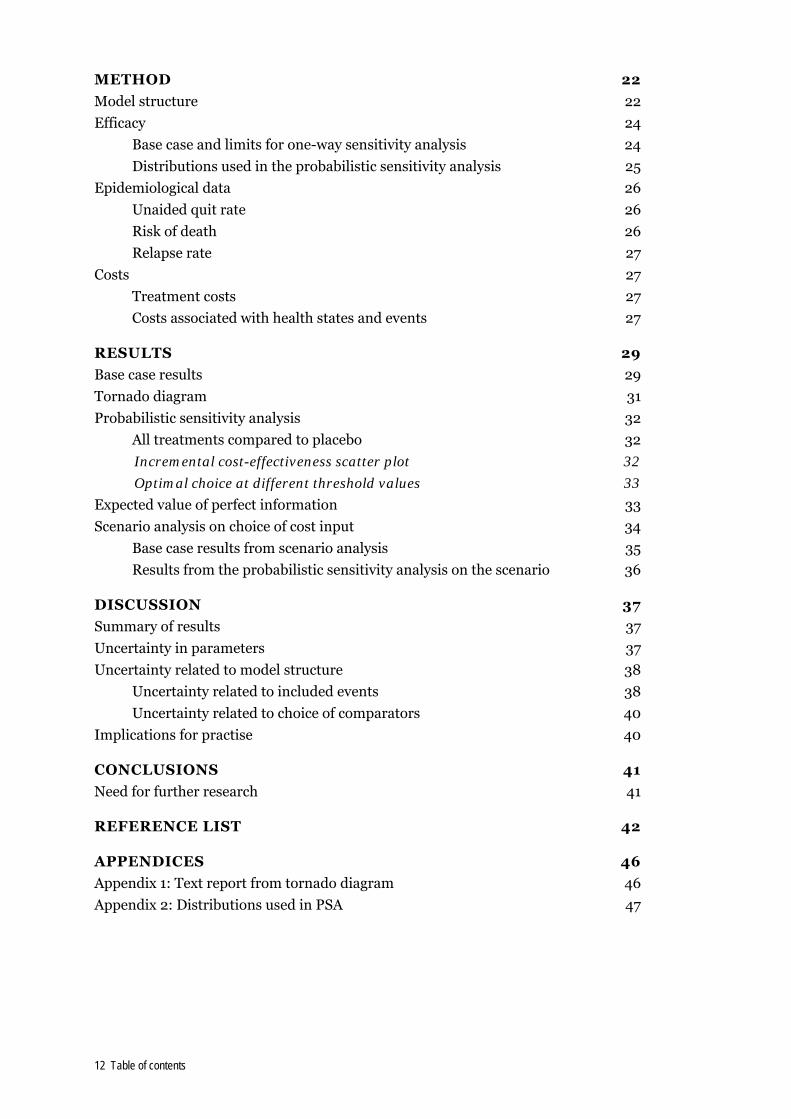
METHOD 22 Model structure 22 Efficacy 24
Base case and limits for one-way sensitivity analysis 24 Distributions used in the probabilistic sensitivity analysis 25
Epidemiological data 26 Unaided quit rate 26 Risk of death 26 Relapse rate 27
Costs 27 Treatment costs 27 Costs associated with health states and events 27
RESULTS 29 Base case results 29 Tornado diagram 31 Probabilistic sensitivity analysis 32
All treatments compared to placebo 32 Incremental cost-effectiveness scatter plot 32 Optimal choice at different threshold values 33
Expected value of perfect information 33 Scenario analysis on choice of cost input 34
Base case results from scenario analysis 35 Results from the probabilistic sensitivity analysis on the scenario 36
DISCUSSION 37 Summary of results 37 Uncertainty in parameters 37 Uncertainty related to model structure 38
Uncertainty related to included events 38 Uncertainty related to choice of comparators 40
Implications for practise 40
CONCLUSIONS 41 Need for further research 41
REFERENCE LIST 42
APPENDICES 46 Appendix 1: Text report from tornado diagram 46 Appendix 2: Distributions used in PSA 47

13 Glossary
Glossary
Term Explanation
One-way sensitivity analysis A change in one model parameter from a
lower to an upper value and the effect of
the change on the ICER (i.e. estimated
upper and lower ICER based on the up-
per and lower parameter value).
ICER The incremental cost-effectiveness ratio,
i.e. the difference in costs between two
strategies divided by the difference in
health effects (often life years or quality
adjusted life years).
ICER= ΔC/ ΔE
Willingness to pay
(WTP)/threshold value/λ
Societal willingness to pay per unit of ef-
fectiveness, for example per life year or
quality adjusted life year.
Assumed to be maximum NOK 500 000
per life year or quality adjusted life year
in Norway.
NHB Net health benefit.
NHB=ΔE-(ΔC/ λ)
A treatment is considered cost-effective if
it yields a positive net health benefit.
Tornado diagram Visual representation of a series of one-
way sensitivity analyses. Presents a num-
ber of bars, each representing the change
in the ICER based on the change in one
14 Glossary
parameter. The bars are ordered accord-
ing the impact the change in the parame-
ter has on the estimated ICER.
Indicates which parameters the ICER is
most sensitive to changes in. Often pre-
sented with a horizontal line which
represents either the estimated ICER or
the threshold value for the ICER.
The tornado diagram is very sensitive to
the upper and lower value chosen for
each parameter.
Probabilistic sensitivity analysis
(PSA)
A stochastic sensitivity analysis. Each pa-
rameter is assigned a probability distri-
bution instead of one fixed number.
A Monte Carlo simulation with n-number
of draws (often 10 000) is performed
based on the input distributions and the
ICER recalculated n-number of times.
Often presented in the form of an ICE
scatter plot.
Incremental cost-effectiveness scat-
ter plot
A graphical representation of different
simulated ICERs (from a Monte Carlo
simulation) on the cost-effectiveness
plane.
15 Preface
Preface
The Norwegian Knowledge Centre for the Health Services was commissioned by the
Directorate of Health to evaluate the cost-effectiveness of drugs for smoking cessa-
tion in the Norwegian setting. The drugs were to be compared to placebo and to each
other. The economic evaluation will inform the revision of the current treatment
guideline for smoking cessation in primary care.
The project team has consisted of:
• Gunhild Hagen (project manager), Kunnskapssenteret
• Torbjørn Wisløff, , Kunnskapssenteret
We would like to thank our external peer reviewers Ivar Sønbø Kristiansen and
Bjarne Robberstad and our internal peer reviewer Espen Movik.
The aim of this report is to make decisions in health care more well-informed and to
contribute to improved quality of services. The evidence should be considered to-
gether with other relevant factors, such as clinical experience and patient prefer-
ences.
Gro Jamtvedt
Excecutive Director
Marianne Klemp
Research Director
Gunhild Hagen
Health Economist
Project Manager
16 Objective
Objective
The objective of this report was to evaluate the cost-effectiveness of varenicline, bu-
propion and nicotine replacement therapy for smoking cessation in the Norwegian
setting.
17 Background
Background
PREVALENCE
The prevalence of daily smoking in Norway has been decreasing over the last few
years. Data from 2008 indicate that approximately 21% of the Norwegian popula-
tion report to be daily smokers. An additional, 9-10% report that they smoke occa-
sionally (2). The percentage of reported daily smokers varies with age and gender.
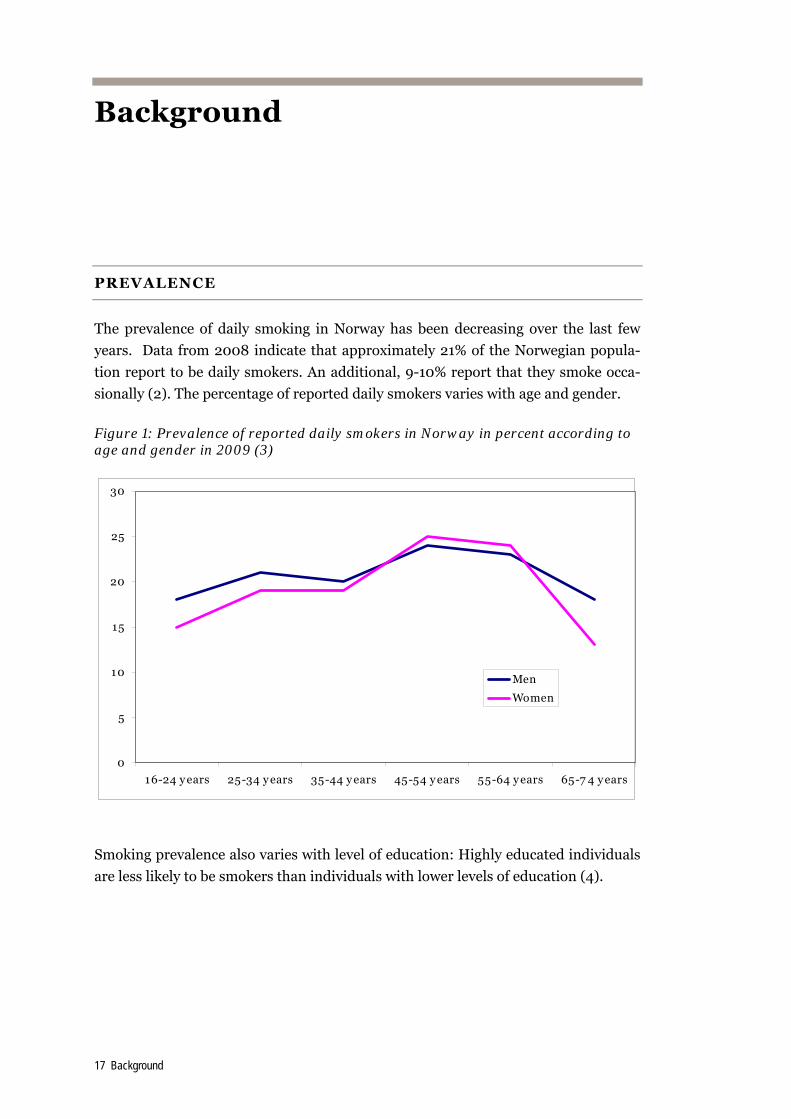
Figure 1: Prevalence of reported daily smokers in Norway in percent according to age and gender in 2009 (3)
0
5
10
15
20
25
30
16-24 y ears 25-34 y ears 35-44 y ears 45-54 y ears 55-64 y ears 65-7 4 y ears
Men
Women
Smoking prevalence also varies with level of education: Highly educated individuals
are less likely to be smokers than individuals with lower levels of education (4).
18 Background
HEALTH AND ECONOMIC COSTS OF SMOKING
Smoking is an important risk factor for a variety of diseases, most notably different
forms of cancer, lung diseases and cardiovascular diseases (5). The Norwegian Insti-
tute of Public Health has estimated that smoking is responsible for 26% of deaths
among women between 40 and 70 years of age. The corresponding number for men
is 40 % (5). A report from the Swedish institute of Public Health estimates that
smoking cost the Swedish society SEK 8 267 million in 2001 (6). This figure com-
prises costs of health care as well as costs related to loss of production.
PHARMACOLOGICAL TREATMENT OPTIONS
There are two prescription drugs on the Norwegian market approved for smoking
cessation; bupropion and varenicline. In addition, several different formulations of
nicotine replacement therapy (NRT) are available, among them transdermal nico-
tine patch, gum, lozenges and vapour inhaler.
Details on the different treatment options can be found in our review of the efficacy
and safety of drugs for smoking cessation (1).
INTRODUCTION TO THE METHODS OF ECONOMIC EVALUA-
TION
An economic evaluation is a comparison of the costs and health effects of different
treatment options, the results of which are often represented in the form of an in-
cremental cost-effectiveness ratio (ICER). The incremental cost-effectiveness can be
regarded as the cost per unit of health, and is calculated as the ratio of the difference
in costs between two options over the difference in effectiveness.
EC
EffectEffectCostCost
ICERΔΔ
=−
−=
comparatoroninterventi
comparatoroninterventi
A treatment is considered cost-effective if the ICER is below a threshold value, or in
common language, if the cost per unit of health (e.g. a life year or quality adjusted
life year) is lower than the societal willingness to pay (λ).
λ<ΔΔ
EC
19 Background
Alternatively the ICER and societal willingness to pay can be presented in the form
of net health benefits (NHB). A treatment is considered cost-effective if it yields a
positive net health benefit.
0: >Δ
−ΔλCENHB
Economic evaluations are often based on decision models (such as decision trees,
Markov models etc) that calculates the results of the analysis from input parameters
in the model. There are always uncertainties related to the values of these parame-
ters, making sensitivity analyses an important feature of any economic evaluation
that uses decision models as framework. In short, sensitivity analysis illustrates how
much the results vary when model parameters are being changed.
Parameters can be changed one at a time, in a one-way sensitivity analysis. The
ICER is then recalculated using an upper and lower value for the given parameter.
The upper and lower value can be taken from the upper and lower end of a 95% con-
fidence interval or by increasing and decreasing the value by a percentage. A series
of one-way sensitivity analyses can be presented in a tornado diagram. A tornado
diagram is a graphical representation of a series of one-way sensitivity analyses, pre-
sented as a series of bars. The bars are ordered according to the impact the variable
change has on the estimated ICER. A tornado diagram can indicate which parame-
ters the ICER is most sensitive to changes in. The result of a tornado diagram is very
sensitive to the upper and lower value chosen.
In a probabilistic sensitivity analysis (PSA) the uncertain parameters in the model
are represented by distributions and not fixed values. As opposed to one way sensi-
tivity analysis (like the tornado diagram), all parameters are changed at the same
time in a PSA. In Monte Carlo simulations, the computer draws values for each pa-
rameter and runs the model for each set of parameters. This is typically done 1 000
or 10 000 times, depending on the number of parameters. The results of these
Monte Carlo simulations can be used to calculate the probability of which of the in-
terventions that are cost-effective, if a willingness-to-pay (WTP) is given.
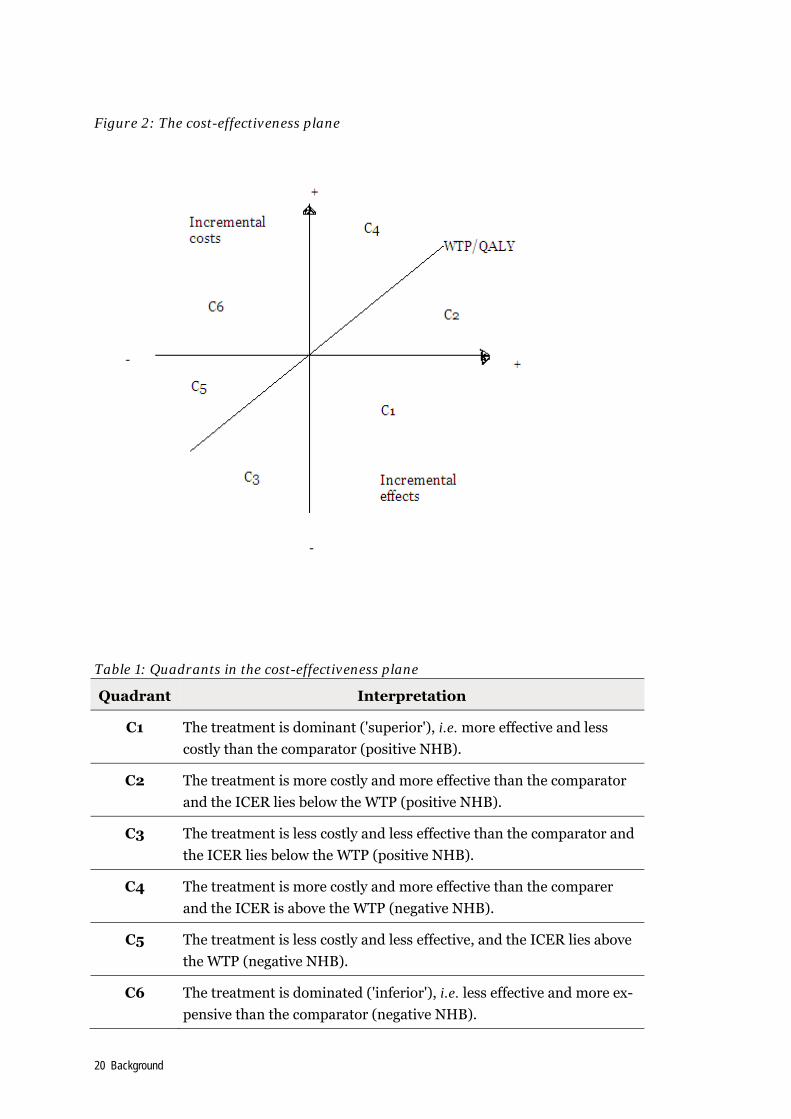
For each draw, the ICER can be recalculated and plotted on the cost-effectiveness
plane, c.f. Figure 2. ICERs in quadrant 1-3 are considered cost-effective. The sum of
percentages of ICERs in quadrant 1-3 is the probability that a treatment is cost-
effective given the assumed willingness to pay.
20 Background
Figure 2: The cost-effectiveness plane
Table 1: Quadrants in the cost-effectiveness plane
Quadrant Interpretation
C1 The treatment is dominant ('superior'), i.e. more effective and less
costly than the comparator (positive NHB).
C2 The treatment is more costly and more effective than the comparator
and the ICER lies below the WTP (positive NHB).
C3 The treatment is less costly and less effective than the comparator and
the ICER lies below the WTP (positive NHB).
C4 The treatment is more costly and more effective than the comparer
and the ICER is above the WTP (negative NHB).
C5 The treatment is less costly and less effective, and the ICER lies above
the WTP (negative NHB).
C6 The treatment is dominated ('inferior'), i.e. less effective and more ex-
pensive than the comparator (negative NHB).

21 Background
ECONOMIC EVALUATION AND PRIORITY SETTING
According to Norwegian policy documents (7-11), a treatment should be prioritised if
the following criteria are met:
1. The disease is severe; A disease is considered severe to the degree that it
causes pain and discomfort, loss of physical, psychological and social func-
tion and if it limits the individual in his or her daily activities. Severity is also
evaluated according to the risk increase the disease entails in terms of death,
disability and discomfort, if treatment is postponed.
2. The treatment is effective; the patient should be expected to benefit from
treatment in terms of longevity or improved quality of life of certain dura-
tion. The treatment effectiveness should also be well documented.
3. The treatment is cost-effective; the added costs of the treatment should be
reasonable compared to the added benefits.
The policy documents mentioned above give no guidance as to what constitutes
a”reasonable” relationship between costs and effectiveness. The Directorate of
Health however, has recently recommended a preliminary estimate of NOK 500 000
per statistical life year in full health (12;13). However, there exists no academic con-
sensus regarding this threshold value, nor has it been subject to a political process,
and it can therefore be regarded as nothing more than a tentative suggestion.

22 Method
Method
MODEL STRUCTURE
In order to assess the cost-effectiveness of drugs for smoking cessation a Markov
model was developed in TreeAge Pro ® 2009. The model structure is illustrated in
Figure 3.
Figure 3: Model structure
DieDead
StaySmoker
QuitQuitter (temporary state)
Smoker
SmokeSmoker
DieDead
StayResumer (temporary state)
QuitQuitter (temporary state)
Resumer (temporary state)
Ex smokerEx smoker
DieDead
StayQuitter (temporary state)
RelapseResumer (temporary state)
Quitter (temporary state)
DieDead
StayEx smoker
RelapseResumer (temporary state)
Ex smoker
Dead
1
Varenicline
BupropionClone 1: Smoking cessation
NRTClone 1: Smoking cessation
No treatmentClone 1: Smoking cessation
Smoking cessation
A Markov model is basically a way of simulating a population cohort over time. The
model is structured to capture the costs and life years gained associated with smok-
ing cessation and contains three regular health states;” Smoker”, “Ex smoker”
(smoke free more than five years) and “Dead” and two temporary health states; “Re-
23 Method
sumer” (relapsed less than five years ago) and “Quitter” (smoke free less than five
years).
We have included temporary states (“tunnel states”) in order to be able to differen-
tiate the risk of death for people who have recently stopped smoking (“Quitters”)
and people who have been smoke free for a longer period of time (“Ex smokers”). We
also wanted to be able to differentiate between people who had recently relapsed
(“Resumers”) and people who could be considered “Smokers” again.
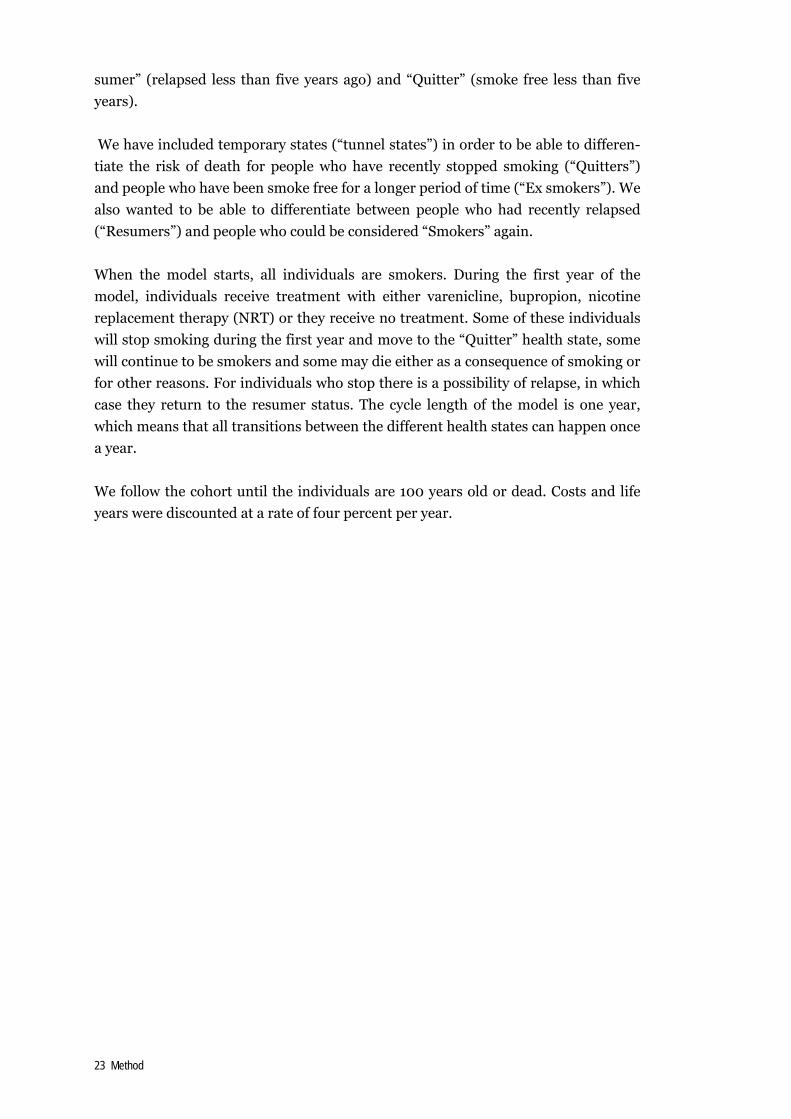
When the model starts, all individuals are smokers. During the first year of the
model, individuals receive treatment with either varenicline, bupropion, nicotine
replacement therapy (NRT) or they receive no treatment. Some of these individuals
will stop smoking during the first year and move to the “Quitter” health state, some
will continue to be smokers and some may die either as a consequence of smoking or
for other reasons. For individuals who stop there is a possibility of relapse, in which
case they return to the resumer status. The cycle length of the model is one year,
which means that all transitions between the different health states can happen once
a year.
We follow the cohort until the individuals are 100 years old or dead. Costs and life
years were discounted at a rate of four percent per year.

24 Method
EFFICACY
Efficacy estimates were taken from our systematic review of the literature (1). We
used estimates of efficacy compared to placebo and relative to the other treatments.
Before calculating the relative estimates, we ordered the interventions according to
increasing efficacy relative to placebo and then compared each treatment with the
next most effective option, i.e. NRT to placebo, bupropion to NRT and varenicline to
bupropion.
Base case and limits for one-way sensitivity analysis
In the base case calculations we used the point estimates for efficacy shown in Table
2 and 3. For the one-way sensitivity analysis, the limits of the 95% confidence inter-
val were used.
Table 2:Efficacy estimates vs. placebo (1)
Treatment
Efficacy vs. placebo
in relative risks
(RR)
GRADE Outcome
NRT vs. placebo 1.58
(1.50-1.66)
Moderate Abstinent at 6-12
months
Bupropion vs.
placebo
1.69
(1.53-1.85)
Moderate Abstinent at 6 +
months
Varenicline vs.
placebo
2.33
(1.95-2.80)
High Continuous abstinence
at 24 or more weeks
Table 3: Efficacy estimates relative to the next more effective option (1)
Treatment Efficacy in relative
risks (RR)
GRADE Outcome
NRT vs.
placebo
1.58
(1.50-1.66)
Moderate Abstinent at 6-12
months
Bupropion vs.
NRT
1.45
(0.50-4.18)
Very low Continuous abstinence
at 52 weeks
Varenicline vs.
bupropion
1.46
(1.18-1.81)
High Continuous abstinence
at 52 weeks
25 Method
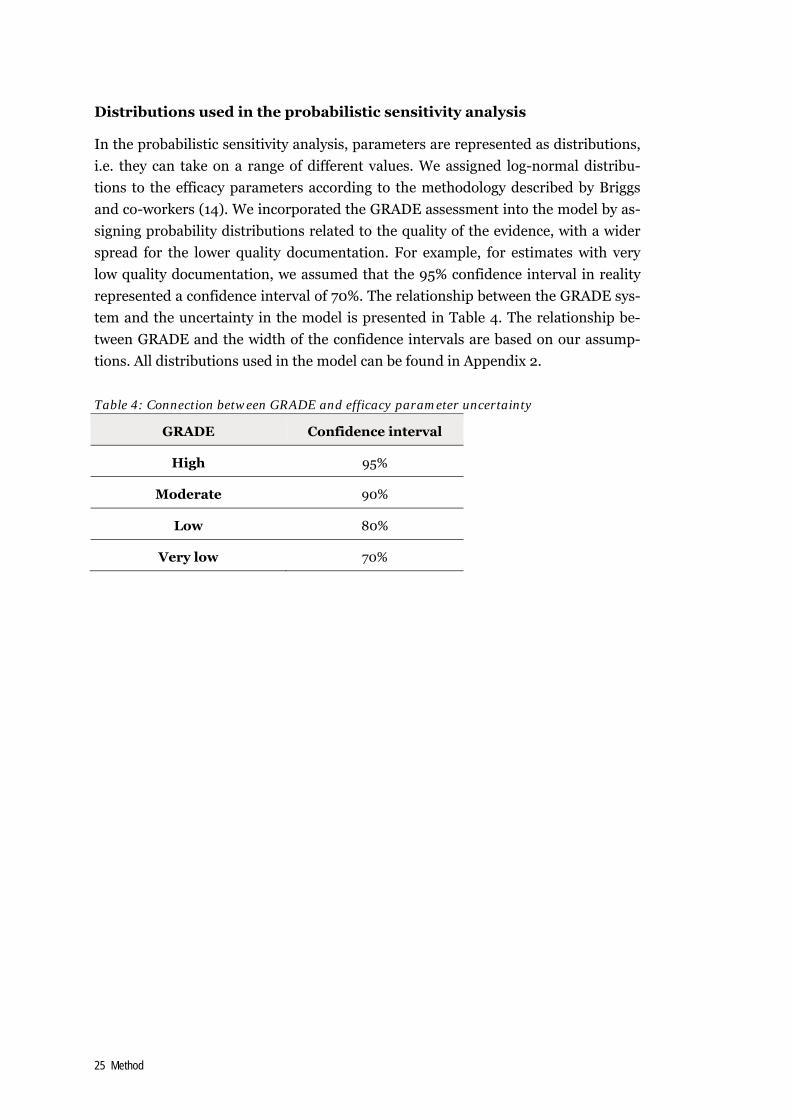
Distributions used in the probabilistic sensitivity analysis
In the probabilistic sensitivity analysis, parameters are represented as distributions,
i.e. they can take on a range of different values. We assigned log-normal distribu-
tions to the efficacy parameters according to the methodology described by Briggs
and co-workers (14). We incorporated the GRADE assessment into the model by as-
signing probability distributions related to the quality of the evidence, with a wider
spread for the lower quality documentation. For example, for estimates with very
low quality documentation, we assumed that the 95% confidence interval in reality
represented a confidence interval of 70%. The relationship between the GRADE sys-
tem and the uncertainty in the model is presented in Table 4. The relationship be-
tween GRADE and the width of the confidence intervals are based on our assump-
tions. All distributions used in the model can be found in Appendix 2.
Table 4: Connection between GRADE and efficacy parameter uncertainty
GRADE Confidence interval
High 95%
Moderate 90%
Low 80%
Very low 70%

26 Method
EPIDEMIOLOGICAL DATA
In order to calculate the transition probabilities between the different health states
epidemiological data is needed.
Unaided quit rate
The efficacy estimates described above are applied to the probability of smoking ces-
sation without intervention (unaided quit rate). Based on a study by Hughes et al.
(15), we set this unaided quit rate to five percent per year. This means that five per-
cent will quit during a year, but they are however later exposed to a risk of relapsing,
so the five percent will not necessarily stay smoke free.
As the smokers in our model are only treated in the first year of the model, their
probability of cessation in years after the intervention year is assumed to be equal to
this unaided quit rate, regardless of what treatment they received.
Risk of death
For transitions to the “Dead” health state, we collected age and gender specific mor-
tality tables from Statistics Norway (16). To these tables we multiplied the relative
hazard ratios (HR) from a recently published study (17), shown in Table 5. The haz-
ard rates used are adjusted for age, systolic blood pressure, total serum cholesterol,
serum triglycerides, physical activity, body mass index, height, and whether or not
the patient is on disability pension, sickness leave or has a family history of coronary
heart disease.
Table 5: Relative hazards of death (17)
Relative hazard of dying for
Norwegian women
Relative hazard of dying for
Norwegian men
Non-smokers 1.00 1.00
Smokers 2.49 (2.29-2.71) 2.61 (2.40-2.85)
Resumers 1.40 (1.08-1.81) 1.59 (1.32-1.91)
Quitters 1.64 (1.38-1.95) 1.39 (1.23-1.58)
Ex-smokers 1.06 (0.90-1.26) 1.07 (0.96-1.19)
In our model, quitters will first gain the full effect of smoking cessation after five
years, i.e. women will have a relative hazard of dying of 1.64 for the first five years
after smoking cessation and in later years a hazard ratio of 1.06 if they stay smoke
free. Resumers have a hazard ratio of 1.40 (women) for the first five years after con-
tinuation and a hazard ratio of 2.49 if they keep on smoking (17).

27 Method
Relapse rate
As the efficacy estimates are based on intention to treat (ITT), we have not modelled
any additional relapse rate in the first year after treatment initiation. Relapse rate at
twelve months and onwards was taken from a study by Hughes and co-workers (18)
and set to ten percent per year.
COSTS
Treatment costs
Drug costs are based on maximum pharmacy retail prices, costs per treated patient
is shown in Table 6. We have assumed that patients treated with varenicline or bu-
propion will visit their general practitioner (GP) once in order to get a prescription.
Visits to a GP were costed using the 2009 GP tariff (19). As nicotine replacement
therapy is available in a range of different formulations and over-the-counter/non-
prescription prices are not regulated, pricing this intervention is difficult. For treat-
ment with nicotine replacement therapy (NRT) we assumed that the treatment
would last for three months, as recommended by the current treatment guideline for
smoking cessation in primary care (20). We also used their estimate of the price of
NRT per day of NOK 35.
Table 6: Treatment costs
Treatment
costs per pa-
tient (NOK)
Assumptions made Source
Varenicline 2 456 One GP visit
Treated for 105 days
(19;21;22)
Bupropion 1 103
One GP visit
Treated for 56 days
(19;23;24)
NRT 3 150
Cost of NOK 35 per day.
Treated for 90 days.
(20)
Costs associated with health states and events
All individuals followed in the model will incur health care costs as long as they live.
This annual cost is assumed to be the average health care expenses per person in
Norway, NOK 45 544 (25). We have assumed that the average annual health care
cost is the same for smokers and for ex-smokers. This may not be the case; it is pos-
sible that smokes have a higher annual health care cost than ex-smokers. We explore
this alternative further in the scenario analysis were we take the costs from a Danish
study.

28 Method
In their last year of life all persons will incur a higher cost, a cost of dying. In our
model, this cost component is taken from a Swedish study (26). Adjusted to 2009
NOK, this cost mounts to 73 306.
29 Results
Results
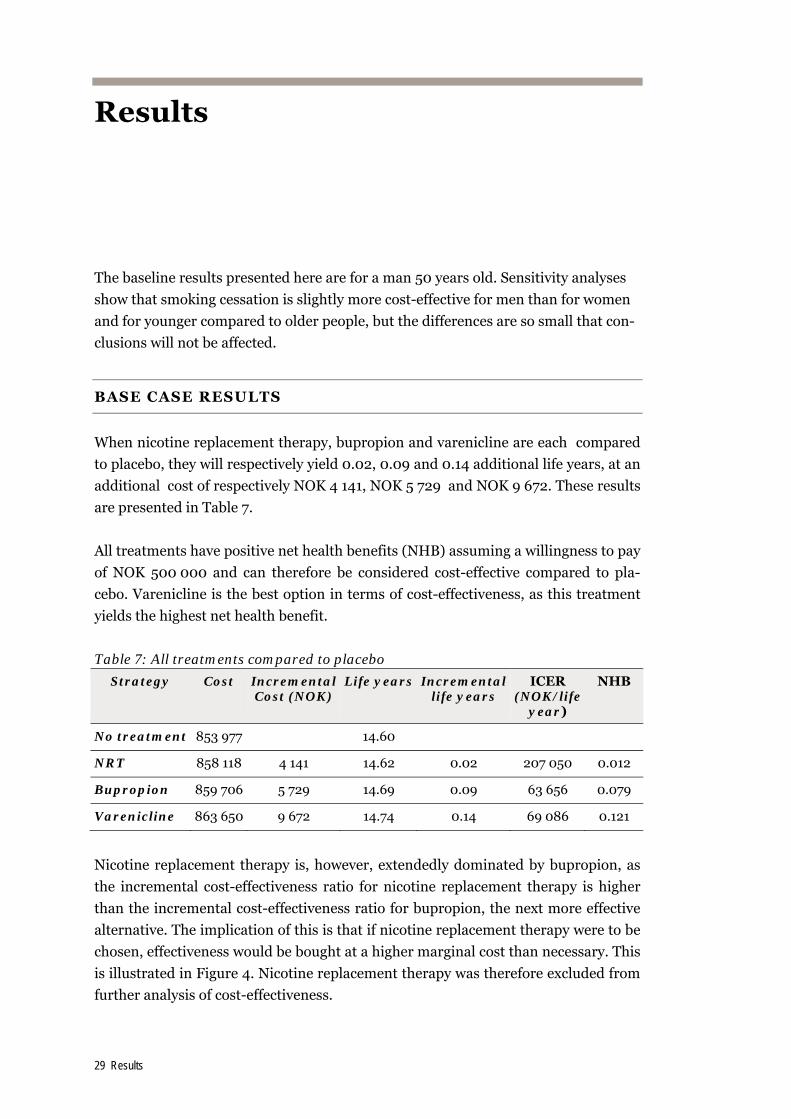
The baseline results presented here are for a man 50 years old. Sensitivity analyses
show that smoking cessation is slightly more cost-effective for men than for women
and for younger compared to older people, but the differences are so small that con-
clusions will not be affected.
BASE CASE RESULTS
When nicotine replacement therapy, bupropion and varenicline are each compared
to placebo, they will respectively yield 0.02, 0.09 and 0.14 additional life years, at an
additional cost of respectively NOK 4 141, NOK 5 729 and NOK 9 672. These results
are presented in Table 7.
All treatments have positive net health benefits (NHB) assuming a willingness to pay
of NOK 500 000 and can therefore be considered cost-effective compared to pla-
cebo. Varenicline is the best option in terms of cost-effectiveness, as this treatment
yields the highest net health benefit.
Table 7: All treatments compared to placebo
Strategy Cost Incremental Cost (NOK)
Life years Incremental life years
ICER (NOK/life
year)
NHB
No treatment 853 977 14.60
NRT 858 118 4 141 14.62 0.02 207 050 0.012
Bupropion 859 706 5 729 14.69 0.09 63 656 0.079
Varenicline 863 650 9 672 14.74 0.14 69 086 0.121
Nicotine replacement therapy is, however, extendedly dominated by bupropion, as
the incremental cost-effectiveness ratio for nicotine replacement therapy is higher
than the incremental cost-effectiveness ratio for bupropion, the next more effective
alternative. The implication of this is that if nicotine replacement therapy were to be
chosen, effectiveness would be bought at a higher marginal cost than necessary. This
is illustrated in Figure 4. Nicotine replacement therapy was therefore excluded from
further analysis of cost-effectiveness.

30 Results
Figure 4:Cost-effectiveness of drugs for smoking cessation, nicotine replacement therapy
excluded based on extended dominance
Effectiveness (life years)
Cos
t (N
OK
)
14,59 14,61 14,63 14,65 14,67 14,69 14,71 14,73
864 000
863 000
862 000
861 000
860 000
859 000
858 000
857 000
856 000
855 000
854 000
853 000
Varenicline
Bupropion
NRT
No treatment
Extended Dominance:
0,277 <= k <= 0,786
When several treatment options are available and they are mutually exclusive,
treatments should be compared to the next more effective option (27). We therefore
ordered the treatments according to increasing effectiveness and recalculated the
cost-effectiveness ratios. Since nicotine replacement therapy was excluded based on
extended dominance, bupropion was compared to no treatment and varenicline to
bupropion. Results are shown in Table 8. Compared to bupropion, varenicline gives
0.05 additional life years at an additional cost of 3 944. The incremental cost-
effectiveness ratio of varenicline compared to bupropion is NOK 78 880 per life year
gained.
Table 8: Treatments compared to the next more effective, when the dominated al-
ternative (NRT) is excluded.
Strategy Cost (NOK)
Incremental Cost (NOK)
Life years Incremental life years
ICER (NOK/life year)
NHB
No treatment 853 977 14.60
Bupropion compared to no treatment
859 706 5 729 14.69 0.09 63 656 0.079
Varenicline compared to bupropion
863 650 3 944 14.74 0.05 78 880 0.042
31 Results
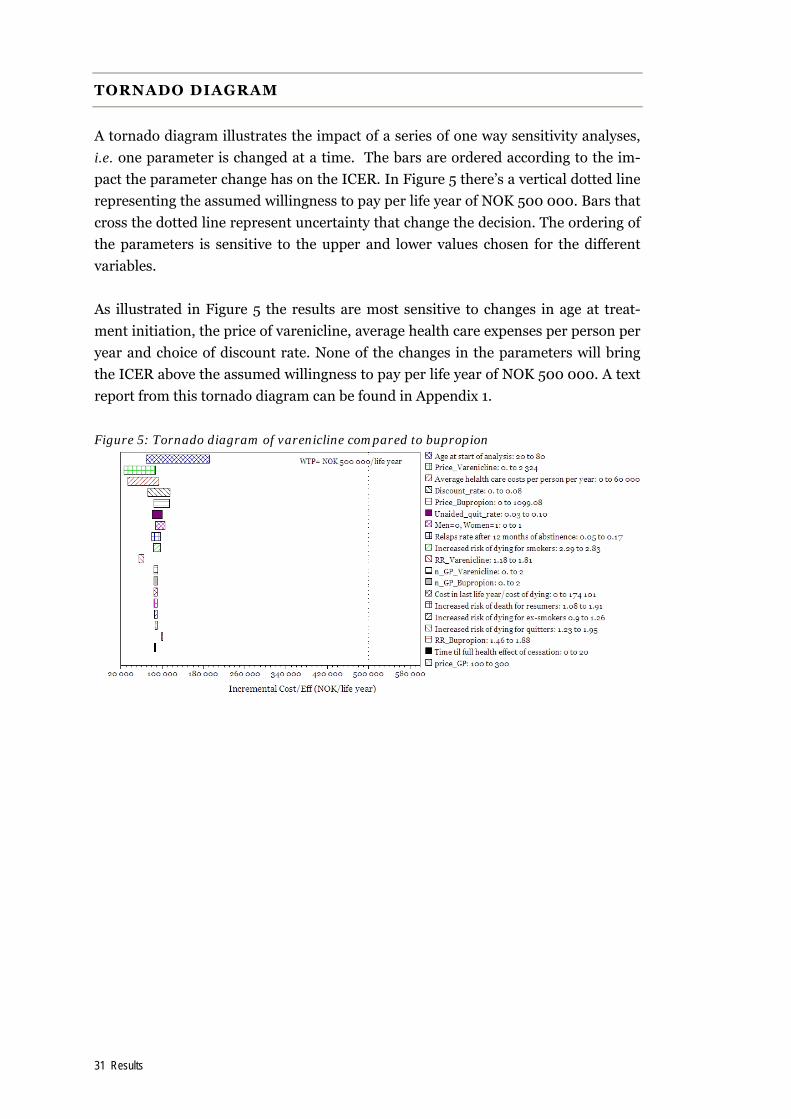
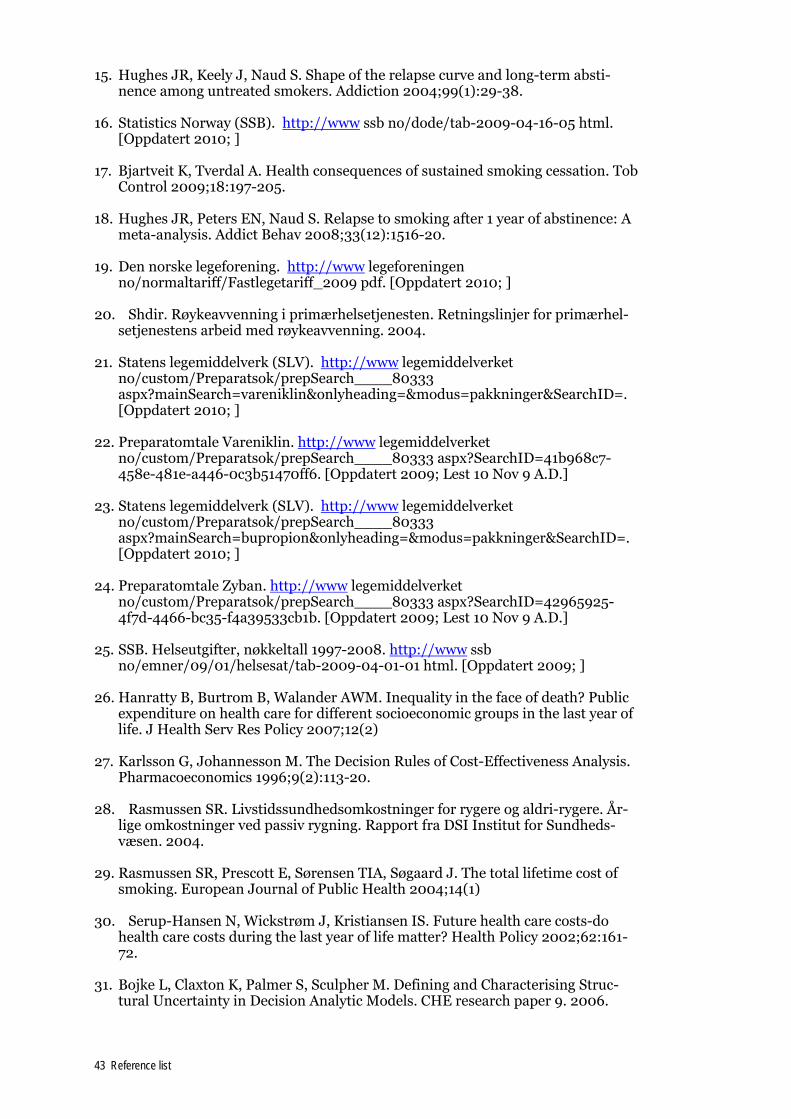
TORNADO DIAGRAM
A tornado diagram illustrates the impact of a series of one way sensitivity analyses,
i.e. one parameter is changed at a time. The bars are ordered according to the im-
pact the parameter change has on the ICER. In Figure 5 there’s a vertical dotted line
representing the assumed willingness to pay per life year of NOK 500 000. Bars that
cross the dotted line represent uncertainty that change the decision. The ordering of
the parameters is sensitive to the upper and lower values chosen for the different
variables.
As illustrated in Figure 5 the results are most sensitive to changes in age at treat-
ment initiation, the price of varenicline, average health care expenses per person per
year and choice of discount rate. None of the changes in the parameters will bring
the ICER above the assumed willingness to pay per life year of NOK 500 000. A text
report from this tornado diagram can be found in Appendix 1.
Figure 5: Tornado diagram of varenicline compared to bupropion

32 Results
PROBABILISTIC SENSITIVITY ANALYSIS
All treatments compared to placebo
Incremental cost-effectiveness scatter plot
We preformed a Monte Carlo simulation with 10 000 draws from the input distribu-
tions. Figure 6 shows a plot of the 10 000 simulated ICERs of each of the treatments
compared to placebo. Nicotine replacement therapy has a probability of 7% of hav-
ing an ICER above the assumed willingness to pay of NOK 500 000 per life year and
a 93% probability of being below. Bupropion and varenicline both have a probability
of 100% of being below the threshold. Figure 6 also illustrates why NRT was ex-
cluded, NRT and bupropion have similar incremental costs, but bupropion yields a
higher incremental effectiveness. Even if all treatments are likely to be cost-effective,
bupropion will give a larger health gain than NRT and varenicline will in turn give a
higher health gain than bupropion.
Figure 6: Incremental cost-effectiveness scatter plot of all treatments compared to placebo
-10 000
-5 000
0
5 000
10 000
15 000
20 000
25 000
30 000
-0,1 0 0,1 0,2 0,3 0,4
Incremental Effectiveness (life years)
Incr
emen
tal C
ost
(NO
K)
NRT vs. placebo
Varenicline vs. placebo
Bupropion vs. placebo
WTP= NOK 500 000/life year
33 Results
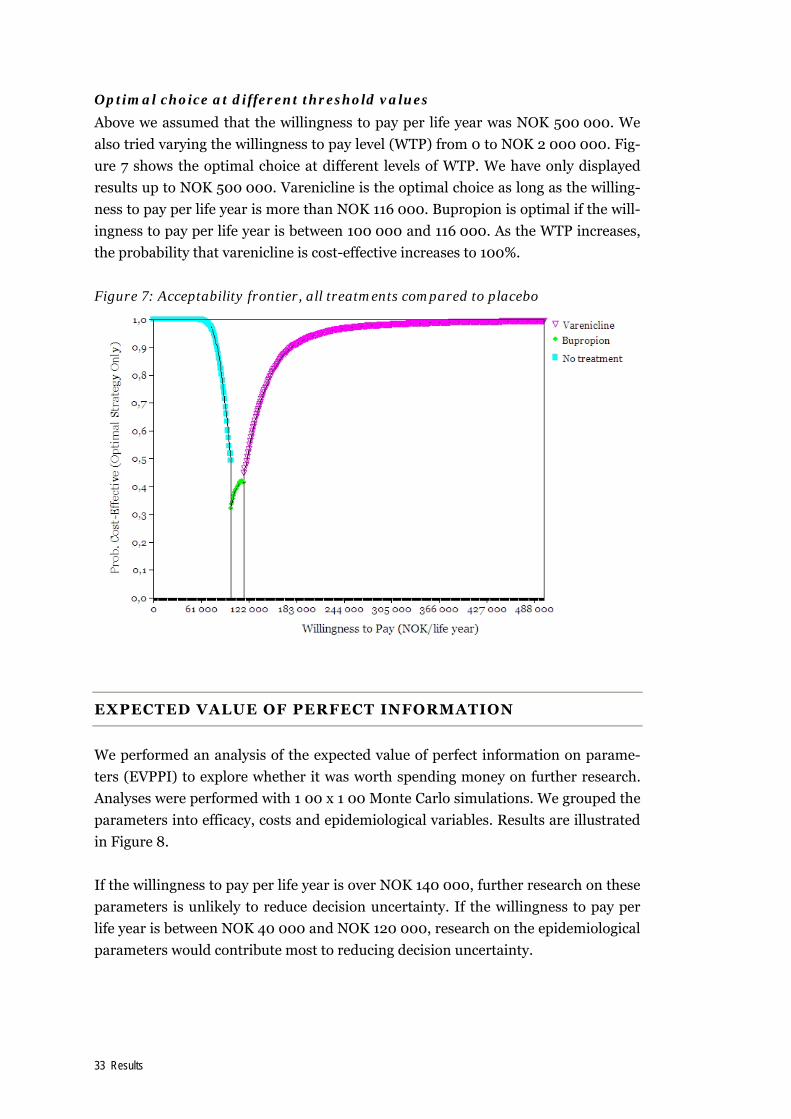
Optimal choice at different threshold values
Above we assumed that the willingness to pay per life year was NOK 500 000. We
also tried varying the willingness to pay level (WTP) from 0 to NOK 2 000 000. Fig-
ure 7 shows the optimal choice at different levels of WTP. We have only displayed
results up to NOK 500 000. Varenicline is the optimal choice as long as the willing-
ness to pay per life year is more than NOK 116 000. Bupropion is optimal if the will-
ingness to pay per life year is between 100 000 and 116 000. As the WTP increases,
the probability that varenicline is cost-effective increases to 100%.
Figure 7: Acceptability frontier, all treatments compared to placebo
EXPECTED VALUE OF PERFECT INFORMATION
We performed an analysis of the expected value of perfect information on parame-
ters (EVPPI) to explore whether it was worth spending money on further research.
Analyses were performed with 1 00 x 1 00 Monte Carlo simulations. We grouped the
parameters into efficacy, costs and epidemiological variables. Results are illustrated
in Figure 8.
If the willingness to pay per life year is over NOK 140 000, further research on these
parameters is unlikely to reduce decision uncertainty. If the willingness to pay per
life year is between NOK 40 000 and NOK 120 000, research on the epidemiological
parameters would contribute most to reducing decision uncertainty.

34 Results
Figure 8: Expected value of perfect information on parameters.
0
50
100
150
200
250
300
350
400
0 20 000 40 000 60 000 80 000 100 000 120 000 140 000 160 000 180 000 200 000
Threshold for Cost-Effectiveness
Epidemiological
Costs
Efficacy
The results from the EVPPI analysis can also be read as an estimate of which group
of parameters the decision is most sensitive to, in this case most of the decision un-
certainty arises as a result of uncertainty in the epidemiological parameters.
SCENARIO ANALYSIS ON CHOICE OF COST INPUT
In the base case results we assumed that the average health care cost per like year
was NOK 45 544 and that this cost was the same for all age groups. We also assumed
that this cost was the same for current and ex-smokers. These assumptions are
probably not valid. Average health care costs are likely to vary with age and it is very
likely that smokers have higher health care expenditures than ex-smokers. Although
we were not able to find any Norwegian data on this, we identified two possible stud-
ies from Denmark, one by Rasmussen et al. (28;29) and one by Serup-Hansen et al.
(30).
In the study by Rasmussen et al. age specific costs for smokers and never-smokers
were reported. The cost estimates included both in-patient and out-patient care and
loss of production estimated by the human capital method. Costs of nursing home
and home help were however not included in the estimates. We adjusted the esti-
mates for inflation and currency; numbers are shown in Table 9. We assigned the
cost of never smokers to ex-smokers, i.e. persons who were smoke free more than
five years. The other health states were assigned the annual cost of smokers.

35 Results
Table 9: Average age specific cost per life year for smokers and never smokers
Age group Annual costs never smokers
Annual costs smokers
35-39 4 332 8 310
40-44 4 186 8 420
45-49 4 957 9 804
50-54 5 926 11 129
55-59 7 823 14 376
60-64 9 680 17 743
66-69 12 650 22 502
70-74 16 147 26 256
75-79 18 974 30 856
80-84 21 425 34 380
85-89 23 048 36 549
Base case results from scenario analysis
When we use the cost estimates in Table 9, all treatment are more effective and cost
saving compared to no treatment. Results are shown in Table 10. Treatment with
respectively NRT, bupropion and varenicline will result in 0.02, 0.09 and 0.14 life
years gained and savings of NOK 187, NOK 875 and NOK 1 365 per person treated
compared to placebo.
No treatment, NRT and bupropion are all dominated by varenicline. Varenicline is
the most cost-effective option, with the highest health gain and the largest savings.
Table 10: Results based on Danish cost input. All treatments compared to placebo
Strategy Cost Incremental Cost (NOK)
Effectiveness (life years)
Incremental Effectiveness
ICER (NOK/life year)
NHB
No treatment
305 727 14,598
NRT 305 540 -187 14,617 0,02 -9 863 0.020
Bupropion 304 852 -875 14,687 0,09 -9 723 0.092
Varenicline 304 362 -1 365 14,737 0,14 -9 751 0.143

36 Results
Results from the probabilistic sensitivity analysis on the scenario
We performed a Monte Carlo simulation with 10 000 iterations. Figure 9 shows the
10 000 simulated ICERs on the cost-effectiveness plane. All treatments have a prob-
ability of 99% of being dominant (more effective and less costly) compared to pla-
cebo.
Figure 9: Scatter diagram of ICERs for all treatments compared to placebo
-2500
-2000
-1500
-1000
-500
0
500
1000
-0,1 -0,05 0 0,05 0,1 0,15
Incremental Effectiveness (life years)
Incr
emen
tal C
ost
(N
OK
)
Varenicline vs placebo
Bupropion vs placebo
NRT vs placebo
Seeing that all results are dominant, the conclusion is in this scenario not sensitive
to any assumptions made about the willingness to pay per life year. The conclusions
will be the same for any and all threshold values.
37 Discussion
Discussion
SUMMARY OF RESULTS
According to our base case analysis, nicotine replacement therapy, bupropion and
varenicline yield net health benefits (NHB) of respectively 0.012, 0.079 and 0.121
compared to placebo. Hence, nicotine replacement therapy, bupropion and vareni-
cline can all be considered cost-effective compared to no treatment, given a willing-
ness to pay of NOK 500 000 per life year gained.
When varenicline is compared to bupropion, the incremental cost-effectiveness ra-
tio is 78 889 NOK/life year gained, which can also be considered cost-effective.
When we vary the willingness to pay from NOK 0 to NOK 2 000 000 per life year
gained, varenicline is the optimal choice for all values above NOK 116 000 per life
year gained. If the willingness to pay is between NOK 100 000 and NOK 116 000,
bupropion is the optimal choice. If the willingness to pay is less than NOK 100 000
per life year gained, none of the treatments can be considered cost-effective.
In the scenario analysis based on Danish cost data, all treatments are less costly and
more effective than no treatment. Varenicline will in this scenario lead to the great-
est savings and to the largest gains in life years. In other words, if we assume higher
treatment costs for smokers, varenicline will be a dominant strategy.
Our analysis on value of information indicate that more research on the input vari-
ables is unlikely to change our conclusion that bupropion and varenicline is cost-
effective, assuming a willingness to pay per life year gained of NOK 500 000.
UNCERTAINTY IN PARAMETERS
All models are simplifications of reality and there is necessarily some degree of un-
certainty associated with the results.
Some of the uncertainty is related to the model inputs, i.e. the parameter estimates
used. Our model inputs have been gathered from a range of sources and they may
not on their own represent true values for a Norwegian population in a real-life set-

38 Discussion
ting. We have used estimates of unaided quit rate and relapse rate after twelve
months from published studies based on data from other countries. It is possible
that these rates are either higher or lower than the actual rates in Norway. We have
however tried to vary the unaided quit rate from 5/100 down to 5/1 000 without any
change in the conclusion. Changing the relapse rate from five to seventeen per cent
per year also had no impact on the conclusion.
We have used efficacy estimates from randomised controlled trials. Efficacy esti-
mates indicate how well a treatment can work under ideal circumstances, but not
how well it will actually work in real-life settings. Motivation is one of the factors key
to a successful smoking cessation attempt. Individuals in randomised controlled tri-
als can be more motivated to stop smoking than the average person in real life or
they can become more motivated by the fact that they are taking part in a study. It is
also possible that compliance with the drugs is less in a real life setting than in the
randomised controlled trials. It is therefore possible that the effectiveness of the
drugs is smaller in a real-life setting, than the efficacy estimates taken from random-
ised controlled trials in our efficacy report. If this is the case, we are overestimating
the cost-effectiveness of the treatments.
We have conducted a range of sensitivity analyses on these parameters and the con-
clusions are robust to realistic changes in these values.
We were not able to find age specific cost data from Norway that included costs from
both primary and secondary care. In our base case we use an estimate of annual
health care expenditure from Statistics Norway that is constant across age. With this
estimate, we are most likely overestimating the costs for the younger age groups and
possibly underestimating for the older age groups. Due to the limitations in available
Norwegian cost data, we conducted a scenario analysis based on Danish cost data.
The conclusions were not changed based on the alternative cost input, but the fact
that the smokers were assumed to have higher costs than the ex-smokers in this sce-
nario made all treatments more cost-effective and even cost saving.
UNCERTAINTY RELATED TO MODEL STRUCTURE
Another aspect of uncertainty is related to the model structure (31;32). Examples of
model structure uncertainty relates to the events included in the model and the
choice of comparators (31).
Uncertainty related to included events
Events included in models is a trade off between available time for the modelling
project and the realism of the model (33). Our model was structured to capture the
life years gained from smoking cessation. The model therefore only contains the
health states necessary to capture costs and health effects of being either dead or
39 Discussion
alive. In reality however, smoking will increase the risk of a variety of diseases, most
notably different cancers, lung diseases and cardiovascular diseases. If we had in-
cluded the natural history of these diseases in the model, we would have been able to
capture the loss due to smoking-related disease in terms of quality adjusted life
years and not only life years. We would in other words have been able to capture the
“pain and suffering” aspect of the different smoking related diseases.
It is therefore possible that our simplistic model underestimates the health effects
and potential savings related to smoking cessation.
A number of economic evaluations of the cost-effectiveness of drugs for smoking
cessation have been published in recent years (34-54). Many published economic
evaluations of varenicline have been based on the Benefits of Smoking Cessation on
Outcomes (BENESCO) model, a very elaborate Markov model developed by Pfizer,
which includes health states for lung cancer, chronic obstructive pulmonary disease,
coronary heart disease, stroke and asthma exacerbations. This model clearly in-
cludes a more realistic description of the potential health effects of smoking than our
simplified model.
However, the Finish application of the BENESCO by Linden et al. 2010, reports
varenicline to have an ICER of €8 791 (approximately 79 875 NOK) per life year
gained compared to bupropion in a 20 year perspective (53). In a lifetime perspec-
tive the ICER is €-3 336 (approximately -26 691 NOK) per life year gained. The
Dutch application yields an ICER of €-1 774 (approximately NOK -14 194) per life
year gained for varenicline compared to bupropion (35). The Belgium application
yields an ICER of €-1 294 per life year gained (approximately NOK -10 353) (49) and
the Swedish ICERs varying from €14 743 to €-3 852 per quality adjusted life year
(approximately NOK 117 944 to -30 816) depending on gender, length of follow up
and inclusion/exclusion of indirect effects (38).
The incremental cost-effectiveness ratios naturally vary between the different stud-
ies, due to both differences in methodology, e.g. choice of discount rate and inclu-
sion or exclusion of indirect costs, and variation in country specific cost and epide-
miological data. The conclusions are however uniform, varenicline is found to be a
cost-effective and often dominant strategy. Despite the fact that our model is very
simple, our conclusions are the same as the conclusions found in the other coun-
tries.
Possible side effects of nicotine replacement therapy, bupropion and varenicline are
not included in the analysis. If one of the drugs has serious side effects, inclusion of
these side effects in the analysis may change the conclusions.

40 Discussion
Uncertainty related to choice of comparators
The other type of structure uncertainty is related to the included comparators. This
evaluation has only assessed the cost-effectiveness of the available pharmacological
treatment options. Ideally all types of mutually exclusive interventions should be
compared in a cost-effectiveness analysis (55). This means that physician advice to
quit and other types of counselling strategies possibly could have been included in
our analysis.
Evaluation of many of these interventions can however be difficult due to lack of
good quality efficacy studies. A recent review from Canada reviewed the effective-
ness and cost-effectiveness of mass media interventions, telephone counselling,
post-secondary interventions, community-wide stop-smoking contests, community
interventions, physician advice to quit, nursing intervention to stop smoking, hospi-
tal based intervention to stop smoking, and different types of pharmacotherapy (56).
They conclude that pharmacotherapy, physician advice to quit, nursing interven-
tions, hospital-based interventions, and proactive telephone counselling are all likely
to be both effective and cost-effective in the short-term. Among these interventions
they found varenicline, bupropion and nicotine replacement therapies, followed by
physician advice to quit and nursing interventions to be the most effective strategies.
IMPLICATIONS FOR PRACTISE
Cost-effectiveness alongside the effectiveness of the treatment and the severity of the
disease is important considerations when decisions are made regarding which
treatment to offer from the National Health Service, for example when considering
whether or not a drug should be reimbursed.
In the choice of treatment for the individual patient, additional considerations, like
patient preferences should be taken into account. Patients may have preferences for
nicotine replacement therapy because this intervention does not require a prescrip-
tion from a doctor. Other patients may prefer counselling.
41 Conclusions
Conclusions
We have evaluated the cost-effectiveness of varenicline, bupropion and nicotine re-
placement therapy for smoking cessation in a Norwegian setting. We conclude that
all treatments can be considered cost-effective compared to placebo and that vareni-
cline is likely to be the most cost-effective alternative when the drugs are evaluated
relative to each other. The conclusions seem robust to changes in the parameters.
NEED FOR FURTHER RESEARCH
Nicotine replacement therapy was excluded from our relative analysis based on ex-
ternal dominance. Given this, our analysis of the expected value of perfect informa-
tion on parameters indicates that more research is unlikely to reduce decision uncer-
tainty when the willingness to pay per life year gained is higher than NOK 140 000.
We do in other words not believe that further research on the included drugs would
change the conclusion.
42 Reference list
Reference list
1. Sæterdal I, Harboe I, Ringerike T, Reikvam Å, Hagen G, Klemp M. Legemidler til
røykeslutt. Rapport fra nasjonalt kunnskapssenter for helsetjenesten. 2010.
2. SSB. Røyking i Norge, 2008. Jevn nedgang i andel dagligrøykere. http://www ssb no/emner/03/01/royk/index html. [Oppdatert 2010; ]
3. SSB. Andel røykere. http://statbank ssb no/statistikkbanken/. [Oppdatert 2010; ]
4. Helsedirektoratet. Tobakken taper terreng-halvveis gjennom Nasjonal strategi for det tobakksforebyggende aarbeidet 2006-2010. 2009.
5. Vollset SESR, Tverdal A, Gjessing HK. Hvor dødelig er røyking? 2006.
6. Bolin K, Lindgren B. Røkning-produksjonsbortfall och sjukvårdskostnader. 2004.
7. NOU 1997:18 Prioritering på ny. Gjennomgang av retningslinjer for prioritering-er innen nork helsetjeneste (Lønning 2). 1997.
8. NOU 1997:7 Piller, prioritering og politikk. 1997.
9. HOD (Helse- og omsorgsdepartementet). FOR 2000-12-01 nr 1208: Forskrift om prioritering av helsetjenester, rett til nødvendig helsehjelp fra spesialisthel-setjenesten, rett til bahandling i utlandet og om klagenemd (prioriteringsfor-skriften).
10. LOV 1999-07-02 nr 63. LOV 1999-07-02 nr 63: Lov om pasientrettigheter (pasi-entrettighetsloven).
11. HOD (Helse og omsorgsdepartementet). Forskrift om legemidler (legemiddel-forskriften). http://www lovdata no/cgi-wift/wiftldles?doc=/app/gratis/www/docroot/for/sf/ho/ho-20091218-1839 html&emne=legemiddelforskrift*&. [Oppdatert 2010; ]
12. Hdir. http://www helsedirektoratet no/samfunns_konomiske_analyser/helseeffekter_i_samfunns_konomiske_analyser_87704. [Oppdatert 13 Oct 2009; ]
13. Sælensminde K. Helseeffekter i samfunnsøkonomiske analyser. 2007.
14. Briggs A, Sculpher M, Claxton K. Decision Modelling for Health Economic Eva-luation. 2006.
43 Reference list
15. Hughes JR, Keely J, Naud S. Shape of the relapse curve and long-term absti-nence among untreated smokers. Addiction 2004;99(1):29-38.
16. Statistics Norway (SSB). http://www ssb no/dode/tab-2009-04-16-05 html. [Oppdatert 2010; ]
17. Bjartveit K, Tverdal A. Health consequences of sustained smoking cessation. Tob Control 2009;18:197-205.
18. Hughes JR, Peters EN, Naud S. Relapse to smoking after 1 year of abstinence: A meta-analysis. Addict Behav 2008;33(12):1516-20.
19. Den norske legeforening. http://www legeforeningen no/normaltariff/Fastlegetariff_2009 pdf. [Oppdatert 2010; ]
20. Shdir. Røykeavvenning i primærhelsetjenesten. Retningslinjer for primærhel-setjenestens arbeid med røykeavvenning. 2004.
21. Statens legemiddelverk (SLV). http://www legemiddelverket no/custom/Preparatsok/prepSearch____80333 aspx?mainSearch=vareniklin&onlyheading=&modus=pakkninger&SearchID=. [Oppdatert 2010; ]
22. Preparatomtale Vareniklin. http://www legemiddelverket no/custom/Preparatsok/prepSearch____80333 aspx?SearchID=41b968c7-458e-481e-a446-0c3b51470ff6. [Oppdatert 2009; Lest 10 Nov 9 A.D.]
23. Statens legemiddelverk (SLV). http://www legemiddelverket no/custom/Preparatsok/prepSearch____80333 aspx?mainSearch=bupropion&onlyheading=&modus=pakkninger&SearchID=. [Oppdatert 2010; ]
24. Preparatomtale Zyban. http://www legemiddelverket no/custom/Preparatsok/prepSearch____80333 aspx?SearchID=42965925-4f7d-4466-bc35-f4a39533cb1b. [Oppdatert 2009; Lest 10 Nov 9 A.D.]
25. SSB. Helseutgifter, nøkkeltall 1997-2008. http://www ssb no/emner/09/01/helsesat/tab-2009-04-01-01 html. [Oppdatert 2009; ]
26. Hanratty B, Burtrom B, Walander AWM. Inequality in the face of death? Public expenditure on health care for different socioeconomic groups in the last year of life. J Health Serv Res Policy 2007;12(2)
27. Karlsson G, Johannesson M. The Decision Rules of Cost-Effectiveness Analysis. Pharmacoeconomics 1996;9(2):113-20.
28. Rasmussen SR. Livstidssundhedsomkostninger for rygere og aldri-rygere. År-lige omkostninger ved passiv rygning. Rapport fra DSI Institut for Sundheds-væsen. 2004.
29. Rasmussen SR, Prescott E, Sørensen TIA, Søgaard J. The total lifetime cost of smoking. European Journal of Public Health 2004;14(1)
30. Serup-Hansen N, Wickstrøm J, Kristiansen IS. Future health care costs-do health care costs during the last year of life matter? Health Policy 2002;62:161-72.
31. Bojke L, Claxton K, Palmer S, Sculpher M. Defining and Characterising Struc-tural Uncertainty in Decision Analytic Models. CHE research paper 9. 2006.

44 Reference list
32. Koerkamp BG, Weinstein MC, Stijnen T, Heijenbrok-Kal MH, Hunink M. Uncer-tainty nand Patient Heterogeneity in Medical Decision Models. Med Decis Mak-ing 2010;30(2)
33. Claxton K, Sculpher M, McCabe C, Briggs A, Akehurst R, Buxton M, et al. Prob-abilistic sensitivity analysis for NICE technology assessment: not an optinonal extra. Health Econ 2005;(14)
34. Halpern MT, Dirani R, Schmier JK. The cost effectiveness of varenicline for smoking cessation. Manag Care Interface 2007;20(10):18-25.
35. Hoogendoorn M, Welsing P, Rutten-van Molken MPMH. Cost-effectiveness of varenicline compared with bupropion, NRT, and nortriptyline for smoking ces-sation in the Netherlands. Curr Med Res Opin 2008;24(1):51-61.
36. Howard P, Knight C, Boler A, Baker C. Cost-utility analysis of varenicline versus existing smoking cessation strategies using the BENESCO simulation model: Application to a population of US adult smokers. Pharmacoeconomics 2008;26(6):497-511.
37. Fernandez Bobadilla OJ, Sanchez-Maestre C, Riestra MB, Arroyo O, De SB, V, Wilson K. Cost effectiveness analysis of varenicline (champix) for the treatment of smoking in spain. An Med Interna 2008;25(7):342-8.
38. Bolin K, Mork A-C, Willers S, Lindgren B. Varenicline as compared to bu-propion in smoking-cessation therapy-Cost-utility results for Sweden 2003. Respir Med 2008;102(5):699-710.
39. Jackson II KC, Nahoopii R, Said Q, Dirani R, Brixner D. An employer-based cost-benefit analysis of a novel pharmacotherapy agent for smoking cessation. J Occup Environ Med 2007;49(4):453-60.
40. Bertram MY, Lim SS, Wallace AL, Vos T. Costs and benefits of smoking cessa-tion aids: making a case for public reimbursement of nicotine replacement ther-apy in Australia. Tob Control 2007;16:255-60.
41. Bolin K, Lindgren B, Willers S. The cost utility of bupropion in smoking cessa-tion health programs: simulation model results for Sweden. Chest 2006;129(3):651-60.
42. Cornuz J, Pinget C, Gilbert A, Paccaud F. Cost-effectiveness analysis of the first-line therapies for nicotine dependence. Eur J Clin Pharmacol 2003;59(3):201-6.
43. Gilbert AR, Pinget C, Bovet P, Cornuz J, Shamlaye C, Paccaud F. The cost effec-tiveness of pharmacological smoking cessation therapies in developing coun-tries: a case study in the Seychelles. Tob Control 2004;13(2):190-5.
44. Johnson CD, Lucas LM, Uchishiba MA. Efficacy and cost-effectiveness analysis of NRT patches vs. J Pharm Technol 2001;17(4):140-6.
45. Nielsen K, Fiore MC. Cost-benefit analysis of sustained-release bupropion, nico-tine patch, or both for smoking cessation. Prev Med 2000;30(3):209-16.
46. Shearer J, Shanahan M. Cost effectiveness analysis of smoking cessation inter-ventions. Aust N Z J Public Health 2006;30(5):428-34.
47. Woolacott NF, Jones L, Forbes CA, Mather LC, Sowden AJ, Song FJ, et al. The clinical effectiveness and cost-effectiveness of bupropion and nicotine replace-ment therapy for smoking cessation: a systematic review and economic evalua-tion. Health Technology Assessment (Winchester, England) 2002;6(16):1-245.

45 Reference list
48. Song F, Raftery J, Aveyard P, Hyde C, Barton P, Woolacott N. Cost-effectiveness of pharmacological interventions for smoking cessation: A litera-ture review and a decision analytic analysis. Med Decis Making 2002;22(5 SUPPL.):S26-S37.
49. Annemans L, Nackaerts K, Bartsch P, Prignot J, Marbaix S. Cost effectiveness of varenicline in Belgium, compared with bupropion, nicotine replacement ther-apy, brief counselling and unaided smoking cessation: A BENESCO Markov cost-effectiveness analysis. Clinical Drug Investigation 29(10)()(pp 655-665), 2009 Date of Publication: 2009 2009;(10):655-65.
50. Bae JY, Kim CH, Lee EK. Evaluation of cost-utility of varenicline compared with existing smoking cessation therapies in South Korea. Value in Health 12(SUPPL 3)()(pp S70-S73), 2009 Date of Publication: November-December 2009 2009;(SUPPL. 3):S70-S73.
51. Bolin K, Wilson K, Benhaddi H, de Nigris E, Marbaix SMA-C, Aubin H-J. Cost-effectiveness og varenicline compared with nicotine patches for smoking cessa-tion- results from four European countries. European Journal of Public Health 2009;
52. Hind D, Tappenden P, Peters J, Kenjegalieva K. Varenicline in the management of smoking cessation: a single technology appraisal. Health technology assess-ment (Winchester, England) 13 Suppl 2()(pp 9-13), 2009 Date of Publication: Sep 2009 2009;(Winchester, England):9-13.
53. Linden K, Jormanainen V, Linna M, Sintonen H, Wilson K, Kotomaki T. Cost effectiveness of varenicline versus bupropion and unaided cessation for smoking cessation in a cohort of Finnish adult smokers. Current Medical Research and Opinion 26(3)()(pp 549-560), 2010 Date of Publication: March 2010 2010;(3):549-60.
54. Mould-Quevedo JF, Contreras-Hernandez I. Cost-effective analysis of vareni-cline (Champix) versus the nicotine patch in treatment for smoking cessation in Mexico. [Spanish]. Pharmacoeconomics - Spanish Research Articles 6(1)()(pp 22-32), 2009 Date of Publication: 2009 2009;(1):22-32.
55. Philips Z, Ginnelly L, Sculpher M, Claxton K, Golder S, Riemsma R, et al. Reveiw of guidelines for good practice in decision-analytic modelling in health technol-ogy assessment. Health Technology assessment; Vol 8: No 36. 2004.
56. Medical Advisory Secretariat. Population-based smoking cessation strategies: a summary of a select group of evidence-based reviews. Ontario Health Technol-ogy Assessment Series 2010;10(1). 2010.
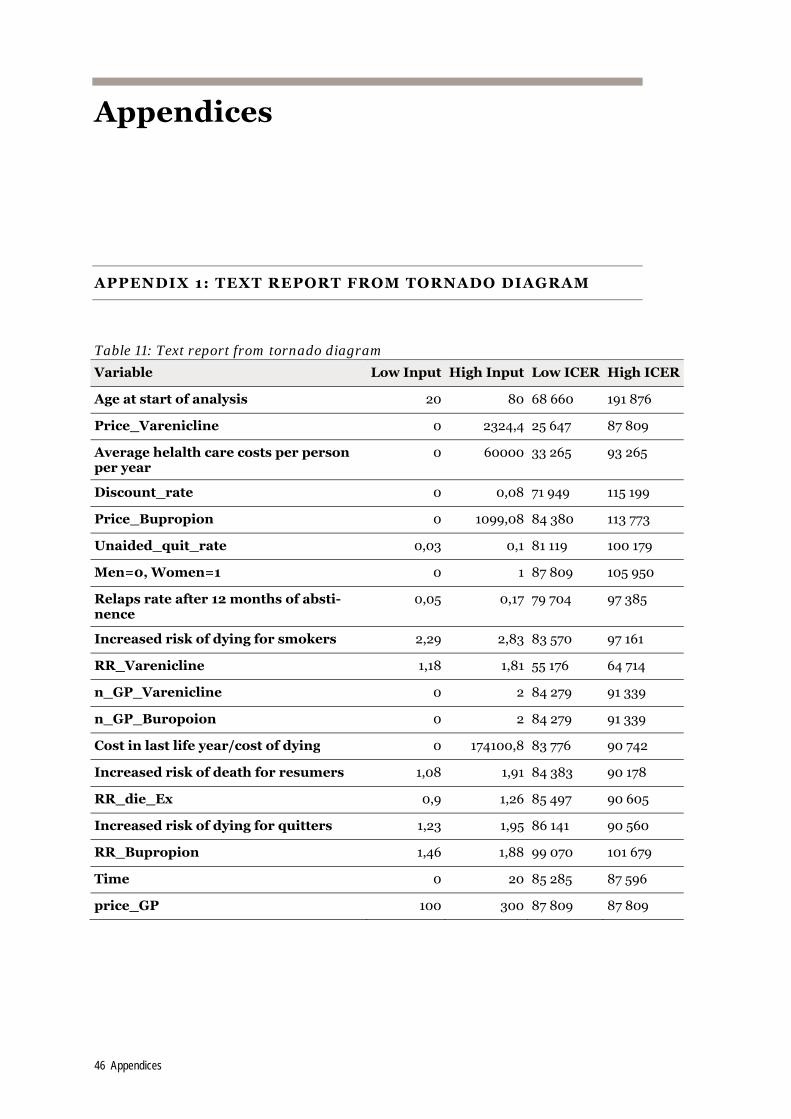
46 Appendices
Appendices
APPENDIX 1: TEXT REPORT FROM TORNADO DIAGRAM
Table 11: Text report from tornado diagram
Variable Low Input High Input Low ICER High ICER
Age at start of analysis 20 80 68 660 191 876
Price_Varenicline 0 2324,4 25 647 87 809
Average helalth care costs per person per year
0 60000 33 265 93 265
Discount_rate 0 0,08 71 949 115 199
Price_Bupropion 0 1099,08 84 380 113 773
Unaided_quit_rate 0,03 0,1 81 119 100 179
Men=0, Women=1 0 1 87 809 105 950
Relaps rate after 12 months of absti-nence
0,05 0,17 79 704 97 385
Increased risk of dying for smokers 2,29 2,83 83 570 97 161
RR_Varenicline 1,18 1,81 55 176 64 714
n_GP_Varenicline 0 2 84 279 91 339
n_GP_Buropoion 0 2 84 279 91 339
Cost in last life year/cost of dying 0 174100,8 83 776 90 742
Increased risk of death for resumers 1,08 1,91 84 383 90 178
RR_die_Ex 0,9 1,26 85 497 90 605
Increased risk of dying for quitters 1,23 1,95 86 141 90 560
RR_Bupropion 1,46 1,88 99 070 101 679
Time 0 20 85 285 87 596
price_GP 100 300 87 809 87 809

47 Appendices
APPENDIX 2: DISTRIBUTIONS USED IN PSA
Table 12: Distributions used in PSA
Name Parameters/Info
Efficacy of NRT vs. placebo Log-Normal. u (mean of logs) = Ln(1.58). sigma (std dev of logs) = (Ln(1.66)-Ln(1.50))/ (2*GRADE_moderate_quality); Expected value: 1.580749998
Efficacy of bupropion vs pla-cebo
Log-Normal. u (mean of logs) = Ln(1.69). sigma (std dev of logs) = (Ln(1.85)-Ln(1.53))/ (2*GRADE_moderate_quality) ; Expected value: 1.692818457
Efficacy of varenicline vs. pla-cebo
Log-Normal. u (mean of logs) = Ln(2.33). sigma (std dev of logs) = (Ln(2.80)-Ln(1.95))/ (2*GRADE_high_quality); Expected value: 2.339944711
Efficacy of bupropion vs. NRT Log-Normal. u (mean of logs) = Ln(1.45). sigma (std dev of logs) = (Ln(4.18)-Ln(0.50))/ (2*GRADE_very_low_quality); Expected value: 2.450523844
Efficacy of varenicline vs. bu-propion
Log-Normal. u (mean of logs) = Ln(1.46). sigma (std dev of logs) = (Ln(1.81)-Ln(1.18))/ (2*GRADE_high_quality); Expected value: 1.468720699
dist_rr_Ex_Men Log-Normal. u (mean of logs) = 0.067659. sigma (std dev of logs) = 0.054791; Expected value: 1.071607681
dist_rr_Resum_Men Log-Normal. u (mean of logs) = 0.463734. sigma (std dev of logs) = 0.094255; Expected value: 1.597078468
dist_rr_Smoke_Men Log-Normal. u (mean of logs) = 0.95935. sigma (std dev of logs) = 0.042044; Expected value: 2.612307287
dist_rr_Quit_Men Log-Normal. u (mean of logs) = 0.329304. sigma (std dev of logs) = 0.063881; Expected value: 1.392839391
dist_rr_Ex_Women Log-Normal. u (mean of logs) = 0.058269. sigma (std dev of logs) = 0.085836; Expected value: 1.063912243
dist_rr_Resum_Women Log-Normal. u (mean of logs) = 0.336472. sigma (std dev of logs) = 0.131728; Expected value: 1.412199097
dist_rr_Smoke_Women Log-Normal. u (mean of logs) = 0.912283. sigma (std dev of logs) = 0.042959; Expected value: 2.492299399
dist_rr_Quit_Women Log-Normal. u (mean of logs) = 0.494696241836107. sigma (std dev of logs) = 0.088202; Expected value: 1.646391689
dist_Cost_LY Gamma. alpha = (54544^2)/(((54544*20)/100)^2).
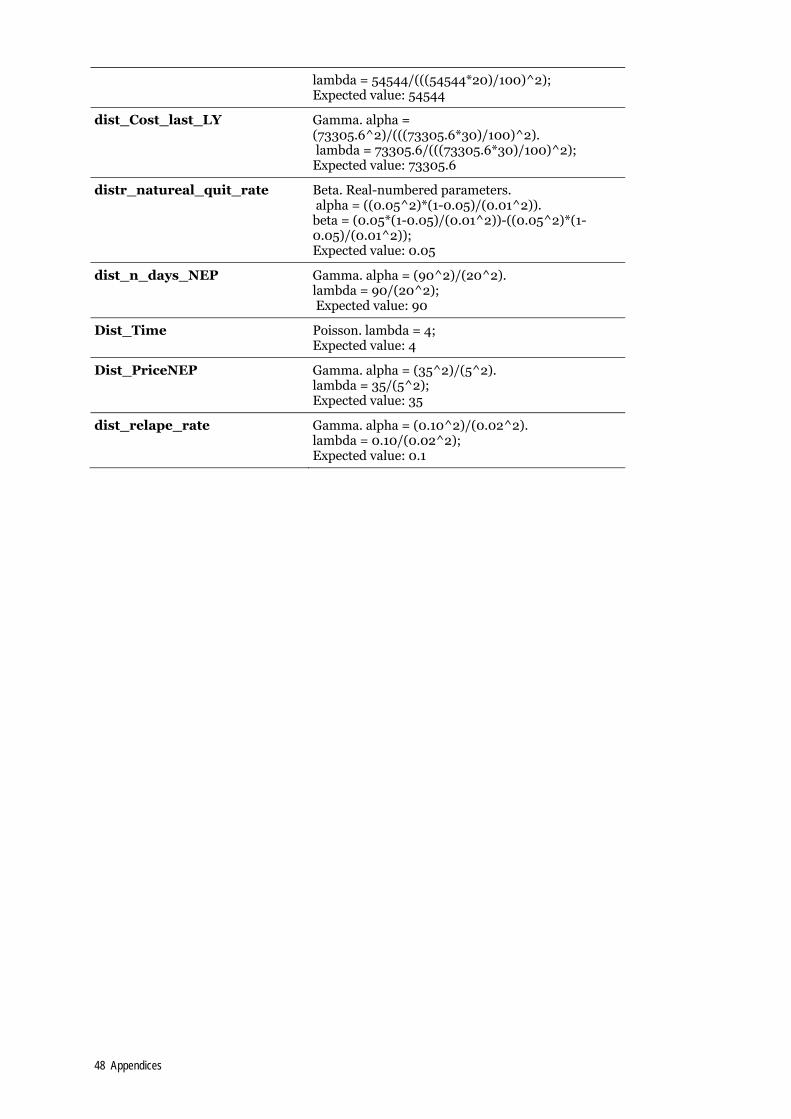
48 Appendices
lambda = 54544/(((54544*20)/100)^2); Expected value: 54544
dist_Cost_last_LY Gamma. alpha = (73305.6^2)/(((73305.6*30)/100)^2). lambda = 73305.6/(((73305.6*30)/100)^2); Expected value: 73305.6
distr_natureal_quit_rate Beta. Real-numbered parameters. alpha = ((0.05^2)*(1-0.05)/(0.01^2)). beta = (0.05*(1-0.05)/(0.01^2))-((0.05^2)*(1-0.05)/(0.01^2)); Expected value: 0.05
dist_n_days_NEP Gamma. alpha = (90^2)/(20^2). lambda = 90/(20^2); Expected value: 90
Dist_Time Poisson. lambda = 4; Expected value: 4
Dist_PriceNEP Gamma. alpha = (35^2)/(5^2). lambda = 35/(5^2); Expected value: 35
dist_relape_rate Gamma. alpha = (0.10^2)/(0.02^2). lambda = 0.10/(0.02^2); Expected value: 0.1