cost effectiveness of technology solutions for future ... · cost effectiveness of technology...
TRANSCRIPT

Cost Effectiveness of Technology Solutions for Future Vehicle
Systems
Tom RyanSouthwest Research Institute
SAE International

Reducing CO2 Footprint
Two ways to reduce the CO2 footprint of vehicle systems
Efficiency ImprovementAlternative Fuels
Hypothesis: Efficiency improvements always make sense and should receive the highest priority. Alternative fuels are limited by supply issues and may not always make sense.

Basic Question
What are the economic costs or benefits for CO2 control through vehicle efficiency improvements?
Can the customer save money while preserving the atmosphere?

Cost Benefit of CO2 Reduction
ScopeInformation derived from ARB funded NESCCAF study, June 2004 (California)
Retail price & cost increaseCO2 savingsCustomer Net cost effect
SwRI study, 2008Cost differences, in-house cost modelEuropean ScenarioUpdate of Net cost for 2008 fuel prices

Assessed Net Lifetime Cost vs CO2 Levels from Grouped Technologies(derived from NESCAFF GHG Study, Large Car data, M-H, baseline 215g/km CO2)
-12000.00
-10000.00
-8000.00
-6000.00
-4000.00
-2000.00
0.0090.0 100.0 110.0 120.0 130.0 140.0 150.0 160.0 170.0 180.0 190.0 200.0
CO2 Levels with technology improvements (g/km)
Net
Life
time
cost
s (E
uro)
0.45 Euro/L($2.58/USG)
0.35 Euro/L(8.83$/USG)
0.7 Euro/L($4/USG)
1.05 Euro/L($6/USG)
Negative "Cost" is net customer lifetime
(240,000km) saving
120g/km European level (NEDC)
2004 CARB Proposed CO2 Phase In
200
250
300
350
400
450
2009 2010 2011 2012 2013 2014Model Year
M-H
CO
2 (g
/mile
)
125
188
250
M-H
CO
2 (g
/km
)
PassengerCars
Light DutyTrucks
0.095g/km/kg(1400kg ITW)
0.097g/km/kg (2000kg ITW)
120g/km CO2 NEDC ~0.06g/km/kg (2000kg ITW)
120g/km CO2 NEDC ~0.086g/km/kg (1400kg ITW)
60% 100% 30%30% 60% 100%30%
Metro-Highway (M-H) CO2 reduction vs Cost & Retail Price Increase (RPI)(derived from CARB Martec Study, June 2004)
0
5
10
15
20
25
0 250 500 750 1000 1250 1500Incremental Cost and RPI for Technology (Euro/US car vs 2004 baseline)
M-H
CO
2 R
ecuc
tion
(vs
base
)
42V 10kW ISG + motor
HSDI
Elect. AccessoriesCVT
6 spd auto
6 spd auto manual
Variable A/C Comp.
Manufactured oncost Retail Price Increase1259 kg Curb Weight2.3L, Auto 4spd (2004) I4 base,182 g/km CO2 M-H Ref. Oncost Threshold?
Retail Price Threshold?42V 10kW ISG
Non-Engine Items
Diesel or Spark Ignition
Engineor
Electric motor
IVT
Auxiliarygearbox
Flywheel
Flywheel hub(and optional
electric motor)
Diesel or Spark Ignition
Engineor
Electric motor
IVT
AuxiliarygearboxAuxiliarygearbox
FlywheelFlywheel
Flywheel hub(and optional
electric motor)
Flywheel hub(and optional
electric motor)
INTERACTING TECHNOLOGIES
Mul
ti Po
int F
uel i
njec
tion
λ=1
Afte
rtre
atm
ent
Cam
Pha
ser (
In)
Cam
Pha
ser (
Ex)
Cam
Pha
ser (
Dua
l)
Cam
Pha
ser (
Cou
pled
)Va
riabl
e Li
ft-D
iscr
ete
Varia
ble
Lift-
Con
tinuo
usC
amle
ss-E
lect
rohy
drau
licTu
rboc
harg
ing
Elec
t. A
ssis
t tur
bo (E
AT)
Cyl
inde
r de-
activ
atio
nVa
riabl
e C
harg
e M
otio
nG
DI-λ
=1G
DI-D
ilute
SI H
CC
I
CI H
SDI
CI H
CC
I/mul
timod
e
HED
GE
Multi Point Fuel injectionλ=1 Aftertreatment YCam Phaser (In) Y YCam Phaser (Ex) Y Y YCam Phaser (Dual) Y Y N NCam Phaser (Coupled) Y Y N N NVariable Lift-Discrete Y Y Y Y Y YVariable Lift-Continuous Y Y Y Y Y Y NCamless-Electrohydraulic Y Y N N N N N NTurbocharging Y Y Y Y Y Y Y Y YElect. Assist turbo (EAT) Y Y Y Y Y Y Y Y Y NCylinder de-activation Y Y Y Y Y Y Y N N N NVariable Charge Motion Y Y Y Y Y Y Y Y Y N N YGDI-λ=1 Y Y Y Y Y Y Y Y Y Y Y Y YGDI-Dilute Y Y Y Y Y Y N N N Y Y N N NSI HCCI Y Y Y Y Y N Y N Y N N N N N NCI HSDI N N N N N N N N Y Y Y N N N N NCI HCCI/multimode N N N N N N N N Y Y Y Y N N N N NHEDGE Y Y Y Y Y Y Y Y Y Y Y Y Y Y Y Y N N
Methodology
IndividualTechnology
Identification
Price & Costing
Drive Cycle CO2
Technology Grouping
Vehicle Performance
Checks
Cost/Benefit
Net Cost
Net Cost per avoided CO2
Payback Period
Correlation of US M-H combined & NEDC fuel consumptions

Derived Information from ARB Study
Key Aspects
ARB (NESCCAF) study used Martec to assess price variances for technologies; updated by SwRI cost model
NESCCAF deduced manufacturing cost relationship to retail price;
updated with SwRI cost model
AVL performed US M-H drive cycle predictions for CO2
variances; additional points added with correlated SwRI drive model, and transposition of M-H CO2 data to NEDC
Effects of individual and grouped technologies considered, but only “grouped”
technologies pursued.
Baseline is 2004MY ~1600kg (curb weight) 3.2L V6, 4 speed auto with 345g/mile (215g/km) CO2
,,~1260kg (curb weight) 2.4L I4, 4 speed auto with 291g/mile (182g/km) CO2
Price & cost are projected for 2008 onwards

Predicted M-H CO2 Reduction vs $US Price & Cost Changes
Effect of Selected Individual technologies, showing assessed $US
retail price increase and cost increase
Metro-Highway (M-H) CO2 reduction vs Cost & Retail Price Increase (RPI)(derived from CARB Martec Study, June 2004; HSDI values 6% increased over Martec)
0
10
20
30
40
50
60
0 500 1000 1500 2000 2500Incremental Cost and RPI for Technology ($/US car vs 2004 baseline)
M-H
CO
2 R
ecuc
tion
(vs
base
)
Advanced HEV
HSDI
Moderate HEV
HSDI/HCCIHEDGE
GDI-Dil.Ad.VVA Hydraulic Camless
SI/HCCI
Manufactured oncostRetail Price Increase
Ref. Market Point ?
Retail Price Threshold?
Ref. Oncost Threshold?
1259 kg Curb Weight2.3L, Auto 4spd (2004) I4 base,291 g/mile CO2 M-H
Engine Items only
M-H
CO
2 R
educ
tion
(vs B
ase)

Predicted M-H CO2 Reduction vs Price & Cost Changes
Non Engine technologies……
Metro-Highway (M-H) CO2 reduction vs Cost & Retail Price Increase (RPI)(derived from CARB Martec Study, June 2004)
0
5
10
15
20
25
0 250 500 750 1000 1250 1500
Incremental Cost and RPI for Technology (Euro/US car vs 2002 baseline)
M-H
CO
2 R
ecuc
tion
(vs
base
)
42V 10kW ISG + motor
HSDI
Elect. AccessoriesCVT
6 spd auto
6 spd auto manual
Variable A/C Comp.
Manufactured oncost Retail Price Increase1259 kg Curb Weight2.3L, Auto 4spd (2004) I4 base,182 g/km CO2 M-H2002
Ref. Oncost Threshold?
Retail Price Threshold?42V 10kW ISG
Non-Engine Items
M-H
CO
2 R
educ
tion
(vs B
ase)

Predicted M-H CO2 Reduction vs Price & Cost Changes
Large car results: $US
Metro-Highway (M-H) CO2 reduction vs $US Cost & Retail Price Increase (RPI)(derived from CARB Study, June 2004: HSDI values 14% higher than Martec)
0
10
20
30
40
50
60
0 400 800 1200 1600 2000 2400 2800 3200Incremental Cost and RPI for Technology ($US/US car vs 2002 baseline)
M-H
CO
2 R
ecuc
tion
(vs
base
)
Advanced HEV
HSDI
Moderate HEV
HSDI/HCCIHEDGE
GDI-Dil.Ad.VVA
Hydraulic Camless
SI/HCCI
1600 kg Curb Weight3.2L V6, Auto 4spd base,345 g/km CO2 M-H(2002)
Turbo
GDI-Stoich
$2266 oncost
$3183 RPI
M-H
CO
2 R
educ
tion
(vs B
ase)
1600 kg Curb Weight3.2L V6, Auto 4 spd Base345 g/mi CO2 M-H(2002)

Correlations
In order to transpose the previous data from the US Metro-
Highway to NEDC, the following relationships are examined:
US M-H vs NEDC fuel consumption correlation (as this is currently the most plentiful data for both markets)
Fuel consumption vs CO2 correlation

Correlation of Metro-Highway & NEDC Fuel Consumptions
Most vehicle specs in above data are same in terms of engine size and transmission for both markets
2007 US Metro-Highway & 2007 NEDC Fuel Consumption Comparisons
(Certification Data, ~30 vehicles with common USA & Europe specs.)
0
2
4
6
8
10
12
14
16
18
20
0.0 2.0 4.0 6.0 8.0 10.0 12.0 14.0 16.0 18.0 20.0US M-H Fuel Cons. (L/100km)
NED
C F
uel C
ons.
(L/1
00km
)

Cost of Ownership Assumptions
10 Years240,000 km5% inflation rate

Assessed Net Lifetime Cost vs CO2 Levels from Grouped Technologies(derived from NESCAFF GHG Study, Large Car data, M-H)
-1500.00
-1000.00
-500.00
0.00
500.00
1000.00
1500.00
90 100 110 120 130 140 150 160 170 180 190 200
CO2 Levels with technology improvements (g/km)
Net
Life
time
cost
s (E
uro)
0.35 Euro/L(2$/USG)
Negative "Cost" is net customer lifetime
(240,000km) saving
130g/km European level (NEDC)
Comparison of NESCCAF & SwRI Curve fits
NESCCAF
SwRI
Net Cost Savings for Customer
Comparison of NESCCAF and SwRI Net Cost to Customer over 10 years, including 5% inflation/year

Assessed Net Lifetime Cost vs CO2 Levels from Grouped Technologies(derived from NESCAFF GHG Study, Large Car data, M-H, baseline 215g/km CO2)
-8000.00
-6000.00
-4000.00
-2000.00
0.00
2000.00
90.0 100.0 110.0 120.0 130.0 140.0 150.0 160.0 170.0 180.0 190.0 200.0
CO2 Levels with technology improvements (g/km)
Net
Life
time
cost
s (E
uro)
0.45 Euro/L(2.58$/USG)
0.35 Euro/L(2$/USG)
0.7 Euro/L(4$/USG)
1.05 Euro/L(6$/USG)
Negative "Cost" is net customer lifetime
(240,000km) saving
130g/km European level (NEDC)
Net Cost Savings for Customer
Net costs calculated by NESCCAF method for Euro 0.35-1.05/L fuel costs, adjusted for inflation
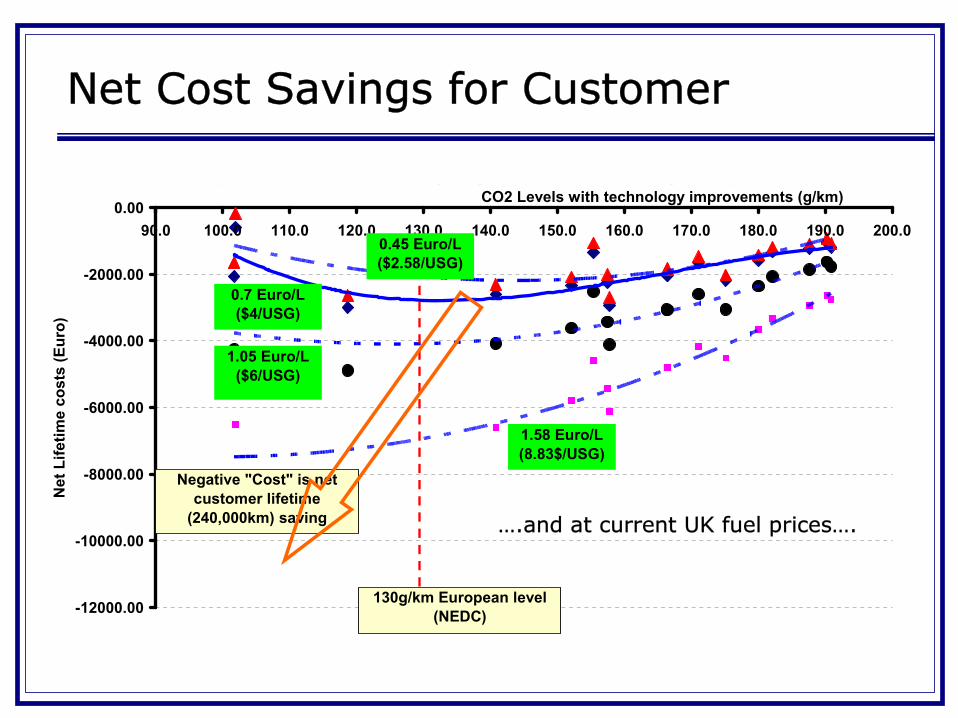
Net Cost Savings for Customer
….and at current UK fuel prices….
Assessed Net Lifetime Cost vs CO2 Levels from Grouped Technologies(derived from NESCAFF GHG Study, Large Car data, M-H, baseline 215g/km CO2)
-12000.00
-10000.00
-8000.00
-6000.00
-4000.00
-2000.00
0.0090.0 100.0 110.0 120.0 130.0 140.0 150.0 160.0 170.0 180.0 190.0 200.0
CO2 Levels with technology improvements (g/km)
Net
Life
time
cost
s (E
uro)
0.45 Euro/L($2.58/USG)
1.58 Euro/L(8.83$/USG)
0.7 Euro/L($4/USG)
1.05 Euro/L($6/USG)
Negative "Cost" is net customer lifetime
(240,000km) saving
130g/km European level (NEDC)

Net Cost Savings for Customer
…And the effect of only 160,000km use in 10 years
Assessed Net Lifetime Cost vs CO2 Levels from Grouped Technologies(derived from NESCAFF GHG Study, Large Car data, M-H, baseline 215g/km CO2)
-12000.00
-10000.00
-8000.00
-6000.00
-4000.00
-2000.00
0.0090 100 110 120 130 140 150 160 170 180 190 200
CO2 Levels with technology improvements (g/km)
Net
Life
time
cost
s (E
uro)
1.58 Euro/L(8.83$/USG)Negative "Cost" is net
customer lifetime saving
130g/km European level (NEDC)
160,000km/ 10 years
240,000km /10 years

Lifetime Net Cost per avoided Tonne CO2 per Customer vs CO2 Levels(LARGE car, 240,000km)
-600.0
-500.0
-400.0
-300.0
-200.0
-100.0
0.0100.0 120.0 140.0 160.0 180.0 200.0
Large car M-H CO2/km
Net
Cos
t Ben
efit
avoi
ded
Tonn
e C
O2
(Eur
o/to
nne)
1.58 Euro/L($8.83/USG)
0.7 Euro/L(4$/USG)
1.05 Euro/L(6$/USG)
0.45 Euro/L(2.58$/USG)
Negative CO2 "Cost/benefit" is customer saving per avoided
CO2 tonne
Net Cost/ton avoided CO2 vs vehicle CO2 levels
At current prices, European customers will personally save
> Euro 500 per tonne of CO2 avoided, at least to ~160g/km, the benefit reducing
to ~Euro 450 at 120 g/km CO2

ConclusionsThe net lifetime cost of CO2 reductions by added engine technology is negative for current and likely future fuel pricing, i.e. the customer benefits, as well as the climate.
For current fuel prices in Europe, the cost savings for the customer is 7000EU at 130 g/km CO2
