cost-effectiveness measurement in development
TRANSCRIPT

Policy Research Working Paper 7027
Cost-Effectiveness Measurement in Development
Accounting for Local Costs and Noisy Impacts
David K. EvansAnna Popova
Africa RegionOffice of the Chief EconomistSeptember 2014
WPS7027P
ublic
Dis
clos
ure
Aut
horiz
edP
ublic
Dis
clos
ure
Aut
horiz
edP
ublic
Dis
clos
ure
Aut
horiz
edP
ublic
Dis
clos
ure
Aut
horiz
ed

Produced by the Research Support Team
Abstract
The Policy Research Working Paper Series disseminates the findings of work in progress to encourage the exchange of ideas about development issues. An objective of the series is to get the findings out quickly, even if the presentations are less than fully polished. The papers carry the names of the authors and should be cited accordingly. The findings, interpretations, and conclusions expressed in this paper are entirely those of the authors. They do not necessarily represent the views of the International Bank for Reconstruction and Development/World Bank and its affiliated organizations, or those of the Executive Directors of the World Bank or the governments they represent.
Policy Research Working Paper 7027
This paper is a product of the Office of the Chief Economist, Africa Region. It is part of a larger effort by the World Bank to provide open access to its research and make a contribution to development policy discussions around the world. Policy Research Working Papers are also posted on the Web at http://econ.worldbank.org. The authors may be contacted at [email protected] and [email protected].
As evidence from rigorous impact evaluations grows in development, there have been more calls to complement impact evaluation analysis with cost analysis, so that policy makers can make investment decisions based on costs as well as impacts. This paper discusses important consid-erations for implementing cost-effectiveness analysis in the policy making process. The analysis is applied in the context of education interventions, although the findings generalize to other areas. First, the paper demonstrates a systematic method for characterizing the sensitivity of impact estimates. Second, the concept of context-specificity is applied to cost measurement: program costs vary greatly across contexts—both within and across countries—and
with program complexity. The paper shows how adapting a single cost ingredient across settings dramatically shifts cost-effectiveness measures. Third, the paper provides evidence that interventions with fewer beneficiaries tend to have higher per-beneficiary costs, resulting in potential cost over-estimates when extrapolating to large-scale applications. At the same time, recall bias may result in cost underestimates. The paper also discusses other challenges in measuring and extrapolating cost-effectiveness measures. For cost-effective-ness analysis to be useful, policy makers will require detailed, comparable, and timely cost reporting, as well as significant effort to ensure costs are relevant to the local environment.

Cost-Effectiveness Measurement in Development:
Accounting for Local Costs and Noisy Impacts
David K. Evans World Bank
Anna Popova World Bank
JEL Codes: D04, D61, H43, I25
Keywords: Cost-Effectiveness Analysis; Impact Evaluation; Education
Acknowledgments: The authors are very grateful for comments and guidance from Conner Brannen, Steven Glazerman, Rachel Glennerster, Kristen Himelein, Henry Levin, Patrick McEwan, and Benjamin Olken as well as for feedback from participants in a session at the Society for Research on Educational Effectiveness (SREE) Spring 2014 conference. The authors are especially grateful to Rachel Glennerster and the Abdul Latif Jameel Poverty Action Lab for sharing their cost-effectiveness data and analysis; and to Marie-Hélène Cloutier for providing additional data. The authors can be contacted at David Evans ([email protected]) and Anna Popova ([email protected]).

I. Introduction
Recent decades have seen an increased emphasis on evidence-based decision making in development policy. As part of the trend, the past 20 years have witnessed a sharp rise in the implementation of rigorous impact evaluations of development programs.1 Impact evaluations are a key tool for providing policy makers with evidence on what does and does not work to reduce poverty, expand investments in human capital, improve opportunities for women, and achieve other social objectives.
There is also an increasing awareness that analyzing impact alone is not enough to determine whether a particular program is worth investing in. The cost-effectiveness of the program or, in other words, how much it will cost to achieve a given impact, is also crucial. How this compares across programs should clearly affect evidence-based policy making. Consider, for example, a low-cost remedial tutoring program and a high-cost extension of the school day that both deliver the same improvement in test scores. Impact (or “effectiveness”) alone would fail as a guide to policy, whereas cost-effectiveness would point to the lower cost program as the better investment. Cost-effectiveness analysis is proposed as an aid to compare the impacts and costs of various programs implemented in different countries and years when the programs have a common objective, making them comparable.
Recent years have seen significant advances in tools to conduct cost-effectiveness analysis in development contexts, often applied to interventions in education. There is a growing literature documenting methods of cost-effectiveness analysis (see Levin & McEwan 2001, Levin et al. 2012, and Glennerster and Takavarasha 2013, for examples). At the same time, recent reviews have discussed the issues surrounding the assumptions on which such analyses rely, and have made recommendations on which of these assumptions may be reasonable for policy makers to employ, bringing the development community closer to consensus on a more standardized methodology for cost-effectiveness analyses (Dhaliwal et al. 2013; McEwan 2012). There have also been advances in implementing a standardized approach to cost-effectiveness analysis. Evans and Ghosh (2008) draw on 40 randomized and non-randomized evaluations of education programs to compare their cost-effectiveness in achieving increases in enrollment, attendance, and test scores. They compare the average program cost (in 1997 USD) for an additional year of school participation, and for a 0.1 standard deviation improvement in test scores, a common measure intended to allow the comparison of gains in test scores in different contexts irrespective of whether the tests are the same. Dhaliwal et al. (2013) use randomized evaluations of 11 education programs from six countries to compare the cost-effectiveness for student attendance and enrollment, in
1 Randomized experiments are one form of rigorous impact evaluation: A recent review found that the vast majority of available randomized experiments in primary schools have been completed since 2000 (McEwan 2014).
2

terms of the additional years of student participation bought with $100 (in 2011 USD). They discuss the limitations of using simple point estimates of impact to conduct cost-effectiveness analysis, and carry out a sensitivity analysis which shows confidence intervals around cost-effectiveness estimates, using the standard error of impact estimates. Kremer, Brannen, and Glennerster (2013) likewise show cost-effectiveness across a range of learning interventions, as does McEwan (2014).2
This paper discusses important challenges to consider in the application of cost-effectiveness analysis. This is most closely related to the discussion of sensitivity of cost-effectiveness estimates to discount rates, exchange rates, and other parameters in Dhaliwal et al. (2013).3 First, we demonstrate a method for characterizing the sensitivity of relative cost-effectiveness estimates to errors in impact estimates, using repeated simulations drawn from the distribution of the impact estimates (i.e., a Monte Carlo simulation). We apply this method using J-PAL (2014a) data which compare the cost-effectiveness of 27 education programs in achieving student learning gains across Africa and Asia (14 of which have statistically significant impacts), and of 16 programs achieving attendance gains (11 of which have statistically significant impacts). Through this analysis we show that a wide range of cost-effectiveness rankings across programs is possible using 90% confidence intervals of impact estimates, both for learning outcomes and for school participation outcomes. We find that taking into account the variance around point estimates, we cannot rule out most rankings of the cost-effectiveness of the 14 programs with significant student learning impacts; but the simulation provides clarity on which programs are most likely to be cost-effective.
Second, we examine questions of context-specificity (i.e., external validity) in cost measurement – not explored in the development literature to date – which further complicate a simplistic approach to cost-effectiveness analysis.4 We look at how costs vary across contexts and with program complexity, and how this complicates the extrapolation of cost-effectiveness results. We find that, using data on community teacher salaries in a number of countries, cost-effectiveness estimates vary by as much as 88 percent with the change of just one cost ingredient. We show how the extrapolation of cost-effectiveness is
2 While cost-effectiveness analysis compares the impacts and costs of programs which have a common outcome, cost-benefit analysis takes comparability across evaluations further by converting all costs and benefits into present-discounted monetary values and presenting the ratio of combined benefits to costs, which allows the comparison of programs with different outcomes, to deem which investment would yield the greater social return. There are advantages and disadvantages to each method, as discussed in Dhaliwal et al. (2013). Regardless, all of the limitations of cost-effectiveness analysis discussed in this paper also apply to cost-benefit analysis. 3 In the context of health interventions in high-income contexts, considerable work has been done to measure sensitivity in cost-effectiveness estimates. See, for example, Jain, Grabner, and Onukwugha (2011). 4 There is a health literature exploring the estimation of confidence intervals for costs (see, for example, Briggs, O’Brien, and Blackhouse 2002); the present paper focuses on key conceptual issues with transferring estimates from one context to another rather than with estimation per se. Levin et al. (2012) demonstrate the context specificity of cost estimates in a U.S. context.
3

further complicated in programs that are “complex in costs,” which is determined not only by the number of cost ingredients, but also by the proportion of total cost explained by few cost ingredients. Third, we explore how various biases – including “recall bias”, much explored in relation to consumption but little in this literature, and “pilot bias”, wherein pilot programs are likely to have higher costs but potentially also higher impacts – are likely to lead to biased cost-effectiveness estimates. These challenges, added to the external validity of impact estimates, which has been much discussed elsewhere, point to the need for governments and their advisors to carry out significant contextualization of cost estimates before drawing conclusions about the relative cost-effectiveness of programs. We conclude with some discussion and recommendations for the way forward.
II. Errors in the Estimation of Impact
Cost-effectiveness analysis typically uses point estimates of impact to calculate cost-effectiveness: For example, a girls’ scholarship program in Kenya has an estimated impact of 0.27 standard deviations in student learning, with a cost per girl per year of $19.51, so the estimated cost-effectiveness is 1.38 standard deviations in student learning per $100 spent. Every point estimate, however, has a confidence interval, the size of which varies depending on the statistical power of each underlying evaluation. Imprecision in the estimation of impact means that it is possible that although one program may appear more cost-effective than a second when using point estimates to calculate cost-effectiveness, the relative cost-effectiveness may change – or the difference become trivial – if the variance around the two point estimates is taken into account.
We first demonstrate the extent to which this occurs in practice by re-ordering the relative cost-effectiveness for a sample of 14 education programs with student learning impacts, using the upper and lower bounds of the 90% confidence interval around the impact estimate and observing how this affects the relative ranking of the cost-effectiveness of these programs. Table 1 presents the original cost-effectiveness results of these 14 learning programs, alongside the results of this sensitivity analysis. We use data from J-PAL (2014a), who conduct cost-effectiveness analyses of 27 education interventions across Africa and Asia, all of which aim to increase student test scores, and apply our sensitivity analysis to the 14 of these programs found to have a significant impact at the 10 percent level. Table 1 ranks the programs in order of descending cost-effectiveness, measured in terms of the additional standard deviations in test scores produced by each program for a cost of $100. The impact on learning is measured in standard deviations of test scores, intended to allow comparison
4

across different tests administered in different contexts.5 The last two columns in Table 1 present the lower and upper bounds of the cost-effectiveness estimate, which we calculate by using the lower and upper bounds of the 90 percent confidence interval for the impact estimate.
Figure 1 shows the original cost-effectiveness estimates for the 14 programs, with error bars representing the calculated lower and upper bounds on cost-effectiveness. As in Table 1, we can see just how much uncertainty surrounding the relative cost-effectiveness of programs stems from imprecision in the estimation of impact. If we were to rank programs by the lower or upper bound of their cost-effectiveness, then the order would change dramatically relative to that observed when using the point estimate. Indeed, when considering a mix of lower and upper bounds, there is almost no ranking of the cost-effectiveness of programs which we can reject. Figure 2 demonstrates this by presenting one example of a dramatic reordering which is consistent with the 90 percent confidence interval of cost-effectiveness estimates. The first column shows the original ordering by cost-effectiveness (based on the point estimate); the second column shows a re-ordering achieved by re-calculating the cost-effectiveness of the most cost-effective programs using the lower bound of the 90% confidence interval, and then re-calculating the cost-effectiveness of the least cost-effective programs using the upper bound of the 90% confidence interval. This is a variation on best and worst case sensitivity testing, as recommended by Boardman et al. (2011).
The shifts are clearly dramatic. Although this is merely one of many possible rankings, it serves to illustrate the great movement in rankings which this may cause. For example, the Individually-paced computer assisted learning program in India (Banerjee et al. 2007), which is ranked eleventh of 14 in the original cost-effectiveness, rises as far as first place (i.e., most cost-effective). Similarly, the Electing school committee and linking to local government program in Indonesia (Pradhan et al. 2012) goes from being one of the most cost-effective programs to one of the least cost-effective.
In order to characterize this sensitivity more systematically, we carry out the following Monte Carlo simulation. Using the mean and standard deviation of the impact estimate for each program and assuming a normal distribution, we randomly select a simulated point estimate for each program, re-doing this 100,000 times.6 We then calculate the proportion of
5 Even this assumption can be problematic. Hollands et al. (2013) discuss how literacy tests focusing on different skills (e.g., phonics versus broader measures of literacy) can deliver very different average effect sizes. Other limitations of using standard deviations of test scores as a measure for learning include that tests typically fail to capture some aspects of student learning, such as critical thinking and creativity, and that standard deviations do not provide information about absolute levels of learning: an intervention that improves test scores by 0.3 standard deviations in a very disadvantaged student population may be more “effective” than one which produces the same improvement in an already high-performing set of students (J-PAL 2014b). 6 Obviously there is no reason that the distribution of impacts would necessarily take a normal distribution, but absent extremely detailed information from each intervention, this assumption permits a demonstration of the sensitivity of cost-effectiveness estimates and the likely most and least cost-effective interventions.
5

times, of the 100,000 draws, that each program falls in the top quartile (of the 14 programs); in other words, how often does this program fall among the most cost-effective programs? We also calculate how often each program falls in the bottom quartile. The results are highlighted in Table 2 and Figure 3.7
This way of characterizing the uncertainty can illustrate the weakness of simple point estimates: For example, the Providing earnings information program in Madagascar is three times more cost-effective than the Linking school committee to local government program in Indonesia when considering point estimates; however, the two programs are both in the top quartile of cost-effectiveness more than 90 percent of the time, suggesting that the difference is not nearly as stark when uncertainty is taken into account. Furthermore, the simulation highlights that even taking the sensitivity of impact estimates into account, these (plus the Streaming by achievement program in Kenya) are all highly cost-effective programs, among the cost-effective the vast majority of the time. Alternatively, conditional cash transfers in Malawi are in the bottom quartile 100 percent of the time; and the Read-a-Thon intervention in the Philippines is in the bottom quartile more than 80 percent of the time. (Of course, cash transfers may not be cost-effective in achieving education results in part because they have many other objectives.) These are much less likely to be good bets for the most cost-effective education programs.
An alternative benchmark against which to measure the cost-effectiveness of a given program is a well-known successful intervention, following Glazerman et al. (2013) who use that strategy in the United States context. We take the Girls’ Merit Scholarships program (Kremer, Miguel, & Thornton 2009) in Kenya as a benchmark for illustrative purposes, and conduct a similar exercise to that described above, calculating the percentage of times of 100,000 random draws that a given program is at least at cost-effective as the estimated cost-effectiveness of the scholarship program (i.e., produces at least 1.38 standard deviations in learning gains per $100). These results are in Table 2 and Figure 4. A policy maker could compare the estimated cost-effectiveness of an intervention to the benchmark. In this case, 11 of the remaining 13 programs are at least as cost-effective as the scholarship program in more than 50% of draws.
We repeat the sensitivity analysis and simulation exercise for student attendance, comparing 11 education programs which J-PAL (2014a) found to have significant impacts. Table 2 shows the original cost-effectiveness results of these 11 programs, as well as the results of our sensitivity analysis, and Figure 5 presents these cost-effectiveness estimates graphically, with error bars representing the lower and upper bounds on cost-effectiveness. Table 4 presents the results of the simulation exercise for student attendance.
7 With cost data from the same intervention applied in multiple sites, it would be possible to carry out a similar simulation for the cost data as well, as in Levin et al. (2012). However, cost data are so scarce that this is not currently possible.
6

This exercise demonstrates that cost-effectiveness analysis, even when only considering errors in impact estimates, can be quite sensitive, and that simple comparisons of the cost-effectiveness of different programs can be very misleading. Given that, it is crucial that policy makers and advisors take into account the sensitivity of cost-effectiveness estimates. Simulations like this can illustrate the sensitivity in an intuitive way and guide policy makers in comparing different programs.
III. Context-Specificity of Costs
There is an extensive and growing literature on the external validity or context specificity of impact estimates. How impact estimates vary across contexts and time is crucial to adapting cost-effectiveness analysis across locales, but as it has been much discussed elsewhere, we do not discuss it in detail here.8 However, there has until now been little discussion of the context-specificity of costs in the context of development. In this section, we explore three context-specificity issues related to costs that complicate cost-effectiveness analysis, associated with (i) cost variation across contexts, (ii) cost extrapolation as a function of program complexity, and (iii) cost extrapolation as a function of pilot bias.
Cost Variation Across Contexts Costs associated with development projects vary dramatically across contexts. Figure 6 shows a comparison of three common cost components of education programs in different countries. We consider the monthly teacher salary, the transportation cost per school or facilitation visit, and the parental daily wage, which represents the opportunity cost of parents’ time for involvement in the education program. We compare each cost across three different countries, although owing to data limitations (not all the programs for which we have cost data include the same cost components) the sample of countries is not the same for each cost. For this example, we restrict ourselves to J-PAL (2014a) data and World Bank (2014) data on teacher salaries to maximize comparability. Unsurprisingly, we observe large differences in costs across countries, despite restricting our comparisons to developing countries. For example, the daily parental wage in Indonesia is five times that in Madagascar, the primary teacher salary in Nepal is 74 percent larger than that in Liberia, and the transportation cost per school or facilitation visit, which varies the most across countries, is 27 times larger in Kenya than in India. Any comparison of cost-effectiveness across countries must take this variation into account.
8 See, for example, Vivalt (2014); Pritchett and Sandefur (2013); Hotz, Imbens, and Mortimer (2005); and Flores and Mitnik (2013).
7
Complicating the story further is that program costs may also vary substantially within countries. We examine a single cost element, transportation cost per school or facilitation visit (standardized in 2011 USD), for four different programs implemented in Kenya’s Western province; while variation is much lower than that across countries, it is still significant, with transportation for a visit in the Scholarships, Textbooks, or Uniforms programs costing $32 (Kremer, Miguel, & Thornton 2009; Glewwe, Kremer, and Moulin 2009; and Evans, Kremer, and Ngatia 2008, respectively), almost 20 percent more than under the Extra Teachers and Streaming program (Duflo, Dupas, and Kremer 2012), as seen in Figure 7. This could be explained by differences in transport infrastructure even over small distances, by differing levels of school density (which cause variation in the average distance a facilitator has to travel to reach a school), or by the form of transportation used. This variation within country has also been demonstrated in high-income contexts: Levin et al. (2012) compare the same education program implemented in five sites across the United States and find large variation in the cost per student across sites, with the most expensive site costing almost 60% more than the least expensive site.9
How much does this variation in cost affect estimates of cost-effectiveness? Consider the remedial education program implemented by the non-governmental organization Pratham in India and evaluated by Banerjee et al. (2007). The intervention hired young women (“Balsakhis”) from the community to work with low-achieving children in urban India outside of the classroom for two hours per day. To illustrate the impact of variation in costs on cost-effectiveness estimates, we change just one cost ingredient, updating this cost for a range of different countries to calculate what the cost-effectiveness of the same program would be in these other countries. This is a version of “parameter variation sensitivity testing,” recommended by Boardman et al. (2011). Obviously the variation captured by this exercise significantly underestimates the actual variation that would take place if all cost ingredients were updated across settings: This remedial education program has five other cost elements, making up 40 percent of the program’s cost. Still, the Balsakhi salaries were the single largest cost component, accounting for 60 percent of the program’s cost. We re-calculate the cost-effectiveness of the program using community or contract teacher salaries from a sample of seven countries for which these data were available from World Bank reports (World Bank 2012; World Bank 2013; World Bank 2014). All other cost components as well as the impact estimates are held constant.
Table 5 presents the results of this analysis. We observe substantial sensitivity of cost-effectiveness to the size of community or contract teacher salaries, with the estimated cost-effectiveness in Niger being almost 50 percent higher than that of the original program, for example, while in Nepal it is estimated that the intervention would be only one-tenth as cost-effective as the original. Adapting cost-effectiveness estimates using local costs is essential.
9 Specifically, the most expensive site for the Talent Search program (intended to reduce high school dropouts) had an annual cost per student of US$670, and the least expensive site had an annual cost of US$420.
8

The key takeaway from these results is that changing just one cost parameter in an evaluation creates substantial variation in the resulting cost-effectiveness estimates. Figure 8 illustrates this point graphically by plotting the simulated cost-effectiveness estimates alongside those of the learning programs evaluated earlier (see Figure 1), to see how the relative cost-effectiveness ranking of the Balsakhi program would change if exported to these other contexts. The change is dramatic: Whereas the original program was the seventh most cost-effective program, these transplanted programs range from among the most cost-effective to the least cost-effective.
This is of course only a partial analysis, varying one parameter, and even this single-parameter comparison relies on strong assumptions. Most notably, this analysis relies on the assumption that in all contexts there would be an adequate supply of volunteers with sufficient education (completed high school) to take advantage of the provided pedagogical materials to deliver out-of-school tutoring to local children (as highlighted in Dhaliwal et al. (2013). This was the case in the area of India were the original Balsakhi remedial tutoring program was tested, but may not necessarily extrapolate to other contexts.
Of course, data on the precise type of teacher from the program of interest may not be available in the target country, perhaps because that kind of teacher has not been contracted previously. An alternative, for example, would be to use data on high school graduate salaries as a proxy for remedial tutor salaries, as most community teachers, such as those in the Balskahi program, are high school graduates. We use data from the Living Standards Measurement Study (World Bank 2014) to calculate average monthly salaries for salaried workers who completed high school (and no further education) and use this to re-compute cost-effectiveness estimates for seven countries across four categories: (i) neighboring countries, (ii) countries with similar GDP per capita, (iii) countries with lower GDP per capita, and (iv) countries with higher GDP per capita. The results are in Table 6. In every case, the cost-effectiveness of the remedial tutoring program is much lower, never more than 30 percent of the cost-effectiveness in India. This consistency across dramatically different environments suggests that back-of-the-envelope cost contextualization may provide very imprecise results. Again, policy makers and advisors would need to calculate the likely local costs with great care in order to infer locally meaningful estimates.
Cost Extrapolation as a Function of Program Complexity If a policy maker were considering a program for implementation, then the above type of analysis would be most plausible if a program has few cost ingredients. Across the sample of 14 education programs targeted at improving learning outcomes, the number of measured cost ingredients per program varies from 1 to 11, with a median of seven cost ingredients (see Figure 9). Figure 10 demonstrates for the same sample that, as expected, the percentage of cost explained by the largest cost ingredient decreases with the total number of cost
9

ingredients of a program. In other words, the more complex the program is, in general, the smaller is the proportion of its costs that can be explained by the program’s largest cost ingredient. Figure 11 shows how this varies when we use the two largest cost ingredients.
What is striking in Figure 10 is that several evaluations deviate significantly from the trend line. There are cases where programs with several ingredients can largely be explained by one or two, such as the Computer assisted learning program in India, where the cost of renting computers explains 69 percent of the total cost (Banerjee et al. 2007) and the Earnings information program in Madagascar, where the opportunity cost for parents to attend a meeting explains 77 percent of the total cost (Nguyen 2008). When considering the transferability of costs across evaluations, calculations will be much simpler (and therefore more likely to be carried out) for programs where a few ingredients explain the vast majority of the costs.
Cost Extrapolation as a Function of Pilot Bias Even as it may be difficult to translate costs from one environment to another because of price differences, overall costs may not translate to another program because of “pilot bias”. Much of the available impact evaluation evidence on the effectiveness and cost-effectiveness of education and other programs in developing countries comes from evaluations of small-scale pilot programs. (A growing number of impact evaluations come from larger scale projects.) However, the cost-effectiveness estimates from pilots may be misleading in informing decisions about investing in scaled-up versions of the same program – be it at the national level in the same country, or in other countries. Moreover, pilot bias may work through a number of channels, leading us to either overestimate or underestimate cost-effectiveness somewhat unpredictably. The costs of pilot programs tend to be inherently higher than those of their scaled-up counterparts, both because programs tend to be more expensive the first time they are implemented, before any cost-saving lessons learned through implementation can be applied, and because larger scale programs benefit from economies of scale. Figure 12 illustrates this, showing how for a sample of 22 education programs targeting learning or student attendance, costs per student fall with the total number of students treated by the program.
Different types of costs will have different degrees of sensitivity to scale. Generally speaking, those interventions with high fixed cost components (e.g., classrooms) will require higher utilization to be most cost efficient, while those constituted largely of variable costs such as personnel (e.g., after-school tutoring) will have costs that are less sensitive to the scale of output (Levin et al. 2012). At the same time, as programs scale up, so does the demand for the staff upon which they rely. Since there may be a limited talent pool at the initial price, staff costs may be pushed up as programs scale up in some cases.
While costs are subject to pilot bias, so too are impact estimates, which are usually believed to be higher for pilot programs. With replication at scale, there tends to be less careful
10
attention to implementation at each site. Overall, if policy makers use the cost-effectiveness results of pilot programs to inform whether or not they should scale up implementation, they may overestimate both the costs and the impacts of programs, confounding the estimation of cost-effectiveness, and ultimately, their decision making process. As a result, a policy maker considering the adaptation of a project in her country that was successful elsewhere would do well to take the scale into account when calculating the likely costs.
IV. Challenges in Reporting
Insufficient Information The challenges of context-specificity of costs and over-estimation of costs from pilot programs can limit how easily policy makers can learn from the cost-effectiveness of one program and apply that to another program. But it is often the case that program costs are not reported at all, or are reported in vague and incomparable terms. In general costs – when reported at all – are reported with a lack of detail on their component parts or units of measure, which makes them ill-suited for the purposes of well-done cost-effectiveness analysis. Table 7 presents examples of current cost reporting from the evaluations of the sample of learning programs reviewed in Section III, which illustrate this lack of detail. McEwan's 2014 review found that 56% of 110 education treatments reported no information on incremental program costs and that most others reported only minimal information. At times, detail may only be reported on the largest cost ingredient of a program (e.g., only the amount of the transfer for a conditional cash transfer program), resulting in underestimated program costs, and an upward bias on the resulting cost-effectiveness estimate.
This compounds the problem of costs varying across different contexts, especially when different costs vary by different amounts. If a policy maker reading an education program evaluation is not given detailed information on what proportion of costs were made up of teacher salaries or construction materials, for example, then they will struggle to extrapolate what the cost-effectiveness of this program would be when implemented in their own country, even if they know the relevant per unit costs. The cost-effectiveness estimates reported in the evaluations in J-PAL (2014a) are, in almost every case, derived after a great deal of additional investigation beyond what is reported in the original research papers.
This problem is far from unique to education interventions. A recent review of cost-effectiveness analyses in health highlighted that “the majority of studies provided insufficient information” on key details such as exchange rates (NICE International 2014). Across sectors, insufficient cost data are reported to draw any sort of reasonable inferences.
11

Recall Bias Another source of the underestimation of costs is recall error. There is a large body of evidence documenting the existence of “recall bias”, predominantly in the context of consumption and poverty measurement. Recall bias occurs when the recall period has an impact on reported levels of expenditure and thus on measures of poverty which rely on these for their calculation. For example, Scott & Amenuvegbe (1990) find that when Ghanaian households are asked about 13 commonly purchased items, recall periods of 7 days and 14 days produce expenditures which are 87 percent and 82 percent the size of those reported the day after purchase, respectively (see Figure 13). Two weeks after purchase, households have forgotten almost twenty percent of the amount purchased. Another example, this one from India, shows how recall bias translates into poverty measurement: Poverty drops by around 40 percent with a shift from an expenditure recall period of 30 days to one of 7 days (Deaton and Grosh 1998; Deaton 2001; Deaton and Kozel 2005). There is also suggestive evidence that these effects may work in different directions depending on the type of expenditure in question, as well as on the demography of respondents (e.g., their income levels). Deaton & Kozel (2005) find, for example, that while moving to a shorter recall period for frequently consumed items produces significantly lower measures of poverty incidence, for infrequently consumed items the opposite is true, with a longer recall period producing lower measures of poverty incidence.10
It is likely that recall error would bias the reporting of costs in a related way to that of expenditures, and thus limit the reliability of cost-effectiveness estimates. This is likely to be particularly pronounced in cases where there is no program budget and itemized costs are not automatically recorded, but are rather reported long after project implementation. Referring to a project budget may reduce the impact of this problem, but budgets often use only broad cost categories such as “transportation costs” or “costs of delivering workshops”, and project administrators are likely to progressively forget the precise costs which constitute these broad categories such that recall bias is likely still a cause for concern. In transportation costs, for example, one may recall the cost of the gasoline but not the cost of the driver’s time. At the same time, government budget items often include more activities than the one being evaluated, so separating the specific items for the activities being evaluated can be a challenge. Budgets also fail to include opportunity cost (Levin et al. 2012), which may vary significantly across programs and may be highly affected by recall bias: Recalling the amount of time people spent on a program several years in the past seems particularly tenuous.
10 In a recent application of the theory to health, Das, Hammer, and Sánchez-Paramo (2012) find that the recall period has significant effects on various measures of illness and health-seeking behavior reported by individuals in Delhi, with effects being more pronounced among the poor.
12
If recall error biases reported costs in the same direction as it does frequent consumption expenditures, with longer recall periods being associated with lower reported costs, we can expect this to result in an underestimation of costs and thus an overestimation of cost-effectiveness. This problem is compounded by the fact that different programs record costs at different times and with differing levels of detail, meaning that the size of recall bias is not constant across programs. Just as impact evaluations are increasingly carried out at the same time as the intervention (i.e., prospectively rather than retrospectively), quality cost estimates should be gathered at the time of expenditure rather than as an ex-post data gathering activity.
V. Conclusions
It is no secret that bringing development programs from one context to another requires strong assumptions. Most of the discussion of those assumptions, to date, has focused on the context-specificity of impact estimates. In this paper, we explore the sensitivity of impact estimates to error, even within their original context, and provide a method for comparing cost-effectiveness across programs that takes said sensitivity into account. We also explore the additional assumptions and sources of error when transferring cost and cost-effectiveness estimates across settings. These include widely varying costs across countries and across projects within the same country, as well as errors such as recall bias, which is likely to underestimate costs, and pilot bias, which is likely to overestimate both the costs and impacts of scaled up programs. These challenges suggest that cost-effectiveness estimates – taken at face value – should be assumed to have a significantly larger margin of error than the error established by uncertainty in impact estimates alone.
For cost-effectiveness analysis to be useful, policy makers need detailed, comparable reporting on costs, gathered at the same time that expenditures are made in order to avoid recall bias. This is not currently the norm in education, health, or other sectors. Agencies that fund impact evaluations and require cost analysis can stipulate that such analysis not be an add-on, carried out after the impact analysis has been completed.
Even with better reporting, policy makers and those who advise them must invest significant additional effort in adapting cost estimates to local contexts in order for cost-effectiveness to be meaningful and useful. This adaptation may be somewhat easier for relatively simple programs where few cost ingredients explain much of the total program cost. No government should implement a new program without counting the cost, but it is crucial to make sure the costs being counted are as accurate and locally relevant as possible.
13
Works Cited
Banerjee, Abhijit V., Shawn Cole, Esther Duflo, and Leigh Linden. 2007. “Remedying Education: Evidence from Two Randomized Experiments in India.” The Quarterly Journal of Economics, no. August: 1235–65.
Boardman, Anthony, David Greenberg, Aidan Vining, and David Weimer. 2011. Cost-Benefit Analysis: Concepts and Practice. The Pearso. New Jersey: Pearson Education, Inc.
Briggs, Andrew H, Bernie J O’Brien, and Gordon Blackhouse. 2002. “Thinking Outside the Box: Recent Advances in the Analysis and Presentation of Uncertainty in Cost-Effectiveness Studies.” Annual Review of Public Health 23 (January): 377–401. doi:10.1146/annurev.publhealth.23.100901.140534.
Das, Jishnu, Jeffrey Hammer, and Carolina Sánchez-Paramo. 2012. “The Impact of Recall Periods on Reported Morbidity and Health Seeking Behavior.” Journal of Development Economics 98(1) (August): 76–88.
Deaton, Angus. 2001. “Counting the World’s Poor: Problems and Possible Solutions.” The World Bank Research Observer 16 (2): 125–47. doi:10.1093/wbro/16.2.125.
Deaton, Angus, and Margaret Grosh. 1998. “Chapter 17: Consumption.” In Designing Household Survey Questionnaires for Developing Countries: Lessons from Ten Years of LSMS Experience.
Deaton, Angus, and Valerie Kozel. 2005. “Data and Dogma: The Great Indian Poverty Debate.” The World Bank Research Observer 20 (2): 177–99. doi:10.1093/wbro/lki009.
Dhaliwal, Iqbal, Esther Duflo, Rachel Glennerster, and Caitlin Tulloch. 2013. “Comparative Cost-Effectiveness Analysis to Inform Policy in Developing Countries.” In Education Policy in Developing Countries, edited by Paul Glewwe. University of Chicago Press.
Duflo, Esther, Pascaline Dupas, and Michael Kremer. 2012. “School Governance, Teacher Incentives, and Pupil-Teacher Ratios: Experimental Evidence from Kenyan Primary Schools.”
Evans, David K, and Arkadipta Ghosh. 2008. Prioritizing Educational Investments in Children in the Developing World Prioritizing Educational Investments in Children in the Developing World.
Evans, David, Michael Kremer, and Muthoni Ngatia. 2008. The Impact of Distributing School Uniforms on Children’s Education in Kenya. Mimeo.
14

Flores, CA, and OA Mitnik. 2013. “Comparing Treatments across Labor Markets: An Assessment of Nonexperimental Multiple-Treatment Strategies.” Review Of Economics And Statistics, no. 4451.
Glazerman, S, A Protik, B Teh, J Bruch, and J Max. 2013. Transfer Incentives for High-Performing Teachers: Final Results from a Multisite Randomized Experiment.
Glennerster, Rachel, and Kudzai Takavarasha. 2013. Running Randomized Evaluations: A Practical Guide. Edited by Princetone University Press.
Glewwe, Paul, Michael Kremer, and Sylvie Moulin. 2009. “Many Children Left behind? Textbooks and Test Scores in Kenya.” American Economic Journal: Applied Economics 1 (1): 112–35.
Hollands, Fiona, M., Yilin Pan, Robert Shand, M. Levin, Henry, R. Belfield, Clive, Michael Kieffer, Brooks Bowden, A., and Barbara Hanisch-cerda. 2013. Improving Early Literacy: Cost-Effectiveness Analysis of Effective Reading Programs.
Hotz, V. Joseph, Guido W. Imbens, and Julie H. Mortimer. 2005. “Predicting the Efficacy of Future Training Programs Using Past Experiences at Other Locations.” Journal of Econometrics 125 (1-2): 241–70. doi:10.1016/j.jeconom.2004.04.009.
Jain, Rahul, Michael Grabner, and Eberechukwu Onukwugha. 2011. “Sensitivity Analysis in Cost-Effectiveness Studies: From Guidelines to Practice.” PharmacoEconomics 29 (4): 297–314. doi:10.2165/11584630-000000000-00000.
J-PAL. 2014a. “Student_Learning_cea-Data-Full-Workbook-1”. Jameel Abdul Poverty Action Lab.
———. 2014b. Learning: What Works. Policy Bulletin.
Kremer, Michael, Conner Brannen, and Rachel Glennerster. 2013. “The Challenge of Education and Learning in the Developing World.” Science (New York, N.Y.) 340 (6130): 297–300. doi:10.1126/science.1235350.
Levin, Henry, M., Clive Belfied, Fiona Hollands, Brooks Bowden, A., Henan Chang, Robert Shand, Yilin Pan, and Barbara Hanisch-cerda. 2012. Cost-Effectiveness Analysis of Interventions That Improve High School Completion.
Levin, Henry, M., and J. McEwan, Patrick. 2001. Cost-Effectiveness Analysis: Methods and Applications. Vol. 21. Thousand Oaks, CA: Sage.
McEwan, Patrick J. 2012. “Cost-Effectiveness Analysis of Education and Health Interventions in Developing Countries.” Journal of Development Effectiveness 4 (2): 189–213. doi:10.1080/19439342.2011.649044.
15

———. 2014. Improving Learning in Primary Schools of Developing Countries: A Meta-Analysis of Randomized Experiments.
Nguyen, Trang. 2008. Information, Role Models and Perceived Returns to Education: Experimental Evidence from Madagascar. Job Market Paper.
NICE International. 2014. Methods for Economic Evaluation Project (MEEP): Final Report.
OANDA. 2014. “Average Exchange Rates. fxAverage: Weekly, Monthly, Quarterly, or Yearly Averages, for Any Time Period since 1990.” http://www.oanda.com/currency/average.
Pradhan, Menno, Daniel Suryadarma, Amanda Beatty, Maisy Wong, Armida Alisjahbana, Arya Gaduh, and Rima Prama Artha. 2012. Improving Educational Quality through Enhancing Community Participation: Results from a Randomized Field Experiment in Indonesia.
Pritchett, Lant, and Justin Sandefur. 2013. Context Matters for Size : Why External Validity Claims and Development Practice Don’t Mix. 336. Working Paper.
Scott, Chris, and Ben Amenuvegbe. 1990. Effect of Recall Duration on Reporting of Household Expenditures: An Experimental Study in Ghana. Washington DC.
Vivalt, Eva. 2014. “How Much Can We Generalize from Impact Evaluation Results ?” New York University.
World Bank. 2012. Evaluation Study of Malawi’s Open Distance Learning Teacher Training Program: Year 1 Baseline Report.
———. 2013. International Development Association Project Appraisal Document on a Proposed Grant in the Amount of SDR 10 Million (US$15 Million Equivalent) to the Republic of Chad for an Education Sector Reform Project Phase II. Washington DC.
———. 2014. “Data for Community, Contract, and Civil Service Teachers Extracted from World Bank Public Expenditure Reviews”. Washington DC.
(OANDA 2014)
16

Tables
Table 1: Learning cost-effectiveness results and sensitivity analyses
ProgramAdditional SD
per $100
Impact on test scores (Standard
Error)
Lower bound impact
(90% CI)
Upper bound impact
(90% CI)
Lower bound additional SD per
$100 (90% CI)
Upper bound additional SD per
$100 (90% CI)Reference
Providing earnings information, Madagascar
118.34 0.202 (0.106) 0.03 0.38 16.19 220.49 Nguyen 2008
Streaming by achievement, Kenya 34.78 0.176 (0.077) 0.05 0.30 9.75 59.82 Duflo, Dupas, & Kremer 2012Linking school committee to local government, Indonesia
34.62 0.165 (0.067) 0.05 0.28 11.50 57.75 Pradhan et al. 2012
Electing school committee and linking to local government, Indonesia
13.34 0.216 (0.093) 0.06 0.37 3.89 22.78 Pradhan et al. 2012
Teacher incentives (year 2), Kenya 6.29 0.136 (0.071) 0.02 0.25 0.89 11.69 Glewwe, Ilias, & Kremer 2010Textbooks for top quintile, Kenya 3.56 0.218 (0.096) 0.06 0.38 0.98 6.14 Glewwe, Kremer, & Moulin 2009Remedial education, India 3.07 0.138 (0.047) 0.06 0.22 1.35 4.79 Banerjee et al. 2007Camera monitoring, India 2.28 0.170 (0.090) 0.02 0.32 0.29 4.26 Duflo, Hanna, & Ryan 2012Village-based schools, Afghanistan 2.13 0.588 (0.146) 0.35 0.83 1.26 2.99 Burde & Linden 2013Extra contract teacher + streaming, Kenya
1.97 0.248 (0.092) 0.10 0.40 0.77 3.17 Duflo, Dupas, & Kremer 2012
Individually-paced computer assisted learning, India
1.55 0.475 (0.068) 0.36 0.59 1.19 1.92 Banerjee et al. 2007
Girls' merit scholarships, Kenya 1.38 0.270 (0.160) 0.01 0.53 0.03 2.73 Kremer, Miguel, & Thornton 2009Read-a-Thon, Philippines 1.18 0.130 (0.050) 0.05 0.21 0.43 1.92 Abeberese, Kumler, & Linden 2013Minimum conditional cash transfers, 0.06 0.202 (0.118) 0.01 0.40 0.00 0.12 Baird, McIntosh, & Özler 2011
Source: Data from J-PAL 2014. Additional calculations by authors.Notes: SD means the standard deviation of a given set of test scores, and measures how much individual test scores change as a result of a program compared to the average test score of the group. $ costs reported in 2011 USD.
17

Table 2: Cost-effectiveness of improving learning – Percentage of draws that each program is in the bottom and top quartile of cost-effectiveness, and is as cost-effective as Girls’ merit scholarships, across 100,000 draws
ProgramAdditional SD per
$100Standard deviation
Percentage of draws in bottom quartile of cost-
effectiveness
Percentage of draws in top
quartile of cost-effectiveness
Percentage of draws as cost-effective as
gilrs'merit scholarships
Providing earnings information, Madagascar 118.34 102.15 3% 96% 97%Streaming by achievement, Kenya 34.78 25.03 1% 91% 99%Linking school committee to local government, Indonesia 34.62 23.13 1% 92% 99%Electing school committee and linking to local government, Indonesia
13.34 9.45 2% 19% 98%
Teacher incentives (year 2), Kenya 6.29 5.40 7% 2% 93%Textbooks for top quintile, Kenya 3.56 2.58 9% 0% 92%Remedial education, India 3.07 1.72 7% 0% 95%Camera monitoring, India 2.28 1.98 27% 0% 77%Village-based schools, Afghanistan 2.13 0.87 15% 0% 92%Extra contract teacher + streaming, Kenya 1.97 1.20 29% 0% 79%Individually-paced computer assisted learning, India 1.55 0.37 55% 0% 78%Girls' merit scholarships, Kenya 1.38 1.35 61% 0% 50%Read-a-Thon, Philippines 1.18 0.74 82% 0% 33%Minimum conditional cash transfers, Malawi 0.06 0.06 100% 0% 0%
Source: Data adapted from J-PAL (2014). Calculations by authors.Notes: SD means standard deviations. Using the mean and standard deviation of the impact estimate for each program and assuming a normal distribution, we randomly select a simulated point estimate for each program, re-doing this 100,000 times. We then calculate the proportion of times, out of the 100,00 draws, that each program falls in the top quartile, in the bottom quartile, and the proportion of times it is more cost-effective than Girls'merit scholarships (i .e., produces at least 1.38 SD in learning gains per $100), which are the figures presented in this table.
18
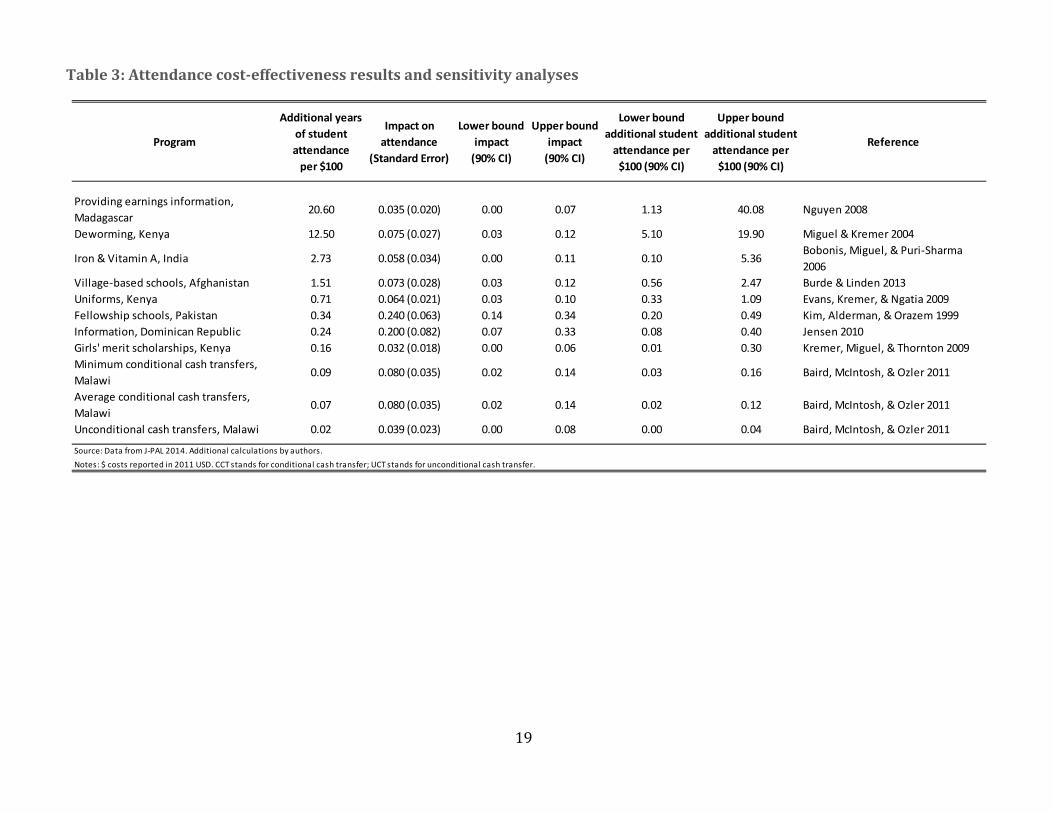
Table 3: Attendance cost-effectiveness results and sensitivity analyses
Program
Additional years of student attendance
per $100
Impact on attendance
(Standard Error)
Lower bound impact
(90% CI)
Upper bound impact
(90% CI)
Lower bound additional student
attendance per $100 (90% CI)
Upper bound additional student
attendance per $100 (90% CI)
Reference
Providing earnings information, Madagascar
20.60 0.035 (0.020) 0.00 0.07 1.13 40.08 Nguyen 2008
Deworming, Kenya 12.50 0.075 (0.027) 0.03 0.12 5.10 19.90 Miguel & Kremer 2004
Iron & Vitamin A, India 2.73 0.058 (0.034) 0.00 0.11 0.10 5.36Bobonis, Miguel, & Puri-Sharma 2006
Village-based schools, Afghanistan 1.51 0.073 (0.028) 0.03 0.12 0.56 2.47 Burde & Linden 2013Uniforms, Kenya 0.71 0.064 (0.021) 0.03 0.10 0.33 1.09 Evans, Kremer, & Ngatia 2009Fellowship schools, Pakistan 0.34 0.240 (0.063) 0.14 0.34 0.20 0.49 Kim, Alderman, & Orazem 1999Information, Dominican Republic 0.24 0.200 (0.082) 0.07 0.33 0.08 0.40 Jensen 2010Girls' merit scholarships, Kenya 0.16 0.032 (0.018) 0.00 0.06 0.01 0.30 Kremer, Miguel, & Thornton 2009Minimum conditional cash transfers, Malawi
0.09 0.080 (0.035) 0.02 0.14 0.03 0.16 Baird, McIntosh, & Ozler 2011
Average conditional cash transfers, Malawi
0.07 0.080 (0.035) 0.02 0.14 0.02 0.12 Baird, McIntosh, & Ozler 2011
Unconditional cash transfers, Malawi 0.02 0.039 (0.023) 0.00 0.08 0.00 0.04 Baird, McIntosh, & Ozler 2011
Source: Data from J-PAL 2014. Additional calculations by authors.Notes: $ costs reported in 2011 USD. CCT stands for conditional cash transfer; UCT stands for unconditional cash transfer.
19

Table 4: Cost-effectiveness of improving student attendance – Percentage of draws each program is in the bottom and top quartile of cost-effectiveness, and is as cost-effective as Girls’ merit scholarships, across 100,000 draws
ProgramAdditional years of student attendance
per $100
Standard deviation
Percentage of draws in bottom quartile of cost-
effectiveness
Percentage of draws in top
quartile of cost-effectiveness
Percentage of draws as cost-effective as
scholarships
Providing earnings information, Madagascar 20.60 19.48 4% 93% 96%Deworming, Kenya 12.50 7.40 0% 98% 100%Iron & Vitamin A, India 2.73 2.63 5% 7% 95%Village-based schools, Afghanistan 1.51 0.95 1% 1% 99%Uniforms, Kenya 0.71 0.38 0% 0% 99%Fellowship schools, Pakistan 0.34 0.15 0% 0% 98%Information, Dominican Republic 0.24 0.16 7% 0% 79%Girls' merit scholarships, Kenya 0.16 0.15 26% 0% 49%Minimum conditional cash transfers, Malawi 0.09 0.07 70% 0% 5%Average conditional cash transfers, Malawi 0.07 0.05 85% 0% 0%Unconditional cash transfers, Malawi 0.02 0.02 100% 0% 0%
Source: Data adapted from J-PAL (2014). Calculations by authors.Notes: Using the mean and standard deviation of the impact estimate for each program and assuming a normal distribution, we randomly select a simulated point estimate for each program, re-doing this 100,000 times. We then calculate the proportion of times, out of the 100,00 draws, that each program falls in the top quartile, in the bottom quartile, and the proportion of times it is more cost-effective than Girls'merit scholarships (i .e., produces at least an additional 0.16 years of student attendance per $100), which are the figures presented in this table.
20

Table 5: Cost-effectiveness of remedial education program using community teacher salaries from other countries, holding all else constant
Country Type of teacherMonthly community teacher salary in base year currency
Base year currency
Monthly community teacher salary in 2011 USD
Additional SD per $100
Niger Contract teacher 3,333.33 2003 CFA 6.91 4.30Guinea Community teacher 7,500.00 1998 GNF 8.04 4.01India (Balsakhi remedial education program) Community teacher 7,500.00 2001 INR 13.24 3.07
Madagascar Community teacher 12.83 2003 USD 15.42 2.79Chad Community teacher 10,000.00 2013 CFA 19.42 2.40Benin Contract teacher 25.00 2003 USD 30.05 1.74Malawi Community teacher 6,672.62 2011 KW 43.12 1.31Nepal Contract teacher 12,024.83 2010 NPR 168.33 0.38Source: Community and contract teacher sa lary data for Benin, Guinea, Madagascar, Nepal , and Niger are from a database extracted from World Bank Publ ic Expenditure Reviews (World Bank 2014), those for Chad are from the Project Appra isa l Document of the Education Sector Reform Project Phase II (World Bank 2013), those for Malawi from the basel ine survey report of the impact eva luation of Onl ine Dis tance Learning (World Bank, 2012), and those for India from J-PAL (2014). The exchange rate for India and average US inflation rates come from J-PAL (2014); average annual exchange rate data for a l l other countries are from OANDA (2014).Notes : SD means s tandard deviations . The reported monthly community teacher sa laries presented in 2011 USD are ca lculated by converting the community teacher sa laries in loca l currency in the various base years (the year the data were col lected) to USD in the given base year, before inflating to 2011 USD us ing the inflation GDP deflator (annual %). Where teacher sa laries are reported in USD as the base year currency, this reflects the uni t of measure of the source data and does not imply that sa laries are actual ly pa id in USD.
21

Table 6: Cost-effectiveness of remedial education program using high school graduate wages from other countries, holding all else constant
Country Monthly salary of high school graduate in base year currency
Base year currency
Remedial tutor equivalent salary in 2011 USD
Additional SD per $100
India (Balsakhi remedial education program) 7,500.00 2001 INR 13.24 3.07
NeighboursTajikistan 364.70 2009 TJS 90.23 0.68
Similar GDP per capitaNicaragua 3,774.29 2009 NIO 196.08 0.33Nigeria 20,165.13 2012 NGN 125.21 0.51
PoorerEthiopia 1,234.35 2011 ETB 73.48 0.82Uganda 284,361.30 2011 UGX 114.11 0.55
RicherBulgaria 368.54 2007 BGN 277.47 0.24Panama 556.47 2008 PAB 580.37 0.12
Source: The monthly sa laries of high school graduates in Ta jiki s tan, Nicaragua, Nigeria , Ethiopia , Uganda, Bulgaria , and Panama are ca lculated us ing Living Standards Measurement Study data (World Bank 2014). Actual data for remedia l tutor sa laries in India are from J-PAL (2014). The exchange rate for India and average US inflation rates come from J-PAL (2014); average annual exchange rate data for a l l other countries are from OANDA (2014).Notes : SD means s tandard deviations . The reported remedia l tutor equiva lent sa laries presented in 2011 USD are ca lculated by converting the average monthly sa laries of sa laried workers who completed high school (and no further education) in loca l currency in the various base years (the year the data were col lected) to USD in the given base year, before inflating to 2011 USD us ing the inflation GDP deflator (annual %).
22

Table 7: Examples of cost reporting across programs
Cost estimates presentation Program
“Balsakhis were paid between Rs. 500 and Rs. 750… Overall, the Balsakhi Program cost is approximately Rs. 107 ($2.25) per student per year."
Remedial education, India (Banerjee 2007)
“Schools… receive grants equal to $2.65 per student or, on average, $727 per school."
Textbooks for top quintile, Kenya (Glewwe et al. 2009)
“Transfer amount offered to the household ($5/month)" Minimum conditional cash transfers, Malawi (Baird et al. 2011)
“We estimate that the cost of implementing the grant was about US$321 (excluding the grant itself) per school”
Linking school committee to local government, Indonesia (Pradhan et al. 2012)
"A quick back-of-the envelope calculation using my results shows that the statistics intervention would cost 2.30 USD for an additional year of schooling and 0.04 USD for additional 0.10 standard deviations in test scores"
Providing earnings information, Madagascar (Nguyen 2008)
23

Figures
Figure 1: Cost-effectiveness of improving learning
Source: Data from J-PAL (2014a). Calculations by authors.
0 1 2 3 4 5
Textbooks for top quintile, Kenya
Remedial education, India
Camera monitoring, India
Village-based schools, Afghanistan
Extra contract teacher + streaming, Kenya
Individually-paced computer assisted learning, India
Girls merit scholarships, Kenya
Read-a-Thon, Philippines
Minimum conditional cash transfers, Malawi
Additional SD per $100
0 50 100
Providing earnings information, Madagascar
Streaming by achievement, Kenya
Linking school committee to local government,Indonesia
Electing school committee and linking to localgovernment, Indonesia
Teacher incentives (year 2), Kenya
24

Figure 2: Cost-effectiveness of improving learning – Results re-ordered by impact values possible within 90 percent confidence interval
Programs ordered by decreasing cost-effectiveness
Programs re-ordered by plausible cost-effectiveness (using confidence intervals)
Additional SD per $100
Providing earnings information, Madagascar
Individually-paced computer assisted learning, India
1.55
Streaming by achievement, Kenya
Village-based schools, Afghanistan
2.13
Linking school committee to local government, Indonesia
Remedial education, India 3.07
Electing school committee and linking to local government, Indonesia
Linking school committee to local government, Indonesia
34.62
Teacher incentives (year 2), Kenya
Streaming by achievement, Kenya
34.78
Textbooks for top quintile, Kenya
Providing earnings information, Madagascar
118.34
Remedial education, India Camera monitoring, India 2.28 Camera monitoring, India Read-a-Thon, Philippines 1.18 Village-based schools, Afghanistan
Teacher incentives (year 2), Kenya
6.29
Extra contract teacher + streaming, Kenya
Electing school committee and linking to local government, Indonesia
13.34
Individually-paced computer assisted learning, India
Textbooks for top quintile, Kenya
3.56
Girls’ merit scholarships, Kenya
Minimum conditional cash transfers, Malawi
0.06
Read-a-Thon, Philippines
Extra contract teacher + streaming, Kenya
1.97
Minimum conditional cash transfers, Malawi
Girls’ merit scholarships, Kenya
1.38
Source: Data adapted from J-PAL (2014a). Calculations by authors. Note: This is an example of one of many possible re-orderings, which is consistent with the 90 percent confidence interval cost-effectiveness estimates. It is achieved by re-ordering the 7 programs with the highest point estimates in descending order of the lower bound of cost-effectiveness, and the 7 programs with the lowest point estimates in ascending order of the upper bound.
25

Figure 3: Cost-effectiveness of improving learning – Percentage of times each program is in the bottom and top quartile of cost-effectiveness, across 100,000 draws
Source: Data adapted from J-PAL (2014a). Calculations by authors.
0% 20% 40% 60% 80% 100%
Providing earnings information, Madagascar
Streaming by achievement, Kenya
Linking school committee to local government,Indonesia
Electing school committee and linking to localgovernment, Indonesia
Teacher incentives (year 2), Kenya
Textbooks for top quintile, Kenya
Remedial education, India
Camera monitoring, India
Village-based schools, Afghanistan
Extra contract teacher + streaming, Kenya
Individually-paced computer assisted learning, India
Girls' merit scholarships, Kenya
Read-a-Thon, Philippines
Minimum conditional cash transfers, Malawi
Percentage of draws in bottom quartile of
cost-effectiveness
0% 20% 40% 60% 80% 100%
Percentage of draws in top quartile of cost-effectiveness
26

Figure 4: Cost-effectiveness of improving learning - percentage of times each program is as cost-effective as Girls’ merit scholarships, across 100,000 draws
Source: Data adapted from J-PAL (2014a). Calculations by authors.
0% 20% 40% 60% 80% 100%
Providing earnings information, Madagascar
Streaming by achievement, Kenya
Linking school committee to local government, Indonesia
Electing school committee and linking to local government, Indonesia
Teacher incentives (year 2), Kenya
Textbooks for top quintile, Kenya
Remedial education, India
Camera monitoring, India
Village-based schools, Afghanistan
Extra contract teacher + streaming, Kenya
Individually-paced computer assisted learning, India
Girls' merit scholarships, Kenya
Read-a-Thon, Philippines
Minimum conditional cash transfers, Malawi
Percentage of draws as cost-effective as Girls' merit
scholarships
Girls’ merit scholarships, Kenya
27

Figure 5: Cost-effectiveness of improving attendance
Source: Data from J-PAL (2014a). Calculations by authors.
0 5 10 15 20 25
Providing earnings information, Madagascar
Deworming, Kenya
Iron & Vitamin A, India
Village-based schools, Afghanistan
Uniforms, Kenya
Fellowship schools, Pakistan
Information, Dominican Republic
Girls' merit scholarships, Kenya
Minimum conditional cash transfers, Malawi
Average conditional cash transfers, Malawi
Unconditional cash transfers, Malawi
Additional student attendance per $100
28
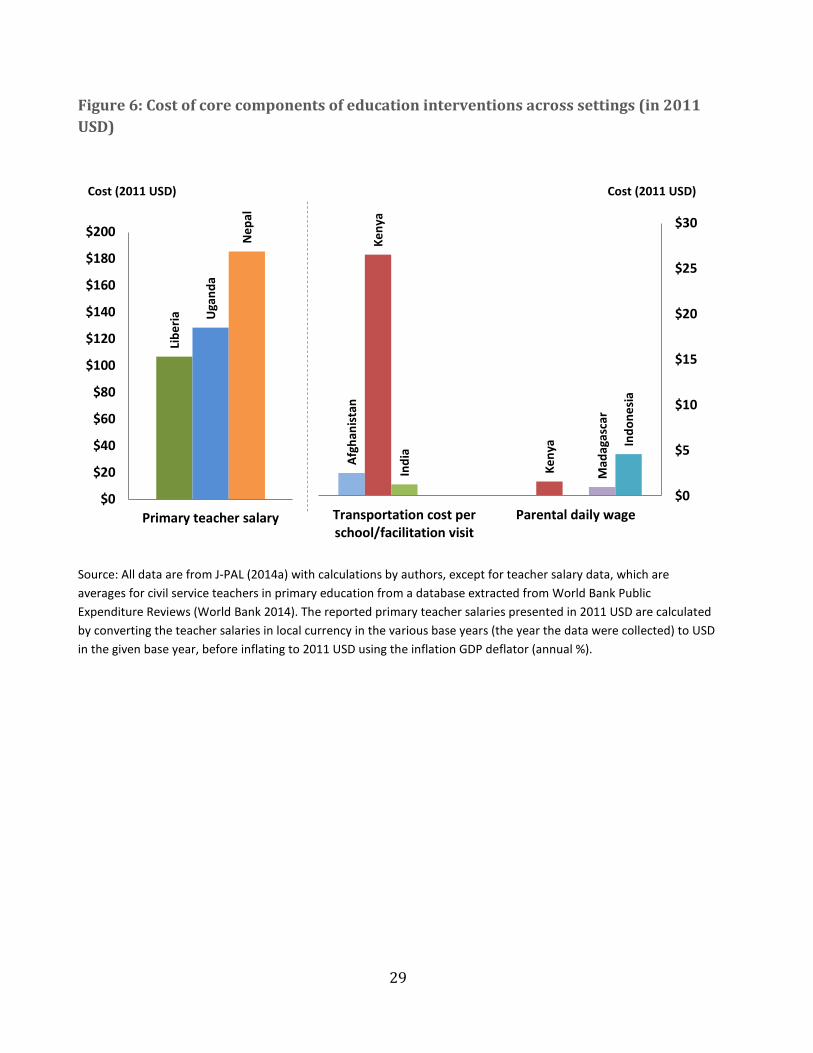
Figure 6: Cost of core components of education interventions across settings (in 2011 USD)
Source: All data are from J-PAL (2014a) with calculations by authors, except for teacher salary data, which are averages for civil service teachers in primary education from a database extracted from World Bank Public Expenditure Reviews (World Bank 2014). The reported primary teacher salaries presented in 2011 USD are calculated by converting the teacher salaries in local currency in the various base years (the year the data were collected) to USD in the given base year, before inflating to 2011 USD using the inflation GDP deflator (annual %).
Libe
ria Uga
nda
Nep
al
$0
$20
$40
$60
$80
$100
$120
$140
$160
$180
$200
Primary teacher salary
Afgh
anis
tan
Keny
a
Keny
a
Indi
a
Mad
agas
car
Indo
nesi
a
Transportation cost perschool/facilitation visit
Parental daily wage$0
$5
$10
$15
$20
$25
$30
Cost (2011 USD) Cost (2011 USD)
29

Figure 7: Cost differences within countries: Transportation cost per school or facilitation visit across Kenyan education programs (2011 USD)
Source: Data from J-PAL (2014a).
Figure 8: Simulated cost-effectiveness of improving learning using a remedial education program, using local data on the cost of community teachers
Source: Data adapted from J-PAL (2014a). Calculations by authors. Notes: Unlabeled bars are the cost-effectiveness of other learning interventions, illustrated in Figure 1.
$27
$32 $32 $32
$23
$24
$25
$26
$27
$28
$29
$30
$31
$32
$33
Extra teachers &Streaming
Girls' meritscholarships
Textbooks Uniforms
Cost (2011 USD)
0 1 2 3 4 5
Niger (simulation)Guinea (simulation)
Remedial education, India (actual estimate)Madagascar (simulation)
Benin (simulation)
Nepal (simulation)
Additional SD per $100
30

Figure 9: Number of cost ingredients per education study
Source: Data adapted from J-PAL (2014a). Calculations by authors.
Figure 10: Percentage of cost explained by largest cost ingredient
Source: Data adapted from J-PAL (2014a). Calculations by authors.
0
1
2
3
1 2 3 4 5 6 7 8 9 10 11
Num
ber o
f stu
dies
Number of cost ingredients
0%
20%
40%
60%
80%
100%
0 2 4 6 8 10 12Number of cost ingredients
Median number of cost ingredients
Computer assisted learning
Earnings information
31

Figure 11: Percentage of cost explained by largest 2 cost ingredients
Source: Data adapted from J-PAL (2014a). Calculations by authors.
Figure 12: Program cost per beneficiary student
Source: Data adapted from J-PAL (2014a). Calculations by authors.
0%
20%
40%
60%
80%
100%
0 2 4 6 8 10 12
-$100
$0
$100
$200
$300
$400
$500
0 5,000 10,000 15,000 20,000 25,000 30,000 35,000
Cost
/stu
dent
201
1 U
SD
Total number of students
32

Figure 13: Expenditure Recall in Ghana
Source: Adapted from Scott & Amenuvegbe 1990.
70
75
80
85
90
95
100
1 day 2 days 3 days 7 days 14 days 1 year
33