cost control and margin protection in the south african mining and metals industry · ·...
TRANSCRIPT

1
Cost control and margin protection in the South African mining and metals industry

2

3
AcknowledgmentsEY would like to thank everyone who contributed to this research in South Africa, the rest of Africa and the rest of the world. In particular, we also thank everyone that generously gave their time to be interviewed.

4
Cost control and margin protection for the South African mining and metals industry is based on research and interviews conducted by EY between May 2013 and August 2013 with senior executives from a number of mining and metals companies operating in South Africa. Executives were interviewed and asked to prioritize their top cost control and margin protection priorities.

5
Top cost control and margin protection priorities for South African mining and metals companies
1 Cost of labor and labor productivity
2 Escalating electricity and fuel prices
3 Managing transportation and logistical costs
4 Effective management of capital
5 Supply chain and procurement practices
6 Commodity price and currency volatility
7 Corporate, administrative and overhead costs
8 Safety, health and environmental costs
9 Cost of being a socially responsible corporate citizen
Exploring, discovering and replacing reserves and resources10

6
Impact of softer commodity prices on the South African mining and metals industry

7
The favorable commodity prices experienced during the past decade incentivized the mining industry to focus on increasing production, often to the detriment of cost competitiveness and productivity.
Nearly all cost categories in the South African mining and metals industry
indexes. Many of the input costs are driven by “administered prices” such as electricity and water or by international pricing of steel, oil and rubber.
would average 5.6% in 2013, 5.5% in 2014 and 5.4% in 2015.2 Although mining
(mining PPI) was 7% at 30 June 2013.
per annum average rise in diesel cost, due to higher international oil price 15.7%
per annum increase in reinforcing steel price15.3%
per annum rise in average remuneration paid per worker
12%
26% per annum average increase in electricity prices to mining sector, from ZAR0.18 per kWh in 2007 to ZAR0.61 per kWh
0 5 10 15 20 25 30
Mining machinery
Structural steel
Reinforcing steel
Labour costs
Cement
Diesel
PGM mining cash costs per 4e
Electricity prices for mining
4.4
11.2
15.3
12
9.1
15.7
7.2
18.1
26
Source: Statistics SA, Chamber of Mines of South Africa EAU
1“Crisis in SA gold mining sector? Finding a way forward,” Chamber of Mines of South Africa, July 2013.
2 Business Day, 28 February 2013.
average annual increase in costs, 2007 to 2012
According the Chamber of Mines of South Africa (CoMSA),1 costs have increased between 2007 and 2012 as follows:

8
There are many reasons for the rampant cost increases, which include a series of complex issues. Nevertheless, since the
products. Global capital is more mobile than ever and is unsympathetic to operations or countries that are perceived to be performing poorly on cost performance, productivity or risk management. As such, relative global cost competitiveness has more of an impact today than ever before.
South Africa’s mining industry continues to be highly dependent on foreign capital to fund existing operations as well as
rapidly changing cost structures, mine planning and productivity expectations of globally orientated investors. As with many
is eroding its historical low labor cost advantage. Accordingly, this transition to a higher labor cost environment will require changes to mine plans and a combination of improvements to productivity through offsets and increased use of technology and automation. Those mining companies that are best able to make this transition will become the future leaders in South African mining.
as bulk commodities and base metals.
In South Africa, nearly 40% of current mined product sales relate to gold and platinum group metals. Due to their relatively
Furthermore, the gold and platinum mines also employ nearly two-thirds of South Africa’s 514,000 mine workers. These
objectives of South Africa. Accordingly, efforts to diversify South Africa’s “basket of produced commodities” could alleviate some of the pressures they are facing and assist with the overall growth and sustainability of South Africa’s mining industry.
The recent softening of precious metals prices was somewhat later than the softening of other commodity prices. As such, precious metals producers have entered the margin protection challenge somewhat later than their peers in other commodities. Accordingly, precious metals producers should take advantage of the many valuable lessons that can be learned around the mining world on reducing costs, and importantly, embedding better margin performance through the raising of productivity of labor and capital.
Precious metal producers are also at the forefront of the complex and important social challenges of South Africa. The responsible dealing with these challenges could potentially impose short-term additional costs on the sector that may not be borne in other parts of the world; however, these costs may be necessary to set up and support the sustainability of the sector over the longer term.
experiencing competing demands on its stretched energy supplies. This represents a real constraint for the sector and lower energy operations will be necessary to succeed in an environment of higher energy cost and potentially unreliable supply.
mining industry. Beyond the industry’s need for competitively priced and sustainable electricity supply, South Africa’s port, rail, road and water infrastructure also requires additional investment to support the development of new projects and to enable cost competitiveness of mine logistics.

9
Gold
Iron ore
Chromium ore
Manganese ore
PGMs
Nickel
Coal
Copper
Building materials
Other non-metallic minerals
Other metallic minerals
26%
2%
5%
21%
17%
2%1%
3%
18%2%
3%
Investors have also expressed their frustrations with the lack of capital returns as share prices have fallen and are applying increased pressure for greater cash
need for continued capital expenditure (stay-in-business, expansion and exploration capital) to secure new reserves and resources, which are critical for growth and future investment opportunities. For these reasons, the management of costs has been a key priority for executives of mining companies globally. As they try to embed a lower cost environment the productivity agenda has risen in prominence. The focus of senior management has shifted from production at any cost to being at the “bottom of costs per mined tonne and at the upper ranges of productivity.”3
Companies that successfully refocus on productivity, cost control and margin protection will position themselves well to take advantage of opportunities when, true to the industry’s cyclical nature, new capital investment returns. The need to harness costs is necessary and urgent;
activities and maintaining enterprise value.
The period of weaker commodity prices also offers South Africa’s mining and metals industry an opportunity to invest in those areas required to support growth, reposition its business case as a priority investment destination, and capitalise on the next commodity cycle.
3“Drilling down and polishing up,” The Australian Financial Review, 28 February 2013 via Factiva © 2013, Fairmax Media Management Pty Limited.
of South Africa’s largest mining and metals companies on their key priorities and approaches to controlling costs and protecting or improving margins.
Source: Statistics SA
Contribution of commodities to total sales revenue 2012
Wickus BothaAfrica Mining and Metals Leader

10
Cost of labor and labor productivity 1

11
was caused by lower commodity prices, rampant cost increases, limited available capital for investing, increased risk and complex production challenges.
from 20%-25% of total production costs for modern, mechanized and open cast mines to 50%-60% for the mature deep-level underground mines. Despite the abovementioned challenges, the South African mining industry continues to be one of the largest employers in South Africa. With a work force of 514,000,4 the South African mining industry employs, and creates opportunities for its people across the entire spectrum of skills and experience. The gold and platinum mines employ more than two-thirds of the workers in the mining industry.
Worker demands for increased salaries and wages have continued to plague the industry. Despite the lower commodity prices and eroding margins, industrial actions and labor strikes have been increasing in both frequency and duration. It is estimated that South Africa’s mining industry lost more than ZAR15 billion in
According to the CoMSA, the average remuneration per worker has increased by more than 12% per year since 2007, resulting in an average annual increase
6 In this regard, it is crucial for companies to ensure that they communicate the
candidly and transparently with its employees.
While workers may aspire to higher real wages, during weak commodity price cycles the dialogue should be focused on achieving productivity improvements
labor productivity increases for the past number of years. In contrast, a notable and sustained decrease in labor productivity was experienced. By example, research by CoMSA indicates that since 2007 labor productivity in the gold mining industry, expressed as kilograms produced by worker, declined by 35%.
4“Quarterly employment statistics, March 2013,” Statistics South Africa, 18 June 2013.
5“Centralised collective bargaining in the South African gold industry,” Chamber of Mines of South Africa website, http://www.bullion.org.za/documents/wages 2013/6909_13%20FS%20BARGAINING%2036BB.pdf, accessed 16 July 2013.
6“Crisis in SA gold mining sector? Finding a way forward,” Chamber of Mines of South Africa, July 2013.
The CoMSA5 has calculated that the cost of one day of industrial action in the South African gold mining industry results in:
Loss of taxes per day
ZAR45 million
Loss of wages and salaries per dayZAR100 million
Loss of sales by suppliers to the mining industry per day
ZAR10 million
ZAR350 million Loss of revenue per day

12
and infrastructure. All these factors contribute to the overall productivity. Unfortunately, due to the complexity and
short-term and in most cases require longer-term strategies and operational discipline.
and performance. Practical examples of some of the challenges and contributing factors include the traveling time it takes workers to reach the face from surface in the deep-level gold and platinum mines, production disruptions due to section 54 safety stoppages by mine health and safety inspectors, and the increasing levels of absenteeism and extended holidays faced by the mining industry. As an example, currently the gold and platinum industries average only 220 productive shifts a year out of a possible 300 available shifts. Furthermore, these low levels of labor utilization
7
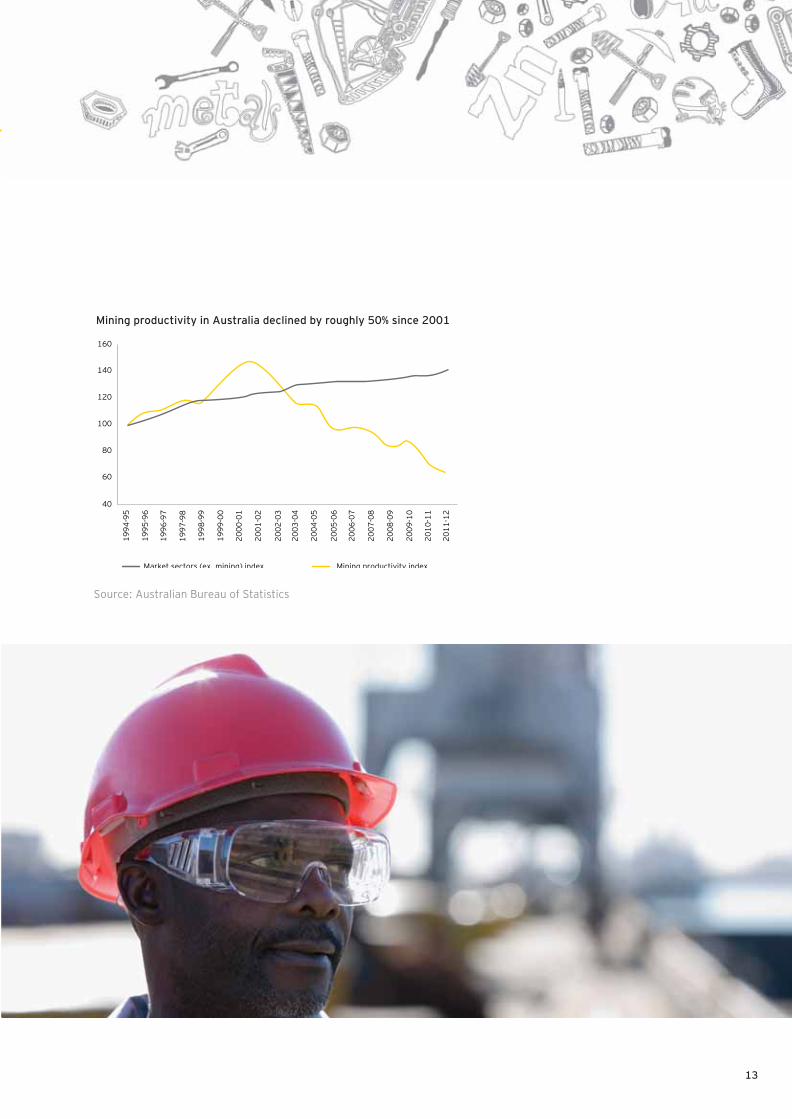
Declining productivity levels is not uniquely South African, and other prominent countries with sizable mining industries face similar challenges. In a study performed by the Australian Bureau of Statistics (ABS), Australia’s unadjusted multifactor productivity (MFP) in the mining industry declined by 50% since 2001. Equally, the United States and Canada also experienced declining productivity levels. However, in response to declining labor productivity several
practices, increased number of shifts and pooling of capital equipment.
300
250
200
1990
=100
150
100
50
-
Real labour costs per kg produced indexed
Productivity, kgs per worker indexed
199019921994199619982000200220042006200820102012
Source: Statistics SA
7 Financial Mail, 11 July 2013.
RSA gold mining, labor productivity (kgs produced per employee) and real labor costs per kg of gold produced,
with base indexed to 1990
13
1994
-95
1995
-96
1996
-97
1997
-98
1998
-99
1999
-00
2000
-01
2001
-02
2002
-03
2003
-04
2004
-05
2005
-06
2006
-07
2007
-08
2008
-09
2009
-10
2010
-11
2011
-12
Market sectors (ex. mining) index Mining productivity index
40
60
80
100
120
140
160
Source: Australian Bureau of Statistics
Mining productivity in Australia declined by roughly 50% since 2001

14
According to Statistics South Africa, the mining industry
the job losses in the sector to 20,000 since July 2012.8 Furthermore, mining value-added output was 3.1% lower in 2012 than in 2011. The most notable production losses recorded were attributed to copper production declining by 21.8%, gold production declining by 14.5% and platinum-group metals output declining by 12%.9
protracted industrial strike actions in the mining industry caught the attention of all the major stakeholders involved to come together to ensure settlements are reached, not only in terms of wage negotiations but also in restoring law and order in community relations. A positive development has been the signing of the framework agreement for sustainable mining, facilitated by the Government of South Africa, aimed at providing safeguards for the upcoming wage negotiations. With inputs made by the Association of Mineworkers and Construction Union (AMCU), the National Union of Mineworkers (NUM), Solidarity, the United Association of South Africa (UASA), the Chamber of Mines of South Africa, the South African Mining Development Association (SAMDA) and Government, the framework also provides a
addressed in the near, medium and long-term.10
Another key long-term challenge for the industry is the availability of skilled and appropriately experienced talent. Although the pressure has been relieved to some extent in the short-term through the slowdown in new investments and developments, the ability to attract and retain the
future. However, in the long-term, mining companies
will have to change labor practices as well as embrace technology because new-generation employees are more technologically savvy and are looking for jobs where technology is central to job expectations. Furthermore, in order to reduce the consumption of natural resources; minimise health, safety and environmental risks; be
modern mining operations will have no choice but to embrace technology and become more mechanized and sophisticated. In turn, this will require more skilled labor.
future work force requirements, countries such as Australia and Canada that have experienced substantial
constraints.
There is a strong correlation between skills, productivity,
competitiveness, which is critical in supporting the South African mining industry to regain its position as one of the premier mining destinations. To a large extent, the favorable commodity prices of the past decade concealed the true impact of the prolonged above-
levels on overall production costs as well as production unit costs. In an effort to maintain operating margins and improve cost competitiveness, companies are required to implement decisive measures to improve the value it derives from its work force.
Source: Bradley and Sharpe, 2009; BREE, 2013
Average annual growth in productivity (%) during 2000-07
Labor Capital MFP
Australia -4.02 -1.41 -1.99
US 0.66 -2.25 -1.68
Canada -2.21 -0.28 -1.07
8“SA platinum industry could shed 145 500 jobs by 2015,” Mining Weekly, 18 June 2013.
9“Strikes cost SA R15.3bn in mining output in 2012,” Mining Weekly, 27 February 2013.
10“Mining’s who’s-who leave AMCU out to dry as accord is signed,” Mining Weekly, 3 July 2013.

15
Responding to the challenge
future resource requirements as well as where these resources can be found
Embrace new technology and mechanization
Train existing staff to perform a number of functions
Introduce initiatives to optimize productivity, utilization and shared value
Create new and exciting opportunities for current staff members to retain their skills in the business for a longer period of time
Rationalise work force in areas where resources are saturated
lifestyles
Initiate training programs for retired/skilled workers to train new, entry-level workers
Create employment offers with a better balance between remuneration, career opportunity and shared value
Introduce and communicate “review measures” to allow the company to hold individuals responsible for their performance
Source talent from aligned sectors and a broader demographic
Enter into strategic alliances with institutions and other communities
Reclaim the importance of communicating directly with employees

16
Escalating electricity and fuel prices2

17
Historically, one of South Africa’s key competitive advantages was the
price increases, companies have been struggling to adapt their consumption patterns and mining methods, resulting in substantially higher electricity bills and notable margin erosion. Fuel and electricity prices have both a direct and an indirect impact on the mining industry, because the mining industry’s suppliers are also affected by the increases.
In 2013, the National Energy Regulator of South Africa (Nersa) granted Eskom
increases being more modest than in the previous few years, these increases
for South Africa.11
South Africa’s current electricity prices are considered comparable to the other BRICS (Brazil, Russia, India, China and South Africa) countries; however, at the current rate of tariff increases, South Africa’s electricity may become among the more expensive of mining-oriented economies. The effect that these continued increases have had on the mining industry is that the cost structures and operating models that mining companies have developed during periods of
0
5
10
15
20
25
30
35
2002 2003 2004 2005 2006 2007 2008 2009 2010 2011 2012
Tariff increase % CPI %
Source: Eskom12
11 Business Day, 28 February 2013.
12“Pricing documents,” Eskom website, http://www.eskom.co.za/c/article/149/pricing-documents/, accessed 10 July 2013.
Electricity tariff increase % vs CPI

18
As a result of the challenges regarding availability of electricity, companies have had to supplement their electricity supply with back-up generators. As such, electricity costs relate to both the tariff increases as well as the additional investment that companies had to make to secure supply either through their own generation or through Eskom produced power.
Escalating fuel (petrol, diesel and fuel derivatives) prices is another cost that mining companies are currently expected to absorb. Ongoing fuel price increases, as well as fuel levies and the introduction of carbon taxes in 2015, will add to an already heavy burden placed on road freight operators.18 The ever-increasing fuel price will have a roll-on effect on all forms of transportation involved in the mining industry.
18
9.13
9
6
4
Brazil
South Africa
China
India
Russia
Source: Brazil,13 Russia,14 Indian,15 China,16 South Africa17
13“Brazil’s power groups warn on price cuts,” ft.com, 26 November 2012.
14“Finland hopes to sell power to Russia to make cables pay,” Reuters, 23 October 2012.
15“Electricity prices in different states of India,” Indian Power Market website, http://www.indianpowermarket.com/2012/09/electricity-prices-in-different-states.html, accessed 12 August 2013.
16“The price of power: China’s confusing electricity rates,” Want China Times, 15 May 2013.
17“2011 - 2012 International Electricity & Natural Gas Report & Price Survey,” NUS Consulting Group, June 2012.
18“Mining industry can ill afford ongoing fuel increases,” Mining Weekly, 31 May 2013.
South African electricity prices vs other BRICS countries (US cents/kWh)

19
The Bloomberg Gas Price Ranking19 ranks 60 countries by average retail price and by “pain at the pump,” which measures the percentage of average daily income needed to buy a gallon of fuel. According to Bloomberg Rankings, South African fuel prices are considered to be reasonable and in the second quartile of the global cost curve. However, based on the all-in costs of fuel, South Africa’s volatile currency, its dependence on road transport and fuel prices in relation to average remuneration, South Africa’s fuel is considered to be the 11th most expensive.
strategies of the mines are dependent on high volumes of exports.
500
600
700
800
900
1,000
1,100
1,200
1,300
1,400
2006 2007 2008 2009 2010 2011 2012 2013
RSA
c/l
itre
Petrol 95 unleaded Diesel 0.005% sulphur
19“Highest and cheapest gas prices per country,” Bloomberg website, http://www.bloomberg.com/slideshow/2013-02-13/highest-cheapest-gas-prices-by-country.html#slide1, accessed 7 August 2013.
South Africa average petrol and diesel prices, 2006 to 2013
RSA
c/l
iter
sulfur

20
0.06
3.47
4.74
5
5.06
5.4
9.89
0 2 4 6 8 10 12
Venezuela
Russia
China
India
South Africa
Brazil
Turkey
60
35
9
2
11
20
7
60
50
45
42
41
39
1
0 10 20 30 40 50 60
Venezuela
Russia
China
India
South Africa
Brazil
Turkey
Rank by most expensive gas Rank by pain at the pump
Source: Created by Bloomberg Rankings using data compiled by Bloomberg, Associates for International Research Inc. (AIRINC), Europe’s Energy Portal, the International Monetary Fund and the U.S. Energy Information Administration. Country descriptions draw from the CIA World Factbook and the Organization for Economic Co-operation and Development. Gas prices are from Jan. 3-18.
Price per gallon of gasoline (US$)
South Africa rank vs. BRICS vs. highest and cheapest

21
Responding to the challengeCreate own or partnered energy supply
Form partnerships to share energy creation and energy consumption with respect to energy-intensive equipment
Implement smarter scheduling of processes and energy consumption activities to reduce peak usage periods and scale back on idle time
Investigate potential partnerships with suppliers of energy and fuel
Review current energy and fuel supply contracts for lower prices over longer terms
Enter into negotiations with suppliers for lower-cost sources over the long-term

22
Managing transportation and logistical costs
3

23
Accessibility and availability of transportation and logistical infrastructure
commitments from the South African Government to allocate resources to capital investment programs aimed at the transformation of the economy.20
A reliable network of transportation and logistical infrastructure that is effective
mining industry. Exporters are heavily dependent on readily available access to transport, freight handling, and port and shipping facilities to take advantage
afford mining companies the opportunity to optimize their sales and marketing strategies to capitalize on weaker currencies through exports, or to deliver to the local market at more competitive prices.
Suppliers to the mining industry are also feeling the effects of higher fuel costs and, as such, their prices are increasing. The only alternative left to mining companies would be to seek cheaper suppliers, which could come with additional risk or increased future maintenance cost. As a percentage of GDP, logistics costs have increased to nearly 13% in 2012. In turn, transport costs
it has been during the past decade and considerably higher than the global average. Research has shown South Africa’s vulnerability to crude oil price volatility, which was exacerbated by the country’s entrenched dependence on road transport and South Africa’s volatile currency, as the primary driver of the higher transport costs.21 Overall freight charges, which include rail costs, port
increases in the costs of electricity, infrastructure, construction and equipment, along with currency changes and longer hauling distances.
Due to the various components making up the transportation and logistics
use of various modes of transport, including bulk road freight, which is often
product to the customer and making the issue of completive costing challenging.
Although it has been acknowledged for a number of years, the integrated
not in place. A well-managed and integrated system can create more sustainable jobs for skilled labor, thereby making it a safer environment, putting less stress on SA’s infrastructure and allowing for better planning by the Government and mining companies to achieve overall growth.
20“Infrastructure a challenge for SA mining,” Business Report, 18 December 2012.
21
Stellenbosch University, June 2013.

24
Responding to the challenge
enterprise value
Understand the return on all capital expenditure, including infra-
infrastructure projects
Identify other stakeholders to co-develop a solution with shared
Investigate partnerships with potential stakeholders in expanded
agreements
Improve mine planning to assist in assurance over optimal levels of take-or-pay commitments
Work with Government to co-develop infrastructure solutions that
all parties
During the past decade, the ratio of infrastructure costs incurred by mining companies versus equipment costs has dramatically shifted and has reached heights of up to 80% of mine development
22 For
component of the overall cost. This is true for both local sales of goods as well as export sales.
As miners look to reduce the capital intensity of these mines, an early target will be infrastructure. To assist this and to promote greater investment in South Africa, the Government must strive to
reform, the provision of Government guarantees to underwrite uncommitted capacity and accelerated planning approvals.
22 Australian Mining, 19 September 2012.

25
Effective management of capital4
26
Across the mining industry there is increased pressure to deliver value to shareholders in both the short and long-term. This means that companies not only have to ensure that they are generating optimal value from their current projects, but also that they invest in future projects that will create sustainable value for their investors. This increases the pressure on executives to ensure
is a natural inclination to reduce capital expenditure and focus on cash preservation and margin protection. Achieving this requires strong leadership, an awareness of the impact on the sociopolitical environment, demonstrable discipline and an unfailing focus on optimising activities and operations that preserve and grow long-term value.
During the past 12 months there have been several large-scale programs announced by mining companies to cutback on capital expenditure, including both stay-in-business capital as well as expansionary capital. On average, annual stay-in-business capital expenditure equals approximately 20%-30% of annual production costs and is crucial to the performance, longevity, safety, mining
senior executive involvement and project sponsorship.
Beyond the increases experienced for input costs such as steel, timber and cement, mining companies have also underestimated the overall costs involved in executing mine development or expansionary projects. This was primarily caused by the continued increase in complexity of these projects as well as the challenges in the labor market that have led to overruns and delays in delivering the projects.
Capital productivity has been adversely impacted by multiple factors, such as the long lead times between investment and production, overruns in project development, and the sluggish pace of innovation in mining technology to name but a few.
In a number of instances, capital was also not appropriately right-sized for the mine developments
increased production, rather than looking to optimize the capital already applied. Companies are now revisiting their true capital needs and applying fresh thinking to increase both the availability and utilization of the existing assets.23
Global mining companies are increasingly targeting capital productivity as the largest potential contributor to margin protection. This is also seen as the most achievable as even a return to the
what they have unlearnt.
Coupled with capital expenditure and capital productivity are the maintenance requirements of mining infrastructure and capital equipment. Poorly planned capital expenditure cutbacks may result in additional maintenance requirements, and as such should be factored in when re-evaluating capital spend.
23 Business risks facing mining and metals 2013–2014, EY, June 2013.

27
Responding to the challenge Implement portfolio management and greater scrutiny around project selection, prioritisation and management
Develop a clear and agreed-upon understanding of acceptable levels of risk against expected return
Regularly assess risks, project economies and assumptions
Undertake forward-looking scenario testing
Introduce robust post-implementation analysis
Consider investments in context of the wider portfolio, not in isolation
of capital outlays
Pursue alternative and innovative funding options to provide optionality
Re-scope and re-cost all capital projects to reassess their relative performance
Ensure all capital is equally productive, and where it is not consider possible divestures
Regularly review existing projects according to the same criteria as new investments
Reoptimize capital for new price environment — e.g., more open cut operations from being “over-trucked” to “under-trucked”
Rely on higher cutoff grades requiring less waste handling via lower strip ratios and less tolerance for dilution
Enhance use of operational data and benchmarking to target
Improve the human and technology interaction, along with training and development
Continue to de-bottlenecking
Transfer risk to third-party owners of assets
Rebalance product chains to better utilise pit, rail and port infrastructure with integrated logistics
Increase automation and innovative solutions across the sector
Improve maintenance and asset management
Renew your focus on continuous process improvement programs, such as a Lean Six Sigma

28
Supply chain and procurement practices
5

29
One of the clear impacts of the long-running commodities boom has been that
become viable or have remained viable for longer. Typically these deposits have been of lower quality or remote from existing supply chains, and this lack of
primary obstacle to rapid development of these resources. Remoteness naturally brings additional challenges in terms of cost, risk and scale of development of the required transport, utilities and supporting infrastructure. Until recently, the tier-one mining and metals Organizations used to have the balance sheet strength to develop integrated mine and logistics projects but have been under increasing shareholder pressure to restrict new capital expenditure.
During the period when companies focused on achieving growth, they were
of “quick wins”, many Organizations have initiated programs to review supply chain processes, procurement practices and supplier agreements. Executives
and focused on cost management.
Suppliers are becoming accustomed to the resetting of supply arrangements to remove scarcity premiums and more aggressive procurement. It is the new world.
While larger companies tend to be in a stronger position to negotiate better terms with contractors and suppliers, rising costs have resulted in consolidations and collaborations within the industry leading to synergies, economies of scale and greater negotiating power. Interestingly, some industry players have begun to forge collaborative relationships with their contractors and suppliers, with the aim of achieving greater savings and increased productivity. For example, in an effort to identify opportunities to reduce wastage from the supply chain, procurement teams could engage and collaborate not only with other functions within the Organization but also with their suppliers.24
Increased project complexity, coupled with pressures on supply chains, is forcing many companies to review their project management methodologies. In doing
and systems required to decrease contractor reliance and achieve global synergies. In particular, some of the areas of optimisation that companies are focusing on include:
inventory levels
Reducing lead times from ordering to receiving goods, through to using the goods
Revisiting mining contractor agreements and establishing key performance indicators (KPIs), remuneration structures and performance management
An often over-looked threat is how natural and environmental disasters highlight the risks of a major catastrophe to global supply, as well as the potential knock- on effects. Understanding and preparing for the occurrence of catastrophic risk is both challenging and essential. The consequences extend beyond individual projects, right along the supply chain, with far-reaching implications for prices, future supply and investment decisions. While the short-term focus is on cost control, companies should consider the possibility of being impacted by supply chain disruptions in their overall risk management strategy and framework.
24 Business risks facing mining and metals 2012–2013, EY, June 2012.

30
Responding to the challenge Ensure project and supply chain performance is monitored and managed by aligning owner and contractor teams through pragmatic contracting strategies and incentive programs
Analyse the strengths and capabilities of your supply chain
Evaluate your exposure if you are at the end of a supply chain
Conduct a supply chain maturity assessment
Do scenario planning and impact assessment across the supply chain
Run diagnostics of supplier capability and risks
Identify critical spares and supplier capability to expedite
Focus on sustainable cost reduction programs
Divest in non-core assets
Review capital tied up in high levels of pre-stripping, advance development and stockpiles
Consider of the use of contract mining vs. sale or leaseback
Review supplier contracts
Outsource
Create of strategic joint ventures to optimize economies of scale

31

32
Commodity price and currency volatility 6

33
South Africa continues to feel the effects of the global economic market, evidenced in the recent fall in the rand against the US dollar, which has declined approximately 20% against the greenback since the start of 2013. Although other emerging market currencies saw similar weakness, South Africa’s history of currency volatility, coupled with low growth prospects and domestic challenges, aggravated the rand’s poor performance.25
To an extent the weakening of the rand during 2013 shielded South African mining companies against the weaker commodity prices. Consequently, it also shielded mining companies against the full impact
Commodity price and currency volatility impact sales as well as the costs of producing salable product.
from production costs because these factors become embedded in the supply chain and procurement practices. Typical input costs affected by the volatility in price and currency are oil, steel, timber, rubber, chemicals and reagents, and capital equipment.
The sensitivity to these volatilities is dependent on companies’ exposure to import and export activities and the dependency that is placed on these sources. In an environment where import and export activity is high, companies are inclined to spend more executive time on managing these
specialized skills to assist in mitigating and managing these exposures, often at great cost.
Volatility also increases uncertainty and unpredictability, thereby creating additional risk in long-term business planning and capital allocation.
Some companies may consider hedging again. However, for most, the opportunity to establish an
period of volatility may create problems for themselves during the next upswing.26 However, given technologies of today, there are some more sophisticated tools available, which means that mining companies can consider multiple scenarios to identify how and where volatility impact the business - and identify in advance possible actions to optimize their returns.27 Commodity price and currency volatility can be managed, taking advantage of price spikes and limiting the exposure to price slumps. Such choices could include:
Undertaking no new action and managing through the cycle
Suspending mining and commencing processing stockpiles
Reducing shifts and consequently reducing production
Deferring new development
Moving to highest-grade reserves
Abandoning production and selling either the project or hybrids thereof
25“SA’s economy is running on empty,” Mail & Guardian, 21 June 2013.
26“Mining sector to continue facing price, currency pressures,” Mining Weekly, 24 May 2013.
27 Business risk facing mining and metals 2013–2014, EY, June 2013.

34
planning to provide a greater range of responses to price and currency volatility. This will allow companies to vary the levels of production more easily without major cost penalties. Some common examples include:
Using equipment hire to support peak production
peak production and scaling back periods
Outsourcing energy supply to power-by-the-hour model
Varying stockpile management
Undertaking campaign rehabilitation using contractors
Responding to the challenge Develop a documented understanding of the company’s exposure to price and currency volatility
Improve the speed of mine planning to match volatility
Prepare for a future hedging program when prices once again increase, managing short-term price risk
level of production, even if it increases overall cost
Increase reliance on local suppliers

35
Corporate, administrative and overhead costs
7

36
expansion ambitions. This required several dedicated teams to investigate, manage and oversee these projects. Now that the focus is on margin protection and cost control, the focus has moved away from growth and expansion, resulting in the redeployments or layoffs and these dedicated teams.
Evidence is rife, with various producers announcing cuts in corporate overheads such as managerial, compliance and administrative costs. Companies are reducing their work force, often through voluntary severance package offers. The situation is not unique to South African mining companies as global peers across the mining industry promise more cost cuts, including plans to shed management positions.
There should, however, be a balance between these cost-cutting initiatives and the potential effects it could have on labor productivity and long-term sustainability. Companies should consider the impact of layoffs in the short to medium term:
Drain of talent from the South African mining industry, setting up future skills shortages
Direct costs such as training expenditures and severance packages
Indirect costs such as re-attraction and future up-scaling costs
Potential impact on the company’s social license to operate
Possible impact on future salary levels and potential recalibration of remuneration levels
become more complex, thereby requiring more specialized and skilled people. This is particularly true for companies operating across multiple jurisdictions or various businesses or commodities. As companies are refocusing on their core strengths and competencies, the need for multiple levels of management, oversight and control has become less critical. As a consequence, senior management have steadily been taking back some of the key day-to-day management functions in an effort to revitalize business performance and to reduce overall costs.
and operational regulations and compliance matters. Companies have steadily invested in building competence to appropriately deal with these obligations, and caution should be taken to ensure that the good that was done in these areas does not get unraveled through cost control initiatives.
We have observed some shift back to selective outsourcing to meet these challenges while reducing costs.

37
Responding to the challengeMove back to outsourcing to optimize manpower utilization
Remove of dual roles for growth and operations, allowing focus on operational improvements
Adopting new technology to substitute capital for labor through in-novation, e.g, automation
Target initiatives to retain critical skills held by older workers
Implement early labor scheduling and sourcing within mine planning

38
Safety, health and environmental costs 8

39
Through a combination of legislation, company policies and commitments to a safe and environmentally friendly working environment, safety, health and environment (SHE) is being taken more seriously than ever before. Safer working environments require behavioral and corporate culture adaptation as well as substantial investments in better safety standards, training and equipment. Furthermore, it often requires companies to revisit the way in which they mine to ensure that they mine safely. Safety incidents also have punitive consequences whereby mining operations are stopped (section 54 safety stoppages), resulting in production losses and declining productivity.
Act 29 of the 1996 Mine Health and Safety Act of South Africa provides strict regulations on the health and safety of mine workers. For most mining companies, health and safety regulations have become entrenched in the way business is conducted with numerous training programs and initiatives introduced across the industry to promote the health and safety of employees. The seriousness of the issue is due to numerous factors, including companies’ social responsibility initiatives, the long-term protection and longevity of valuable skills and the risk associated with reputational damage.
of mining companies such as “If we cannot mine safely, we will not mine”28
value.”29
Despite commendable efforts in improving overall mining health and safety, there are still safety
CoMSA, up to 6 May 2013, fatalities at South African mines have decreased by 15% year-over-year.30 Nevertheless, mining companies will have to continue investing time and money in health and safety initiatives, including training, maintenance of working conditions, scheduling of working shifts and technological improvements.
In terms of occupational health concerns, the mining industry continues to face challenges. The CoMSA recently commented that not enough progress is being made with respect to noise-induced hearing loss (NIHL). According to the Department of Mineral Resources (DMR), an average of 1,600 cases of NIHL are reported a year. Meanwhile, recent data indicates that tuberculosis (TB) and HIV
are declining, in line with the rest of the subregion. Mining companies have implemented several HIV programs over the years, with most workers having access to antiretroviral (ARV) therapy through company programs.31
Access to clean water remains a concern in South Africa mines due to its relative scarcity in the country, as well as high-cost and competing interests from communities, citizens, Government and other industries for this resource. Water scarcity and associated stringent environmental conditions
increase in costs, water management, preservation and conservation is becoming increasingly important and will continue to require more managerial attention in future years.32
28
10 July 2013.
29
30“Tripartite industry milestones analysis report: OH&SPC Circular no 12/13,” Chamber of Mines of South Africa, 10 May 2013.
31 Mining Weekly, 17 May 2013.
32 Business risks facing mining and metals 2013–2014, EY, June 2013

40
Responding to the challenge Require in-house compliance teams to keep the scope and framework of compliance obligations highly visible and actively communicate them to corresponding functional and delivery personnel
Integrate technology in the business that could provide helpful analysis in safety improvements and through controls could enhance productivity and reduce employee exposure to unsafe conditions
Introduce robust maintenance processes and systems to ensure optimal equipment performance
Identify why these incident occur through a detailed analysis and create measures to prevent recurrence
Set greenhouse gas reduction targets that are linked to production
Recognise cost savings and offset opportunities from emissions trading through initiatives for Clean Development Mechanism (CDM) projects
generation
Compliance with increased regulatory and reporting requirements relating to land access, permitting, environmental approvals, rehabilitation and climate change are other areas mining companies have been dealing with. Companies are investing considerable time and capital in maintaining their reputation as good corporate citizens by being transparent and adhering to these regulatory requirements. The cost of noncompliance with these obligations is high because failure to meet
damage.33
33 Effective capital project execution in mining and metals, EY, 2011.

41
Cost of being a socially responsible corporate citizen
9

42
Being a socially responsible corporate citizen means taking responsibility for your impact on the environment, employees and your host community. It generally refers to those efforts that go beyond normal requirements of regulators or environmental protection groups. These activities often involve
promote positive social, communal and environmental change as well as long-term sustainability of the mining industry through the earning of a social license to operate.
The need for a “social license to operate” is widely understood and accepted by the mining industry.
existing laws with increased regulation.
In general, mining companies in South Africa have responded better than their global peers to the challenges and have developed an appreciation for the value of a well-maintained ”social license to operate.” They have come to understand that they cannot operate in isolation and that decisions need
introduction of King I, II and III, companies’ visions have shifted from one where shareholders’ value and owners’ satisfaction were sole corporate goals to one that considers, protects and promotes all stakeholders, including employees, customers, suppliers, shareholders, the environment and the community.
Government
Mining companies
Suppliers
CommunitiesEmployees
Shareholders
Providers of capital
Key stakeholders in the South African mining industry

43
As the number of stakeholders have grown in the past years, so too have the expectation and the complexity of them. In a volatile environment, managing the needs of all of these often-competing stakeholders who contribute to giving mining houses a “social license to operate” is a delicate and telling task. South Africa’s sociopolitical issues, combined with its aging
Inevitably, this will result in higher costs in the sector.
Achieving a social license to operate is one challenge, but maintaining it is another. The key to both is communicating the value through the concept of shared value. Globally, the sector’s understanding of the potential of shared value is in its infancy, suggesting a real opportunity for addressing this
Shared value revolves around focusing on the connections between societal and economic progress, which have the power to unleash the next wave of global growth. A practical example of creating shared value includes increasing the capability and capacity of local businesses to provide goods and services to mining and manufacturing operations in the areas they
reduce environmental impacts, and contribute to a more sustainable and resilient local community that shares in the value of the operations.
Equally important is measuring the value that has been created for all stakeholders, demonstrating the returns achieved from both a social and

44
Responding to the challenge Engage early with local communities to understand and address concerns around mining operations and implement strategies to reduce impacts
Identify opportunities on how mining operations can be adjusted to create more value for communities and additional return for the company
Consider opportunities provided by local supplier, community and employee capabilities
Measure and report on the value created and use this data to continuously monitor and improve performance
Incorporate “social license to operate” risks into the enterprise risk management framework with clear and proactive risk mitigation strategies
Embed mitigation strategies in all critical business processes to ensure an integrated approach
Foster trusting and supportive relationships with all stakeholders
Integrate sustainability key performance indicators with productivity outcomes, as well as in remuneration structures
Use sustainability outcomes to attract and retain workers who value the company’s sustainability philosophy
Improve speed to act on potential license issues
Integrate sustainability objectives into long-term planning
Improve relationships and dialogue with Governments
Develop an understanding of the fast-changing union environment
Continue the debate and engagement about a stable, transparent and predictable policy environment for the mining industry

45
Exploring, discovering and replacing reserves and resources
10

46
investor interest in exploration projects has decreased. Early-stage exploration is risky because the
Mining companies are struggling to fund new exploration projects due to the lack of funding and interest received from their investors who prefer investments in current, more certain, high-grade operating assets.
Furthermore, it has also been noted in the industry that ballooning capital costs on core development projects have forced companies to reduce their current spending programs due to an inability of effectively control and manage capital costs.
Many of the mining services companies are also experiencing the clear intention to slow down and control exploration spending programs.34 The short-term focus of markets is causing them to be indiscriminate on cost reductions. Drops in exploration expenditures have been applauded equally. At the same time, declining assets, lower grades and higher safety risks associated with mature mines render it essential for mining companies to continue investing in exploration projects. Taking this into
sustainability of the industry as a whole, especially since it is an industry whose long-term business strategies and returns are dependent on these new discoveries.
The exploration sector itself is facing escalating operational costs because exploration and development projects are increasing in technical complexity, while suitable projects are increasing in size to compensate for falling grades and to achieve economies of scale.35
In the current low-risk environment, it seems unlikely that companies will increase exploration spending in the near term. This does not bode well for junior explorers and for the mining and metal sector in general, the long-term sustainability of which is dependent on investment in new discoveries.
Responding to the challenge Suspension of exploration and the dismantling of exploration capa-bility will negatively impact future availability of developments
Increasing stockpile utilization
Downsizing exploration teams to match deferred or redesigned pre-feasibility study and exploration programs
34“Exploration spending decisions by miners slower than expected,” Mineweb, 24 June 2013.
35 Business risks facing mining and metals 2013–2014, EY, June 2013.

EY’s Global Mining & Metals Center
With a strong but volatile outlook for the sector, the global mining and metals sector is focused on future growth through
increased challenges of changing expectations in the maintenance of its social license to operate, skills shortages, effectively executing capital projects and meeting Government revenue expectations.
EY’s Global Mining & Metals Center brings together a worldwide team of professionals to help you succeed — a team with deep technical experience in providing assurance, tax, transactions and advisory services to the mining and metals sector. The Center is where people and ideas come together to help mining and metals companies meet the issues of today and anticipate those of tomorrow. Ultimately it enables us to help you meet your goals and compete more effectively.
Area contacts
Global Mining & Metals LeaderMike ElliottTel: +61 2 9248 [email protected]
OceaniaScott GrimleyTel: +61 3 9655 [email protected]
China and MongoliaPeter MarkeyTel: +86 21 2228 [email protected]
JapanAndrew CowellTel: +81 3 3503 [email protected]
Europe, Middle East, Indiaand Africa LeaderMick BardellaTel: +44 20 7951 [email protected]
AfricaWickus BothaTel: +27 11 772 [email protected]
Commonwealth ofIndependent StatesEvgeni KhrustalevTel: +7 495 648 [email protected]
France and LuxemburgChristian MionTel: +33 1 46 93 65 [email protected]
IndiaAnjani AgrawalTel: +91 982 061 [email protected]
United Kingdom & IrelandLee DownhamTel: +44 20 7951 [email protected]
Americas and United States LeaderAndy MillerTel: +1 314 290 [email protected]
CanadaBruce SpragueTel: +1 604 891 [email protected]
South America and Brazil LeaderCarlos AssisTel: +55 21 3263 [email protected]
Service line contactsGlobal Advisory LeaderPaul MitchellTel: +86 21 2228 [email protected]
Global Assurance LeaderTom WhelanTel: +1 604 891 [email protected]
Global IFRS LeaderTracey WaringTel: +61 3 9288 [email protected]
Global Tax LeaderAndy MillerTel: +1 314 290 [email protected]
Global Transactions LeaderLee DownhamTel: +44 20 7951 2178 [email protected]

EY | Assurance | Tax | Transactions | Advisory
About EY EY is a global leader in assurance, tax, transaction and advisory services. The
insights and quality services we deliver help build trust and confidence in the
capital markets and in economies the world over. We develop outstanding
leaders who team to deliver on our promises to all of our stakeholders. In so
doing, we play a critical role in building a better working world for our people,
for our clients and for our communities.
EY refers to the global organization and may refer to one or more of the
member firms of Ernst & Young Global Limited, each of which is a separate
legal entity. Ernst & Young Global Limited, a UK company limited by
guarantee, does not provide services to clients. For more information about
our organization, please visit ey.com.
© 2013 EYGM Limited.
All Rights Reserved
Studio ref. 130625. Artwork by Nokwanda.
EYG no. ER0104
ED no. 1501, 1401
This material has been prepared for general informational purposes only and
is not intended to be relied upon as accounting, tax, or other professional
advice. Please refer to your advisors for specific advice.
ey.com