cost-benefit analysis of options for certification ... · pdf filecost-benefit analysis of...
TRANSCRIPT

04/02/2015 Service Request 1 1
CO2 HDV Stakeholder Meeting
Cost-Benefit Analysis of Options for Certification, Validation and Monitoring and Reporting of HDVs
Leif-Erik Schulte
Vicente Franco
Brussels, January, 30th 2015
Overview
04/02/2015 Service Request 1 2
Introduction
Technical Assessment
CO2 Determination Methodology (Task 1)
Confomity of Production / Ex-Post Validation (Task 2)
Cost Assessment
CO2 Determination Methodology (Task 1)
Confomity of Production / Ex-Post Validation (Task 2)

04/02/2015 Service Request 1 3
Introduction
A specific service request has been issued by the EC under
Framework Service Contract CLIMA.C.2/FRA/2013/0007. The
work under this contract, managed by TNO, has the following
objectives:
to identify, define and assess options for Certification,
Validation, and Reporting and Monitoring of fuel
consumption and CO2 emissions from heavy-duty vehicles.
to determine the costs of these options to the relevant
stakeholders.

Task 1 Certification (TüV NORD)
Task 2 Ex-post validation (TüV NORD)
Task 3 Monitoring and reporting (TNO)
Task 4-6 Costs for tasks 1-3 (ICCT)
Task 7 Stakeholder consultation (ICCT)
Tasks
04/02/2015 Service Request 1 4
Overview
04/02/2015 Service Request 1 5
Introduction
Technical Assessment
CO2 Determination Methodology (Task 1)
Confomity of Production / Ex-Post Validation (Task 2)
Cost Assessment
CO2 Determination Methodology (Task 1)
Confomity of Production / Ex-Post Validation (Task 2)
04/02/2015 Service Request 1 6
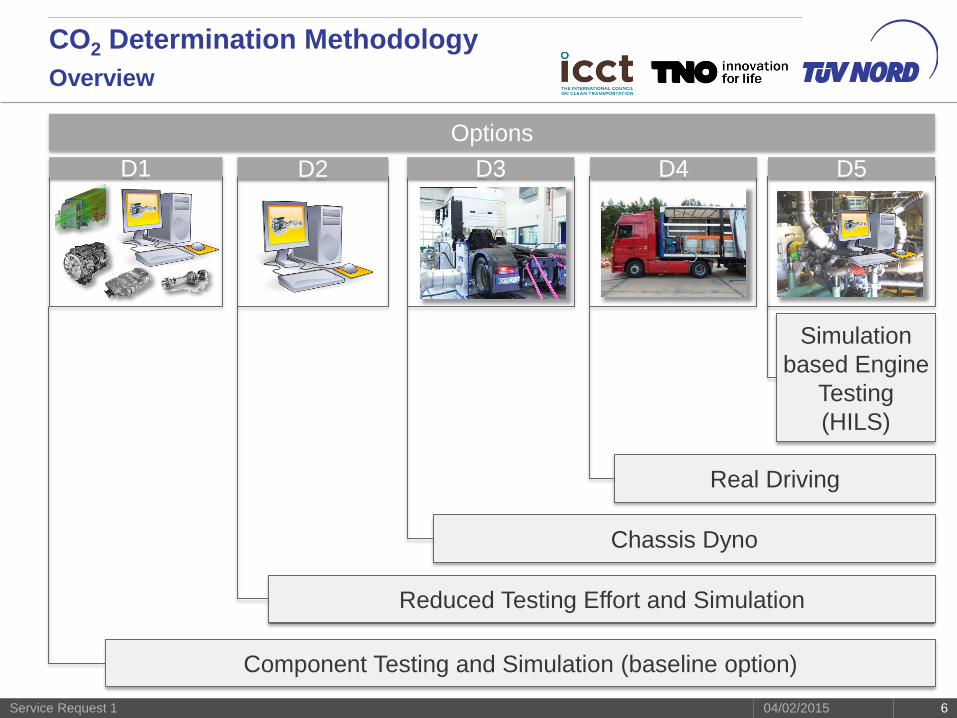
D1 D2 D3 D4 D5
Options
Component Testing and Simulation (baseline option)
Reduced Testing Effort and Simulation
Chassis Dyno
Real Driving
Simulation
based Engine
Testing
(HILS)
CO2 Determination Methodology
Overview

04/02/2015 Service Request 1 7
D1 D2 D3 D4 D5
Options
Cons
- Possible mismatch between simulation and reality (cycle, gear change, etc.)
- Possible operating errors of tool or data handling
- High testing effort on component level
CO2 Determination Methodology
Component Testing and Simulation
Pros
+ Determination of vehicle specific CO2 emission / fuel consumption
+ High accuracy possible if use of default is minimized
+ Easy determination of CO2 emissions / fuel consumption for different
mission profiles and payloads
+ No driver influence
+ Good repeatability and reproducability (vs. mismatch . . . )
04/02/2015 Service Request 1 8
D1 D2 D3 D4 D5
Options
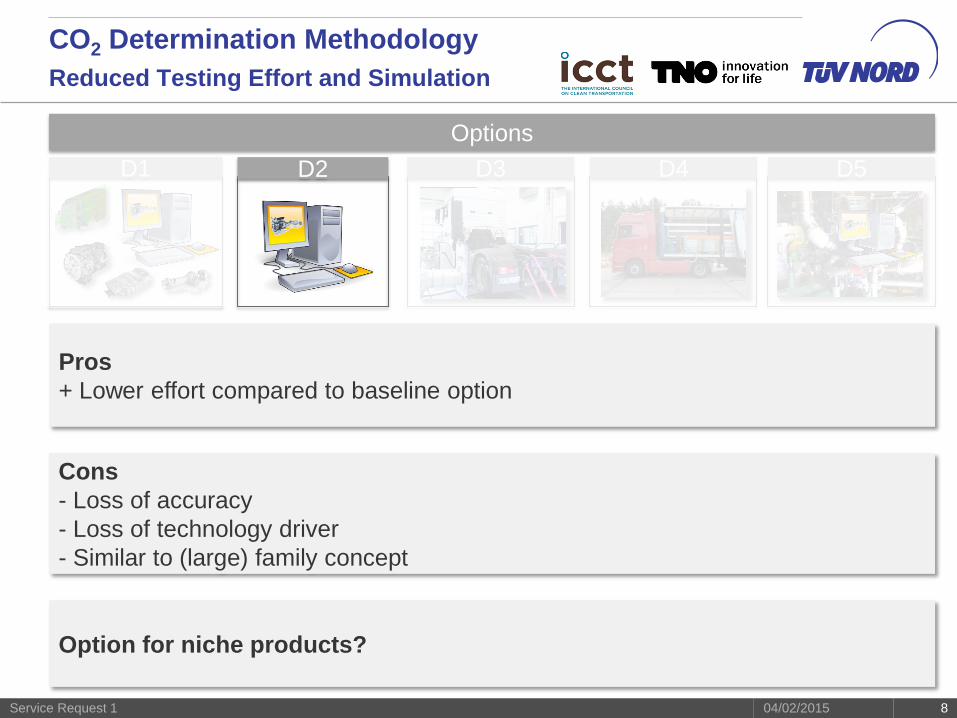
Cons
- Loss of accuracy
- Loss of technology driver
- Similar to (large) family concept
CO2 Determination Methodology
Reduced Testing Effort and Simulation
Pros
+ Lower effort compared to baseline option
Option for niche products?
04/02/2015 Service Request 1 9
D1 D2 D3 D4 D5
Options
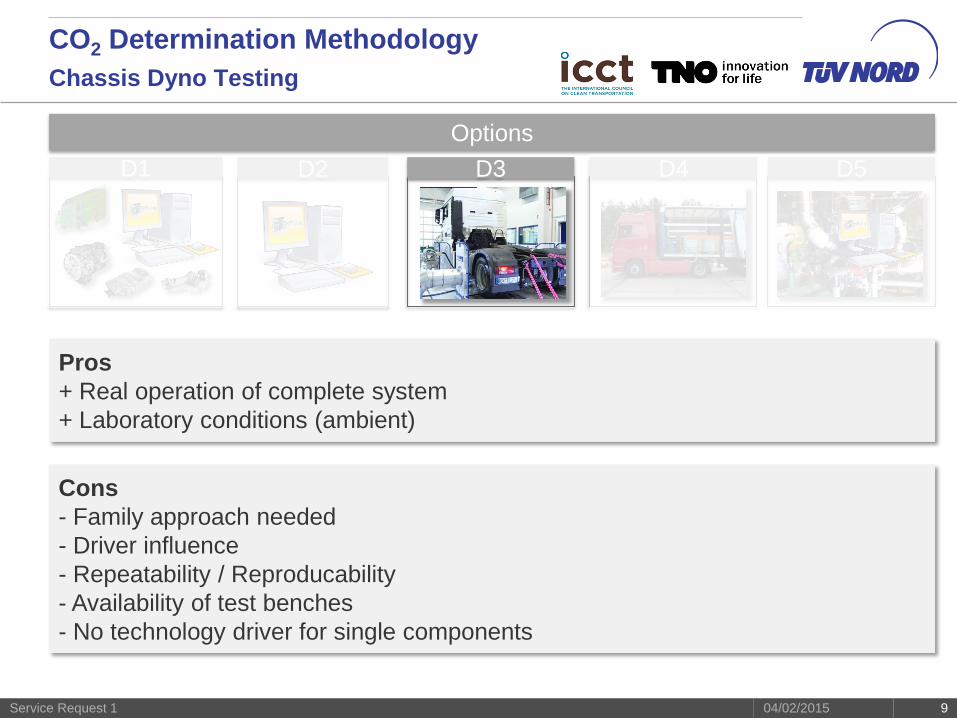
Cons
- Family approach needed
- Driver influence
- Repeatability / Reproducability
- Availability of test benches
- No technology driver for single components
CO2 Determination Methodology
Chassis Dyno Testing
Pros
+ Real operation of complete system
+ Laboratory conditions (ambient)

04/02/2015 Service Request 1 10
D1 D2 D3 D4 D5
Options
Cons
- Family approach needed
- Limited to poor repeatability, reproducability, comparability
- No technology driver for single components
CO2 Determination Methodology
Real Driving
Pros
+ Real operation of complete system under real conditions
04/02/2015 Service Request 1 11
D1 D2 D3 D4 D5
Options
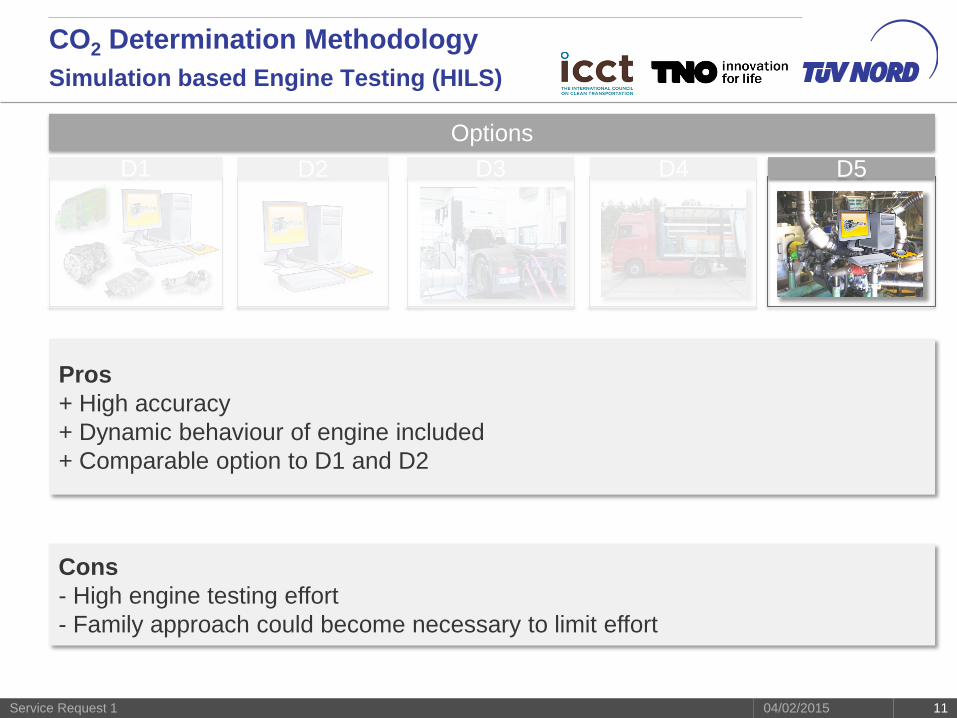
Cons
- High engine testing effort
- Family approach could become necessary to limit effort
CO2 Determination Methodology
Simulation based Engine Testing (HILS)
Pros
+ High accuracy
+ Dynamic behaviour of engine included
+ Comparable option to D1 and D2
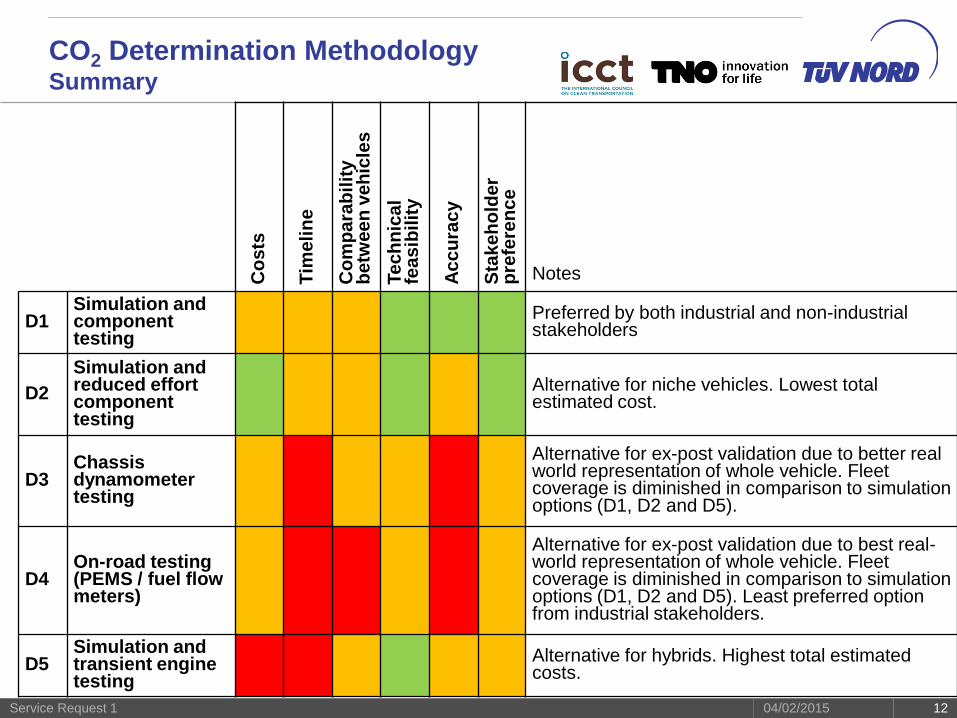
CO2 Determination Methodology Summary
04/02/2015 Service Request 1 12
Co
sts
Tim
eli
ne
Co
mp
ara
bil
ity
be
twee
n v
eh
icle
s
Te
ch
nic
al
fea
sib
ilit
y
Ac
cu
rac
y
Sta
ke
ho
lde
r p
refe
ren
ce
Notes
D1 Simulation and component testing
Preferred by both industrial and non-industrial stakeholders
D2
Simulation and reduced effort component testing
Alternative for niche vehicles. Lowest total estimated cost.
D3 Chassis dynamometer testing
Alternative for ex-post validation due to better real world representation of whole vehicle. Fleet coverage is diminished in comparison to simulation options (D1, D2 and D5).
D4 On-road testing (PEMS / fuel flow meters)
Alternative for ex-post validation due to best real-world representation of whole vehicle. Fleet coverage is diminished in comparison to simulation options (D1, D2 and D5). Least preferred option from industrial stakeholders.
D5 Simulation and transient engine testing
Alternative for hybrids. Highest total estimated costs.
Overview
04/02/2015 Service Request 1 13
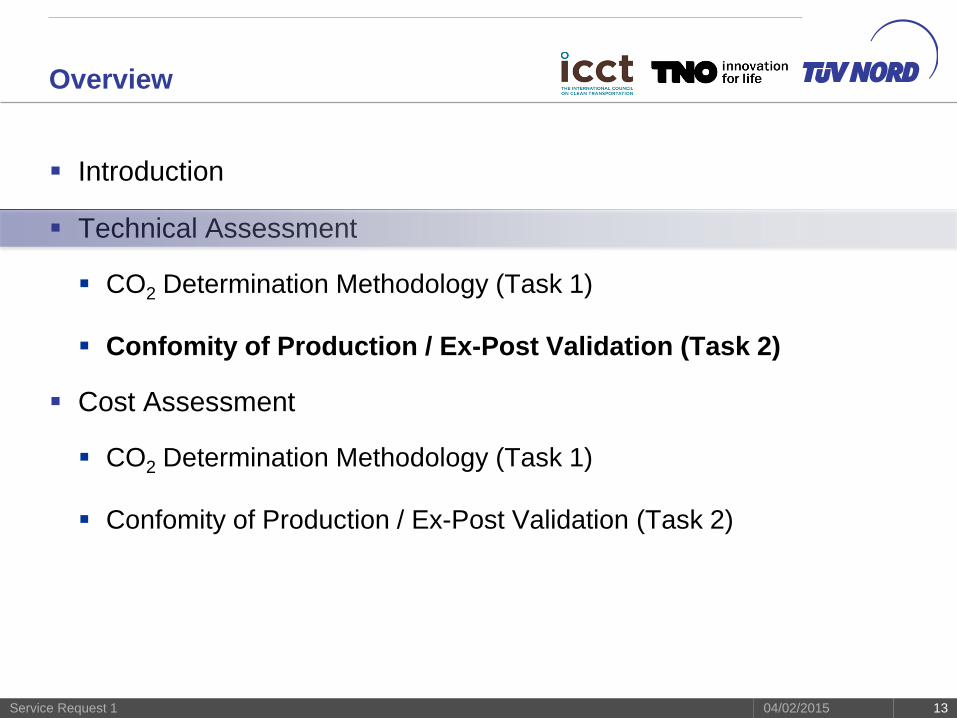
Introduction
Technical Assessment
CO2 Determination Methodology (Task 1)
Confomity of Production / Ex-Post Validation (Task 2)
Cost Assessment
CO2 Determination Methodology (Task 1)
Confomity of Production / Ex-Post Validation (Task 2)
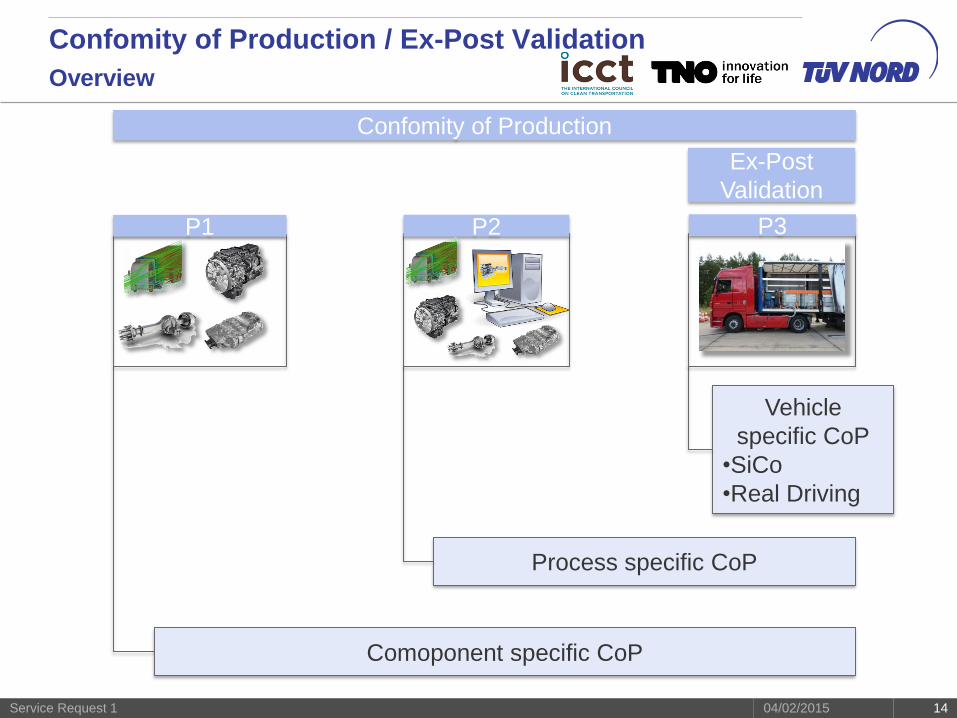
04/02/2015 Service Request 1 14
Comoponent specific CoP
Process specific CoP
Vehicle
specific CoP
•SiCo
•Real Driving
Confomity of Production / Ex-Post Validation
Overview
P1 P2 P3
Confomity of Production
Ex-Post
Validation

04/02/2015 Service Request 1 15
Confomity of Production / Ex-Post Validation
Component specific
P1 P2 P3
Confomity of Production
Ex-Post
Validation
Cons
- No control of the complete process, e.g. operating error during certification
- Transfer of responsibility to component supplier => number of involved parties /
administrative burden
Pros
+ Direct quality control on component level
+ Use of simplified test procedures possible
04/02/2015 Service Request 1 16
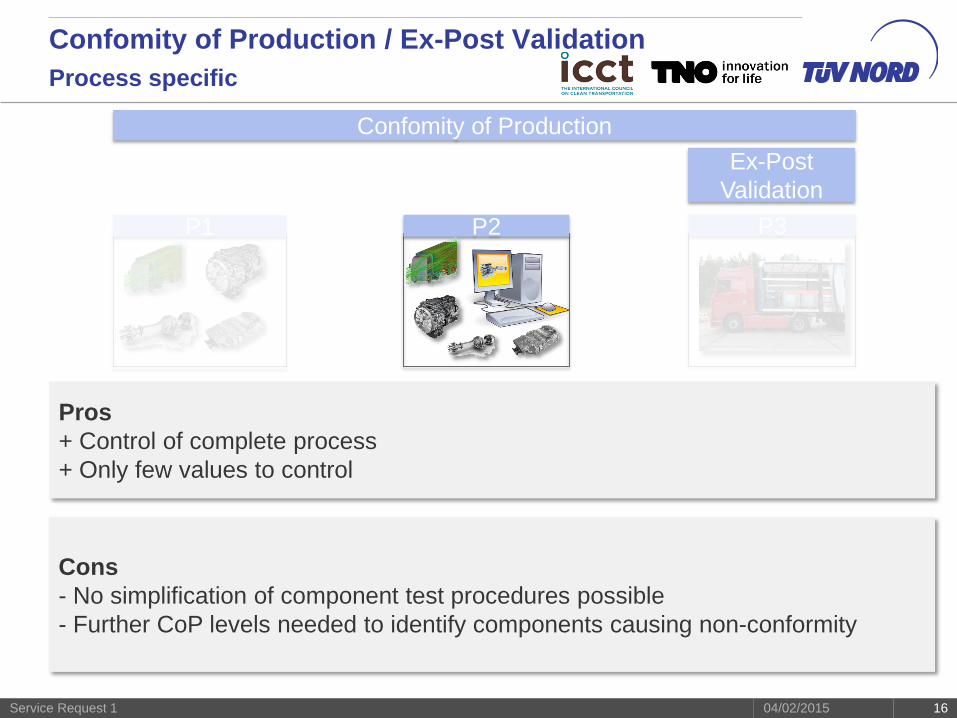
Confomity of Production / Ex-Post Validation
Process specific
P1 P2 P3
Confomity of Production
Ex-Post
Validation
Cons
- No simplification of component test procedures possible
- Further CoP levels needed to identify components causing non-conformity
Pros
+ Control of complete process
+ Only few values to control
04/02/2015 Service Request 1 17
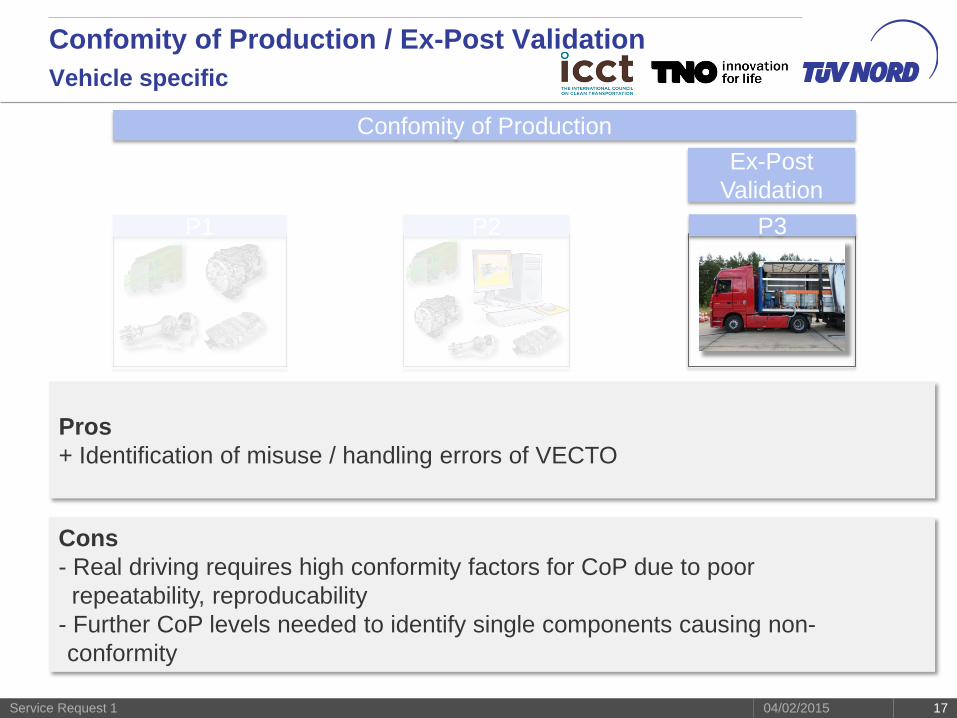
Confomity of Production / Ex-Post Validation
Vehicle specific
P1 P2 P3
Confomity of Production
Ex-Post
Validation
Cons
- Real driving requires high conformity factors for CoP due to poor
repeatability, reproducability
- Further CoP levels needed to identify single components causing non-
conformity
Pros
+ Identification of misuse / handling errors of VECTO

Confomity of Production / Ex-Post Validation Summary
04/02/2015 Service Request 1 18
Co
sts
Tim
eli
ne
Co
mp
ara
bil
ity b
etw
een
ve
hic
les
Te
ch
nic
al fe
as
ibil
ity
Ac
cu
rac
y (
de
pe
nd
s o
n D
o
pti
on
)
Sta
ke
ho
lde
r p
refe
ren
ce
Notes
P1 Component-specific CoP
Preferred option for OEMs and TAA and Technical Services.
P2 Process-specific CoP
P3 Vehicle-specific CoP
Preferred option for research bodies, consultancies and NGOs. Least preferred option for industrial stakeholders.
04/02/2015 Service Request 1 19
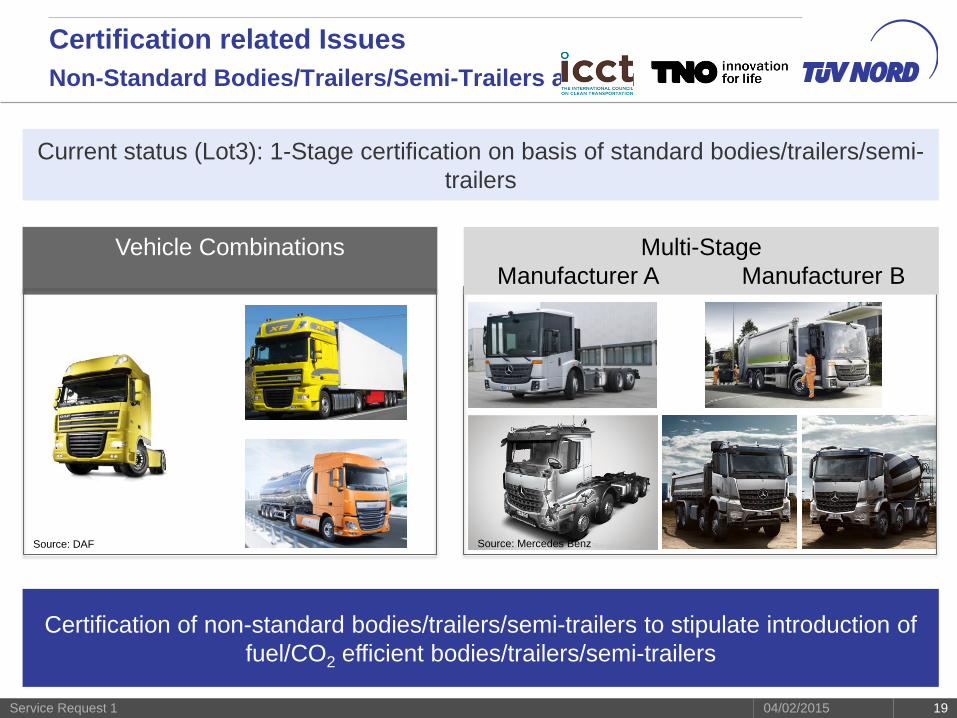
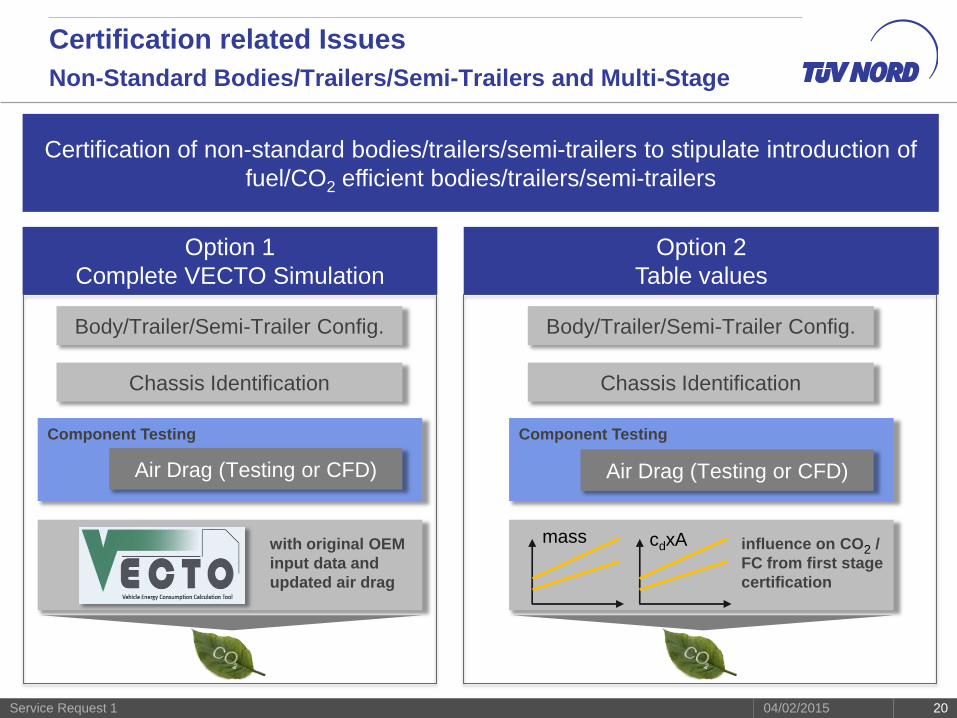
Certification related Issues
Non-Standard Bodies/Trailers/Semi-Trailers and Multi-Stage
Certification of non-standard bodies/trailers/semi-trailers to stipulate introduction of
fuel/CO2 efficient bodies/trailers/semi-trailers
Vehicle Combinations
Current status (Lot3): 1-Stage certification on basis of standard bodies/trailers/semi-
trailers
Multi-Stage
Manufacturer A Manufacturer B
Source: Mercedes Benz Source: DAF
04/02/2015 Service Request 1 20
Certification related Issues
Non-Standard Bodies/Trailers/Semi-Trailers and Multi-Stage
Certification of non-standard bodies/trailers/semi-trailers to stipulate introduction of
fuel/CO2 efficient bodies/trailers/semi-trailers
Option 2
Table values
Option 1
Complete VECTO Simulation
Body/Trailer/Semi-Trailer Config.
Chassis Identification
Component Testing
Air Drag (Testing or CFD)
with original OEM
input data and
updated air drag
Body/Trailer/Semi-Trailer Config.
Chassis Identification
Component Testing
influence on CO2 /
FC from first stage
certification
mass cdxA
Air Drag (Testing or CFD)
Overview
04/02/2015 Service Request 1 21
Introduction
Technical Assessment
CO2 Determination Methodology (Task 1)
Confomity of Production / Ex-Post Validation (Task 2)
Cost Assessment
CO2 Determination Methodology (Task 1)
Confomity of Production / Ex-Post Validation (Task 2)
• Costs of certification
• Costs of CoP
• Conclusions and recommendations
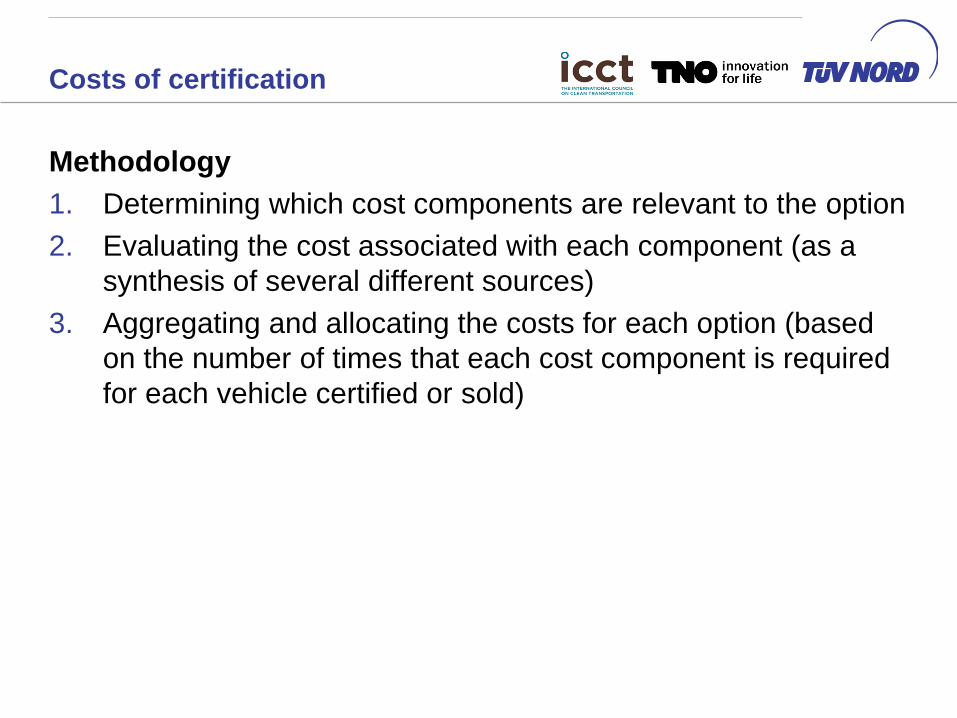
Costs of certification
Methodology
1. Determining which cost components are relevant to the option
2. Evaluating the cost associated with each component (as a
synthesis of several different sources)
3. Aggregating and allocating the costs for each option (based
on the number of times that each cost component is required
for each vehicle certified or sold)
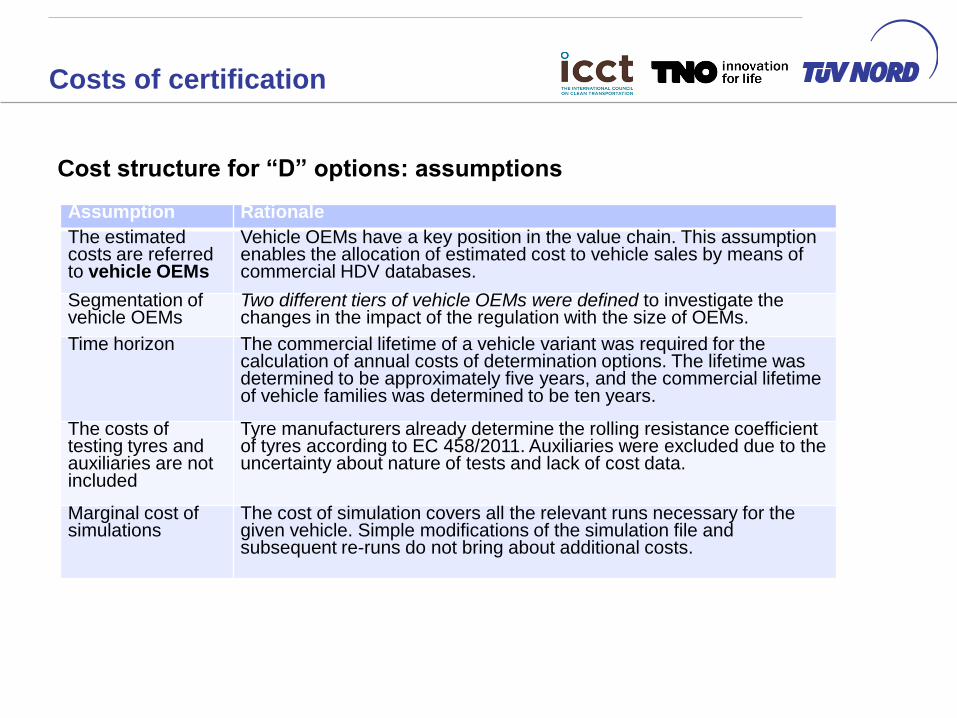
Costs of certification
Cost structure for “D” options: assumptions
Assumption Rationale
The estimated costs are referred to vehicle OEMs
Vehicle OEMs have a key position in the value chain. This assumption enables the allocation of estimated cost to vehicle sales by means of commercial HDV databases.
Segmentation of vehicle OEMs
Two different tiers of vehicle OEMs were defined to investigate the changes in the impact of the regulation with the size of OEMs.
Time horizon The commercial lifetime of a vehicle variant was required for the calculation of annual costs of determination options. The lifetime was determined to be approximately five years, and the commercial lifetime of vehicle families was determined to be ten years.
The costs of testing tyres and auxiliaries are not included
Tyre manufacturers already determine the rolling resistance coefficient of tyres according to EC 458/2011. Auxiliaries were excluded due to the uncertainty about nature of tests and lack of cost data.
Marginal cost of simulations
The cost of simulation covers all the relevant runs necessary for the given vehicle. Simple modifications of the simulation file and subsequent re-runs do not bring about additional costs.
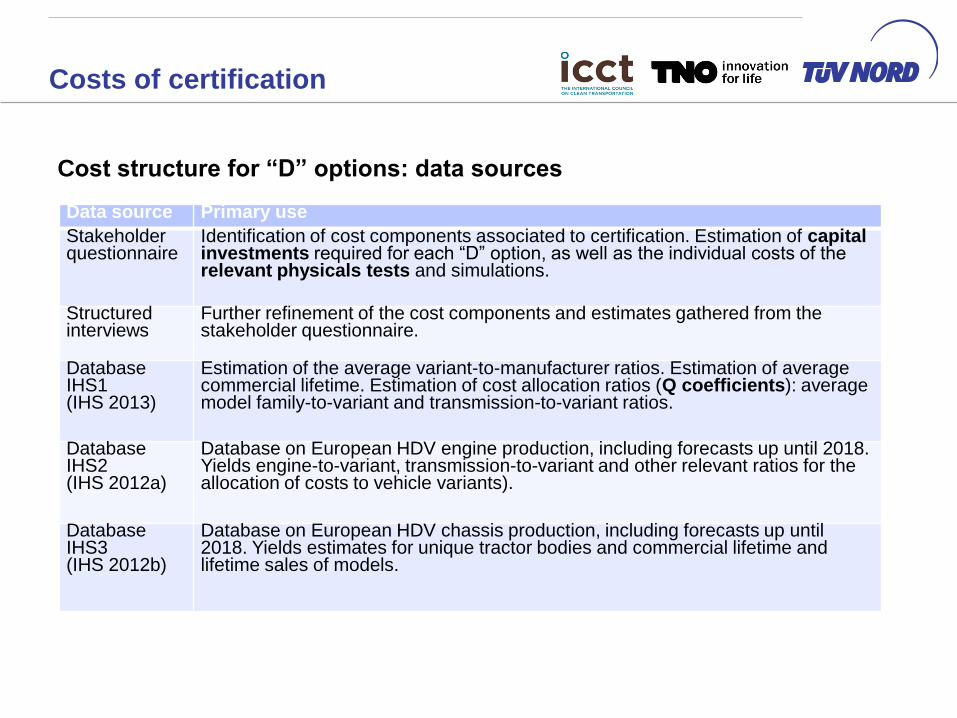
Costs of certification
Cost structure for “D” options: data sources
Data source Primary use
Stakeholder questionnaire
Identification of cost components associated to certification. Estimation of capital investments required for each “D” option, as well as the individual costs of the relevant physicals tests and simulations.
Structured interviews
Further refinement of the cost components and estimates gathered from the stakeholder questionnaire.
Database IHS1 (IHS 2013)
Estimation of the average variant-to-manufacturer ratios. Estimation of average commercial lifetime. Estimation of cost allocation ratios (Q coefficients): average model family-to-variant and transmission-to-variant ratios.
Database IHS2 (IHS 2012a)
Database on European HDV engine production, including forecasts up until 2018. Yields engine-to-variant, transmission-to-variant and other relevant ratios for the allocation of costs to vehicle variants).
Database IHS3 (IHS 2012b)
Database on European HDV chassis production, including forecasts up until 2018. Yields estimates for unique tractor bodies and commercial lifetime and lifetime sales of models.
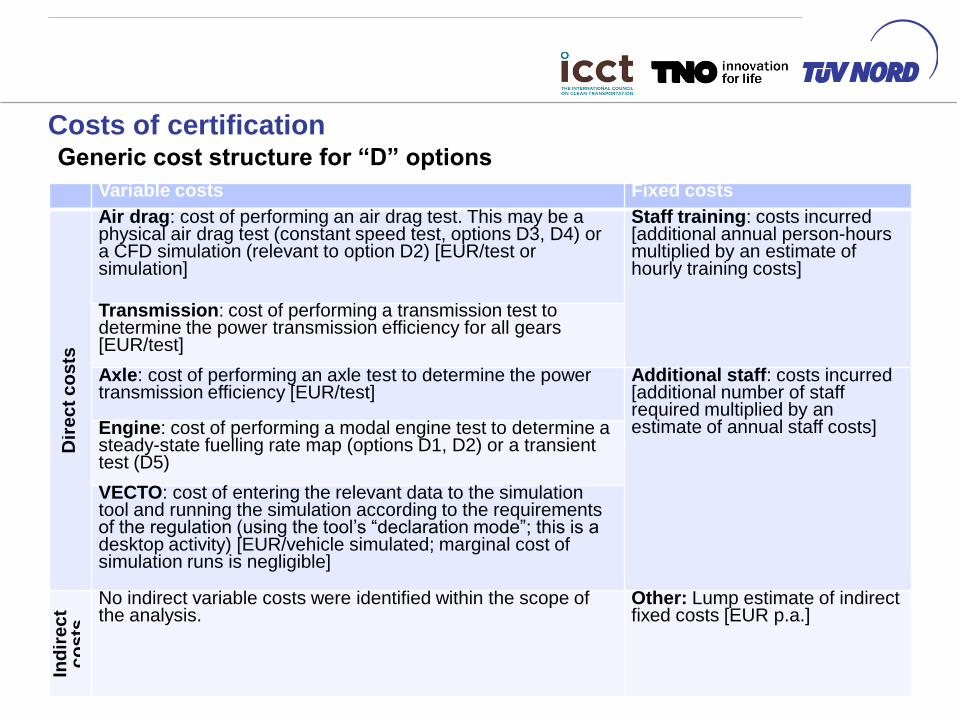
Variable costs Fixed costs
Dir
ec
t c
os
ts
Air drag: cost of performing an air drag test. This may be a physical air drag test (constant speed test, options D3, D4) or a CFD simulation (relevant to option D2) [EUR/test or simulation]
Staff training: costs incurred [additional annual person-hours multiplied by an estimate of hourly training costs]
Transmission: cost of performing a transmission test to determine the power transmission efficiency for all gears [EUR/test]
Axle: cost of performing an axle test to determine the power transmission efficiency [EUR/test]
Additional staff: costs incurred [additional number of staff required multiplied by an estimate of annual staff costs] Engine: cost of performing a modal engine test to determine a
steady-state fuelling rate map (options D1, D2) or a transient test (D5)
VECTO: cost of entering the relevant data to the simulation tool and running the simulation according to the requirements of the regulation (using the tool’s “declaration mode”; this is a desktop activity) [EUR/vehicle simulated; marginal cost of simulation runs is negligible]
Ind
ire
ct
co
sts
No indirect variable costs were identified within the scope of the analysis.
Other: Lump estimate of indirect fixed costs [EUR p.a.]
Costs of certification Generic cost structure for “D” options
Costs of certification
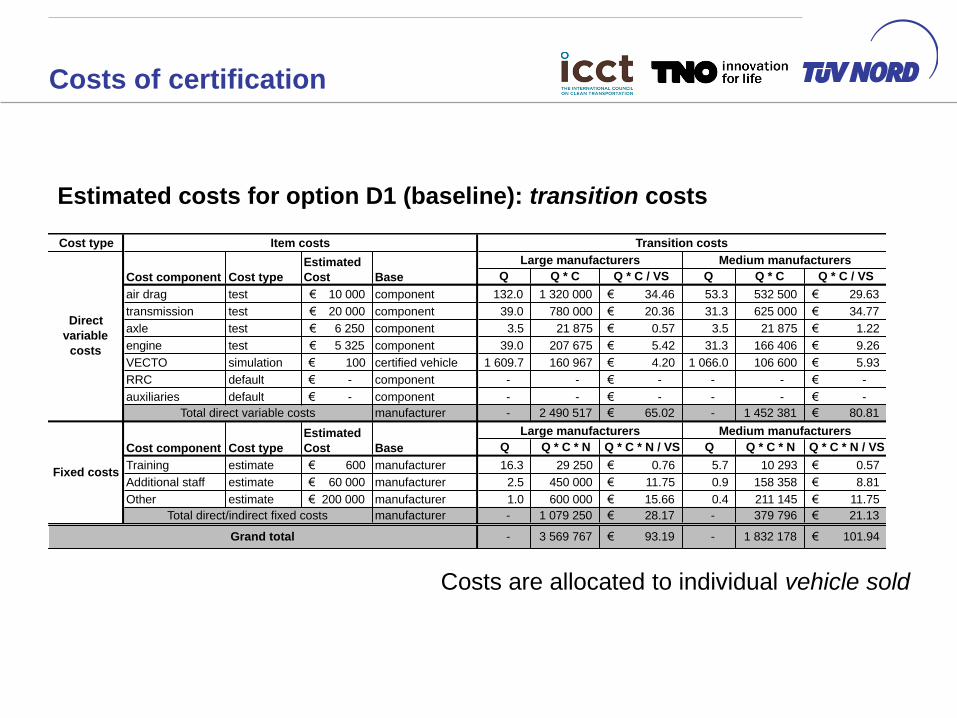
Cost type
Q Q * C Q * C / VS Q Q * C Q * C / VS
air drag test 10 000€ component 132.0 1 320 000 34.46€ 53.3 532 500 29.63€
transmission test 20 000€ component 39.0 780 000 20.36€ 31.3 625 000 34.77€
axle test 6 250€ component 3.5 21 875 0.57€ 3.5 21 875 1.22€
engine test 5 325€ component 39.0 207 675 5.42€ 31.3 166 406 9.26€
VECTO simulation 100€ certified vehicle 1 609.7 160 967 4.20€ 1 066.0 106 600 5.93€
RRC default -€ component - - -€ - - -€
auxiliaries default -€ component - - -€ - - -€
manufacturer - 2 490 517 65.02€ - 1 452 381 80.81€
Q Q * C * N Q * C * N / VS Q Q * C * N Q * C * N / VS
Training estimate 600€ manufacturer 16.3 29 250 0.76€ 5.7 10 293 0.57€
Additional staff estimate 60 000€ manufacturer 2.5 450 000 11.75€ 0.9 158 358 8.81€
Other estimate 200 000€ manufacturer 1.0 600 000 15.66€ 0.4 211 145 11.75€
manufacturer - 1 079 250 28.17€ - 379 796 21.13€
- 3 569 767 93.19€ - 1 832 178 101.94€
Medium manufacturers
Cost component Cost type
Estimated
Cost Base
Transition costs
Large manufacturers Medium manufacturers
Item costs
Cost component Cost type
Estimated
Cost Base
Direct
variable
costs
Total direct/indirect fixed costs
Total direct variable costs
Grand total
Fixed costs
Large manufacturers
Estimated costs for option D1 (baseline): transition costs
Costs are allocated to individual vehicle sold
Cost of certification
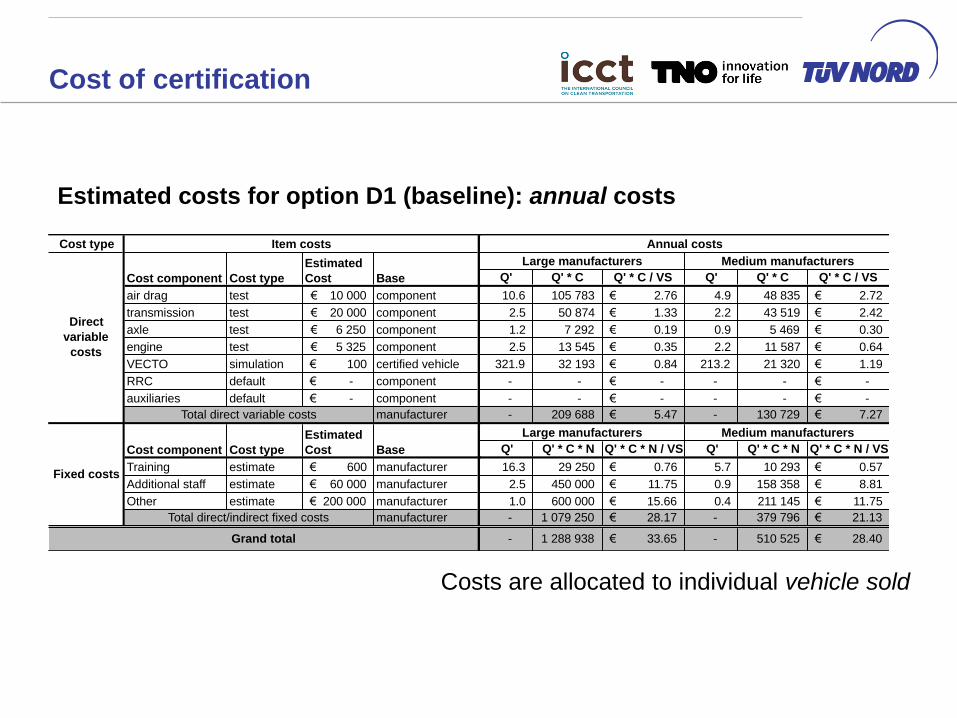
Estimated costs for option D1 (baseline): annual costs
Cost type
air drag test 10 000€ component
transmission test 20 000€ component
axle test 6 250€ component
engine test 5 325€ component
VECTO simulation 100€ certified vehicle
RRC default -€ component
auxiliaries default -€ component
manufacturer
Training estimate 600€ manufacturer
Additional staff estimate 60 000€ manufacturer
Other estimate 200 000€ manufacturer
manufacturer
Cost component Cost type
Estimated
Cost Base
Item costs
Cost component Cost type
Estimated
Cost Base
Direct
variable
costs
Total direct/indirect fixed costs
Total direct variable costs
Grand total
Fixed costs
Q' Q' * C Q' * C / VS Q' Q' * C Q' * C / VS
10.6 105 783 2.76€ 4.9 48 835 2.72€
2.5 50 874 1.33€ 2.2 43 519 2.42€
1.2 7 292 0.19€ 0.9 5 469 0.30€
2.5 13 545 0.35€ 2.2 11 587 0.64€
321.9 32 193 0.84€ 213.2 21 320 1.19€
- - -€ - - -€
- - -€ - - -€
- 209 688 5.47€ - 130 729 7.27€
Q' Q' * C * N Q' * C * N / VS Q' Q' * C * N Q' * C * N / VS
16.3 29 250 0.76€ 5.7 10 293 0.57€
2.5 450 000 11.75€ 0.9 158 358 8.81€
1.0 600 000 15.66€ 0.4 211 145 11.75€
- 1 079 250 28.17€ - 379 796 21.13€
- 1 288 938 33.65€ - 510 525 28.40€
Large manufacturers Medium manufacturers
Annual costs
Large manufacturers Medium manufacturers
Costs are allocated to individual vehicle sold
Cost of certification
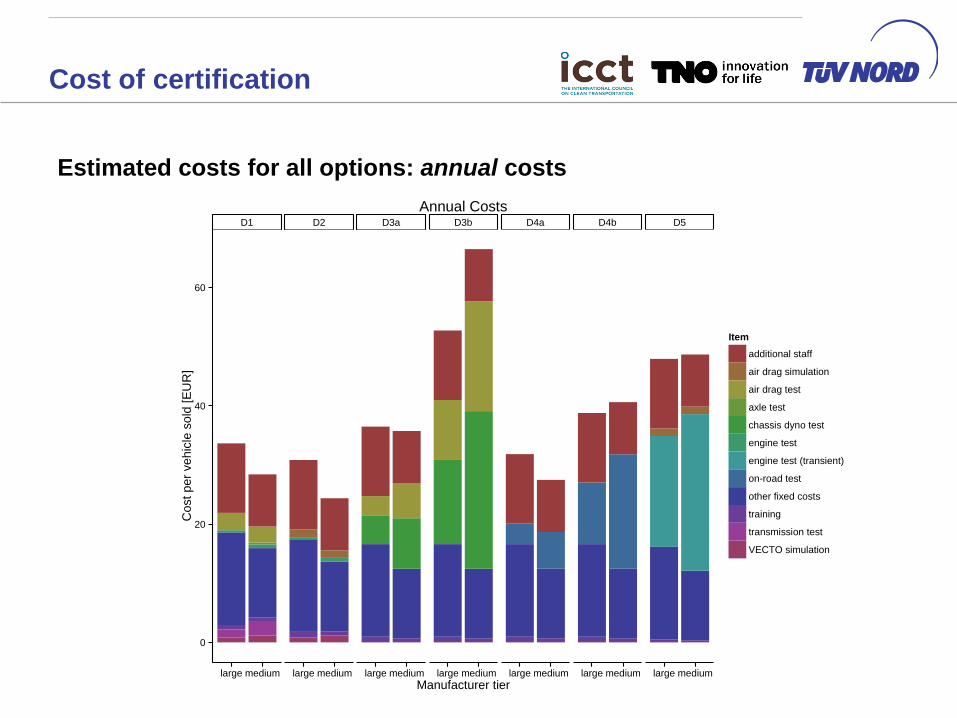
Estimated costs for all options: annual costs
D1 D2 D3a D3b D4a D4b D5
0
20
40
60
large medium large medium large medium large medium large medium large medium large medium
Manufacturer tier
Cost p
er
vehic
le s
old
[E
UR
]
Item
additional staff
air drag simulation
air drag test
axle test
chassis dyno test
engine test
engine test (transient)
on-road test
other fixed costs
training
transmission test
VECTO simulation
Annual Costs

Costs of CoP
Cost structure for “P” options: assumptions
Assumption Rationale
Option P1: Component-specific CoP
Option P1 relies on ensuring that the input data for the simulation of CO2 emissions is valid (it therefore applies to options D1, D2 and D5). This option is based on the assumption that, if the specifications of the different components conform to the data delivered for the certification of the vehicle, then the certified vehicle is in conformity. It was assumed that one percent of components would be retested.
Option P2: Process-specific CoP
Option P2 consists of replicating the CO2 determination process, including retesting components and rerunning the simulation for a portion of certified vehicles. It was assumed that one percent of component tests and simulations would be repeated. The process-specific CoP was determined to be unsuitable for options D3 and D4, as these options do not rely on simulations.
Option P3: Vehicle-specific CoP
Option P3 relies on confirming a vehicle’s CO2 emission value based on PEMS on-road measurements or measurements on a test track. Under determination options D1, D2, and D5, one percent of the certified vehicles would be tested. Under options D3 and D4, ten percent of vehicle families would be retested.
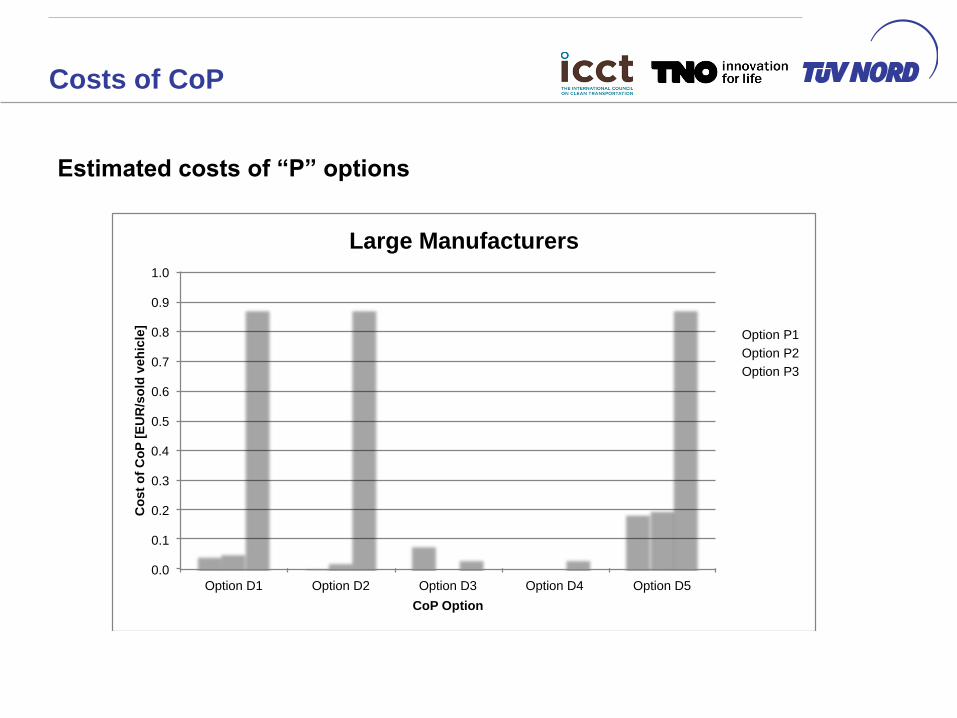
Costs of CoP
Estimated costs of “P” options
0.0
0.1
0.2
0.3
0.4
0.5
0.6
0.7
0.8
0.9
1.0
Option D1 Option D2 Option D3 Option D4 Option D5
Co
st
of
Co
P [
EU
R/s
old
veh
icle
]
CoP Option
Large Manufacturers
Option P1
Option P2
Option P3
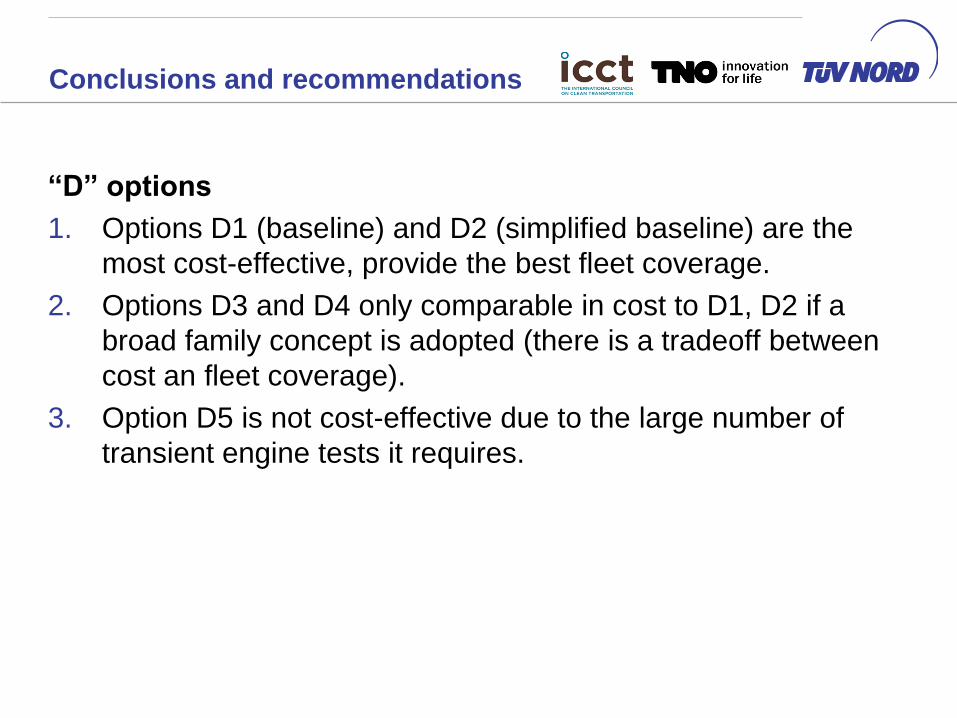
Conclusions and recommendations
“D” options
1. Options D1 (baseline) and D2 (simplified baseline) are the
most cost-effective, provide the best fleet coverage.
2. Options D3 and D4 only comparable in cost to D1, D2 if a
broad family concept is adopted (there is a tradeoff between
cost an fleet coverage).
3. Option D5 is not cost-effective due to the large number of
transient engine tests it requires.

Conclusions and recommendations
“P” options
1. For similar levels of coverage, options P1 (component-
specific) and P2 (process-specific) are vastly more cost-
efficient than option P3 (vehicle-specific conformity of
production).
2. The cost-effectiveness of simulation approaches (options
D1, D2) are carried over to CoP.
3. The estimated additional costs per sold vehicle are EUR
0.05 and 0.07 for large and medium manufacturers (1%
coverage).

04/02/2015 Service Request 1 34
Thank you for your attention