cost and potential of monolithic cigs photovoltaic modules9 minimum sustainable price (msp) • msp:...
TRANSCRIPT

NREL is a national laboratory of the U.S. Department of Energy, Office of Energy Efficiency and Renewable Energy, operated by the Alliance for Sustainable Energy, LLC.
Cost and Potential of Monolithic CIGS Photovoltaic Modules
IEEE Photovoltaic Specialists Conference, New Orleans
Kelsey A. W. Horowitz and Michael Woodhouse
June 17, 2015
NREL/PR-6A20-64507

2
Analysis Disclaimer DISCLAIMER AGREEMENT These manufacturing cost model results (“Data”) are provided by the National Renewable Energy Laboratory (“NREL”), which is operated by the Alliance for Sustainable Energy LLC (“Alliance”) for the U.S. Department of Energy (the “DOE”). It is recognized that disclosure of these Data is provided under the following conditions and warnings: (1) these Data have been prepared for reference purposes only; (2) these Data consist of forecasts, estimates or assumptions made on a best-efforts basis, based upon present expectations; and (3) these Data were prepared with existing information and are subject to change without notice. The names DOE/NREL/ALLIANCE shall not be used in any representation, advertising, publicity or other manner whatsoever to endorse or promote any entity that adopts or uses these Data. DOE/NREL/ALLIANCE shall not provide any support, consulting, training or assistance of any kind with regard to the use of these Data or any updates, revisions or new versions of these Data. YOU AGREE TO INDEMNIFY DOE/NREL/ALLIANCE, AND ITS AFFILIATES, OFFICERS, AGENTS, AND EMPLOYEES AGAINST ANY CLAIM OR DEMAND, INCLUDING REASONABLE ATTORNEYS' FEES, RELATED TO YOUR USE, RELIANCE, OR ADOPTION OF THESE DATA FOR ANY PURPOSE WHATSOEVER. THESE DATA ARE PROVIDED BY DOE/NREL/ALLIANCE "AS IS" AND ANY EXPRESS OR IMPLIED WARRANTIES, INCLUDING BUT NOT LIMITED TO, THE IMPLIED WARRANTIES OF MERCHANTABILITY AND FITNESS FOR A PARTICULAR PURPOSE ARE EXPRESSLY DISCLAIMED. IN NO EVENT SHALL DOE/NREL/ALLIANCE BE LIABLE FOR ANY SPECIAL, INDIRECT OR CONSEQUENTIAL DAMAGES OR ANY DAMAGES WHATSOEVER, INCLUDING BUT NOT LIMITED TO CLAIMS ASSOCIATED WITH THE LOSS OF DATA OR PROFITS, WHICH MAY RESULT FROM AN ACTION IN CONTRACT, NEGLIGENCE OR OTHER TORTIOUS CLAIM THAT ARISES OUT OF OR IN CONNECTION WITH THE USE OR PERFORMANCE OF THESE DATA.

3
Acknowledgments
All our collaborators in industry
Funding
Dr. Michael Woodhouse Co-Author
Ran Fu Team Member, Systems Costs
NREL CIGS Team

4
Overview of Presentation
• $/W manufacturing costs and minimum sustainable price calculations for monolithic, glass-glass CIGS modules o Sputtering plus sulfurization after selenization (SAS)
– Batch – In-line rapid thermal process (RTP)
o Co-evaporation – In-line, 1-stage process – 3-stage process
• Cost reduction roadmap • Levelized cost of energy (LCOE) for CIGS and standard c-Si technology
Photo by Shell Solar, NREL 10803
5
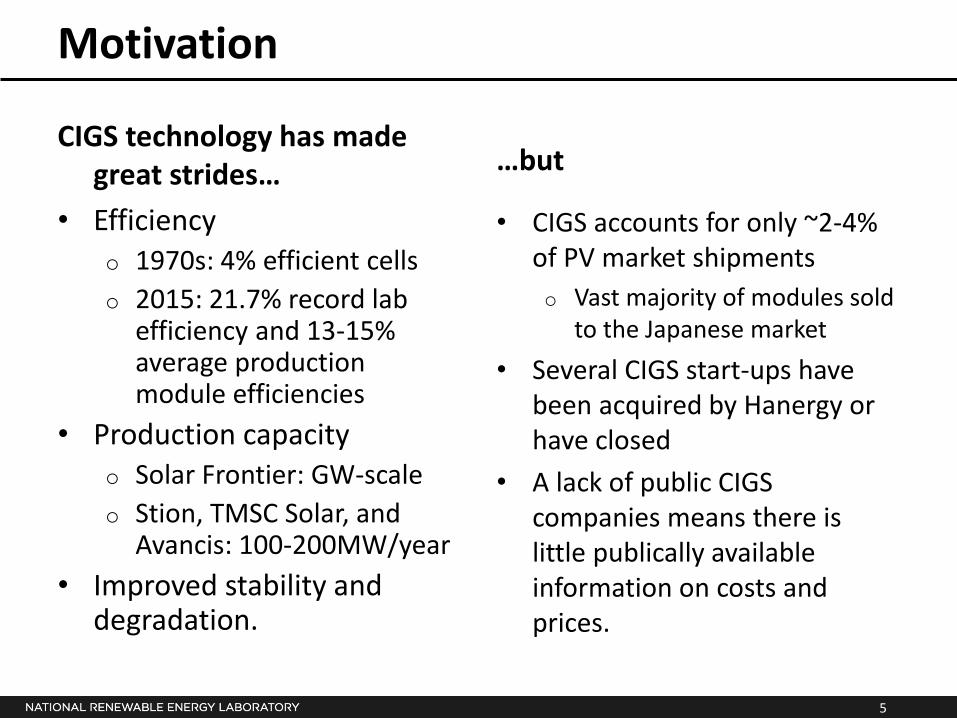
Motivation
• Efficiency o 1970s: 4% efficient cells o 2015: 21.7% record lab
efficiency and 13-15% average production module efficiencies
• Production capacity o Solar Frontier: GW-scale o Stion, TMSC Solar, and
Avancis: 100-200MW/year • Improved stability and
degradation.
• CIGS accounts for only ~2-4% of PV market shipments o Vast majority of modules sold
to the Japanese market • Several CIGS start-ups have
been acquired by Hanergy or have closed
• A lack of public CIGS companies means there is little publically available information on costs and prices.
CIGS technology has made great strides… …but

6
Reference Case Assumptions Glass-glass monolithic module
o Low-iron tempered front glass (3.2mm thick) o Soda lime back glass (3.2mm thick)
1.6m x 0.6m substrate size 1.5 μm thick CIGS layer 250 nm thick Mo layer Ga/(In+Ga) = 0.31 Cu/(In+Ga) = 0.92 14% module efficiency U.S. manufacturing 100MW/year production volume.

7
Method for Computing Manufacturing Cost
Create a process
flow
Request and gather input data
Aggregate data, plug
into model, run analysis
Review by industry and
academic experts

8
Method for Computing Manufacturing Cost
• Total cost of ownership for each step in the manufacturing process o Materials o Utilities o Labor o Depreciation (equipment and facilities/building) o Maintenance
• Assume a largely automated manufacturing process
• 7-year and 15-year straight-line depreciation schedules for equipment and building, respectively.

9
Minimum Sustainable Price (MSP) • MSP: The price at which the net present value (NPV) of a 20-year project is equal
to zero o Minimum price necessary to generate a required rate of return o We set the required rate of return to be the weighted average cost of capital (WACC)
– E = % equity, D = % debt, re = cost of equity, rd = cost of debt, rt = corporate tax rate – WACC = 14.5% calculated for the U.S. PV cell and module companies in 2015 – More information in: Fu, R.; James, T.; Woodhouse, M. (2015). “Economic
Measurements of Polysilicon for the Photovoltaic Industry: Market Competition and Manufacturing Competitiveness.” IEEE JPV 5; pp. 515-524. Accessed May 2015: http://ieeexplore.ieee.org/xpl/articleDetails.jsp?arnumber=7042229.
• Included in the NPV calculation: o Manufacturing costs o Overhead costs
– Research and development (R&D) costs, assumed to be 8% of revenue – Sales, general, and administrative (SG&A) costs, assumed to be 4% of revenue – Other costs (warranty, legal), assumed to be 2% of revenue
o Taxes, 28% effective federal corporate tax rate assumed o Zero salvage value.

10
Manufacturing Process Flow

11
CIGS Absorber Deposition Processes
• Sputtering plus sulfurization after selenization (SAS) o Batch: More mature, deployed in large-scale production
today, higher efficiency, high yield o In-line RTP: Higher throughput if high yields can be
achieved at scale, elemental Se
• Co-evaporation o Not yet deployed in large-scale commercial production,
earlier stage o 3-stage process: Record cell efficiencies, low
throughput, high capital cost o 1-stage, in-line process: Higher throughput, lower
efficiency than 3-stage.
Reference case

12
Step-by-Step Manufacturing Costs Step-by-Step Manufacturing Costs for Sputtering + Batch SAS U.S. Manufacturing, 100MW/year production, 1.6m x 0.6m substrate
• Total module manufacturing cost: $78.22/m2 ($0.59/WDC at 14% efficiency) • MSP: $0.72/WDC.

13
Manufacturing Cost Breakdown
• Material costs dominate o Balance of module materials are a significant cost
driver • The SAS step represents the largest device cost • Exact breakdown will vary by region of
manufacturing.

14
Comparison of Process Costs • This comparison assumes equal manufacturing scale and yields could be
achieved. Additional efforts into the in-line RTP and co-evaporation processes are required to meet these goals.
• We find the 3-stage co-evaporation process to be more expensive than 1-stage co-evaporation or sputtering + batch SAS today.
• 16% efficiency for leading modules on commercial lines has been demonstrated both from sputtering + batch SAS and 1-stage, in-line co-evaporation. Which process will have a long-term efficiency advantage is unknown.
$13.97/m2 $12.23/m2 $17.58/m2

15
Manufacturing Cost Reduction Roadmap
• Decreasing the thicknesses to below 1.5 microns may require engineering to maintain process repeatability, as well as light-trapping structures or electron reflectors. This is an open question.
• Additional reductions could be achieved if throughput for the CIGS absorber process could be achieved without sacrificing efficiency.
• Efficiency improvements are key to future module and system $/W reductions.
Module efficiency (average production): • 16% near-term • 18% mid-term • 20% long-term
(requires significant development).
U.S. Manufacturing, 100MW/year production volume
$0.44/WDC MSP
$0.72/WDC MSP
Some companies may already: • Be achieving ≥ 95-96% yields • Be using ~2mm back glass • Be using Zn(O,S) buffer layer.

16
Scale and Manufacturing Location
• Preliminary estimates indicate that scaling from 100MW/year to 1GW/year could reduce total module costs by $0.03-$0.04/WDC.
• Manufacturing in a low-cost labor location could save an additional $0.05/WDC at the assumed level of automation in our model.
• Costs will always depend on the manufacturing location, supply chain, and specific company.

17
LCOE of CIGS and Standard c-Si
• Single-owner utility model • 7.5% nominal discount rate, 30-year
analysis period • No state or local incentives included • Use $0.72/WDC computed CIGS MSP
for these assumptions as the module price
• $0.65/WDC used as the global c-Si module price.
• For a given system price in this climate, CIGS can achieve a lower LCOE because of the low temperature co-efficient and good low-light performance
• Increasing module efficiency would drive down system costs, a major contributor to LCOE
• Reducing degradation rate from -0.96%/yr assumed here to -0.5%/year could decrease CIGS LCOE by ~0.5 ¢/kWh, depending on the module
• SAM may underestimate CIGS energy production according to industry interviews.

18
Summary and Future Work • We have built a bottom-up cost model for different CIGS
manufacturing processes. o For U.S. manufacturing and 100MW/year production with
sputtering + batch SAS, we calculate a total module manufacturing cost of $0.59/WDC ($0.72/WDC MSP) with potential to reduce below $0.40/WDC.
o Materials, balance of module, and the SAS process represent major module cost drivers.
• Using our modeled module cost numbers, we estimate the LCOE of CIGS to be close to that of standard c-Si. The difference is primarily driven by the higher system price due to the lower module efficiency (14% vs. 16%). o Deeper study of observed energy production in CIGS systems and
energy production modeled with SAM is warranted. • Better resolution on global material costs, supply chains,
and competitiveness would provide further insight into current CIGS costs and market dynamics.

NREL is a national laboratory of the U.S. Department of Energy, Office of Energy Efficiency and Renewable Energy, operated by the Alliance for Sustainable Energy, LLC.
Thank you! [email protected]
20
Complete LCOE Inputs