cost and benefits of body-worn camera deploymentshigh-profile cases involving police use of force...
TRANSCRIPT

Cost and Benefits
Of Body-Worn Camera Deployments
Final Report
April 2018
Police Executive Research Forum
1120 Connecticut Avenue NW, Suite 930
Washington, DC 20036

2
Contents Executive Summary ........................................................................................................................ 7
Introduction ................................................................................................................................... 16
BWC Costs Are Substantial ...................................................................................................... 16
Do BWC Benefits Offset Some of the Costs? .......................................................................... 17
A Nationally Representative Survey of Law Enforcement Agencies ........................................... 18
Sample Selection ....................................................................................................................... 18
Survey Distribution ................................................................................................................... 20
Survey Response ....................................................................................................................... 20
PERF BWC Guidelines............................................................................................................. 22
Policy Recommendations.......................................................................................................... 22
BWC Activation Policies and Officer Discretion ..................................................................... 23
Video Storage............................................................................................................................ 24
(Web-based storage maintained by the BWC vendor or other third party) .............................. 25
(Centralized storage system owned by the police dept.) ........................................................... 25
Release of BWC Footage Is Largely Discretionary .................................................................. 26
Current BWC Deployment ....................................................................................................... 26
Reason for BWC Deployment .................................................................................................. 27
BWC Adoption ......................................................................................................................... 28
When Were BWCs Adopted? ................................................................................................... 28
Who in the Agency Is Wearing BWCs? ................................................................................... 29
Costs .......................................................................................................................................... 30
BWC Program Satisfaction ....................................................................................................... 31
Cost-Benefit Analysis ................................................................................................................... 32
Initial Quasi-Experimental Approach to Cost-Benefit Data ..................................................... 32
Cost-Benefit Instrument and Data ............................................................................................ 33
Initial Analysis of Cost-Benefit Data ........................................................................................ 33
First Change to Analysis Plan: .................................................................................................. 34
Obtaining Civil Suit Data Through the Freedom of Information Act (FOIA) ......................... 34
Use of FOIA Requests .............................................................................................................. 34
Challenges with Data Collection Using FOIA.......................................................................... 35
Analysis of Civil Lawsuit Data ................................................................................................. 35
Civil Lawsuits in Mesa, AZ ...................................................................................................... 36
Number of Suits .................................................................................................................................. 37

3
Payout of Suits .................................................................................................................................... 37
Pre- and Post-BWC Comparison ......................................................................................................... 38
Examining Trends in Types of Civil Suits ............................................................................................. 39
Conclusions from Analysis of Mesa Civil Suit Data ............................................................................. 39
Civil Lawsuits in Phoenix, AZ.................................................................................................. 40
Number of Suits .................................................................................................................................. 40
Payout of Suits .................................................................................................................................... 40
Pre- and Post-BWC Comparison ......................................................................................................... 41
Examining Trends in Types of Civil Suits ............................................................................................. 43
Conclusions from Analysis of Phoenix Civil Suit Data ......................................................................... 43
Civil Lawsuits in Dallas, TX .................................................................................................... 43
Number of Suits with Payouts ............................................................................................................ 43
Payout of Suits .................................................................................................................................... 44
Pre- and Post-BWC Comparison ......................................................................................................... 44
Conclusions from Analysis of Dallas Civil Suit Data............................................................................. 45
Second Change to the Analysis Plan: A Case Study Approach ................................................ 46
Case Studies .................................................................................................................................. 46
Mesa Police Department ........................................................................................................... 47
Phoenix Police Department....................................................................................................... 49
Dallas Police Department ......................................................................................................... 50
Calculating Costs ...................................................................................................................... 50
Comparing Costs with Data on Civil Suits ............................................................................... 52
Lessons Learned from Collection and Analysis of Cost-Benefit Data ..................................... 54
Conclusion: Findings and Recommendations ............................................................................. 56
Findings: ................................................................................................................................... 56
Recommendations ..................................................................................................................... 58

4
Letter from the PERF Executive Director
Many new technologies are changing the business of policing in America. Cybercrime and
computer-assisted crime are changing the very nature of crime and criminal investigations.
Police are starting to deploy new technologies for receiving video and other digital information
through 911 systems, and are learning how to manage and use all that incoming data.
Meanwhile, FirstNet is bringing a new level of sophistication to how police can transmit digital
data to officers in the field. Computer-assisted crime analysis is helping identify crime patterns
so police can prevent the next crime from happening. Social media platforms like Twitter are
changing how police share information, and how they obtain critically important information.
In the midst of all of these technologies, some of which are quite complex and technical, we
have an important new technology that anyone can understand: body-worn cameras (BWCs).
These simple video cameras are little more than a rugged version of the camera in your
smartphone. And yet these devices have the potential to transform policing for the better, by
creating video records of the incidents that officers encounter, and how they respond to those
incidents.
While the technology of BWCs is easy to understand – they’re simply video cameras – the
deployment of BWCs raises a number of important questions that must be addressed, such as
the extent to which BWCs change or “civilize” the behavior of police officers and members of
the public, and whether or not any changes lead to reduced police use-of-force and fewer
complaints against police officers. Another important question is whether BWCs can help
police agencies build better relationships with the communities they serve by promoting
organizational transparency and accountability.
While the potential of BWCs to improve policing for the better is appealing to many law
enforcement executives, an important concern are the financial costs of sustaining a BWC
program. Beyond the up-front costs of purchasing cameras are significant back-end costs,
especially those associated with maintaining, storing, and sharing the large amount of video
data that BWCs produce. It is important that police leaders have a clear understanding of how
these costs compare to the anticipated benefits of deploying BWCs.
The PERF research described in this report was designed to answer some of these questions
about BWCs. With generous support from the Laura and John Arnold Foundation, we
conducted one of the largest and most comprehensive surveys to date of law enforcement
agencies regarding their deployments of body-worn cameras. This survey, which obtained data

5
from a representative sample of police agencies nationwide, revealed a number of important
findings:
Our survey found that more than one-third of American law enforcement agencies have
already deployed BWCs to some or all of their officers, and another 50% currently have
plans to do so.
We found that a large majority of departments with BWCs are happy with them. More
than 85% of them would recommend them to other police agencies.
There is variation in how widely agencies have deploy BWCs within the department.
More than 40 percent of agencies reported that they have given BWCs to all sworn
officers, but some agencies have made only partial deployments. For example, three
agencies that PERF studied more closely had only equipped a fraction of their police
force with BWCs: 10 percent of officers in Phoenix; 30 percent of officers in Dallas; and
44 percent in Mesa, AZ.
We found that for most agencies, the cost of BWCs are quite low – approximately
$5,000 a year or less. (However, the costs are low because most police departments
either have a small number of officers, or they are only partially deploying BWCs to
some, not all, of their officers. BWC costs run into millions of dollars in large agencies.)
Importantly, we found that the most important reason given for adopting BWCs, by over
nine in 10 agencies, was to promote accountability, transparency, and legitimacy. This
objective, which demonstrates a strong desire among agencies to build trust and foster
relationships with their communities, is laudable. To determine if they are meeting this
goal, and to ensure that their practices are consistent with the expectations and values
of the community, we recommend that agencies conduct regular surveys with their
community to measure satisfaction with police services in their neighborhoods.
Finally, we tried to assess whether BWCs might reduce the number of civil lawsuits against
police departments. In theory, the presence of cameras may cause officers and community
members or suspects to behave better, and in some cases, people have been known to
threaten lawsuits but change their mind when they find out there is video of the incident. BWC
footage in some cases can quickly resolve what would otherwise be a “he said, she said”
disagreement. However, we were unable to obtain enough data to make strong conclusions
about whether BWCs reduce lawsuits. With few exceptions, most cities simply do not record
information about the number of lawsuits filed against them, the nature of the complaints, the
outcomes, and related data. We were able to obtain lawsuit data from three cities – Dallas,
Phoenix, and Mesa, AZ – and we made some limited findings based on that information.
6
I hope readers will find this report informative and helpful as police agencies continue to
explore the potential of body-worn camera technology. PERF is very grateful to the Laura and
John Arnold Foundation for its support in conducting this research.
Chuck Wexler, Executive Director
Police Executive Research Forum

7
Executive Summary
High-profile cases involving police use of force have fueled an ongoing national conversation about ways to improve police accountability, transparency, and legitimacy. Many policymakers, community members, and law enforcement officials believe that body-worn cameras (BWCs) advance these goals. Because BWCs provide an audio-visual record of police-public encounters that can be reviewed after an incident, the presence of BWCs may encourage officers and community members to maintain a higher standard of behavior during the incident. And BWCs can demonstrate that a police agency is willing to be transparent and accountable for its actions. The conceptual appeal of BWCs has led to rapid adoption of the technology in police agencies across the country. Existing research provides empirical support for the idea that BWCs can lead to positive outcomes, such as reductions in use-of-force incidents and in complaints against police officers. However, the costs of deploying cameras agency-wide can be substantial. Beyond the front-end costs involved in purchasing cameras, which can be considerable, particularly for larger agencies with hundreds or thousands of officers, there are significant ongoing costs involved in storing and managing video data. Little evidence exists to definitively demonstrate that the potential benefits of BWCs justify their significant costs. On the other hand, another significant cost for local and state jurisdictions is related to civil litigation resulting from police encounters with the public. Millions of dollars are paid out each year, whether through settlements or jury awards, to members of the public who bring legal action against police departments for harms caused by unreasonable use of force or other misconduct by police officers. In addition to the harm that police misconduct can cause to the individuals involved and to the community’s trust in the police, misconduct results in financial costs to local jurisdictions. Given the belief that BWCs can improve the behavior of police officers and members of the public, it follows that BWCs theoretically could yield reductions in civil lawsuits against the police. If police officers and community members, knowing that their actions are being recorded, behave more civilly toward each other, many types of incidents may naturally tend to de-escalate, rather than escalate into physical conflict or other actions that could result in litigation. In addition, the presence of BWCs may discourage some community members from filing untrue or frivolous complaints against the police. A number of agencies with BWCs have reported that some public complaints, which might otherwise have escalated into a civil lawsuit, were withdrawn after the complainant learned that BWC footage of the incident existed (Miller and Toliver, 2014). The Police Executive Research Forum (PERF) conducted a two-pronged study to investigate the costs and benefits of BWCs in more detail.

8
The first phase involved a nationally representative survey of law enforcement agencies to document the extent of BWC adoption, the costs of implementation, and agency policies on how BWCs are used. The second phase involved collecting information on civil lawsuits against police agencies, in order to determine whether the presence of BWCs might tend to improve the behavior of officers and community members, and thereby reduce the likelihood of lawsuits. If BWCs can result in fewer lawsuits and payouts, an investment in BWCs theoretically might “pay for itself” partially or entirely. This work extends previous work by PERF developing an implementation guide for BWC programs (Miller and Toliver, 2014) and research examining the impact of BWCs on citizens’ perceptions of police (Police Executive Research Forum, 2017).
Phase 1: National Survey Purpose The first phase of this project involved fielding a nationally representative survey of police agencies – the largest and most comprehensive survey to date on deployments of BWCs. The goal of this phase was to provide national data on the current extent of BWC adoption among police agencies, and the costs involved in implementing a BWC program. Sample selection and distribution PERF created a nationally representative sample of 1,203 municipal police agencies using the National Directory of Law Enforcement Agencies. Agencies were stratified by size such that all large agencies (i.e., with 250 or more sworn officers) were selected, and the remaining smaller agencies were randomly selected in proportion to their presence in each of the four major regions demarcated by the U.S. Census Bureau. A comprehensive survey distribution approach was used that involved mailed survey invitation letters, mailed hardcopy surveys, mailed reminder letters, and follow-up phone calls. The survey was provided in both hardcopy and online formats. The survey was first distributed in June 2015, and phone calls were finished in September 2015. Response In total, 893 of the 1,203 were returned, for an overall response rate of 74.2%. The response rate for large agencies (250 or more sworn officers) was much higher, at 96.4% (160 of 166 surveys). Analyses demonstrated the respondent sample closely resembled the total sample characteristics, suggesting non-response bias was not an issue.

9
Findings of the national survey:
Police agencies have very high interest in BWCs: More than 35% of respondents indicated that their agencies currently use BWCs, and almost 47% of respondents said they have plans to deploy cameras in the future. So more than eight out of 10 agencies either are using BWCs or are planning to do so.
The primary reason for BWCs is to increase trust in the police: Nearly 92% of respondents indicated that their primary reason for deploying BWCs was to promote accountability, transparency, and legitimacy. All of those goals have to do with increasing the public’s trust in their police departments.
There is some variation in deployment based on agency size: Adoption of BWCs was related to agency size. Departments with 500 or more sworn officers have the highest rate of adoption, with 46% of the departments deploying BWCs. Among the smallest agencies, with 10 or fewer sworn officers, 35.3% have deployed BWCs. Mid-sized agencies have somewhat lower rates of adoption. Among departments with 100 to 499 officers, 33.9% have deployed BWCs. Among departments with 11 to 99 sworn officers, 27.5% have deployed BWCs. Adoption has rapidly increased among agencies since 2009.
Which officers receive BWCs: Most commonly, when BWCs are adopted, they are deployed to all sworn members or to all patrol officers.
Costs: Because most police departments have a small number of officers,1 and because departments do not necessarily provide BWCs to all of their officers, the costs of a BWC program are low in most departments. The median annual cost of an entire BWC program among all agencies responding to the PERF survey was $4,000 in camera-related costs (i.e., equipment and hardware) plus $1,000 in costs related to storing the electronic files containing video footage from the cameras. (These costs were for the most recent fiscal year; and administrative and personnel costs are not included in these numbers). However, costs can run into millions of dollars for large departments. The most expensive BWC program in the PERF survey cost the department $1,334,717 in one year for the BWC equipment, plus $4,000,000 to store the video files.
1 Nearly half of local police departments employ fewer than 10 officers. See Local Police Departments, 2013:
Personnel, Policies, and Practices. U.S. Department of Justice, Bureau of Justice Statistics. Page 1. https://www.bjs.gov/content/pub/pdf/lpd13ppp.pdf

10
Very high satisfaction with BWCs: More than 85% of agencies that have adopted BWCs said they would “recommend” (19.3%) or “strongly recommend” (65.9%) that other agencies adopt BWCs.
Many police agencies’ policies about how BWCs are used are in line with BWC policy recommendations made by PERF in 2014. However, many agencies require officers to activate their BWCs in situations where PERF guidelines recommend giving officers discretion. For example, PERF guidelines call for officer discretion in recording statements by crime victims, and 36.0 percent of surveyed agencies reported that that is their policy, but 58.9 percent reported that they require officers to record crime victims.
Cost-Benefit Analysis Purpose The goal of the second phase of this project was to compare the costs of implementing BWCs with the costs of civil lawsuits against police agencies. A broad range of other potential benefits of BWCs could also be considered in a cost-benefit evaluation, but this study focused specifically on the question: Does the amount of money paid out in civil lawsuits decline after BWCs are introduced, and if so, do these savings offset the costs of deploying BWCs? However, PERF researchers encountered several challenges in obtaining the required information, which necessitated several changes to the original analysis plan. Initial Quasi-Experimental Approach The original plan called for assessing the numbers of civil suit settlements and the dollar costs of the settlements before and after BWC deployment in police agencies. These agencies would be compared to a matched group of agencies that had not implemented BWCs. More specifically, the responses from PERF’s national survey in phase one would inform the selection of 26 “treatment” agencies that had deployed BWCs. Once the 26 agencies were selected, data requests and telephone interviews would be conducted with these agencies to obtain further information on payouts for civil lawsuits. Main challenges:
Despite six outreach waves across various mediums, such as traditional mail, email, and phone calls, only 11 agencies provided any data on lawsuit settlements.
Of the data provided, a significant amount of information was either missing (i.e. not collected by the agency) or unreported (i.e. collected by the agency but unable to be compiled or distributed readily).

11
First Change to Analysis Plan: Obtaining Data on Civil Lawsuits Against Police Agencies Through Freedom of Information Act (FOIA) Requests Due to the challenges in obtaining lawsuit data from police agencies, a new analysis plan was adopted to compare the costs and benefits of BWCs. Eight agencies were selected from those that responded to the national survey, divided evenly into early- and late-adopters of BWCs. The goal was to investigate in detail the nature of civil suits filed against these agencies, how BWCs may have affected cases, and whether some lawsuits may have been withdrawn or never filed due to the presence of BWCs. In consultation with Dr. Joanna Schwartz, a legal scholar with expertise on civil litigation, researchers filed Freedom of Information Act (FOIA) requests to these jurisdictions (typically to the city attorney’s office, financial department, or public information office) to obtain data on civil lawsuits. However, the FOIA process encountered several obstacles. Main challenges:
Despite multiple requests, it took eight months for all FOIA requests to be fulfilled.
The data provided rarely conformed to the tenets of the original request, and a significant amount of information was missing.
BWC administrators and police department attorneys were unable to provide answers to follow-up questions posed in the augmented interview protocol.
Usable data on lawsuits from three cities Of the eight jurisdictions that provided civil lawsuit data through FOIA request, three – Mesa and Phoenix, Arizona, and Dallas, Texas – included sufficient detail for a basic examination of civil suits and payouts before and after BWC implementation.
In Mesa, lawsuits increased, but payments declined: In Mesa, Arizona, since 2001 there has been a general increase in the number of lawsuits, but an overall decrease in the amount of money paid out for these suits. Breaking these figures down further showed that the number of suits with a payout held steady from the pre- to post-BWC period, but that the number of suits without a payout nearly doubled. The average amount of money paid out for civil lawsuits in Mesa was higher in the period before BWCs were deployed, compared to the period after BWCs were deployed. (While the overall number of suits increased following BWC adoption, largely driven by claims of excessive force or false arrest, police shooting claims disappeared altogether. This likely drove the reductions in payouts, because shooting claims can result in substantial settlement awards.)
In Phoenix, lawsuits and payments declined: In Phoenix, Arizona, the data showed a general decrease in both the number of civil suits and the amount of money paid out for these suits since 2006. When suits that resulted in payouts were separated from lawsuits without a payout, both figures were lower in the period after BWCs had been deployed compared to before BWCs. Likewise, the money paid out for suits was lower in the period after BWCs were implemented, compared to before.

12
In Dallas, the number of payouts declined, but the dollar totals increased: Civil lawsuit data from Dallas, Texas included only cases that resulted in a payout. Based on these cases, the number of suits resulting in a payout generally decreased since 2009, while the amount of money paid out for these suits increased. The average payout was higher in the post-BWC period compared to before.
Second Change to the Analysis Plan: A Case Study Approach Because the FOIA data in five of the eight police agencies was incomplete, PERF researchers used a qualitative approach to provide richer detail among the three agencies for which more comprehensive FOIA-obtained data was available: Mesa, Phoenix, and Dallas. PERF researchers made site visits to each agency and conducted interviews with key personnel involved in their BWC programs. What the cost data show:
The Mesa Police Department currently has 330 cameras deployed to about 44% of its personnel. Each camera cost $120 to purchase. The costs of maintenance and data storage are bundled together in a per-camera cost of $1,147. The cost of administrative staff to fulfill FOIA requests is $931 per camera. The total cost per camera, per year in Mesa is $2,198.
There are currently 350 cameras deployed to approximately 10% of personnel in the Phoenix Police Department. The costs of the cameras, their maintenance, and storage for videos are bundled together for an annual fee of $1,608. A five-person civilian unit to fulfill FOIA requests costs $1,207 per camera, and an IT staff member devoting a third of his time to support the BWC program costs $68 per camera. The total cost per camera, per year in Phoenix is $2,883.
The Dallas Police Department has currently deployed 1,000 cameras to about 30% of its personnel. The purchase cost per camera is approximately $189. Camera maintenance and video storage are bundled together for a per-camera cost of $739. The costs of administrative staff involved in the BWC are $197 (although costs to fulfill FOIA requests are offset by requestor fees). The total cost per camera, per year in Dallas is $1,125.
The figures provide estimates of the total annual cost per camera for each agency, based on the costs of cameras and controllers, maintenance, storage, and staff. However, these estimates may change in the future with new contract agreements, changes in staffing, or the implementation of new policies governing the program. The challenges in obtaining civil lawsuit data prevented any broad conclusions about whether implementation of BWCs has led to reductions in lawsuit settlements or payouts resulting from settlements. However, it was possible to compare the total annual cost of BWC programs in the three cities with the annual average amount of settlement money paid in each jurisdiction. This
13
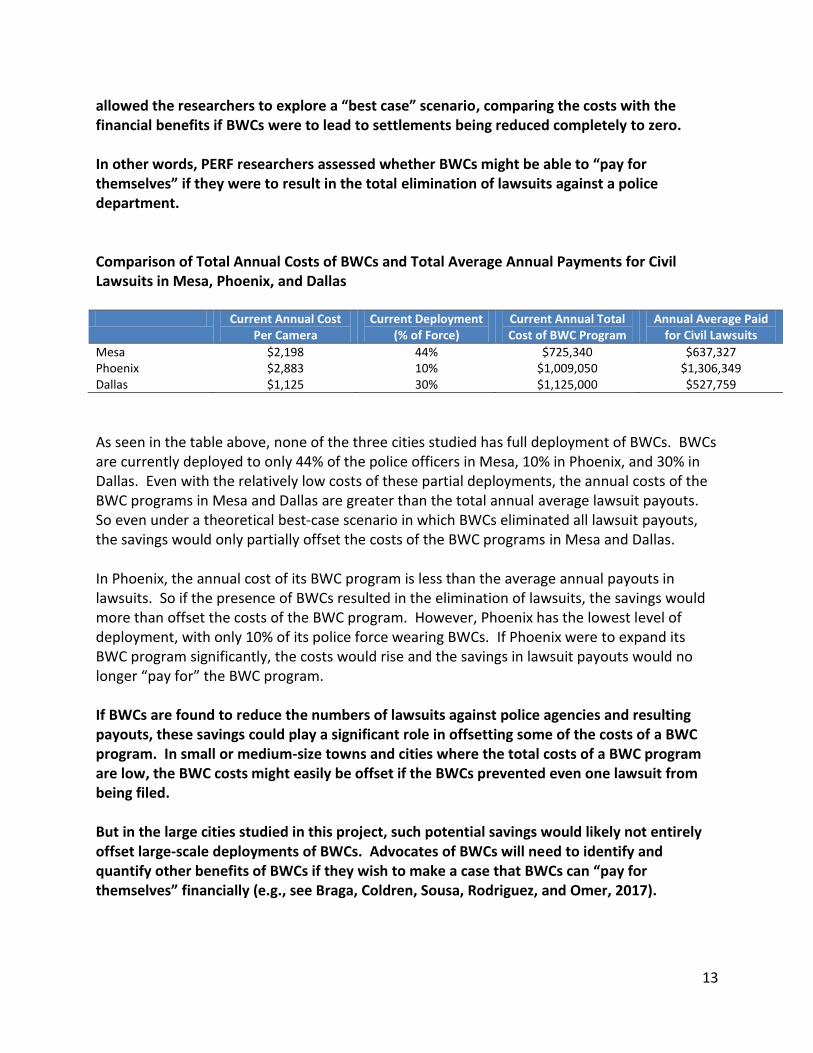
allowed the researchers to explore a “best case” scenario, comparing the costs with the financial benefits if BWCs were to lead to settlements being reduced completely to zero. In other words, PERF researchers assessed whether BWCs might be able to “pay for themselves” if they were to result in the total elimination of lawsuits against a police department. Comparison of Total Annual Costs of BWCs and Total Average Annual Payments for Civil Lawsuits in Mesa, Phoenix, and Dallas Current Annual Cost
Per Camera Current Deployment
(% of Force) Current Annual Total Cost of BWC Program
Annual Average Paid for Civil Lawsuits
Mesa $2,198 44% $725,340 $637,327 Phoenix $2,883 10% $1,009,050 $1,306,349 Dallas $1,125 30% $1,125,000 $527,759
As seen in the table above, none of the three cities studied has full deployment of BWCs. BWCs are currently deployed to only 44% of the police officers in Mesa, 10% in Phoenix, and 30% in Dallas. Even with the relatively low costs of these partial deployments, the annual costs of the BWC programs in Mesa and Dallas are greater than the total annual average lawsuit payouts. So even under a theoretical best-case scenario in which BWCs eliminated all lawsuit payouts, the savings would only partially offset the costs of the BWC programs in Mesa and Dallas. In Phoenix, the annual cost of its BWC program is less than the average annual payouts in lawsuits. So if the presence of BWCs resulted in the elimination of lawsuits, the savings would more than offset the costs of the BWC program. However, Phoenix has the lowest level of deployment, with only 10% of its police force wearing BWCs. If Phoenix were to expand its BWC program significantly, the costs would rise and the savings in lawsuit payouts would no longer “pay for” the BWC program. If BWCs are found to reduce the numbers of lawsuits against police agencies and resulting payouts, these savings could play a significant role in offsetting some of the costs of a BWC program. In small or medium-size towns and cities where the total costs of a BWC program are low, the BWC costs might easily be offset if the BWCs prevented even one lawsuit from being filed. But in the large cities studied in this project, such potential savings would likely not entirely offset large-scale deployments of BWCs. Advocates of BWCs will need to identify and quantify other benefits of BWCs if they wish to make a case that BWCs can “pay for themselves” financially (e.g., see Braga, Coldren, Sousa, Rodriguez, and Omer, 2017).

14
These findings should be interpreted with caution and not be used to draw any broad conclusions about the cost-benefit tradeoff of BWC programs. Given the challenges in obtaining data, it remains unclear whether BWCs affect civil suit payouts, and further, if there are additional factors that would influence the cost-effectiveness of BWCs.
Recommendations PERF’s national survey demonstrated the expansion and popularity of BWCs in policing. With a response rate of 74.2% overall, and 96.4% among police agencies with more than 250 sworn officers, the findings are representative of police experiences and perceptions at the time of the survey. Based on these findings, PERF has a number of recommendations: RECOMMENDATION 1: Field the current survey instrument again to obtain an updated estimate of BWC adoption. The state of BWC adoption has been changing rapidly in recent years, and there is a great deal of interest among police agencies, local elected officials, the news media, and others about how many agencies are deploying BWCs, and how BWCs are impacting police work. PERF’s survey instrument can be replicated to produce standardized, longitudinal data about these developments over time. RECOMMENDATION 2: If resources such as federal grants are dedicated to expand BWC adoption, officials may consider focusing resources on mid-sized police agencies. Mid-size agencies have the lowest rate of BWC adoption, which may be a reflection of the difficulty they face in obtaining the necessary funding. Large agencies have higher BWC costs but tend to have a greater base of resources to draw upon, and small agencies tend to have low, manageable BWC costs. RECOMMENDATION 3: Police agencies should regularly measure community perceptions and attitudes about policing in their neighborhoods. More than nine in 10 agencies indicated that the primary reason for adopting BWCs was to promote accountability, transparency, and legitimacy, reflecting a desire to build trust and foster relationships with their communities. By regularly surveying citizens about their satisfaction with policing in their neighborhoods, police agencies can not only determine if they are achieving their intended goal, but also fulfill their obligation to ensure that members of the community are satisfied with the quality and delivery of public safety services. This is particularly important when considering previous work by PERF that did not find evidence of increasing community perceptions of police legitimacy resulting from deployments of BWCs.

15
RECOMMENDATION 4: There is a need for more data, and better data, on civil lawsuits to be collected by police and government agencies. Municipalities have a responsibility to their communities to track basic data on lawsuits against the police – not only because settlement costs affect taxpayers, but because community members should know how often their police departments are being sued, the reasons for the lawsuits, and the outcomes of the lawsuits.
(Executive Summary concludes.)

16
Introduction Body-worn cameras (BWCs) have become a major topic of discussion within the law enforcement community and among the public. As a broad national conversation about policing continues to unfold in the wake of high-profile uses of force by police, BWCs are often seen as a technological “fix” that can bring more accountability, transparency, and legitimacy to the law enforcement profession (Ariel et al., 2017). This is because BWCs are believed to have a powerful “civilizing” effect on the behavior of individuals who know they are being recorded. When police have an encounter with a community member, it is assumed that the behavior of both the officer and the community member will improve when they know that their words and actions are being recorded and can later be subject to scrutiny (Ready and Young, 2015). Several studies lend support to this claim, finding that BWCs reduce police use of force and complaints against officers (Ariel, Farrar, and Sutherland, 2015; Ariel et al., 2017; Grossmith et al., 2015; Hedberg, Katz, and Choate, 2016; Jennings, Lynch, and Fridell, 2015; Katz, Choate, Ready, and Nuno, 2014; Mesa Police Department, 2013; Ready and Young, 2015). A recent randomized controlled trial found reductions in citizen complaints, but a lack of change in citizens’ perceptions of police associated with BWCs, suggesting that a “civility effect” of BWCs may be limited in most public encounters (Police Executive Research Forum, 2017). BWC Costs Are Substantial
Though there are many potential upsides to implementing a BWC program, the financial costs of BWCs can be significant (see Miller and Toliver, 2014). Beyond the immediate up-front costs of purchasing cameras, there are the major back-end costs involved in operating and maintaining a BWC program over the long term. In particular, storing video data produced by BWCs may necessitate the purchase of new equipment or an annual subscription to a cloud-based database, typically provided by private vendors. Storage issues are cumulative, since retention laws require police departments to keep certain types of footage (for example, video associated with major crime investigations) for years or even indefinitely, which creates a core of videos requiring storage each year in addition to new footage. In addition to storage costs, maintaining and sharing video data may require hiring additional staff, for example, to review and tag footage, to categorize incidents appropriately and document their locations, and to fulfill information requests by media organizations and members of the public (see also White, 2014). Finally, there are significant administrative costs associated with developing and managing BWC programs; procuring contacts, equipment, and personnel; developing policies; and maintaining oversight.
The extensive costs of deploying BWCs must be carefully considered by police executives and city officials against other spending needs and priorities. Cost considerations will also be an important factor driving decisions about the scope of BWC implementation and policies pertaining to storage, retention, and release of videos, which are all critical decisions that may influence whether the community perceives that BWCs foster accountability and transparency.

17
Do BWC Benefits Offset Some of the Costs?
The costs of adopting BWCs may be worthwhile, given the benefits that they are expected to produce. Such benefits may include reductions in police use-of-force incidents, fewer complaints against officers, improvements in citizens’ satisfaction with the police, and increased public perceptions of the legitimacy of police agencies. While these are all important outcomes, they are difficult to translate into a monetary equivalent that can be compared with the costs of purchasing and operating BWCs, in order to help justify their purchase.
A potential benefit that is more easily monetized is the cost of civil lawsuits filed against police agencies. If BWCs reduce police use of force or the number of complaints filed against officers, they may also lead to fewer civil suits filed against police agencies, and fewer or smaller payments in settlements and adjudications. This possibility was modestly examined in a study conducted in Rialto, California by Ariel and colleagues (2015). Using various sources of data, the researchers estimated the average cost of each citizen complaint against an officer to be approximately $20,000. In a related study, a randomized controlled trial examining the effects of BWCs on police use of force and complaints, the researchers determined that 21 fewer complaints were filed as a result of BWCs, equating to about $400,000 that was saved in direct costs resulting from complaints. Overall, the researchers concluded that $4 was saved in resolving complaints for every $1 spent on BWCs. To date, no other attempts have been made to assess the costs and benefits of adopting BWCs within the context of civil lawsuits against police.

18
A Nationally Representative Survey of Law Enforcement Agencies The initial phase of this project included the design and distribution of a national survey. The purpose of the survey was two-fold. First, it provided a snapshot of BWC adoption at a critical point in time as the technology was becoming well-known in the policing profession and many agencies were adopting or considering it (July-September 2015). Second, the survey findings provided important information regarding usage of BWCs that could be directly used in the second cost-benefit phase of the project. Sample Selection
Using the most recent edition of the National Directory of Law Enforcement Agencies, we created a nationally-representative sample of 1,203 municipal police agencies from a population of 11,649 municipal agencies with a listed sworn count.2 This sample size allowed us to make estimates within a margin of error of 5% while detecting small differences in proportions between the sample and population. In order to avoid the sample being populated primarily by the more numerous smaller police agencies,3 we first stratified the sample by agency size. We selected all “large” agencies with 250 or more sworn officers (N=166). For the remaining “small” agencies in the sample (N=1,037), we further stratified into four regions of the country as demarcated by the U.S. Census Bureau (see Figure 1). We sampled based on proportionate need in each region. In other words, we divided the population of small agencies across four regions and obtained the percentage of agencies within each region; then we calculated the number of agencies required to keep the same percentages but that would also sum to 1,034 (see Table 1 for this breakdown and how the sample became 1,037 small agencies).
2 This excludes agencies with non-municipal jurisdictions, such as sheriffs’ offices, counties, state/federal law enforcement, and tribal police. Given the ultimate purpose of examining cost-benefit coupled with lawsuit data, non-municipal jurisdictions presented additional complexities (such as non-law enforcement duties, competing jurisdiction, considerable population heterogeneity over large geographic areas, and/or different laws governing legal judgments and liability) that would have fundamentally altered the survey instrument. Municipal agencies are by far the most common type of police agency in the United States at nearly 80% of all agencies. 3 Using previous estimates and surveys fielded by the Bureau of Justice Statistics, approximately 50% of all police
agencies have 10 or fewer full-time sworn officers. With such a heavy skew toward smaller agencies, a pure random sample of less than 10% of agencies would likely severely under-represent large agencies.

19
Figure 1: Census Regions of the United States
Source: U.S. Census Bureau
Table 1: Count of Small Agencies by Region, and Required Sampling Quotas
1-249
officers % of
agencies Agencies needed
Agencies needed (rounding up)
Northeast 2,578 22.4 232.1 233
South 3,705 32.3 333.6 334
Midwest 3,998 34.8 360.1 361
West 1,202 10.5 108.2 109
11,483 100.0 1,034* 1037
*Power calculation indicated that a total sample of 1,200 would be sufficient, so the goal was at least 1,034 small agencies, (which when combined with 166 large agencies, would total 1,200). However, due to rounding up, we increased each region by one to meet the threshold. The final count is 1,037, three more than the target, though we added four integers, due to the loss of specificity in the rounding process.
We took all small agencies and created a listing for each region. Within each listing, we assigned every agency a random non-integer between 0 and 1 using the RAND function in Microsoft Excel. These random numbers were stabilized to prevent further change and then sorted from smallest to largest. A coin flip was conducted for each of the four regional quadrants to determine whether assignment would start from largest to smallest or smallest to largest. After this, the required number of agencies was selected from each region. For example, 233 agencies were required from the Northeast region, and our coin flip determined we would start with the agency assigned the lowest random number and include the next 232 agencies with larger random numbers.
20
This method allows for rapid determination of replacement agencies since it is based on a fixed random number and sort. To date, we have had to select eight agencies to be replacements as some police departments were out-of-scope, typically because the agency had been disbanded within the past year. To achieve a 70 percent or better response rate, PERF used a proven survey distribution plan4 that consisted of disseminating (1) two waves of survey invitation letters, (2) one wave of hardcopy surveys, (3) two mailed and one faxed survey reminder letters, and (4) reminder phone calls. Invitations included a link to take the survey online, but sampled agencies were also able to request completion of the survey on hard copy or by phone. Survey Distribution
The first two invitation letters were mailed on June 24 and July 17, 2015. The mail wave, which included a hardcopy survey and PPE (Postage Paid Envelope), was mailed on August 4, 2015. A reminder letter was mailed on August 25. Due to project time constraints, the second mailed reminder letter was preceded by the facsimile survey reminder letter, which was faxed out on September 8, 2015. Reminder phone calls were placed to all non-responding agencies between August 26, 2015 and September 18, 2015. During these calls, PERF was able to complete 33 surveys over the phone for agencies that do not currently utilize body- worn cameras in the field. Survey Response
The overall response rate is 74.2 percent (893 out of 1,203 surveys). The response rate among large agencies (those with 250 or more sworn officers) is substantially higher, at 96.4 percent (160 out of 166 surveys). In addition to the 804 completed surveys, 89 additional contacts have provided truncated information, yielding a respondent count of 893. Of the 893 surveys, 314 agencies currently use BWCs, or 35.2% of all responding agencies. Our first analysis examined the similarities between respondents and the sampling frame. While we are confident in the generalizability of the sample from the population, the representativeness of respondents to the sample speaks to a different issue than generalizability. Non-response bias can be a major issue, even with surveys that obtain high response rates. Simply put, if there is a bias and/or potential self-selection among those responding, a perfectly chosen sampling frame can be irrelevant. For our sample, we assessed
4 Dillman, D.A., Smyth, J.D., & Christian, L.M. (2009). Internet, Mail and Mixed-Mode Surveys: The Tailored Design
Method (3rd
ed.). New Jersey: Wiley.

21
respondents on the same criteria from which we selected the sample, namely size and region. Potential bias would be seen if the respondents varied significantly from the sample itself. For example, if our sample had 20 percent of agencies from the Northeast, but our respondents were 60 percent from the Northeast, that would indicate potential bias, as results would not be representative of the sample. For our data, preliminary results suggest there is likely no issue with non-response bias based on our selection criteria. As seen in Tables 2 and 3, our respondent sample closely reflects the sample characteristics on both selection criteria, agency size and region of the country. For the size breakdown, we further disaggregated size for better detail. Even though our response rates among smaller law enforcement agencies (under 250 sworn) is lower than among large agencies, over 82% of our respondents are from small agencies. This does not reflect a heavy skew in the data. Table 2: Sampling Frame and Respondents by Geographical Region
SAMPLING FRAME SURVEY RESPONDENTS
Region # of Agencies Percent # of Agencies Percent
Northeast 259 21.5 182 20.4
South 404 33.6 289 32.4
Midwest 395 32.8 318 35.6
West 145 12.1 104 11.6
TOTAL 1,203 100.0 893 100.0
Table 3: Sampling Frame and Respondents by Agency Size
SAMPLING FRAME SURVEY RESPONDENTS
Size # of Agencies
Cumulative Percent
# of Agencies Cumulative
Percent
Less than 11 519 43.1 328 36.7
11-99 487 83.6 377 78.9
100-249 31 86.2 28 82.1
250-499 91 93.8 85 91.6
500-999 37 96.8 37 95.7
1000 or more 38 100.0 38 100.0
TOTAL 1,203 893
22
PERF BWC Guidelines
The 2014 report, Implementing a Body-Worn Camera Program: Recommendations and Lessons Learned,5 released by PERF and the DOJ Office of Community Oriented Policing Services, contains more than 30 recommendations for law enforcement agencies considering implementing a BWC program. These recommendations were based on a major project in which PERF surveyed 250 of its member agencies, interviewed more than 40 police executives, conducted 20 policy reviews, and convened a national summit in September 2013. At this summit, more than 200 law enforcement representatives, academics, federal officials, and others discussed their experiences with BWCs and debated a number of key policy issues, such as the conditions under which officers should be required, allowed, or prohibited from activating their BWCs, and the extent to which police agencies should release BWC video recordings to the public. PERF has been closely tracking news media coverage of body-worn camera programs for several years. For example, news stories about BWC programs (used in PERF’s “Daily Clips” news service) show that the most difficult policy issues mentioned above continue to be the subject of debate in some cities; there is not yet a consensus or set of model policies used by most agencies. To a large extent, it appears that most cities are fashioning their own policies, often following long periods of discussion among local elected officials and police leaders. However, the PERF/COPS Office recommendations appear to remain solidly in the mainstream of current thinking. Hence, PERF used these recommendations in crafting the current survey questions covering BWC policies. We analyzed some of the responses in light of our recommendations, and found that many agencies’ policies are generally consistent with our recommendations.
Policy Recommendations
The PERF/COPS Office report recommends that officers be required to activate their BWC when responding to all calls for service and during all law enforcement-related activities. Some organizations or individuals have called for stricter policies, requiring officers to activate their cameras during their entire shift, while others have gone in the other direction, giving officers a great deal of discretion in deciding when to turn on the video recording function. PERF’s reasoning was that cameras generally should be activated in order to ensure that they capture the types of situations that are mostly likely to produce evidence or result in controversy, such as officers’ use of force against suspects. At the same time, PERF’s recommendations allow for officer discretion to turn the camera off in certain limited
5 http://www.policeforum.org/assets/docs/Free_Online_Documents/Technology/implementing%20a%20body-
worn%20camera%20program.pdf

23
situations, such as honoring the wishes of crime victims who prefer not to be recorded in the midst of what is often a traumatic event for them. In the survey, we first asked respondents to best categorize, across seven mutually exclusive categories, their agency’s general policy regarding whether officers should have any discretion to turn the BWC off. As seen in Table 4, a sizable majority of respondents in our survey results who use BWCs have a policy consistent with PERF’s recommendation. Very few agencies require that BWCs be activated at all times, and fewer than 10 percent of agencies leave the question to officers’ discretion. A handful of agencies have no policy in place regarding camera activation. Table 4: Agency’s Policies Specifying When Officers Must Activate their BWCs
Activation Policy Number of Agencies
Percent of Agencies
BWC must be activated as soon as an officer starts his/her shift 3 1.1
As soon as officer begins interacting with a citizen (including non-law enforcement-related activity) and/or responds to call for service
51 19.3
As soon as officer begins interacting with a citizen (law enforcement-related activity only) and/or responds to call for service
147 55.7
Once outside of his/her patrol car 2 0.8
At officer discretion 26 9.8
No policy in place 17 6.4
Other/Missing 18 6.8
TOTAL 264 100.0
Note: Policy categories are mutually exclusive.
BWC Activation Policies and Officer Discretion
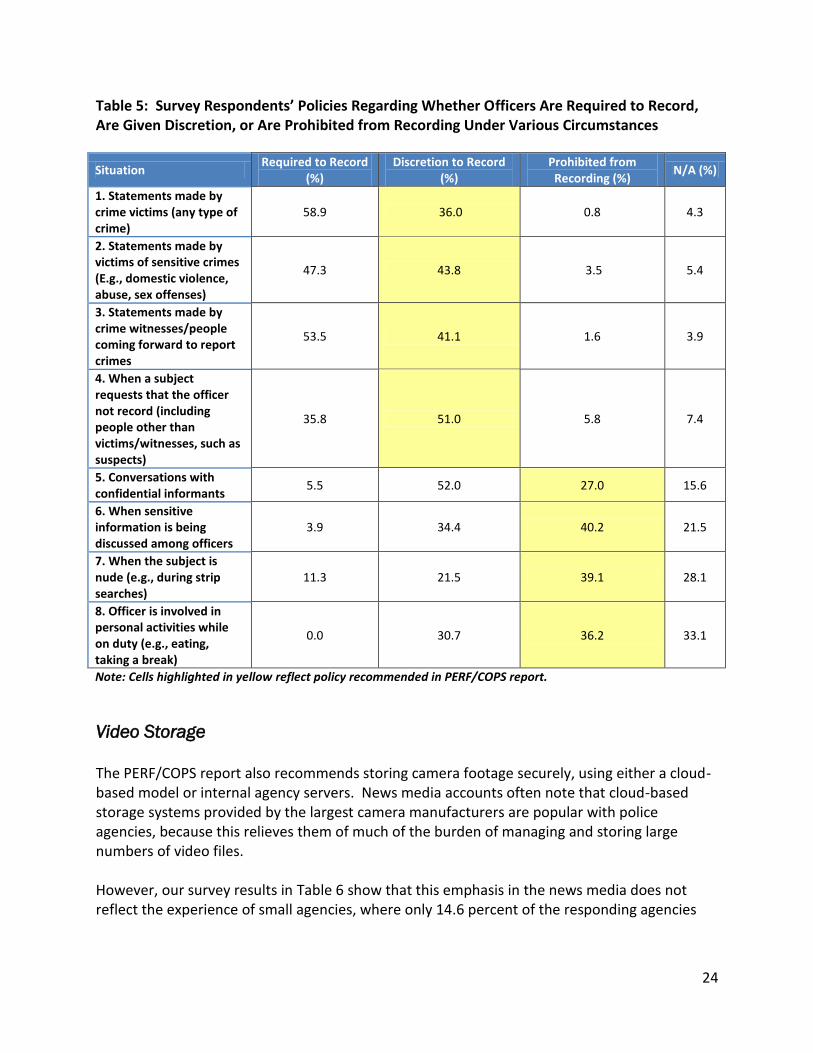
The PERF/COPS report provides more detailed recommendations regarding specific types of encounters where BWCs are a sensitive issue. In Table 5, we present several of these types of encounters that were covered in the survey. For each encounter, we asked the respondent whether the situation required, allowed officer discretion, or prohibited recording as per the agency policy. For each type of situation, the cell highlighted in yellow reflects the general PERF recommendation. For example, in Situation 2, the PERF/COPS recommendation call for officers to exercise discretion in a situation involving a sexual assault victim who prefers not to be recorded, and 43.8 percent of responding agencies said that that is their policy. However, 47.3 percent of agencies reported that they require officers to record such incidents.
24
Table 5: Survey Respondents’ Policies Regarding Whether Officers Are Required to Record, Are Given Discretion, or Are Prohibited from Recording Under Various Circumstances
Situation Required to Record
(%) Discretion to Record
(%) Prohibited from Recording (%)
N/A (%)
1. Statements made by crime victims (any type of crime)
58.9 36.0 0.8 4.3
2. Statements made by victims of sensitive crimes (E.g., domestic violence, abuse, sex offenses)
47.3 43.8 3.5 5.4
3. Statements made by crime witnesses/people coming forward to report crimes
53.5 41.1 1.6 3.9
4. When a subject requests that the officer not record (including people other than victims/witnesses, such as suspects)
35.8 51.0 5.8 7.4
5. Conversations with confidential informants
5.5 52.0 27.0 15.6
6. When sensitive information is being discussed among officers
3.9 34.4 40.2 21.5
7. When the subject is nude (e.g., during strip searches)
11.3 21.5 39.1 28.1
8. Officer is involved in personal activities while on duty (e.g., eating, taking a break)
0.0 30.7 36.2 33.1
Note: Cells highlighted in yellow reflect policy recommended in PERF/COPS report.
Video Storage
The PERF/COPS report also recommends storing camera footage securely, using either a cloud-based model or internal agency servers. News media accounts often note that cloud-based storage systems provided by the largest camera manufacturers are popular with police agencies, because this relieves them of much of the burden of managing and storing large numbers of video files. However, our survey results in Table 6 show that this emphasis in the news media does not reflect the experience of small agencies, where only 14.6 percent of the responding agencies

25
use cloud-based servers. In large agencies, however, two thirds of responding agencies use cloud-based servers. Table 6: Storage Strategies for BWC Video Footage
Storage Strategy
All Agencies Small Agencies (less than
250 sworn) Large Agencies (250+
sworn)
Count of Agencies
Percent of Agencies**
Count of Agencies
Percent of Agencies
Count of Agencies
Percent of Agencies
Cloud (Web-based storage maintained by the BWC vendor or other third party)
72 27.3 28 14.1 44 66.7
Internal Server (Centralized storage system owned by the police dept.)
157 59.5 139 70.2 18 27.3
Other (Individual computers, flash drives, DVDs, etc.)
46 17.4 38 19.2 8 12.1
Note: Totals may not sum to 100% due to some agencies using multiple methods.
Cloud storage and management of BWC footage can be easier for police agencies, particularly large agencies that could be overwhelmed by the volume of footage produced by numerous officers. However, cloud-based storage often is said to be more costly than internal storage, and the costs of storage often are reported to be larger than the initial costs of acquiring body-worn cameras. Cloud-based storage managed by a BWC manufacturer also raises issues of the propriety of government agencies contracting out the management of sensitive information. Among smaller agencies, the task of storing and managing BWC footage can seem less daunting, and often can be accomplished with relatively small expansions of existing resources and personnel.

26
Release of BWC Footage Is Largely Discretionary
As shown in Table 7 below, 79.2 percent of responding agencies have policies or public information laws that require them to release BWC footage, though all but two agencies are allowed exceptions by law, such as video depicting evidence in a criminal case.6 With such a large percentage of respondents following this type of policy requiring case-by-case determinations of whether to release footage, there is a clear ongoing need for video redaction technology, as well as additional budgeting for staff to process FOIA requests or other requests by the public and/or news media to view footage. The volume of requests will likely be proportionate to agency and jurisdiction size. A key challenge is that neither large nor small agencies typically have extensive staffing for public information requests. Large volumes of requests for videos, especially if the requested footage requires redaction, may result in bottlenecks within large agencies. Table 7: Agency Policies on Releasing BWC Video Footage to the News Media or the Public
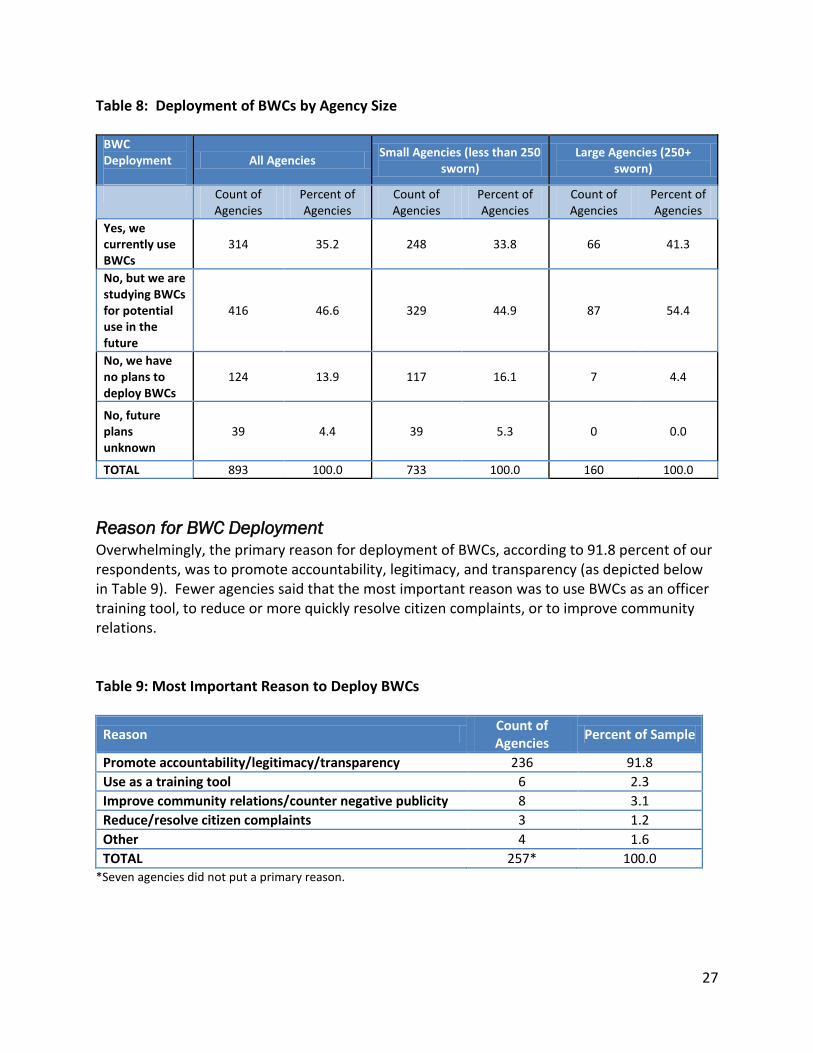
Current BWC Deployment As shown in Table 8, 35.2 percent of our survey respondents said that their agency currently uses BWCs. An additional 46.6 percent said they have plans to deploy cameras sometime in the future. Just 13.9 percent said they had no plans to deploy the technology.
6 These “release under certain circumstances” policies are consistent with PERF’s guidance in Implementing a
Body-Worn Camera Program: Recommendations and Lessons Learned. Police Executive Research Forum, 2014, pp. 17-19.
Policy Count of Agencies
Percent of Agencies
No, we do not have to turn over footage in any circumstances 45 17.0
Yes, we must turn over footage under all circumstances 2 0.8
Yes, but we can withhold footage pursuant to exemptions (e.g., evidentiary or personnel records exemptions, etc.)
207 78.4
No Answer 10 3.8
TOTAL 264 100.0
27
Table 8: Deployment of BWCs by Agency Size
BWC Deployment
All Agencies Small Agencies (less than 250
sworn) Large Agencies (250+
sworn)
Count of Agencies
Percent of Agencies
Count of Agencies
Percent of Agencies
Count of Agencies
Percent of Agencies
Yes, we currently use BWCs
314 35.2 248 33.8 66 41.3
No, but we are studying BWCs for potential use in the future
416 46.6 329 44.9 87 54.4
No, we have no plans to deploy BWCs
124 13.9 117 16.1 7 4.4
No, future plans unknown
39 4.4 39 5.3 0 0.0
TOTAL 893 100.0 733 100.0 160 100.0
Reason for BWC Deployment
Overwhelmingly, the primary reason for deployment of BWCs, according to 91.8 percent of our respondents, was to promote accountability, legitimacy, and transparency (as depicted below in Table 9). Fewer agencies said that the most important reason was to use BWCs as an officer training tool, to reduce or more quickly resolve citizen complaints, or to improve community relations. Table 9: Most Important Reason to Deploy BWCs
Reason Count of Agencies
Percent of Sample
Promote accountability/legitimacy/transparency 236 91.8
Use as a training tool 6 2.3
Improve community relations/counter negative publicity 8 3.1
Reduce/resolve citizen complaints 3 1.2
Other 4 1.6
TOTAL 257* 100.0 *Seven agencies did not put a primary reason.

28
BWC Adoption
Adoption of BWC technology was related to agency size, but the relationship was not as strong as might be expected. More than one-third of the smallest agencies (with fewer than 10 sworn officers) had adopted BWCs – a slightly higher rate than agencies with 11-99 officers and agencies with 100-499 officers. The largest agencies (500 or more sworn officers) had the highest rate of adoption of BWCs, with just under half of agencies having purchased cameras (see Figure 2 below).
Figure 2: Purchase of BWCs by Agency Size
When Were BWCs Adopted?
The adoption of BWCs has grown exponentially. A few agencies were experimenting with the technology as early as 2007. But their adoption significantly took off in 2014, when about one in 10 agencies purchased BWCs, and the total percentage of agencies with BWCs rose from 15 percent to 25 percent. This trend has continued in 2015, with 29.4 percent of survey respondents reporting that they have adopted BWCs (see Figure 3 below).
46
33.9
27.5
35.3
0 10 20 30 40 50
500+
100-499
11 to 99
< 10
Percentage adopting BWCs
Nu
mb
er
of
swo
rn o
ffic
ers

29
Figure 3: Cumulative Adoption of BWCs by Year
Who in the Agency Is Wearing BWCs?
The survey asked which officers currently use BWCs. The most common responses were “all sworn officers” and “patrol officers,” with 43.3 percent and 42.6 percent of agencies, respectively (see Figure 4). Nearly one in four agencies (24.3%) said that they had supplied cameras to traffic officers, but only a few (4.9%) said they equipped SWAT officers with cameras. About a quarter of agencies also said that officers in other units had been supplied with BWCs. These included a wide variety of different assignments, including gang units, detectives, bicycle officers, animal control officers, crime scene investigators, and K9 units. (Numbers add to more than 100% because agencies could check all categories that apply.) Figure 4: Which Units Receive BWCs?
0
5
10
15
20
25
30
35
2007 2008 2009 2010 2011 2012 2013 2014 2015
Pe
rce
nta
ge t
hat
hav
e a
do
pte
d B
WC
s
0
10
20
30
40
50
All sworn Patrol Traffic SWAT Other
43.3 42.6
24.3
4.9
27
Pe
rce
nta
ge o
f ag
en
cie
s

30
Costs
The survey included several questions about the cost of body cameras – both in terms of dollars and staff time. Costs of camera equipment: Table 10 shows that among all the agencies that responded to the PERF survey, the agency with the most expensive BWC program spent more than $1.3 million on cameras in the most recent fiscal year. However, the total median cost was $4,000. This means about half of the agencies responding to the PERF survey spent more than $4,000 on camera equipment in the most recent fiscal year, and half spent less than $4,000. Costs of storing video files: The maximum annual storage cost reported by a responding agency was $4 million. Again, the median cost was much lower, totaling $1,000 per agency, reflecting that most police agencies are quite small. These figures demonstrate considerable variability in costs, with the largest sized agencies serving as outliers in the data. Large agencies had maximum and median costs far higher than small agencies. Table 10: Financial Costs of BWC Maximum Agency Cost Median Agency Cost
Cameras (equipment, hardware, etc.) $1,334,717 $4,000
Large Agencies (250+ sworn) $1,334,717 $60,000
Small Agencies (Less than 250 sworn) $97,000 $2,900
Storage (per year) $4,000,000 $1,000
Large Agencies (250+ sworn) $4,000,000 $29,450
Small Agencies (Less than 250 sworn) $50,000 $500
Maximum Agency Cost Median Agency Cost
Cameras (equipment, hardware, etc.) $1,334,717 $4,000
Storage (per year) $4,000,000 $1,000
Respondents said that their officers spent an average of 25.5 minutes each day reviewing and tagging video footage produced by body cameras. They also responded that they received an average of about 9.1 Freedom of Information requests for camera footage per month. Each of these requests was estimated to take an average of 9.8 hours of staff time to respond to, though the median value was 1 hour.

31
BWC Program Satisfaction Finally, the survey asked two questions of agencies that had implemented body cameras that were designed to measure satisfaction or dissatisfaction with the cameras. Respondents were first asked whether they had plans to expand the program. Fewer than half (40.2%) of the agencies that had deployed cameras said that they were planning to expand the program, while 59.5% had no current plans to expand their use. This could mean that some agencies are reluctant to expand their BWC programs, but it also may reflect that some agencies – especially smaller ones – have already fully built out their program. The latter explanation is bolstered by the answers to a question about whether respondents would recommend that other agencies implement their own body camera programs. More than eight out of 10 agencies would either strongly recommend (65.9%) or recommend (19.3%) that other agencies adopt cameras; only 4% would not recommend adopting BWCs (see Figure 5 below). Figure 5: Satisfaction with Camera Adoption
65.9
19.3
10
3
1
0 10 20 30 40 50 60 70
Strongly recommend adoption
Recommend adoption
Neither recommend for nor against
Recommend against adoption
Srongly recommend against adoption
Percentage

32
Cost-Benefit Analysis PERF’s original plan for this project called for a detailed cost-benefit analysis describing the effect of BWCs on civil litigation settlements. While such a cost-benefit analysis is needed by the field, a number of challenges with implementation emerged, which led to redesigns of the plan. This section details the progression of the cost-benefit analysis and the lessons learned to help researchers interested in conducting a similar analysis in the future. PERF developed the idea of conducting a cost-benefit analysis of BWCs after hearing a presentation by the Mesa (AZ) Police Department at the International Association of Chiefs of Police (IACP) Annual Meeting in October 2014. Police officials noted their use of BWCs led to considerable savings in the amount of money paid by the city to settle civil suits against the police. Officials said that the savings were substantial enough to offset the ongoing cost of fielding and maintaining cameras. This experience could be critical to policing, as it would provide a rationale for a municipality to appropriate funding for BWC programs if the costs of lawsuits could be expected to decline. PERF proposed a study that would examine the costs incurred by agencies adopting BWCs and weigh those costs against measurable reductions in the cost of civil suits against police agencies. Results would provide law enforcement executives, city managers, and municipal councils with generalizable information for assessing the cost of implementing a wide-scale BWC program. Since use of BWCs cannot be randomized between agencies, PERF researchers proposed a quasi-experimental design to assess the costs/settlements before and after BWC deployment in agencies using cameras. Additionally, PERF proposed developing a comparison group of law enforcement agencies without a BWC program during the matched “before” and “after” periods. In the control group agencies (non-BWCs), as in the BWC adopters, we would examine the amounts of settlement money paid out during the same two periods as its paired twin that had not adopted BWCs. This is a classic pretest-posttest control group design, a design with high internal validity that controls for potential effects of time and initial differences between treatment groups. PERF proposed that the best starting point for collecting the data required by the design was a national survey of law enforcement agencies. Fielding a survey also served a broader purpose of providing a comprehensive snapshot of BWC implementation nationally, yielding information useful for policymakers and others to assess the state of BWC adoption and associated policies. The results of the survey are covered in the previous section. Initial Quasi-Experimental Approach to Cost-Benefit Data
Upon completion of the survey, the PERF research team identified 26 potential agencies to serve as the “BWC adopter” treatment group for the quasi-experiment examining BWC costs and civil settlements before and after BWC deployment. A list of these agencies can be found in Appendix 1.

33
There were three criteria for agency selection as a BWC adopter. Each criterion came directly from questions asked in the survey, making the survey and responses critical to the selection process. First, the agency must have had BWCs since 2013 (Question 3 in the survey). This would allow for adequate time following BWC implementation to determine potential effects of the BWC use. Second, an agency had to be fielding at least 30 BWCs (Question 7). This criterion allows for sufficient exposure of BWC technology among the public and across multiple officers, without which it would be hard to argue that the BWC program could influence civil suits. Finally, the agency had to note that civil suit data was publicly available (Question 21). Without public data on civil litigation, there could be no follow-up to examine civil settlement data over time. Cost-Benefit Instrument and Data
PERF worked with Dr. Priscillia Hunt, an economist for the RAND Corporation and expert on conducting cost-benefit analyses, to develop an instrument to obtain the required cost-related data from the 26 selected agencies (see Appendix 2 for a copy of the instrument). Our team believed that this instrument reflects the required level of detail to conduct a comprehensive cost-benefit analysis. In fact, Dr. Hunt was slated to provide further guidance following data collection to analyze the information. However, it soon became clear that a comprehensive cost-benefit analysis as designed would be challenging. PERF conducted six outreach waves to the 26 selected agencies, including a hard copy letter, three emails, and two sets of phone calls. All levels of PERF staff, from assistants to directors, participated in the outreach between December 2015 and March 2016. The point of contact for the outreach efforts was the listed agency representative from the national survey. By March 2016, 11 agencies had provided data. However, numerous data elements were either unreported or missing. In other words, information about civil lawsuit cases either was not collected by the police agencies, or it could not be readily compiled and distributed. Among jurisdictions that were able to provide data, the data were not reported in a consistent or standardized manner across jurisdictions, and in some cases, over time within jurisdictions. During follow-up with respondents, PERF staff members were often told that the agency in question did not readily capture much of the data being requested. The study team then attempted to fill in gaps in the data using open-source research, with limited results. Initial Analysis of Cost-Benefit Data
Although agency response rate was low (11 out of 26) and most datasets had missing data, PERF researchers attempted a limited examination of the civil suit data provided in the responses. The purpose was to establish a base level of “face validity” for our research question by superficially examining whether civil settlement costs declined after BWC

34
implementation. While a decline in money awarded after BWCs is not sufficient alone to establish possible causality of BWCs on civil suits, a reduction in civil payouts is a necessary condition for our predicted effect that BWC implementation would result in civil settlement cost reductions. Only eight agencies provided enough civil suit information to address the face validity of our research question. Of those agencies, seven out of eight showed no pattern of decline in civil suits or payouts following BWC implementation. Interestingly, the Mesa (AZ) Police Department was the only agency demonstrating a sharp decline in lawsuits after its BWC program started. Given the limitations of the data, it is impossible to definitively say whether this trend was an anomaly or a result of BWC implementation in Mesa. However, the descriptive evidence led the research team to consider whether a decline in civil lawsuit costs after BWC use was an exception rather than a rule. First Change to Analysis Plan:
Obtaining Civil Suit Data Through the Freedom of Information Act (FOIA)
The research team discussed a change in scope with LJAF to deviate from the proposed analysis plan. Following discussion through the summer of 2016, LJAF and the research team approved a new approach to assess the potential costs associated with BWCs. Eight agencies that responded to the national survey, divided evenly into early adopters (BWC use before 2014) and late adopters (BWC use starting in 2014 or later), were selected for this new scope (see Appendix 3). The purpose was to limit the count of agencies and go into deeper detail into the nature of civil suits and how BWCs may directly affect cases. We also sought to understand whether some potential civil suits did not advance to court due to the presence of BWCs (e.g., citizens withdrawing a complaint after being informed that there was BWC footage of the incident in question). Use of FOIA Requests
The research team consulted with Dr. Joanna Schwartz, a legal scholar who teaches at the University of California, Los Angeles School of Law. Dr. Schwartz has conducted research into civil liability and collected relevant civil suit and settlement data from dozens of jurisdictions across the country (see Schwartz, 2014). Using Dr. Schwartz’s civil suit data instrument, the research team created a new instrument to capture information for this project. Our work was smaller in scope than the research conducted by Dr. Schwartz, so our team worked to scale down the information being requested. An additional requirement during the selection of eight BWC agencies was that the data from each agency or jurisdiction must have been part of Dr. Schwartz’s research in 2014. The research team believed this would ensure that the data would be available, as our instrument was a truncated version of Dr. Schwartz’s and would be in a format easy to standardize across jurisdictions. Freedom of Information Act (FOIA) requests were made pursuant to the state

35
law governing each jurisdiction. Because the requested data involved civil litigation and settlement information, the FOIA requests were made to the jurisdiction’s legal counsel. While the suits in question involved the police agency, we had learned during the initial cost-benefit phase that law enforcement agencies are not the custodians of these legal records. In Dr. Schwartz’s research, data on civil suits and liability came through FOIA requests tailored to the state and/or local legal requirements dictating public release of information within each jurisdiction. Our team followed that approach, using much of the same language that Dr. Schwartz used in her request (see Appendix 4). Additionally, Dr. Schwartz reviewed our instrument and list of requested agencies in order to provide feedback and further tailor the requests. She informed our team that FOIA requests can often take weeks or months to complete. Challenges with Data Collection Using FOIA
Three problems became clear as the research progressed. First, some FOIA requests were taking many months to complete. PERF did not receive data from all agencies until May 2017, eight months after the initial request. This delay was in spite of multiple requests to non-responding agencies. Second, the data provided rarely fit the format our team had requested and had large portions missing. This made any analysis difficult, both within a given agency’s data and between agencies. Third, our augmented interview protocol (see Appendix 5), which was designed to follow up the FOIA request by asking questions of the BWC administrators and agency general counsel, was not amenable to short discussions over the phone. It proved challenging to arrange the interviews, and the questions tended to produce short, vague, or speculative responses, unless the interviewee had previously done background research into the questions. It was clear to the research team that the requested information was not regularly maintained by many jurisdictions, and in cases where information was maintained, it was often not standardized within a single jurisdiction across years, let alone between different jurisdictions. Due to these issues, jurisdictions could be in full compliance with the FOIA request and yet not provide sufficient actionable data for this research. Analysis of Civil Lawsuit Data
In time, FOIA requests were fulfilled for all eight jurisdictions that were contacted. Although there were significant issues with the quality and usability of the data that were provided, the researchers conducted a basic descriptive examination of civil lawsuits in a handful of jurisdictions. This assessment focused on the annual number of suits and the amount of money paid out for these suits before and after BWCs were deployed in each jurisdiction.

36
Data from three jurisdictions – Dallas, Texas, and Mesa and Phoenix, Arizona – were sufficiently detailed to investigate trends in civil lawsuits following the introduction of BWCs. This was primarily a first-step “face validity” test: the researchers could look for reductions in civil suits and settlement payments following the adoption of BWCs, but could not determine if any observed trends were attributable to the BWCs. It is also important to caution against comparing any observations from the following descriptive analyses across jurisdictions, given differences in data coverage and reporting (as discussed in each section below). Civil Lawsuits in Mesa, AZ
The City of Mesa provided civil litigation data for the 14-year period between January 2001 and December 2014. The data show a cyclic pattern of civil suit counts across the years, and a general decline in the amount paid to settle lawsuits. The following claim types were included in the data: excessive force (non-shooting) (section 1983); excessive force (non-shooting) (non-section 1983);7 false arrest; police shooting (gun); and police shooting (Electronic Control Weapon). Other claim types were also included in the data but did not fall within the scope of the current study and thus are not considered here: libel, slander, defamation; malicious prosecution; and officer/employee misconduct. Figure 6: Annual Number of Lawsuits and Amount Paid for Suits in Mesa, AZ, 2001-2014
7 “Section 1983” refers to cases that are subject to 42 U.S. Code § 1983 Civil Action for Deprivation of Rights. An
officer’s actions may be subject to section 1983 lawsuits when s/he acts “under the color of law” and violates an individual’s constitutionally-protected rights (see Vaughn and Coomes, 1995).
0
2
4
6
8
10
12
14
$0
$500,000
$1,000,000
$1,500,000
$2,000,000
$2,500,000
$3,000,000
$3,500,000
$4,000,000
$4,500,000
2001 2003 2004 2005 2006 2007 2008 2009 2010 2011 2012 2013 2014
Amount Paid Number of Suits Linear (Amount Paid) Linear (Number of Suits)

37
The Mesa Police Department (MPD) first deployed BWCs in August 2012. It would be expected that any changes in civil lawsuits that may have resulted due to BWCs, such as fewer suits filed against the agency, or perhaps more importantly, less money paid out in settlements or adjudications, would be observed after this date of introduction.
Number of Suits To begin exploring this possibility, yearly trends in civil suits brought against the MPD and the amount paid out for these suits are presented in Figure 6. As displayed in Figure 6, the total number of civil suits varies considerably from year to year, ranging from just one suit in 2001 to a high of 12 suits in 2004, 2008, and 2013. Yet, even with peaks in 2008 and 2013, there were near lows in terms of money paid out. Given the limited correlation and potential lag effects not captured in the data, it is difficult to assess why lawsuit counts fluctuate while money paid remains low. Overall, there appears to be a general upward trend in the number of suits against the MPD between 2001-2014,8 though the variation across years likely reflects natural variation with potential time-lagged effects rather than specific, systemic changes taking place in Mesa. There was a small uptick in suits in 2013, the year after BWCs were first implemented, and then the number dropped dramatically in 2014. Without information on suits in later years, it is not possible to determine if this drop simply reflects a reversion to the mean, or a reverse in the long-term upward trend in the number of suits. Payout of Suits Figure 6 also shows that the amount paid out for suits on a yearly basis varies substantially, ranging from a low of $7,700 paid out in 2013 to a high of $3,865,000 paid out in 2004. Generally, the amount of money paid out for civil suits tracks closely with the number of suits filed between 2001-2007. Thereafter, from 2008-2014, these trends begin to diverge, with the amount paid for suits decreasing as the total number of suits increases, and vice-versa. Overall, there appears to be a general downward trend in the amount of money paid for out for civil suits between 2001-2014. While there was an uptick in money paid out in 2010, these figures have generally declined since then. The next step involved examining the average number of civil suits as well as the average payout for these suits per year before and after BWCs were adopted by the MPD. Because BWCs were adopted in August 2012, the pre-BWC period ranges from January 2001 – July 2012
8 The best fitting linear trendlines, displayed in Figure 6 (as well as Figures 7 and 8 below), were calculated by
minimizing the sum of squared residuals using the formula: y = mx + b, whereby m = the slope of the line and b = the y-intercept. In the case of the trendline for number of civil suits in Figure 6, the linear equation is y = 0.3681x + 4.4231. This was computed automatically in Excel using the trendline option.

38
and the post-BWC period ranges from August 2012 – December 2014.9 Table 11 provides a breakdown of the average number of suits for the pre- and post-BWC periods.10 Pre- and Post-BWC Comparison As seen in Table 11, there was an average of 5.8 suits per year during the pre-BWC period versus an average of 9.9 suits per year in the post-BWC period, an increase of approximately 71%. These were further broken down into the average number of suits per year pre- and post-BWCs that resulted in a payout (i.e., through settlement or adjudication) and those that did not result in a payout (i.e., the case was dismissed, or the defendant was granted summary judgment or won at trial, etc.). There was an average of 2.2 suits per year that resulted in a payout during the pre-BWC compared to an average of 2.1 in the post-BWC period. In other words, the average number of suits each year that resulted in a payout was largely unchanged after the introduction of BWCs. On the other hand, there was an average of 3.6 suits per year that did not lead to a payout in the pre-BWC period, versus an average of 7.9 per year in the post-BWC period. This translates in a 116% increase in the average number of suits per year that yielded no payout post-BWCs. Table 11: Comparison of Average Annual Number of Civil Suits During Pre- and Post-BWC Periods in Mesa Average Number of Suits
Per Year Average Number of Suits
Per Year with Payout Average Number of Suits Per Year without Payout
Pre-BWC (01/2001-07/2012)
5.8 2.2 3.6
Post-BWC (08/2012-12/2014)
9.9 2.1 7.9
In addition to the average number of civil suits per year, the average annual payouts pre- and post-BWCs were also calculated. Table 12 shows that before BWCs were deployed by the MPD, the maximum amount paid for all suits in a given year was $3,865,000, and the lowest amount
9 A strong argument could be made for adjusting these periods to account for a potential temporal lag in the
effects of BWCs on civil lawsuits. However, it was not immediately clear what length, if any, would constitute an appropriate lag time. Therefore, it was decided that the two periods would be distinguished by adoption date, because it was the earliest time in which any changes in lawsuits could occur. This also makes sense conceptually, as some officers and community members could be expected to adjust their behavior as soon as officers began using BWCs. The pre- and post-BWC periods were also determined in this way for Phoenix and Dallas. 10
An important limitation of civil lawsuit data is that suits can take several years to resolve. To accurately estimate the number of suits or the amount of money paid out for lawsuits during a particular time period, one must know 1) when the original event that led to a lawsuit occurred, 2) when a lawsuit was filed, and 3) when a suit was finally closed (including appeals). Unfortunately, the data obtained via FOIA requests rarely contained all of these dates. Researchers used the information that did exist. For Mesa, the researchers utilized the “claim date,” which appeared to indicate the date in which the suit was filed. For Phoenix and Dallas, the researchers utilized “date of loss” and “payment date,” respectively.

39
per year was $0 (or $75,000, when considering years that had at least one payout). After BWCs were adopted, the maximum amount paid for all suits in a given year was $42,500 and the lowest was $7,700 (although no money was paid out in the last five months of 2012, following BWC adoption). On average, the annual payout for all suits pre-BWCs was $132,424 versus $2,092 post-BWCs. When considering only cases that resulted in a payout, the average amount paid per year for suits pre-BWC was $354,895 compared to $10,040 post-BWCs. Likewise, the median payout for suits pre-BWCs was $75,000 versus $7,500 during the post-BWC period. Table 12: Comparison of Average Annual Payouts of Civil Suits During Pre- and Post-BWC Periods in Mesa
Maximum Paid during 1 Year
Minimum Paid during 1
Year
Average Paid Per Suit Overall Average Paid Per Suit of Suits with
Payout
Median Paid of Suits with
Payout
Pre-BWC (01/2001-07/2012)
$3,865,000 $175,000 $132,424 $354,895 $75,000
Post-BWC (08/2012-12/2014)
$42,500 $7,700 $2,092 $10,040 $7,500
Examining Trends in Types of Civil Suits Civil suits were also disaggregated by claim type to observe trends in different forms of litigation. These figures are presented in Appendix 6. Similar to the findings for the suits as a whole, the average number of civil suits per year alleging excessive force (section 1983), excessive force (non-section 1983), and false arrest increased following the implementation of BWCs. Additionally, the average amount of money paid out for these suits declined (in the case of non-section 1983 excessive force claims, there was not a single payout in the post-BWC period, though there were a total of six suits with this claim). Conversely, however, the number of civil suits for police shootings involving either gun or ECW both declined from the pre- to post-BWC period. In fact, in the post-BWC camera period, there were no suits alleging either of these claims. Likewise, no money was paid out for police shootings in the post-BWC period. Conclusions from Analysis of Mesa Civil Suit Data These findings suggest that some benefits may have been realized in Mesa following the introduction of BWCs. While the number of suits increased following BWC deployment, the amount of money paid dropped, and the number of suits that did not yield a payout increased. Further, these trends vary among claim type. While the overall number of suits increased following BWC adoption, largely driven by claims of excessive force or false arrest, police

40
shooting claims disappeared altogether. This likely drove the reductions in payouts, because shooting claims can result in substantial settlement awards. For example, the total paid for police shootings pre-BWCs was nearly $7 million, more than double the amount paid for all other types of claims combined. While the figures are in the expected direction, additional research is needed to determine if they are a result of BWCs and if these trends hold over time. There is no existing research evidence suggesting that BWCs will reduce police-involved shootings, nor do the data here make a definitive case for such a relationship. What is clear is that police shootings are the main outlier when it comes to civil settlements, and while there is evidence in the literature that BWCs can reduce use-of-force complaints, there is no established link between BWC deployment and the very rare (yet often expensive, in regards to settlements) event of shootings. Still, the current results are consistent with the belief that BWCs can decrease civil liability outcomes.
Civil Lawsuits in Phoenix, AZ
Civil lawsuit data were obtained from the City of Phoenix for the 10-year period between January 2006 – December 2015. The data included the following claim types: dog bite; excessive force; false arrest; search and seizure; shooting; violation of civil rights. Since all cases involved a police action that could be subject to the influence of BWCs, they were all considered in the following descriptive analyses. Number of Suits The introduction of BWCs by the Phoenix Police Department (PPD) first occurred in April 2011, and thus any effects on civil lawsuits deriving from BWCs would only be observed after this time. Figure 7 is presented to demonstrate the year-to-year trends in the number of civil suits and the amount paid out each year to resolve these suits. As shown in Figure 7, the number of civil suits varies across years. The number of suits gradually increased from 2006-2009, held steady into 2010, and thereafter decreased, with a plateau between 2011 and 2013. Overall, there is a general decreasing trend in the number of civil suits each year in Phoenix from 2006-2015. Payout of Suits With the exception of 2006, when the amount paid for civil suits exceeded $7 million, the total payouts for lawsuits in Phoenix are fairly stable across all years. Excluding 2006, the maximum amount paid out for suits was $2,098,250 in 2008 and the minimum amount paid out was $5,000 in 2015. There appears to be no clear correlation in trends between the number of suits and the amount of money paid out each year. The overall trend in payouts generally decreased between 2006-2015.

41
Figure 7: Annual Number of Suits and Amount Paid for Suits in Phoenix, AZ, 2006-2015
Pre- and Post-BWC Comparison Given that the Phoenix Police Department first deployed BWCs in April 2011, the pre-BWC period ranges from January 2006 – May 2011 and the post-BWC period ranges from April 2011 – December 2015. A breakdown of the average number of suits per year for the pre- and post-BWC periods is presented in Table 13. As shown in Table 13, there were an average of 34.3 suits per year during the pre-BWC period compared to an average of 21.7 suits per year in the post-BWC period, which amounts to a 37% decrease in the average number of suits per year after BWCs were deployed. To probe further, the average number of suits with and without payouts was considered. For cases that resulted in a payout, there were 8.6 suits on average per year pre-BWCs. After BWCs were adopted, this figure dropped 58% to an average of 3.6 suits with a payout per year. Similarly, the average number of suits without a payout pre-BWC was 25.7, versus 18.1 post-BWCs, a decrease of almost 30%. While these trends are consistent with an explanation that BWCs produce declines in suits, data limitations prevent making any such declarative conclusion. The trends should be treated as a limited correlation rather than any causal statement. With numerous missing variables, it is not possible to determine if changes are specifically due to BWCs, other jurisdictional factors (for
0
5
10
15
20
25
30
35
40
45
$0
$1,000,000
$2,000,000
$3,000,000
$4,000,000
$5,000,000
$6,000,000
$7,000,000
$8,000,000
2006 2007 2008 2009 2010 2011 2012 2013 2014 2015
Amount Paid Number of Suits Linear (Amount Paid) Linear (Number of Suits)

42
example, a change in policy or adjudication rules), a revision towards the mean, a pure anomaly, other explanations, or some combination of factors. Table 13: Comparison of Average Annual Number of Civil Suits During Pre- and Post-BWC Periods in Phoenix
Average Number of Suits Per Year
Average Number of Suits Per Year with Payout
Average Number of Suits Per Year without Payout
Pre-BWC (01/2006-03/2011)
34.3 8.6 25.7
Post-BWC (04/2011-12/2015)
21.7 3.6 18.1
Table 14 displays the average annual payouts for suits during the pre- and post-BWC periods. During the pre-BWC period, the average payout per year was $61,506 compared to $19,345 afterwards, a decrease of about 69%. When considering only suits that resulted in a payout, the averages for the pre- and post-BWC periods were $246,022 and $117,206, respectively. Further, the maximum annual payout pre-BWC was $7,119,690 and the minimum annual payout was $60,000. In comparison, the maximum annual payout post-BWC was $1,072,500 and the minimum was $5,000. Although these figures all decreased following the introduction of BWCs, the median payout actually grew; during the pre-BWC period, the median payout was $15,000 versus $25,000 afterwards. Since 2006 appears to be an outlier for civil lawsuits, these figures were also considered without the suits for this year. When 2006 is excluded, the average annual payout for civil suits pre-BWCs is $25,008, a difference from the post-BWC period of about 23%. For suits that resulted in a payout, the average paid per suit was $106,792 pre-BWCs. Finally, the maximum amount paid for suits during the pre-BWC period is $2,098,450. Table 14: Comparison of Average Annual Payouts of Civil Suits During Pre- and Post-BWC Periods in Phoenix
Maximum Paid during 1 Year
Minimum Paid during 1
Year
Average Paid Per Suit Overall
Average Paid Per Suit of Suits with Payout
Median Paid of Suits with Payout
Pre-BWC (01/2006-03/2011)
$7,119,690 $60,000 $61,506 $246,022 $15,000
Post-BWC (04/2011-12/2015)
$1,072,500 $5,000 $19,345 $117,206 $25,000

43
Examining Trends in Types of Civil Suits
The Phoenix civil suit data provided sufficient detail to investigate suits by claim type. These figures are provided in Appendix 7. Reflective of the trend for suits overall, the average number of suits per year for dog bites, excessive force, false arrest, shootings, and violation of civil rights all declined from the pre- to post-BWC periods. While the average number of suits per year increased for search and seizure after the introduction of BWCs, the change was modest. Interestingly, while the average annual payouts decreased for dog bites (to zero) and shootings, they actually increased for excessive force, false arrest, search and seizure, and violation of civil rights. Conclusions from Analysis of Phoenix Civil Suit Data These observations provide preliminary evidence that Phoenix may have enjoyed some benefits upon deploying BWCs. These figures also suggest the benefits not only included a reduction in the amount paid in settlements, but also an overall reduction in lawsuits filed. Again, it was useful to explore these figures by claim type, as each type exhibited unique trends. For most claim types, average payouts actually increased after BWCs had been fielded. It appears that declines in average payouts for shootings drove the overall trends in money paid out. Before BWCs were deployed, the total amount paid out for police shootings in Phoenix was over $9 million, a figure nearly five times greater than the amount paid out for all other claim types combined. To date, there is no research evidence suggesting that BWC program implementation will reduce police-involved shootings. Establishing such evidence could be difficult given the rare occurrence of shootings, although the data clearly show these rare events can come with a high cost in civil settlements. These figures point to the need for future efforts to disentangle the particular effects of BWCs, if any, on different types of police actions. Civil Lawsuits in Dallas, TX
Data on civil lawsuits were acquired from the City of Dallas for the 7-year period between January 2009 – December 2015. The claim types included in the data were civil rights, torts, employment, licensing, and Chapter 13. The latter three claim types fell outside the scope of the current inquiry and were not considered further. Number of Suits with Payouts Compared to Mesa and Phoenix, the data obtained from Dallas included less information for descriptive assessment. For example, the Dallas data includes only suits that resulted in a payout. Therefore, it is not possible to know the actual number of suits in Dallas each year because suits that were filed, but did not ultimately result in a payout, were not included. A further drawback was that no details were included about each claim beyond whether each suit was a tort or a civil rights violation. Assessment of the differences between claim types was not particularly useful. In addition, it is possible that some suits that were considered in the

44
following analyses were also out of scope. But because no further details were given about each case, all torts and civil rights violations were considered. The Dallas Police Department launched a BWC program in January 2014. Figure 8 presents the number of civil suits each year and the amount of money paid out as a result of the suits. The number of suits varies from year to year, increasing into 2010, followed by a decrease into 2011, another increase into 2013, a stabilization in 2014, and finally a decrease again into 2015. There is a general decreasing trend in the number of civil suits from 2009-2015. Payout of Suits In contrast to the number of civil suits, the amount paid out shows a general increasing trend from 2009-2015. Though there is a small amount of variation in the amount paid out for suits between 2009-2012, the figure drastically increases into 2014, and then declines in 2015. The maximum amount paid in a year for civil suits was $1,268,000, which occurred in 2014. The minimum amount was $82,420 in 2011. Figure 8: Annual Number of Suits and Amount Paid for Suits in Dallas, TX, 2009-2015
Pre- and Post-BWC Comparison Using an implementation date of January 2014, the pre-BWC period ranges from January 2009 – December 2013 and the post-BWC period ranges from January 2014 – December 2015. Table
0
5
10
15
20
25
30
$0
$200,000
$400,000
$600,000
$800,000
$1,000,000
$1,200,000
$1,400,000
2009 2010 2011 2012 2013 2014 2015
Amount Paid Number of Suits Linear (Amount Paid) Linear (Number of Suits)

45
15 compares the average number of suits per year as well as the average amount paid for suits per year for these two periods. During the pre-BWC period, there was an average of 19.8 suits per year versus 17.5 suits per year for the post-BWC period. Again, these figures only account for suits that resulted in a payout. Overall, the average amount paid out per lawsuit per year pre-BWC was $15,747, whereas the average amount paid out per lawsuit per year post-BWC was $61,010, a rather sharp increase of 287%. The median payout also increased from the pre- to post-BWC period, from $6,900 to $25,000. Further, the maximum total amount paid in a year pre-BWC was $801,696 and the minimum total for a year was $82,420. In comparison, the maximum amount paid for a year’s worth of lawsuits post-BWC was $1,268,400, and the minimum was $866,941. Table 15: Comparison of Average Annual Payouts of Civil Suits During Pre- and Post-BWC Periods in Dallas
Average Number of Suits Per Year
Maximum Paid during 1
Year
Minimum Paid during 1
Year
Average Paid Per Suit Overall
Median Paid of Suits with Payout
Pre-BWC (01/2009-12/2013)
19.8 $801,696 $82,420 $15,747 $6,900
Post-BWC (01/2014-12/2015)
17.5 $1,268,400 $866,941 $61,010 $25,000
Conclusions from Analysis of Dallas Civil Suit Data Based on the data provided by Dallas, it is difficult to ascertain whether any evidence exists for possible changes in civil suit trends following BWC deployment. The figures generally point to an increase in the amount of money paid out, except for a decrease in 2015. Without further information on suits beyond a single year following BWC deployment, it is not possible to determine if this decrease was an exception or a rule. Further, the decrease in money paid out in 2015 followed a large increase in settlement money paid out beginning in 2012, two years prior to BWC adoption. It is possible that many of the payouts that occurred in the post-BWC period originated from incidents that occurred in the pre-BWC period. In addition, it was not possible to examine differences in suits that were resolved without a payout, or any differences in trends across claim types. Further, these results highlight the possibility there is no universal link between BWC adoption and civil lawsuits. The data are sensitive to outliers, and such outliers may be wholly independent from any effects of BWCs. Given data limitations, it is impossible to establish causation. However, the correlation evidence for Dallas is inconsistent with the idea of BWCs reducing civil litigation.
46
Second Change to the Analysis Plan: A Case Study Approach
Given the challenges in gathering data about lawsuits, the research team worked with LJAF once again to redefine the scope of the project. The final attempt to understand the cost-benefit of BWCs focused on three police departments as case studies – Dallas, Texas, and Mesa and Phoenix, Arizona. The results of this phase are detailed in the next section.
Case Studies The researchers agreed that a qualitative case study perspective would be more suitable to the
task of gathering information about the costs of BWCs, in which cost data could be collected
through interviews with key personnel who were involved in the management and/or
operation of BWC programs at selected police agencies. The researchers would conduct site
visits to these agencies and use in-depth interviews to obtain data that was otherwise not
available through secondary sources or brief phone interviews.
Three police agencies were selected as case studies. In determining which agencies to select,
the researchers began by considering data that had already been collected throughout the
course of this study. Ultimately, the three sites selected were Mesa and Phoenix, Arizona and
Dallas, Texas. The selection of these agencies was based on several factors. First, these
agencies had completed a survey in the first phase of this project. Second, all three agencies
fulfilled the FOIA requests for civil lawsuit data. More importantly, the civil lawsuit data
provided by these three agencies were more complete than what was received from other
jurisdictions. Finally, the two organizations conducting the research had good working
relationships with these departments that the researchers believed would produce the kind of
cooperation needed to gather the information required for the study.
The researchers made initial contact with the Dallas Police Department in August 2017 and the
police departments in Mesa and Phoenix in October 2017.11 The agencies agreed to participate
in the project as case studies, and the researchers worked with key personnel to coordinate site
visits and schedule interviews. The site visit to Dallas took place in August 2017 and the site
visits to the Mesa and Phoenix Police Departments were carried out on December 6-8, 2017.
Prior to the site visits, the researchers spoke via telephone with representatives from each
agency to explain the purpose and goals of the project and to describe in detail the type of
questions that would be asked during the interviews. This process allowed members of the
agency to prepare and obtain any information that would require some time to retrieve.
11
Dallas served as a pilot test for the case study approach. Given the difficulty of acquiring data in previous
efforts, the researchers wanted to ensure that this revised plan was viable prior to full implementation. After a successful site visit with the Dallas Police Department, the research team pursued additional site visits in Mesa and Phoenix.

47
On site in Mesa, the researchers spoke with the chief of police, a commander, and the two
members of the body camera administrative unit. In Phoenix, the researchers spoke with two
members of the body camera unit and an IT staff member who worked with the unit. In Dallas,
the researchers spoke with the head of the body camera unit, a bureau commander, and
deputy chief.
In each site, the researchers gathered information about the cost of the cameras, maintenance,
and storage; costs of personnel administering the camera program; and costs of responding to
freedom of information requests for videos.
Mesa Police Department
The Mesa Police Department (MPD) was one of the early adopters of body worn cameras,
beginning its program on a pilot basis in 2012. Mesa’s program has been the subject of several
evaluations. A study by the department reported a 40-percent decrease in citizen complaints
to the department, including a 75-percent decrease in complaints about use of force (Mesa
Police Department, 2013). A quasi-experimental study by Ready and Young (2015) examined
behavior of officers who did and did not wear body cameras, based on filed reports. The
researchers found that officers who wore cameras were less likely to perform stop-and-frisks
and make arrests, but were more likely to give citations and initiate contacts with citizens.
Officers who wore cameras reported that they were helpful in situations where they issued a
warning or citation, performed a stop-and-frisk, and made an arrest.12
The initial pilot BWC program in Mesa included 50 cameras in 2012 and lasted one year. At the
end of that pilot program, the department sought to expand the program and the expansion
was submitted to the City Council in May 2014. This purchase provided a ramp-up of 100
cameras per year beginning in 2014 and ending in 2016.
Currently, the MPD has 350 body cameras deployed by patrol and traffic enforcement officers.
The department recently renewed a contract with Axon for five additional years. The contract
covers purchase, maintenance, and data storage. Many of the department’s body cameras
have been in service since 2013. Mesa police report that, with the exception of worn out
batteries, they have been quite reliable.
Officers in Mesa are required to activate their BWCs when dispatched to a call for service or
when they have any contact with a member of the public. According to the policy in Mesa, this
includes, but is not limited to, all calls for service, vehicle pursuits, traffic stops, citizen contacts,
impaired driver investigations, accident scenes, transportation of prisoners, all searches (except
12
Perceptions of helpfulness were assessed by Ready and Young (2015) based on responses to a single question asking officers (after each encounter with a member of the public) “In general, do you think the use of a body-worn camera in this type of encounter is…” with response options ranging from “Very Helpful” to “Very Unhelpful.”
48
when an expectation of privacy exists), statements made by subjects, victims, and witnesses,
advising individuals of their Miranda Rights, interrogations, and situations involving official law
enforcement activity or when an officer deems it appropriate to record. Officers are instructed
to keep recording until events are completed and document reasons for non-activation or
interruptions of recordings. Further, officers are allowed discretion when a victim requests not
to be recorded, but officers are advised to record the victim’s request to stop the recording.
To determine whether BWCs are being activated by officers as required by policy, the
department conducts monthly audits comparing the number of calls for which cars were
dispatched against the number of body camera videos recorded. The department also
conducted a formal audit of compliance with body camera usage policies at the district level.
The audit found compliance in the 90% range. Still, Mesa executives noted the need to assess
compliance more thoroughly. For example, they recommended reviewing officers’ recordings
individually, and conducting random spot-checks of recordings relative to the associated calls
for service and public contacts to ensure they correctly match. However, a lack of resources
prohibited full-scale review of the footage produced by officers. The department has noted that
it may be difficult for officers to activate body cameras in some situations when they are using
an ECW or firearm, because such encounters may escalate quickly and not allow a safe moment
for officers to manually operate their BWC.13 Therefore, the department is looking into
automation technology, such as distributing Axon Tasers and holsters that will turn on body
cameras automatically when the ECWs are removed from their holsters.
Officers are responsible for tagging video of incidents recorded on body cameras. Tagging
happens immediately after calls are completed and is software-assisted through a smartphone
connected to the BWC. The CAD system is used to check to ensure that proper tagging has
occurred.
The body camera administrative unit consists of a sergeant and a detective who oversee all
aspects of the program from body camera purchase to installations of new camera-related
software. The two staff members are responsible for redacting body camera videos for the
roughly 300 annual public records requests. Unit staff said that the bulk of these requests
come from insurance companies and attorneys in traffic accident cases. Redaction is done in
two stages, using both Axon and Adobe software to blur entire videos rather than blurring only
faces. By blurring entire videos, rather than just the faces of individuals captured in the video,
the unit was able to minimize the otherwise extraordinary amount of time that would be
involved in the redaction process. Once footage has been redacted, it is forwarded to the
Records Unit to release to the public records requestor. Videos used by prosecutors are
forwarded without redaction.
13
PERF’s BWC guidelines note officers may fail to record “when conditions make it unsafe or impossible to activate the camera” (see Miller & Toliver, 2014). In such cases, PERF notes “officers should document in writing and/or on camera their reasons for not recording” as this “holds officers accountable, allows supervisors to investigate recording irregularities, and documents the absence of video footage for investigations and court proceedings.” MPD follows this recommendation.
49
Phoenix Police Department
The body camera program in the Phoenix Police Department (PPD) began in 2011 with 18
cameras. On April 15, 2013 the Phoenix Police Department expanded its pilot program to 56
cameras as part of a research grant awarded to Arizona State University researchers to evaluate
the pilot BWC program (Katz et al., 2015). The researchers found that arrests by officers
wearing BWCs increased by 17% during the 15-month period of observation, compared to 9% in
the comparison group of officers not wearing BWCs. Complaints against the police declined by
23% among officers who wore cameras, compared to an 11% increase among officers in the
comparison group of officers not wearing BWCs. Moreover, officers in the body camera group
who received a citizen complaint were significantly less likely to have the complaint sustained,
compared to the officers without cameras.
As a result of a patrol reorganization and vendor-upgraded cameras, Phoenix expanded
deployment to 150 cameras in March 2015. In May 2017 the program was expanded to include
300 cameras in the field with 30 back-ups. The annual cost per camera is $1,608, including
purchase, cloud storage, and maintenance. Currently the department archives 213,000 videos,
consuming 45 terabytes of data, in compliance with an Arizona state law requiring videos to be
retained for at least 190 days. Footage associated with active investigations and serious crimes
is required to be stored for a longer time.
Each officer is assigned their own camera, which they retrieve from a docking station at the
beginning of their shift and return at the end of their shifts, initiating upload of videos to the
cloud. Once the camera has been docked, officers can leave. The CAD system links call data to
videos and creates tags for incidents. Officers are sent an email for videos from the small
proportion of recorded incidents that fail to link after five days. Phoenix personnel estimate
that the system captures 95% of videos, leaving approximately one video per officer per day
uncategorized (though this varies by officer). The officers can then review the video(s) and
manually attribute them to the proper incident from that shift. The Phoenix Police Department
estimates this process takes approximately 5 minutes per video. Prior to this system, officers
were required to manually tag all videos produced during each shift, which unit staff estimated
to take approximately 30 minutes per officer.
The body-worn camera unit is overseen by a lieutenant, headed by a police sergeant, and
staffed with an administrative assistant and four aides. The unit administers the camera
program and handles records requests from prosecutors, other government agencies, the
media, and the public. Redaction is done with Microsoft software and consumes about one
hour of staff time for 10 minutes of video recording, although times vary according to what
needs to be redacted. Prosecutors do their own redaction for video evidence to be used in
court.
A member of the PPD IT team also spends about one-third of his time working on software
related to the body camera program. His work has helped to automate camera activation when
50
police vehicle light bars are turned on; to make it possible to share information with
prosecutors; and to sync the CAD system with body cameras.
Dallas Police Department
Building on a pilot program, the Dallas Police Department (DPD) is in the final stages of
deploying 1,000 body cameras. Storage to date has consumed 98 terabytes of video cloud
storage. Videos are kept for 90 days before being deleted unless they are attached to an
investigation or are otherwise significant.
At the time of our site visit, the department was conducting monthly audits of body camera
usage. Each month, 4 to 6 patrol officers per watch were selected from each division for
scrutiny. For those officers selected, lists of calls for service were checked against body camera
video. In cases where video was not captured, officers are interviewed and corrections are
issued. Officers not found to be in compliance are also subject to regular audits at the division
level.
The DPD body camera administrator is a sergeant, assisted by two officers. Unlike the other
two study sites, the DPD administrative unit is not responsible for redaction for public
information requests. Those requests are handled by the Open Records Unit. Like the other
sites, Dallas uses software for redaction, provided by Axon and a third-party vendor. DPD staff
estimated that it takes 15-30 minutes (about one minute of effort for each minute of video) to
redact videos of traffic accidents, the most requested form of video. Costs of the Open Records
Unit responding to the approximately 32 public requests for video each month were said to be
covered by fees charged to requestors.14
Body camera administrators said that there was minimal time spent by IT staff in maintaining
the body camera program.
Calculating Costs
In calculating costs of the body camera programs, the researchers initially set out to capture
data on purchase price of the cameras and controllers, camera maintenance costs, data storage
costs, costs of reviewing and tagging film of incidents recorded on the cameras, costs of staff
time administering the body camera program, cost of IT staff time involved in supporting the
camera program, and costs of responding to FOIA requests. These costs present a current
snapshot of the costs to maintain the BWC program in the current state. If programs grow, it is
likely the cost structure will also grow as administrative costs could increase, even when
cameras and storage may become cheaper per unit when bought in bulk. Due to the potential
variability in the calculations, it is not possible to responsibly project costs for full deployment.
14
Average based on first six months of 2017.

51
All sites reported that categorizing recorded incidents was performed by the officers wearing
the cameras between radio runs, and was typically just a few seconds. Costs of redacting
videos for FOIA requests in the two Arizona departments were incorporated in the camera
administrative staff budget, and in Dallas, these costs were billed to requestors; so PERF did not
include tagging or redaction costs in our cost calculations.
Dallas and Mesa both purchased cameras and controllers outright, while the cost of cameras in
Phoenix was incorporated in a contract that also included maintenance and data storage.15 The
cost of the cameras and controllers, maintenance, and data storage ranged from $1,608 per
camera in Phoenix to $1,267 in Mesa to $928 in Dallas (see Table16 below).
Staff costs were also highest in Phoenix at $1,275 per camera, and included 30% of the time of
an IT staff person. The other two sites claimed little involvement of IT staff on an ongoing basis;
staff costs in Mesa were $931 per camera and $197 per camera in Dallas. While these costs are
accurate for the current iteration of the BWC program, staff costs would could increase
dramatically as a department approached full deployment. Costs are higher in the two Arizona
sites because they include costs of redaction of videos for FOIA requests, while in Dallas this
function is performed on a fee-for-service basis by the Open Records Unit.
Total annual costs were $2,883 per camera in Phoenix; $2,198 per camera in Mesa; and $1,125
per camera in Dallas.
15
Our calculations are based on annual costs: For agencies that bought cameras, the acquisition cost was divided by 5 based on an expected 5-year life span for the cameras.
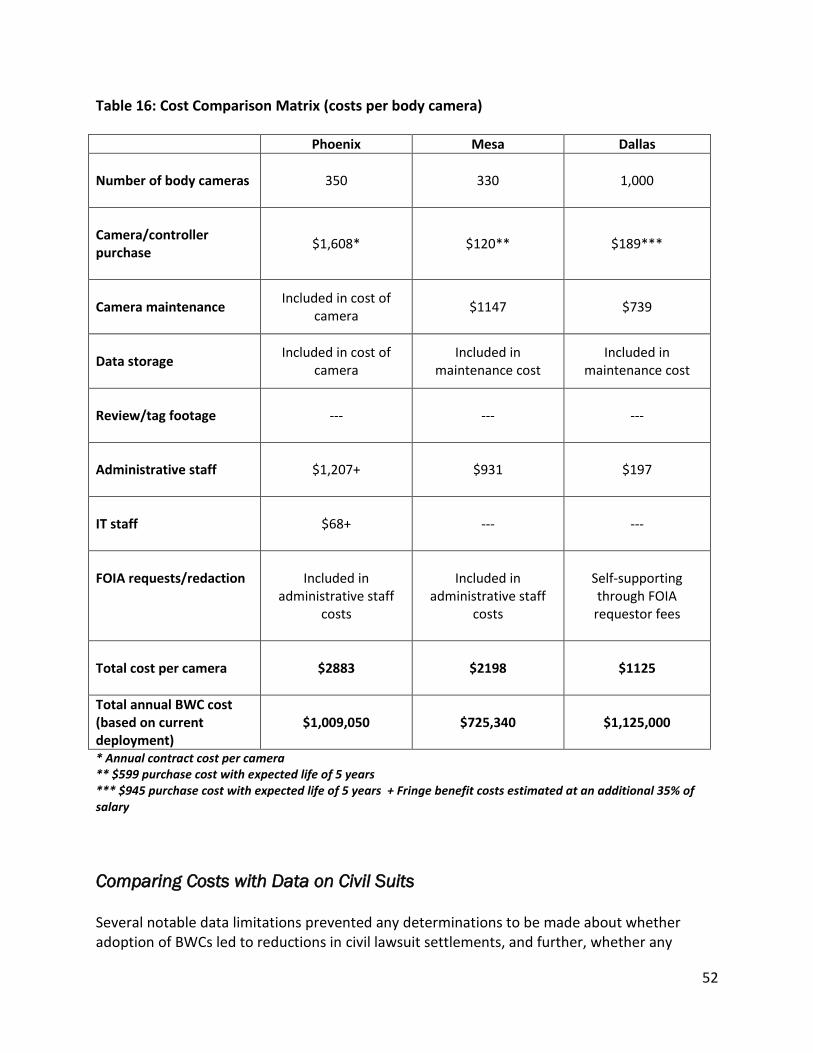
52
Table 16: Cost Comparison Matrix (costs per body camera) Phoenix Mesa Dallas
Number of body cameras
350 330 1,000
Camera/controller purchase
$1,608*
$120** $189***
Camera maintenance
Included in cost of camera
$1147 $739
Data storage
Included in cost of camera
Included in maintenance cost
Included in maintenance cost
Review/tag footage
--- --- ---
Administrative staff
$1,207+ $931 $197
IT staff
$68+ --- ---
FOIA requests/redaction
Included in
administrative staff costs
Included in
administrative staff costs
Self-supporting through FOIA
requestor fees
Total cost per camera
$2883 $2198 $1125
Total annual BWC cost (based on current deployment)
$1,009,050 $725,340 $1,125,000
* Annual contract cost per camera ** $599 purchase cost with expected life of 5 years *** $945 purchase cost with expected life of 5 years + Fringe benefit costs estimated at an additional 35% of salary
Comparing Costs with Data on Civil Suits
Several notable data limitations prevented any determinations to be made about whether adoption of BWCs led to reductions in civil lawsuit settlements, and further, whether any
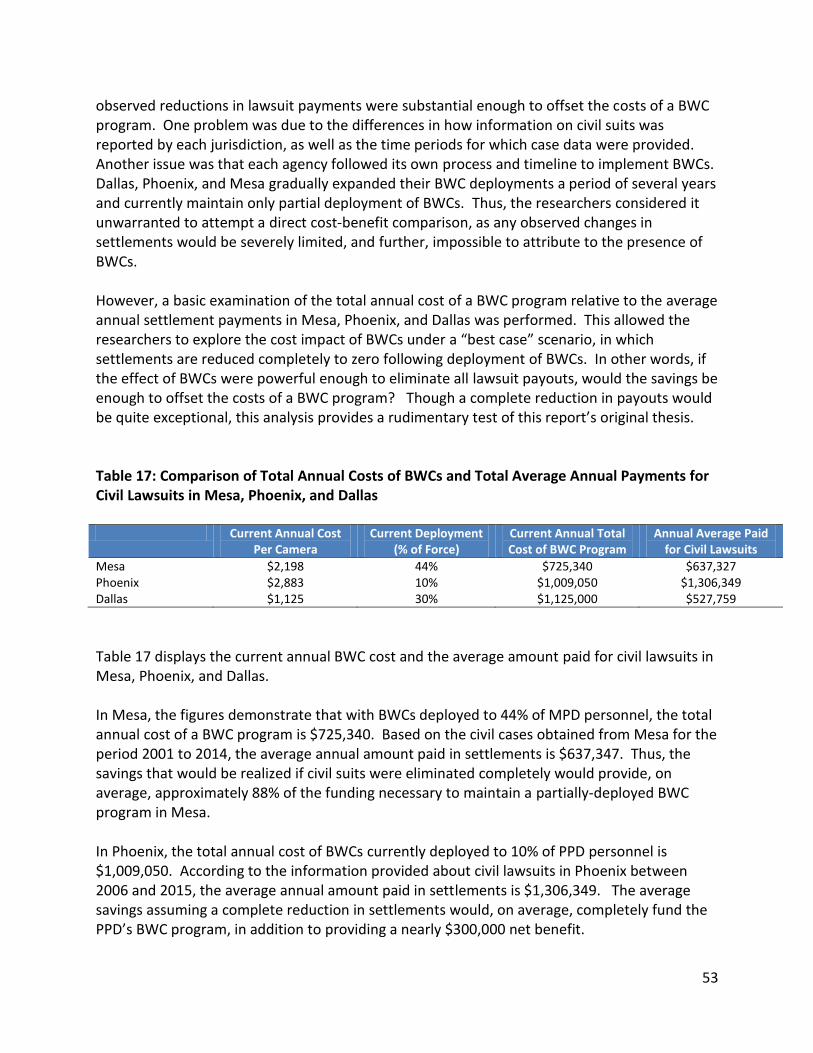
53
observed reductions in lawsuit payments were substantial enough to offset the costs of a BWC program. One problem was due to the differences in how information on civil suits was reported by each jurisdiction, as well as the time periods for which case data were provided. Another issue was that each agency followed its own process and timeline to implement BWCs. Dallas, Phoenix, and Mesa gradually expanded their BWC deployments a period of several years and currently maintain only partial deployment of BWCs. Thus, the researchers considered it unwarranted to attempt a direct cost-benefit comparison, as any observed changes in settlements would be severely limited, and further, impossible to attribute to the presence of BWCs. However, a basic examination of the total annual cost of a BWC program relative to the average annual settlement payments in Mesa, Phoenix, and Dallas was performed. This allowed the researchers to explore the cost impact of BWCs under a “best case” scenario, in which settlements are reduced completely to zero following deployment of BWCs. In other words, if the effect of BWCs were powerful enough to eliminate all lawsuit payouts, would the savings be enough to offset the costs of a BWC program? Though a complete reduction in payouts would be quite exceptional, this analysis provides a rudimentary test of this report’s original thesis. Table 17: Comparison of Total Annual Costs of BWCs and Total Average Annual Payments for Civil Lawsuits in Mesa, Phoenix, and Dallas Current Annual Cost
Per Camera Current Deployment
(% of Force) Current Annual Total Cost of BWC Program
Annual Average Paid for Civil Lawsuits
Mesa $2,198 44% $725,340 $637,327 Phoenix $2,883 10% $1,009,050 $1,306,349 Dallas $1,125 30% $1,125,000 $527,759
Table 17 displays the current annual BWC cost and the average amount paid for civil lawsuits in Mesa, Phoenix, and Dallas. In Mesa, the figures demonstrate that with BWCs deployed to 44% of MPD personnel, the total annual cost of a BWC program is $725,340. Based on the civil cases obtained from Mesa for the period 2001 to 2014, the average annual amount paid in settlements is $637,347. Thus, the savings that would be realized if civil suits were eliminated completely would provide, on average, approximately 88% of the funding necessary to maintain a partially-deployed BWC program in Mesa. In Phoenix, the total annual cost of BWCs currently deployed to 10% of PPD personnel is $1,009,050. According to the information provided about civil lawsuits in Phoenix between 2006 and 2015, the average annual amount paid in settlements is $1,306,349. The average savings assuming a complete reduction in settlements would, on average, completely fund the PPD’s BWC program, in addition to providing a nearly $300,000 net benefit.
54
The figures displayed for Dallas in Table 17 contrast with Mesa and Phoenix in that the average amount paid in civil settlements is a small percentage of the total annual costs of the DPD’s BWC program. With approximately 30% of officers wearing BWCs, the DPD spends $1,125,000 per year for its BWC program. However, the average amount paid in civil settlements is $527,759. At best, the savings acquired from a complete reduction in civil settlement payments would contribute 47% of the total funds necessary for the DPD’s current BWC program.16 A clear qualification to these findings is that they are based on an extreme “best case” scenario in which payouts for civil settlements are completely reduced to zero following the adoption of BWCs, and that the elimination of these payouts is the direct result of BWCs, rather than other factors. If this were to occur, the figures in Table 17 demonstrate that, at least in cases of Phoenix and Mesa, savings in lawsuit payments might provide most or all the necessary funds to offset the total costs of their current, limited BWC programs. However, it is important to note that this is only true when BWCs are partially deployed in each agency. If BWCs were to be deployed to all officers in each department, the costs of purchasing more cameras, storage space, and human resources that would be necessary to manage a larger amount of video footage would substantially outweigh the savings realized from even a complete elimination of civil suit payments. The cost-benefit calculation might be somewhat more favorable in small law enforcement agencies with few officers (where BWC costs would be lower but even a single lawsuit could be costly), or in larger agencies that implement only a partial deployment of BWCs. Other potential benefits of BWCs (e.g., reducing the time spent on investigating complaints against officers) must be considered to adequately determine if the benefits realized by BWCs outweigh the costs (Braga et al., 2017). Lessons Learned from Collection and Analysis of Cost-Benefit Data
The use of cost-benefit models is an important step to analyze the effectiveness of police programs and to evaluate outcomes. The pursuit of a workable and generalizable cost-benefit model examining the effect of BWCs on civil suits and settlements proved more challenging than originally anticipated. Data on civil suits were not regularly maintained by police departments or other agencies of local governments. Some departments may not collect any statistics at all regarding lawsuits, because they have a limited capacity to store data, or their records are not automated, or they may not consider the data to be within their scope to keep. In cases where some data exist, often it was not standardized within a single jurisdiction across years, let alone between different jurisdictions. Due to these issues, jurisdictions could be in
16
It is important to note that the civil lawsuit data for Dallas only covered the general categories of torts and civil
rights cases. It is possible that the payouts (and corresponding savings) would be higher when considering a broader universe of cases that may be expected to be subject to any effects of BWCs.

55
full compliance with our requests for information, including our requests under Freedom of Information Act rules, and yet not provide sufficient actionable data for this research. While the cost-benefit study had to be narrowed in scope, there is value to researchers and practitioners in documenting the process.

56
Conclusion: Findings and Recommendations Recent high-profile police use-of-force incidents have generated a national debate about the best ways to increase transparency and accountability in policing. Body-worn cameras for police officers are widely viewed as a tool to achieve to these goals, because recording police encounters allows the public to review incidents. Another potential benefit of BWCs is that they may improve the behavior of officers and members of the public, based on the theory that most people naturally behave more civilly if they know they are being recorded. As a result, BWCs are often seen as an important new technology that may bring reductions in police use of force and citizen complaints against officers, and in turn, may increase community members’ perceptions of police legitimacy and satisfaction with police services. Some of the research to date on BWCs supports these claims. The wide range of potential benefits to BWCs has encouraged rapid adoption of the technology among agencies across the country and worldwide. However, deploying BWCs is not inexpensive, and it is not clear if their benefits justify their substantial costs. Aside from modest attempts to measure the costs and benefits of BWCs (e.g., Ariel et al., 2015; Braga et al., 2017), researchers have yet to thoroughly engage in this task. This project sought to help fill this critical gap in the literature by comparing the costs of implementing and maintaining a BWC program against any measurable reductions in civil lawsuit settlements. Findings:
1. Body-worn cameras are a highly popular technology within the law enforcement
profession, and their adoption continues to increase among police agencies across the country.
This study provides an important status report on deployments of BWCs in the United States, which demonstrated the expansion and popularity of BWCs in policing. PERF’s nationally representative survey of law enforcement agencies, with a response rate of 74.2% overall, and 96.4% among police agencies with more than 250 sworn officers, produced findings that are representative of police experiences and perceptions at the time of the survey.
PERF’s survey found that more than 35% of agencies have already deployed BWCs, and nearly 47% currently have plans to do so in the future. In other words, more than eight out of 10 agencies either are using BWCs or are planning to do so.
57
85% of respondents with a BWC program in place said they would “recommend” (19.3%) or “strongly recommend” (65.9%) that other police agencies adopt BWCs. That is an extraordinarily high rate of satisfaction among police agencies with a relatively new technology. While there may be initial skepticism among officers, studies show that as officers gain experience with BWCs, their perceptions and attitudes about them improve (Goetschel and Peha, 2017; Ready and Young, 2015). The PERF survey responses further showed that adoption of BWCs has increased rapidly in recent years. While fewer than 5% of agencies had deployed BWCs by 2009, the figure grew to 15% in 2013, and then doubled to approximately 30% of agencies in 2015, and now has reached 35%. It is likely that the percentage of agencies adopting BWCs will continue to grow in the coming years. It is imperative that research on these devices continues, so that law enforcement leaders and community members fully understand their practical consequences (Dymond and Hickman, 2017).
BWCs are seen as a mechanism to increase public trust. Nearly 92% of respondents indicated that their primary reason for deploying BWCs was to promote accountability, transparency, and legitimacy. All of those goals have to do with increasing the public’s trust in their police departments.
There is wide variation in the costs of BWC programs in different agencies. Because most police departments have a small number of officers, and because departments do not necessarily provide BWCs to all of their officers, the costs of a BWC program are low in most departments. The median cost of an entire BWC program among all agencies responding to the PERF survey was approximately $5,000 per year. But annual costs can run into millions of dollars for large departments.
Current deployment rates are uneven among agencies, with the largest rates of adoption seen among the largest agencies, followed by the smallest agencies; mid-sized agencies had the lowest rates of BWC deployment. One explanation for this finding is that mid-sized agencies may lack the financial resources that are necessary to adopt BWCs (e.g., see Smith, 2018). Though the largest agencies may incur the most substantial costs when implementing a BWC program, they are also likely to benefit from a greater tax base and foundation of resources to draw from. Conversely, while the smallest agencies may have fewer resources to rely on, they also require fewer cameras, generate less data that needs to be managed and stored, and thus tend to have the ability to deploy BWCs without facing extraordinary costs.
Many police agencies’ policies about how BWCs are used are in line with BWC policy recommendations made by PERF in 2014. However, many agencies

58
require officers to activate their BWCs in situations where PERF guidelines recommend giving officers discretion. For example, PERF guidelines call for officer discretion in recording statements by crime victims, and 36.0 percent of surveyed agencies reported that that is their policy, but 58.9 percent reported that they require officers to record crime victims.
2. Information about civil lawsuit settlements needed for a cost-benefit analysis of BWC
programs is difficult to obtain. Most law enforcement agencies do not track information about civil lawsuits, and information that is collected by some local municipalities often is missing critical data elements, lacks standardization, and can take many months to obtain. Even in departments that maintain records on lawsuits, the information often was not standardized from one year to the next within a single jurisdiction, much less standardized across different jurisdictions. As a result, many jurisdictions were unable to provide information. Many FOIA requests for information made during this project were fully complied with, and yet did not provide sufficient actionable data for this research because the jurisdictions do not track the information.
3. In three cities studied in this project, it is unlikely that reductions in civil lawsuit payments could result in financial savings large enough to offset the costs full funding for a BWC program. The limited data on the costs of lawsuits that PERF was able to obtain from three police departments (Mesa, Phoenix, and Dallas) demonstrated that even in the extreme best-case scenario of civil settlement payouts being completely eliminated as a result of deployment of BWCs, it is unlikely that the savings would be substantial enough to offset the total cost of a BWC program. While some jurisdictions realized enough savings to offset most of the costs of BWCs, this was only true because BWCs had been deployed to less than half of all personnel. If BWCs were deployed to all personnel, the costs would likely outweigh the savings, even if civil suits were completely eliminated. Of course, this is not to say that the costs of BWCs cannot be justified; there are many other perceived benefits associated with this technology that local officials may consider substantial enough to justify the initial costs and continuing expenses of a BWC program.
Recommendations
RECOMMENDATION 1: Field the current survey instrument again to obtain an updated estimate of BWC adoption. PERF’s nationally representative survey found that than 35% of agencies have already deployed BWCs, and nearly 50% currently have plans to do so in the future. The state of BWC adoption has been changing rapidly in recent years. Given the strong response rate and representative sample, PERF’s survey instrument is strong and could be replicated with minimal revisions to

59
produce standardized, longitudinal data. Adoption of BWCs is a major development in policing that should be monitored and subjected to continuing analysis. RECOMMENDATION 2: If future resources are dedicated to expand BWC adoption (such as federal grants), officials may consider focusing resources on mid-sized police agencies. Survey results indicated the highest rates of BWC adoption are among the largest agencies, followed by the smallest agencies; mid-sized agencies had the lowest rates of BWC deployment. This finding is potentially linked to financial resources. The largest agencies have high budgets and sizable tax bases, so funding BWCs is often about reallocating resources, rather than finding new sources of revenue. In contrast, a BWC program in the smallest agencies is limited in scope, resulting in limited cost. But for mid-size agencies, the costs may outpace resources unless they can obtain additional financial assistance to overcome at least the initial costs of BWCs. RECOMMENDATION 3: Police agencies should regularly measure community perceptions and attitudes about policing in their neighborhoods. More than nine in 10 agencies indicated that the primary reason for adopting BWCs was to promote accountability, transparency, and legitimacy, reflecting a desire among agencies to build trust and foster relationships with their communities. Yet, a previous experiment conducted by PERF in Arlington, Texas did not reveal evidence of improved perceptions of police legitimacy resulting from BWC deployments. (Police Executive Research Forum, 2017). To determine if they are achieving this goal, agencies should regularly survey citizens about their satisfaction with policing in their neighborhoods. By conducting standardized surveys on a regularly basis agencies would be able to establish a baseline assessment of community satisfaction and to monitor shifts in the communities’ perceptions and attitudes about service provision over time. This would enable police agencies to see how community sentiment shifts in response to the implementation of new programs or technologies, such as BWCs. It would also allow agencies to take meaningful, proactive steps to improve and sustain community satisfaction over time. Further, police agencies have an obligation to ensure that members of the community are satisfied with the quality and delivery of public safety services (Moore and Braga, 2003). The Commission on Accreditation for Law Enforcement Agencies (CALEA) includes citizen surveys among the criteria in their accreditation program.17 Gauging public perceptions and attitudes is an critical step towards improving services, building trust, and fostering relationships with the community.
17
http://www.calea.org/content/standards-titles-1

60
RECOMMENDATION 4: There is a need for more data, and better data, on civil lawsuits. This data should be collected by police and government agencies. While the costs of BWC programs were relatively well documented or otherwise accessible to the PERF research team, complete and accurate information pertaining to civil lawsuits was not available. A deficiency of comprehensive and high-quality data on civil lawsuits was the primary challenge for the current inquiry. Considering that civil suits against police agencies can result in substantial payouts, relevant information about these cases should be collected and updated regularly in a standardized and easily accessible format. Unfortunately, police agencies may feel that this type of data is too detailed or otherwise outside the scope of their responsibilities to track regularly. However, municipalities have a responsibility to their communities to track this type of information – not only because settlements affect taxpayers, but also because community members should know how often their police departments are being sued, the reasons for the lawsuits, and the outcomes of the lawsuits. Police leaders should support or lead efforts to expand data collection. The potential of BWCs for reducing lawsuit costs could help police leaders to secure funds to expand BWC programs, if research demonstrates such savings. On the other hand, if savings are not realized, police leaders may consider the costs of their BWC programs more carefully. A more solid foundation of knowledge about BWC costs and benefits will help to inform police departments’ decisions about whether to expand their BWC programs to include most or all officers.

61
References Archbold, C. A., & Maguire, E. R. (2002). Studying civil suits against the police: A serendipitous finding of sample selection bias. Police Quarterly, 5(2), 222-249. Ariel, B., Farrar, W. A., & Sutherland, A. (2015). The effect of police body-worn cameras on use of force and citizens’ complaints against the police: A randomized controlled trial. Journal of Quantitative Criminology, 31(3), 509-535. Ariel, B., Sutherland, A., Henstock, D., Young, J., Drover, P., Sykes, J., Megicks, S., & Henderson, R. (2017). “Contagious accountability:” A global multisite randomized controlled trial on the effect of police body-worn cameras on citizens’ complaints against the police. Criminal Justice and Behavior, 44(2), 293-316. Braga, A., Coldren, J. R., Sousa, W., Rodriquez, D., & Alper, O. (2017). The benefits of body-worn cameras: New findings from a randomized controlled trial at the Las Vegas Metropolitan Police Department. Arlington, VA: CNA Corporation. Dymond, A., & Hickman, M. (2017). Body-worn cameras, use of force, and police-civilian interactions. Policing: A Journal of Policy and Practice. Advance Online Article. https://doi.org/10.1093/police/pax073. Goetschel, M., & Peha, J. M. (2017). Police perceptions of body-worn cameras. American Journal of Criminal Justice, 42(4), 698-726. Goodison, S. E., & Thomson, J. S. (2017). There and back again: Ensuring law enforcement’s continued support for modernized crime data. Criminology and Public Policy, 16(4), 1099-1105. Grossmith, L., Owens, C., Finn, W., Mann, D., Davies, T., & Baika, L. (2015). Police, camera, evidence: London’s cluster randomised controlled trial of body worn video. London: College of Policing. Hedberg, E. C., Katz, C. M., & Choate, D. E. (2017). Body-worn cameras and citizen interactions with police officers: Estimating plausible effects given varying compliance levels. Justice Quarterly, 34(4), 627-651. Jennings, W. G., Lynch, M. D., & Fridell, L. A. (2015). Evaluating the impact of police officer body-worn cameras (BWCs) on response-to-resistance and serious external complaints: Evidence from the Orlando police department (OPD) experience utilizing a randomized controlled experiment. Journal of Criminal Justice, 43(6), 480-486.

62
Katz, C. M., Choate, D. E., Ready, J. R., & Nuño, L. (2014). Evaluating the impact of officer worn body cameras in the Phoenix police department. Phoenix, AZ: Center for Violence Prevention and Community Safety, Arizona State University. Katz, C.M., Kurtenbach, M., Choate, D.E., & White, M.D. (2015). Phoenix, Arizona, Smart Policing Initiative: Evaluating the Impact of Police Officer Body-Worn Cameras. Retrieved from https://www.bja.gov/bwc/pdfs/Evaluating-the-Impact-of-Officer-Worn-Body-Cameras.pdf. Mesa Police Department (2013). On-officer body camera system: Program evaluation and recommendations. Mesa, AZ: Mesa Police Department. Moore, M. H., & Braga, A. (2003). The “bottom line” of policing: What citizens should value (and measure!) in police performance. Washington, DC: Police Executive Research Forum. Miller, L., & Tolliver, J. (2014). Implementing a body-worn camera program: Recommendations and lessons learned. Washington, DC: Office of Community Oriented Policing Services. Police Executive Research Forum (2017). Citizen perceptions of body-worn cameras: A randomized controlled trial. Washington, DC: Police Executive Research Forum. Ready, J.T. and Young, J.T.N. (2015). The impact of on-officer video cameras on police–citizen contacts: findings from a controlled experiment in Mesa, AZ. Journal of Experimental criminology, DOI 10.1007/s11292-015-9237-8. Reaves, B. A. (2015). Local police departments, 2013: Equipment and technology. Washington, DC: Department of Justice, Office of Justice Programs, Bureau of Justice Statistics. Schwartz, J. C. (2014). Police indemnification. New York University Law Review, 89, 885-1005. Smith, P. (2018). What happens when suburban police departments don’t have enough money? National Public Radio, 01/24/2108. Retrieved from https://www.npr.org/2018/01/22/579778555/what-happens-when-suburban-police-departments-dont-have-enough-money. Vaughn, M. S., & Coomes, L. F. (1995). Police civil liability under section 1983: When do police officers act under color of law? Journal of Criminal Justice, 23(5), 395-415. White, M. D. (2014). Police officer body-worn cameras: Assessing the evidence. Washington, DC: Office of Justice Programs, US Department of Justice. Yokum, D., Ravishankar, A., & Coppock, A. (2017). Evaluating the effects of police body-worn cameras: A randomized controlled trial. Washington, DC: The Lab @ DC.

63
Young, S. (2017). Police Department Finishing Body Camera Rollout, Hopes Cops Turn Them On More Often. Dallas Observer, January 11, 2017. Retrieved from http://www.dallasobserver.com/news/now-the-dog-nuts-want-to-spare-every-child-biting-pit-bull-in-dallas-10211550.

64
Appendix 1:
Agency Date of Camera
Deployment Current Camera
Count18
Alliance (NE) Police Department 2012 (approx.) 30 Medina (OH) Police Department 06/2013 39 Farmington (NM) Police Department 10/2012 100 Laramie (WY) Police Department 02/2013 32 Lubbock (TX) Police Department 06/2012 95 Oakland (CA) Police Department 09/2010 661
Pittsburgh (PA) Bureau of Police 04/2012 35 Salt Lake City (UT) Police Department 05/2012 345 Fort Worth (TX) Police Department 01/2012 510 Mesa (AZ) Police Department 08/2012 150 Albuquerque (NM) Police Department 2010 (approx.) 600 Bristol (VA) Police Department 01/2012 37 Charlotte-Mecklenburg (NC) Police Department 2014 (approx.) 375 Crawfordsville (IN) Police Department 08/2012 30 Daytona Beach (FL) Police Department 10/2012 108 De Ridder (LA) Police Department 01/2010 27 Greensboro (NC) Police Department 06/2013 323
Houston (TX) Police Department 12/2013 100 Plainfield (IN) Police Department 01/2010 50 Scottsdale (AZ) Police Department 07/2013 40 Topeka (KS) Police Department 02/2012 200 West Palm Beach (FL) Police Department 01/2013 160 Magnolia (AR) Police Department 01/2012 25
Newport News (VA) Police Department 07/2012 186 Tarboro (NC) Police Department 04/2012 22 Ontario (OR) Police Department 04/2013 21
18
The count of cameras may not always correlation perfectly to the count of officers using cameras. In some jurisdictions, cameras are used by multiple officers across shift. However, when typically thinking of BWC usage and “full deployment,” there will a 1:1 ration between cameras and officers.

65
Appendix 2: Cost-Benefit Instrument Benefits/Potential for Savings:
If information is not available at the individual suit level, then obtain by month, quarter, or
year:
Number of suits
Nature of suits
Proportion of suits in which settlements paid out
Amount of money paid out
Attorney costs
o Are services contracted or is there staff within the agency?
Insurance premiums, if applicable?
Monies dedicated to investigative costs for civil suits
o Non-legal staff in particular (sworn officers, civilians used to prepare
documentation and fulfill legal requests)
Does respondent know of cases in which camera footage was used in which suit was dismissed
or award reduced?
Costs:
1. Currently:
a. How many cameras does your agency currently have?
b. What was the total purchase price of these cameras?
2. Have you increased the number of cameras over time?
a. If yesplease explain from initial purchases to now and provide purchases
prices & quantity.
3. Have any cameras been lost or stolen?
a. If yeshow many?
How much did it cost to replace these? (indicate zero if none)
4. Have any cameras broke or needed repairs?
a. If yeshow many?
How much did it cost to repair or replace these? (indicate zero if none)
5. Are the cameras under warranty (prompt: for maintenance, repairs or replacements due
to loss, stolen, or broken)?
a. If yes for how long?
6. Does your camera program have an administrator?

66
a. If YesCan you estimate what % of that person’s time is devoted to the camera
program?
What is that person’s fully-loaded salary?
7. Can you indicate how much data was stored:
a. In the first month of the program
b. Last month (October 2015)
c. Same month last year (October 2014)
8. How is BWC data currently stored?
By a vendor on a cloud server.
a. What is the plan and pricing? (prompt: Reserved, Spot, On-demand pricing)
i. Have you changed this plan since the program started? Please explain.
b. What was the cost last month (Oct 2015)? (note: interviewee should have
answered how much data was stored last month.)
By server at the department.
a. Did you have to purchase an additional server?
i. If yeshow much was the upfront cost?
Annually thereafter for how many years?
How much was spent to install the server? (prompt: delivery, IT staff
time)
Please list any additional costs due to the server (prompt: cooling, space)
b. Did you expand storage capacity in order to store BWC data?
a. If yesWhat was the cost?
c. Do you know the utility expense for this data storage?
9. Have there been changes to how BWC data is stored since the beginning of the
program?
a. If yes please explain and provide details of the purchase price & the annual
cost thereafter.
10. Who reviews and tag BWC footage?
Officers who wear the cameras
a. Can you estimate how much time this takes on average?
b. When do they do this? (prompt: at the end of shift, during shift)
Administrative staff
a. What % of that person’s time is taken by reviewing camera footage?
b. What is the fully-loaded salary of that person?
c. When do they do this? (prompt: at the end of shift, during shift)
Other
a. Indicate who, provide cost, and when review

67
11. How long is data stored before it’s destroyed? (prompt: Is there a process of destroying
data constantly over time? Or are there months when a large amount of data is
removed)
12. FOIA requests
a. How many FOIA requests for camera data did your agency receive last month
(Oct 2015)?
b. Can you estimate how much staff time is involved in handling FOIA requests?
c. What is the fully-loaded salary of that staff?
13. Security cost
a. Do you purchase data security services?
i. If yes How much does this cost per month?
Has this changed over time? (prompt: have you paid for this service since
the beginning of the program? Has the cost changed?)
b. Does anyone at the department monitor BWC data security?
i. If yes Can you estimate how much additional staff time is involved in
monitoring BWC data?
What is the fully-loaded salary of that staff?
c. Have you had any security breaches?
i. If yes Can you estimate how much staff time was involved in resolving
each incident?
What is the fully-loaded salary of that staff?
Please list any additional costs due to the data breach (prompt: hire new
employee, law suits, changed data infrastructure)
14. Have you had any civil suits because of the body cameras?
a. If yesCan you estimate the cost of these suits?
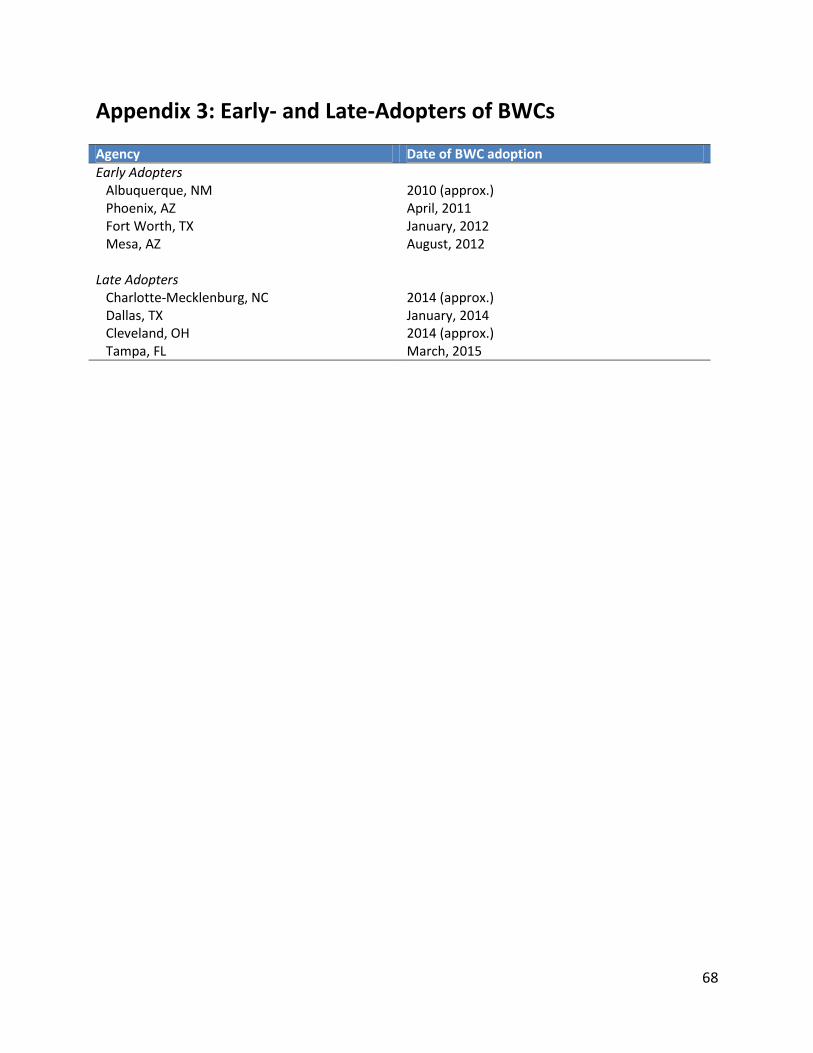
68
Appendix 3: Early- and Late-Adopters of BWCs Agency Date of BWC adoption
Early Adopters Albuquerque, NM 2010 (approx.) Phoenix, AZ April, 2011 Fort Worth, TX January, 2012 Mesa, AZ August, 2012 Late Adopters Charlotte-Mecklenburg, NC 2014 (approx.) Dallas, TX January, 2014 Cleveland, OH 2014 (approx.) Tampa, FL March, 2015
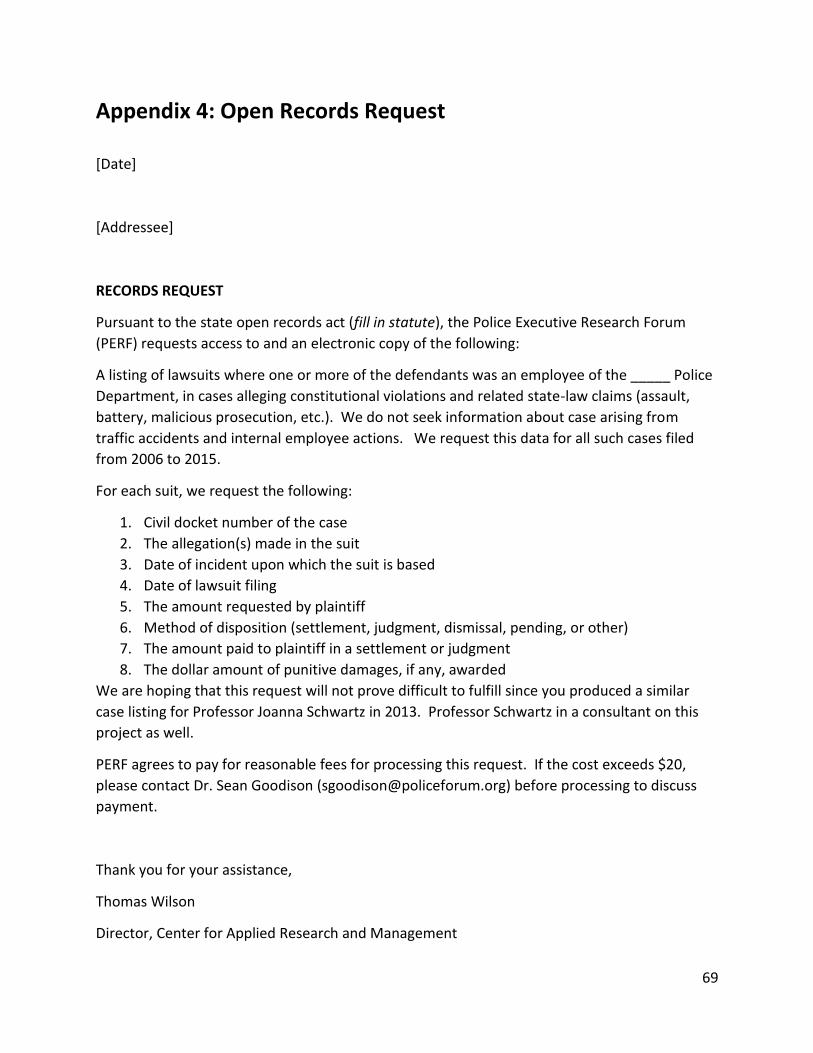
69
Appendix 4: Open Records Request [Date]
[Addressee]
RECORDS REQUEST
Pursuant to the state open records act (fill in statute), the Police Executive Research Forum
(PERF) requests access to and an electronic copy of the following:
A listing of lawsuits where one or more of the defendants was an employee of the _____ Police
Department, in cases alleging constitutional violations and related state-law claims (assault,
battery, malicious prosecution, etc.). We do not seek information about case arising from
traffic accidents and internal employee actions. We request this data for all such cases filed
from 2006 to 2015.
For each suit, we request the following:
1. Civil docket number of the case
2. The allegation(s) made in the suit
3. Date of incident upon which the suit is based
4. Date of lawsuit filing
5. The amount requested by plaintiff
6. Method of disposition (settlement, judgment, dismissal, pending, or other)
7. The amount paid to plaintiff in a settlement or judgment
8. The dollar amount of punitive damages, if any, awarded
We are hoping that this request will not prove difficult to fulfill since you produced a similar
case listing for Professor Joanna Schwartz in 2013. Professor Schwartz in a consultant on this
project as well.
PERF agrees to pay for reasonable fees for processing this request. If the cost exceeds $20,
please contact Dr. Sean Goodison ([email protected]) before processing to discuss
payment.
Thank you for your assistance,
Thomas Wilson
Director, Center for Applied Research and Management

70
Appendix 5: Augmented Interview Protocol.
BODY WORN CAMERA DETAILED COST SURVEY
I. Information on Cost of Civil Suits against the Police
1) Does your municipal agency have statistics by month, quarter, or year on:
Number of civil suits filed against the police
Number of suits settled or adjudicated
Nature of suits
Proportion of suits in which settlements paid out
Amount of money paid out
Investigative costs of civil suits
Amount of insurance premiums (if applicable)
Attorney costs (if applicable)
If you have any of this information, please provide at the smallest unit of time possible (in other
words, ideally month, but if not quarter, and if not that year) and note which unit of time you
have used.
2) What proportion of services are contracted or handled by municipal staff?
3) Are support staff used in defending against civil suits (examples include sworn officers,
civilians used to prepare documentation and fulfill legal requests)?
4) Were there any civil suit cases in which the use of body worn camera footage resulted in
a dismissed or reduced award?
II. Information on Costs of Body Worn Camera Program
15. How many cameras does your agency currently have?
a. What costs (specifically) did your agency’s budget line allocate for regarding
purchase of cameras in each of the past 5 years?
16. For each of the past 5 years, what has your agency’s budget allocated for in terms of
repair/maintenance of cameras?
17. For each of the past 5 years, what did your agency’s budget allocate to support an
administrator for your body worn camera program?

71
18. In each of the past 5 years, what has your agency’s budget allocated for regarding
storage of data from body worn cameras?
a. Is data stored on a local server?
i. If yes, was additional storage capacity purchased specifically for body
camera data?
19. Who reviews and tags body worn camera footage (examples include officers,
administrative or other staff)?
a. If reviewing and tagging is done by officers who wear the cameras:
i. How much time does this take on average?
ii. At what point during the shift does the officer review and tag the
footage?
b. If reviewing and tagging is done by administrative staff:
d. What percentage of that person’s time is taken by reviewing camera
footage?
e. What is the fully-loaded salary of that person?
f. At what point during the shift does staff review and tag footage?
c. If reviewing and tagging is done by other staff:
b. Who specifically reviews and tags the footage?
c. What percentage of that person’s time is used for reviewing camera
footage?
d. What is the fully-loaded salary of that person?
e. At what point during the shift does this person review and tag footage?
20. How long is non-evidentiary data stored before destruction?
a. Is there an automated process of destroying data constantly over time, or are
there months when a large amount of data is removed at once by staff?
21. How many FOIA requests for camera data did your agency receive in each of the 5 past
years?
a. Approximately how much staff time is involved in handling FOIA requests?
b. What are the fully-loaded salaries of that staff?

72
Appendix 6: Pre-/Post-BWC Comparison by Claim Type (Mesa)
Number of Suits
Number of Suits,
With Payout
Number of Suits, Without Payout
Average Number Suits Per
Year
Total Paid Average Paid
Per Suit Overall
Average Paid Per Suit of Suits, With
Payout
Excessive Force (1983)
Before BWC 25 6 19 2.16 $311,218.00 $12,448.72 $51,869.67
After BWC 11 3 8 4.55 $40,700.00 $3,700.00 $13,566.67
Excessive Force (non-1983)
Before BWC 6 4 2 0.52 $1,185,000.00 $197,500.00 $296,250.00
After BWC 6 0 6 2.48 $0 $0 $0
False Arrest
Before BWC 17 6 11 1.47 $431,159.00 $25,362.29 $71,895.83
After BWC 7 2 5 2.89 $9,500.00 $1,357.14 $4,750.00
Police Shooting (Gun)
Before BWC 16 7 9 1.38 $6,820,000.00 $426,250.00 $974,285.71
After BWC 0 0 0 0.00 $0 $0 $0
Police Shooting (ECW)
Before BWC 3 2 1 0.26 $125,000.00 $41,666.67 $62,500.00
After BWC 0 0 0 0.00 $0 $0 $0

73
Appendix 7: Pre-/Post-BWC Comparison by Claim Type (Phoenix)
Number of Suits
Number of Suits,
With Payout
Number of Suits, Without Payout
Average Number Suits Per
Year
Total Paid Average Paid
Per Suit Overall
Average Paid Per Suit of Suits, With
Payout
Dog Bite
Before BWC 8 2 6 1.52 $490,000.00 $61,250.00 $245,000.00
After BWC 1 0 1 0.21 $0 $0 $0
Excessive Force
Before BWC 77 25 52 14.67 $1,270,950.00 $16,505.84 $50,838.00
After BWC 40 5 35 9.41 $672,500.00 $16,812.50 $134,500.00
False Arrest
Before BWC 44 9 35 8.38 $147,103.83 $3,343.27 $16,344.87
After BWC 21 2 19 4.94 $275,000.00 $13,095.24 $137,500.00
Search & Seizure
Before BWC 6 1 5 1.14 $5,000.00 $833.33 $5,000.00
After BWC 8 4 4 1.88 $80,000.00 $10,000.00 $20,000.00
Shooting
Before BWC 12 6 6 2.29 $9,130,940.00 $760,911.67 $1,521,823.33
After BWC 9 4 5 2.12 $920,000.00 $102,222.22 $230,000.00
Violate Civil Rights
Before BWC 33 2 31 6.29 $27,000.00 $818.18 $13,500.00
After BWC 24 2 22 5.65 $45,000.00 $1,875.00 $22,500.00