cost analysis for the monitoring of nicd- batteries in ... · cost analysis for the monitoring of...
TRANSCRIPT

Cost Analysis for the monitoring of NiCd-batteries in municipal solid waste Development of a monitoring strategy and assessment of related costs
Study on behalf of
Umweltbundesamt Bismarckplatz 1 14193 Berlin
carried out by
ARGUS – Statistics and Information Systems in Environment and Public Health Franklinstr. 1 10587 Berlin
Berlin, October 2004

Seite 1
ARGUS GmbH Berlin
Contents
1 Background and Objetive............................................................... 2
2 Identification of NiCd-relevant waste streams.............................. 2
3 Selection of an appropriate sampling method for waste types containing NiCd-batteries .............................................................. 7
4 Identification of cost-affecting parameters ................................. 12
5 Investigation Plan for NiCd-relevant waste streams .................. 16
6 Estimation of cost for the monitoring system ............................ 20
7 Summary........................................................................................ 23
Seite 2
ARGUS GmbH Berlin
1 Background and Objetive The proposal of the European Commission for a Directive on batteries and accumulators1 intends to establish a collection rate of 80 % for spent portable nickel-cadmium batteries (hereinafter referred to as NiCd-batteries). Pursuant to Article 6, the collection rate shall be monitored by annual determination of the quantities of spent NiCd-batteries in municipal solid waste (MSW) . The proposed collection rate is calculated as follows:
100% MSWinQuantitiesQuantitiesCollectedQuantitiesCollectedinrateCollection
The quantities of NiCd-batteries collected separately or sorted out in treatment plants are available from the established battery collection schemes. The quantities disposed of in the municipal solid waste have to be determined by investigation of the waste streams that con-tain relevant amounts of NiCd-batteries. The objective of the study is to assess the efforts and costs that would be necessary to monitor NiCd-batteries in MSW. The following work steps have to be carried out:
1. Identification of relevant waste streams, i.e. waste streams containing relevant amounts of NiCd-batteries;
2. Selection of appropriate sampling strategies for the relevant waste streams;
3. Determination of the cost affecting factors of the sampling;
4. Development of a sampling plan for the relevant waste streams;
5. Assessment of the monitoring costs.
A monitoring system has to consider all waste streams that could contain relevant amounts of NiCd-batteries. However, a uniform definition of the term 'municipal solid waste' does not exist in Germany. The comparison of national statistics and the waste balances of the Ger-man Bundesländer reveals differences with regard to the waste types covered by the term MSW: C&D waste, sewage sludge and specific industrial wastes for example are sometimes classified as MSW and sometimes not. According to its origin municipal solid waste can be assigned to 'households', 'commercial activities', and 'public areas' (infrastructural waste). Comprehensive definitions and delimitations with regard to municipal solid waste are set out in the guidelines for standardised waste analyses of the Bundesländer Brandenburg2 and Saxony3. In the following, waste is classified according to the main categories used in the waste balances of the Länder. For those categories a reliable database is available.
2 Identification of NiCd-relevant waste streams In the first step, the total quantity of NiCd-batteries which is expected to be contained in mu-nicipal solid waste is estimated. The estimation is based on the amounts of NiCd-batteries
1 Proposal for a Directive of the European Parliament and of the Council on batteries and accumulators and
spent batteries and accumulators. COM(2003) 723 of 21.11.2003. 2 Guideline for the execution of analyses to determine amount and compositon of municipal solid waste in the
Land Brandenburg; Landesumweltamt Brandenburg; Müll und Abfall, Kapitel 1705; Berlin; 1999. 3 Guideline for standardised waste analysis in Saxony. Sächsisches Landesamt für Umwelt und Geologie (ed.),
Dresden 1998.

Seite 3
ARGUS GmbH Berlin
placed on the market and collected separately. In a second step, the share of NiCd-batteries in the different municipal waste types is estimated and the likely NiCd-load for each waste type is calculated.
Table 1 shows the quantities of NiCd-batteries that were sold and collected in the period form 2001 to 2003. The table is based on data from the two most important battery collection schemes, the Stiftung Gemeinsames Rücknahmesystem (GRS) Batterien and the system of Bosch GmbH. According to these data, about 3,185 tonnes of NiCd-batteries have been put on the market in 2003. In the same period, about 1,179 tonnes have been collected sepa-rately4. The difference of 2,007 tonnes indicates the amount that should predominantly be found in the different MSW streams.
Table 1: Quantities of NiCd-batteries placed on the market and collected separately
Collection scheme
Placed on the market [tonnes]
Collected [tonnes]
Remaining quantity [tonnes]
Collection rate [%]
2001 2002 2003 2001 2002 2003 2001 2002 2003 2001 2002 2003
GRS Batterien
1,591 1,593 1,968 1,110 992 1,082 481 601 886 69.8% 62.3% 55.0%
Bosch 1,198 1,016 1,217 41 110 97 1,157 906 1,120 3.5% 10.8% 7.9%
Vfw-Rebat n.a. n.a. n.a. n.a. n.a. n.a. n.a. n.a. n.a. n.a. n.a. n.a.
Total* 2,789 2,609 3,185 1,151 1,102 1,179 1,638 1,507 2,007 41.3% 42.2% 37.0%
* The total does not include the amounts of NiCd-batteries placed on the market by members of the recycling scheme Vfw-Rebat and collected by Vfw-Rebat.
The bigger part of the spent batteries that are not collected separately will probably be dis-posed of together with the residual waste from households. However, it can be assumed that batteries are also found in other waste streams. Hence, it was examined whether different MSW streams might contain relevant amounts of batteries. The following waste types were considered: bulky waste, commercial waste, separately collected paper/board, glass, light-weight packaging and biowaste, separately collected WEEE (battery-containing devices), mixed construction and demoilition waste (C&D waste), production-specific industrial waste, and infrastructural waste (e. g. market waste),
Reliable data on the share and the margin of deviation (variation coefficients) of batteries in MSW were sought from the results of own surveys, from operators of waste treatment facili-ties, and from other experts (a list of contacted experts is enclosed). Overall, the investiga-tion has shown that only few specific surveys on spent batteries in waste have been con-ducted. Survey results on the percentage of batteries and waste electrical and electronic equipment (WEEE) are available only for household waste. The battery content of separately collected WEEE was examined in a study conducted by Infa GmbH5. Empirical data on the content and the variance of batteries in bulky waste, commercial waste, mixed C&D waste, production-specific industrial waste, separately collected recyclables (paper/board, glass, lightweight packaging and biowaste), and infrastructural waste (e. g. market waste), could no
4 The figures do not include the amounts of NiCd-batteries placed on the market by members of the recycling
scheme Vfw-Rebat and collected by Vfw-Rebat 5 Infa-GmbH Ahlen; personal communication

Seite 4
ARGUS GmbH Berlin
be found. These data were estimated on the basis of empirical data for household waste and under consideration of the most likely distribution among the potential waste streams. The estimation was based on the following considerations: In expert interviews the battery con-tent in bulky waste, commercial waste, mixed C&D waste, lightweight packaging (LVP) and WEEE was consistently assessed as potentially relevant but clearly lower than in household waste. All other waste types were judged to be irrelevant. The threshold below which the battery content was considered as irrelevant was set at < 0.005 % (50 ppb). Waste flows with such a low battery content contribute only very few to the overall battery amount and need not to be considered in a monitoring system. For all potentially relevant waste flows for which no empirical data were available the share of batteries was estimated at 0.04 % which is half the percentage of batteries in household waste. The results of the search for empirical data are summarised in Table 2.
Table 2: Share of batteries and small electrical/electronic appliances in municipal waste
Surveys on batteries in municipal solid waste
Hou
seho
ld w
aste
Bul
ky w
aste
, LVP
, co
mm
erci
al w
aste
, m
ixed
C&
D w
aste
Sepa
rate
ly c
ol-
lect
ed W
EEE
Hou
seho
ld w
aste
Batteries [%] WEEE [%]
Share VarCoeff. Share VarCoeff. Share Share VarCoeff.
Berlin 2002/03 1) 0.07 n.a. 1.0 n.a. Berlin 1997 1) 0.05 200 0.5 246 Düsseldorf 1997/98 1) 0.11 164 0.5 145 Mettmann 1998/99 1) 0.02 242 0.5 156 Potsdam 1997 1) 0.05 233 0.7 196 Bayern 1999-2003 4) 0.09 n.a. 0.8 n.a. TSA Dresden 2) 0.022 n.a. n.a. Witzenhausen-Institut3) 0.065 n.a. n.a. Infa-GmbH Ahlen 6) 0.1* Mean value 5) 0.07 210 0.04** n.a. 0.7 186 1) Waste analyses ARGUS 2) Herhof Umwelttechnik GmbH; determined by manual sorting of batteries in the ferromagnetic fraction, not
including button cells. 3) Michael Kern: Quantification of the battery content in Municipal Solid Waste, 2004. 4) Waste analyses carried out on behalf of Bayerisches Landesamtes für Umweltschutz. 5) The results from Bayern were weighted with the factor 2 on account of the large extent of the survey. 6) Infa GmbH, Ahlen; personal communication. * Share of NiCd-batteries ** Estimated share of batteries n.a.: not available
To estimate the share of NiCd-batteries in municipal waste, data on the total battery content and on small electronic and electrical appliances in municipal waste streams can be used. Such data are available only for household and WEEE. From the total share of batteries the share of NiCd-batteries must be calculated. For this purpose it is assumed that NiCd-

Seite 5
ARGUS GmbH Berlin
batteries amount to 10 % of all batteries contained in municipal waste. This share corre-sponds to the percentage of NiCd-batteries in the separate collection of batteries of the big-gest battery collection scheme, the GRS Batterien6.
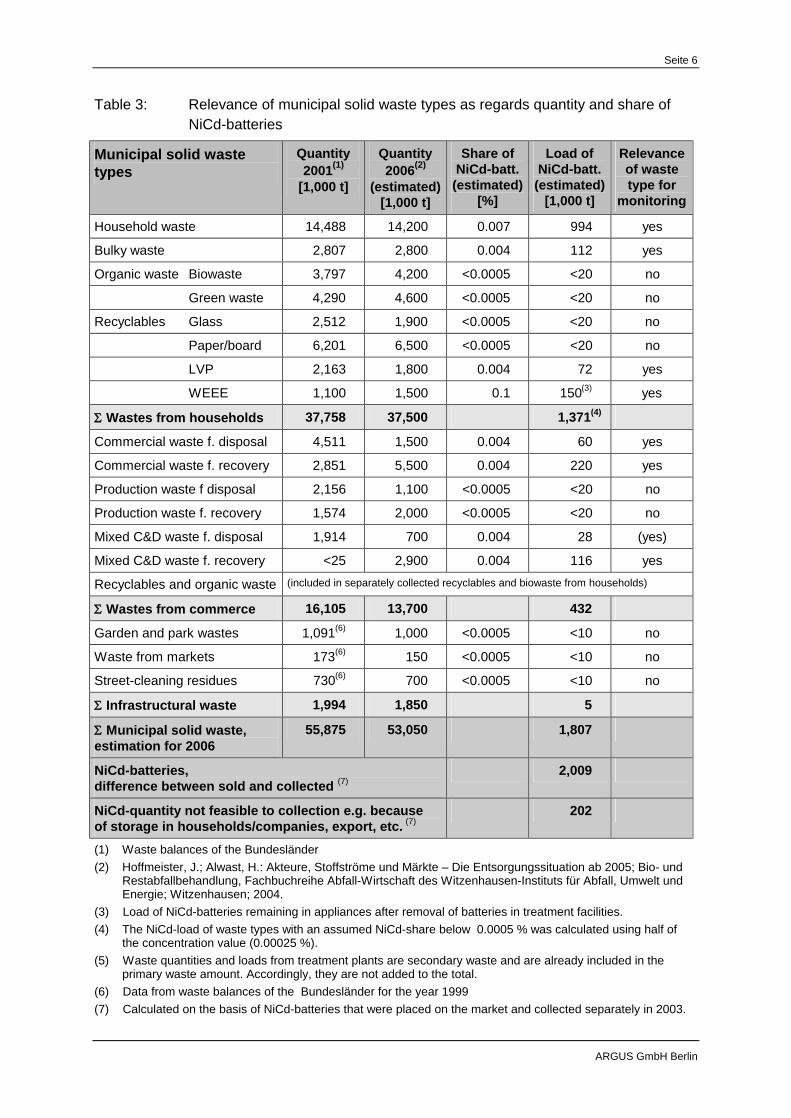
Table 3 shows the quantities of municipal solid waste by waste types as reported by Bunde-sländer in their waste balances. The table includes municipal solid waste that falls under the responsibility of the public-law parties, and commercial waste similar to household waste which is freely tradable (estimation from Prognos AG7). The table shows current quantities for 2001 and estimated amounts for 2006.
Table 3 also contains the share of NiCd-batteries as calculated from the total battery con-tent. The estimated share of NiCd-batteries multiplied with the expected waste amount in 2006 gives the NiCd-load for each of municipal solid waste types. Based on the calculated load the following waste types are considered to be relevant for the development of a moni-toring system.
On the basis of the estimated shares of NiCd-batteries in the different municipal solid waste types about 90 % of the assumed NiCd-load can be reproduced. A diffuse amount is sup-posed to be contained in the non-relevant waste types. The battery content of these waste types was calculated using the defined 'relevance threshold' divided by factor 2 (0.00025 %). The 200 tonnes of NiCd-batteries not contained in MSW are supposed to be stored in households or exported.
Assuming that half of the bulky waste, the commercial waste and the mixed C&D waste, and all of the separately collected lightweight packaging and WEEE are lead to sort-ing/reprocessing plants, and assuming further that the load of NiCd-batteries ends up in equal shares in the sorting residues and the ferromagnetic fraction of the treatment facilities, both of these output streams will contain about 200 tonnes of NiCd-batteries. On account of the low amount of NiCd-batteries contained in mixed C&D waste (28 tonnes and 1.4 % re-spectively) this waste stream should not be included in the monitoring system.
Based on the estimated loads of NiCd-batteries the following waste types are considered to be relevant for monitoring: household waste, bulky waste, commercial waste, mixed C&D waste for recovery, lightweight packaging from DSD-collection, WEEE, and sorting residues respectively.
6 GRS Batterien: Erfolgskontrolle 2003 (http://www.grs-batterien.de/facts/pict/erfolg03.pdf ) 7 Hoffmeister, J.; Alwast, H.: Akteure, Stoffströme und Märkte – Die Entsorgungssituation ab 2005; Bio- und
Restabfallbehandlung, Fachbuchreihe Abfall-Wirtschaft des Witzenhausen-Instituts für Abfall, Umwelt und Energie; Witzenhausen; 2004.
Seite 6
ARGUS GmbH Berlin
Table 3: Relevance of municipal solid waste types as regards quantity and share of NiCd-batteries
Municipal solid waste types
Quantity 2001(1)
[1,000 t]
Quantity 2006(2)
(estimated) [1,000 t]
Share of NiCd-batt. (estimated)
[%]
Load of NiCd-batt. (estimated)
[1,000 t]
Relevance of waste type for
monitoring
Household waste 14,488 14,200 0.007 994 yes
Bulky waste 2,807 2,800 0.004 112 yes
Organic waste Biowaste 3,797 4,200 <0.0005 <20 no
Green waste 4,290 4,600 <0.0005 <20 no
Recyclables Glass 2,512 1,900 <0.0005 <20 no
Paper/board 6,201 6,500 <0.0005 <20 no
LVP 2,163 1,800 0.004 72 yes
WEEE 1,100 1,500 0.1 150(3) yes
Wastes from households 37,758 37,500 1,371(4)
Commercial waste f. disposal 4,511 1,500 0.004 60 yes
Commercial waste f. recovery 2,851 5,500 0.004 220 yes
Production waste f disposal 2,156 1,100 <0.0005 <20 no
Production waste f. recovery 1,574 2,000 <0.0005 <20 no
Mixed C&D waste f. disposal 1,914 700 0.004 28 (yes)
Mixed C&D waste f. recovery <25 2,900 0.004 116 yes
Recyclables and organic waste (included in separately collected recyclables and biowaste from households)
Wastes from commerce 16,105 13,700 432
Garden and park wastes 1,091(6) 1,000 <0.0005 <10 no
Waste from markets 173(6) 150 <0.0005 <10 no
Street-cleaning residues 730(6) 700 <0.0005 <10 no
Infrastructural waste 1,994 1,850 5
Municipal solid waste, estimation for 2006
55,875 53,050 1,807
NiCd-batteries, difference between sold and collected (7)
2,009
NiCd-quantity not feasible to collection e.g. because of storage in households/companies, export, etc. (7)
202
(1) Waste balances of the Bundesländer (2) Hoffmeister, J.; Alwast, H.: Akteure, Stoffströme und Märkte – Die Entsorgungssituation ab 2005; Bio- und
Restabfallbehandlung, Fachbuchreihe Abfall-Wirtschaft des Witzenhausen-Instituts für Abfall, Umwelt und Energie; Witzenhausen; 2004.
(3) Load of NiCd-batteries remaining in appliances after removal of batteries in treatment facilities. (4) The NiCd-load of waste types with an assumed NiCd-share below 0.0005 % was calculated using half of
the concentration value (0.00025 %). (5) Waste quantities and loads from treatment plants are secondary waste and are already included in the
primary waste amount. Accordingly, they are not added to the total. (6) Data from waste balances of the Bundesländer for the year 1999 (7) Calculated on the basis of NiCd-batteries that were placed on the market and collected separately in 2003.

Seite 7
ARGUS GmbH Berlin
3 Selection of an appropriate sampling method for waste types containing NiCd-batteries
The investigation of the mass proportion of NiCd-batteries in municipal solid waste is a com-plex subject. To chose a suitable sampling method and to develop a sampling plan all avail-able information regarding the NiCd-relevant waste types are important.
The selection of the appropriate sampling method depends on the waste flow and on the level where the waste is accessible for sampling (sampling level). Figure 1 shows the flow of the relevant waste types from origin to destination based on the estimated quantities for the year 2006. The waste flows after the first treatment step are included in the chart only where they are relevant for the sampling. The flow chart gives important information on the suitable sampling methods.
In 2006, presumably about 70 % of household, bulky and commercial waste, which is dedi-cated to disposal operations, will go directly from the generators (households and small en-terprises) to waste incineration facilities. In contrast, waste types dedicated to recovery, i.e. commercial waste and construction waste, will predominantly undergo sorting or reprocess-ing prior to recycling or energy recovery8. Separately collected lightweight packaging (LVP) and waste electrical and electronic equipment (WEEE) will be delivered completely to sorting / reprocessing facilities.
For the determination of the waste composition or the mass proportion of specific waste components (here: proportion of NiCd-batteries) in municipal solid waste basically three ap-proaches are feasible:
sampling from waste bins at the premises, or sampling from the truckload of the collec-tion vehicle after delivery at the treatment plant;
sampling form the conveyor belt in the treatment plants;
sampling from storage heaps at treatment plants.
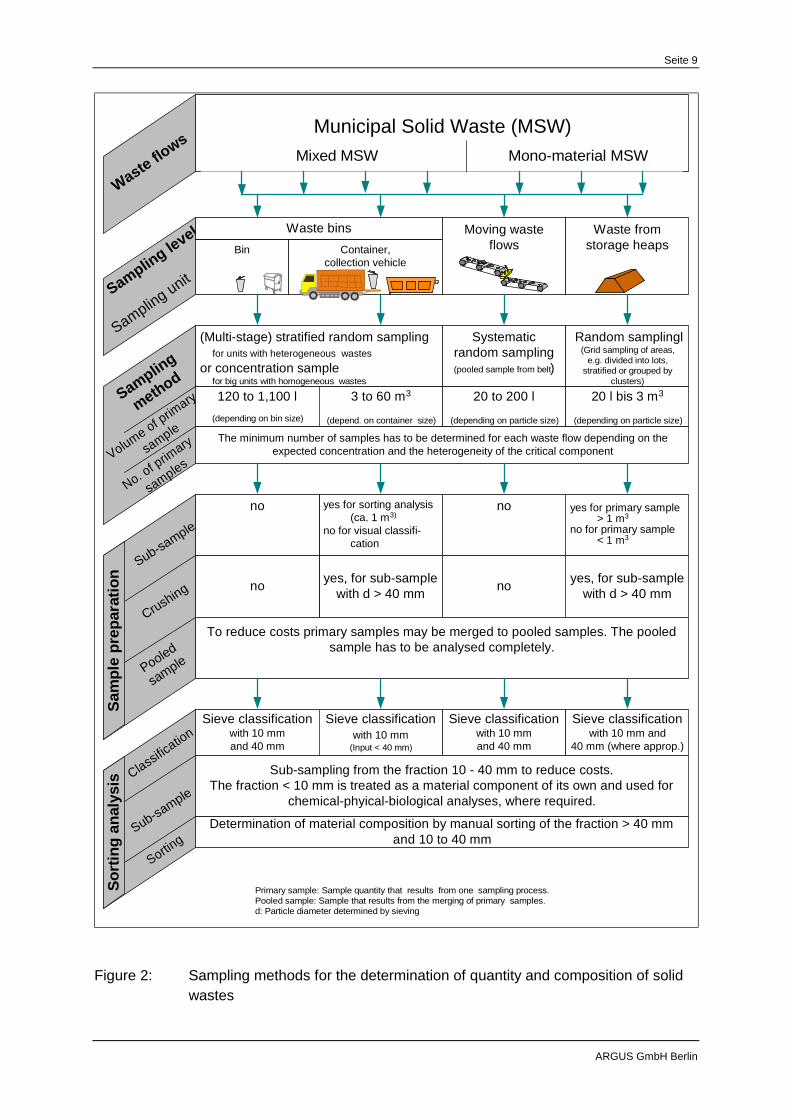
Figure 2 gives an overview of the sampling methodologies for determination of amount and composition of municipal solid waste.
For the sampling of the NiCd-relevant waste types (household waste, commercial waste, lightweight packaging and WEEE from separate collection, and sorting residues from waste treatment plants) two methods are feasible:
stratified random sampling from waste bins at the premises, and/or
systematic random sampling from the conveyor belt.
For a national survey a stratified and multi-stage approach is necessary.
8 Hoffmeister, J.; Alwast, H.: Akteure, Stoffströme und Märkte – Die Entsorgungssituation ab 2005; Bio- und
Restabfallbehandlung, Fachbuchreihe Abfall-Wirtschaft des Witzenhausen-Instituts für Abfall, Umwelt und Energie; Witzenhausen; 2004.

Seite 8
ARGUS GmbH Berlin
Mixed C&D fR (2.8)
Origin Waste type Plant / destination
Household w. (14.2)
Comm. waste fD (1.5)
Comm. waste fR (5.5)
LVP (1.8)
WEEE (1.5)
LandfillPrivate households
Commercialactivities
Private householdsand commercialactivities
Incinerationplant
Sorting /Reprocessing
Rerpocessing ofmixed C&D waste
Abroad
Revovery plants
MBT/MBS
Sorting residues (1)
Mixed C&D fD (0.7)
All amounts in milliontonnes
Bulky waste (2.8)of which for recovery (1.1)
Figure 1: Flow chart showing the expected flows of NiCd-relevant waste types for the year 2006
Seite 9
ARGUS GmbH Berlin
Container,collection vehicle
Moving wasteflowsBin
Municipal Solid Waste (MSW)Mixed MSW Mono-material MSW
Waste fromstorage heaps
Systematicrandom sampling(pooled sample from belt)
Random samplingl(Grid sampling of areas,
e.g. divided into lots,stratified or grouped by
clusters)
120 to 1,100 l(depending on bin size)
20 to 200 l
(depending on particle size)
20 l bis 3 m3
(depending on particle size)
The minimum number of samples has to be determined for each waste flow depending on theexpected concentration and the heterogeneity of the critical component
yes for sorting analysis (ca. 1 m3)
no for visual classifi- cation
Determination of material composition by manual sorting of the fraction > 40 mmand 10 to 40 mm
yes for primary sample > 1 m3
no for primary sample < 1 m3
Waste flows
3 to 60 m3
(depend. on container size)
Sampling level
Sampling unit
Sampling
method
(Multi-stage) stratified random sampling for units with heterogeneous wastesor concentration sample for big units with homogeneous wastes
Volume of primary
sample
No. of primary
samples
Sub-sample
no no
Crushing
Pooled
sample
Sam
ple
prep
arat
ion yes, for sub-sample
with d > 40 mmyes, for sub-sample
with d > 40 mmno no
To reduce costs primary samples may be merged to pooled samples. The pooledsample has to be analysed completely.
Sieve classificationwith 10 mmand 40 mm
Sieve classificationwith 10 mmand 40 mm
Sieve classificationwith 10 mm
(Input < 40 mm)
Sieve classificationwith 10 mm and
40 mm (where approp.)
Sub-sampling from the fraction 10 - 40 mm to reduce costs.The fraction < 10 mm is treated as a material component of its own and used for
chemical-phyical-biological analyses, where required.
Classification
Sub-sample
Sort
ing
anal
ysis
Sorting
Waste bins
Primary sample: Sample quantity that results from one sampling process.Pooled sample: Sample that results from the merging of primary samples.d: Particle diameter determined by sieving
Figure 2: Sampling methods for the determination of quantity and composition of solid wastes

Seite 10
ARGUS GmbH Berlin
The sampling of the waste bins at the premises is a well established methodology to deter-mine the material composition of household waste. 9 As an alternative, we will include the investigation of household waste by sampling of relevant output flows from mechanical-biological treatment (MBT) and other sorting/reprocessing facilities. Until June 2005, this approach will be of limited use since household waste will be predominantly disposed of at landfills or incineration facilities without prior treatment. Even after June 2005 an area-wide investigation of household waste via sampling of treatment plants will not be possible since the major part of the waste will go to waste incineration plants. However, both approaches will be assessed here. The decision on the more appropriate method has to be taken on the basis of the comparison of costs and under consideration of the uncertainties.
The composition of bulky waste, commercial waste and construction and demolition waste is usually done by visual classification. Visual classification is based on the estimation of the volumetric share of the main material components from a large number of truckloads. This method is obviously not suitable for the determination of NiCd-batteries. The determination of NiCd-batteries by sorting is also inadequate on account of economic reasons. Hence, for bulky waste, commercial waste and construction and demolition waste the sampling at treatment facilities is the only feasible option. As about 70 % of these waste streams can be regarded as waste for recovery, they will be delivered to treatment plants, where a represen-tative sampling will be possible. It is assumed that NiCd-batteries will accumulate mainly in the sorting residues of those treatment plants as well as in the separated ferromagnetic sub-stream.
For lightweight packaging (LVP) from DSD-collection basically both methods are applicable. The sampling of the yellow bag/bin is possible at the premises. Planning and execution of the sampling is carried out in the same way as for household waste. Since all LVP is deliv-ered to sorting facilities, the relevant material flows can also be sampled from the belt. Both methods will be considered as feasible options.
Waste electrical and electronic equipment (WEEE) presumably contains a significant amount of NiCd-batteries. The separate collection of WEEE which is already established is expected to increase in future due to the forthcoming ElektroG10. An inquiry of operators from treatment facilities and information from the GRS11 confirmed that batteries and accu-mulators are removed from appliances prior to the reprocessing, and are made available to the battery collection schemes. Thus, NiCd-batteries from WEEE are included in the sepa-rately collected quantities. The investigation of this waste flow is not necessary.
As some NiCd-batteries are an integral part of electrical appliances which cannot be easily removed (e.g. tooth brushes, shavers, toys, etc.) it is possible that an unknown quantity of NiCd-batteries ends up in the residual waste of WEEE-treatment facilities. Through compari-son of the NiCd-batteries that are removed at treatment facilities and the estimated amount of NiCd-batteries in WEEE12, the quantities that are presumably contained in the residues from treatment facilities can be derived. We estimate the load of NiCd-batteries in this waste
9 Bauer, R. K.; Barghoorn, M.; Gössele, P.; et al.: Bundesweite Hausmüllanalyse 1983-85; Arbeitsgruppe Um-
weltstatistik der Technischen Universität Berlin; UBA-Texte; Berlin; 1985. 10 Gesetz über das Inverkehrbringen, die Rücknahme und die umweltverträgliche Entsorgung von Elektro- und
Elektronikgeräten (Elektro- und Elektronikgerätegesetz – ElektroG); Entwurf vom Sept. 2004 11 Personal communication: Dr. Fricke, GRS, und Dr. Böhme, Elektronik-Recycling GmbH, Berlin 12 Infa-GmbH Ahlen, personal communication

Seite 11
ARGUS GmbH Berlin
flow at 150 tonnes/a (please refer to table 3). In order to close this data gap, a specific sam-pling survey for this special waste stream should be conducted, at least once.
Bulky waste, commercial waste and C&D waste are often processed together in treatment facilities, due to their similar material properties. As already mentioned above, these waste types can be sampled directly at facilities. Within a sampling plan the three waste types can be summarised as one waste group. The single facility types (MBT plants, sorting plants for commercial waste and sorting plants for C&D waste) should be proportionally considered according to the share of the respective waste stream.
Table 4 shows the suitable survey and sampling methods for the NiCd-relevant waste flows. The listed options will be specified in the following.
Table 4: Suitable sampling methods for the waste types that considered NiCd-relevant NiCd-relevant waste type Stratified random sampling
from waste bins at the prem-ises (Households/enterprises)
Systematic random sam-pling of primary samples from the belt in treatment facilities
Household waste Bulky waste Commercial waste C&D waste for recovery Lightweight packaging WEEE Bulky waste, commercial waste, C&D waste for recovery

Seite 12
ARGUS GmbH Berlin
4 Identification of cost-affecting parameters The development of a sampling and investigation plan that aims at the determination of NiCd-batteries in the relevant waste streams requires information on waste generators, col-lection systems, bin/container types and sizes, treatment steps, treatment plants, etc. Furthermore, all available information on the waste properties, e.g. waste composition, particle size distribution, mass proportions and variances of the critical component are important. The costs of the different elements of a survey on waste composition, i.e. planning, sam-pling, sample preparation, analysis and data evaluation, can be estimated on the basis of numerous similar surveys. The speciality of the survey on NiCd-batteries, however, is the very low concentration (10 to 100 ppb in the generated waste) and the irregular occurrence of the critical component in the population (here: NiCd-batteries in municipal solid waste). This results in a high heterogeneity (high variation coefficients) of the population with regard to the critical component. To obtain reliable results a high number of primary samples have to be taken (i.e. a high sampling volume has to be analysed) or a sampling strategy has to be used that reduces the variance.
Sampling from the belt of waste treatment plants could possibly be such a variance-reducing strategy. In waste treatment plants batteries accumulate in specific output flows (e.g. in the metal fraction or the heavy fraction). Furthermore, in most treatment plants the waste stream is shredded, fractionated and sorted according to properties. At best, this results in the ho-mogenisation and accumulation of the critical component. For NiCd-batteries such an effect is likely. An additional advantage is that different waste types are often processed in one single facility (e.g. one facility for bulky waste, commercial waste and C&D waste), where the relevant output streams can be investigated together. Thus, sampling at facilities could show considerable cost advantages.
The determination of the amount of NiCd-batteries for the whole of Germany cannot be done at only one plant or in only one area (public-law party). By stratification according to regions (South, North-West and East) and residential structure (city and rural areas) a representative distribution of the areas / plants under investigation has to be assured. This requires a multi-stage sampling approach that encompasses firstly the selection of an area / plant for each stratum and, secondly the selection of waste bins / primary samples within the selected ar-eas / plants.
Hence, the decisive parameters that determine the costs of a survey on NiCd-batteries in MSW are the concentration and the heterogeneity of NiCd-batteries within the relevant waste streams. The heterogeneity itself depends on the variance between different ar-eas/plants, and on the variance between the primary samples from one and the same area/plant. The heterogeneity or variance of primary samples is determined by the distribu-tion of the measured values and the properties of the particles of the material flow (size, density, form, surface etc.).
To determine the variances of NiCd-batteries in the relevant waste streams a literature re-search and an inquiry were carried out to collect and evaluate empirical data on the variance of battery quantities in the relevant waste streams. Empirical data on the variance are only available for batteries in household waste, determined by the methodology of bin sampling. Specific empirical variances for NiCd-batteries could not have been identified and have to be

Seite 13
ARGUS GmbH Berlin
estimated on the basis of the available battery data (see table 5). Surveys on batteries that would allow for the estimation of variances between areas / plants, and between primary samples at plants are not available. On account of this unsatisfactory data situation a prob-abilistic-statistical assessment of the expected variances was carried out.
Assessment of the variances on the basis of probabilistic / statistical examination (idealistic proportion estimation)
The theoretical model for estimation of variances and variation coefficients respectively is based on the assumption that all particles of the waste under investigation have the same selection probability. In equation 1 a model with simplifying assumptions is introduced:
N
1i
2
i
U
Ui2U
S
mm
aaa
N1
PP1
n1
aavar
G
G
G
(1)
with: :avar S Variance of the content of the critical component in the sample
:aS Content of critical component in the sample
:ia Content of critical component of the ith particle
n : Number of particles in the sample
P : Selection probability for the particles
N : Number of particles in the population
GUa : Content of critical component in the population
im : Mass of the ith particle
m : Average mass of the particle in the population Nmm
The theoretical calculation of the variance according to this model requires that at least the content of the critical component
GUa (this is the proportion of NiCd-batteries in the waste
stream which corresponds to the selection probability P in case of particle sampling) and the proportion and mass distribution of the waste components are known. Other properties that have an impact on heterogeneity and variance such as density, form and surface of the par-ticles are not considered in the model. The proportion of NiCd –batteries in the relevant waste streams has already been estimated and will be used for the calculation of the theo-retical variances.
For the estimation of the material proportions it is assumed that a particle carries the charac-teristic of interest for 100 % or to 0 %. The particles 'batteries' fulfil this criterion. To each particle either the proportion ai = 0 or ai = 1 can be assigned. For the model assumption the population is divided into two parts. Thus the calculation of the variance according to equa-tion 2 no longer requires the distribution of proportions but only the mass distribution must be known.

Seite 14
ARGUS GmbH Berlin
The mass distribution of waste correlates strongly with the particle size. Zwisele 13 has ana-lysed the particle size distribution for heterogeneous wastes of different crushing grades. By means of particle size distribution for different mixtures of waste and a conversion factor the mass distribution for different mixtures of materials can be estimated.
With the mass distribution the variation coefficient for the relevant waste streams is esti-mated according to equation 2. As it cannot be assumed in practical terms that the critical component is following an ideal type distribution, the variation coefficients will be corrected by the factor 2 in case of bin sampling and factor 5.1 in case of sampling at treatment facilities.
B,mB
U
2U
A,mAUUS
2U
S nQ'maa1
nQ'ma1m
1m1
aavar
G
G
G
GG
(2)
with: GUm : Mass of the population
:'Am Equivalent mass of particle A (no NiCd battery)
AmnQ : Auxiliary parameter for the variance of particle A
:'Bm Equivalent mass of particle B (NiCd-battery)
BmnQ : Auxiliary parameter for the variance of particle B
The variances between waste management areas or plants respectively cannot be calcu-lated on a theoretical basis without detailed information on the areas and plants (e.g. differ-ent behaviour of waste generators in different regions etc.). However, it can be assumed that the additional variance will be very small compared to the variance between primary sam-ples. Hence, the variance of the primary samples is considered as a good approximation of the total variance.
Table 5 shows the empirically determined variation coefficients for the relevant waste flows together with the coefficients that are derived from the probabilistic-statistical approach.
13 Zwisele, B.: Entwicklung einer neuen Probenahmemethode für heterogene Abfälle geringer Schüttdichte;
Dissertation an der Technischen Universität Berlin; Rhombos-Verlag ISBN 3-937231-42-0; Berlin; 2004

Seite 15
ARGUS GmbH Berlin
Table 5: Variation coefficients for different sampling methods, particle size distributions and NiCd-proportions in the relevant waste streams
Variation coefficients of single values (relating to 1 m3)
NiCd-relevant waste types
Type of sampling, particle size
NiCd-share [%]
Empiric * [%]
Theoretic ** [%]
Bin sampling 0.007 500-750 501.4% Plant d’=80mm 112.0% Plant d’=40mm 97.0% Plant d’=10mm
0.07
68.6% Plant d’=80mm 158.5% Plant d’=40mm 137.3%
Household waste
Plant d’=10mm
0.035
97.1% Bin sampling 0.004 699.2% Plant d’=80mm 203.0% Plant d’=40mm 181.6% Plant d’=10mm
0.04
104.8% Plant d’=80mm 331.6% Plant d’=40mm 296.6%
Lightweight packaging
Plant d’=10mm
0.015
171.2% Plant d’=80mm 148.3% Plant d’=40mm 128.4% Plant d’=10mm
0.04
90.8% Plant d’=80mm 209.7% Plant d’=40mm 181.6%
Bulky waste, commercial waste and C&D waste
Plant d’=10mm
0.02
128.4% Sampling of devices 0.01 32.0% Plant d’=80mm 93.7% Plant d’=40mm 81.2% Plant d’=10mm
0.1
57.4% Plant d’=80mm 132.6% Plant d’=40mm 114.8%
WEEE
Plant d’=10mm
0.05
81.2% * The variation coefficient for NiCd batteries in household waste is based on empirical data of ARGUS for
batteries in household waste (table 2) and has been corrected by means of the factor 1.01 (approximate value for shares <0.1%), according to the respective proportion of NiCd-batteries to the total batteries (0.1 or 10% respectively)
** Tthe variation coefficients have been corrected by the factor 2 for bin sampling and factor 5.1 for sam-pling at treatment facilities.
Based on the variation coefficients shown in Table 5 the required planning data for the inves-tigation on NiCd-batteries in municipal solid waste can be derived.

Seite 16
ARGUS GmbH Berlin
5 Investigation Plan for NiCd-relevant waste streams For the selection of representative survey areas a multistage selection procedure will be ap-plied. In the following the different steps of work are described. In addition, the selection procedure is illustrated in Figure 3.
Step 1: For the selection of single waste management areas or waste management facili-ties, the total survey area (Germany) will be initially subdivided into three sub-regions by al-locating the German Bundesländer to three regions. With regard to waste management is-sues, it is assumed that these areas will be homogeneous within itself but differing from each other. The following breakdown into regions is proposed.
Table 6: Division of the area under investigation into sub-regions
Northwest East South
Schleswig-Holstein, Hamburg, Bremen, Niedersachsen, Nordrhein-Westfalen
Mecklenburg-Vorpommern, Brandenburg, Berlin, Sachsen-Anhalt, Thüringen, Sachsen
Hessen, Rheinland-Pfalz, Saarland, Baden-Württemberg, Bayern
Step 2: Within each of the three regions a stratification (differentiation) will be applied ac-cording to „rural areas / sparsely populated“ and „urban areas / densely populated“. This means, each waste management area or waste management facility will be assigned to one of these two Categories (strata).
Step 3: There will be three areas / facilities representatively selected from both, the rural and the urban areas. The subdivision into regions as well as the selection of single ar-eas/facilities is illustrated in Figure 3.
According to the presented selection scheme, 18 single areas/facilities per single waste stream should be selected and investigated to obtain representative results. A main part of the investigation plan is to stipulate the sampling method for the different waste streams as well as the corresponding sampling parameters like sample size and number of samples.

Seite 17
ARGUS GmbH Berlin
Parent Population(waste stream unser investigaion all over Germany)
Northwest Region East Region South Region
1st step: Division of the parent population into sub-regions
2nd step: Stratifying (grouping) according to residential structures
urban rural urban rural urban rural
3rd step: Random selection of facilities / areas
Facility 1
Facility 2
Facility 3
Facility 1
Facility 2
Facility 3
Facility 1
Facility 2
Facility 3
Facility 1
Facility 2
Facility 3
Facility 1
Facility 2
Facility 3
Facility 1
Facility 2
Facility 3
Figure 3: Selection procedure for sampling areas / facilities
Following the estimation of variation coefficients which is based on the statistical calculations in chapter 4, it is possible to calculate the necessary sample size according to equation (3) at a level of accuracy of +/-10 % at a 95 % confidence level.
2
2212
0
var
zul
U
s ua
a
n G
(1)
where: 21
u : confidence coefficient of the normal distribution for an error prob-
ability of
:zul maximum allowance for random sampling error
For the development of a sampling plan at a sorting or treatment facility idealised conditions have to be considered. The waste streams of a sorting / treatment facility are schematically shown in Figure 3. It is assumed that the input stream is split into three output streams, where one stream contains a non-relevant content but two streams show relevant concentra-

Seite 18
ARGUS GmbH Berlin
tions of the critical parameter. It is assumed that the proportion of the critical component will be equal in the two relevant output streams. For household waste and similar commercial waste it is estimated that the relevant output stream will be 10 – 20 % of the input stream. For light packaging waste the relevant output stream is estimated to lie between 10 – 30 % of the input stream.
Sorting/Treatment Facility
Inpu
t: 10
0%
Prop
ortio
n: a
=xO
utpu
t 1: 8
0%
Prop
ortio
n: a
=0
Output 2: 5% Proportion: a=0.9/(1-0.9)*x
Output 3: 5% Proportion: a=0.9/(1-0.9)*x
Out
put 1
: 90%
Pr
opor
tion:
a=0
Output 2: 10% Proportion: a=0.8/(1-0.8)*x
Output 3: 10% Proportion: a=0.8/(1-0.8)*x
Figure 4: Splitting of a waste stream in a sorting / treatment facility under idealised con-ditions
Table 7 shows the necessary planning data for the relevant waste types under investigation. These information is the basis for the development of an investigation plan for the determi-nation of the content of NiCd-batteries in solid residual wastes. Table 7 shows the minimum necessary sample size for the case that the relevant output stream of a waste sorting / treatment facility, which has to be sampled, is estimated to be 10 % of the input stream, and it shows the maximum necessary sample size for the case that the relevant output stream of a waste sorting / treatment facility is estimated to be 20 % of the input stream or 30 % for light packaging respectively.

Seite 19
ARGUS GmbH Berlin
Table 7: Necessary sample size for the investigation of a relevant waste stream of 10 % and 20/30%, related to 100 % input of sorting / treatment facilities
Sample (total) Sample per Facility
(at 18 facilities)
Waste type and type of sam-pling
NiCd *
Volume of pri-mary sample
Number of sam-
ples
Sample size [m³]
Mass of sample
[kg]
Num-ber of sam-ples
Sample size [m³]
Mass of sample
[kg]
Household waste, bin sampling 100 % 1,000 l 9,658 9,658 965,752 536 536 53,65210 % 10/20 l 24,114 362 72,340 1340 20 4,019Household waste, sampling at
facility 20 % 10/20 l 48,260 724 144,782 2682 40 8,043
Packaging waste, bin sampling 100 % 1.000 l 18,780 18,780 845,084 1,043 1,043 46,949Packaging waste, facility 10 % 10/20 l 70,373 1125 101,337 3,910 63 5,630Packaging waste, facility 30 % 10/20 l 187,755 3004 270,368 10,431 167 15,020
Bulky waste, facility 10 % 10/20 l 42,224 633 126,672 2,346 35 7,037Bulky waste, facility 20 % 10/20 l 84,482 1267 253,444 4,694 70 14,080
Commercial waste, facility 10 % 10/20 l 42,224 633 126,672 2,346 35 7,037Commercial waste, facility 20 % 10/20 l 84,482 1267 253,444 4,694 70 14,080
C&D waste, facility 10 % 10/20 l 42,224 633 126,672 2,346 35 7,037C&D waste, facility 20 % 10/20 l 84,482 1267 253,444 4,694 70 14,080
WEEE, facility - Devices 3,842 3,8 800 128 0,1 46,949
WEEE, facility 10 % 10/20 l 16,870 253 50,608 938 14 2,812WEEE, facility 20 % 10/20 l 33,772 507 101,317 1876 28 5,629
Sample (total) Sample per facility (30)
Sorting residues, facility 10 % 10/20 l 70,374 1055 211,120 2,346 35 7,037Sorting residues, facility 20 % 10/20 l 140,804 2111 422,407 2,346 70 14,074
*) estimated relevant waste stream at a facility
Sampling from conveyor belts at waste sorting and treatment facilities provides several ad-vantages. As it is possible here to focus only on the relevant waste streams in which the con-centration of NiCd-batteries is upgraded, the necessary sample size is smaller than in case of sampling the whole waste stream (e.g. sampling of waste bins). This fact is especially visible for the light packaging waste stream. Due to the enormous necessary sample size, packaging waste should not be sampled on the bin level, particularly as sampling of packag-ing waste at facilities will provide reliable results with significantly reduced effort.
Also in case of household waste the necessary sample size for a bin sampling is much higher than for sampling at facilities. On the other hand, only 25 % of household waste is going to waste sorting / treatment facilities. This means, more than 70 % of household waste could not be considered in case a facility sampling. Due to this fact, the bin sampling method should not be basically rejected. Probably some areas, which are not connected with sorting / treatment facilities have to be investigated necessarily by means of bin sampling.

Seite 20
ARGUS GmbH Berlin
6 Estimation of cost for the monitoring system After stipulating the ancillary conditions for the different steps of work, the related efforts and costs can be estimated. Due to the differentiation regarding the size of the relevant waste streams (10 % and 20/30% respectively, please refer to table 7) different sample sizes have to be considered. This causes the presented ranges of costs.
The cost estimation is based on hourly rates as follows: Project engineer 70,- €/h Student 25,- €/h Leader of sorting team 30,- €/h Sorting staff 15,- €/h
All presented costs are net-values.
Table 8 provides an cost-overview, depending on different sampling methods, different waste types under investigation and different concentrations of NiCd-batteries in the respec-tive waste streams.
In addition to the costs for the investigations at the facilities, the necessary efforts for general planning, project management, calculation of overall results as well as reporting have to be considered.
The main influencing parameters for the costs of the NiCd monitoring system are sampling and sorting. This is due to the necessary sample size, which has been determined by both, an empirical and a statistical-mathematical approach.
The big range of costs is caused by the complexity of the investigation of facilities. Regard-ing the distribution of NiCd-battery shares and the particle size distribution in the output stream of facilities, only idealised assumption could be made.
Table 8 shows the range of costs for different investigation designs. Depending on the dif-ferent options, the costs will range between 1.1 and 3.3 Mio EURO.
For interpreting the costs, the following points should be considered:
The investigation of household waste by means of bin sampling is more cost-intensive but provides a higher reliability of results, as the coverage of the area under investiga-tion will be 100%. In order to increase the reliability and the accuracy of the results, it is recommended to investigate some areas by means of bin sampling.
The combined investigation of bulky waste, commercial waste and C&D waste is cost effective but statistically reliable results with regard to NiCd-contents in the single waste stream are not possible.
The investigation design for sampling at treatment facilities is based on quite rough as-sumptions. Planning under practical conditions might lead to significant cost variations.
Under cost aspects it will be reasonable to differentiate between a first basis investiga-tion and regular monitoring investigations. Probably a basic investigation might show that a waste type with a low content of NiCd-batteries will not be relevant in the following years. To clarify the relevance of bulky waste and C&D waste and to obtain a first benchmark, it is recommended to conduct initial investigations with a smaller sample size (e.g. 10% of the determined necessary sample size).

Seite 21
ARGUS GmbH Berlin
By determining additional and reliable empirical data it will be possible in the future to optimise the necessary survey efforts and costs. E.g. if the share of NiCd-batteries in the waste stream has been underestimated (0.04% instead of 0.08%), in the following year the necessary efforts (sample size, analysis) would be inversely proportional re-ducible by factor 2. In case of an overestimation of the NiCd share the efforts will in-crease respectively.
If the desired accuracy of the results will be increased by factor 2 (e.g. from 10 to 5 %) the sample size and the connected efforts for sampling and sorting will increase by factor 4. If the confidence level is reduced from 95 % to e.g. 90 %, the necessary ef-forts would be reduced by the factor 0.7.
The indicated costs can not be regarded as fixed costs. They might vary if different hourly rates are applied or if work sequences will have been optimised. Actual costs must be surveyed by a market research.
The mentioned facts might lead to significant cost variations.

Seite 22
ARGUS GmbH Berlin
Table 8: Costs for a NiCd monitoring system, sampling household waste at the bin level
Waste type Step of work Costs per step of work
Costs per facility/area
Costs per waste type min - max
1a Planning 3,800 € Sampling 15,600 € Sorting 33,800 € 18 facilities
Household waste, bin sampling
Evaluation 2,280 € 55,480 € 998,640€ 1b Planning 1,520 € Sampling 6,000 – 12,000 € Sorting 2,800 – 5,600 € 18 facilities
Household waste, sampling at facilities (alternative to 1a)
Evaluation 2,280 – 3,420 € 12,600 – 22,540 € 226,800 – 405,720 € 2 Planning 1,520 € Sampling 9,800 – 24,500 € Sorting 5,700 – 14,250 € 18 facilities
LVP, sampling at facilities (sorting plant)
Evaluation 2,280 – 3,420 € 19,300 – 43,690 € 347,400 – 786,420 € 3 Planning 1,520 € Sampling 6,900 – 13,800 € Sorting 4,200 – 8,400 € 18 facilities
Bulky waste, sampling at facilities (sorting / treatment plant))
Evaluation 2,280 – 3,420 € 14,900 – 27,140 € 268,200 – 488,520 € 4 Planning 1,520 € Sampling 6,900 – 13,800 € Sorting 4,200 – 8,400 € 18 facilities
Commercial waste, sampling at facilities (sorting / treatment plant))
Evaluation 2,280 – 3,420 € 14,900 – 27,140 € 268,200 – 488,520 € 5 Planning 1,520 € Sampling 6,900 – 13,800 € Sorting 4,200 – 8,400 € 18 facilities
C&D waste, sampling at facilities (sorting / treatment plant))
Evaluation 2,280 – 3,420 € 14,900 – 27,140 € 268,200 – 488,520 € 6a Planning 760,00 € Sampling 1,600,00 € Sorting 2,440,00 € 4 facilities
WEEE, sampling of devices
Evaluation 2,280,00 € 7,080€ 28,320 € 6b Planning 760 € Sampling 4,000- 8,000 € Sorting 2,440 – 4,880 € 18 facilities
WEEE, sampling at facilities (sorting / treatment plant)) (alternative to 6a) Evaluation 2,280 – 3,420 € 9,480 - 17,060 € 170,640 – 307,080 €
7 Planning 1,520 € Sampling 6,900 – 13,800 € Sorting 4,200 – 8,400 € 30 facilities
Bulky waste, commercial waste, C&D waste, sampling at facilities (sorting/treatment plant) (alternative to 2,3,4,5) Evaluation 2,280 – 3,420 € 14,900 – 27,140 € 447,000 – 814,200 €
Costs for general planning, co-ordination, evaluation 38,800 €
Total costs for all waste streams, bin sampling for hou-sehold waste (1a, 2, 3, 4, 5, 6a)
2,217,760 - 3,317,740 €
Total costs for all waste streams, sampling at facilities for household waste and WEEE (1b, 2, 3, 4, 5, 6b)
1,588,240 - 3,003,580 €
Total costs for all waste streams, most cost effective option (1b, 2, 6a, 7)
1,088,320 - 2,073,460 €
The indicated ranges of costs are caused by variable shares of NiCd-batteries in the output streams. Assumed accuracy of the results: 10% at 95% confidence level.

Seite 23
ARGUS GmbH Berlin
7 Summary It was the aim of the study to assess the sampling volume and the costs that would be re-quired to monitor NiCd-batteries in municipal solid waste. The following tasks have been carried out:
1. Identification of relevant waste streams, i.e. waste streams containing relevant amounts of NiCd batteries;
2. Selection of appropriate sampling strategies for the relevant waste streams;
3. Determination of the cost-affecting parameters;
4. Development of a sampling plan for the relevant waste streams;
5. Assessment of the monitoring costs.
About 2,000 tonnes of NiCd-batteries are either contained in municipal solid waste or tempo-rarily stored in households and companies. They are assumed to be distributed among dif-ferent waste streams as follows: about 1,106 tonnes are assigned to household waste and bulky waste, 72 tonnes to lightweight packaging from DSD-collection, 280 tonnes in com-mercial waste, and 144 tonnes in WEEE (remaining quantity after removal of batteries). About 55 tonnes are distributed among other waste types, and 200 tonnes are assumed to be stored in households and companies, or exported.
The sampling of waste bins at the premises and the sampling at waste treatment facilities have proven to be the most suitable sampling approaches. For both methods, the cost-affecting parameters were determined. The very low proportion of NiCd-batteries and the heterogeneous mass distribution of particles in the waste stream clearly show the strongest impact on the survey costs.
The sorting and reprocessing steps in waste treatment plants result in a accumulation and homogenisation in the NiCd-relevant output streams of the plants. A higher share of NiCd-batteries and a reduction of particle sizes in the output streams require smaller sampling volume and lead to considerably lower costs for this approach.
However, the investigation of household waste by sampling of treatment plants is connected with uncertainties. With this approach only 25 % of the household waste can be covered. To increase the accuracy and reliability of the results it is recommended to additionally investi-gate the household waste in some areas by sampling of bins.
On the basis of the determined sample volume and the estimated costs for planning, sam-pling, sorting and evaluation the total costs of the monitoring of NiCd-batteries is estimated to range between 1.1 and 3.3 Million EURO. The costs are mainly caused by the sampling and sorting procedures. The high efforts are due to the big necessary sample size. The high variation of the presented costs is caused by the following reasons:
different methodological approaches,
uncertainties about the relevance of different waste streams ,
uncertainties regarding the real shares of NiCd-batteries in the waste streams,
uncertainties regarding the distribution of NiCd-batteries among the output streams of the facilities

Seite 24
ARGUS GmbH Berlin
modification desired accuracy and reliability (confidence level)
variation of hourly rates of the involved staff etc.

Seite 25
ARGUS GmbH Berlin
Annex
List of contacted experts
Name Company
Dr. Jürgen Fricke Stiftung Gemeinsames Rücknahmesystem (GRS) Batterien
Nicole Knudsen Stiftung Gemeinsames Rücknahmesystem (GRS) Batterien
Dr. Christiani Ingenieurbüro HTP
Fr. Bremerstein DSD, Abt. Technik- und Systementwicklung
Eberhard Lütge aha Hannover (Abfallzweckverband)
Ulf Meyer zu Westerhausen Abfallbehandlungszentrum Hannover (composting of biowaste)
Detlev Cohrs Bund Deutscher Stahlrecycling und Entsorgungsunternehmen
Herr Pohl Herhof Umwelttechnik GmbH
Herr Gollub Herhof Umwelttechnik GmbH
Herr Ebert Bosch Servicezentrum
Herr Cerowski Bosch Servicezentrum
Herr Lange Bauschutt Recycling GmbH
Herr Gumbrecht BASA (sorting plant for C&D waste)
Fardin Seddigh Ing.-Büro Seddigh und Klausing
Beate Winkler ALBA