cosppac ocean portal about: ocean temperature
TRANSCRIPT
Climate and Oceans Support
Program in the Pacific
COSPPac Ocean Portal About: Ocean Temperature
In Brief
Daily sea surface temperature (SST) is available in near-real time (2-days lag). SST can be viewed as
temperature in degrees Celsius; as an anomaly (degrees difference from normal conditions); or, as
deciles (ranking from lowest to highest based on the climatology).
Along with the daily data, there are also options to view the parameters as averages over various
periods of time (monthly, 3-monthly, 6-monthly, 12-monthly).
The ‘Reynolds’ sea surface temperature dataset dates back to 1982, while the ‘ERSST’ dataset dates
back to 1950 and is of coarser resolution.
Sub-surface mean temperature data are available from 1993 to July 2012 in monthly blocks.
Introduction
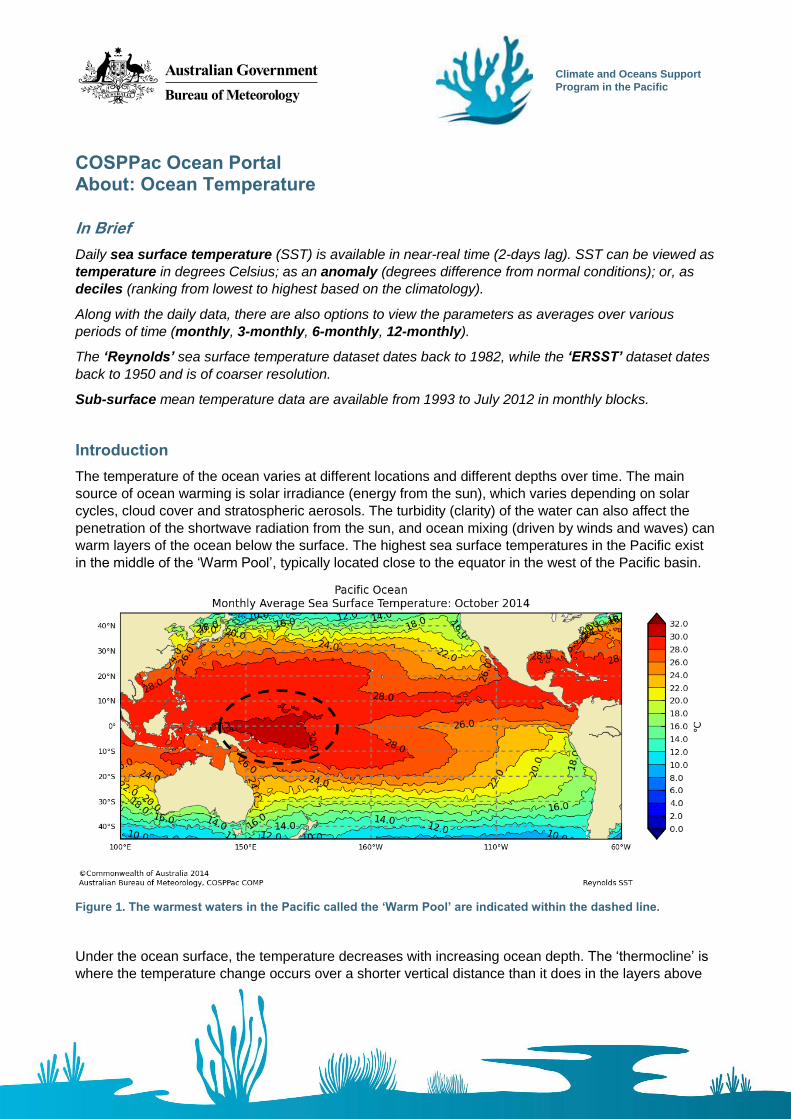
The temperature of the ocean varies at different locations and different depths over time. The main
source of ocean warming is solar irradiance (energy from the sun), which varies depending on solar
cycles, cloud cover and stratospheric aerosols. The turbidity (clarity) of the water can also affect the
penetration of the shortwave radiation from the sun, and ocean mixing (driven by winds and waves) can
warm layers of the ocean below the surface. The highest sea surface temperatures in the Pacific exist
in the middle of the ‘Warm Pool’, typically located close to the equator in the west of the Pacific basin.
Figure 1. The warmest waters in the Pacific called the ‘Warm Pool’ are indicated within the dashed line.
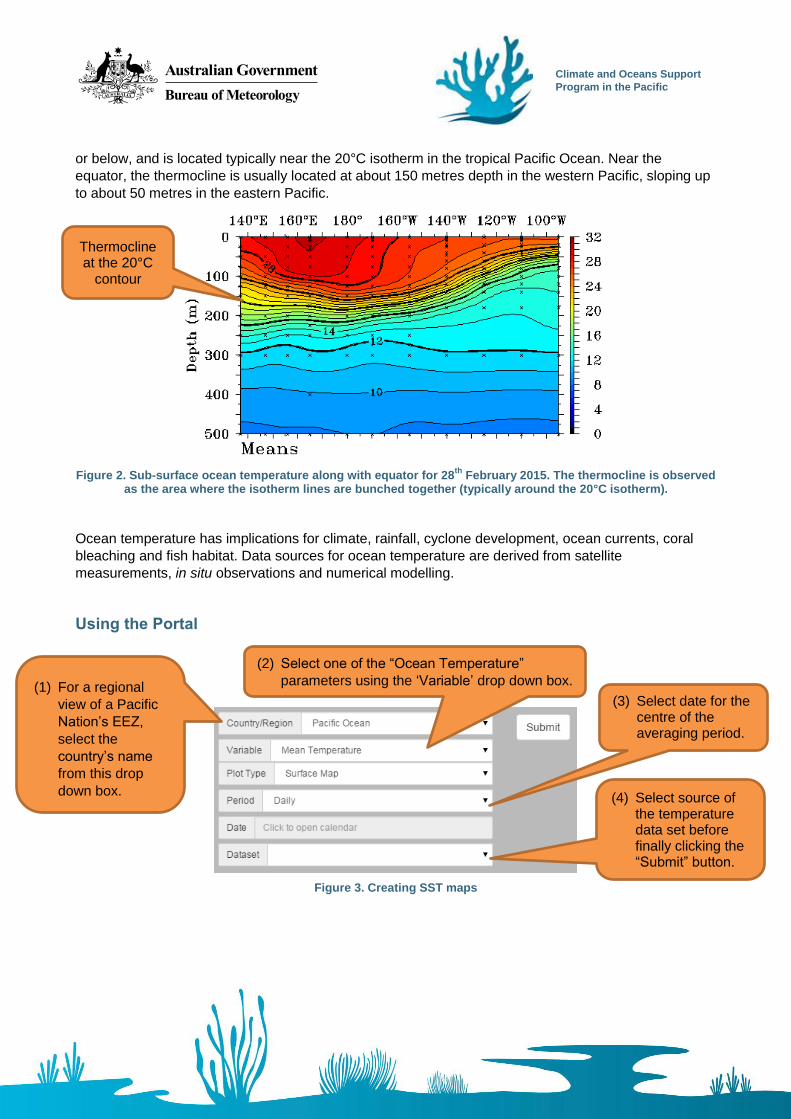
Under the ocean surface, the temperature decreases with increasing ocean depth. The ‘thermocline’ is
where the temperature change occurs over a shorter vertical distance than it does in the layers above
Climate and Oceans Support
Program in the Pacific
or below, and is located typically near the 20°C isotherm in the tropical Pacific Ocean. Near the
equator, the thermocline is usually located at about 150 metres depth in the western Pacific, sloping up
to about 50 metres in the eastern Pacific.
Figure 2. Sub-surface ocean temperature along with equator for 28th
February 2015. The thermocline is observed as the area where the isotherm lines are bunched together (typically around the 20°C isotherm).
Ocean temperature has implications for climate, rainfall, cyclone development, ocean currents, coral
bleaching and fish habitat. Data sources for ocean temperature are derived from satellite
measurements, in situ observations and numerical modelling.
Using the Portal
Figure 3. Creating SST maps
(2) Select one of the “Ocean Temperature”
parameters using the ‘Variable’ drop down box.
(1) For a regional
view of a Pacific
Nation’s EEZ,
select the
country’s name
from this drop
down box.
(3) Select date for the centre of the averaging period.
(4) Select source of the temperature data set before finally clicking the “Submit” button.
Thermocline at the 20°C
contour

Climate and Oceans Support
Program in the Pacific
Figure 4. Creating sub-surface cross section plots
Description of Parameters
Ocean temperature data is available in multiple datasets. The choice of dataset depends on the
application of the data.
Reynolds – Mean Temperature (Surface Map), Anomalies, Deciles:
Select this dataset if you are interested in observed SST data in near-real time, or historical data dating
back to September 1981. Note that although the Reynolds SST values are supplied on a 25 km grid,
due to the data interpolation method used the product actually resolves SST features at spatial scales
of around 150 km. The Reynolds SST product will therefore not usually reflect the small-scale changes
in SST within 150 km of coasts.
ERSST – Mean Temperature (Surface Map), Anomalies, Deciles, Trend:
Select this dataset if you would like to compare SST data from January 1950 to the present, with the added option of looking at the trend. The dataset depends entirely on in situ SST observations and can be used for studying long-term changes in SST over spatial scales of several hundred kilometres.
Note: the original data goes back until 1854 but the early period is excluded due to poor observation
coverage in the Pacific (see Smith et. al. (2003) for further information).
BRAN – Mean Temperature (Sub-surface Maps):
Select this dataset if you are interested in sub-surface temperature.
(3) Select monthly averaging time period.
(2) Click on the map with the mouse cursor to pick your location. The corresponding latitude/longitude will automatically appear in the boxes below.
(1) If “Sub-surface Cross-section” is selected as the plot type, additional latitude and longitude information is required.
(4) The “BRAN” dataset will automatically be selected for sub-surface plots.

Climate and Oceans Support
Program in the Pacific
Table 1. Summary of datasets included in the Ocean Portal as part of Ocean Temperature
Dataset Resolution Time
Period
Available
Averaging
Periods
Data Types Updating
Frequency
Reynolds 0.25 degrees September
1981 to
present
Daily, monthly,
3-monthly, 6-
monthly, yearly
Mean
Temperature
(SST at ~ 1 mm
to 1 m depth),
Anomaly, Deciles
Daily (two
day lag)
ERSST 2 degrees January
1950 to
present
Monthly, 3-
monthly, 6-
monthly, yearly
Mean
Temperature
(SST at 20 cm to
10 m depth),
Anomaly, Deciles,
Trend
Monthly
BRAN Horizontal: 0.1º x
0.1° between
longitudes 90°
east to 180° east
and 75° south to
16° north latitude.
The resolution is
0.9° x 0.1° across
the Indian Ocean
and South Pacific
Ocean. Depth: 30
vertical levels (5
m intervals down
to 22 m, then 6 m
to 10 m intervals
down to 200 m).
1993 to
July 2012
Monthly, 3-
monthly, 6-
monthly, yearly
Mean
Temperature
(SST at 2.5 m
depth and Sub-
surface)
No Update
Definition of Data Types
Mean Temperature: Temperature in degrees Celsius.
Anomalies: Shows the temperature difference between the temperature and normal (normal is defined
as the average temperature for the specified time period occurring from 1971-2000).
Deciles: Shows the temperature ranking in terms of the entire dataset (e.g. near the average, or
towards lowest/highest within the record).
Trend: Shows how the average ocean temperature has changed since 1950. Maps display degree
change per decade.
Climate and Oceans Support
Program in the Pacific
Examples of Applications
Fisheries: Different species of fish are sometimes known to be found at certain temperature
ranges. Near real time SST maps can help inform where good fishing locations might be.
Table 2. Ranges of sea surface temperature that different species of tuna a present in the Pacific (Sund, Blackburn & Williams 1981).
Common name Species All occurrences
(°C) Abundant
occurrences (°C)
Skipjack Katsuwonus pelamis 17–30 20–29
Yellowfin Thunnus albacares 18–31 20–30
Bigeye T. obesus 11–29 13–27
Albacore T. alalunga 13–25 15–21
Southern bluefin T. maccoyii 10.5–21 17–20
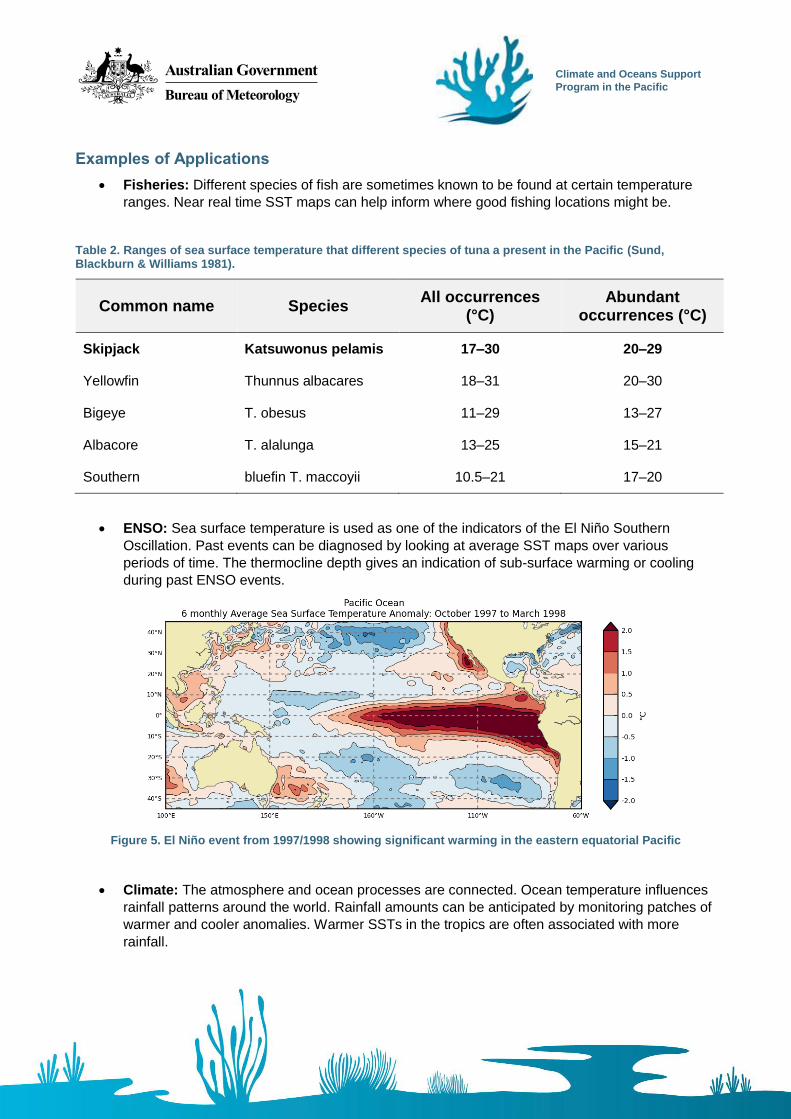
ENSO: Sea surface temperature is used as one of the indicators of the El Niño Southern
Oscillation. Past events can be diagnosed by looking at average SST maps over various
periods of time. The thermocline depth gives an indication of sub-surface warming or cooling
during past ENSO events.
Figure 5. El Niño event from 1997/1998 showing significant warming in the eastern equatorial Pacific
Climate: The atmosphere and ocean processes are connected. Ocean temperature influences
rainfall patterns around the world. Rainfall amounts can be anticipated by monitoring patches of
warmer and cooler anomalies. Warmer SSTs in the tropics are often associated with more
rainfall.

Climate and Oceans Support
Program in the Pacific
Cyclones: The formation of tropical cyclones requires SSTs higher than 26.5 degrees Celsius,
although major storms require higher temperatures (Webster, Gulledge & Curry 2006).
Monitoring warm patches of ocean gives insight into the potential for cyclone formation, and the
possible start or finish of the cyclone season.
Data Sources
Reynolds
Reynolds is a global sea surface temperature and ice-coverage dataset developed and maintained by
the NOAA National Climate Data Center (USA). The original data are produced using a high-resolution,
blended optimum interpolation analysis (Reynolds et al. 2007).
All the analyses on this Portal have been derived from the daily data on a 0.25° global grid. These are,
in turn, based on interpolating observations of ocean surface temperature from ships, drifting and
moored buoys, and Advanced Very High Resolution Radiometers (AVHRR) on polar-orbiting satellites.
Where no recent observations were available, the long-term average SST (“climatology”) was used in
the analysis.
ERSST
Extended Reconstructed Sea Surface Temperature (ERSST) is a global monthly sea surface
temperature analysis developed and maintained by the NOAA Earth System Research Laboratory
(USA). With a resolution of 2° (latitude and longitude), the ERSST analysis is intended to complement
the NOAA Optimum Interpolation SST V2 (referred to in this portal as Reynolds SST). The longer
period of time spanned by ERSST is more suitable for statistical analyses, including trends and deciles.
All the ERSST (version 3b) analyses on this portal have been derived from monthly data. These are, in
turn, based on observations of ocean surface temperature from ships, buoys (both drifting and moored)
and other in situ platform types (Smith & Reynolds 2003, 2004).
BRAN
The Bluelink Re-ANalysis (BRAN) 3.5 is a high-resolution ocean reanalysis for a 19-year period from
1993-2012 (Oke et al. 2013; Chiswell & Rickard 2014). This product was developed by the Bluelink
Project, which is a partnership between the Bureau of Meteorology, CSIRO and the Royal Australian
Navy to deliver ocean forecasts for the Australian region. The ocean reanalysis was constructed by
combining observational data with a high-resolution ocean model to establish an eddy-resolving best
estimate of the ocean state.
The analyses presented here are derived from the BRAN3.5 daily data sourced from the Centre for
Australian Weather and Climate Research (CAWCR), which is a partnership between the Australian
Bureau of Meteorology and the CSIRO. To generate the ocean reanalysis, observations of the ocean
temperature, salinity and sea-level were assimilated from satellites and in-situ ocean monitoring
instruments such as ARGO profiling floats, tide gauges, XBTs and the TOGA TAO moored array (see
Oke et al. 2013 for more information).

Climate and Oceans Support
Program in the Pacific
Links
Reynolds SST:
http://www.ncdc.noaa.gov/oisst
ERSST:
http://www.ncdc.noaa.gov/ersst/
BRAN:
http://www.cmar.csiro.au/staff/oke/BRAN.htm
Disclaimer
The Bureau advises that the information in this service comprises general statements based on
scientific research. The Bureau does not warrant, guarantee or make any representations regarding the
currency, correctness, accuracy, completeness, reliability, or any other aspect regarding characteristics
or use of the information shown on this web portal. The user accepts sole responsibility and risk
associated with the use and results of Bureau material in this service, irrespective of the purpose to
which such use or results are applied. To the extent permitted by law, the Bureau (including each of its
employees) excludes all liability to any person for any consequences, including but not limited to losses,
damages, costs, expenses and any other compensation, whether in an action, contract, negligence or
tort, arising out of or in connection with the use or performance of Bureau material in this service and
any information or material contained in it.
The information shown in this web portal is covered by the Bureau of Meteorology’s Copyright Notice –
see http://www.bom.gov.au/other/copyright.shtml?ref=ftr.
References
Chiswell, SM & Rickard, GJ 2014, ‘Evaluation of Bluelink hindcast BRAN 3.5 at surface and 1000 m’, Ocean Modelling, vol. 83, pp. 63–81.
Oke, PR, Sakov, P, Cahill, ML, Dunn, JR, Fiedler, R, Griffin, DA, Mansbridge, J V., Ridgway, KR & Schiller, A 2013, ‘Towards a dynamically balanced eddy-resolving ocean reanalysis: BRAN3’, Ocean Modelling, vol. 67, pp. 52–70.
Reynolds, RW, Smith, TM, Liu, C, Chelton, DB, Casey, KS & Schlax, MG 2007, ‘Daily high-resolution-blended analyses for sea surface temperature’, Journal of Climate, vol. 20, pp. 5473–5496.
Smith, TM & Reynolds, RW 2003, ‘Extended Reconstruction of Global Sea Surface Temperatures Based on COADS Data (1854-1997).’, Journal of Climate, vol. 16, pp. 1495–1510.
Smith, TM & Reynolds, RW 2004, ‘Improved Extended Reconstruction of SST (1854-1997).’, Journal of Climate, vol. 17, pp. 2466–2477.
Sund, PN, Blackburn, M & Williams, F 1981, ‘TUNAS AND THEIR ENVIRONMENT IN THE PACIFIC OCSAN: A REVIEW’, Oceanography Marine Biology: An Annual Review, vol. 19, pp. 443–512.

Climate and Oceans Support
Program in the Pacific
Webster, P, Gulledge, J & Curry, J 2006, ‘Expanding tropical warm pool: Increased tropical cyclone season length and storm duration’, in American Geophyscial Union, Fall Meeting, pp. 709–719.
Please note the following text reproduced from the NOAA website: “Please note: If you acquire
NOAA_ERSST_V3 or NOAA High Resolution SST data products from PSD, we ask that you
acknowledge us in your use of the data. This may be done by including text such as:
NOAA High Resolution SST data provided by the NOAA/OAR/ESRL PSD, Boulder, Colorado,
USA, from their Web site at http://www.esrl.noaa.gov/psd/, or
NOAA_ERSST_V3 data provided by the NOAA/OAR/ESRL PSD, Boulder, Colorado, USA, from
their Web site at http://www.esrl.noaa.gov/psd/
in any documents or publications using these data. We would also appreciate receiving a copy of the
relevant publications. This will help PSD to justify keeping the NOAA_ERSST_V3 and NOAA High
Resolution SST data set freely available online in the future. Thank you!”
In addition, you should also acknowledge our Bluelink partners, the Australian Navy and the CSIRO
(Wealth from Oceans, National Research Flagships) when using the BRAN product.
Contact
For more information, please email [email protected]