corsica river audit - community & environmental defense...
TRANSCRIPT

CORSICA RIVERPRELIMINARY WATERSHED AUDIT
Opportunities To Build Upon A Highly SuccessfulWatershed Restoration Campaign
Prepared ByRichard Klein
COMMUNITY & ENVIRONMENTAL DEFENSE SERVICES
811 Crystal Palace CourtOwings Mills, Maryland 21117
ceds.org/audit
On Behalf of
CORSICA RIVER CONSERVANCYPost Office Box 235
Centreville, Maryland 21617 www.corsicariverconservancy.org
June 10, 2012

This page is intentionally blank.
CONTENTS
SUMMARY . . . . . . . . . . . . . . . . . . . . . . . . . . . . . . . . . . . . . . . . . . . . . . . . . . . . . . . . . . . . . . . . . . 1A PHENOMENAL RESTORATION EFFORT . . . . . . . . . . . . . . . . . . . . . . . . . . . . . . . . 1CURRENT CONDITIONS & IMPAIRMENT SOURCES . . . . . . . . . . . . . . . . . . . . . . . 1AUDIT FINDINGS & OPPORTUNITIES TO ACCELERATE RESTORATION . . . . . 3
Construction Sites . . . . . . . . . . . . . . . . . . . . . . . . . . . . . . . . . . . . . . . . . . . . . . . . . 3Stormwater BMPs . . . . . . . . . . . . . . . . . . . . . . . . . . . . . . . . . . . . . . . . . . . . . . . . . 3Conservancy Rain Gardens . . . . . . . . . . . . . . . . . . . . . . . . . . . . . . . . . . . . . . . . . . 4Retrofits . . . . . . . . . . . . . . . . . . . . . . . . . . . . . . . . . . . . . . . . . . . . . . . . . . . . . . . . . 4Forest Conservation . . . . . . . . . . . . . . . . . . . . . . . . . . . . . . . . . . . . . . . . . . . . . . . . 5Environmental Site Design . . . . . . . . . . . . . . . . . . . . . . . . . . . . . . . . . . . . . . . . . . 5Centreville WWTP: An Impressive Success . . . . . . . . . . . . . . . . . . . . . . . . . . . . . 5Sewage Collection System . . . . . . . . . . . . . . . . . . . . . . . . . . . . . . . . . . . . . . . . . . . 6Illicit Discharges . . . . . . . . . . . . . . . . . . . . . . . . . . . . . . . . . . . . . . . . . . . . . . . . . . 6Cover Crops . . . . . . . . . . . . . . . . . . . . . . . . . . . . . . . . . . . . . . . . . . . . . . . . . . . . . . 6Buffers . . . . . . . . . . . . . . . . . . . . . . . . . . . . . . . . . . . . . . . . . . . . . . . . . . . . . . . . . . 6Concentrated Animal Feeding Operations (CAFO) . . . . . . . . . . . . . . . . . . . . . . . . 7Sewage Sludge Application . . . . . . . . . . . . . . . . . . . . . . . . . . . . . . . . . . . . . . . . . . 7
INTRODUCTION . . . . . . . . . . . . . . . . . . . . . . . . . . . . . . . . . . . . . . . . . . . . . . . . . . . . . . . . . . . . . 8
CORSICA RIVER CURRENT CONDITIONS & IMPAIRMENT SOURCES . . . . . . . . . . . . . . 8NUTRIENT TOTAL MAXIMUM DAILY LOAD (TMDL) . . . . . . . . . . . . . . . . . . . . . 11WATERSHED RESTORATION ACTION STRATEGY (WRAS) . . . . . . . . . . . . . . . . 12MARYLAND BIOLOGICAL STREAM SURVEY (MBSS) DATA . . . . . . . . . . . . . . . 13ECOLOGICAL ASSESSMENT . . . . . . . . . . . . . . . . . . . . . . . . . . . . . . . . . . . . . . . . . . . 15IMPERVIOUS SURFACES & ESTUARINE HEALTH . . . . . . . . . . . . . . . . . . . . . . . . 17
SUMMARY OF CURRENT CONDITIONS & AUDIT RELEVANCE . . . . . . 18
AUDIT OF REGULATED & OTHER AQUATIC ENHANCEMENT ACTIVITIES . . . . . . . . 19WHY SITE NAMES & LOCATIONS ARE NOT GIVEN IN THIS REPORT . . . . . . . 19CONSTRUCTION SITE EROSION & SEDIMENT CONTROL . . . . . . . . . . . . . . . . . 20
Why Does Exposed Soil = Pollution? . . . . . . . . . . . . . . . . . . . . . . . . . . . . . . . . . 21Construction Site Audit . . . . . . . . . . . . . . . . . . . . . . . . . . . . . . . . . . . . . . . . . . . . 22
EXISTING STORMWATER BEST MANAGEMENT PRACTICES . . . . . . . . . . . . . . 24Development Project BMPs . . . . . . . . . . . . . . . . . . . . . . . . . . . . . . . . . . . . . . . . . 24Conservancy’s Amazing Retrofit Project . . . . . . . . . . . . . . . . . . . . . . . . . . . . . . . 27Other Retrofits . . . . . . . . . . . . . . . . . . . . . . . . . . . . . . . . . . . . . . . . . . . . . . . . . . . 28
FOREST CONSERVATION . . . . . . . . . . . . . . . . . . . . . . . . . . . . . . . . . . . . . . . . . . . . . . 29ENVIRONMENTAL SITE DESIGN . . . . . . . . . . . . . . . . . . . . . . . . . . . . . . . . . . . . . . . 31POINT SOURCE DISCHARGES . . . . . . . . . . . . . . . . . . . . . . . . . . . . . . . . . . . . . . . . . . 33ILLICIT DISCHARGES . . . . . . . . . . . . . . . . . . . . . . . . . . . . . . . . . . . . . . . . . . . . . . . . . 36COVER CROPS . . . . . . . . . . . . . . . . . . . . . . . . . . . . . . . . . . . . . . . . . . . . . . . . . . . . . . . 39BUFFERS . . . . . . . . . . . . . . . . . . . . . . . . . . . . . . . . . . . . . . . . . . . . . . . . . . . . . . . . . . . . 41

CONCENTRATED ANIMAL FEEDING OPERATIONS (CAFO) . . . . . . . . . . . . . . . 43SEWAGE SLUDGE APPLICATION . . . . . . . . . . . . . . . . . . . . . . . . . . . . . . . . . . . . . . . 43
Tables
1. Corsica River Watershed Characteristics . . . . . . . . . . . . . . . . . . . . . . . . . . . . . . . . . . . . . . 92. TMDL Nutrient Sources (Yr 2000) . . . . . . . . . . . . . . . . . . . . . . . . . . . . . . . . . . . . . . . . . 113. Fish Health Comparison . . . . . . . . . . . . . . . . . . . . . . . . . . . . . . . . . . . . . . . . . . . . . . . . . 134. Nutrient Sources - 2009 Assessment . . . . . . . . . . . . . . . . . . . . . . . . . . . . . . . . . . . . . . . . 165. Stormwater Best Management Practices Serving Corsica River
Watershed Development . . . . . . . . . . . . . . . . . . . . . . . . . . . . . . . . . . . . . . . . . . . . . . . . . 256. Stormwater BMP Audit Findings . . . . . . . . . . . . . . . . . . . . . . . . . . . . . . . . . . . . . . . . . . 267. Corsica River Reported Sewage Overflows 2005 - Present . . . . . . . . . . . . . . . . . . . . . . . 378. Corsica River Stream Sampling Results - 14 March 2010 . . . . . . . . . . . . . . . . . . . . . . . 389. Cropfield Nitrogen Loading & BMPs . . . . . . . . . . . . . . . . . . . . . . . . . . . . . . . . . . . . . . . 39
Figures
1. Corsica River Watershed Map . . . . . . . . . . . . . . . . . . . . . . . . . . . . . . . . . . . . . . . . . . . . . 102. Centreville Spray-Irrigation Monitoring Well Data . . . . . . . . . . . . . . . . . . . . . . . . . . . . . 35

1
SUMMARYThanks to a grant from the Chesapeake and Atlantic Coastal Bays Trust Fund the Corsica RiverConservancy retained Community & Environmental Defense Services (CEDS) to conduct aPreliminary Watershed Audit for the Corsica River.
A PHENOMENAL RESTORATION EFFORTBeginning in the late 1970s, the author of this report was the director of Maryland Save OurStreams. I launched one of the first watershed restoration campaigns in Maryland, whichtargeted Gwynns Falls in Baltimore County and City. Over the past four decades I’ve watchedmany similar projects strive for success. But it was not until I had the pleasure of studying theCorsica River effort that I’ve seen a restoration project so unequivocally successful.
The Corsica River Conservancy attracts one in four watershed residents to their annualAwareness Day. One in five households benefits from a Rain Garden and a number of othershave rain Barrels. The Town of Centreville has produced one of the best wastewater treatmentfacilities on the Eastern Shore. The Town in conjunction with the County, State agencies andprivate foundations has implemented dozens of restoration practices. The farming community ofthe watershed, with support from the Queen Anne’s Soil Conservation District and the MarylandDepartment of Agriculture, has achieved the most extensive use of winter cover crops inMaryland and perhaps in the entire Bay watershed. Thanks to all of these incredible efforts theCorsica River is well on the way to becoming the first fully restored waterway in the ChesapeakeBay drainage. But the River is not there yet and a number of challenges remain.
The purpose of a Watershed Audit is to provide a thorough, independent assessment of allactivities regulated by existing aquatic resource protection laws. A Preliminary Audit, such asthat described in this report, takes a first look at a sampling of regulated activities. However, theCorsica River watershed is unique in having benefitted from so many restoration activities. Because of this a number of voluntary aquatic resource enhancement activities have beenincluded in this Preliminary Audit.
In the following pages several opportunities to improve the aquatic resource benefits ofthese activities are offered. The shortcomings are not due to any lack of motivation or dedicationon the part of the many people who oversee these activities. Instead, the problem lies in the factthat they are too few in number and lack the resources needed to succeed.
CURRENT CONDITIONS & IMPAIRMENT SOURCESThe tidal portion of the Corsica River is suffering from excessive nutrient and sediment inputswhich lowers water clarity and inhibits the growth of submerged aquatic vegetation along withbeneficial benthic algae, both of which are essential to a healthy ecosystem. The nutrientsstimulate excessive surface algal growth which reduces water clarity and leads to severe oxygendepletion. Suspended sediment combines with algae to further reduce water clarity.

2
To restore the tidal portion of the Corsica River, a 2009 University of Maryland Centerfor Environmental Science assessment called for reducing nutrient inputs by 50%, which wouldbring about a 70% reduction in algae and a substantial improvement in water clarity. Universityscientists recommended achieving this 50% reduction by:
• maximizing the use of winter cover crops on half of all agricultural fields;• increasing the removal of nutrients from runoff generated on developed lands with
stormwater Best Management Practices (BMPs); and • upgrading the existing 160 (of 809) septic systems located near tidal waters for better
nitrogen removal.
Four percent of the Corsica River watershed is presently covered by buildings, parkinglots, streets and other impervious surfaces that prevent rainwater from infiltrating underlyingsoils. A recent study found that tidal rivers, like the Corsica, begin suffering even more acutewater quality problems when watershed imperviousness exceeds 5%; a threshold the River maysoon cross. However, the adverse effects of increasing growth can be offset by retaining moreforest and utilizing highly effective stormwater BMPs.
The nontidal portion of the Corsica River system consists of three major streams: GravelRun, Mill Stream Branch, and Three Bridges Branch. Based on fish and macroinvertebratesampling, these nontidal waters are presently rated fair on a scale of poor, fair and good. Of thethree, Gravel Run is slightly better than Three Bridges Branch with Mill Stream Branch slightlypoorer.
The factors cited as degrading the quality of nontidal portions of the Corsica River systeminclude:
• Lack of riparian buffers;• Excessive sediment inputs which degrade habitat by filling pools and riffles, burying
woody substrate, lowering stability and reducing variations in stream velocity-depth;• Low percentage of the watershed in forest; and• Some nontidal stream segments are presently affected by development which will
increase as growth continues in the watershed, though full use of erosion andsediment control, Environmental Site Design and other highly-effective aquaticresource protection measures could substantially reduce the impact.
While nutrients tend not to be a significant problem for smaller nontidal streams, thesewaters do convey nutrients to the tidal river. Researchers have isolated five nitrogen hotspotsalong these nontidal waterways and hope to identify and correct the cause of each.

3
AUDIT FINDINGS & OPPORTUNITIES TO ACCELERATE RESTORATIONFollowing is a summary of the findings from each Audit area. In the main reportrecommendations are offered with regard to steps the Conservancy can take to further accelerateCorsica River restoration.
Construction SitesSediment (eroded soil) is a major factor in the decline of the tidal Corsica River and tributarystreams. No land use has the potential to generate more sediment on a per acre basis thanconstruction sites. Erosion control is the most effective method for preventing construction sitesediment pollution. Once a site is cleared and brought up to rough grade all disturbed soils mustbe treated with a layer of straw mulch sufficiently thick to obscure underlying soils and seededwith grass. Additional seeding may be required to achieve adequate stabilization. Thoroughstabilization reduces erosion and sediment pollution by 95% to 99%. Perimeter controls, likeblack silt fence and sediment traps, reduce pollution by a third to half but allows the mostharmful soil particles (clay) to escape.
CEDS identified five construction sites within the Corsica watershed. One had a verylarge soil stockpile that had not been properly stabilized and was severely eroded. Though asediment trap had been installed to intercept runoff from the stockpile the trap had filled witheroded soil quite some time ago. Since then large quantities of sediment have been dischargedinto Mill Stream Branch. This very serious problem was referred to the Maryland Department ofthe Environment. MDE quickly investigated and directed the owner make all necessarycorrections.
The four other construction sites were residential projects where a portion of the graded,but undeveloped lots had not been stabilized as required by State law. The lack of stabilizationranged from complete to perhaps 50% vegetative cover; well short of the coverage needed toprotect nearby waters. While some of these lots drained to large sediment basins, the lack of fullstabilization allows excessive sediment releases into the Corsica River system.
MDE’s inspection capabilities are limited to put it mildly. Though State law requiresbiweekly inspections of all construction sites, only 16% of those under MDE jurisdiction arevisited in any given year. Several options are available for improving erosion control compliancein the Corsica River. The first and most effective would be to establish a cooperativerelationship with developers and contractors where Conservancy volunteers keep an eye out foropportunities to enhance stabilization. Another option would be for the Town of Centreville orQueen Anne’s County to assume inspection-enforcement responsibility from MDE.
Stormwater BMPsAbout 7% of the Corsica River watershed is developed with homes, businesses, schools, etc. And about 10% of the nitrogen and 25% of the phosphorus entering the tidal Corsica River iswashed from these buildings, associated parking lots, streets, sidewalks and other impervioussurfaces. Fortunately, two-thirds of all impervious surfaces drain to 85 stormwater Best

4
Management Practices. These BMPs include ponds, specially designed grass channels,bioretention facilities and infiltration trenches or basins. If all of the BMPs were workingperfectly they would keep the following quantities of pollutants out of the Corsica each year:2,543 pounds of nitrogen, 480 pounds of phosphorus and 127 tons of solids (mostly soil erodedfrom channels).
However, a survey of 48 of the BMPs indicated that about half had maintenance issues orother defects that would lower pollutant removal efficiency. In a few cases the defects were suchthat pollutant retention had dropped to zero and a facility was even in danger of washing out.
Stormwater BMP inspection and maintenance is a major problem statewide. Presentlythose who own BMPs in Queen Anne’s County are responsible for maintenance whether theowner be a government agency, a homeowners association, a business or church. The MarylandGeneral Assembly recently passed two bills to address stormwater inspection-maintenancefunding, but the bills (HB987/SB614) did not include Queen Anne’s County. However, theTown of Centreville is considering the possibility of creating a stormwater utility which wouldgenerate the funds needed to effectively inspect and maintain BMPs, within this portion of thewatershed.
Conservancy Rain GardensThrough an innovative and highly effective program, the Corsica River Conservancy hassucceeded in accomplishing something no other watershed group has achieved in Maryland,perhaps even nationally. The Conservancy has won the support of one out of every fivewatershed homeowners for their Rain Garden program. There are now nearly 373 Rain Gardensin the watershed with more coming. The key to this highly successful effort are Conservancyvolunteers who give homeowners a choice of Rain Garden design, the homeowner selects thespot to install the Rain Garden, then a contractor comes by to install each facility by hand. TheRain Garden costs $2,000 each for a total expenditure of $740,000 thus far. These funds wereprovided by the Chesapeake and Atlantic Coastal Bays Trust Fund and the National Fish andWildlife Foundation (NFWF) administered through the Chesapeake Bay Trust. Equallyimpressive is the degree to which homeowners have maintained the Rain Gardens. Only 3%have failed! The only shortcoming is that a number of the Rain Gardens lack a depression at thesurface to store impervious surface runoff until it can soak through the mulch and planting soillayers.
RetrofitsIn addition to the Conservancy’s 370 Rain Gardens, the Town of Centreville, Queen Anne’sCounty, the Maryland Department of Natural Resources and the Maryland Department of theEnvironment have or soon will complete 32 other retrofit projects. Most of these projects wereidentified in the 2004 Corsica River Watershed Restoration Action Strategy or grew out ofsubsequent planning efforts.

5
Forest ConservationSince the mid-1980s development projects within the critical area, which extends 1,000 feet fromhigh tide, have been required to preserve a portion of each site as forest. All other developmenthas been required to meet similar forest conservation requirements since 1991. These forestareas are then recorded on the plat for each project as Forest Conservation Easements. The platswere obtained for three major Corsica River watershed development projects approved sinceforest conservation requirements came into effect. One has built out completely and the othertwo project sites have been cleared and partially completed. On one project there is a 6.5-acreriparian buffer area adjoining an intermittent and perennial stream which was supposed to beconverted to forest but has remained in agricultural production. The Conservancy is pursuingthis matter to verify that this area was supposed to be forested. At another project it appears thata 30-acre forest conservation easement may extend onto adjoining properties, which couldincrease the likelihood that the forest would be disturbed. The Town of Centreville is lookinginto this question.
Environmental Site DesignIn 2007, Queen Anne’s County adopted the first Environmental Site Design manual of anyMaryland county. In 2009, ESD was adopted statewide. ESD is a far more effective way ofgetting the benefits of growth with fewer aquatic resource impacts. CEDS reviewed the plans forall development projects proposed for the Corsica watershed, but which have not yet been built. There were three such projects. All were approved prior to the adoption of ESD. Neverthelessseveral are using elements of ESD. Recommendations are offered in the body of this report forhow the Conservancy might encourage all three owners to make greater use of ESD.
Centreville WWTP: An Impressive SuccessThe Centreville wastewater treatment plant (WWTP) treats less than 350,000 gallons per day(gpd) from a population of about 4,285 people. Prior to the 2004 Corsica River WatershedRestoration Action Strategy, the plant discharged 11,500 pounds of nitrogen annually into GravelRun near where it enters the tidal Corsica River. The Town has since installed a highly-effectivewastewater treatment system and switched the discharge to spray-irrigation fields located alongMD 305, east of downtown. Nitrogen releases has been slashed by an amazing 59%! Groundwater monitoring records show that the high quality effluent sprayed on the MD 305 siteactually reduces nitrogen concentrations in groundwater. In other words, the effluent is cleaner(in some respects) than groundwater flowing onto the site.
Beginning in 2007, the nitrogen content of groundwater flowing beneath MD 305 andonto the spray site began declining. While it is tempting to believe this is due to BMPs appliedto cropland this is but one of a number of possible explanations.
One set of data does raise concern about the effect of the spray-fields and warrants furtherinvestigation. Generally macroinvertebrate sampling showed good conditions throughout ThreeBridges Branch except at two stations rated fair which are located next to the spray-irrigationfields. However, both stations are also improving which indicates some past impact that has

6
been resolved. The impact could have occurred during the development of Three Creeks whichsits on the opposite bank of Three Bridges Branch. These and other possible causes warrantfurther investigation.
Sewage Collection SystemThe less than 350,000 gallons of sewage treated at the Centreville plant each day is collectedfrom 1,000 homes, businesses and other buildings via a system of buried pipes (sewers) and fivepumping stations. According to the Maryland Department of the Environment, slightly morethan one million gallons of sewage has been released from the sewage collection system and intothe Corsica River system since 2005. Most of the release was due to severe weather events. Butthe number of incidents has declined sharply since 2008. Only one such incident occurred lastyear.
Illicit DischargesOccasionally a manufacturing or repair operation will connect a wastewater discharge pipe to astorm drain. This is illegal and is termed an illicit discharge. To check for such discharges oneexamines each pipe outfall (of which there are at least 57 in the Corsica watershed) to look foranything flowing from the pipe in dry weather. If flow is present and it is something other thanclear, cool, odorless groundwater then samples are collected to test for pollutants.
This is what was done by those who prepared the Watershed Restoration Action Strategy. For this Preliminary Audit waters associated with each stormwater BMP were examined forpollution indicators. Most BMPs are located below storm drain outfalls. Also, 21 points onstreams in the Corsica system were analyzed for pollution indicators. Only one suspect area wasfound which is likely due to large amounts of road salt applied at the MD213/US301 interchange.
Cover CropsAgriculture dominates the Corsica River watershed with regard to land use and nutrient releases. The 45 farmers who work these lands have taken many important steps towards minimizingnutrient and sediment releases. The most recent of which is a very impressive increase in the useof winter cover crops. A well-timed and established cover crop can reduce nitrogen andsediment loads by 47% and 20%, respectively.
All of the fields in the watershed which could benefit from cover crops did so in 2011. These were mostly the fields planted in corn last year. In March, CEDS viewed these fields fromadjoining roads and found a well-established cover crop on most. However, survey in April,May and June indicated that a portion of these fields could have been planted in a commercialcover crop. Some commercial winter cover crops receive fertilizer which reduces the nitrogenload reduction benefit.
BuffersA strip of grass extending 35 feet from a stream bank can reduce the amount of nitrogen enteringthe waterway by 13% to 46%. A 100-foot forest buffer can keep 19% to 65% of nitrogen out of

7
the waterway while preserving instream habitat for fish and other organisms. The WatershedRestoration Action Strategy (WRAS) and other studies identified a paucity of buffers as a majorproblem of the Corsica River system. The 2004 WRAS noted 18 waterside areas rated as VerySevere or Severe with regard to the absence of a buffer. CEDS examined these 18 areas fromnearby roads or aerial photos to determine how much progress has been made in the last nineyears improving these buffers. Of the 18 buffers, two had some improvement but not to thedegree needed to achieve full buffer benefits. A third buffer had a well established grass buffer. However, some of these areas may have been transformed to grass buffers which may not showup on an aerial photo. Since the WRAS was published in 2004, more than a hundred acres ofbuffers have been established in the Corsica River watershed.
Concentrated Animal Feeding Operations (CAFO)Two of these operations exist in the Corsica watershed and have a combined capacity of 792,000chickens. The Corsica River streams most closely associated with each CAFO were examinedfor evidence of pollution, but no such indications were found.
Sewage Sludge ApplicationNine farms in the Corsica River watershed make beneficial use of wastewater plant sludge byapplying it to fields. As with CAFOs, the waters associated with each of these farms wereexamined but no adverse effects were apparent.

8
INTRODUCTIONIn March, 2012, the Corsica River Conservancy retained Community & Environmental DefenseServices (CEDS) to conduct a Preliminary Watershed Audit for the Corsica River. The Auditwas made possible through a grant from the Chesapeake and Atlantic Coastal Bays Trust Fund.
The purpose of a Watershed Audit is to provide an independent assessment of activitiesregulated by existing aquatic resource protection laws. The Audit identifies areas of success andneed. An Audit serves as an opportunity to educate watershed residents about the benefits theyderive from the successes and how their quality of life can improve if they take a more active rolein supporting government and private aquatic resource protection efforts.
A Preliminary Audit, such as that described in this report, takes a first look at regulatedactivities. The intent is to assess a sampling of each category of activity present within awatershed to determine if problem areas exist. Recommendations are then provided for resolvingaquatic resource impacts caused by problem activities, including methods citizens can use toindependently monitor all activities in the future.
Both a Preliminary and full Watershed Audit begin with a review of available informationregarding the targeted waterway.
"An informed citizenry is the only true repository of the public will."Thomas Jefferson
“You don't get what you expect. You get what you inspect. When you deal in generalities,you will never have success; but when you deal in specifics, you will rarely have afailure. When performance is measured, performance improves. When performance ismeasured and reported, the rate of improvement accelerates"
Thomas S. Monson, Business and Religious Leader
CORSICA RIVER CURRENT CONDITIONS & IMPAIRMENT SOURCESTable 1, on the next page, provides the characteristics of the Corsica River and its watershed. Amap of the Corsica River watershed (Figure 1) follows the table.
The latest University of Maryland Center for Environmental Science Ecocheckassessment of the Chester River and tributaries, including Corsica River, rated these waterways aD. The 2010 Chester River Association (CRA) Report Card rates Corsica River nontidaltributaries at B- with the mainstem of the Chester River and tidal tributaries (including theCorsica) rated C-. The Ecocheck and Report Card do not use the same water quality parameters,hence the difference in ratings. Of course the ratings are based on a scale of A to F, with A beingoptimum water quality.

Table 1: Corsica River Watershed Characteristics
CHARACTERISTIC VALUE SOURCE
Watershed area (approximate) 25,298 acres39.5 sq mi
1
Land Use:
Agriculture 60% 2
Forest 27% 2
Residential 7% 2
Water 6% 2
Wetlands <1% 2
Impervious area 4% 3
Population 5,842 6
Homes (2007 approximate) 1,500 1
Tidal River:
Length 6.5 miles 1
Maximum depth 15 feet 4
Mean depth ~3.28 feet 2
Named nontidal tributary length (miles)
Alder Branch 1.15 5
Earle Creek 0.94 5
Emory Creek 1.46 5
Gravel Run 1.92 5
Mill Stream Branch 5.30 5
Miller Creek 0.37 5
Three Bridge Branch 5.47 5
Sources:1. Six Years of Corsica River Restoration: January 2006 through December
2011:http://www.ceds.org/corsica/Corsica_Implementers_6Yr_Rept%20.pdf
2. An Ecological Assessment of the Corsica River Estuary and Watershed:
http://www.gonzo.cbl.umces.edu/documents/Publications/FULL%20CORSICA%20T EXT% 20FINAL%2023O
CT09.pdf
3. Impervious Surface Target and Limit Reference Points for Chesapeake Bay Subestuaries Based on Summer
Dissolved Oxygen and Fish Distribution, available online at: http://www.dnr.state.md.us/irc/docs/00015414.pdf
4. ADC Chartbook Chesapeake Bay Maryland & Virginia 8th Edition
5. Direct measurement from USGS topographic maps6. Based on 2010 Census data which showed a population of 4,235 for the Town of Centrevilleand an average population density of 47.5 people per square mile outside of the Town.


1 Dissolved oxygen must remain above 5.0 milligrams per liter (mg/l) to maintain a healthy, diverse
community of fish and other aquatic organisms.
11
Table 2: TM DL Nutrient Sources (Yr 2000)
Source Nitrogen Phosphorus
Agricultural 86% 84%
Forest 6% 2%
Urban NPS 4% 3%
Centreville
WWTP
4% 11%
Beginning in 2000, the Maryland Biological Stream Survey (MBSS) conducted intensivesampling of Corsica River nontidal tributaries. The latest MBSS report analyzed data gatheredfrom 2006 to 2009. Based on fish and macroinvertebrates (insects, crustaceans, worms, etc.) thenontidal tributaries are in fair condition (on a scale of poor, fair and good). Of the three majortributaries, Gravel Run is slightly better than Three Bridges Branch with Mill Stream Branchslightly poorer. The MBSS data is discussed in detail later in this report.
In 1999, the Maryland Department of the Environment (MDE) placed the Corsica Riveron the list of impaired waters due to: excessive sediments, over-enrichment with nutrients, PCBs,fecal coliform bacteria, and impacts to biological communities. As a result of these impairments,the Corsica River was listed as a Category I watershed, in need of restoration.
In 2000, MDE drafted Total Maximum Daily Load reports for three causes of CorsicaRiver impairment: nutrients, PCBs and fecal coliform bacteria.
NUTRIENT TOTAL MAXIMUM DAILY LOAD (TMDL)When present in excessive quantities, nutrients (nitrogen and phosphorus) can stimulateexcessive algal growth which leads to dissolved oxygen depletion and severe stress for mostaquatic organisms. Elevated algae density also blocks sunlight essential to submerged aquaticvegetation. These SAVs provide important habitat for many fish, shellfish and other CorsicaRiver denizens.
The year 2000 MDE report established anannual TMDL for nitrogen of 287,670 lbs/yr and22,244 lbs/yr for phosphorus. Table 2, shows thesources of nitrogen and phosphorus presented in the2000 TMDL. The sole point source was the Townof Centreville wastewater treatment plant (WWTP). Urban NPS (Non Point Source) is runoff fromexisting buildings, parking lots, streets and otherimpervious surfaces. If nutrient releases into theCorsica River system are lowered to the loadingscalled for in the TMDL, then dissolved oxygenlevels in the Corsica River should remain at or abovethat required for a health ecosystem1 and algalgrowth should remain within the range compatible with a River fully suited for aquatic life,swimming and other forms of water recreation.
At the time the TMDL was completed, the sewage treated at the Centreville WWTP wasdischarged into Gravel Run near the head of tide. Today, the effluent is applied to land at a
12
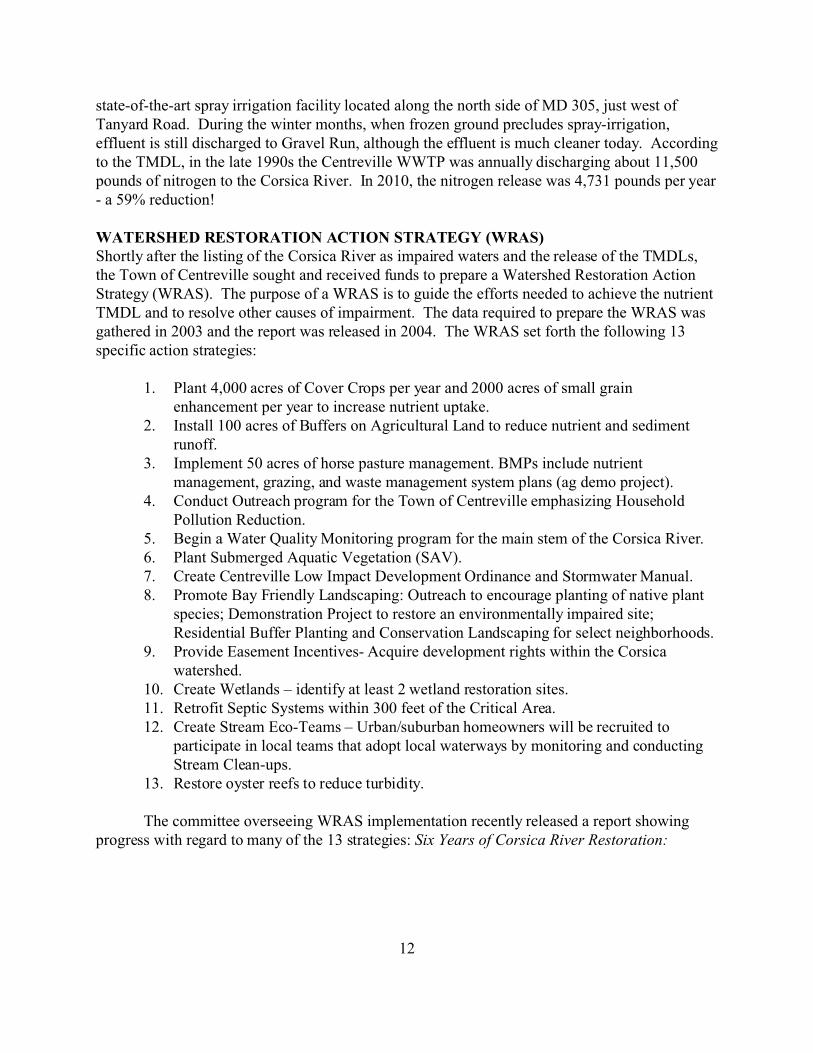
state-of-the-art spray irrigation facility located along the north side of MD 305, just west ofTanyard Road. During the winter months, when frozen ground precludes spray-irrigation,effluent is still discharged to Gravel Run, although the effluent is much cleaner today. Accordingto the TMDL, in the late 1990s the Centreville WWTP was annually discharging about 11,500pounds of nitrogen to the Corsica River. In 2010, the nitrogen release was 4,731 pounds per year- a 59% reduction!
WATERSHED RESTORATION ACTION STRATEGY (WRAS)Shortly after the listing of the Corsica River as impaired waters and the release of the TMDLs,the Town of Centreville sought and received funds to prepare a Watershed Restoration ActionStrategy (WRAS). The purpose of a WRAS is to guide the efforts needed to achieve the nutrientTMDL and to resolve other causes of impairment. The data required to prepare the WRAS wasgathered in 2003 and the report was released in 2004. The WRAS set forth the following 13specific action strategies:
1. Plant 4,000 acres of Cover Crops per year and 2000 acres of small grainenhancement per year to increase nutrient uptake.
2. Install 100 acres of Buffers on Agricultural Land to reduce nutrient and sedimentrunoff.
3. Implement 50 acres of horse pasture management. BMPs include nutrientmanagement, grazing, and waste management system plans (ag demo project).
4. Conduct Outreach program for the Town of Centreville emphasizing HouseholdPollution Reduction.
5. Begin a Water Quality Monitoring program for the main stem of the Corsica River.6. Plant Submerged Aquatic Vegetation (SAV).7. Create Centreville Low Impact Development Ordinance and Stormwater Manual.8. Promote Bay Friendly Landscaping: Outreach to encourage planting of native plant
species; Demonstration Project to restore an environmentally impaired site;Residential Buffer Planting and Conservation Landscaping for select neighborhoods.
9. Provide Easement Incentives- Acquire development rights within the Corsicawatershed.
10. Create Wetlands – identify at least 2 wetland restoration sites.11. Retrofit Septic Systems within 300 feet of the Critical Area.12. Create Stream Eco-Teams – Urban/suburban homeowners will be recruited to
participate in local teams that adopt local waterways by monitoring and conductingStream Clean-ups.
13. Restore oyster reefs to reduce turbidity.
The committee overseeing WRAS implementation recently released a report showingprogress with regard to many of the 13 strategies: Six Years of Corsica River Restoration:

2 Six Years of Corsica River Restoration: January 2006 through December 2011, published 2012,
availab le online at: http://www.ceds.org/corsica/Corsica_Implementers_6Yr_Rept%20.pdf
3 The results were reported in Status and trends in biological condition, water quality, and habitat
conditions in the Corsica River watershed (2007-2009), published 2010 , available online at:
ftp://dnrftp.dnr.state.md.us/public/Outgoing/CCWS/CorsicaRiverInitiative/MBSS_2010_Corsica_Rpt.pdf
4 Subsurface Nitrate Levels in the Corsica River Watershed: Cover Crop Implementation Results,
published 2006 , available online at:ftp://dnrftp.dnr.state.md.us/public/Outgoing/CCWS/CorsicaRiverInitiative/Staver_Nitrate%20after%20Cover%20Crop.pdf
13
Table 3: Fish Health Comparison
Health Rating 2006 2009
Good 30% 29%
Fair 50% 46%
Poor 20% 25%
January 2006 through December 2011.2 Table 2, in the Six-Year report lists an impressive 17WRAS projects completed thus far with another ten on-going at a total cost of $2,354,111.
MARYLAND BIOLOGICAL STREAM SURVEY (MBSS) DATABetween 2000 and 2005, the Maryland Biological Stream Survey analyzed fish,macroinvertebrates, water chemistry and physical habitat at 26 points on nontidal streams withinthe Corsica River system. This sampling was repeated between 2007 and 2009.3 The purposewas to determine if the many improvements made as a result of the WRAS had a measureableeffect on stream health.
At first glance Table 3, would seem to indicate aslight decline in the health of fish populations from 2006to 2009. However, the differences are too small and thedata too variable to be significant. The lack ofimprovement should not be viewed as a direct reflectionof restoration effectiveness. As will be seen in the nextparagraph, it can take quite some time for the benefits ofrestoration efforts to translate into healthier ecosystems.
The most dramatic, fully implemented restorationpractice thus far has been upgrading the Centreville WWTP to a better treatment system(Sequential Batch Reactor) and applying the effluent to land via spray-irrigation. Previously, allof the effluent was discharged into Gravel Run near the head of tide. These tidal-nontidal zonesare difficult to assess, which likely accounts for a lack of sampling stations above and below thedischarge point. The other biggest change is a substantial increase in winter cover crops whichshould cause nitrogen levels to decline over time. In general, most of the nitrogen enteringstreams like those of the Corsica drainage comes in with groundwater seeping from springs,wetlands or directly into the channel. Only a small portion is transported in surface runoff. Winter cover crops substantially reduce the amount of nitrogen entering groundwater andtransported in surface (cropfield) runoff. But we will not see the full benefits in Corsica Rivertributaries until enough post-cover crop rainfall percolates through the soil to reach a seep, springor stream channel. In the Corsica watershed, the depth from the surface of a cropfield to thewater table ranges from five- to fifteen feet.4 It can take three years for rainfall to percolate

5 Subsurface Nitrate Levels in the Corsica River Watershed: Cover Crop Implementation
Results, published 2006 , available online at:
ftp://dnrftp.dnr.state.md.us/public/Outgoing/CCWS/CorsicaRiverInitiative/Staver_Nitrate%20after%20Cover%20Cr
op.pdf
6 An Ecological Assessment of the Corsica River Estuary and Watershed, published 2009, available online
at: http://www.corsicariverconservancy.org/sites/default/files/Corsica%2520Box%2520M odel%252023OCT09.pdf
7 German Branch Targeted Watershed Project Biotic and Water Quality Monitoring Evaluation Report
1990 Through 1995, published 1997 , available online at:
http://web.vims.edu/GreyLit/MDNR/ccws-wrd-mn-97-03?svr=www
8 Report on Nutrient Synoptic Surveys in the Corsica River Watershed, Queen Anne’s County, Maryland,
April 2003 as part of the Watershed Restoration Action Strategy, published 2003, Watershed Services, Maryland
Department of Natural Resources, 580 Taylor Avenue, Annapolis, MD 21401.
9 Status and trends in biological condition, water quality, and habitat conditions in the Corsica River
watershed (2007-2009), published 2010 , available online at:
ftp://dnrftp.dnr.state.md.us/public/Outgoing/CCWS/CorsicaRiverInitiative/MBSS_2010_Corsica_Rpt.pdf
14
vertically from the soil surface to the water table.5 In the adjoining German Branch watershed ittakes an average of 18 years for water to flow from a cropfield surface to a point of discharge(seep, spring, wetland, channel or shoreline).6 In other words, it could be a couple of decadesbefore we start seeing noticeable improvements in the portion of the Corsica River ecosystemaffected by cropfield releases.
The MBSS researchers found that nitrogen levels were higher in subwatershedsdominated by agricultural or urban land uses. Increasing percentages of forest in a watershedwas correlated with healthier fish populations and lower nutrient levels. The researchersrecommended increasing riparian (streamside) buffers and the extent of forest within thewatershed. In the adjoining German Branch watershed DNR biologists found thatmacroinvertebrate and fish populations were controlled more by habitat than nutrientconcentrations.7 The researchers who sampled the Corsica system in the early part of the decadenoted that fish populations were dominated by species preferring sand or mud habitats.8 Morediverse and healthier fish populations were associated with more stable habitats containing alarger amount of woody material, gravel and other stable stream beds.9
MBSS found several nitrogen “hot-spots” within the Corsica River watershed. Theresearchers cited USEPA studies showing that in the Mid-Atlantic region “natural” total nitrogenlevels tend to be below 0.87 milligrams per liter (mg/l). The corresponding value for totalphosphorus is 0.0525 mg/l. The researchers also noted that the Maryland Department of NaturalResources (DNR) considers a total nitrogen value greater than 7.0 mg/l to be highly elevated with0.07 mg/l being the corresponding threshold for total phosphorus.

10 Restoration & Enhancement Opportunities for the Corsica River Watershed (undated) is available online
at: http://www.dnr.state.md.us/irc/docs/00015709.pdf
11 See: http://websoilsurvey.nrcs.usda.gov/app/HomePage.htm
12 Variations in Base-flow Nitrate Flux in a First-order Stream and Riparian Zone, published 2008,
availab le online at: http://ddr.nal.usda.gov/bitstream/10113/15719/1/IND44061145.pdf
13 An Ecological Assessment of the Corsica River Estuary and Watershed, published 2009, available online
at: http://www.corsicariverconservancy.org/sites/default/files/Corsica%2520Box%2520M odel%252023OCT09.pdf
15
The MBSS researchers found that total nitrogen was extremely high at five streamsampling points. One of these “hot-spots” was in an area dominated by urban and agriculturalland uses. The other four were in agricultural areas. The researchers recommended:
“Knowing where nutrient levels are elevated, sub-watershed specific nutrient reductionsplans need to be established. Expanded cover crop planting, wider vegetated bufferstrips, or improved stormwater management should be considered within these smalldrainages.”
In the 2006 report Restoration & Enhancement Opportunities for the Corsica RiverWatershed,10 DNR recommended focusing on hydric (wetland) soils previously converted tofarming as the first place to expand riparian buffers, particularly where these soils abut existingforest, floodplains or streams. It appears though that most of the hydric soils in the Corsicawatershed are in forest, based upon data available through the USDA Web Soil Survey GISsite.11
Researchers at the Beltsville Agricultural Research Center (BARC) found that about halfthe nitrogen entered an agricultural stream along 10% of its length.12 The BARC researcherscalled these sections “critical areas” and theorized that concentrating Best Management Practices(BMPs) at areas draining to these points may be a far more cost-effective approach for reducingnutrient inputs. I understand that MDE and others are looking into similar approaches to identifynutrient critical areas within the Corsica system.
ECOLOGICAL ASSESSMENTIn 2009, the University of Maryland Center for Environmental Science published an assessmentof all available Corsica River data and the implications for ecosystem health.13 The researchersconcluded River quality remains impaired due to excessive nutrient concentrations which causealgae populations to proliferate which, in turn, contributes to reduced water clarity and dissolvedoxygen deficiencies. Poor water clarity precludes the return of submerged aquatic vegetation andbeneficial bottom-dwelling algae. Dissolved oxygen levels have fallen below that needed for ahealthy estuary (5.0 mg/l) and have led to fish kills in recent years. Water quality is poorest atthe head of the River and improves as one moves towards the Chester River.

16
Table 4, presents updated nutrient loadings for the Corsica River system from the 2009assessment. When converted to pounds per year the nutrient loads in Table 4 become 261,668and 36,085 respectively for nitrogen and phosphorus. The year 2000 MDE TMDL called forreducing nitrogen loading to 287,670 pounds/yr and 22,244 pounds/yr for phosphorus. At firstglance one might assume the nitrogen TMDL has been met and now we only need focus onphosphorus. Unfortunately this is not the case.
Table 4: Nutrient Sources - 2009 Assessment
SOURCE
LOADING(kilograms/month)
PERCENT
Nitrogen Phosphorus Nitrogen Phosphorus
Agriculture 8,099 1,002 81.9% 73.5%
Developed Areas 1,023 345 10.3% 25.3%
Direct AtmosphericDeposition
452 ~0 4.6% 0.0%
Centreville WWTP 168 17 1.7% 1.2%
Septic Leachate 149 ~0 1.5% 0.0%
Total 9,891 1,364 100.0% 100.0%
In the decade since MDE drafted the TMDL, water quality modeling science hasimproved dramatically. Because of this and a number of other changes the target established bythe 2000 MDE TMDL may no longer be applicable. In fact, the scientists who compiled the2009 ecological assessment concluded that the nitrogen loads presented in Table 4 must bereduced by 50% to restore the Corsica River to a condition where submerged aquatic vegetation,benthic algae, fish populations and human uses can be fully restored. One of the most noticeableearly signs of success in achieving this goal would be that water clarity would double or triplethroughout the River, with the bottom visible to a depth of maybe three feet. This would lead toa greater abundance of fish, shellfish and other organisms. In fact, conditions would return which have not existed in the Corsica system for 50 years.
The ecological assessment noted the substantial nutrient load reduction achieved byupgrading the Centreville Wastewater Treatment Plant (WWTP). The scientists suggested three actions to achieve the 50% reduction in nutrient loads:
• maximize the use of winter cover crops on half of all agricultural fields;• increase the removal of nutrients from runoff generated on developed lands with
stormwater Best Management Practices (BMPs); and

14 Impervious Surface Target and Limit Reference Points for Chesapeake Bay Subestuaries Based on
Summer Dissolved Oxygen and Fish Distribution, published 2009 , available online at:
http://www.dnr.state.md.us/irc/docs/00015414.pdf
15 At 2.0 mg/l of dissolved oxygen conditions become very stressful for most organisms.
17
• upgrade the existing 160 (of 809) septic systems located near tidal waters for betternitrogen removal.
The first action may have been achieved and substantial progress has been made towardsthe second. More on both later in this report. The WRAS Implementers Group set the goal ofupgrading nutrient removal in 30 of the 809 septic systems in the watershed. Thus far 48% of the30 upgrades have occurred.
IMPERVIOUS SURFACES & ESTUARINE HEALTHIn 2009, the Maryland Department of Natural Resources (DNR) published a study of therelationship between impervious area, dissolved oxygen and fishery health.14 The study wasconducted in ten Maryland tidal waterways, including the Corsica River. Following are theprinciple conclusions taken verbatim from this study:
• The 5 milligram per liter (mg/L) dissolved oxygen (DO) target was almost 3-timesmore likely to have been observed in bottom waters when impervious surfaces (IS)cover 5% or less of a watershed than when IS was 10-17%;
• The chance of measuring DO below the 2 mg/L threshold15 was nearly 3-times greaterwhen IS was 10% or more;
• In systems with target IS (less than 5%), habitat would generally be consideredunimpaired and managing harvest of resident fishes would be effective;
• Preserving watersheds at or below 5% IS would be a viable fisheries managementstrategy;
• Increasingly stringent regulation might compensate for habitat stress as IS increasesfrom 5 to 10%; and
• Above a 10% IS threshold, habitat stress mounts and successful management byharvest adjustments alone becomes unlikely.
According to the DNR study, 4% of the Corsica River watershed was covered bybuildings, parking lots, streets and other impervious surfaces as of 2009. Given the large areas ofdevelopable land within the watershed, it seems likely that Corsica River watershedimperviousness will cross the 5% threshold in the not too distant future. The most intensedevelopment would occur within the Town of Centreville and in the growth area designated byQueen Anne’s County on lands adjoining the Town.
Preserving land through the sale of development rights and other measures wouldcertainly slow the pace at which impervious area is added to the Corsica River watershed. As of

16 Corsica River Watershed Characterization, published 2003 , available online at:
www.dnr.state.md.us/irc/docs/00006551.pdf
17 Personal communication with Mr. Frank Di Gialleonardo.
18 To learn more about ESD visit: ceds.org/esd , www.qac.org/Docs/PublicWorks/esdm/QAC_ESDM .pdf or
http://www.mde.state.md.us/programs/Water/StormwaterManagementProgram/MarylandStormwaterD esignM anual/
Pages/programs/waterprograms/sedimentandstormwater/stormwater_design/index.aspx
18
2003, 1,958 acres of the Corsica watershed had been preserved.16 Presently, about 5,850 acres inthe watershed are now preserved17, which brings the total amount of the watershed preserved toan incredible 23%! Another 7% of the watershed is presently developed and 7% is water orwetlands. So as much as 64% of the watershed could be developed.
It is doubtful that the other nine watersheds included in the DNR study have benefittedfrom as many restoration practices as the Corsica. While it is a given that these practices offsetimpervious surface impacts, the degree of offset is unknown. Hopefully, monitoring willcontinue and demonstrate that with the right BMPs a healthy estuary is compatible withimpervious area greater than 5%.
In 2009, Maryland adopted a new approach to mitigating the impact of impervioussurfaces known as Environmental Site Design (ESD).18 While it is possible that ESD will offsetsome impervious surface impacts, it would be unwise to assume complete mitigation. ESD is abrand new approach with many uncertainties regarding effectiveness, not the least of which is thestrain it will put on presently overtaxed inspection capabilities. Prior to ESD each developmentproject might have two or three stormwater BMPs. With ESD the number may increase ten-fold. How all these BMPs will be inspected and maintained is a very serious unanswered questionstatewide.
As noted in other studies cited above, the DNR researchers found that macroinvertebratecommunities were healthier in headwater streams draining agricultural watersheds provided therewas extensive use of Best Management Practices (BMPs). As impervious surfaces increased,stream health declined, although retaining generous riparian buffers mitigated the impactsomewhat.
SUMMARY OF CURRENT CONDITIONS & AUDIT RELEVANCEThe tidal portion of the Corsica River is suffering from excessive nutrient and sediment inputswhich lowers water clarity and inhibits the growth of submerged aquatic vegetation along withbenthic algae, both of which are essential to a healthy ecosystem. The nutrients stimulateexcessive surface algal growth which reduces water clarity and leads to severe oxygen depletion. Suspended sediment combines with algae to further reduce water clarity.

19
To restore the tidal portion of the Corsica River, the University of Maryland Center forEnvironmental Science assessment called for reducing nutrient inputs by 50%, which wouldbring about a 70% reduction in algae and a substantial improvement in water clarity, by:
• maximizing the use of winter cover crops on half of all agricultural fields;• increasing the removal of nutrients from runoff generated on developed lands with
stormwater Best Management Practices (BMPs) which may reduce the impact ofwatershed imperviousness approaching the critical threshold of 5%; and
• upgrading the existing 160 (of 809) septic systems located near tidal waters for betternitrogen removal.
Based on fish and macroinvertebrate sampling, the nontidal portion of the Corsica Riversystem is presently rated fair on a scale of poor, fair and good. The nontidal system consists ofthree major streams: Gravel Run, Mill Stream Branch, and Three Bridges Branch. Of the three,Gravel Run is slightly better than Three Bridges Branch with Mill Stream Branch slightly poorer. While nutrients tend not to be a significant problem for smaller nontidal streams, these waters doconvey nutrients to the tidal river. Researchers have isolated five nitrogen hotspots along thesenontidal waterways and hope to identify and correct the cause of elevated levels. The factorscited as degrading the quality of nontidal portions of the Corsica River system include:
• Lack of riparian buffers;• Excessive sediment inputs which degrade habitat by filling pool-riffles, burying
woody substrate, lowering stability and variations in velocity-depth;• Low percentage of the watershed in forest; and• Some nontidal stream segments are presently affected by development which will
increase as growth continues in the watershed, though full use of erosion andsediment control, Environmental Site Design and other highly-effective aquaticresource protection measures could substantially reduce the impact.
Of course greater use of cover crops could also substantially reduce inputs of sedimentand other pollutants to nontidal waters.
AUDIT OF REGULATED & OTHER AQUATIC ENHANCEMENT ACTIVITIESNormally a Watershed Audit focuses on activities regulated by existing aquatic resourceprotection laws. However, agriculture is such an important element in the Corsica Riverecosystem that several voluntary aquatic resource enhancement activities were included. Also,there has been a phenomenal amount of voluntary restoration in the Corsica River watershed. Therefore the scope of this Audit has been expanded.
WHY SITE NAMES & LOCATIONS ARE NOT GIVEN IN THIS REPORTCEDS seeks to achieve correction of water quality problems through the Equitable Solutions,cooperation first approach. It is only after all reasonable efforts to achieve cooperation areexhausted that CEDS moves on to other approaches. It would be inconsistent with cooperation-

19 Urbaniza tion and S treams: Studies of Hydrolog ic Impacts, published 1997 , available online at:
http://ceds.org/audit/Urbanization_and_Streams-Studies_of_Hydrologic_Impacts.pdf
20
Silt fence and other perimeter controls are far less
effective than stabilizing soil with mulch-grass
first to publish the name and location of sites found to be causing more pollution than permittedby clean water laws since we have yet to contact the site owner. However, one facility is namedbecause of commendable action to enhance the Corsica River - the Centreville WastewaterTreatment Plant (WWTP).
The exception to the cooperation-first approach are those situations where a pollutionproblem is on-going, causing substantial aquatic resource impact and additional impact may beimminent. CEDS found several construction sites that had extremely poor erosion and sedimentcontrol. It was obvious that at least some of these sites had already damaged Corsica Rivertributaries and more harm would occur come the next rain. Because of this the sites werereferred immediately to the Maryland Department of the Environment. See the next section forfurther detail.
CONSTRUCTION SITE EROSION & SEDIMENT CONTROLSeveral of the studies cited above noted that sediment is a significant factor degrading the qualityof the Corsica River, both the tidal and nontidal portions. In 1996, MDE listed the Corsica Riveras being impaired by sediment. In the tidal portion excessive sediment inputs fill boatingchannels and combines with algae to prevent sunlight from reaching river bottom areas thatmight otherwise support submerged aquatic vegetation. Sediment degrades the quality ofnontidal stream habitat by filling in pools, riffles and by burying woody material. On a per acrebasis, no other land use within the Corsica River system has the potential to release as muchsediment as a construction site.
Enough soil can erode from a typicalconstruction site to pollute three miles ofdownstream waters.19 Recovery of thesepolluted waters can take a century. However,with the use of the right protection measuresthis pollution can be eliminated. And THEmost effective protection is to prevent erosionin the first place by covering exposed soil withstraw mulch, grass, or other "stabilization"materials. When compared to other measures,like the black silt fence pictured to the right,they simply can't keep enough mud on the siteto prevent pollution. In fact, whenever you seeexposed soil on a construction site, you canassume pollution will occur come the next rain. This is why the principal Chesapeake Baywatershed states - Maryland, Pennsylvania, and Virginia - require protection of all disturbedconstruction site soils within 3 to 14 days from when bulldozers and other earth-moving

20 See: http://www.mde.state.md.us/programs/Water/StormwaterManagementProgram/
SoilErosionandSedimentControl/Pages/Programs/W aterPrograms/SedimentandStormwater/erosionsedimentcontrol/i
ndex.aspx
21
Sediment traps capture sand, some silt but
little clay
equipment first arrive. However, compliance with this vitally important law is less than 100% inmany parts of the Bay watershed. Until we can improve compliance, efforts to restore theChesapeake Bay and our many other degraded waterways, like the Corsica, will be in jeopardy.
The bible on construction site erosion and sediment control is Maryland Standards forSoil Erosion & Sediment Control, published by the Maryland Department of the Environment.20 MDE just replaced the 1994 edition with a 2011 edition, which becomes effective in sevenmonths (January 9, 2013).
Both editions emphasize the need to quickly clear a site of vegetation and bring the siteup to rough grade where building can begin. Once grading ceases the entire disturbed area mustthen be stabilized with an application of mulch and grass seed. The mulch, usually straw, mustbe sufficiently thick to obscure underlying soils from view. It is only by achieving such a thickcover that straw can prevent erosion come the next rain.
Under ideal conditions the first seeding leads to a well established stand of grass, which isdefined in the new MDE manual as “95% vegetative groundcover”. However, many contractors-developers budget for a single seeding. All too often this first seeding achieves a sparse growthof grass, mulch begins blowing away and the underlying soils erode away with each rain. This isnot a problem confined to the Corsica River watershed but is statewide and even Bay-watershedwide.
This is why CEDS is urging groups like the Conservancy to educate the public, includingthe development community, that exposed soil on a construction site means pollution of thenearest waterway come the next rain. If this goal is achieved then people will react to exposedconstruction site soil with the same indignation triggered by littering or aggressive driving. Asthis perception spreads the area of exposed construction site soil will diminish through voluntaryactions on the part of the development-constructioncommunity.
Why Does Exposed Soil = Pollution?The answer to this question is simple: Clay.
Soil is made up of three particle sizes: sand, siltand clay. Clay is the smallest and the hardest to removeonce it has been eroded from the soil surface andentrained in runoff. Sand and coarse silt can be kept ona construction site with silt fence, sediment traps (likethat pictured to the right), and other perimeter control

22
measures. These perimeter measures mostly rely upon settling to remove sediment from runoff. The larger particles settle fairly quickly while days or weeks may be required for clay and finersilt to settle from suspension. So, the most effective way of keeping clay on a construction site isto prevent erosion, which means minimizing the exposure of soil to the erosive force of rainfalland runoff. This, in turn, means protecting soil as quickly as possible following disturbance witha layer of straw mulch, then grass. Road beds and parking lot areas are protected by laying downa layer of stone. Collectively, mulch, grass and stone are known as “stabilization measures”.
One might think that the small size renders clay particles harmless. In some respects theopposite is true. Much of the phosphorus, pesticides, and other pollutants washing fromconstruction sites travel attached to clay particles. Many fish eggs have a slightly sticky coatingand clay can adhere so thickly to the egg surface that oxygen flow is blocked suffocating thedeveloping fish embryo. Clay is the most expensive particle to remove from drinking watersources. Clay and other suspended particles are responsible for a large portion of the turbiditywhich blocks sunlight and has greatly diminished the extent of submerged aquatic vegetation(SAV) throughout the Chesapeake Bay and other Maryland waters.
Construction Site AuditCEDS identified five active construction sites within the Corsica River watershed. The mostsevere problem was found at the Centreville Business Park. Following is the text of a messagesent to the Maryland Department of the Environment (MDE) requesting an investigation ofconditions found at all five sites.
Centreville Business Park: There are two large areas of exposed soil within this site onMD 213 at the south end of Centreville. The southernmost is located behind the FoodLion shopping center. There’s a large stockpile of earth about 500 feet to the east of theshopping center. The stockpile is poorly stabilized and eroding severely. While asediment trap is present between the stockpile and Mill Stream Branch, the trap is full ofsediment. At the north end of the Business Park, near some recently completed retailspace at the north end of Comet Drive, there’s another stockpile next to a largestormwater pond. As with the first pile, this one is poorly stabilized and a large amount ofmaterial has been deposited in the pond. Of course Maryland law calls for stabilization ofexposed soils once earth-moving activity has halted more than momentarily even if apond is present. Of particular concern are the clay and fine silt particles which do notsettle in ponds and can pose such a threat to the fish spawning in the Corsica system atthis time. Stabilization seems the most effective way of keeping these fines onsite and outof Mill Stream Branch.
North Brook: This project is located on the east side of MD 213 off Wexford Drive.Throughout the southeast area of this project there are numerous lots which eithercompletely lack stabilization or where mulch-grass is too thin to prevent excessiveerosion. There are also a few lots north of Wexford.

21 Annual Enforcement and Compliance Report Fiscal Year 2011, published 2012 , available online at:
http://www.mde.state.md.us/aboutmde/DepartmentalReports/Documents/www.mde.state.md.us/assets/document/abo
utMDE/MDE_FY 11_Enforcementcompliancereport.pdf
22 Biweekly inspections are most important when a construction site is active. See Code of Maryland
Regulations (COMAR) 26.17.01.09D for the biweekly inspection requirement, availab le online at:
www.dsd.state.md.us/comar/getfile.aspx?file=26.17.01 .09.htm
23
Symphony Woods: As with North Brook, there are also a number of poorly stabilizedlots within Symphony Woods. These lots are also in the southeast portion of this project.
Ashland Meadows: A single lot is being developed along Ashland Drive, off TanyardRoad. The perimeter silt fence is lying on the ground, no longer functioning. Also theentire lot is exposed soil and should be stabilized.
Beech Trail Lane: A single lot is under construction at Tanyard Road and Beech TrailLane. Much of the lot is exposed soil and should be stabilized.
MDE directed correction of the deficiencies noted at the Centreville Business Park. MDEreferred the other issues to the Queen Anne’s Soil Conservation District which oversees erosionand sediment control on individual lots. The Conservancy is working directly with the Districtregarding these issues.
It appears the severe problem at Centreville Business Park had existed for quite sometime. If this is correct then it is likely due to the lack of sufficient inspection staff. The MarylandDepartment of the Environment (MDE) serves as the erosion and sediment control inspection-enforcement agency with regard to construction activity in nine Maryland counties includingQueen Anne’s. Statewide, MDE oversees 158,058 regulated entities, of which about 13,000 areconstruction sites.21 In fiscal year 2011, MDE inspectors were able to visit only 16% of theseconstruction sites even though State law requires an inspection of each site once every twoweeks.22
MDE inspection capabilities are not likely to increase in the near future. In fact, theirinspection staff declined by 6% over the past year. One possible solution is for Queen Anne’sCounty to seek delegation of inspection-enforcement authority as was done by other EasternShore counties: Cecil, Dorchester, Kent and Worcester. The Town of Centreville could also seekthis authority.
CEDS also came across a recent logging operation north of the Corsica River. Observation of the operation was limited to that visible from the road. It appeared that alldisturbed soils had been effectively treated with a layer of straw mulch and grass. All in all, theerosion and sediment control care taken at this site was impressive.

23 See a 2012 Thank You letter sent to Elm Street D evelopment posted at:
http://ceds.org/audit/OdentonGatewayThankYou.pdf
24 Queen Anne’s County stormwater management officials felt that the 2010 database accurately accounted
for existing BMPs in the Corsica River watershed . The public can access the BMP database via StormPrint:
http://mdewin25.mde.state.md.us/flexviewer/stormwater/map.html
24
On-Going Audit Recommendations: Construction SitesIn May, CEDS conducted a Watershed Audit workshop on behalf of the Conservancy. A portionof the workshop was devoted to training volunteers in methods for evaluating construction siteerosion control quality and encouraging developers-contractors to eliminate exposed soilwhenever it appears on a site. This approach has been used quite successfully by the SevernRiver Association23 and others. It does not require trespass or the other negatives associated withpast efforts. The increased public awareness stemming from this workshop could serve to beginspreading the Exposed Soil=Pollution message and generating the public support needed shouldCentreville or Queen Anne’s County opt for enforcement authority. Conservancy volunteersshould then request an opportunity to tour each construction site in the Corsica watershed withthe party responsible for erosion and sediment control. The tours should be repeated monthly.
EXISTING STORMWATER BEST MANAGEMENT PRACTICESStormwater BMPs include ponds, sand filters, bioretention, specially designed grass channels,infiltration basins-trenches and other measures intended to reduce downstream flooding, retainpollutants washed from impervious surfaces, maintain groundwater recharge, and minimize thehigh velocities causing channel erosion. Unlike most Chesapeake Bay watersheds, there are twolarge categories of stormwater BMPs in the Corsica River watershed: those built as part of pastdevelopment projects and retrofits installed by the Conservancy, the Town of Centreville, QueenAnne’s County and the State Highway Administration.
Development Project BMPsAs early as 1985, proposed development projects within the Corsica River watershed have beenrequired to use stormwater BMPs. According to a 2010 edition of the Maryland Urban BMPDatabase24, there are now 85 BMPs treating runoff from as much as 1,180 acres of developedlands or about two-thirds of all developed lands within the watershed (see Table 5, on the nextpage). If all BMPs were fully functional they could be keeping 2,543 pounds of nitrogen out ofthe Corsica River each year along with 480 pounds of phosphorus and 127 tons of solids. Thesolids are mostly sediment derived from channel erosion caused by the excessive velocity anderosive force of runoff from impervious surfaces.
CEDS created a listing of the 85 BMPs located in the Corsica River watershed thenplotted the location of each using the coordinates from the database. The plots were made with2008 Google Earth aerial photos as the base imagery. During this process it was apparent thatmany of the BMPs either had not been built or the coordinates were inaccurate. The population

Table 5: Stormwater Best Management Practices Serving Corsica River Watershed Development
AVERAGE ACRESTYPE NUMBER YEAR BUILT SERVED Nitrogen Phosphorus Sediment Nitrogen Phosphorus Sediment
(pounds) (pounds) (tons)
Bioretention 1 1.4 50% 60% 90% 7.1 0.8 0.2
Dry Pond 5 2000 34.3 5% 10% 10% 17.1 3.3 0.6
Extended Detention Pond 3 1998 128.7 20% 20% 60% 256.4 25.0 13.9
Grass Channel 10 2006 47.9 45% 45% 70% 214.8 20.9 6.0
Infiltration Basin 2 1986 11.1 80% 85% 95% 88.8 9.2 1.9
Infiltration Trench 3 1990 9.0 80% 85% 95% 71.7 7.4 1.5
Shallow Marsh Pond 1 2003 7.9 20% 45% 60% 15.7 3.4 0.9
Swales 1 2007 0.0 50% 60% 90% 0.0 0.0 0.0
Underground Storage 2 2007 0.7 20% 45% 60% 1.5 0.3 0.1
Wet Pond 57 2003 938.9 20% 45% 60% 1,870.3 409.8 101.4
Total 85 1,180.0 2,543.3 480.2 126.6
POLLUTANT REMOVAL EFFICIENCY POLLUTANTS POTENTIALLY RETAINED
Pollutant removal efficiency is based upon in Accounting for Stormwater Wasteload Allocations and Impervious Acres Treated , available online at: http://www.mde.state.md.us/programs/Water/StormwaterManagementProgram/Documents/NPDES%20Draft%20Guidance%206_14.pdf
Pollutants Potentially Retained is based upon average per acre loading rates times the removal efficiency. Loading rates were obtained from Table 1, in Accounting for Stormwater Wasteload Allocations and Impervious Acres Treated.

26
of 85 facilities was then whittled down to 48 BMPs. On March 13, 2012, CEDS visited andevaluated the 48 BMPs.
Table 6, provides a summary of the BMPs evaluated. Of the 48 BMPs, 50% had noobvious defect which would interfere with pollutant removal effectiveness. The other 50% haddefects ranging from those causing a modest increase in pollutant releases to those so poorlymaintained that pollutant retention is essentially zero. The problem BMPs were referred toCentreville and Queen Anne’s County officials. As of the date of this report we have not heardthe results of the Town and County evaluation of the problem BMPs.
Table 6: Stormwater BMP Audit Findings
Type Number ProblemNoted
Nature of Problem
Bioretention 1 1 No mulch which is critical topollutant removal and preventing
failure
Dry Pond 2 2 No area to store pollutants orfloodwaters
Extended-Detention Pond 2 2 Storage loss; piping which couldlead to spillway failure
Grass Channel 5 2 BMP was dry pond with no storage
Infiltration Basin 1 0
Underground Storage 2 0 No manholes or other presenceindicators; so facilities could not
be evaluated
Wet Pond 35 17 Forebay breached; no wet pool; nopollutant storage area; storage
reduced due to sediment-cattails;spillway piping; trees on
embankment; dewatering devicefailure
Total 48 24
Percent of Total 50%
About eight miles of US Route 301 is located within the Corsica River watershed. Several stormwater BMPs are visible in the highway median. However, it’s too dangerous to

25 See Section 6.7.4, Chesapeake Bay Phase 5 Community Watershed Model, USEPA Chesapeake Bay
Program.
26 Based on a 2012 detailed evaluation of BMP inspection in Anne Arundel County.
27 Based on Costs of Stormwater Management Practices In Maryland Counties, published 2011 , available
at:
http://www.mde.state.md.us/programs/Water/TM DL/TMD LImplementation/Documents/King_Hagan_Stormwater%
20Cost%20Report%20to%20MDE_Final%20Draft_12Oct2011.pdf
27
A Symphony Village Rain Garden
attempt a closer look on foot. Instead a request was sent to the State Highway Administration fordetails regarding the number, type and location of BMPs. The SHA response noted threefacilities in the watershed: a retention pond, a shallow marsh and a wet extended-detention pond.
Inspection and maintenance of stormwater BMPs is a serious issue statewide. Marylandlaw requires inspection of stormwater BMPs a minimum of once every three years. However,TMDLs-Watershed Implementation Planning requires an annual inspection to gain credit forpollutants retained in filtering practices which maybe our most-effective BMPs.25
A full-time inspector can evaluate about 800 BMPs per year at a cost of roughly $150 perevaluation.26 Annual BMP maintenance costs range from $600 to $3500 per BMP dependingupon type.27 In the Corsica watershed BMPs are maintained by the owner, whether that be agovernment agency, a homeowners association or business. The Maryland General Assemblyjust passed a bill (HB 987/SB614) establishing a source of funding for stormwater BMPsinspection, maintenance and installation in nine counties, but not Queen Anne’s.
The Town of Centreville is investigating the possibility of establishing a funding sourceknown as a stormwater utility. Similar programs elsewhere in Maryland and Delaware have beenquite successful. Given the number of problems noted at existing stormwater BMPs additionalfunding is certainly an urgent need.
Conservancy’s Amazing Retrofit ProjectThe Corsica River Conservancy has accomplishedsomething truly unique among Maryland watershedorganizations; perhaps even among all groups nationally. The Conservancy has installed a Rain Garden at one ofevery five households in the Corsica River watershed! Thus far nearly 370 Rain Gardens have been installed at acost of $2,000 each for a total investment of $740,000. Funding for the Rain Gardens was provided by theChesapeake and Atlantic Coastal Bays Trust Fund and theNational Fish and Wildlife Foundation (NFWF)administered through the Chesapeake Bay Trust.

28
The Conservancy’s Rain Gardens are installed in private yards generally downhill of ahome or other impervious surfaces. After much trial and error the Conservancy found anapproach which makes it easy for homeowners to appreciate Rain Garden benefits and get one oftheir own. A Conservancy volunteer shows the homeowner photos of a couple of different RainGarden designs, several of which support flowering plants spring, summer and fall.
After making a choice the homeowner selects a location for the 250-square foot RainGarden. A contractor installs the Rain Garden at no cost to the homeowner. After correcting anyinstallation issues Rain Garden maintenance becomes the homeowner’s responsibility. Incredibly, homeowners have been maintaining 97% of all Rain Gardens!
Of course there’s alwaysroom for improvement, even with aproject as incredibly successful asthis one. Ideally, the surface of aRain Garden should be depressed 6-to 12-inches below the first pointwhere runoff could flow from thefacility. This depression serves tostore runoff until it can be treated bysoaking through the mulch andplanting soil layer. It appears that anumber of Rain Gardens lack asurface depression. No doubtsignificant pollutant retention is occurring but it could be only a fraction of what might beachieved. There would be value in using the CEDS Rain Gage & Float method to monitor a fewRain Gardens to get a handle on treatment volumes.
Frankly, the surface storage issue is almost trivial compared to the challenges theConservancy has overcome to get 20% of all watershed homeowners to embrace a Rain Gardenin their yard and to achieve a 97% maintenance rate. But it does provide an importantopportunity to substantially reduce pollution inputs to the Corsica.
Other RetrofitsIn addition to the 373 Rain Gardens installed through the Conservancy’s efforts, another tenretrofit projects have been completed or soon will be. Most were carried out by the Town ofCentreville. This is also an extremely impressive accomplishment. One of these retrofits was forthe public library on Commerce Street. This is a fantastic project for helping the publicunderstand the benefits provided by Rain Gardens. However, this Rain Garden treats runoff from13,000 square feet of impervious area. This Rain Garden should have a minimum storage area of

28 The recommended storage is based on the 2009 Maryland Stormwater Design Manual which calls for
treating a minimum of the first inch of runoff from impervious surfaces. The surface storage area is sized to
accommodate 75% of this volume with the remainder stored in the mulch and planting soil layers.
29
Centreville Public Library Rain Garden
813 cubic feet below the firstpoint where runoff could flowfrom the Garden.28 With thisstorage volume the RainGarden would treat the firstinch of runoff from impervioussurfaces or 90% of all runoff. It looks like the actual storagearea in the library facility maybe something less 813 cubicfeet. The Rain Gage & FloatMethod could be used toquickly and inexpensivelyverify storage volume.
On-Going Audit Recommendations: Stormwater BMPsThe May workshop showed Conservancy volunteers how to evaluate stormwater BMPs foropportunities to enhance pollution retention. Unlike construction sites, stormwater BMPs neednot be visited monthly but once a year. At least one Maryland county is considering thepossibility of using volunteer inspections to verify pollutant retention for TMDL and WatershedImplementation Plan purposes. This County is also considering the possibility of allowingtrained volunteers to perform simple BMP maintenance, like replacing mulch in bioretention-Rain Garden facilities every two years.
The Conservancy should monitor several typical Rain Gardens to determine just howmuch runoff is being treated. If it is substantially less than the first inch from impervioussurfaces then consideration should be given to opportunities to create additional storage duringfuture installations and repairs.
FOREST CONSERVATIONSince the mid-1980s those developing land within a thousand feet of the Corsica and its tidalcreeks has been required to retain a portion of each site in forest. With the passage of theMaryland Forest Conservation Act in the early 1990s, this became law in all other portions of thewatershed. There is a growing amount of scientific research that sensitive aquatic resourcescannot be preserved by just limiting impervious area and using highly-effective BMPs. Aminimum amount of forest must also be retained within a watershed. At this point it appears that

29 CW P 2003 . Impacts of Impervious Cover on Aquatic Systems. The Center for Watershed Protection,
8391 Main Street, Ellicott City, Maryland 21043. www.cwp.org and Baltimore County WRE Technical Memo - C
Impervious Cover Analysis , from Baltimore County Department of Environmental Protection, Towson, MD.
30 See: http://www.msa.md.gov/megafile/msa/stagser/s1500/s1529/html/0000.html
30
at least 50% of a watershed must remain in forest to preserve sensitive aquatic resources.29 TheMaryland Forest Conservation Act requires retaining 15% to 50% of a development site in forest. The 15% figure applies to sites zoned for very intense development. As development intensitydecreases forest retention rises towards the 50% threshold.
Portions of a site to remain in forest or planted with trees are required to be shown asforest conservation easement areas on the plat approved for each project. To assess the degree towhich these forests had been preserved or planted, CEDS reviewed the plats for three of thelargest projects developed in the Corsica watershed since the adoption of the Forest ConservationAct: North Brook, Symphony Village and Three Creeks. The plats were obtained from theMaryland State Archives website.30 To determine if the Platted Forest Conservation Easement(FCE) had been preserved each was compared with the forest shown on Google Earth. TheGoogle Earth imagery dated from June, 2011. Following are the results.
North Brook: The plat shows nontidal wetland buffers but no forest conservationeasements. A review of recent aerial photos indicate the buffers have been maintained.
Symphony Village: Like North Brook, the plats for Symphony Village show a numberof nontidal wetland buffers along with a 30-acre forest conservation easement. This FCEextends along both sides of Mill Stream Branch from the east side of Symphony Villageto a point very near the MD 213 crossing of Mill Stream Branch. Recent aerial photosshow the forest canopy remains intact throughout the 30-acre FCE. However, the FCEboundaries do not correspond to those shown on recent property maps. If this is correctand not a mapping error then it could create a situation where a future landowner cutsforest unknowingly within the FCE. CEDS requested an opinion on this question fromthe Town of Centreville.
Three Creeks: It appears that about 6.5 acres of the FCE has remained in agriculturalproduction. This area is located south of Pondview Drive. The area adjoins a perennialand intermittent tributary to Three Bridges Branch, making it very sensitive. The loss of6.5 acres of forest riparian buffer at this point is significant. Furthermore, every acre offorest added to the Corsica River watershed increases the probability of full recovery andoffsets the effect of increasing impervious area. CEDS has forwarded this issue to theConservancy.
On-Going Audit Recommendations: Forest ConservationDuring the May Audit workshop volunteers were instructed in methods to assess forestconservation compliance. The volunteers should use this knowledge to review all development

31 The Queen Anne’s ESD Manual is available at:qac.org/Docs/PublicWorks/esdm/QAC_ESDM .pdf
31
projects approved since forest conservation requirements came into effect: 1984 for projectswithin the critical area (1,000 feet of high tide) and July 1991 for most other projects. Additionally, this background will allow volunteers to review plans for proposed development toconfirm that every acre of forest which could be saved or added has been.
ENVIRONMENTAL SITE DESIGNIn 2009, the Maryland Department of the Environment (MDE) adopted a new approach tostormwater management called Environmental Site Design (ESD). This new approach placesgreater emphasis on preserving forests and minimizing disturbance of steep slopes, highly-erodible soils, and other sensitive areas. In addition, small highly-effective filtering-infiltrationmeasures now serve as the primary BMPs to treat runoff rather than the past pond-basedapproach. So, instead of retaining pollutants in pond bottom sediments where they can beflushed into downstream waters during large, turbulent runoff events, pollutants are safelytrapped below the soil surface. Most ESD measures are also designed to function as filters whichthen release treated runoff into underlying soils. Filters are generally more effective than pondsin removing pollutants. Infiltrating runoff into underlying soils is critical to maintaining thevolume of dry-weather inflow to wetlands, streams, and tidal waters. By utilizing measures witha small drainage area, ESD practices should require less maintenance. For further background onESD visit: ceds.org/esd or MDE ESD Chapter.
Queen Anne’s County has been practicing ESD for quite some time. It appears thatQueen Anne’s was the first Maryland county to adopt an ESD manual in 2007.31
To assess the extent to which ESD will be used in the Corsica River watershed, CEDScontacted Centreville and Queen Anne’s County officials about development projects which havebeen proposed, even permitted, but not yet built-out. It is likely these projects would beobligated to meet ESD requirements or the owner might be amenable to substituting ESDpractices for less effective and more expensive measures. Three such projects were identified. However, all three had been approved prior to ESD and one was partially completed.
Anderson Major Subdivision: This 146-acre project is located on the north shore of theCorsica River and along the east side of Alder Branch. The site was approved in 2005 tobe developed as eleven new homes on one- to three-acre lots and with an existing hometo remain. Five of the homes are in the critical area, four of which were present as of theJune 2011 Google Earth images. None of the other seven lots have been developed. However, the court serving these homes has been cleared and graded, but not paved andtwo stormwater pocket wet ponds have been installed, each designed to manage the two-year storm. Since this project predates adoption of ESD by the County and State, no ESDpractices are shown. The plat shows a 5.74-acre FCE, most of which has not beenafforested. There is also 86 acres of open space set aside on the site in order to achievethe development rights needed to create the twelve lots. About 40% of the open space

32
parcel appears to be in agricultural production. A field is located in the area where lots 6-12 are situated. Once these lots are developed this field may become difficult to farm. Perhaps the Conservancy could prevail upon the owners to allow this field to revert toforest. This field is also located on partially hydric soils. Earlier in this report referencewas made to a DNR recommendation to allow cultivated hydric soils to revert to forest. The Conservancy should also consider urging the owners to install a couple of RainGardens on each lot or dry wells at downspouts. These measures would greatly improveupon the aquatic resource benefits provided by the two pocket wet ponds.
Callahan Minor Subdivision: This 274 acre site is located southeast of US Route 301. As a cluster project 32 residential lots would be permitted or three lots with the slidingscale approach. The minor subdivision plat approved in 2009-2010 shows three lots. Stormwater management consists of discharging downspouts onto areas with a slope ofless than 5% and a length of at least 75 feet. If either condition cannot be met then drywells, Rain Gardens or other practices must be used. Most of these practices are ESDmeasures though it appears this project was not subject to the Maryland ESDrequirements. The plat shows a 19.8 acre FCE. As of June, 2011 the project had notbeen built, while the FCE remains in forest.
Meadow Creek: This 224-acre project is also located to the southeast of US Route 301. It was approved in 2006 (prior to ESD) for fourteen, 1.25-acre residential lots and threelarger lots. The two perennial streams on the site, which are the headwaters of ThreeBridges Branch, benefit from very generous buffers measuring 340-feet in width orgreater. All of the hydric soils on the site are contained within the streamside buffers andFCEs. Stormwater management will consist of four wet ponds, with portions of proposedrooftops and other impervious surfaces designed to sheetflow onto lawns or otherpermeable areas.
On-Going Audit Recommendations: Environmental Site Design The owners-developers of all three of these projects may be open to adding ESD practices to theundeveloped lots. For example, the houses could have a dry well at each downspout or perhapseach lot could benefit from two of the Conservancy’s Rain Gardens - one for the front roof anddriveway and a second for the rear roof, deck or patio. In exchange the Conservancy mightconsider instituting a program to designate development projects as Corsica Friendly, Green orsome other label. A residential subdivision in Anne Arundel County, the Preserve at SevernRun, touts their environment friendly design in all their promotional materials which presumablyenhances sales and sale price. The same is true for many LEED certified buildings.
Additionally, consideration might be given to providing other incentives for increasingforest areas on each site. While none of the sites contain unforested hydric soils, there may beother conditions on the sites leading to increased nutrient or sediment releases. For example, theBeltsville study referenced on page 15 describes “critical areas” where unusually large amountsof nitrogen enter a stream. If these critical areas exist on the three development sites then

32 DRAFT Queen Anne’s County 2011 Comprehensive Water and Sewerage Plan, available online at:
http://www.qac.org/Docs/PublicWorks/CWSP_2010_PubHearingDraft.pdf
33 Ibid.
34 Ibid.
35 Personal communication with Mr. Mark Durrett on May 3, 2012.
33
incentives might be found to convert them from crop production to forest. For future projectproposals, consideration might be given to incentives such as bonus density for preserving orcreating more forest than is normally required.
Procedures for evaluating proposed development for opportunities to make greater use ofESD were included in the Audit workshop. Of course it would further the Conservancy’s goal ofrestoring the Corsica by working with each applicant to maximize project benefits.
POINT SOURCE DISCHARGESThe Maryland Department of the Environment (MDE) regulates about 11,500 point sourcedischarges permitted under the State-Federal National Pollution Discharge Elimination System(NPDES). Only one of these facilities is located in the Corsica River watershed: the CentrevilleWastewater Treatment Plant (WWTP).
The Centreville plant treats wastewater generated by 3,500 people living or working in1,000 homes, businesses, institutions and other buildings which make up the Town.32 The flowto the plant is presently about 400,000 gallons per day (gpd) but is permitted to go as high as500,000 gpd. The Town is seeking approval to increase the permitted capacity to 540,000 gpd. In theory the plant could expand to one million gallons per day. Treatment is provided by ahighly-effective system known as a Sequential Batch Reactor (SBR), which can handle up to750,000 gpd.33
At the time the TMDL was completed in 2000, the sewage treated at the CentrevilleWWTP was discharged into Gravel Run near the head of tide. Since March 2005, the effluenthas mostly been applied to the land at a 370-acre state-of-the-art spray irrigation system locatedalong the north side of MD 305, just west of Tanyard Road. Treated wastewater is stored in alarge lagoon located on the spray site which has a capacity of approximately 23 million gallonsand provides 45 days of storage at maximum permitted flows.34 During the winter months whenfrozen ground and other factors preclude spray-irrigation, effluent is still discharged to GravelRun though it is much cleaner when compared to the pre-SBR discharge. Presently, the spray-irrigation fields are planted with switchgrass (Panicum virgatum), which is harvested and used inmushroom production.35

34
According to the TMDL, in the late 1990s the Centreville WWTP was annuallydischarging about 11,500 pounds of nitrogen to the Corsica River. In 2010, the nitrogen releasewas 4,731 pounds per year; a very impressive 59% reduction.
All those holding NPDES discharge permits are required to regularly submit DischargeMonitoring Reports (DMRs) to MDE. The DMRs present quantities of pollutants andwastewater permitted to be discharged along with actual amounts released. The DMRs showedpermit limits were exceeded on three occasions in 2009, once in 2010 and never in 2011.
CEDS also reviewed the groundwater monitoring records for the spray-irrigation fields. The spray-fields are located along the lower half of a gentle hillside which begins about 1500 feetupslope of the fields, on the south side of MD 305. The uphill area south of MD 305 isdominated by cropfields and a horse racetrack.
Four monitoring wells are located upgradient of the spray-fields, near MD 305, with sixwithin or below the fields. Additionally, Three Bridges Branch is sampled at MD 305 (upstreamof the fields) with two sampling points downstream.
Figure 2, on the next page, compares nitrate concentrations in the upgradient wells withthose located within and down groundwater gradient of the wastewater spray-fields. Figure 2shows that while nitrate levels have always been lower in the downgradient wells, this trendbecame even more pronounced and consistent once the spray fields were put into operation inMarch 2005. It appears that the much lower concentration of nitrate in the treated wastewateractually dilutes the high-nitrate groundwater flowing beneath the fields from the area south ofMD 305.
Even more interesting is the steady decline in nitrate levels in upgradient wells from 2007on. While it is tempting to think that the decline is due to winter cover crops or other BMPsapplied to the fields south of MD 305, this is but one of many possible explanations. Frankly, ittakes years for the effects of BMPs like cover crops to show up in monitoring wells. CEDSforwarded the monitoring data to MDE in hopes that their extremely knowledgeable staff mayhave an opportunity in the future to study this trend.
In 2008, CEDS reviewed records of all Eastern Shore spray-irrigation operations. At thattime the Centreville facility was head and shoulders above the rest and today the facility appearsto be operating even better. Congratulations to the Town of Centreville!
The only note of caution in what appears to be a very well-operated facility is the MBSSdata for Three Bridges Branch. Macroinvertebrate community health (BIBI) is generally ratedgood throughout Three Bridges Branch except for the two stations next to the spray-fields, whichare rated fair. Apparently both stations were of even poorer quality as the MBSS report showsboth are improving. There are likely a number of possible explanations for the low BIBI scores,such as residual impacts from the development of Three Creeks along the opposite (north) bank

Figure 2: Centreville Spray-Irrigation Monitoring Well Data
0.00
1.00
2.00
3.00
4.00
5.00
6.00
7.00
8.00
9.00
Dec-01
Apr-02
Aug-02
Dec-02
Apr-03
Aug-03
Dec-03
Apr-04
Aug-04
Dec-04
Apr-05
Aug-05
Dec-05
Apr-06
Aug-06
Dec-06
Apr-07
Aug-07
Dec-07
Apr-08
Aug-08
Dec-08
Apr-09
Aug-09
Dec-09
Apr-10
Aug-10
Dec-10
Apr-11
Nitr
ate
(mg/
l)
Upgradient Wells
Downgradient Wells

36 DRAFT Queen Anne’s County 2011 Comprehensive Water and Sewerage Plan, available online at:
http://www.qac.org/Docs/PublicWorks/CWSP_2010_PubHearingDraft.pdf
37 See: http://www.mde.state.md.us/programs/Water/OverFlow/Pages/ReportedSewerOverflow.aspx
38 DRAFT Queen Anne’s County 2011 Comprehensive Water and Sewerage Plan, available online at:
http://www.qac.org/Docs/PublicWorks/CWSP_2010_PubHearingDraft.pdf
36
of Three Bridges Branch. There could have been a spill at the Tanyard Road crossing some yearsago and downstream areas are recovering. Hopefully MBSS will take a closer look at thisportion of Three Bridges Branch during future sampling efforts.
On-Going Audit Recommendations: Point Source DischargesThere would be value in the Conservancy taking an annual tour of the spray-irrigation facility. The Implementers Group might consider inviting the Public Works director to make anoccasional presentation on groundwater monitoring trends.
SEWAGE COLLECTION SYSTEMThe 400,000 gallons of wastewater treated at the Centreville plant each day is collected via asystem of buried pipes, which are mostly eight-inch gravity sewers. Four pump stations help sewage flow to the treatment plant in flatter areas. The North Brook community is also served bygrinder pumps.36
The Maryland Department of the Environment (MDE) recently created an onlineMaryland Reported Sewer Overflow Database.37 This database includes overflows reported toMDE since 2005. Table 7, on the next page, lists 18 overflows within the Corsica Riverwatershed over the past six years. These overflows mostly occurred at the treatment plant andreleased slightly more than one million gallons of wastewater. Overflows appeared to havepeaked in 2008 and have become less common since then.
A “Public Health Concern” area exists at the intersection of US Route 301 and MD 304where a number of commercial, industrial and municipal uses served by inadequate onsitewastewater treatment systems. This area is designated in the County’s water and sewer plan toreceive sewer service within ten years.38 It is also being considered as a possible business park.
On-Going Audit Recommendations: Sewage Collection SystemThe Conservancy should monitor the MDE database for any changes in overflow frequency orvolume as well as for repeated overflows due to the same cause. These factors may indicate apattern and a need requiring increased citizen support to resolve.
ILLICIT DISCHARGESAs part of the WRAS field work, DNR staff identified 57 pipe outfalls within the Corsica Riverwatershed. DNR examined each for indications of illicit pollution discharges. Indicatorsincluded a discharge with an unusual color, odor or temperature. Revisiting all 57 outfalls was

Table 7: Corsica River Reported Sewage Overflows 2005 - PresentSource: http://www.mde.state.md.us/programs/Water/OverFlow/Pages/ReportedSewerOverflow.aspx
SSO Centreville, Town of 1/25/2005 116 Johnstown Ln, Centreville WWTP 30 Operator errorSSO Centreville, Town of 4/27/2005 North Pump Station 13,000 Blockage
SSO Centreville, Town of 1/11/2006 Centreville WWTP, North Pump Station Centreville WWTP
1,000 Blockage
SSO Centreville, Town of 8/2/2006 Centreville WWTP, Effluent chamber leading to river
Centreville WWTP
48,700 Mechanical failure
SSO Centreville, Town of 8/22/2006 Centreville WWTP, Effluent chamber leading to river
2,730 Mechanical failure
BYPASS Centreville, Town of 8/22/2006 Disk Filter Centreville WWTP
2,730 Operating on one tank
SSO Centreville, Town of 4/24/2007 Centreville WWTP, Johnstown Ln. 50 Pipe failureSSO Centreville, Town of 6/7/2007 Water Tower #1 2,000 Mechanical Failure
SSO Centreville, Town of 6/11/2007 Town of Centreville, Water Tower #1 2,000 Mechanical Failure
SSO Centreville, Town of 2/13/2008 Comet Drive 300 GreaseSSO Centreville, Town of 2/27/2008 Intersection of South Commerce and South
Liberty Streets3,000 Grease
SSO Centreville, Town of 5/21/2008 Centreville WWTP outfall 001 12,140 Operator error
BYPASS Centreville, Town of 7/9/2008 Disk Filter 547,000 Precipitation
SSO Centreville, Town of 10/26/2008 116 Johnston Ln, Centreville WWTP 28,780 tripped breakers
BYPASS Centreville, Town of 5/7/2009 116 Johnstown Lane, Automatic Influent Screening Unit
Centreville WWTP
100,000 Loss of power
SSO Centreville, Town of 6/29/2009 116 Johnstown Lane, Centreville WWTP Centreville WWTP
75 Mechanical Failure
SSO Centreville, Town of 3/8/2010 116 Johnston Ln, Centreville WWTP 50 Overfilled reed bed
SSO Centreville, Town of WWTP
8/28/2011 Centreville WWTP, Johnstown Lane, Centreville
Centreville WWTP
297,000 Precipitation
1,060,585
Disclaimer: Data on this spreadsheet was generated using the MDE website. In no event shall MDE, nor its employees, officers or agents become liable to users of the data provided herein for any loss arising from the use, operation or modification of the data.
CauseCollection-
SystemQuantity in
Gallons LocationOverflow
Type Municipality/FacilityDate
Discovered

Table 8: Corsica River Stream Sampling Results - 14 March 2010
Stream Location Conductivity Temperature pH
Total Dissolved
Solids Photo Waypoint
S/cm F ppmMill Stream Branch MD 213 262 58.4 6.95 170 110Mill Stream Branch Taylor Mill Road
extended254 61.7 6.99 170 1175-77 115
Mill Stream Branch Rolling Bridge Road 214 61.3 6.93 140 1186 120Mill Stream Branch Liitle Eagle Road 116 64.5 6.75 80 1195 126Tributary Mill Stream Branch
Behind Food Lion shopping center
338 55.9 6.72 230 1167-8 112
Tributary Mill Stream Branch
Taylor Mill Road 388 58.1 7.10 260 1174 114
Tributary Mill Stream Branch
MD 213 404 55.5 6.59 280
Tributary Mill Stream Branch
Below Centreville Bus Pk SWM pond
323 57.5 6.79 210 1169 113
Tributary Mill Stream Branch
MD 213 226 60.0 6.66 160 1182 118
Tributary Mill Stream Branch
Taylor Mill Road extended
293 59.3 7.22 200 1178 116
Tributary Mill Stream Branch
Hibernia Road 256 62.7 7.44 170 1199 128
Tributary Earle Creek MD 304 223 64.2 7.24 140 1213 133Tributary Earle Creek Hibernia Road 212 62.2 7.46 140 1204 130Tributary Tilgman Cove MD 304 325 59.0 6.78 220 1209-10 132Gravel Run MD 213 231 68.0 7.41 150 1214-15 134Three Bridges Branch MD 213 273 64.0 7.61 190 1216 135Three Bridges Branch MD 305 333 63.3 7.70 220 1219 137Three Bridges Branch Carville Road 299 62.6 7.30 200 1187 121Tributary Three Bridges Branch
Southeast corner North Brook
205 65.1 7.44 140 1217 136
Tributary Three Bridge Branch
Carville Road 182 69.0 6.71 120 1222 140
Tributary to Emory Creek Spaniards Neck Road 70 64.7 6.28 40 1278 142
Maximum 404 69.0 7.70 280Average 258 61.8 7.05 173
Minimum 70 55.5 6.28 40

39 Nitrogen loads were obtained from the Chesapeake Bay Watershed Phase 5 .3 Model:
http://ches.communitymodeling.org/models/CBPhase5/index.php
39
Table 9: Cropfield Nitrogen Loading & BMPs
B M P Pounds/Acre/
Year
High-Till without Manure
Nutrient Management
11.49
High-Till with Manure Nutrient
Management
8.22
Low-Till with Manure Nutrient
Management
7.30
With Winter Cover Crops 3.87
beyond the scope of this Preliminary Audit. Instead, CEDS examined many of the stormwaterBMPs in the watershed for indications of illicit discharges as well as factors affecting pollutantretention. No such indicators were found.
Additionally, CEDS measured conductivity, Total Dissolved Solids, pH and watertemperature in one day (March 14, 2012) at 21 points on the nontidal streams of the Corsicawatershed. The results are presented in Table 8, on page 38. Sampling so many points for thesebasic parameters in one day creates a water quality snapshot. Even modest discharges may showup as abrupt changes in water chemistry or temperature from one point to another in such a snapshot. Fortunately, none of these indicators were found except for elevated conductivity in atributary to Mill Stream Branch. Conductivity is a measure of the ability of water to conductelectricity and mostly results from the presence of chloride and other ions.
The unnamed tributary with elevated conductivity joins Mill Stream Branch behind theFood Lion shopping center, crosses under the Symphony Village pedestrian bridge, then underTaylor Mill Road and finally MD 213. Conductivity steadily increased as one progressedupstream. The highest conductivity was measured at the uppermost station on MD 213. Furthermeasurements could not be made without entering onto private property. It is possible that theelevated conductivity may be a result of heavy road salt use at the US Route 301 and MD 213interchange. Other explanations are possible too. This might be another area of investigation forfuture MBSS or volunteer surveys.
On-Going Audit Recommendations: Illicit DischargesThe Conservancy should consider undertaking regular water quality snapshots throughout theCorsica River system. Reliable meters can be purchased for less than $200.
COVER CROPSAgriculture dominates the Corsica Riverwatershed with regard to both land use andnutrient inputs. Most of the agricultural landis in cropfields, with corn and soybeans beingthe most common crops grown in thewatershed.
Table 9, compares nitrogen loadingsfrom a typical cropfield in the middle ChesterRiver segment, which includes CorsicaRiver.39 The table shows how nitrogen loadsdecline as one adds more Best ManagementPractices (BMPs) to a cropfield.

40 Developing Nitrogen, Phosphorus and Sediment Reduction Efficiencies for Tributary Strategy Practices,
2009, available online at: http://archive.chesapeakebay.net/pubs/bmp/BMP_ASSESSMENT_FINAL_REPORT.pdf
40
According to agricultural experts, about 75% of Corsica watershed cropfields benefitfrom Low-Till, which is also known as conservation tillage, No-Till, etc. The figures presentedin Table 9, should be viewed more as indicative of the relative reduction in nitrogen loadsachieved by implementing additional BMPs; not as absolute values for all Corsica cropfields.
A primary Corsica River WRAS initiative was an increase in the use of winter covercrops. If planted on or before October 1st, a winter cover crop of rye, barley or wheat can reducenitrogen loads by 47%, phosphorus by 15% and sediment by 20%.40 The reduction is achievedby taking up nitrogen from fertilizer remaining within the root zone after a crop like corn isharvested and by reducing erosion. If cover crop planting does not occur until mid-October thensufficient nitrogen will have leached below the root zone to reduce the load reduction to perhaps40%. If the cover crop isn’t planted until the first week in November then nitrogen reductiondrops to 19%.
The nitrogen load reductions are only achieved if the cover crop is not fertilized. If afield is planted with commercial winter wheat or other cover crops, which require fertilization,then zero nitrogen load reduction is assumed. However, the commercial crop may still reduceerosion.
According to local agricultural experts, most Corsica River farmers alternate (rotate)fields between corn and soybeans from year to year. Winter cover crops are less effective onsoybeans because this crop is harvested later in the year. So, as a practical matter, winter covercrops can be applied to about half the 10,200 acres of Corsica watershed cropfields which areplanted in corn each year.
Several years ago the State of Maryland launched a major initiative to greatly expand theuse of cover crops. Through this initiative farm owners receive a payment of about $25 - $80 peracre to plant cover crops. This initiative worked particularly well in the Corsica watershed wherefarm owners signed up to plant cover crops on about half the cropfields; presumably all thosefields planted in corn.
In early March 2012, CEDS drove most of the roads within the watershed and noted if thefields visible from those roads had a cover crop. Of the 114 cropfields surveyed, 43% had wellestablished cover crops and another 5% had vegetation present but was rather sparse. In otherwords, about half the fields had cover crops. The sparse vegetation on 5% of the fields may havebeen due to heavy grazing by geese, late planting, unfavorable weather or other factors.
On April 10th, May 3rd, and June 10th 2012, CEDS looked at all of the cropfieldspreviously surveyed. By this time farmers should have applied herbicides to kill off the covercrop in preparation for spring planting. By June 10th only 15 field still had the cover crop, which

41 See Section 6.5.7, in Chesapeake Bay Phase 5 Com munity Watershed Model, available online at:
http://ches.communitymodeling.org/models/CBPhase5/index.php
42 See Section 6.5.8, in Chesapeake Bay Phase 5 Com munity Watershed Model, available online at:
http://ches.communitymodeling.org/models/CBPhase5/index.php
41
appeared tro be commercial winter wheat. Since wheat is fertilized it does not provide thenitrogen reduction benefit of other cover crops. But 36% of the fields did appear to have anitrogen-reducing cover crop, which is essentially the same as the Maryland Department ofAgriculture estimate of 40%.
On-Going Audit Recommendations: Cover CropsThe Conservancy should continue to support the Queen Anne’s Soil Conservation District andthe Maryland Department of Agriculture in the great strides they have made in maximizingwinter cover crops in the Corsica River watershed.
BUFFERSA number of the studies cited earlier pointed to the need to expand buffers along the waterwaysand wetlands making up the Corsica River system. This would include the largest waterways tothe smallest ditches carrying water for just part of the year. Depending upon the purpose, thebuffer could be grass or forest and would extend 35- to 100-feet from the waterway or wetlandedge. A forest buffer extending 100-feet from a stream bank can remove 19% to 65% of thenitrogen passing through it from adjoining crop fields.41 A 35-foot wide grass buffer can remove13% to 46% of the nitrogen transported in cropfield runoff.42 The variation in effectiveness is afunction of soil characteristics. Of course this assumes there’s no point along the buffer whererunoff concentrates. Buffers work best when runoff travels through it as a very shallow, sheetflow.
In addition to pollutant removal, buffers provide other aquatic resource benefits. Theyare a source of leaves and other vegetative matter which serve as a critical source of food,particularly in headwater streams. Tree branches and trunks provide essential woody habitatwhen submerged in a waterway. Trees and other vegetation also serve to slow bank erosion. Theshade afforded by trees moderates water temperature.
In their 2009 report, Maryland Biological Stream Survey researchers stated:
“The Corsica River watershed currently contains approximately 5000 acres of forestedriparian buffers. Protecting this forested stream corridor is of paramount importance toprotecting the biological community found in these stream systems. Any major loss inriparian buffer acreage could result in a decline in stream condition that would bereflected in a decline in the biological metrics that we measure.”
The Watershed Restoration Action Strategy set the goal of creating an additional 100acres of buffers along the waters of the Corsica River system. As of this date, the Queen Anne’s

42
Soil Conservation District has implemented 90 acres of grass buffers and 8.1 acres of woodedbuffers. Also, the Chester River Association has implemented 32.7 acres of switchgrass bufferswithin the Corsica River watershed. Thus, the WRAS goal has not only been met but exceeded.
The Watershed Restoration Action Strategy described 54 buffers assessed during 2003field work. Of these buffers, 18 were rated Very Severe or Severe with regard to their ability tocapture pollutants and/or provide aquatic resource habitat. CEDS assumed that of the 54 buffersthese 18 were the most likely to have been targeted for enhancement efforts over the past nineyears.
Unfortunately, the WRAS did not contain the criteria used to designate a buffer VerySevere, Severe, etc. CEDS assumed a Very Severe (VS) buffer would consist of closely-mowedlawn or cropfield extending to the edge of a waterway. A Severe (S) buffer would have someunmown grass or woody vegetation but far less than the minimum 35-feet recommended forcropfields and the 100-feet for lawns.
In March and June, 2012, CEDS was able to look eight of the VS-S buffers. The otherten either require a boat or permission to enter into the interior of a farm.
Buffer 217201 had a well-established grass buffer. There was no visible indication thatthe other seven buffers had been enhanced in anyway. The only exception is Buffer 094001located on the north side of the Watson Road bridge and the east side of the Corsica River. There may have been some additional plantings, but its hard to tell.
Through Google Earth, 2005 and 2011 aerial photos of the Corsica River watershed canbe viewed online. These photos were used to check for changes in buffer condition during thisperiod at all 18 VS-S locations. At Buffer 094003 there may have been some additionalplantings, but not enough to establish a 100-foot shoreline buffer.
Google Earth shows 100 feet of trees extending back from the shoreline at Buffer 029004. This is true in 2005 and 2011, indicating the trees may have been there in 2003. If this is correctthen its unclear why this buffer was rated Severe.
The other 16 VS-S buffers appear the same in the 2005 and 2011 aerial photos. In otherwords, it appears no enhancement has occurred to the 18 poorest buffers found nine years ago,with the exception of perhaps some minor improvements to one buffer. However, grass buffersmay have been established at some of the locations yet not be visible from nearby roads. And agrass buffer would not necessarily show up on an aerial photo.
Because of the lack of clear definitions for the WRAS buffer ratings and the difficulties inevaluating buffers from nearby roads and aerial photos, the Maryland Department of Agriculturehas taken issue with the analysis presented above as it relates to farming. In addition, MDAcontends that while several of the sites listed remain unbuffered, many of the sites either have

43 See: mde.state.md.us/programs/Land/SolidWaste/CAFOMAFO/Pages/Programs/LandPrograms/Solid_Waste/cafo/index.aspx
44 See:mde.state.md.us/programs/Land/SolidWaste/CAFOMAFO/Pages/Programs/LandPrograms/Solid_Waste/cafo_search/CAFO.aspx
43
buffers on them or they are residential areas that are not the responsibility of agriculture toaddress.
On-Going Audit Recommendations: BuffersThe Conservancy should consider working with Soil Conservation District staff to verify bufferconditions in the watershed, beginning with the VS-S buffers not visible from nearby roads. TheConservancy should also support MDE in developing methods to identify critical areas withregard to excessive nutrient inputs. These areas would then become a priority for bufferestablishment. Other buffer enhancement opportunities were mentioned earlier such as the 6.5acres of forest apparently missing at the Three Creek development.
CONCENTRATED ANIMAL FEEDING OPERATIONS (CAFO)The Maryland Department of the Environment (MDE) regulates Concentrated Animal FeedingOperations (CAFOs).43 The MDE CAFO Search webpage was used to determine if any existwithin the Corsica River watershed, of which there are two.44 Combined, the two CAFOs have acapacity of 792,000 chickens. CEDS examined the streams most closely associated with bothoperations. No indications were present that the streams were receiving excess organicenrichment. Conductivity, Total Dissolved Solids, and pH measurements did not show anyindication of contamination. Neither CAFO is near a nitrogen hot spot. In other words, bothCAFOs are enhancing the agricultural economy with no measurable effects upon aquaticresource health.
On-Going Audit Recommendations: CAFOsConservancy volunteers should periodically monitor the stream most directly associated witheach CAFO to detect any changes in water clarity, odor or conductivity which might indicateadverse effects.
SEWAGE SLUDGE APPLICATIONThe Maryland Department of the Environment also regulates the application of sewage sludgefrom wastewater treatment plants to land. Nine farms in the Corsica River watershed arepermitted to apply sewage sludge. As with the CAFOs, CEDS examined the streams below allnine sites and found no indication of organic enrichment or other forms of pollution.
On-Going Audit Recommendations: Sewage SludgeAs with CAFOs, Conservancy volunteers should periodically monitor the stream most directlyassociated with each sewage sludge site to detect any changes in water clarity, odor, conductivitywhich might indicate adverse effects.